1. Introduction
Intestinal microbiota emerges as a key factor of homeostasis [
1]. Commensal bacteria, in particular,
Bifidobacterium genus, gained momentum as functional modulators of a variety of physiological processes as well as in disease [1-2]. The
B. longum infantis and
B. bifidum species are the first bacteria that colonize the intestine of newborns [3-4] suggesting a principal role of microbiota in post-embryonic development. Of particular interest is a cross-talk between the intestinal microbiota and the immune system [5-7]. Liwen et al. (2018) demonstrated a role for bifidobacteria in the balance of cytokines TNF-α/IL-4 and IL-5/IL-17A as a tentative biomarker of asthma in children [
8]. Furthermore, the addition of bifidobacteria to the cultured colon carcinoma cell line decreased the expression of TNF-α, IL-6 and IL-12 and concomitant elevation of IL-10 and IL-8 mRNAs [
9]. Thus, the outcome of bifidobacteria-cytokine interactions may vary from pro- to anti-inflammatory depending on the specific context [
10].
Mechanisms whereby bifidobacteria and cytokines interact deserve an in-depth investigation. In particular, these interactions presume direct binding of cytokines to bifidobacterial proteins. Can bifidobacteria provide candidate protein binders that physically target (selectively or promiscuously) mammalian cytokines and modulate their functions? Previously we discovered a species-specific PFNA operon that determines a significant diversity of amino acid sequences between individual strains within bifidobacteria. The operon contains five genes:
pkb2,
aaatp,
duf58,
tgm and
fn3 [11-12] that encode, respectively, the serine-threonine protein kinase [11, 13-14]; MoxR-ATPase AAA-ATP, a protein with an unknown function that contains the annotated DUF58 domain, and a predicted transglutaminase [
15]. The
fn3 gene encodes a ~210 kDa membrane-bound FN3 protein. Functional roles of this protein in bifidobacteria are poorly understood. In
B. bifidum S17 FN3 mediated the adhesion of bacteria to the intestinal epithelium [
16]. Thus, FN3 proteins can mediate protein-protein interactions, specifically, bind the recombinant cytokines in cell-free systems [15, 17].
Bifidobacterial FN3 proteins contain two fibronectin type III domains (FNIII, FN3). These domains were initially identified in fibronectin, a component of extracellular matrix [18-20], where they act as structural spacers or are involved in protein-protein interactions [
21]. FN3 domains are structurally close to immunoglobulin domains with seven β-sheets but the intradomain disulfide bond in FN3 is absent [22-23]. Nevertheless, FN3 domains are conformationally stable, thereby providing the protein binding motifs different from those engaged by the antibodies [
24]. Generally, FN3 domains share a consensus motif WSXWS (WS motif) in which the conservative residues WS…WS have been reported in the type I cytokine (e.g., IL-21) receptors [
25]. Mutations in WS motif affected the interaction with cytokines [26-27]. The residue X plays a role in the spatial organization of protein-protein complexes and in signaling [25, 28-29]. These data mechanistically attributed the WS motif in the binding of cytokines to their cognate receptors.
Our comparative analysis of nucleotide sequences of bifidobacterial FN3 domains revealed species-specific variations of the annotated WS motif: WSXPS, WSXES, WSXDS or WSXYS. The most pronounced differences were found in B. angulatum and B. bifidum: the WS motif in the 2nd domain of FN3 proteins was absent [15, 30]. One may hypothesize that the above stretches can be involved in the interaction of bifidobacteria with cytokines.
The FN3 protein in the
B. longum GT15 strain carries two tandem domains. The region 3’ to the 2nd domain is the C-terminus [
31]. Previously we have cloned the
fn3 gene fragment encoding both FN3 domains and the C-terminal region (aa. 1494-1994). The protein expressed from this construct has been termed ΔFN3.1 [17, 31]. We demonstrated that ∆FN3.1 of
B. longum GT15 can bind the recombinant TNF-α as determined in enzyme-linked immunosorbent assays [
17]. This binding requires full-length ∆FN3.1 including C-terminal region. The initial
in silico analysis suggested that ΔFN3.1 can form a cavity for TNF-α binding [
31]. Furthermore, treatment of
B. longum GT15 with tumor necrosis factor α (TNF-α) modulated transcription of 176 operons (~1,000 genes). Importantly, this treatment activated the expression of PFNA genes including
fn3 [
32]. These results provided strong evidence in favor of the link between bifidobacterial FN3 proteins and cytokines, thereby justifying an in-depth analysis of structural and functional interactions between bifidobacteria and the immune system.
In the present study we expanded the array of bifidobacterial strains and cloned the genes encoding ΔFN3 in B. angulatum и B. bifidum. Comparison of the binding of recombinant ΔFN3 proteins from different species of bifidobacteria to the cytokines TNF-α, IL-6, IL-8 and IL-10 demonstrated differential affinity to individual cytokines as determined by surface plasmon resonance technique. We for the first time predicted in silico tertiary structures of ΔFN3 fragments and identified new potential cytokine binding regions. In cell culture, the combined treatment with FN3 and TNF-α elevated the abundance of TNF-α mRNA, suggesting that the consequences of interactions between microbiota and the immune system should be considered with caution.
2. Results
2.1. Analysis of Amino Acid Sequences of Bifidobacterial ΔFN3 Fragments
The ΔFN3 protein in
B. angulatum GT102 (NCBI AMK57067, locus_tag Bang102_000210; 1956 aa. residues; GenBank GCA_000966445.2) [
14] contains two domains (residues 1454-1539 and 1544-1635). The ΔFN3 protein in
B. bifidum 791 (NCBI KYJ84759, locus_tag APS66_RS03355; 1992 residues; GenBank GCA_022014355.1) also contains two domains (residues 1490-1576 and 1581-1665). The protein expressed from this DNA fragment was termed ΔFN3.1. The names of respective proteins in
B. angulatum GT102 and
B. bifidum 791 strains were ΔFN3.2 and ΔFN3.3. The amino acid identities were: 33 (49%) between ΔFN3.1 and ΔFN3.2; 39 (54%) between ΔFN3.1 and ΔFN3.3; and 32 (46%) between ΔFN3.2 and ΔFN3.3.
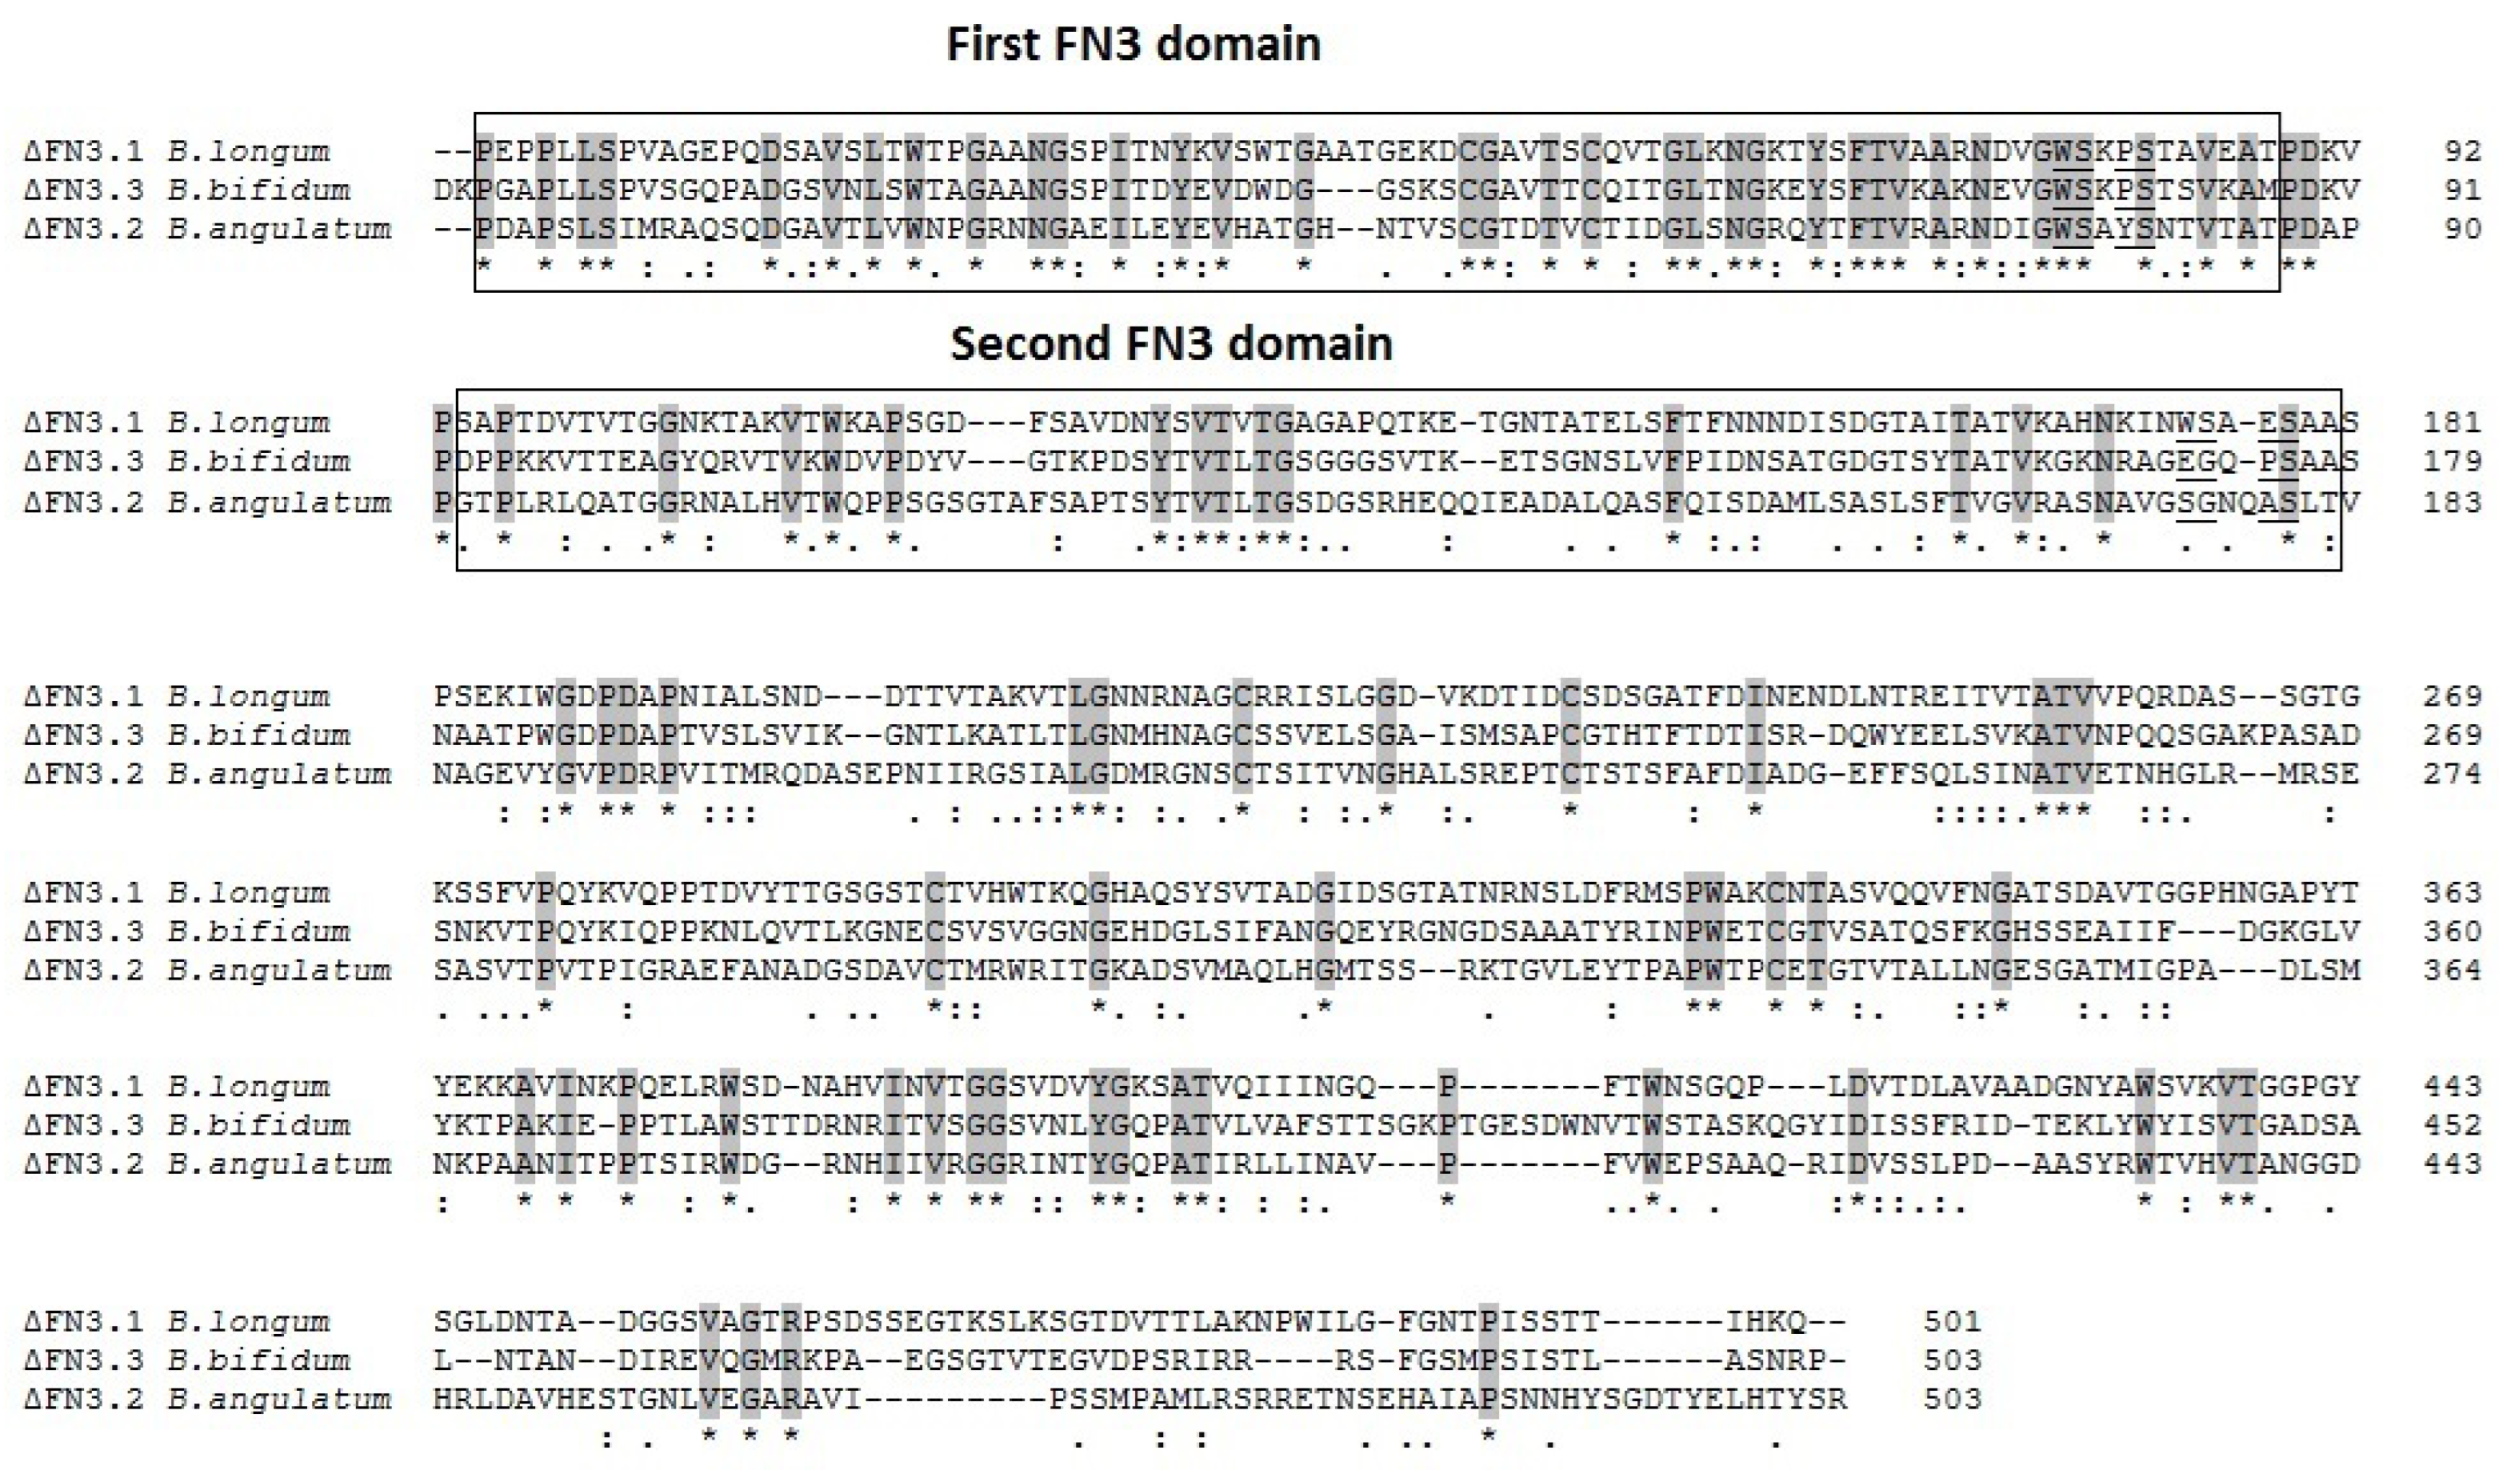
Alignment of amino acid sequences of bifidobacterial ΔFN3 proteins revealed the motifs other than the previously described conservative WSXWS stretch. In B. longum the 1st FN3 domain contains WSXPS sequence in which the tryptophan residue is substituted with proline. In the 2nd domain the respective motif is WSXES (glutamic acid instead of tryptophan). The most pronounced difference was detectable between 2nd FN3 domains of B. angulatum: SGXXAS (W → S, S → G, W → Q, S → A) and B. bifidum: EGXPS (W → E, S → G, W → P).
Alignment of amino acid sequences of ΔFN3.1
B. longum GT15, ΔFN3.2
B. angulatum GT102 and ΔFN3.3
B. bifidum 791 revealed that the homologies in domains 1 were more pronounced than in domains 2 (
Figure 1). Thirty five core (conservative) residues were detected in the 1st domain compared to 16 in the 2nd domain. The C-terminal region is the most variable among bifidobacteria. Therefore, expanding the array of bifidobacterial strains to investigate the binding of strain-specific FN3 proteins with cytokines, we cloned the genes encoding ΔFN3.2
B. angulatum and ΔFN3.3
B. bifidum, isolated the respective proteins and compared their characteristics with the previously obtained ΔFN3.1.
2.2. Cloning and Expression of Genes Encoding ΔFN3.2 B. angulatum and ΔFN3.3 B. bifidum. Isolation and Purification of Recombinant Proteins
Previously we have cloned the
fn3 gene fragment (residues 1494-1994) of
B. longum GT15 that encompasses two FN3 domains and a C-terminal region. The recombinant ΔFN3.1 was isolated [17, 31]. In the present study we cloned the genes encoding ΔFN3.2
B. angulatum and ΔFN3.3
B. bifidum. For PCR amplification of fragments of genomic DNAs of
B. angulatum GT102 and
B. bifidum 791, the oligonucleotides homologous to N- and C-terminal regions of the
Δfn3.2 and
Δfn3.3 genes, respectively, were used. The amplified fragments were cloned into the pET16b expression vector followed by the procedures of protein expression and purification (see
Materials and Methods). SDS-PAGE showed ~56 kDa bands that corresponded to the calculated molecular masses of ΔFN3.2 and ΔFN3.3 including His-Tag linker of pET16b plasmid (
Figure S1).
To test the possibility of purification of ΔFN3.2
B. angulatum and ΔFN3.3
B. bifidum under native conditions, pellets of
E. coli BL21 (DE3) containing recombinant plasmids were lysed in a buffer (50 mM NaH
2PO
4, 5 mM Tris-HCl, 300 mM NaCl, 1 mM PMSF, 5 mM DTT (pH 8.0) containing lysozyme (1 mg/ml), 0.5% Triton X-100 and 20 mM 2-mercaptoethanol, sonicated with ultrasound and centrifuged to separate soluble fraction and the pellet. SDS-PAGE revealed that ΔFN3.2
B. angulatum was found in the pellet (inclusion bodies) and can be isolated only under denaturing conditions and subsequent re-folding. Thus, for further studies ΔFN3.3
B. bifidum were used (
Figure S2). This protein was in the soluble fraction and therefore can be isolated under non-denaturing conditions.
Two approaches were used to investigate physical interaction of ΔFN3.1 B. longum and ΔFN3.3 B. bifidum with cytokines: a kinetic analysis by surface plasmon resonance and in silico simulations.
2.3. Interactions of ΔFN3.1 B. longum GT15 and ΔFN3.3 B. bifidum 791 with TNF-α, IL-6, IL-8 and IL-10.
We determined the ability of ΔFN3.1
B. longum GT15 and ΔFN3.3
B. bifidum 791 to bind the recombinant TNF-α, IL-6, IL-8 and IL-10 using surface plasmon resonance technique. These analyses were performed in neutral (pH 7.4) or alkaline (pH 8.0) solutions. These values were chosen based on isoelectric points of ΔFN3.1
B. longum (pI 6.05) и ΔFN3.3
B. bifidum (pI 7.18). As shown in
Table 1 and
Figure S3, ΔFN3.1
B. longum GT15 and ΔFN3.3
B. bifidum 791 were avid TNF-α binders: dissociation constants were 13.1 nM and 58.2 nM, respectively. However, the efficacy of binding to interleukins was different. For ΔFN3.1
B. longum GT15, pH did not influence the binding to IL-8 (
Table 2,
Figure S4A,B). In contrast, at pH 7.4 the binding of ΔFN3.1
B. longum GT15 to IL-10 (
Table 2,
Figure S5A,B) was detectable (K
b = 62.2 nM). The ΔFN3.1
B. longum GT15 interacted with IL-6 neither at pH 8.0 nor at pH 7.4 (
Table 2,
Figure S6A,B). Furthermore, binding of ΔFN3.3
B. bifidum 791 to IL-8 (
Figure S4C,D), IL-10 (
Figure S5C,D) and IL-6 (
Figure S6C,D) did not depend on pH (
Table 3). Interactions of ΔFN3.3
B. bifidum 791 with IL-6 and IL-10 at either pH were below the level of detection. Thus, binding of ΔFN3.1
B. longum GT15 with IL-10 was pH-sensitive probably due to conformational changes at alkaline conditions. ΔFN3.3
B. bifidum 791 showed no detectable interaction with IL-10.
These results indicated that ΔFN3.1 B. longum GT15 and ΔFN3.3 B. bifidum 791 differentially bind to TNF-α, IL-6, IL-8 and IL-10. We next performed a systematic analysis of protein-protein interactions using molecular modeling aiming to identify critical parameters of these interactions.
2.4. Prediction of Tertiary Structures
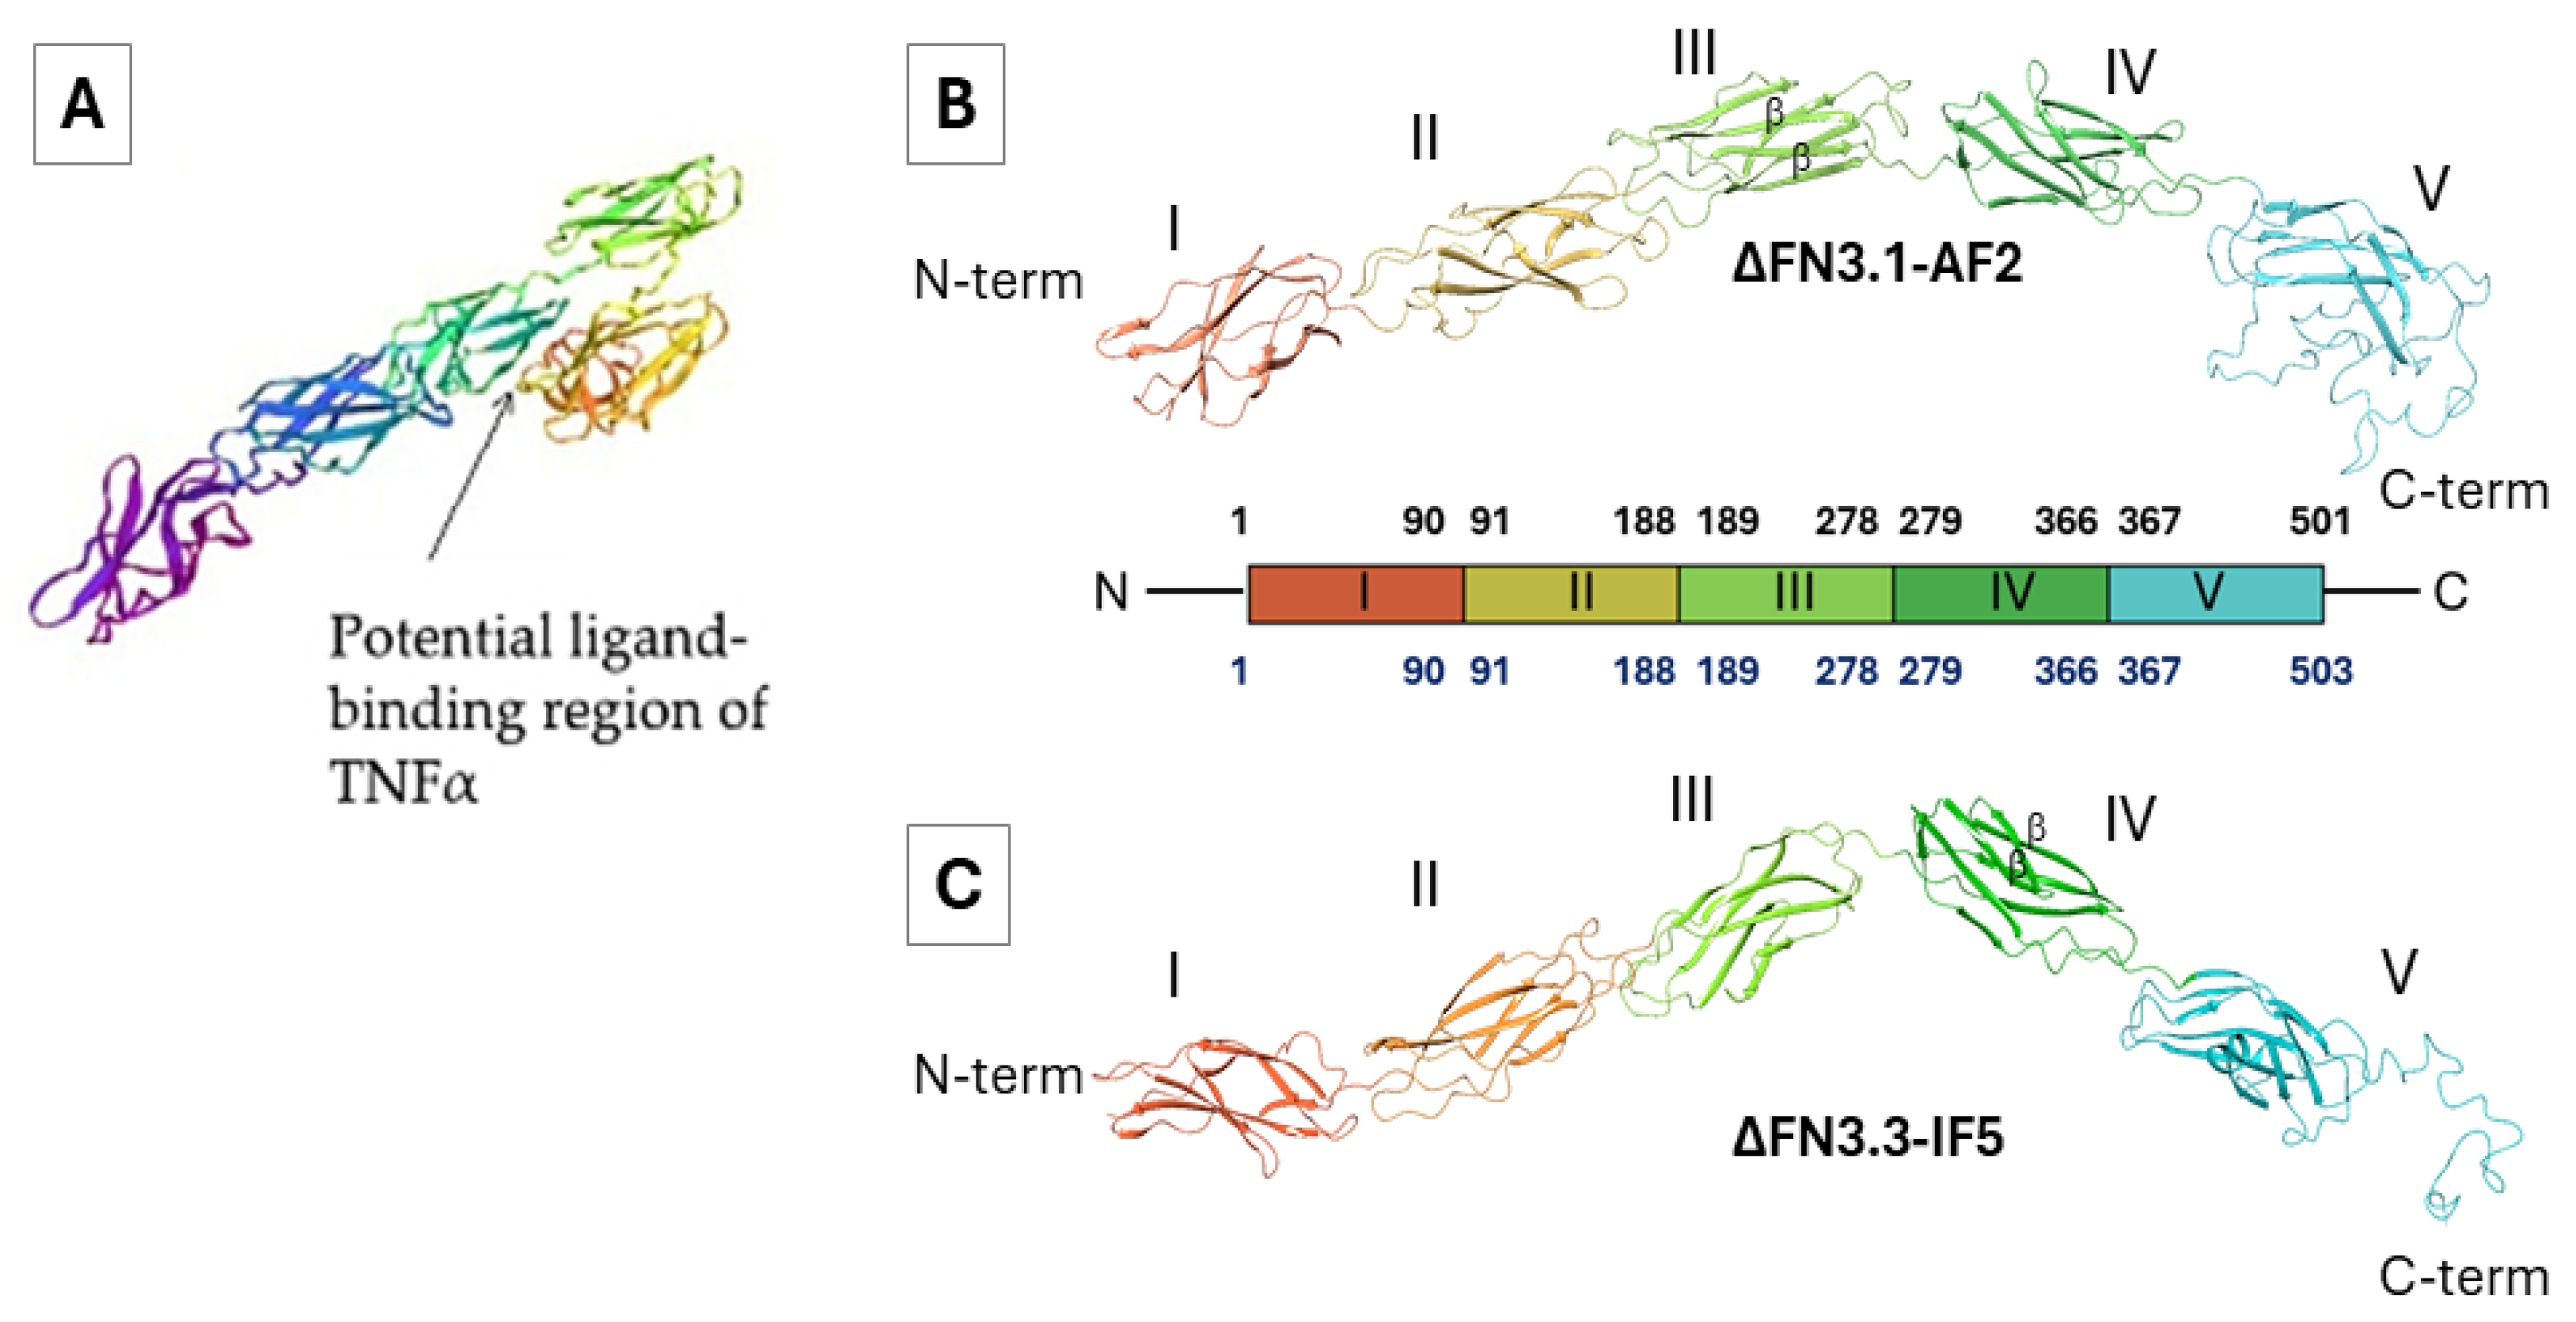
Prior to our study, experimentally confirmed 3D structures of bifidobacterial ∆FN3.1 and ∆FN3.3 proteins were unavailable. We have used trRosetta servers for structural prediction based on homology modeling [
31] (
Figure 2A). In so doing we used data on eukaryotic FN3 domain-containing proteins resolved by X-ray crystallography. Presumably, the proteins are formed by two linear FN3 domains with the predominant anti-parallel β-sheets.
Selection of optimal structures among the array of predicted variants was based on scoring functions in AlphaFold2 [
33], RoseTTAFold [
34], I-TASSER [35-37], and IntFOLD5 [
38].
Table S1 shows the quality of prediction for the best structures out of five variants. In all cases the non-structured portions at the C-termini of ∆FN3.1 and ∆FN3.3 (aa. 475-503) were poorly predictable (red color). In general, the predictive results obtained with AlphaFold2, RoseTTAFold and IntFOLD5 were similar. In contrast, the I-TASSER algorithm generated the structures with minimal relevance to the expected architecture of ΔFN3-containing proteins.
The analysis of Ramachandran maps (
Figures S7 and S8) allowed us to estimate the geometrical probability of predicted ∆FN3 proteins. Top quality models were obtained with RoseTTAFold, AlphaFold2 and IntFOLD5: >90% amino acid residues were located in permissible areas (red and yellow) with minimal number of prohibited conformations. I-TASSER generated the biggest number of geometrical alterations making this algorithm not applicable for further analysis. Thus, we focused on predictions of ∆FN3.1 and ∆FN3.3 structure with RoseTTAFold. Recently this server has been validated as preferential for prediction of the full-size tertiary structure of poly(ADPribose) polymerase 1 [
39].
Tertiary structures of ΔFN3 proteins obtained with RoseTTAFold were used as references for comparison with the results of AlphaFold2 and IntFOLD5 (
Table S2). For MD simulations and refinement of geometrical parameters, ∆FN3.1-AF2 and ∆FN3.1-IF5 models were chosen. The absence of black triangles in the prohibited areas reflects the absence of steric conflicts, that is, the models demonstrated high probability similarly to RoseTTAFold.
Geometrical parameters of tertiary structures were refined for ∆FN3.1 predicted with RoseTTAFold (∆FN3.1-RF) and AlphaFold2 (∆FN3.1-AF2) as well as for ∆FN3.3 predicted with RoseTTAFold (∆FN3.3-RF) and IntFOLD5 (∆FN3.3-IF5). MD simulations lasted for 100 ns followed by evaluation of RMSD fluctuations, clusterization and Ramachandran map analyses of the most representative structures. MD simulations of ∆FN3.1-RF and ∆FN3.1-AF2 completed successfully and reached the plateau (see RMSD curves in
Figure S9A). The amplitude of RMSD fluctuations for ∆FN3.1-AF2 was substantially lower than for ∆FN3.1-RF, suggesting that the latter model is less stable. Evaluation of spatial organization of representative frames using Ramachandran maps (
Figure S9B) revealed a big number of sterically unfavorable conformations of the side chains in the amino acid residues in ∆FN3.1-RF compared to ∆FN3.1-AF2. Therefore, the latter model was considered in subsequent calculations.
The tertiary model of ∆FN3.3-RF achieved an equilibrium state neither within the initial 100 ns of MD simulations nor after an additional 100 ns (
Figure S10C). Therefore, clusterization of trajectory data was not performed. MD simulations of ∆FN3.3-IF5 structure followed by clusterization procedure generated a tertiary structure for molecular modeling stable for 100 ns. The RMSD curve (
Figure S10B) calculated by Cα atoms reached the plateau and fluctuated within 8–12 Å. The Ramachandran maps (
Figure S10C) revealed minor steric conflicts and irregular conformations in the loops and terminal zones. Nevertheless, in the clusterization procedure the representative frames reflected the most stable conformations. The tertiary structure of ΔFN3.3 was chosen based on these data.
Thus, we focused on tertiary structures of ΔFN3.1 and ΔFN3.3 proteins obtained with AlphaFold2 and IntFOLD5, respectively. Of note, the models depicted in
Figure 2B, C differed from the reported tertiary structures [
31]. The reasons for these discrepancies remain to be elucidated; however, all three methodologies of structural prediction generated close results (
Table S1).
Geometrical parameters of TNF-α, IL-8, IL-10 and IL-6 were taken from PDB. Among 37 structures [
40], 4G3Y [
41] and 5UUI [
42] fit the parameters obtained by X-ray analyses with best resolution. For interleukins, the best geometrical parameters corresponded to the PBD codes 1ALU [
43] – IL-6; 5D14 – IL-8 and 2H24 [
44] – IL-10. Also, we used an AlphaFold2 methodology for prediction of tertiary structures of the above proteins. Since these proteins are well studied, the results of predictions were good (
Table S1). Unlike for ΔFN3 proteins, different servers were unnecessary. Geometrical parameters of predicted tertiary structures of TNF-α, IL-8, IL-10 and IL-6 were refined during 100 ns MD simulations. The analysis produced the geometrical parameters of proteins that corresponded to the most representative clusterization frames (
Figures S11, S12).
2.5. Molecular Docking
2.5.1. FN3-TNF-α Interaction
The region(s) in TNF-α involved in the interactions with ∆FN3 proteins has not been identified [
31]. For FN3 domain-containing eukaryotic proteins the interactions take place in the cytokine receptor motif. We hypothesized that in the ΔFN3.1 protein of
B. longum GT15, the following amino acid residues may be involved in binding to cytokines: Trp78, Ser79, Pro81, and Ser82 (the “cytokine receptor motif” in the 1st domain of FN3, annotated in NCBI); Trp174, Ser175, Glu177, Ser178 (the “cytokine receptor motif” in the 2nd domain of FN3, annotated in NCBI), and Ala43, Ala51, Thr111, Pro417, and Ala424 which we have identified in 203 sequenced genomes of
B. longum subsp.
longum [
31]. For the
B. bifidum 791 ΔFN3.3, it can be assumed that the residues involved in cytokine binding are located in the cytokine receptor motifs in the 1st and 2nd domains (
Table 4). The amino acid sequences of ΔFN3.3 proteins of all
B. bifidum genomes were identical (our unpublished data).
Protein-protein docking procedures generated 30 poses of the cytokine relative to FN3 proteins. In the first approximation, we selected optimal docking poses (
Tables S3 and S4). Selection was based on energy parameters and the analysis of intermolecular interactions between the amino acid residues in the cytokine and FN3. Also, we considered an involvement of residues presented in
Table 4. Then two poses were chosen for MD refinement of geometrical parameters of ΔFN3.1-TNF-α and ΔFN3.3-TNF-α complexes.
MD simulations of ΔFN3.1-TNF-α complexes in positions 24 and 5 as well as ΔFN3.3-TNF-α complexes in positions 21 and 14 were performed for 200 ns. RMSD fluctuations are given in Figure-SM8. The ΔFN3.1-TNF-α-pose5 equilibrated by 120 ns (
Figure S13A) unlike ΔFN3.1-TNF-α-pose24 (
Figure S13B). RMSD fluctuations were ~10Å. Similar conclusion can be drawn from the analysis of ΔFN3.1-TNF-α MD curves (
Figure S13C,D): in the ΔFN3.3-TNF-α-pose14, RMSD fluctuations of ΔFN3.3 and TNF-α were within 2-4 Å by the completion of simulations (
Figure S13C) whereas in ΔFN3.3-TNF-α -pose21 the fluctuations were significant (
Figure S13D).
Clusterization procedures produced a representative frame that corresponded to the most stable position of the system over the entire time of simulations. This frame contains similar RMSD values. In all cases Ramachandran maps were good, with a few insignificant steric conflicts (
Figure S14). Free energies of binding (ΔG
bind) and dissociation constants (K
D) were estimated for each complex. Since the binding regions of TNF-α and ΔFN3 are uncertain, we selected the complexes with K
D values close to experimental values (
Table S5).
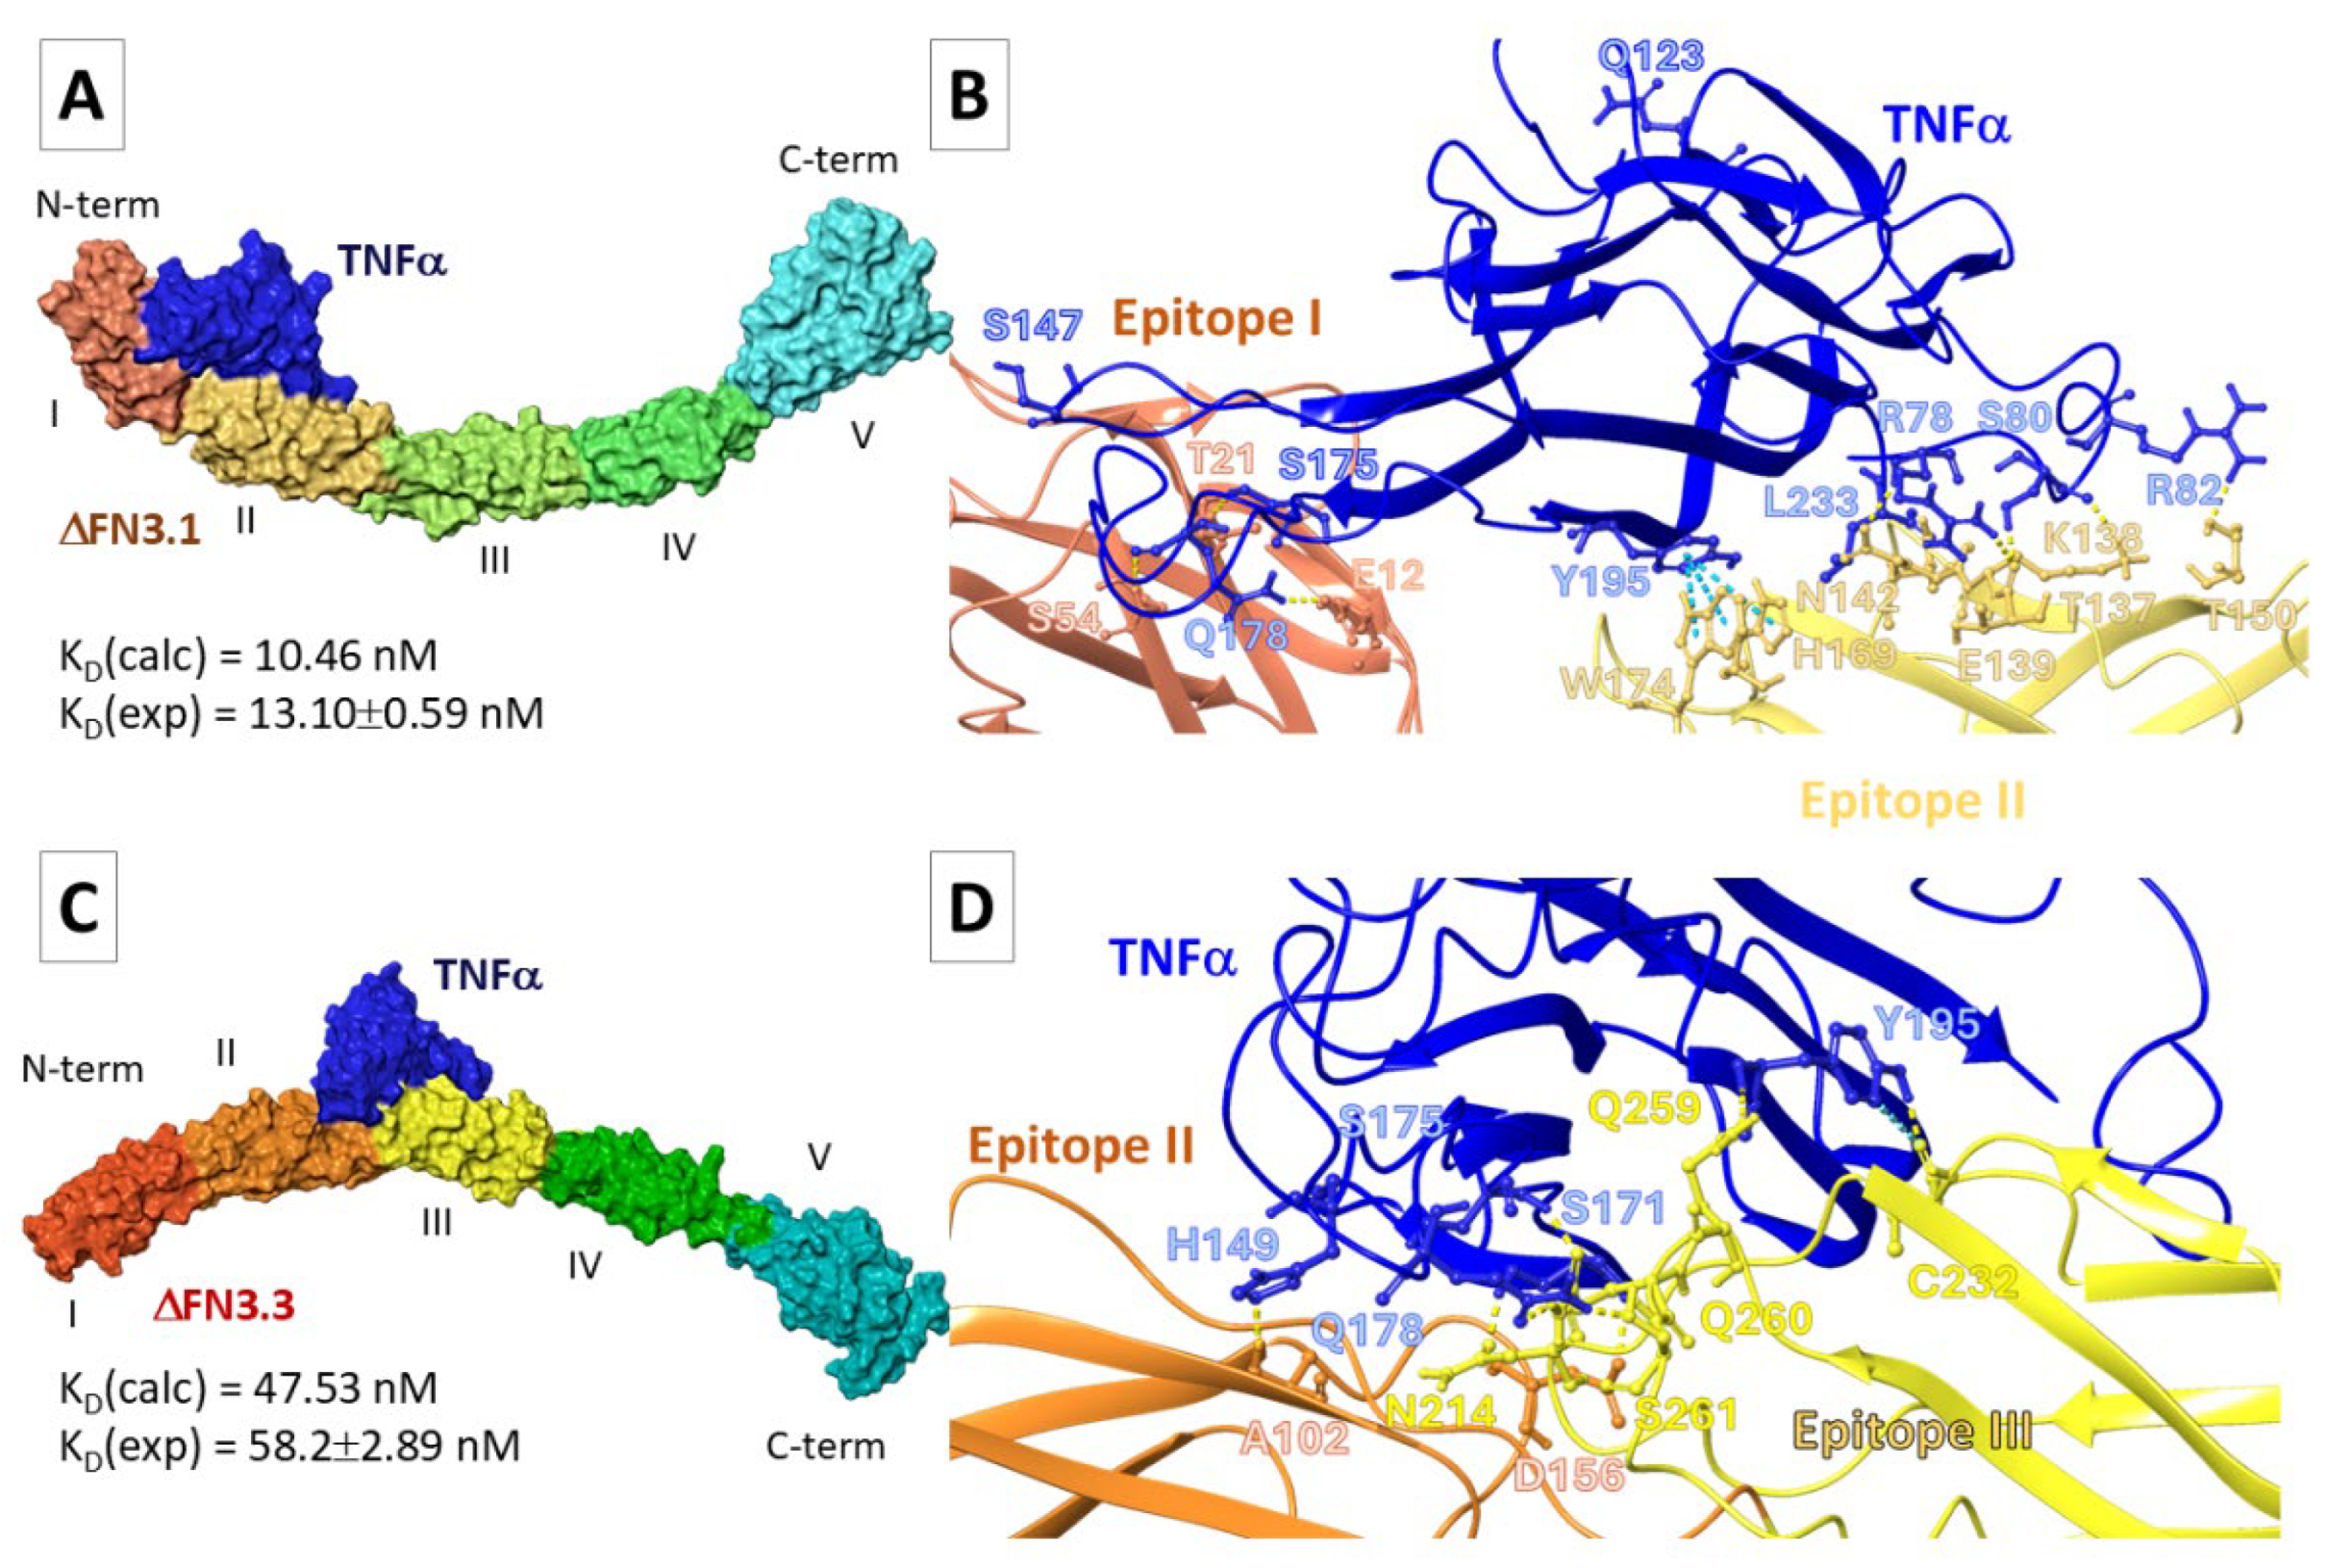
During the entire time of simulation TNF-α localized predominantly between epitopes I and II of ∆FN3.1 and formed intermolecular interactions such as hydrogen bonds, salt bridges and π-π stacking (
Figure 3A,
Table S5). In the representative frame ∆FN3.1- TNF-α-pose24) the hydrogen bonds were found between the residues in TNF-α and epitope II; residues W174-Q123, D158-S147 and N173-Q123 were critically important (
Table S5). In the pose 5 the cytokine was bound to FN3. Intermolecular contacts between Y195 in TNF-α formed π-π cation stacking bonds with W174 (
Figure 3B). This position of the cytokine relative to ∆FN3.1 was characterized by a smaller number of hydrogen bonds compared to the pose24. However, the theoretically calculated K
D value was closer to the experimental data.
Most probably, TNF-α interacts with ∆FN3.3 between the epitopes. Nevertheless, numerous intermolecular contacts with epitope III were registered (Table-S5,
Figure 3C). In the pose14, the pairs of residues in the complexes form hydrogen bonds (
Figure 3D). In the pose21, the salt bridges were formed between K204-E219 in ∆FN3.3 and K216-E180 in the cytokine (
Table S5). Values ΔG
bind for TNFα-∆FN3.3 complexes in the pose14 were below those in the pose21. Consequently, K
D (∆FN3.3-TNF-α-pose14) was comparable with experimental data (Table-S5,
Figure 3D). We suggested that main differences between K
D values of TNF-α-FN3 complexes are dictated by differential positioning of TNF relative to the surfaces of ∆FN3.1 and ∆FN3.3.
2.5.2. FN3-Interleukin Interactions
The potential binding site(s) of bifidobacterial ∆FN3 proteins with interleukins is also unknown. We selected optimal docking poses out of 30 for MD-assisted refinement of geometrical parameters of ∆FN3-interleukin complexes (
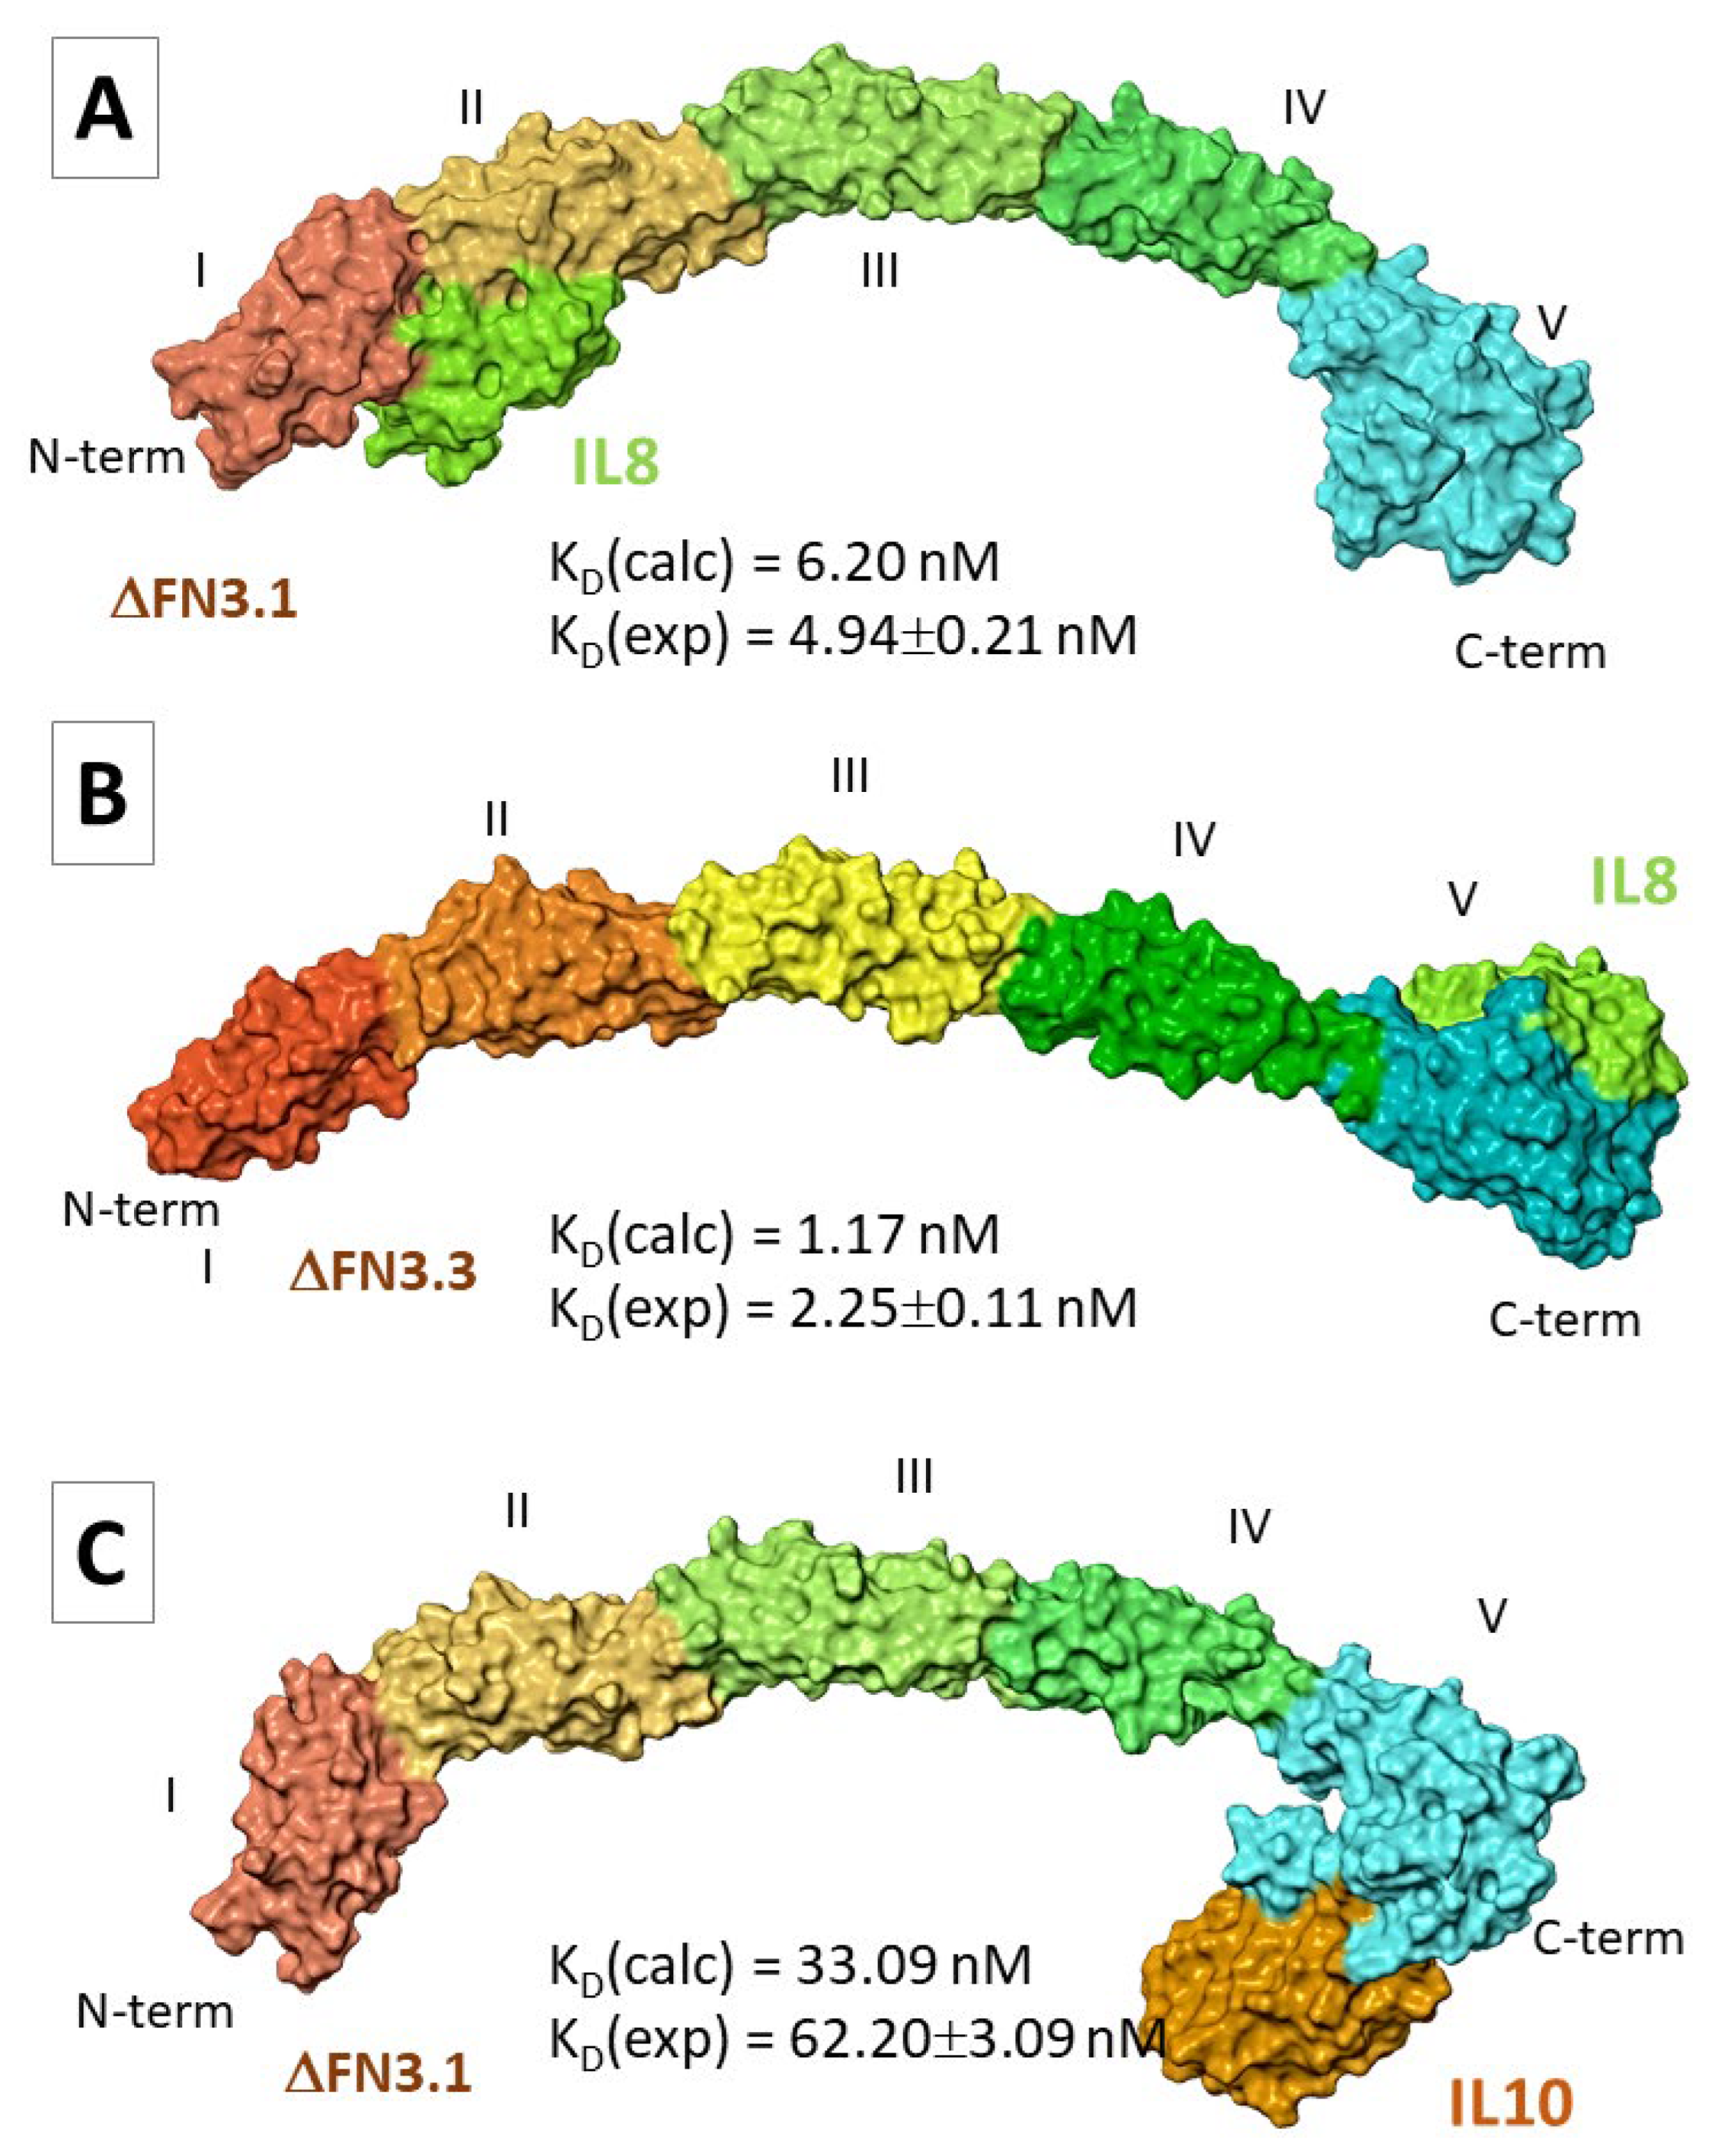
Tables S6, S7). For IL-8, two poses were selected in which the cytokine was located between the epitopes I and II (pose3) or II and III (pose11) in ΔFN3.1. A number of hydrogen bonds was found between the aa. residues (
Table S6). In the majority of docking poses the contacts of ∆FN3.3 with IL-8 involved the epitope V. In this case we analyzed two opposite poses: #17 (IL-8 bound to the epitope V) and #19 (IL-8 bound to the epitope III; Table-S5). In the latter pose only a few hydrogen bridges were detected, unlike ΔFN3.3-IL-8(pose17). The analysis of MD trajectories showed that both ΔFN3.1-IL-8(pose3) and ΔFN3.1-IL-8(pose11) reached an equilibrium by the end of simulation (
Figure S15A,B). Still, for ΔFN3.1-IL-8(pose11) complexes, RMSD fluctuations of IL-8 atoms were more pronounced (~10Å;
Figure S15D) than in ΔFN3.1-IL-8(pose3) complexes (Figure-S9C). The interaction of IL-8 with the C-terminus of ΔFN3.3 (pose17) was more stable than with the epitope III (pose19;
Figure S15C,D). The Ramachandran maps that corresponded to the representative frames were satisfactory (
Figure S16). The calculated values ΔG
bind and K
D suggested that the probable positioning of IL-8 on the surface of ΔFN3.1 and ΔFN3.3 corresponded to the pose3 (
Figure 4A) and pose17 (
Figure 4B), respectively. The calculated K
D values were in agreement with experimental values.
In the case of IL-10 we selected two poses: IL-10 binds to the C-terminus of ΔFN3.1 (pose16) or the cytokine is localized between the epitopes I and II (pose28). In the former scenario, more intermolecular hydrogen bonds and salt bridges were registered compared with pose28 (
Table S6). One may suppose that IL-10 interacts with ΔFN3.3 via the C-terminus (
Table S7). Each of four MD simulations showed an unstable positioning of the interleukin relative to the surface of ΔFN3 proteins (
Figure S17). Representative frames with Ramachandran maps were obtained only for ΔFN3.1-IL-10 complexes in two poses (
Figure S18). Values ΔG
bind for both poses were comparable (
Table S8). Nevertheless, K
D values suggest that, predominantly, IL-10 makes contacts with the epitope V at the C-terminus of ΔFN3.1 (
Figure 3C).
According to the results of molecular docking, IL-6 preferentially binds to the C-termini of ΔFN3.1 and ΔFN3.3 (
Table S6,
Table S7) forming a small number of hydrogen bonds between the paired aa. residues. MD simulations revealed an unstable positioning of IL-6 relative to the surfaces of ΔFN3.1 or ΔFN3.3 (
Figure S19). Since the experimental data showed a weak interaction of IL-6 with ΔFN3 proteins, we did not calculate ΔG
bind and K
D values.
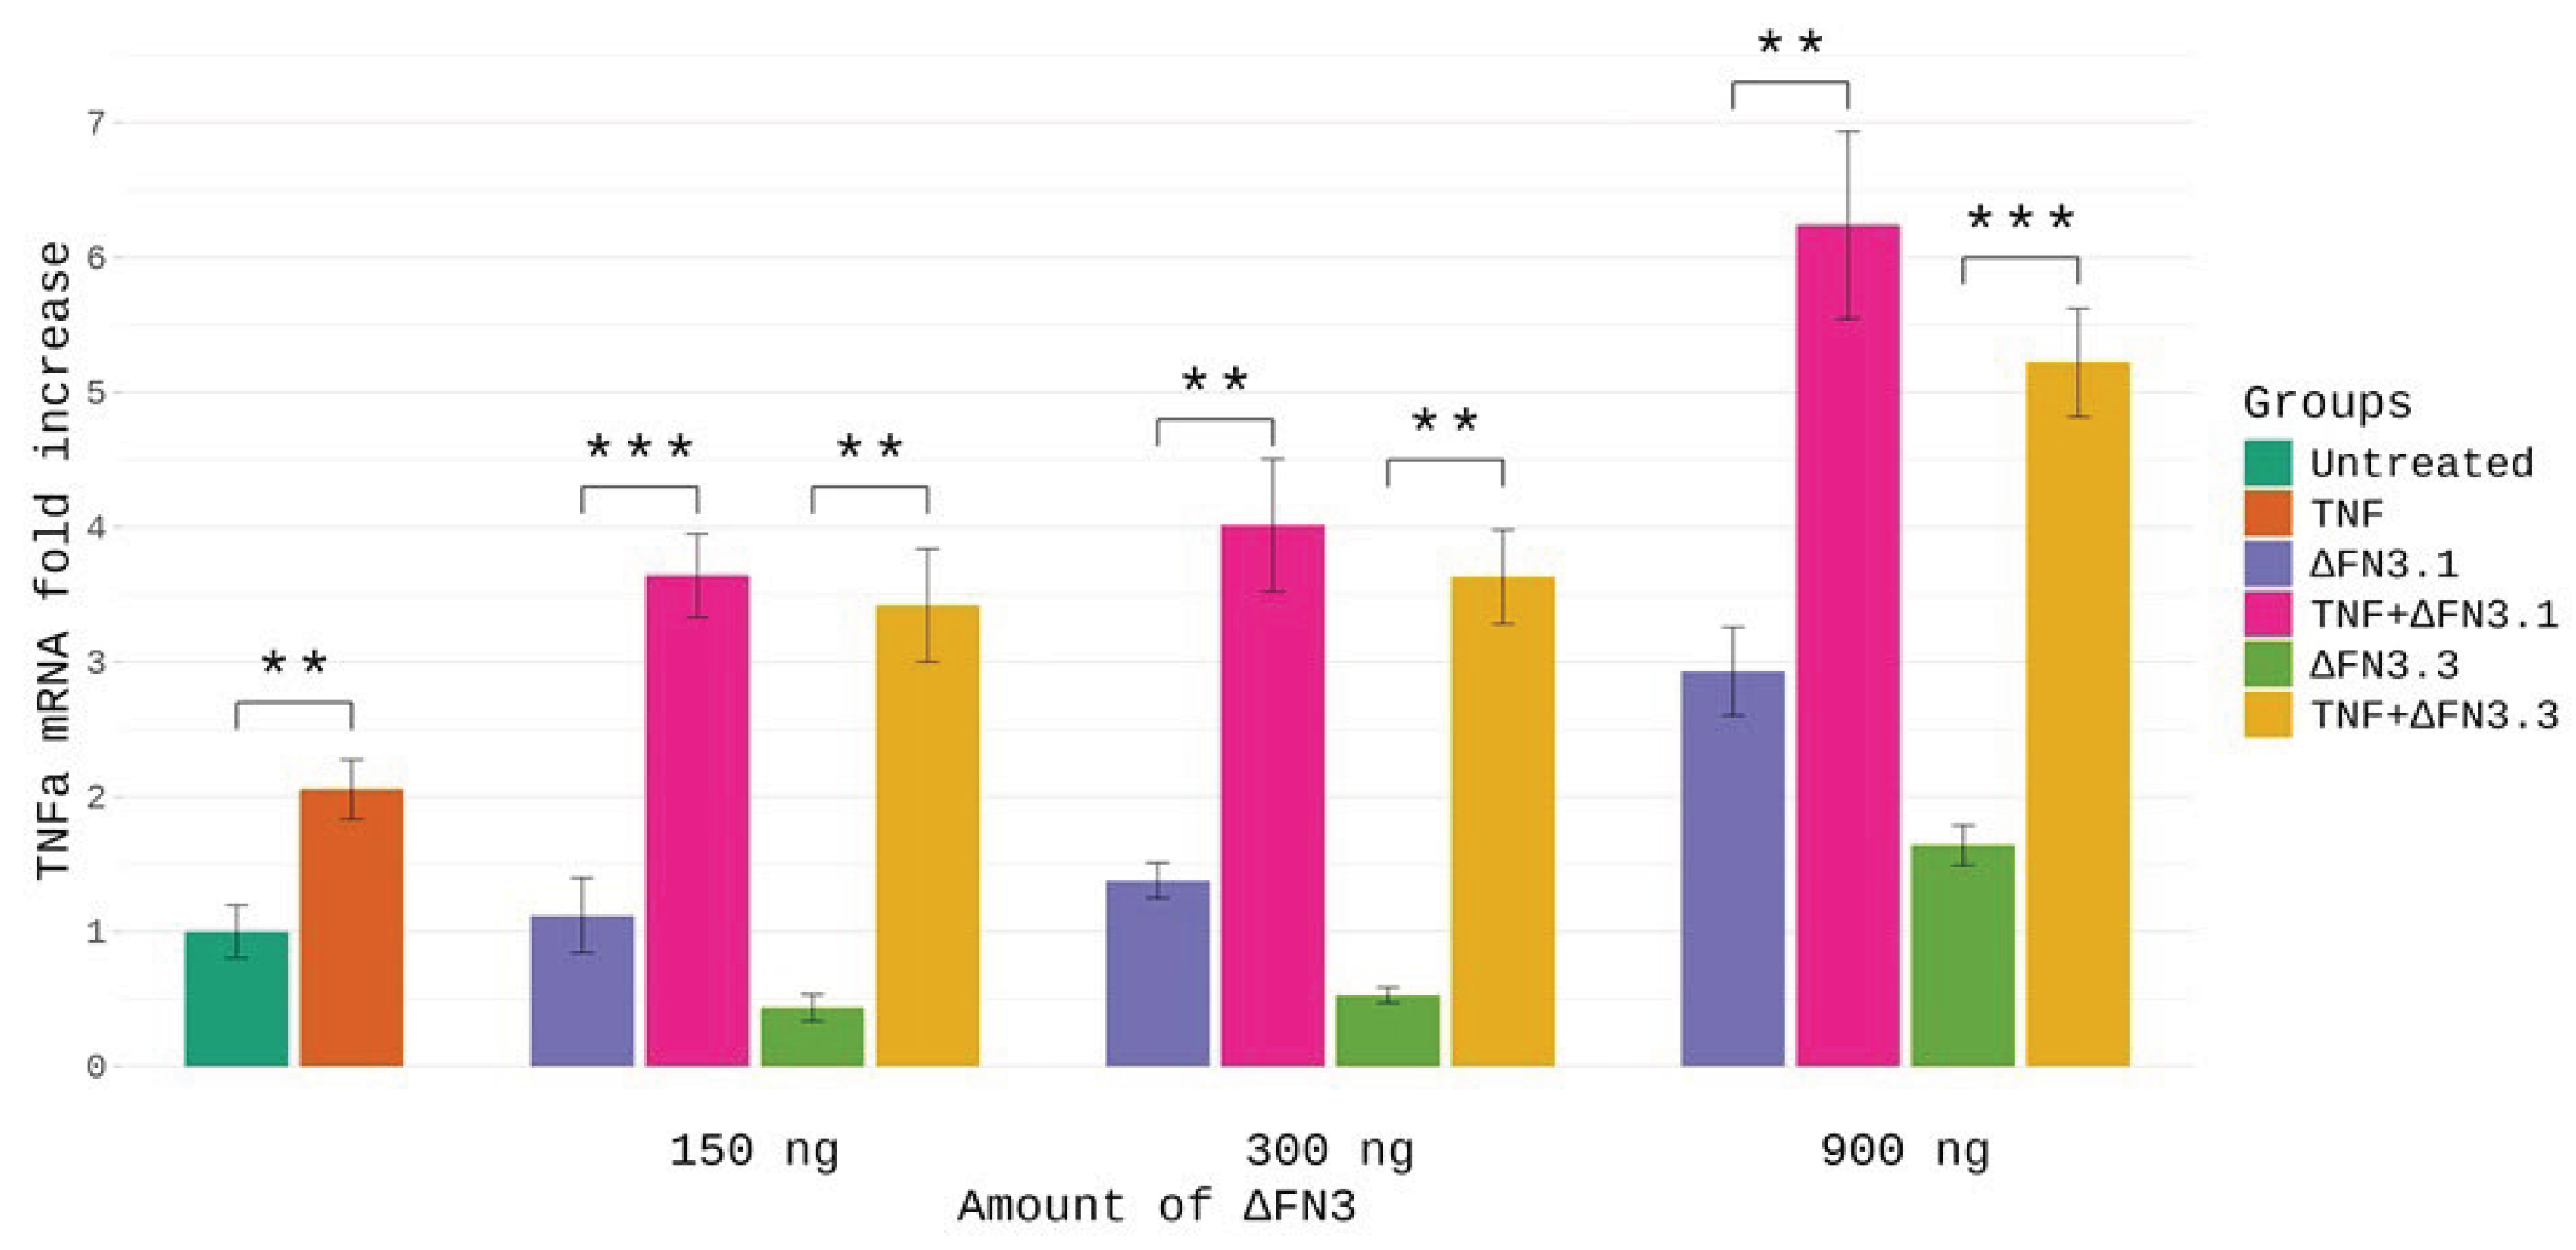
2.6. Effects of ΔFN3 and TNF-α on Cytokine mRNA Abundance in THP-1 Cells
To get insight into the physiological significance of binding of ΔFN3 to TNF-α, we studied the effects of the combination of these proteins on the expression of genes known to be regulated, at least in part, by TNF-α:
IL-6,
IL-8 and
TNF-α. In so doing we treated the THP-1 human monocytic leukemia cell line with ΔFN3 proteins alone or in combination with TNF-α for 3 h followed by RT-PCR. Conditions of treatment were optimized in preliminary experiments. As shown in
Figure 5, ΔFN3.1, ΔFN3.3 or TNF-α alone caused no significant increase of TNF-α mRNA except for relatively big (900 ng) amounts of ΔFN3 proteins. In contrast, the combinations of ΔFN3.1 or ΔFN3.3 with TNF-α elevated the abundance of TNF-α mRNA ~4-7-fold. The synergy was independent of the amounts of ΔFN3 proteins, that is, the fold increase of TNF-α mRNA was similar for each combination. These results strongly suggested that ΔFN3 can synergize with TNF-α in activating the gene encoding this cytokine. Effects of combinations were gene-specific: TNF-α alone was a strong inducer of the IL-8 mRNA whereas no synergy with ΔFN3 proteins was detected (at least at the concentrations used in the experiments) (
Figure S20). Also, no synergistic effect on the
IL-6 mRNA was observed.
3. Discussion
Bifidobacteria comprise an ancient group of anaerobic bacteria [
45]. These microbes are the only representatives of actinobacteria in the gastrointestinal tract [
46] counting for 99 species [
47].
B. longum and
B. bifidum are the primary residents of the child’s intestine that participate in the immune system development [
3]. Bifidobacteria and their metabolites have been implicated into the intestine-brain and intestine-immunity cross-talks [5, 48].
The FN3 protein, initially identified by us as a product of the PFNA operon, can be a candidate mediator of immune regulation by bifidobacteria. ΔFN3 proteins demonstrate a high interspecies divergence of amino acid sequences. Also, ΔFN3 carry various motifs of cytokine receptors; these structural features substantiate the differential affinity to certain cytokines. We have shown that the conservative cytokine receptor motifs in bifidobacteria contain WS-PS, WS-ES, WS-DS or WS-YS stretches. The most striking was the difference between
B. angulatum and
B. bifidum [
15], namely, the absence of the WSXWS motif in the 2nd FN3 domain.
In the present study we dissected FN3-cytokine interactions in more detail. Previously we have used ELISA to show that the FN3 fragment (∆FN3.1) of the
B. longum GT15 strain preferentially binds TNF-α [
17]. The structural model of ΔFN3.1 generated with the trRosetta software included five epitopes with β-sheets as predominant folds. Two epitopes are formed by two FN3 domains whereas another three epitopes are presented in the C-terminal region [
31]. We determined the binding profiles of ΔFN3.1
B. longum GT15 and ΔFN3.3
B. bifidum 791 with TNF-α, IL-6, IL-8 and IL-10 using the surface plasmon resonance measurements. Kinetic analysis of ΔFN3-cytokine interaction proved that ΔFN3.1 and ΔFN3.3 can bind TNF-α and IL-8. Furthermore, ΔFN3.1 was capable of binding IL-10 whereas IL-6 interacted with neither ΔFN3.
We next performed de novo molecular modeling [
34] and neuronal network technologies to generate, for the first time, the tertiary structures of ΔFN3.1 and ΔFN3.3. Based on these models, we provided novel evidence regarding tentative cytokine binding regions in ΔFN3 proteins. Results of calculated binding energies and dissociation constants of ΔFN3-cytokine complexes were in a good agreement with experimental data.
Most importantly, our modeling demonstrated that cytokine-binding regions differed for individual ΔFN3 proteins. For ΔFN3.1
B. longum GT15, TNF-α interacted presumably with the 2nd FN3 domain; this interaction involved aa. residues of the cytokine receptor motif WSXWS (
Figure S21). In complexes ΔFN3.1-IL8 pose3 (
Table S8) the interaction involves W174 in the 2nd domain as well as the neighboring residues I172 and N173. In contrast, the above motif is absent in the 2nd domain of ΔFN3.3
B. bifidum 791; the binding involved other residues located in the 1st domain and the C-terminus. These findings, being not obviously predictable, expand our knowledge of mechanisms of interactions between microbiota and the immune system. Several protein regions in the participating proteins are involved, making these interactions non-incidental; mutational analysis will determine the significance of specific sites. One may hypothesize that individual regions provide more conformational opportunities that ultimately cooperate to form stable complexes. Thus, structural diversity of binding regions ensures the evolutionary conserved manner of microbiota-cytokine interactions.
Testing whether the affinity of ΔFN3 to cytokines in cell-free systems may be translated into the physiological effect, we observed that both ΔFN3.1 and ΔFN3.3 synergized with TNF-α in the activation of the TNF-α gene in the human monocyte cell line. We suggest that ΔFN3 bind TNF-α in the extracellular milieu thereby facilitating the autoregulatory loop ΔFN3 - TNF-α - TNF-α induction. The synergistic effect of the combination was specific for TNF-α since no additivity was registered for IL-8 or IL-6 mRNAs upon cell exposure to TNF-α together with either ΔFN3.1 or ΔFN3.3. These observations add the complexity to the interpretation of the role of microbiota in the immune regulation. TNF-α is a pleiotropic cytokine with the established significance in a variety of immune reactions [
49]. The gene encoding this factor carries two promoters with functionally opposite effects [
50]. More studies are needed to clarify the mechanism(s) whereby the bifidobacterial proteins synergize with TNF-α to sustain TNF-α activation. One plausible explanation could be acquisition of a specific confirmation of TNF-α in complexes with ΔFN3, making the cytokine a stronger inducer of the cognate gene. This assumption is in line with the above-mentioned conformational hypothesis: the more binding sites, the more variants of formation of functionally diverse protein-protein complexes. Finally, interference with ΔFN3-TNF-α interaction with a small molecular weight compound or a peptide inhibitor might be considered for disruption of the autoregulatory loop to attenuate stress-induced cytokine release.
4. Materials and Methods
4.1. Bacterial Strains, Plasmid Vectors, Culture Media and Conditions
We used the following strains:
B. angulatum GT102 [
30],
B. bifidum 791,
E.coli DH5a (F–, Φ 80 ΔlacZΔM15, Δ(lacZYA-argF), U169) (Promega, USA) [
51] and
E. coli BL21(DE3) (F–, dcm, ompT, hsdS(rB–mB–), gal λ (DE3)) (Novagen, USA). The expression vector pET16b (Novagen, USA) [
52] contains a His-Tag linker in the N-terminal region for protein isolation and purification.
B. angulatum GT102 and
B. bifidum 791 strains were cultured under anaerobic conditions (HiAnaerobic SystemeMark III, HiMedia, India) in agar and MRS broth (HiMedia, India) supplemented with cysteine (0.5 g/l) at 37°C for 24-48 h.
E. coli strains were propagated in Luria-Bertani (LB) broth [
53]. Ampicillin (150 μg/ml) was used as a selective agent for selection of plasmid-bearing cells. All reagents were from Amresco, USA unless specified otherwise.
4.2. DNA Manipulations
Genomic DNAs of
B. angulatum GT102 and
B. bifidum 791 were isolated using the GenElute Bacterial Genomic DNA Kit (Sigma-Aldrich, USA). Isolation of plasmid DNA, obtaining competent
E. coli cells, transformation and analysis of recombinant plasmids were performed using standard methods [
53]. DNA fragments carrying Δ
fn3 were amplified from genomic DNAs of
B. angulatum GT102 and
B. bifidum 791 strains using Phusion High Fidelity PCR Master Mix (Thermo Fisher Sci., Lithuania) on a mini-cycler PTC-0150 (MJ Research, Inc., USA). The following oligonucleotides were used for amplification: FN3B.ang-N: (5´-tcgtcatatgcccgacgccccgtcactgt-3´), FN3B.ang-C: (5´-gatcctcgagctaccgggaatacgtatgcaattc-3´), FN3B.bif-N(5´-tcgtcatatggacaagcccggcgcgccgc-3´) and FN3B.bif-C: (5´-gatcctcgagtcatggtcggtttgaggccag-3´) (all from Eurogen, Russia). PCR-amplified fragments were cloned into
NdeI and
XhoI restriction sites of the His-Tag-containing pET16b expression vector.
4.3. Expression in E. coli and Purification of Recombinant ΔFN3 Proteins
E. coli BL21 (DE3) cells containing the recombinant plasmid were grown in LB broth at 37°C until they reached OD600 of 0.6-0.8. The fn3 gene of B. angulatum GT102 and B. bifidum 791 was induced by the addition of 1 mM isopropyl-β-D-1-thiogalactopyranoside (IPTG) for 5 h at 28°C. Cells were pelleted and frozen at -20°C. To study the expression of fn3, cells were resuspended in a sample buffer containing 62.5 mM Tris-HCl pH 6.8, 5% glycerol, 2% 2-mercaptoethanol, 0.1% SDS and 0.001% bromophenol blue, then heated at 95°C for 10 min and analyzed by 12.5% SDS-PAGE. Protein fractions of E. coli BL21 (DE3) cells containing empty pET16b plasmid were used as negative controls.
Isolation and purification of ΔFN3.1
B. longum GT15 and ΔFN3.3
B. bifidum 791 were carried out as described [
17]. Samples were dialyzed in a buffer containing 10 mM HEPES-NaOH pH7.4, 150 mM NaCl, 10% glycerol, and 1 mM phenylmethylsulfonyl fluoride (PMSF). Protein concentration was measured on a Qubit 2.0 fluorimeter (Invitrogen, USA). Purified proteins were stored at -80°C.
4.4. Interaction of ΔFN3 Proteins with TNF-α, IL-8, IL-6 and IL-10
For surface plasmon resonance analysis (imSPR-Pro system, iCLIEBIO, Korea), recombinant TNF-α, IL-8, IL-6 and IL-10 (ProSpec, Israel) were immobilized on the sensor COOH-chip (iCLIEBIO). Four different concentrations of the analyte sample (ΔFN3.1 B. longum GT15 or ΔFN3.3 B. bifidum 791) were prepared by serial dilution in a running buffer containing 10 mM HEPES-NaOH pH8.0 (or pH 7.4), 150 mM NaCl and 0.05 % Tween-20. The ΔFN3.1 B. longum GT15 or ΔFN3.3 B. bifidum 791 samples were injected at a flow rate 30 µl/min. The injection step included a 200 sec association phase followed by a 600 sec dissociation phase. Serum albumin (SibEnzyme, Russia) was used as a control for non-specific protein binding. Data were analyzed by globally fitting curves describing the simple 1:1 bimolecular model to the set of three sensorograms using BIAEvaluation software [biaevaluation.software.informer.com]. Sensorograms characterize the changes of the signal over time. Signals were measured in resonance units (RU) proportionally to the amount of the surface-bound substance. Initially the analytes ∆FN3 B. longum GT15 and B. bifidum 791 were loaded onto the chip and allowed to interact with TNF-α, IL-6, IL-8 and IL-10 for 200 sec. The sensorograms registered the responses over time. The rate of complex association Ka (1/Ms) was calculated. Next, the chips were washed with a running buffer, and the complexes were allowed to dissociate for up to 600 sec. This process reflected a decreased response on the sensorograms. The dissociation rate Kd (1/s) and dissociation constant KD=Kd/Ka (M) were calculated.
4.5. Molecular Modeling Studies
4.5.1. Prediction of Tertiary Structure of ∆FN3 Proteins
Tertiary structures of ∆FN3.1 and ∆FN3.3 were predicted on the basis of AlphaFold2 [
33]; RoseTTAFold [
34]; I-TASSER [35-37] and IntFold5 [
38] and scoring functions. In AlphaFold2 and RoseTTAFold the accuracy of predictions is estimated as predicted Local Distance Difference Test (pLDDT) values that reflect local atomic distances [
54]. The I-TASSER and IntFOLD5 tools use their evaluation functions to assess the accuracy of prediction, analogously to pLDDT: C-score (Confidence Score) [35, 55-56] and GMQS (Global Model Quality Score) [38, 57]. The algorithm is presented in
Figure S22. Tertiary structures of TNF-α, IL-6, IL-8 and IL-10 were predicted using AlphaFold2 [
33]. Geometrical parameters of each structure were refined by molecular dynamic (MD) simulations within 100 ns.
4.5.2. Protein-Protein Docking
To study the affinity of TNF-α, IL-8, IL-10 and IL-6 to FN3 proteins, we used the protocol of protein-protein docking PIPER [
58]. The protocol is based on the method of quick Fourier transformation with a novel potential DARS (Decoys As the Reference State). The docking algorithm presumes the rotation of the ligand (TNF-α, IL-8, IL-10 or IL-6) relative to the receptor (∆FN3 protein) fixed in the coordinate system; all possible orientations of proteins relative to each other are detectable. The systems were considered solid bodies without optimization of protein-protein interface. Because the binding regions have not been identified, the positions were unlimited. The docking poses were ranged according to weight coefficients of energy terms PIPER score and PIPER energy [
59].
4.5.3. MD Simulations
Model systems of tertiary structures and protein-protein complexes were generated in the graphic milieu of the academic version of Maestro (Schrödinger Release 2024-1). The systems were placed into a cubic well with the buffer zone 15-25 Å filled with 0.15 M NaCl. Extra charges on proteins were neutralized with Na
+ and Cl
-. TIP3P was used as a solvent. MD modeling was performed in an NPT ensemble at 310 K (37°C). Total time of simulations was 50-200 ns, 2 fs increment of the integrator, 5000 – 10,000 trajectory frames. The force field was OPLS4 [
60]. MD simulations were performed using Desmond [
61]. The analysis included mean square deviation of atomic positions (RMSD) and clusterization of frames [
62].
4.5.4. Estimation of Binding Energy and KD
Representative frames were aligned with geometrical parameters of statistically significant protein-protein complexes for which the free binding energies (∆G
bind) were estimated according to MM-GBSA methodology [
63]. Frames were selected based on minimal RMSD values and maximal number of repetitive images. The binding of TNF-α and interleukins to the surface of FN3 proteins can be expressed as:
where [P]
eq are FN3 proteins, [L]
eq are TNF-α or interleukins, [P+L]
eq is the protein-protein complex in an equilibrated state. The value ∆G
bind depends on the dissociation constants as:
where R is universal gas constant = 8.314 J/(mol*K), T is temperature, K˚
D is the dissociation constant:
The physical meaning of K˚
D represents the standard constant of equilibrium, a value transformed into K
D using the formula:
where P is pressure (H/m
2), ∆ν is the sum of stoichiometry parameters of reaction coefficients (1).
4.6. Detection of Cytokine mRNA by Reverse Transcription-Polymerase Chain Reaction
The THP-1 human monocytic leukemia cell line (American Type Culture Collection, Manassas, VA) was propagated in RPMI-1640 supplemented with 2 mM
L-glutamine (PanEco, Russia), 10% fetal bovine serum (Atlanta Biol., Flowery Branch, GA), 50 U/ml penicillin and 50 µg/ml streptomycin (PanEco, Russia) at 37˚C, 5% CO
2 in a humidified atmosphere. Cells in the logarithmic phase of growth were used in experiments. Cells were plated into 6-well plates (FDCELL, China; 4×10
5/2 ml of culture medium) and treated with 300 ng of recombinant TNF-α (SCI STORE, Russia) in the absence or presence of varying amounts of ΔFN3.1 or ΔFN3.3 for 3 h (
Table S9). Cells were pelleted, washed with saline and lysed in ExtractRNA reagent (Evrogen, Russia). Total RNA was isolated according to the manufacturer’s instructions. Reverse transcription was performed using the MMLV RT kit (Evrogen, Russia). PCR mixtures (25 µl) contained 13 ng cDNA template, primers (0.4 µM each), qPCRmix-HS SYBR (Evrogen, Russia) and deionized water. Amplifications were carried out on a CFX96 (Bio-Rad, Hercules, CA) at 95˚C - 5 min, 95˚C 30 s, 62˚C 30 s and 72˚ 30 s (40 cycles). To analyze RT-PCR data, the CFX Manager V 3.1 program (Bio-Rad) was used. The
HPRT1 mRNA was taken as a reference [
64]. Three biological replicates (each sample in triplicate) were analyzed; data were expressed as ∆∆Cq. Primers were designed using primer-BLAST [
65] (
Table S10).
4.7. Bioinformatic Analysis
5. Conclusions
Interactions of the intestinal microbiota with the immune system form an important axis in normal homeostasis as well as in disease. Differential ability of individual bifidobacterial proteins to bind cytokines sets the stage for personalized use of chemical and biotechnological instruments that regulate these interactions. Knowledge about the molecular determinants of microbiota-cytokine binding can be expanded on other commensal species. Bifidobacterial ΔFN3 proteins are perspective as prototypic modulators of microbiome-immunity cross-talk, in particular, for the design of chemical or peptide disruptors for prophylaxis and therapy.
Supplementary Materials
The following supporting information can be downloaded at the website of this paper posted on Preprints.org. Figure S1: Expression of genes encoding proteins ΔFN3.2 B. angulatum GT102 and ΔFN3.3 B. bifidum 791; Figure S2: Isolation and purification of recombinant ΔFN3.3 protein: chromatogram of protein isolation and purification (A), electrophoresis of protein isolation and purification (B); Figure S3: Sensorograms of interaction of TNF-α with ΔFN3.1 B. longum (A), ΔFN3.3 B. bifidum 791 (B) and albumin BSA (C); Figure S4: Sensorograms of interaction of ΔFN3.1 B. longum GT15 (A,B) and ΔFN3.3 B. bifidum 791 (C,D) with IL-8; Figure S5: Sensorograms of interaction of ΔFN3.1 B. longum GT15 (A,B) and ΔFN3.3 B. bifidum 791 (C,D) with IL-10; Figure S6: Sensorograms of the interaction of ΔFN3.1 B. longum GT15 (A, B) and ΔFN3.3 B. bifidum 791 (C,D) with IL-6; Figure S7: Ramachandran maps for ΔFN3.1 models whose tertiary structure is predicted using various methodologies: AF2, AlphaFold2; RF, RoseTTAFold; IT, I-TASSER; IF, IntFOLD5; Figure S8: Ramachandran maps for ΔFN3.3 models whose tertiary structure is predicted by various methodologies: AF2, AlphaFold2; RF, RoseTTAFold; IT, I-TASSER; IF, IntFOLD5; Figure S9: Results of MD simulations of ΔFN3.1 structures predicted by AlphaFold2 (AF2) and RoseTTAFold (RF): RMSD is used to measure average change in displacement of a selection of atoms for a particular frame with respect to a reference frame. RMSD was calculated for all frames in the trajectory (A), Ramachandran maps for representative MD simulation frames (B); Figure S10: Results of MD simulations of ΔFN3.3 structures predicted by RoseTTAFold (RF) and IntFOLD5 (IF5): RMSD is used to measure average change in displacement of a selection of atoms for a particular frame with respect to a reference frame (calculated for all frames in the trajectory) (A), Ramachandran maps for representative MD simulation frames (B); Figure S11: MD simulations of TNF-α and interleukin structures predicted by AlphaFold2: RMSD is used to measure average change in displacement of a selection of atoms for a particular frame with respect to a reference frame calculated for all frames in the trajectory) (A-D); Figure S12: MD simulations of TNF-α and interleukins: Ramachandran maps for representative MD simulation frames (A-D); Figure S13: MD simulations of complexes TNF-α-ΔFN3: RMSD is used to measure average change in displacement of a selection of atoms for a particular frame with respect to a reference frame (A-D); Figure S14: MD simulations of TNF-α-ΔFN3 complexes: Ramachandran map for representative MD simulation frames; Figure S15: MD simulations of complexes IL8-ΔFN3: RMSD is used to measure average change in displacement of a selection of atoms for a particular frame with respect to a reference frame (A-D); Figure S16: MD simulations of complexes IL8-ΔFN3: Ramachandran map for representative MD simulation frames (A-D); Figure S17: MD simulations of complexes IL10-ΔFN3: RMSD is used to measure average change in displacement of a selection of atoms for a particular frame with respect to a reference frame (A-D); Figure S18: MD simulations of complexes IL10-ΔFN3.1: Ramachandran map for representative MD simulation frames (A,B); Figure S19: MD simulations of complexes IL6-ΔFN3: RMSD is used to measure average change in displacement of a selection of atoms for a particular frame with respect to a reference frame (A,B); Figure S20: No additivity of combinations of ΔFN3 proteins and TNF-α on IL-8 mRNA; Figure S21: Interaction of TNF-α with surfaces of ΔFN3.1 B. longum and ΔFN3.3 B. bifidum: contact amino acids and optimal binding positions; Figure S22: General algorithm for predicting tertiary structures; Table S1: Folding results: pLDDT, predicted Local Distance Difference Test; C-score, Confidence Score; GMQS is Global Model Quality Score; Table S2: Comparison of alignment score and RMSD of ∆FN3 structures obtained using different folding methodologies; Table S3: Docking of TNF-α to ΔFN3.1; Table S4: Docking of TNF-α to ΔFN3.3; Table S5: MD trajectories of TNF-α in complexes with ΔFN3; Table S6: Docking of interleukins to ΔFN3.1; Table S7: Docking of interleukins to ΔFN3.3; Table S8: MD trajectories of interleukins in complexes with ΔFN3. Table S9: Description of experimental groups. Untreated THP-1 cells were taken as 1; Table S10: Primers used in RT-PCR.
Author Contributions
Conceptualization, M.G.A., S.S.B. and V.N.D.; methodology, M.G.A.; S.S.B., D.A.M., A.A.S.; software, M.G.A., S.S.B; validation, M.G.A., S.S.B., A.R.Y., A.A.S., V.N.D.; formal analysis, M.G.A., A.R.Y., M.G.I., A.A.S.; investigation, M.G.A., D.A.M., A.A.N., D.A.R.; resources, S.S.B. and V.N.D.; writing—original draft preparation, M.G.A., N.I.A.; writing—review and editing, N.I.A., A.A.S. and V.N.D.; visualization, M.G.A., S.S.B. and N.I.A.; supervision, V.N.D.; project administration, V.N.D.; funding acquisition, V.N.D. All authors have read and agreed to the published version of the manuscript.
Funding
This work was carried out as part of the State Contract «Creation of biotechnological products for agriculture, food industry and medicine» No. 125050605758-0.
Institutional Review Board Statement
Not applicable.
Informed Consent Statement
Not applicable.
Data Availability Statement
The original contributions presented in this study are included in the article/supplementary material. Further inquiries can be directed to the corresponding authors.
Acknowledgments
The analysis of the interaction of ΔFN3 proteins with cytokines by the surface plasmon resonance method was performed at the Center for Collective Use "Structural and Functional Studies of Proteins and RNA" of the Protein Institute of the Russian Academy of Sciences (No. 3678921,
https://protres.ru/ckp-ib-ran). The authors express their gratitude to Venera Z. Nezametdinova for providing experimental materials and participating in the discussion of the results, and to Ekaterina S. Ivanova for assistance in experiments.
Conflicts of Interest
The authors declare no conflicts of interest.
Abbreviations
The following abbreviations are used in this manuscript:
| C-score |
Confidence Score |
| DARS |
Decoys As the Reference State |
| GMQS |
Global Model Quality Score |
| MD-simulations |
molecular dynamic simulations |
| pLDDT |
predicted Local Distance Difference Test |
References
- Sharma, A.; Sharma, G.; Im, S.H. Gut microbiota in regulatory T cell generation and function: mechanisms and health implications. Gut Microbes. 2025, 17. https://doi.org/10.1080/19490976.2025.2516702.
- Kumar, H.; Collado, M.C.; Wopereis, H.; Salminen, S.; Knol, J.; Roeselers, G. The Bifidogenic Effect Revisited-Ecology and Health Perspectives of Bifidobacterial Colonization in Early Life. Microorganisms 2020, 8, 1855. [CrossRef]
- Rabe, H.; Lundell, A.C.; Sjöberg, F.; Ljung, A.; Strömbeck, A.; Gio-Batta, M.; Maglio, C.; Nordström, I.; Andersson, K.; Nookaew, I.; et al. Neonatal gut colonization by Bifidobacterium is associated with higher childhood cytokine responses. Gut Microbes 2020, 12, 1-14. [CrossRef]
- Ennis, D.; Shmorak, S.; Jantscher-Krenn, E.; Yassour M. Longitudinal quantification of Bifidobacterium longum subsp. infantis reveals late colonization in the infant gut independent of maternal milk HMO composition. Nat. Commun. 2024, 15, 894. [CrossRef]
- Shang, J.; Wan, F.; Zhao, L.; Meng, X.; Li, B. Potential Immunomodulatory Activity of a Selected Strain Bifidobacterium bifidum H3-R2 as Evidenced in vitro and in Immunosuppressed Mice. Front. Microbiol. 2020, 11, 2089. [CrossRef]
- Vinkler, M.; Fiddaman, S.R.; Těšický, M.; O'Connor, E.A.; Savage, A.E.; Lenz, T.L.; Smith A.L.; Kaufman J.; Bolnick D.I.; Davies C.S. Understanding the evolution of immune genes in jawed vertebrates. J. Evol. Biol. 2023, 36, 847-873. [CrossRef]
- Alessandri, G.; van Sinderen, D.; Ventura M. The genus bifidobacterium: From genomics to functionality of an important component of the mammalian gut microbiota running title: Bifidobacterial adaptation to and interaction with the host. Comput. Struct. Biotechnol. J. 2021, 19, 1472–1487. [CrossRef]
- Liwen, Z.; Yu, W.; Liang, M.; Kaihong, X.; Baojin, C. A low abundance of Bifidobacterium but not Lactobacillius in the feces of Chinese children with wheezing diseases. Medicine (Baltimore) 2018, 97, e12745. [CrossRef]
- Choi, Y.J.; Shin, S.H.; Shin, H.S. Immunomodulatory Effects of Bifidobacterium spp. and Use of Bifidobacterium breve and Bifidobacterium longum on Acute Diarrhea in Children. J. Microbiol. Biotechnol. 2022, 9, 1186–1194. [CrossRef]
- Lim, H.J.; Shin, H.S. Antimicrobial and Immunomodulatory Effects of Bifidobacterium Strains: A Review. J. Microbiol. Biotechnol. 2020, 30, 1793–1800. [CrossRef]
- Nezametdinova, V.Z.; Mavletova, D.A.; Alekseeva, M.G.; Chekalina, M.S.; Zakharevich, N.V.; Danilenko, V.N. Species-specific serine-threonine protein kinase Pkb2 of Bifidobacterium longum subsp. longum: Genetic environment and substrate specificity. Anaerobe 2018, 51, 26-35. [CrossRef]
- Dyachkova, M.S.; Chekalin, E.V.; Danilenko, V.N. Positive Selection in Bifidobacterium Genes Drives Species-Specific Host-Bacteria Communication. Front. Microbiol. 2019, 10, 2374. [CrossRef]
- Nezametdinova, V.Z.; Zakharevich, N.V.; Alekseeva, M.G.; Averina, O.V.; Mavletova, D.A.; Danilenko, V.N. Identification and characterization of the serine/threonine protein kinases in Bifidobacterium. Arch. Microbiol. 2014, 196, 125-136. [CrossRef]
- Zakharevich, N.V.; Averina, O.V.; Klimina, K.M.; Kudryavtseva, A.V.; Kasianov, A.S.; Makeev V.J.; Danilenko V.N. Complete Genome Sequence of Bifidobacterium longum GT15: Identification and Characterization of Unique and Global Regulatory Genes. Microb. Ecol. 2015, 70, 819-834. [CrossRef]
- Nezametdinova, V.Z.; Yunes, R.A.; Dukhinova, M.S.; Alekseeva, M.G.; Danilenko, V.N. The Role of the PFNA Operon of Bifidobacteria in the Recognition of Host's Immune Signals: Prospects for the Use of the FN3 Protein in the Treatment of COVID-19. Int. J. Mol. Sci. 2021, 22, 9219. [CrossRef]
- Westermann, C.; Gleinser, M.; Corr, S.C.; Riedel, C.U. A Critical Evaluation of Bifidobacterial Adhesion to the Host Tissue. Front. Microbiol. 2016, 7, 1220. [CrossRef]
- Dyakov, I.N.; Mavletova, D.A.; Chernyshova, I.N.; Snegireva, N.A.; Gavrilova, M.V.; Bushkova, K.K.; Dyachkova, M.S.; Alekseeva, M.G.; Danilenko, V.N. FN3 protein fragment containing two type III fibronectin domains from B. longum GT15 binds to human tumor necrosis factor alpha in vitro. Anaerobe 2020, 65, 102247. [CrossRef]
- Henderson, B.; Nair, S.; Pallas, J.; Williams, M.A. Fibronectin: a multidomain host adhesin targeted by bacterial fibronectin-binding proteins. FEMS Microbiol. Rev. 2011 35, 147-200. [CrossRef]
- Speziale, P.; Arciola, C.R.; Pietrocola, G. Fibronectin and Its Role in Human Infective Diseases. Cells 2019, 8, 1516. [CrossRef]
- Malagrinò, F.; Pennacchietti, V.; Santorelli, D.; Pagano, L.; Nardella, C.; Diop, A.; Toto, A.; Gianni, S. On the Effects of Disordered Tails, Supertertiary Structure and Quinary Interactions on the Folding and Function of Protein Domains. Biomolecules 2022, 12, 209. [CrossRef]
- Valk, V.; van der Kaaij, R.M.; Dijkhuizen, L. The evolutionary origin and possible functional roles of FNIII domains in two Microbacterium aurum B8. A granular starch degrading enzymes, and in other carbohydrate acting enzymes. Amylase 2017, 1, 1-11. [CrossRef]
- Sun, H.; Guo, Z.; Hong, H.; Zhang, Z.; Zhang, Y.; Wang, Y.; Le, S.; Chen, H. Free Energy Landscape of Type III Fibronectin Domain with Identified Intermediate State and Hierarchical Symmetry. Phys. Rev. Lett. 2023, 131, 218402. [CrossRef]
- Koide, A.; Koide, S. Use of Phage Display and Other Molecular Display Methods for the Development of Monobodies. Cold Spring Harb. Protoc. 2024, 5, 107982. [CrossRef]
- Zhu, N.; Smallwood, P.M.; Rattner, A.; Chang, T.H.; Williams, J.; Wang, Y.; Nathans, J. Utility of protein-protein binding surfaces composed of anti-parallel alpha-helices and beta-sheets selected by phage display. J. Biol. Chem. 2024, 300, 107283. [CrossRef]
- Siupka, P.; Hamming, O.T.; Kang, L.; Gad, H.H.; Hartmann, R. A conserved sugar bridge connected to the WSXWS motif has an important role for transport of IL-21R to the plasma membrane. Genes Immun. 2015, 6, 405-413. [CrossRef]
- Singh, S.; Chaturvedi, N.; Rai, G. De novo modeling and structural characterization of IL9 IL9 receptor complex: a potential drug target for hematopoietic stem cell therapy. Network Modeling Analysis in Health Informatics and Bioinformatics 2020, 9, 29. [CrossRef]
- Singh, S.; Rai, G. Structural Insights into the IL12:IL12 Receptor Complex Assembly by Molecular Modeling, Docking, and Molecular Dynamics Simulation. Comb. Chem. High Throughput Screen. 2022, 25, 677-688. [CrossRef]
- Olsen, J.G.; Kragelund, B.B. Who climbs the tryptophan ladder? On the structure and function of the WSXWS motif in cytokine receptors and thrombospondin repeats. Cytokine Growth Factor Rev. 2014, 25, 337-41. [CrossRef]
- Szabó, R.; Láng, O.; Láng, J.; Illyés, E.; Kőhidai, L.; Hudecz, F. Effect of SXWS/WSXWS peptides on chemotaxis and adhesion of the macrophage-like cell line J774. J. Mol. Recognit. 2015, 28, 253-260. [CrossRef]
- Zakharevich, N.V.; Nezametdinova, V.Z.; Averina, O.V.; Chekalina, M.S.; Alekseeva, M.G.; Danilenko, V.N. Complete Genome Sequence of Bifidobacterium angulatum GT102: Potential Genes and Systems of Communication with Host. Russian Journal of Genetics. 2019, 55, 847-864. [CrossRef]
- Alekseeva, M.G.; Dyakov, I.N.; Bushkova, K.K.; Mavletova, D.A.; Yunes, R.A.; Chernyshova, I.N.; Masalitin, I.A.; Koshenko, T.A.; Nezametdinova, V.Z.; Danilenko, V.N. Study of the binding of ΔFN3.1 fragments of the Bifidobacterium longum GT15 with TNFα and prevalence of domain-containing proteins in groups of bacteria of the human gut microbiota. Microbiome Res. Rep. 2023, 2, 10. [CrossRef]
- Veselovsky, V.A.; Dyachkova, M.S.; Menyaylo, E.A.; Polyaeva, P.S.; Olekhnovich, E.I.; Shitikov, E.A.; Bespiatykh, D.A.; Semashko, T.A.; Kasianov, A.S.; Ilina, E.N.; Danilenko, V.N. et al. Gene Networks Underlying the Resistance of Bifidobacterium longum to Inflammatory Factors. Front. Immunol. 2020, 11, 595877. [CrossRef]
- Jumper, J.; Evans, R.; Pritzel, A.; Green, T.; Figurnov, M.; Ronneberger, O.;, Tunyasuvunakool, K.; Bates, R.; Žídek, A.; Potapenko, A. et al. Highly accurate protein structure prediction with AlphaFold. Nature 2021, 596, 583-589. [CrossRef]
- Baek, M.; DiMaio, F.; Anishchenko, I.; Dauparas, J.; Ovchinnikov, S.; Lee, G.R.; Wang, J.; Cong, Q.; Kinch, L.N.; Schaeffer R.D. et al. Accurate prediction of protein structures and interactions using a 3-track neural network. Science 2021, 373, 871–876. [CrossRef]
- Zheng, W.; Zhang, C.; Li, Y.; Pearce, R.; Bell, E.W.; Zhang, Y. Folding non-homologous proteins by coupling deep-learning contact maps with I-TASSER assembly simulations. Cell Rep. Methods. 2021, 1, 100014. [CrossRef]
- Zhang, C.; Freddolino, L.; Zhang, Y. COFACTOR: improved protein function prediction by combining structure, sequence and protein–protein interaction information. Nucleic Acids Res. 2017, 45, 291–299. [CrossRef]
- Yang, J.; Zhang, Y. I-TASSER server: new development for protein structure and function predictions. Nucleic Acids Res. 2015, 43, 174–181. [CrossRef]
- McGuffin, L.J.; Edmunds, N.S.; Genc, A.G.; Alharbi, S.M.A.; Salehe, B.R.; Adiyaman, R. Prediction of protein structures, functions and interactions using the IntFOLD7, MultiFOLD and ModFOLDdock servers. Nucleic Acids Res. 2023, 51, 274–280. [CrossRef]
- Mustaev, E.; Khamitov, E.M. Predicting the PARP1 Tertiary Structure by Molecular Modeling Methods. Journal of Structural Chemistry, 2025, 66, 898-910. [CrossRef]
- Berman, H.M.; Westbrook, J.; Feng,; Gilliland, G.; Bhat, T.N.; Weissig, H.; Shindyalov, I.N.; Bourne P.E. The Protein Data Bank. Nucleic Acids Res. 2000, 28, 235-242. [CrossRef]
- Liang, S.; Dai, J.; Hou, S.; Su, L.; Zhang, D.; Guo, H.; Hu, S.; Wang, H.; Rao, Z.; Guo Y.; et al. Structural Basis for Treating Tumor Necrosis Factor α (TNFα)-associated Diseases with the Therapeutic Antibody Infliximab. J. Biol. Chem. 2013, 288, 13799-13807. [CrossRef]
- Carrington, B.; Myers, W.K.; Horanyi, P.; Calmianol, M.; Lawson, A.D.G. Natural Conformational Sampling of Human TNFα Visualized by Double Electron-Electron Resonance. Biophysical Journal 2017, 113, 371-380. [CrossRef]
- Somers, W.; Stahl, M.; Seehra J.S. Å crystal structure of interleukin 6: implications for a novel mode of receptor dimerization and signaling. The EMBO Journal 1997, 16, 989 – 997. [CrossRef]
- Yoon, S.I.; Logsdon, N.J.; Sheikh F.; Donnelly R.P.; Walter M.R. Conformational Changes Mediate Interleukin-10 Receptor 2 (IL-10R2) Binding to IL-10 and Assembly of the Signaling Complex. Protein Structure and Folding 2006, 281, 35088-35096. [CrossRef]
- Gao, B.; Gupta, R.S. Phylogenetic Framework and Molecular Signatures for the Main Clades of the Phylum Actinobacteria. Microbiol. Mol. Biol. Rev. 2012, 76, 66–112. [CrossRef]
- Barka, E.A.; Vatsa, P.; Sanchez, L.; Gaveau-Vaillant, N.; Jacquard, C. Meier-Kolthoff, J.P.; Klenk, H.P.; Clément, C.; Ouhdouch, Y.; van Wezel, G.P. Taxonomy, physiology, and natural products of Actinobacteria. Microbiol. Mol. Biol. Rev. 2015, 80, (1):1–43. [CrossRef]
- Duranti, S.; Longhi, G.; Ventura, M.; van Sinderen, D.; Turroni, F. Exploring the ecology of Bifidobacteria and their genetic adaptation to the mammalian gut. Microorganisms 2020, 9, 8. [CrossRef]
- Olajide, T.S.; Ijomone, O.M. Targeting gut microbiota as a therapeutic approach for neurodegenerative diseases. Neuroprotection 2025, 3, 120-130. [CrossRef]
- Mopuru, R.; Chaturvedi, S.; Burkholder, B.M. Relapsing Thrombotic Thrombocytopenic Purpura (TTP) in a Patient Treated with Infliximab for Chronic Uveitis. Ocul. Immunol. Inflamm. 2022, 30, 241-243. [CrossRef]
- El-Tahan, R.R.; Ghoneim, A.M.; El-Mashad, N. TNF-α gene polymorphisms and expression. Springerplus 2016, 5, 1508. [CrossRef]
- Inoue, H.; Nojima, H.; Okayama, H. High efficiency transformation of Escherichia coli with plasmids. Gene 1990, 96, 23-28. [CrossRef]
- Mierendorf, R.; Yeager, K.; Novy, R. Innovations. Newsletter of Novagen, Inc. 1994, 1, 1–3.
- Maniatis, T.; Fritsch, E.F.; Sambrook, J. Molecular Cloning: A Laboratory Manual. Cold Spring Harbor: New York, USA, 1984.
- Mariani, V.; Biasini, M.; Barbato, A.; Schwede, T. lDDT: a local superposition-free score for comparing protein structures and models using distance difference tests. Bioinformatics 2013, 29, 2722–2728. [CrossRef]
- Zheng, W.; Wuyun, Q.; Li, Y.; Liu, Q.; Zhou, X.; Peng, C.; Zhu, Y.; Freddolino, L.; Zhang, Y. Deep-learning-based single-domain and multidomain protein structure prediction with D-I-TASSER. Nat. Biotechnol. 2025. [CrossRef]
- Zhou, X.; Zheng, W.; Li, Y.; Pearce, R.; Zhang, C.; Bell, E.W.; Zhang, G.; Zhang, Y. I-TASSER-MTD: a deep-learning-based platform for multi-domain protein structure and function prediction. Nat. Protoc. 2022, 17, 2326-2353. [CrossRef]
- McGuffin, L.J.; Shuid, A.N.; Kempster, R.; Maghrabi, A.H.A.; Nealon, J.O.; Salehe, B.R.; Atkins, J.D.; Roche, D.B. Accurate template-based modeling in CASP12 using the IntFOLD4-TS, ModFOLD6, and ReFOLD methods. Proteins 2018, 86, 335-344. [CrossRef]
- Kozakov, D.; Brenke, R.; Comeau, S.R.; Vajda S. PIPER: An FFT-Based Protein Docking Program with Pairwise Potentials. PROTEINS: Structure, Function, and Bioinformatics 2006, 65, 392–406. [CrossRef]
- Kozakov, D.; Hall, D.R.; Xia, B.; Porter, K.A.; Padhorny, D.; Yueh, C.; Beglov, D.; Vajda, S. The ClusPro web server for protein-protein docking. Nat Protoc. 2017, 12, 255–278. [CrossRef]
- Lu, C.; Wu, C.; Ghoreishi, D.; Chen, W.; Wang, L.; Damm, W.; Ross, G.A.; Dahlgren, M.K.; Russell, E.; Von Bargen, C.D.; et al. OPLS4: Improving Force Field Accuracy on Challenging Regimes of Chemical Space. J. Chem. Theory Comput. 2021, 17, 4291-4300. [CrossRef]
- Bowers, K.J.; Chow, E.; Xu, H.; Dror, R.O.; Eastwood, M.P.; Gregersen, B.A.; Klepeis, J.L.; Kolossvary, I.; Moraes, M.A.; Sacerdoti, F.D.; et al. Scalable Algorithms for Molecular Dynamics Simulations on Commodity Clusters. In Proceedings of the ACM/IEEE SC2006 Conference on High Performance Networking and Computing, Tampa, FL, USA, 11-17 November 2006.
- Frey, B.J.; Dueck, D. Clustering by Passing Messages Between Data Points. Science 2007, 315, 972-976. [CrossRef]
- Genheden, S.; Ryde, U. The MM/PBSA and MM/GBSA methods to estimate ligand-binding affinities. Expert Opin. Drug Discov. 2015, 10, 449-461. [CrossRef]
- Haimes, J.; Kelley, M. Demonstration of a ΔΔCq calculation method to compute relative gene expression from qPCR data. A Horizon Discovery Group Company, USA, 2015. – Pp. 1-4.
- Ye, J.; Coulouris, G.; Zaretskaya, I.; Cutcutache, I.; Rozen S.; Madden T.L. Primer-BLAST: A tool to design target-specific primers for polymerase chain reaction. BMC Bioinformatics 2012, 13, 134. https://www.biomedcentral.com/1471-2105/13/134.
|
Disclaimer/Publisher’s Note: The statements, opinions and data contained in all publications are solely those of the individual author(s) and contributor(s) and not of MDPI and/or the editor(s). MDPI and/or the editor(s) disclaim responsibility for any injury to people or property resulting from any ideas, methods, instructions or products referred to in the content. |
© 2025 by the authors. Licensee MDPI, Basel, Switzerland. This article is an open access article distributed under the terms and conditions of the Creative Commons Attribution (CC BY) license (http://creativecommons.org/licenses/by/4.0/).