
Submitted:
03 September 2025
Posted:
04 September 2025
You are already at the latest version
Abstract
Severe acute malnutrition is associated with enteropathy manifested as disruption of epithelial tight junctions and increased gut permeability, associated with intestinal and systemic inflammation. Bifidobacterium longum subsp. infantis (B. infantis) and Lacticaseibacillus rhamnosus GG (LGG ®, Chr. Hansen A/S) have been shown to strengthen the gut epithelial barrier and to reduce inflammation in preclinical studies. The aim of this study was to compare the ability of four commercial strains of B. infantis, LGG and their combination to mitigate inflammation-mediated epithelial damage using an in-vitro immunocompetent model of the intestine. A microfluidic mid-throughput device OrganoPlate® (Mimetas B.V.) was employed to enable the co-culturing of intestinal epithelial cells (Caco-2) with peripheral blood mononuclear cells. Epithelial damage was induced by stimulating PBMCs with lipopolysaccharide and probiotic conditioned media were added to the apical side of the Caco-2 to test the effects on barrier integrity, cytokine secretion, and gene transcription. All tested probiotics demonstrated significant protection of the epithelium via modulation of tight-junction proteins and homeostatic cytokines gene transcription promoting a “leak-tight” phenotype. These findings demonstrate that B. infantis and/or LGG may have the potential to protect the intestinal epithelium and thus could contribute to alleviating intestinal enteropathy in malnourished children.
Keywords:
malnutrition
; inflammation
; gut-on-a-chip
; probiotics
; Bifidobacterium infantis
; LGG
; Lacticaseibacillus rhamnosus
; immunomodulation
; intestinal barrier
1. Introduction
A healthy infant gut microbiome, dominated by Bifidobacterium, may contribute to metabolic functions that are essential to infant growth and development, such as development of the immune system, host metabolism and colonization resistance to enteric pathogens [1,2,3,4,5]. Gut dysbiosis, an imbalance in microbial composition characterized by the overrepresentation of potentially pathogenic taxa, mediates persistent pathophysiological and immune abnormalities and is thought to play a role in nutrient malabsorption leading to underweight infants and failure to thrive [6,7]. Mechanistically, severe acute malnutrition is associated with enteropathy manifested as disruption of epithelial tight junctions and increased gut permeability, leading to intestinal and systemic inflammation [8]. Recently, Bifidobacterium longum subsp. infantis (B. infantis) oral supplementation was shown to improve weight gain of Bangladesh malnourished infants [9]. Lacticaseibacillus (lactobacillus) rhamnosus GG (LGG) in combination with Bifidobacterium animalis was previously shown to reduce the incidence [10] and duration of diarrhea [11,12]. The beneficial effect of B. infantis and LGG was linked to their immunomodulatory and homeostatic potential based on in vitro [13,14,15,16,17,18] and in vivo [19,20,21] studies. Specifically for Bifidobacteria, their contribution to infant health relies on the ability to metabolize human milk saccharides (HMO) [22,23,24]. Interestingly, even within the B. infantis species, which is equipped with the most complex toolbox for HMO utilization, different strains have preferences towards specific HMO type [25,26,27].
We aimed to compare the functionality of several commercial strains of B. infantis as well as potential efficacy superiority in combination with LGG (Table S1) grown in a medium supplemented with 2 abundant in human breastmilk HMO types: 2′-Fucosyllactose (2’-FL) and Lacto-N-tetraose (LNT) [28]. When selecting strains and their combinations for clinical use, standard in vitro models—typically based on a single cell type—lack the complexity of the physiological environment. Meanwhile, in vivo models, primarily using rodents, are costly, require ethical approval, and often fail to accurately reflect human responses (reviewed in [29]). On the other hand, “intestine-on-a-chip” technology allows combining both cell types playing key roles in intestinal inflammation, i.e. epithelial and immune cells, and uses media flow, which more closely mimic the physiological conditions in the intestine and exerts shear stress on epithelial cells promoting their differentiation [30,31]. We have established an immunocompetent model of intestinal epithelial inflammation using a previously described mid-throughput microfluidic device OrganoPlate [32]. This device enables rapid maturation of a leak-tight layer of intestinal epithelial cells (Caco-2) in one channel, while the opposite channel, separated from the other by extracellular matrix [33,34], was populated with human peripheral blood mononuclear cells (PBMC). Subsequently, PBMC were stimulated with E. coli lipopolysaccharide (LPS) provoking pro-inflammatory cytokine secretion and compromising the epithelial barrier function of Caco-2. We then demonstrate that the supernatants of the tested probiotic strains were able to mitigate inflammation-mediated epithelial barrier damage via modulation of Caco-2 gene transcription related to tight-junction complex formation and homeostatic cytokines expression.
2. Materials and Methods
PBMC Sourcing
Human peripheral blood samples were collected from healthy volunteers at the Clinical Investigation Center INVOLvE (Investigation and volunteers for human health) of the Institute Pasteur. The participants received an oral and written information about the research and gave written informed consent in the frame of the healthy volunteers COSIPOP cohort after approval of the Est II Ethics Committee (2023, February 20th).
Mammalian Cells
Human colon adenocarcinoma cell line Caco-2/TC-7 (Caco2) (Sigma-Aldrich) at passages between 2 and 12, were cultured in complete MEM medium: MEM (Gibco™, Thermo Fisher Scientific, Inc.) supplemented with 10% FBS (Gibco), 1% Sodium Pyruvate (Gibco), 1% Non-essential Amino Acids (NEAA, Gibco) and 1% penicillin/streptomycin (Sigma-Aldrich). Cells were cultured at 37 °C in a humidified atmosphere with 5% CO2. PBMC from human blood were isolated using Ficoll-Paque™ PLUS (Cytiva) according to the manufacturer’s protocol. Briefly, the whole blood was diluted 1:1 with PBS and centrifugation at room temperature (RT) for 30 min at 400 g without a break on top of the Ficoll layer. The interphase containing PBMC was then recovered, and the cells were washed in PBS by centrifugation at 600 g and then again at 450 g, 10 minutes each time. PBMC were set to 106 cells/mL in RPMI medium (Sigma-Aldrich) and supplemented with 10% FBS (Gibco) and 1% penicillin/streptomycin (Sigma-Aldrich).
OrganoPlate Seeding
Epithelial tubule formation by Caco-2 cells in three-lane OrganoPlate was performed as previously reported [33]. In short, 2*104 Caco-2 cells were seeded against a pH-buffered 4 mg/mL Collagen I gel (Collagen-I rat tail, R&D systems) in a 3-lane 400 μm OrganoPlate and allowed to attach against the gel for 4 h (37 °C, 5% CO2). Complete MEM medium was then added to the inlets and outlets and the plate on an interval rocker (Perfusion Rocker, Mimetas) switching between a +7° and −7° inclination every 8 min (37 °C, 5% CO2) to create bi-directional flow. Medium was changed 4 days after the seeding. When indicated, 5 days after Caco-2 seeding the medium in the opposite channel was exchanged with 105 PBMC in supplemented RPMI, with (or without) LPS mix of three strains of E. coli (Sigma-Aldrich, L2637, 3012 and 3137) [35] at 100 ng/mL each.
Immunofluorescent Microscopy Imaging
At the end point of experiments, all cells cultures were fixed in 4% paraformaldehyde (VWR 100504-858) in DPBS (+Ca/+Mg, Gibco 14040-083) for 30 min. Cell membranes were permeabilized with a 0.1% Triton X-100 solution in DPBS for 20 min and blocked with a 2% BSA solution in DPBS (Sigma A2153) for over 1h. Primary antibodies against ZO-1 (Invitrogen 61-7300, AB_138452) and Villin (BD Biosciences 610358 AB_397748) were then diluted in a 2% BSA solution in DPBS and incubated overnight at 4°C. Secondary antibodies (Invitrogen A-21429, AB_2535850; Jackson 315-606-046, AB_2340251), DAPI (Invitrogen, D1306), and Phalloidin (Sigma, P5282) were then also diluted in 2% BSA and incubated for 2h. Cell cultures were rinsed with DPBS prior to imaging. All steps, except when specified otherwise, were performed on chip and at room temperature. Confocal immunostaining images were acquired using a spinning disk microscope (Andor BC34 CF) using a 20X magnification air objective (NA 0.8). Z stacks were acquired over a range of 200µm with a Z resolution of 0.3µm. 3D reconstructions were performed in ImarisTM (Bitplane AG) scientific software.
Bacteria Culture
Bacteria strains (Table S1) were first grown overnight on De Man–Rogosa–Sharpe (MRS) agar plates (BD), then a single colony was inoculated in 5mL of MRS (CondaLab) and grown at 37°C in the BactronTM anaerobic chamber (Sheldon Manufacturing, Inc.). After 24h growth, 40 mL cultures were diluted 1:100 in MRS without dextrose, supplemented with 2’-FL and LNT, kindly donated by DSM-Firmenich, at final concentration of 0,5% each, still in anaerobic conditions. For the combination, Bifin02™ (Chr. Hansen A/S) and LGG pre-cultures were mixed in the same tube at a 1:1 ratio. After overnight incubation, aliquots were taken for cytometry analysis and OD measurement, while CFU determination was achieved by plating on MRS agar plates. Aliquots of the sterile media are used for blank and negative control. The rest of the bacteria cultures were centrifuged at 10,000 g for 10 minutes, the pH of the cleared supernatant was determined using a FiveEasy Mettler Toledo® pH-meter (Mettler-Toledo Gmbh) and then adjusted to pH 7 using NaOH solution. The supernatants were then filtered via 0.22µm filter (MCE, Millipore-Merck) and stored at -80 °C. Bacterial pellets of Bifini02, LGG and combination of both were centrifuged 10 minutes at 10,000 g, washed in sterile PBS and frozen at -80°C for qPCR analysis.
Lectin-Based Discrimination of Bacteria Strain in Mixture
Bacteria culture samples (LGG, Bifin02, and Combo) were first quantified by flow cytometry using calibrated microsphere standard LIVE/DEAD™ BacLight™ Bacterial Viability and Counting Kit (Thermo Fisher Scientific) to estimate absolute bacterial concentrations according to the manufacturer protocol. Then the solution of RCA lectin (Ricinus communis agglutinin I) was added to 3 x10⁷ cell/mL of each bacterial suspension at a final concentration of 15 µg/mL. Samples were incubated at room temperature for 20 minutes protected from light and then centrifuged at 10,000 g for 10 minutes at room temperature to pellet the bacteria. The supernatants were carefully discarded, and the bacterial pellet was gently resuspended in 1 x phosphate-buffered saline (PBS) to remove any unbound lectin. The BD Influx™ (BD Biosciences) cell sorter was used to measure the fluorescence of bacterial cells according to the channel corresponding to the RCA staining and size parameter (Blue540_30/FSC). Twenty thousand events were acquired for each sample at an analysis rate of 1 000 events per second, and the data analysis was conducted using the FlowJo™ v10.5+ software (FLOWJO, LLC).
Cytokine Secretion
Media were collected separately from Lumen and Basal” channels) inlets and outlets and stored at −20 °C until further assessment by Luminex methods. The concentrations of CCL2, CCL20, CCL28, IFNγ, IL2, IL8, TNFα, CCL3, CCL25, CXCL10, IL1β, IL6 and IL10 were quantified using a human multiplex assay (R&D systems) according to manufacturer protocol running on BIOPLEX 200 reader (BIORAD). Results of only quantitatively detected cytokines are presented. IL-8 concentration was assessed using ELISA method according to the manufacturer protocol (R&D systems).
TEER Measurements
Transepithelial electrical resistance (TEER) was measured at different time points using an automated multichannel impedance spectrometer designed for use with the OrganoPlate (OrganoTEER, Mimetas) as described by Beaurivage et al. [33] except that the OrganoPlates were equilibrated at room temperature for 30 minutes before the measurement. Data was analyzed using OrganoTEER software, which automatically extracts the TEER contribution and normalizes it to Ohm*cm2.
Metabolomic Analysis
The supernatants were extracted in water using a constant ratio of sample mass to extraction volume. Each sample was weighed, and ultrapure water with stable isotope-labeled internal standards was added at a ratio of 1:4 (wt/wt) sample to solvent. Extracts were homogenized by bead beating with ceramic beads (4 x 30 sec at 30 Hz). Non-soluble material was pelleted by centrifugation at 16,000 g for 5 minutes at 4°C. The supernatant was transferred to a Spin-X® centrifuge 22 μm tube filter Corning® Costar® (Corning, Inc.) and extracts passed through (15 000 g/ 4°C/ 5 min) ready for analysis.
Metabolite analysis was carried out by MS-Omics (Vedbæk, Denmark) using gas chromatography - mass spectrometry.
SCFA
Samples were acidified using hydrochloric acid, and deuterium-labeled internal standards were added. Analysis was performed in randomized order using a high-polarity Zebron™ ZB-FFAP column (Phenomenex, Inc., GC Cap. Column 30 m x 0.25 mm x 0.25 µm) installed in a GC (7890B, Agilent) coupled with a quadrupole MS detector (5977B, Agilent). The system was controlled by ChemStation™ (Agilent Technologies, Inc.). Peak areas were integrated using Skyline (24.1, MacCoss Lab Software), before quantification and curation using an in-house pipeline written in MATLAB (2022b, MathWorks). Matrix effects, carryover, noise levels, and precision were evaluated using corresponding quality control samples.
Tryptophan
Samples were fortified with stable isotope labelled internal standards and derivatized with methyl chloroformate using an adapted version of the protocol described by Smart et al. [36]. Analysis was performed in randomized order using a high polarity Zebron ZB-50 column GC (Cap. column 30 m x 0.25 mm x 0.25 µm) installed in a GC coupled with a quadrupole detector. The system was controlled by ChemStation. Peak areas were integrated using Skyline (24.1, MacCoss Lab Software), before curation and quantification against a ten-point external calibration curve, using an in-house pipeline written in MatLab (2022b, MathWorks). Matrix effects, carry-over, noise levels and precision were evaluated using corresponding quality control samples.
Data Processing and Statistical Analysis
Peak areas are extracted using Skyline 24.1 (MacCoss Lab Software).
Univariate statistics (provided as t-tests and relative intensity fold changes) show if any single variable is significantly different between two specified treatment groups. For statistical tests, data was transformed with power transformation (Box-Cox). As this allows assuming normality of the data, T-tests were performed. The obtained p-values were corrected by Benjamini-Hochberg correction with a false positive rate of 0.05.
Gene Transcription Analysis
Caco-2 cells were pelleted, and supernatant was removed. RNA was then extracted using the NucleoSpin® RNA XS kit (Macherey, Nagel GmbH) according to the manufacturer’s instructions. Extraction was followed by a purification step using the RNA Clean & Concentrator kit (Zymo Research). RNA samples were eluted in 15 μL and total RNA was analyzed using the DNF-471 RNA (15nt) Fragment Analyzer kit (Agilent).
Gene transcription analysis was performed on the Biomark System (Standard Biotools) using TaqMan® (Roche Molecular Systems, Inc) chemistry. RNA samples were normalized at 1 ng/µl, reverse transcribed and pre-amplified with 18 cycles using the Preamp and Reverse Transcription kit (Standard Biotools) following the manufacturer’s instructions. Pre-amplification was performed to ensure that there are sufficient target gene copies in each sample for equivalent distribution in all microwell of the Biomark chip. Pre-amplified samples and assays were prepared and loaded on a Biomark Integrated Fluidic Circuit (IFC) 192.24 (Standard Biotools) using the 192.24 GE Dynamic Array Reagent Kit and the TaqMan Fast Advanced Master Mix (Applied Biosystems) according to the manufacturer’s instructions. TaqMan assays were obtained from the Thermo Fisher catalog. Assay IDs are listed in Table S2.
For standard curve analysis and calculation of assay efficiencies a pool of seven samples representing all sample groups of the experiment was prepared and processed in parallel to the samples. After pre-amplification, the pool sample was diluted over 16 serial dilutions at 1/10th and added to the Biomark chip.
Standard Curves Analysis
Standard curves were used to evaluate the efficiency of each primer couple based on modeling Ct values against the 10-log concentrations of standard dilutions (using sixteen 10-fold dilution points), via weighted linear regression [37]. In principle, for each primer of interest, the relationship between Cts and 10-log concentration is expected to be linear, the slope of the standard curve giving the efficiency of the tested primer. The linearity of the PCR was evaluated by the coefficient of determination R2, the linearity of the reactions being validated with R2 ≥ 0.9. Then, the amplification efficiency for each primer was calculated as Eprimer = 10(–1/slope), whereas the efficiency in percentages was calculated as Eprimer, % = (10(–1/slope) - 1)*100 [38].
Primers with Eprimer, % between 90% and 110% were validated. Primers with efficiency between 80% and 90% were analyzed but the lower efficiency was considered in the result interpretation. An efficiency lower than 80% usually indicates low abundance or even absence of the target gene in the pool. An efficiency higher than 110% is usually an indicator of the presence of inhibitors in the samples.
Reference Genes Selection and Normalization
Since primers’ efficiencies were not all equal to 100%, we used the Pfaffl normalization method for RT-qPCR data [39]. That relative quantification method is based on the calculation of the ratio between the expression of target genes and the expression of reference gene(s) present in all samples of interest. The reference gene(s) have to be chosen among candidate house-keeping genes, selecting those that are the most stably expressed among all samples.
To identify the most stable house-keeping genes, we used the function selectHKs of the freely available R/Bioconductor package NormqPCR, applying the geNorm method, using a cut-off value of 0.15 for the pairwise variation Vn/Vn+1, and the minimum number of reference genes to be used for normalization was set to 2 [40].
In our case, three housekeeping genes were tested (RPLP0, B2M, GAPDH), and the reference genes selection procedure evidenced that RPLP0 and GAPDH were the most stable and relevant for normalization.
The ratio for relative expression with the Pfaffl normalization is defined as:
with
R = Etarget(Ctcalib target – Ctsamples target) / Eref(Ctcalib ref – Ctsamples ref)
Etarget: Target primer amplification efficiency
Eref: Reference gene amplification efficiency
Ctsamples target: Ct of the target genes in samples
Ctsamples ref: Ct of the reference genes in samples
Ctcalib target: Ct of the target genes in calibrator samples
Ctcalib ref: Ct of the reference genes in calibrator samples
The calibrator is usually a set of one or more samples used as reference. In our case, the Ctcalib was computed as the geometric mean of the Cts of all samples from the “MRS, No LPS” group.
Note that, in the case when more than one reference gene is selected, the equation denominator is considered as the geometric mean of Eref(Ctcalib ref – Ctsamples ref) among all reference genes.
Variance Partitioning and Confounding Effect Correction
Variance partitioning was used in this study to estimate the effect of each clinical and technical variable on normalized expression data, to identify confounding effect variables [41]. Based on that analysis, the extraction batch and PBMC donor effects were corrected using the removeBatchEffect function of the R/Bioconductor limma package [42].
Statistical Analysis
For each comparison considered in each dataset of interest, each assay was analyzed individually, comparing its expression in one condition compared to another using non-parametric Wilcoxon test (the null hypothesis being that the mean expression of the considered assay is not significantly different between the two investigated conditions). To correct for the multiple testing effect, p-values were adjusted using the Benjamini-Hochberg approach [43]. The log2-fold-change (hereafter LFC) associated to the comparison was calculated as the log2 ratio of mean expression levels between the two conditions. We considered that the expression of an assay was significantly different in the two investigated conditions when the adjusted p-value was lower than 0.05.
3. Results
To better mimic the physiological disruption of epithelial barrier due to continuing inflammatory process, both epithelial and immune cells should be present in the experimental system. Therefore, we used a microfluidic device OrganoPlate consisting of 40 chips with 3 lanes each. The middle lane is filled with extracellular matrix (Collagen I) creating a separation between the two other channels, thus enabling co-culture of two different cell types while still allowing molecules to diffuse [33]. Caco-2 intestinal epithelial cells are seeded in one of the channels (“Lumen” channel) and allowed to proliferate until they fill the entire channel forming a tubule-shaped monolayer (Figure 1A,B). Each channel is connected to a small reservoir with medium and a gravity-driven flow is generated by the rocking movement of the plate that forces the medium through the channel. The shear stress created by the flow promotes rapid maturation of the epithelial monolayer [31] which is demonstrated by elevated Trans-epithelial electrical resistance (TEER) that remains stable starting from the fourth day in culture (Figure 1C). To verify the polarization and differentiation of Caco-2 cells we investigated the localization of Zonula Occludens-1 (ZO-1) and the Villin proteins in the epithelial monolayer using immunofluorescence. After 5 days of growth under shear stress conditions we observed ZO-1 staining along the contact lines between the cells while Villin is primarily located on the apical side (facing the center of the channel) of Caco-2 cells (Figure 1D).
Once the mature Caco-2 monolayer was formed after 5 days in culture (Figure 1C) we added human PBMC in the opposite (Basal) channel. To induce inflammation and provoke epithelial barrier damage, we stimulated the PBMC with E. coli LPS – mimicking severe dysbiosis manifested by overgrowth of Gram-negative bacteria [44,45] and their translocation into the Basal circulation [46]. We then measured the concentration of a panel of cytokines and chemokines in both channels after 3 days. Upon addition of non-stimulated PBMC in our model we detected accumulation of IL-8, IP-10 and TNFα in the Basal channel and a slight increase of IL-8 in the Lumen channel (Figure 2A). Direct stimulation of PBMC by LPS provoked a sharp increase in the concentration of all assessed cytokines in the Basal channel, as expected. The only exception was the CXCL10 (IP-10) chemokine whose concentration was strongly reduced in the Basal channel upon LPS stimulation. In the Lumen channel only 3 cytokines were quantitatively detected including CCL2, IL-6 and IL-8. Among these, the concentration of IL-8 only slightly increased in the presence of non-stimulated PBMC and additional sharp increase of this cytokine, as well as of IL-6, was detected upon LPS stimulation. In accordance with pro-inflammatory cytokine upregulation, the epithelial barrier integrity assessed by TEER decreased in the presence of PBMC achieving statistical significance on day 2 only but further dropped to reach 50 – 60% compared to day 0 upon LPS stimulation (Figure 2B). The observed TEER difference between the treatments was sustained during the 3 days of observation.
In addition, we assessed the transcription of genes encoding cytokines and chemokines involved in homeostasis and inflammation of the epithelium as well as of genes encoding proteins involved in epithelial barrier integrity maintenance including adhesion in Caco-2 cells. We found that the addition of PBMC significantly increased transcription of several cytokines both of pro-inflammatory (CCL2, IL-23A) and homeostatic (IL-18, TSLP) nature (Figure 2C). PBMC presence in the Basal channel reduced the transcription of the major pro-inflammatory cytokine IL-8 and upregulated the transcription of most tested genes encoding proteins participating in epithelial barrier integrity including E-Cadherin (CDH1), Tight-Junction Protein 1 (TJP1 or ZO-1) and Claudin family proteins (CLDN-1, -2, -3, -4). LPS stimulation of PBMC provoked upregulation only of pro-inflammatory cytokines CCL2, IL-6 and IL-8 as well of matrix metalloproteinase 7 (MMP7) known to cleave E-Cadherin [47] and degrade extracellular matrix [48] thus promoting an increase in intestinal permeability.
In summary, LPS stimulation of PBMC led to significant up-regulation of cytokines and TEER decrease, indicating loss in barrier integrity thus resembling a disrupted intestinal barrier exposed to a high pro-inflammatory milieu as observed in severe cases of malnutrition [8].
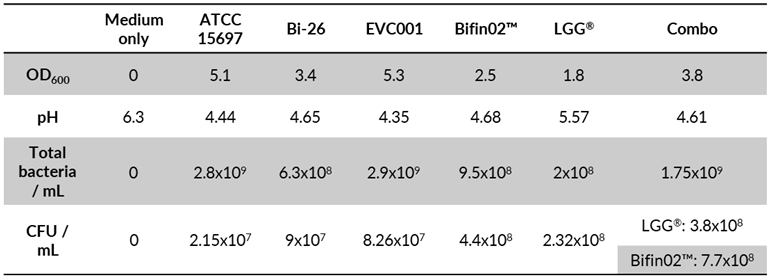
First, we investigated the impact of supernatant of ATCC 15697 reference strain on epithelial barrier integrity using the LPS-stimulated PBMC inflammatory model. Bacteria were growth medium was supplemented with 2’-FL – the most abundant HMO in “secretor” mothers who represent the majority (~80%) of human population, and LNT, which is among the most abundant HMO of “non-secretor” mothers [49,50]. After 24 hours of incubation under anaerobic conditions, the growth of bacteria was assessed by OD measurements, agar plating for subsequent CFU quantification as well as by flow cytometry analysis (Table. 1). Consistent with production of organic acids (including Lactate and short chain fatty acids – SCFA) [26,51] the pH of the culture medium after 24 hours of growth was reduced from its original value of 6.3 to 4.4. The filtered and pH-neutralized supernatant was then added in Caco-2 culture medium to the Lumen channel at final proportion ranging from 10 to 30% (vol/vol) simultaneously with the addition of LPS-stimulated (or non-stimulated) PBMC to the Basal channel. We observed that the supernatant of the B. infantis ATCC 15697 strain was able to mitigate the detrimental impact of LPS-stimulated PBMC on TEER values in a dose-dependent manner, reaching the complete protection of intestinal barrier integrity at 30% and being stable for three days (Figure 3).
Next, we proceeded to compare the capacity of several probiotic B. infantis strains including Bi-26™ (Chr. Hansen A/S), EVC001, Bifin02, one strain of L. rhamnosus GG (LGG) and the combination of Bifin02 and LGG (“Combo”) (Table 1) to mitigate inflammation-mediated epithelial damage and to investigate the effect of LGG supplementation. To distinguish between the two strains in the “Combo” immediately at the end of the growth, we stained a culture sample with fluorescently labelled Ricinus Communis Agglutinin I (RCA I) lectin that very efficiently (99%) stained the Bifin02 but rarely (7.5%) the LGG strain (Figure S1). As 74% of the bacteria in the Combo were stained with RCA, we estimated the proportion of the two strains to be around 3:1 in favor of Bifin02. To confirm the viability (and cultivability) of the bacteria we also plated diluted cultures on MRS agar. All the tested single strains reached high CFU ranging between 2.15x10⁷ and 4.4x10⁸ CFU /ml while the Combo reached 1.15x10⁹ CFU /ml at 2:1 ratio for Bifin02 and LGG strains respectively. The slight difference in the strain proportion using the two methods probably lies in the fact that the plating method measures viable and cultivable bacteria while all intact bacteria are detected by the flow-cytometer. In accordance with CFU and OD measurements, the pH of the culture medium after 24 hours of growth was around 4.6±0.14 for all probiotics containing B. infantis strains including the Combo, while pure LGG culture reached pH 5.6, indicating metabolic activity of all the strains. Culture supernatants at final concentration of 30% (vol/vol) were then tested in our model. Foremost, we found that all the tested supernatants could significantly mitigate the LPS-induced epithelial barrier damage (Figure 4A). Then we also assessed the concentration of the major pro-inflammatory cytokine IL-8 in both channels which is also strongly upregulated in our model (Figure 2A) using ELISA method. While probiotic supernatants had no impact on IL-8 concentration rise in Basal channel, up-regulation in the Lumen channel was significantly diminished compared to non-inoculated bacterial medium (control medium) by most probiotic supernatants besides LGG and Bifin02 (Figure 4B).
We then investigated the metabolome of the probiotic supernatants specifically focusing on short-chain fatty acids (SCFA) and the Tryptophane/Indole pathway as they are associated with epithelial barrier maintenance and immunomodulatory effects [52]. Indeed, among the most highly upregulated metabolites detected in the supernatants of all tested probiotics we found Formic acid belonging to the SCFA family and Indole-3-Lactic Acid (ILA) while LGG appears as the weakest producer of the latter (Figure 5). Other members of Indole pathway including Indole-3-Propionic acid (I3P), Indole-3-Butyric acid, and Tryptamine were produced by all B. infantis strain but not by LGG alone. Lactate – one of the main by-products of lactic acid bacteria and bifidobacteria metabolism [53] – was also among the most upregulated metabolites, as expected (Table S3).
To further explore the possible mode-of-action of probiotic supernatants, we expanded the cytokine analysis for 3 probiotics: ATCC 15697, Bifin02 and Combo using Luminex technology. We found that none of the probiotic supernatants had any impact on LPS-induced alteration of cytokine levels produced mainly by PBMC in the Basal channel (Figure 6, right). In the Lumen channel, on the other hand, only the supernatant of ATCC 15697 strain provoked statistically significant reduction of IL-6 and IL-8 concentrations (Figure 6, left).
Since the origin of cytokines detected in lumen channel can be attributed to Caco2 cells and/or diffusion from Basal channel [33], we investigated the direct impact of probiotics on the cytokines produced by epithelial cells by assessing the transcription of genes encoding cytokines and chemokines involved in homeostasis and inflammation of the epithelium. Indeed, we found that the tested probiotic supernatants did not consistently modulate the upregulation of the IL-6 and IL-8 cytokines and thus did not reach statistically significant impact (Figure 7, left). In contrast, the transcription of TSLP, TGFβ and IL-18 was significantly upregulated by all three tested probiotics except for Bifin02 that did not reach the p-value significance threshold for TSLP transcription modulation although demonstrating similar trend.
To test the hypothesis that the protective effect of probiotics might also have a cytokine-independent nature, we examined the transcription of genes encoding proteins involved in epithelial barrier integrity maintenance. We found that Claudin-3 and Claudin-4 transcription was upregulated by all three probiotics while the transcription of Claudin-2 was downregulated significantly by ATCC 15697 and the Combo while Bifin02 showed a similar tendency (Figure 7, right). Additionally, the probiotics induced a slight upregulation of TJP-1, OCLN, CDH1 as well as downregulation of MMP7 although it mostly didn’t reach statistically significant values.
4. Discussion
For more than a decade “intestine-on-a-chip”-like technologies have been developed to narrow the translational gap between cell-based in-vitro models and clinical studies by combining the advantages of performing the study in the lab while recapitulating more complex organ behavior and key host responses thanks to the use of multiple cell types [54,55,56]. While epithelial cell lines (e.g. Caco-2, HT-29) are used to model the epithelium, the use of the immune cells is rarer despite their key role in intestinal homeostasis and especially in inflammatory process. Indeed, PBMC used in our model induced accumulation of IL-8, IP-10 and TNFα in the Basal channel and provoked a slight increase in epithelial paracellular permeability (Figure 2). Intriguingly, the presence of PBMC in Basal channel had a bivalent impact on cytokine gene transcription in Caco-2, upregulating immunoregulatory cytokines TSLP and IL-18 and downregulating pro-inflammatory cytokine IL-8 on one hand, while also upregulating pro-inflammatory cytokines such as IL-23A and CCL2 (monocyte chemoattractant protein-1 – MIP-1). (Figure 2C). In addition, transcription of genes encoding proteins ensuring the integrity and maintenance of the epithelial barrier including Claudin family proteins (CLDN-1, -2, -3, -4), E-Cadherin (CDH1) and ZO-1 (TJP1) was also upregulated (Figure 2C). These results further demonstrate the importance of the cross-talk between epithelial and immune cells in intestinal homeostasis [57].
Since LPS translocation towards the blood stream is a hallmark of severe epithelial barrier disfunction and was reported in acute malnutrition in infants [8,58,59], we used it as physiologically relevant tool to provoke PBMC-mediated inflammation in our model. LPS stimulation induced upregulation of most of the tested cytokines in the Basal channel except for downregulation of CXCL-10 chemokine (Figure 2A, right). Interestingly, while this chemokine is commonly associated with inflammation and immune cells recruitment [60,61], Proost et al. reported the inhibitory effect of LPS on IFNγ-induced secretion of CXCL10 by PBMCs but not by fibroblasts thus assuring, supposedly, T cell recruitment to the site of infection from the blood stream [62]. Regarding the Lumen channel, we quantitatively detected only the increase of IL-8 and IL-6 (Figure 2A, left).
Here we demonstrate that the conditioned media of B. infantis alone or in combination with LGG grown in supplementation of 2’-FL and LNT protected against LPS-induced epithelial damage as measured by TEER. Interestingly, the concentration of the tested cytokines in the Basal channel remained generally unchanged by probiotic supernatants (Figure 6, right) and the increase of IL-6 and IL-8 in the Lumen channel was only slightly mitigated while not even always reaching statistical significance (Figure 6, left). The tested probiotics did not reduce the transcription levels of IL-6 and IL-8 encoding genes in Caco-2 cells (Figure 7, left). This indicates that while intestinal barrier damage is likely mediated by cytokines produced by PBMC, the protective effect of the probiotic-conditioned media appears to be independent of these cytokine levels. One could imagine that the cytokines detected in the lumen compartment are not primarily secreted by Caco-2 cells, but instead diffuse more actively from the “blood” channel into the lumen as a result of LPS-induced damage to the intestinal membrane as demonstrated by Beaurivage et al [33]. Since probiotic supernatants protect intestinal barrier integrity, the diffusion of cytokines secreted by PBMC could be reduced. Therefore, the observed decrease in cytokine levels in the lumen compartment may be due to reduced diffusion, rather than a direct effect of the probiotics on Caco-2 cell cytokine secretion; this hypothesis should be investigated further in the future. In contrast to no effect on pro-inflammatory cytokines, probiotic supernatants upregulated genes encoding immunoregulatory cytokines TGFβ and TSLP as well as IL-18 which is involved in tissue repair [57]. Furthermore, the tested supernatants modified the transcription of Claudin genes of the tight-junction protein family tilting the balance in favor of “tight” Claudin-3 and Claudin-4 in contrast to the “leaky” Claudin-2. Besides Claudins, the transcription of other genes encoding junction proteins was also upregulated but did not reach statistical significance, most probably due to the variability between the PBMC donors. It was specifically demonstrated that Claudin-2 is upregulated in the intestine of patients with inflammatory bowel diseases [63]. Moreover, Claudin-2 expression in epithelial cell lines was upregulated by variety of pro-inflammatory cytokines including TNFα [64] and IL-6 [65,66] that were strongly upregulated upon LPS stimulation of PBMC in our model (Figure 6A). Interestingly, it was previously demonstrated that B. infantis conditioned medium prevents TNFα + IFNγ mediated TEER drop via downregulation of Claudin-2 und upregulation of ZO-1, Occludin [67] and Claudin 1 [13] trend.
One of the mechanisms by which probiotics impact tight junction protein expression is via pattern recognition receptors such as Toll-like receptor 2 (TLR2) and TLR9 [68,69,70]. Indeed, TLR2 activation in intestinal epithelial cells was demonstrated to improve epithelial barrier via apical modulation of tight junctions [71]. Although no intact bacteria were included in our experiments, cell debris and extracellular vesicles bearing TLR2 ligands such as lipoproteins, lipoteichoic acid, and components of peptidoglycan can be well present in bacterial supernatants [72].
Another mode of action of probiotics effect on amelioration of intestinal epithelial barrier is mediated by the produced metabolites. Indeed, all the tested probiotics produced ILA although LGG® produced much less of this metabolite. Moreover, all tested B. infantis strains produced significant concentrations of several Indole derivatives (Figure 5) that were demonstrated to contribute to epithelial barrier integrity and to mitigate inflammation via activation of Aryl hydrocarbon receptor (AhR) [73,74,75]. Specifically, ILA was found in stool samples of infants upon EVC001 supplementation [76] and its anti-inflammatory effect was demonstrated to be mediated by AhR and Nuclear factor erythroid 2-related factor 2 (Nrf2) pathway [77,78,79].
In summary, all tested B. infantis strains and LGG demonstrated the potential to protect the intestinal epithelium from LPS induced inflammatory damage while the addition of LGG to B. infantis Bifin02 had no additional impact compared to Bifin02 alone. Mechanistically, it is proposed that Indole derivatives produced by these probiotic strains may reinforce the barrier function of the intestinal epithelial cells mainly via modulation of tight-junction proteins and homeostatic gene transcription promoting a leak-tight phenotype. In general, the Gut-on-a-Chip model replicates key inflammatory features, enabling mid-throughput screening of biotherapeutics and potentially supporting personalized medicine with the use of donor-derived immune cells.
Supplementary Materials
Table S1: Bacterial strains, Table S2: Genes and qPCR assays ID, Figure S1: Strain discrimination using lectin staining, Table S3: Metabolomic analysis of probiotic supernatants.
Author Contributions
Conceptualization: I.B. and C.V.; Data generation and analysis: I.B., B.B., B.B.A, S.P., S.B., A.H, M.R., J.M.T., M.M.; Resources, JS, MS and JP; Writing I.B and C.V.; Supervision and validation: JS, RD
Funding
This research was funded by Gates Medical Research institute
Data Availability Statement
The original contributions presented in this study are included in the article and supplementary materials. Further inquiries can be directed to the corresponding author.
Acknowledgments
2′-Fucosyllactose (2’-FL) and Lacto-N-tetraose HMOs used in this research were donated by dsm-firmenich. We thank dsm-firmenich for its ongoing support of research into the benefits of HMOs. We are grateful to the healthy volunteers for their participation in the study. We also thank the COSIPOP study group members who conceived and managed the COSIPOP cohort from Human health of the Institute Pasteur and the biobank (CHIP) of the Biological Resource Center of the Institute Pasteur (Paris) for distribution of the blood samples. COSIPOP study group members: Laurence Arowas, Nathalie Clement, Maurine Delhaye, Christine Fanaud, Emilie Nguyen, Clémence Noury, Blanca-Liliana Perlaza, Emmanuel Roux, Marie Vogtensperger, Ayla Zayoud, Nathalie Jolly* and Hélène Laude*. *Co-senior authors We thank IFF (International Flavors & Fragrances Inc.) for providing the Bi-26™ and Novonesis for providing the Bifin02™ and LGG® strains for this study.
Conflicts of Interest
The authors declare no conflict of interest
References
- Kane, A.V.; Dinh, D.M.; Ward, H.D. Childhood malnutrition and the intestinal microbiome. Pediatric research 2015, 77, 256–262. [Google Scholar] [CrossRef]
- Dogra, S.K.; Kwong Chung, C.; Wang, D.; Sakwinska, O.; Colombo Mottaz, S.; Sprenger, N. Nurturing the Early Life Gut Microbiome and Immune Maturation for Long Term Health. Microorganisms 2021, 9, 2110. [Google Scholar] [CrossRef] [PubMed]
- Donald, K.; Finlay, B.B. Early-life interactions between the microbiota and immune system: impact on immune system development and atopic disease. Nature reviews Immunology 2023, 23, 735–748. [Google Scholar] [CrossRef] [PubMed]
- Zhang, H.; Zhang, Z.; Liao, Y.; Zhang, W.; Tang, D. The Complex Link and Disease Between the Gut Microbiome and the Immune System in Infants. Frontiers in cellular and infection microbiology 2022, 12, 924119. [Google Scholar] [CrossRef] [PubMed]
- Sanidad, K.Z.; Zeng, M.Y. Neonatal gut microbiome and immunity. Current opinion in microbiology 2020, 56, 30–37. [Google Scholar] [CrossRef]
- Casaburi, G.; Duar, R.M.; Brown, H.; Mitchell, R.D.; Kazi, S.; Chew, S.; Cagney, O.; Flannery, R.L.; Sylvester, K.G.; Frese, S.A.; et al. Metagenomic insights of the infant microbiome community structure and function across multiple sites in the United States. Sci Rep 2021, 11, 1472. [Google Scholar] [CrossRef]
- Duar, R.M.; Henrick, B.M.; Casaburi, G.; Frese, S.A. Integrating the Ecosystem Services Framework to Define Dysbiosis of the Breastfed Infant Gut: The Role of B. infantis and Human Milk Oligosaccharides. Frontiers in nutrition 2020, 7, 33. [Google Scholar] [CrossRef]
- Iddrisu, I.; Monteagudo-Mera, A.; Poveda, C.; Pyle, S.; Shahzad, M.; Andrews, S.; Walton, G.E. Malnutrition and Gut Microbiota in Children. Nutrients 2021, 13. [Google Scholar] [CrossRef]
- Barratt, M.J.; Nuzhat, S.; Ahsan, K.; Frese, S.A.; Arzamasov, A.A.; Sarker, S.A.; Islam, M.M.; Palit, P.; Islam, M.R.; Hibberd, M.C.; et al. Bifidobacterium infantis treatment promotes weight gain in Bangladeshi infants with severe acute malnutrition. Sci Transl Med 2022, 14, eabk1107. [Google Scholar] [CrossRef]
- Castro-Mejía, J.L.; O'Ferrall, S.; Krych, Ł.; O'Mahony, E.; Namusoke, H.; Lanyero, B.; Kot, W.; Nabukeera-Barungi, N.; Michaelsen, K.F.; Mølgaard, C.; et al. Restitution of gut microbiota in Ugandan children administered with probiotics (Lactobacillus rhamnosus GG and Bifidobacterium animalis subsp. lactis BB-12) during treatment for severe acute malnutrition. Gut Microbes 2020, 11, 855–867. [Google Scholar] [CrossRef]
- Grenov, B.; Namusoke, H.; Lanyero, B.; Nabukeera-Barungi, N.; Ritz, C.; Mølgaard, C.; Friis, H.; Michaelsen, K.F. Effect of Probiotics on Diarrhea in Children With Severe Acute Malnutrition: A Randomized Controlled Study in Uganda. Journal of pediatric gastroenterology and nutrition 2017, 64, 396–403. [Google Scholar] [CrossRef]
- Kara, S.S.; Volkan, B.; Erten, I. Lactobacillus rhamnosus GG can protect malnourished children. Benef Microbes 2019, 10, 237–244. [Google Scholar] [CrossRef]
- Guo, S.; Gillingham, T.; Guo, Y.; Meng, D.; Zhu, W.; Walker, W.A.; Ganguli, K. Secretions of Bifidobacterium infantis and Lactobacillus acidophilus Protect Intestinal Epithelial Barrier Function. Journal of pediatric gastroenterology and nutrition 2017, 64, 404–412. [Google Scholar] [CrossRef] [PubMed]
- O'Hara, A.M.; O'Regan, P.; Fanning, A.; O'Mahony, C.; Macsharry, J.; Lyons, A.; Bienenstock, J.; O'Mahony, L.; Shanahan, F. Functional modulation of human intestinal epithelial cell responses by Bifidobacterium infantis and Lactobacillus salivarius. Immunology 2006, 118, 202–215. [Google Scholar] [CrossRef] [PubMed]
- Sibartie, S.; O'Hara, A.M.; Ryan, J.; Fanning, A.; O'Mahony, J.; O'Neill, S.; Sheil, B.; O'Mahony, L.; Shanahan, F. Modulation of pathogen-induced CCL20 secretion from HT-29 human intestinal epithelial cells by commensal bacteria. BMC immunology 2009, 10, 54. [Google Scholar] [CrossRef] [PubMed]
- Álvarez-Mercado, A.I.; Plaza-Díaz, J.; de Almagro, M.C.; Gil, Á.; Moreno-Muñoz, J.A.; Fontana, L. Bifidobacterium longum subsp. infantis CECT 7210 Reduces Inflammatory Cytokine Secretion in Caco-2 Cells Cultured in the Presence of Escherichia coli CECT 515. Int J Mol Sci 2022, 23. [Google Scholar] [CrossRef]
- Li, A.; Zhang, C.; Chi, H.; Han, X.; Ma, Y.; Zheng, J.; Liu, C.; Li, C. 2'-Fucosyllactose promotes Lactobacillus rhamnosus KLDS 8001 to repair LPS-induced damage in Caco-2 cells. Journal of food biochemistry 2022, 46, e14059. [Google Scholar] [CrossRef]
- Fang, H.W.; Fang, S.B.; Chiang Chiau, J.S.; Yeung, C.Y.; Chan, W.T.; Jiang, C.B.; Cheng, M.L.; Lee, H.C. Inhibitory effects of Lactobacillus casei subsp. rhamnosus on Salmonella lipopolysaccharide-induced inflammation and epithelial barrier dysfunction in a co-culture model using Caco-2/peripheral blood mononuclear cells. Journal of medical microbiology 2010, 59, 573–579. [Google Scholar] [CrossRef]
- Konieczna, P.; Akdis, C.A.; Quigley, E.M.; Shanahan, F.; O'Mahony, L. Portrait of an immunoregulatory Bifidobacterium. Gut Microbes 2012, 3, 261–266. [Google Scholar] [CrossRef]
- van der Kleij, H.; O'Mahony, C.; Shanahan, F.; O'Mahony, L.; Bienenstock, J. Protective effects of Lactobacillus rhamnosus [corrected] and Bifidobacterium infantis in murine models for colitis do not involve the vagus nerve. American journal of physiology. Regulatory, integrative and comparative physiology 2008, 295, R1131–1137. [Google Scholar] [CrossRef]
- Mao, J.; Qi, S.; Cui, Y.; Dou, X.; Luo, X.M.; Liu, J.; Zhu, T.; Ma, Y.; Wang, H. Lactobacillus rhamnosus GG Attenuates Lipopolysaccharide-Induced Inflammation and Barrier Dysfunction by Regulating MAPK/NF-κB Signaling and Modulating Metabolome in the Piglet Intestine. The Journal of nutrition 2020, 150, 1313–1323. [Google Scholar] [CrossRef] [PubMed]
- Lordan, C.; Roche, A.K.; Delsing, D.; Nauta, A.; Groeneveld, A.; MacSharry, J.; Cotter, P.D.; van Sinderen, D. Linking human milk oligosaccharide metabolism and early life gut microbiota: bifidobacteria and beyond. Microbiology and molecular biology reviews : MMBR 2024, 88, e0009423. [Google Scholar] [CrossRef]
- Thomson, P.; Medina, D.A.; Garrido, D. Human milk oligosaccharides and infant gut bifidobacteria: Molecular strategies for their utilization. Food microbiology 2018, 75, 37–46. [Google Scholar] [CrossRef]
- Sela, D.A.; Chapman, J.; Adeuya, A.; Kim, J.H.; Chen, F.; Whitehead, T.R.; Lapidus, A.; Rokhsar, D.S.; Lebrilla, C.B.; German, J.B.; et al. The genome sequence of Bifidobacterium longum subsp. infantis reveals adaptations for milk utilization within the infant microbiome. Proc Natl Acad Sci U S A 2008, 105, 18964–18969. [Google Scholar] [CrossRef]
- Duar, R.M.; Casaburi, G.; Mitchell, R.D.; Scofield, L.N.C.; Ortega Ramirez, C.A.; Barile, D.; Henrick, B.M.; Frese, S.A. Comparative Genome Analysis of Bifidobacterium longum subsp. infantis Strains Reveals Variation in Human Milk Oligosaccharide Utilization Genes among Commercial Probiotics. Nutrients 2020, 12. [Google Scholar] [CrossRef]
- Zabel, B.E.; Gerdes, S.; Evans, K.C.; Nedveck, D.; Singles, S.K.; Volk, B.; Budinoff, C. Strain-specific strategies of 2'-fucosyllactose, 3-fucosyllactose, and difucosyllactose assimilation by Bifidobacterium longum subsp. infantis Bi-26 and ATCC 15697. Sci Rep 2020, 10, 15919. [Google Scholar] [CrossRef]
- Arzamasov, A.A.; Osterman, A.L. Milk glycan metabolism by intestinal bifidobacteria: insights from comparative genomics. Critical reviews in biochemistry and molecular biology 2022, 57, 562–584. [Google Scholar] [CrossRef]
- Vinjamuri, A.; Davis, J.C.C.; Totten, S.M.; Wu, L.D.; Klein, L.D.; Martin, M.; Quinn, E.A.; Scelza, B.; Breakey, A.; Gurven, M.; et al. Human Milk Oligosaccharide Compositions Illustrate Global Variations in Early Nutrition. The Journal of nutrition 2022, 152, 1239–1253. [Google Scholar] [CrossRef]
- Ingber, D.E. Human organs-on-chips for disease modelling, drug development and personalized medicine. Nature reviews Genetics 2022, 23, 467–491. [Google Scholar] [CrossRef] [PubMed]
- Pocock, K.; Delon, L.; Bala, V.; Rao, S.; Priest, C.; Prestidge, C.; Thierry, B. Intestine-on-a-Chip Microfluidic Model for Efficient in Vitro Screening of Oral Chemotherapeutic Uptake. ACS biomaterials science & engineering 2017, 3, 951–959. [Google Scholar] [CrossRef]
- Chi, M.; Yi, B.; Oh, S.; Park, D.J.; Sung, J.H.; Park, S. A microfluidic cell culture device (μFCCD) to culture epithelial cells with physiological and morphological properties that mimic those of the human intestine. Biomedical microdevices 2015, 17, 9966. [Google Scholar] [CrossRef] [PubMed]
- Trietsch, S.J.; Naumovska, E.; Kurek, D.; Setyawati, M.C.; Vormann, M.K.; Wilschut, K.J.; Lanz, H.L.; Nicolas, A.; Ng, C.P.; Joore, J.; et al. Membrane-free culture and real-time barrier integrity assessment of perfused intestinal epithelium tubes. Nat Commun 2017, 8, 262. [Google Scholar] [CrossRef]
- Beaurivage, C.; Naumovska, E.; Chang, Y.X.; Elstak, E.D.; Nicolas, A.; Wouters, H.; van Moolenbroek, G.; Lanz, H.L.; Trietsch, S.J.; Joore, J.; et al. Development of a Gut-On-A-Chip Model for High Throughput Disease Modeling and Drug Discovery. Int J Mol Sci 2019, 20. [Google Scholar] [CrossRef]
- Gijzen, L.; Marescotti, D.; Raineri, E.; Nicolas, A.; Lanz, H.L.; Guerrera, D.; van Vught, R.; Joore, J.; Vulto, P.; Peitsch, M.C.; et al. An Intestine-on-a-Chip Model of Plug-and-Play Modularity to Study Inflammatory Processes. SLAS TECHNOLOGY: Translating Life Sciences Innovation 2020, 25, 585–597. [Google Scholar] [CrossRef]
- Bounab, Y.; Eyer, K.; Dixneuf, S.; Rybczynska, M.; Chauvel, C.; Mistretta, M.; Tran, T.; Aymerich, N.; Chenon, G.; Llitjos, J.F.; et al. Dynamic single-cell phenotyping of immune cells using the microfluidic platform DropMap. Nature protocols 2020, 15, 2920–2955. [Google Scholar] [CrossRef]
- Smart, K.F.; Aggio, R.B.; Van Houtte, J.R.; Villas-Bôas, S.G. Analytical platform for metabolome analysis of microbial cells using methyl chloroformate derivatization followed by gas chromatography-mass spectrometry. Nature protocols 2010, 5, 1709–1729. [Google Scholar] [CrossRef]
- Rutledge, R.G.; Côté, C. Mathematics of quantitative kinetic PCR and the application of standard curves. Nucleic acids research 2003, 31, e93. [Google Scholar] [CrossRef]
- Rasmussen, R. Quantification on the LightCycler. In Rapid Cycle Real-Time PCR: Methods and Applications; Meuer, S., Wittwer, C., Nakagawara, K.-I., Eds.; Springer: Berlin/Heidelberg, Germany, 2001; pp. 21–34. [Google Scholar] [CrossRef]
- Pfaffl, M.W. A new mathematical model for relative quantification in real-time RT-PCR. Nucleic acids research 2001, 29, e45. [Google Scholar] [CrossRef] [PubMed]
- Vandesompele, J.; De Preter, K.; Pattyn, F.; Poppe, B.; Van Roy, N.; De Paepe, A.; Speleman, F. Accurate normalization of real-time quantitative RT-PCR data by geometric averaging of multiple internal control genes. Genome biology 2002, 3, Research0034. [Google Scholar] [CrossRef] [PubMed]
- Hoffman, G.E.; Schadt, E.E. variancePartition: interpreting drivers of variation in complex gene expression studies. BMC bioinformatics 2016, 17, 483. [Google Scholar] [CrossRef]
- Ritchie, M.E.; Phipson, B.; Wu, D.; Hu, Y.; Law, C.W.; Shi, W.; Smyth, G.K. limma powers differential expression analyses for RNA-sequencing and microarray studies. Nucleic acids research 2015, 43, e47. [Google Scholar] [CrossRef]
- Benjamini, Y.; Hochberg, Y. Controlling the False Discovery Rate: A Practical and Powerful Approach to Multiple Testing. Journal of the Royal Statistical Society: Series B (Methodological) 1995, 57, 289–300. [Google Scholar] [CrossRef]
- Weiss, G.A.; Hennet, T. Mechanisms and consequences of intestinal dysbiosis. Cellular and molecular life sciences : CMLS 2017, 74, 2959–2977. [Google Scholar] [CrossRef] [PubMed]
- Page, M.J.; Kell, D.B.; Pretorius, E. The Role of Lipopolysaccharide-Induced Cell Signalling in Chronic Inflammation. Chronic stress (Thousand Oaks, Calif.) 2022, 6, 24705470221076390. [Google Scholar] [CrossRef]
- Nagpal, R.; Yadav, H. Bacterial Translocation from the Gut to the Distant Organs: An Overview. Annals of nutrition & metabolism 2017, 71 Suppl 1, 11–16. [Google Scholar] [CrossRef]
- Noë, V.; Fingleton, B.; Jacobs, K.; Crawford, H.C.; Vermeulen, S.; Steelant, W.; Bruyneel, E.; Matrisian, L.M.; Mareel, M. Release of an invasion promoter E-cadherin fragment by matrilysin and stromelysin-1. Journal of cell science 2001, 114, 111–118. [Google Scholar] [CrossRef]
- Burke, B. The role of matrix metalloproteinase 7 in innate immunity. Immunobiology 2004, 209, 51–56. [Google Scholar] [CrossRef] [PubMed]
- Soyyılmaz, B.; Mikš, M.H.; Röhrig, C.H.; Matwiejuk, M.; Meszaros-Matwiejuk, A.; Vigsnæs, L.K. The Mean of Milk: A Review of Human Milk Oligosaccharide Concentrations throughout Lactation. Nutrients 2021, 13. [Google Scholar] [CrossRef] [PubMed]
- Konieczna, M.; Koryszewska-Bagińska, A.; Bzikowska-Jura, A.; Chmielewska-Jeznach, M.; Jarzynka, S.; Olędzka, G. Modifiable and Non-Modifiable Factors That Affect Human Milk Oligosaccharides Composition. Nutrients 2024, 16, 2887. [Google Scholar] [CrossRef]
- Zalán, Z.; Hudáček, J.; Štětina, J.; Chumchalová, J.; Halász, A. Production of organic acids by Lactobacillus strains in three different media. European Food Research and Technology 2010, 230, 395–404. [Google Scholar] [CrossRef]
- Fu, Y.; Lyu, J.; Wang, S. The role of intestinal microbes on intestinal barrier function and host immunity from a metabolite perspective. Front Immunol 2023, 14, 1277102. [Google Scholar] [CrossRef] [PubMed]
- Mathur, H.; Beresford, T.P.; Cotter, P.D. Health Benefits of Lactic Acid Bacteria (LAB) Fermentates. Nutrients 2020, 12. [Google Scholar] [CrossRef]
- Donkers, J.M.; Eslami Amirabadi, H.; van de Steeg, E. Intestine-on-a-chip: Next level in vitro research model of the human intestine. Current Opinion in Toxicology 2021, 25, 6–14. [Google Scholar] [CrossRef]
- Morelli, M.; Kurek, D.; Ng, C.P.; Queiroz, K. Gut-on-a-Chip Models: Current and Future Perspectives for Host-Microbial Interactions Research. Biomedicines 2023, 11. [Google Scholar] [CrossRef]
- Xiang, Y.; Wen, H.; Yu, Y.; Li, M.; Fu, X.; Huang, S. Gut-on-chip: Recreating human intestine in vitro. Journal of tissue engineering 2020, 11, 2041731420965318. [Google Scholar] [CrossRef]
- Peterson, L.W.; Artis, D. Intestinal epithelial cells: regulators of barrier function and immune homeostasis. Nature reviews. Immunology 2014, 14, 141–153. [Google Scholar] [CrossRef]
- Patterson, G.T.; Osorio, E.Y.; Peniche, A.; Dann, S.M.; Cordova, E.; Preidis, G.A.; Suh, J.H.; Ito, I.; Saldarriaga, O.A.; Loeffelholz, M.; et al. Pathologic Inflammation in Malnutrition Is Driven by Proinflammatory Intestinal Microbiota, Large Intestine Barrier Dysfunction, and Translocation of Bacterial Lipopolysaccharide. Front Immunol 2022, 13, 846155. [Google Scholar] [CrossRef]
- Jones, K.D.; Hünten-Kirsch, B.; Laving, A.M.; Munyi, C.W.; Ngari, M.; Mikusa, J.; Mulongo, M.M.; Odera, D.; Nassir, H.S.; Timbwa, M.; et al. Mesalazine in the initial management of severely acutely malnourished children with environmental enteric dysfunction: a pilot randomized controlled trial. BMC medicine 2014, 12, 133. [Google Scholar] [CrossRef]
- Singh, S.; Anshita, D.; Ravichandiran, V. MCP-1: Function, regulation, and involvement in disease. International immunopharmacology 2021, 101, 107598. [Google Scholar] [CrossRef]
- Antonelli, A.; Ferrari, S.M.; Giuggioli, D.; Ferrannini, E.; Ferri, C.; Fallahi, P. Chemokine (C-X-C motif) ligand (CXCL)10 in autoimmune diseases. Autoimmunity reviews 2014, 13, 272–280. [Google Scholar] [CrossRef] [PubMed]
- Proost, P.; Vynckier, A.K.; Mahieu, F.; Put, W.; Grillet, B.; Struyf, S.; Wuyts, A.; Opdenakker, G.; Van Damme, J. Microbial Toll-like receptor ligands differentially regulate CXCL10/IP-10 expression in fibroblasts and mononuclear leukocytes in synergy with IFN-gamma and provide a mechanism for enhanced synovial chemokine levels in septic arthritis. European journal of immunology 2003, 33, 3146–3153. [Google Scholar] [CrossRef]
- Garcia-Hernandez, V.; Quiros, M.; Nusrat, A. Intestinal epithelial claudins: expression and regulation in homeostasis and inflammation. Annals of the New York Academy of Sciences 2017, 1397, 66–79. [Google Scholar] [CrossRef]
- Mankertz, J.; Amasheh, M.; Krug, S.M.; Fromm, A.; Amasheh, S.; Hillenbrand, B.; Tavalali, S.; Fromm, M.; Schulzke, J.D. TNFalpha up-regulates claudin-2 expression in epithelial HT-29/B6 cells via phosphatidylinositol-3-kinase signaling. Cell and tissue research 2009, 336, 67–77. [Google Scholar] [CrossRef]
- Suzuki, T.; Yoshinaga, N.; Tanabe, S. Interleukin-6 (IL-6) regulates claudin-2 expression and tight junction permeability in intestinal epithelium. The Journal of biological chemistry 2011, 286, 31263–31271. [Google Scholar] [CrossRef]
- Al-Sadi, R.; Ye, D.; Boivin, M.; Guo, S.; Hashimi, M.; Ereifej, L.; Ma, T.Y. Interleukin-6 modulation of intestinal epithelial tight junction permeability is mediated by JNK pathway activation of claudin-2 gene. PLoS One 2014, 9, e85345. [Google Scholar] [CrossRef]
- Ewaschuk, J.B.; Diaz, H.; Meddings, L.; Diederichs, B.; Dmytrash, A.; Backer, J.; Looijer-van Langen, M.; Madsen, K.L. Secreted bioactive factors from Bifidobacterium infantis enhance epithelial cell barrier function. American journal of physiology. Gastrointestinal and liver physiology 2008, 295, G1025–1034. [Google Scholar] [CrossRef] [PubMed]
- Ulluwishewa, D.; Anderson, R.C.; McNabb, W.C.; Moughan, P.J.; Wells, J.M.; Roy, N.C. Regulation of tight junction permeability by intestinal bacteria and dietary components. The Journal of nutrition 2011, 141, 769–776. [Google Scholar] [CrossRef] [PubMed]
- Rose, E.C.; Odle, J.; Blikslager, A.T.; Ziegler, A.L. Probiotics, Prebiotics and Epithelial Tight Junctions: A Promising Approach to Modulate Intestinal Barrier Function. Int J Mol Sci 2021, 22. [Google Scholar] [CrossRef] [PubMed]
- Gou, H.Z.; Zhang, Y.L.; Ren, L.F.; Li, Z.J.; Zhang, L. How do intestinal probiotics restore the intestinal barrier? Front Microbiol 2022, 13, 929346. [Google Scholar] [CrossRef]
- Cario, E.; Gerken, G.; Podolsky, D.K. Toll-like receptor 2 enhances ZO-1-associated intestinal epithelial barrier integrity via protein kinase C. Gastroenterology 2004, 127, 224–238. [Google Scholar] [CrossRef]
- van Bergenhenegouwen, J.; Kraneveld, A.D.; Rutten, L.; Kettelarij, N.; Garssen, J.; Vos, A.P. Extracellular vesicles modulate host-microbe responses by altering TLR2 activity and phagocytosis. PLoS One 2014, 9, e89121. [Google Scholar] [CrossRef]
- Gao, J.; Xu, K.; Liu, H.; Liu, G.; Bai, M.; Peng, C.; Li, T.; Yin, Y. Impact of the Gut Microbiota on Intestinal Immunity Mediated by Tryptophan Metabolism. Frontiers in cellular and infection microbiology 2018, 8, 13. [Google Scholar] [CrossRef]
- Pernomian, L.; Duarte-Silva, M.; de Barros Cardoso, C.R. The Aryl Hydrocarbon Receptor (AHR) as a Potential Target for the Control of Intestinal Inflammation: Insights from an Immune and Bacteria Sensor Receptor. Clinical reviews in allergy & immunology 2020, 59, 382–390. [Google Scholar] [CrossRef]
- Gasaly, N.; de Vos, P.; Hermoso, M.A. Impact of Bacterial Metabolites on Gut Barrier Function and Host Immunity: A Focus on Bacterial Metabolism and Its Relevance for Intestinal Inflammation. Front Immunol 2021, 12, 658354. [Google Scholar] [CrossRef]
- Henrick, B.M.; Rodriguez, L.; Lakshmikanth, T.; Pou, C.; Henckel, E.; Arzoomand, A.; Olin, A.; Wang, J.; Mikes, J.; Tan, Z.; et al. Bifidobacteria-mediated immune system imprinting early in life. Cell 2021, 184, 3884–3898.e3811. [Google Scholar] [CrossRef] [PubMed]
- Ehrlich, A.M.; Pacheco, A.R.; Henrick, B.M.; Taft, D.; Xu, G.; Huda, M.N.; Mishchuk, D.; Goodson, M.L.; Slupsky, C.; Barile, D.; et al. Indole-3-lactic acid associated with Bifidobacterium-dominated microbiota significantly decreases inflammation in intestinal epithelial cells. BMC Microbiol 2020, 20, 357. [Google Scholar] [CrossRef] [PubMed]
- Meng, D.; Sommella, E.; Salviati, E.; Campiglia, P.; Ganguli, K.; Djebali, K.; Zhu, W.; Walker, W.A. Indole-3-lactic acid, a metabolite of tryptophan, secreted by Bifidobacterium longum subspecies infantis is anti-inflammatory in the immature intestine. Pediatric research 2020, 88, 209–217. [Google Scholar] [CrossRef]
- Cui, Q.; Zhang, Z.; Tian, X.; Liang, X.; Lu, Y.; Shi, Y.; Kuerman, M.; Wang, R.; Yu, Z.; Gong, P.; et al. Bifidobacterium bifidum Ameliorates DSS-Induced Colitis in Mice by Regulating AHR/NRF2/NLRP3 Inflammasome Pathways through Indole-3-lactic Acid Production. J Agric Food Chem 2023, 71, 1970–1981. [Google Scholar] [CrossRef]
Figure 1.
Gut-on-a-chip model set-up. (A) Graphical representation of the microfluidic module with the OrganoPlate® and the sequential seeding procedure of Caco-2 and then Peripheral Blood Mononuclear Cells (PBMC) into Lumen and Basal channels respectively. (B) 3D reconstruction of the epithelial tubule based confocal immunostaining images of nuclei (DAPI) and Actin 5 days upon Caco-2 seeding. (C) Epithelial barrier representative evolvement assessed by Transepithelial Electrical Resistance (TEER) from day 3 to 7 without PBMC addition. (D) Zonula Occludens-1 (ZO-1) (left) and Villin (right) immunostaining images of Caco-2 bottom layer of the tubule.
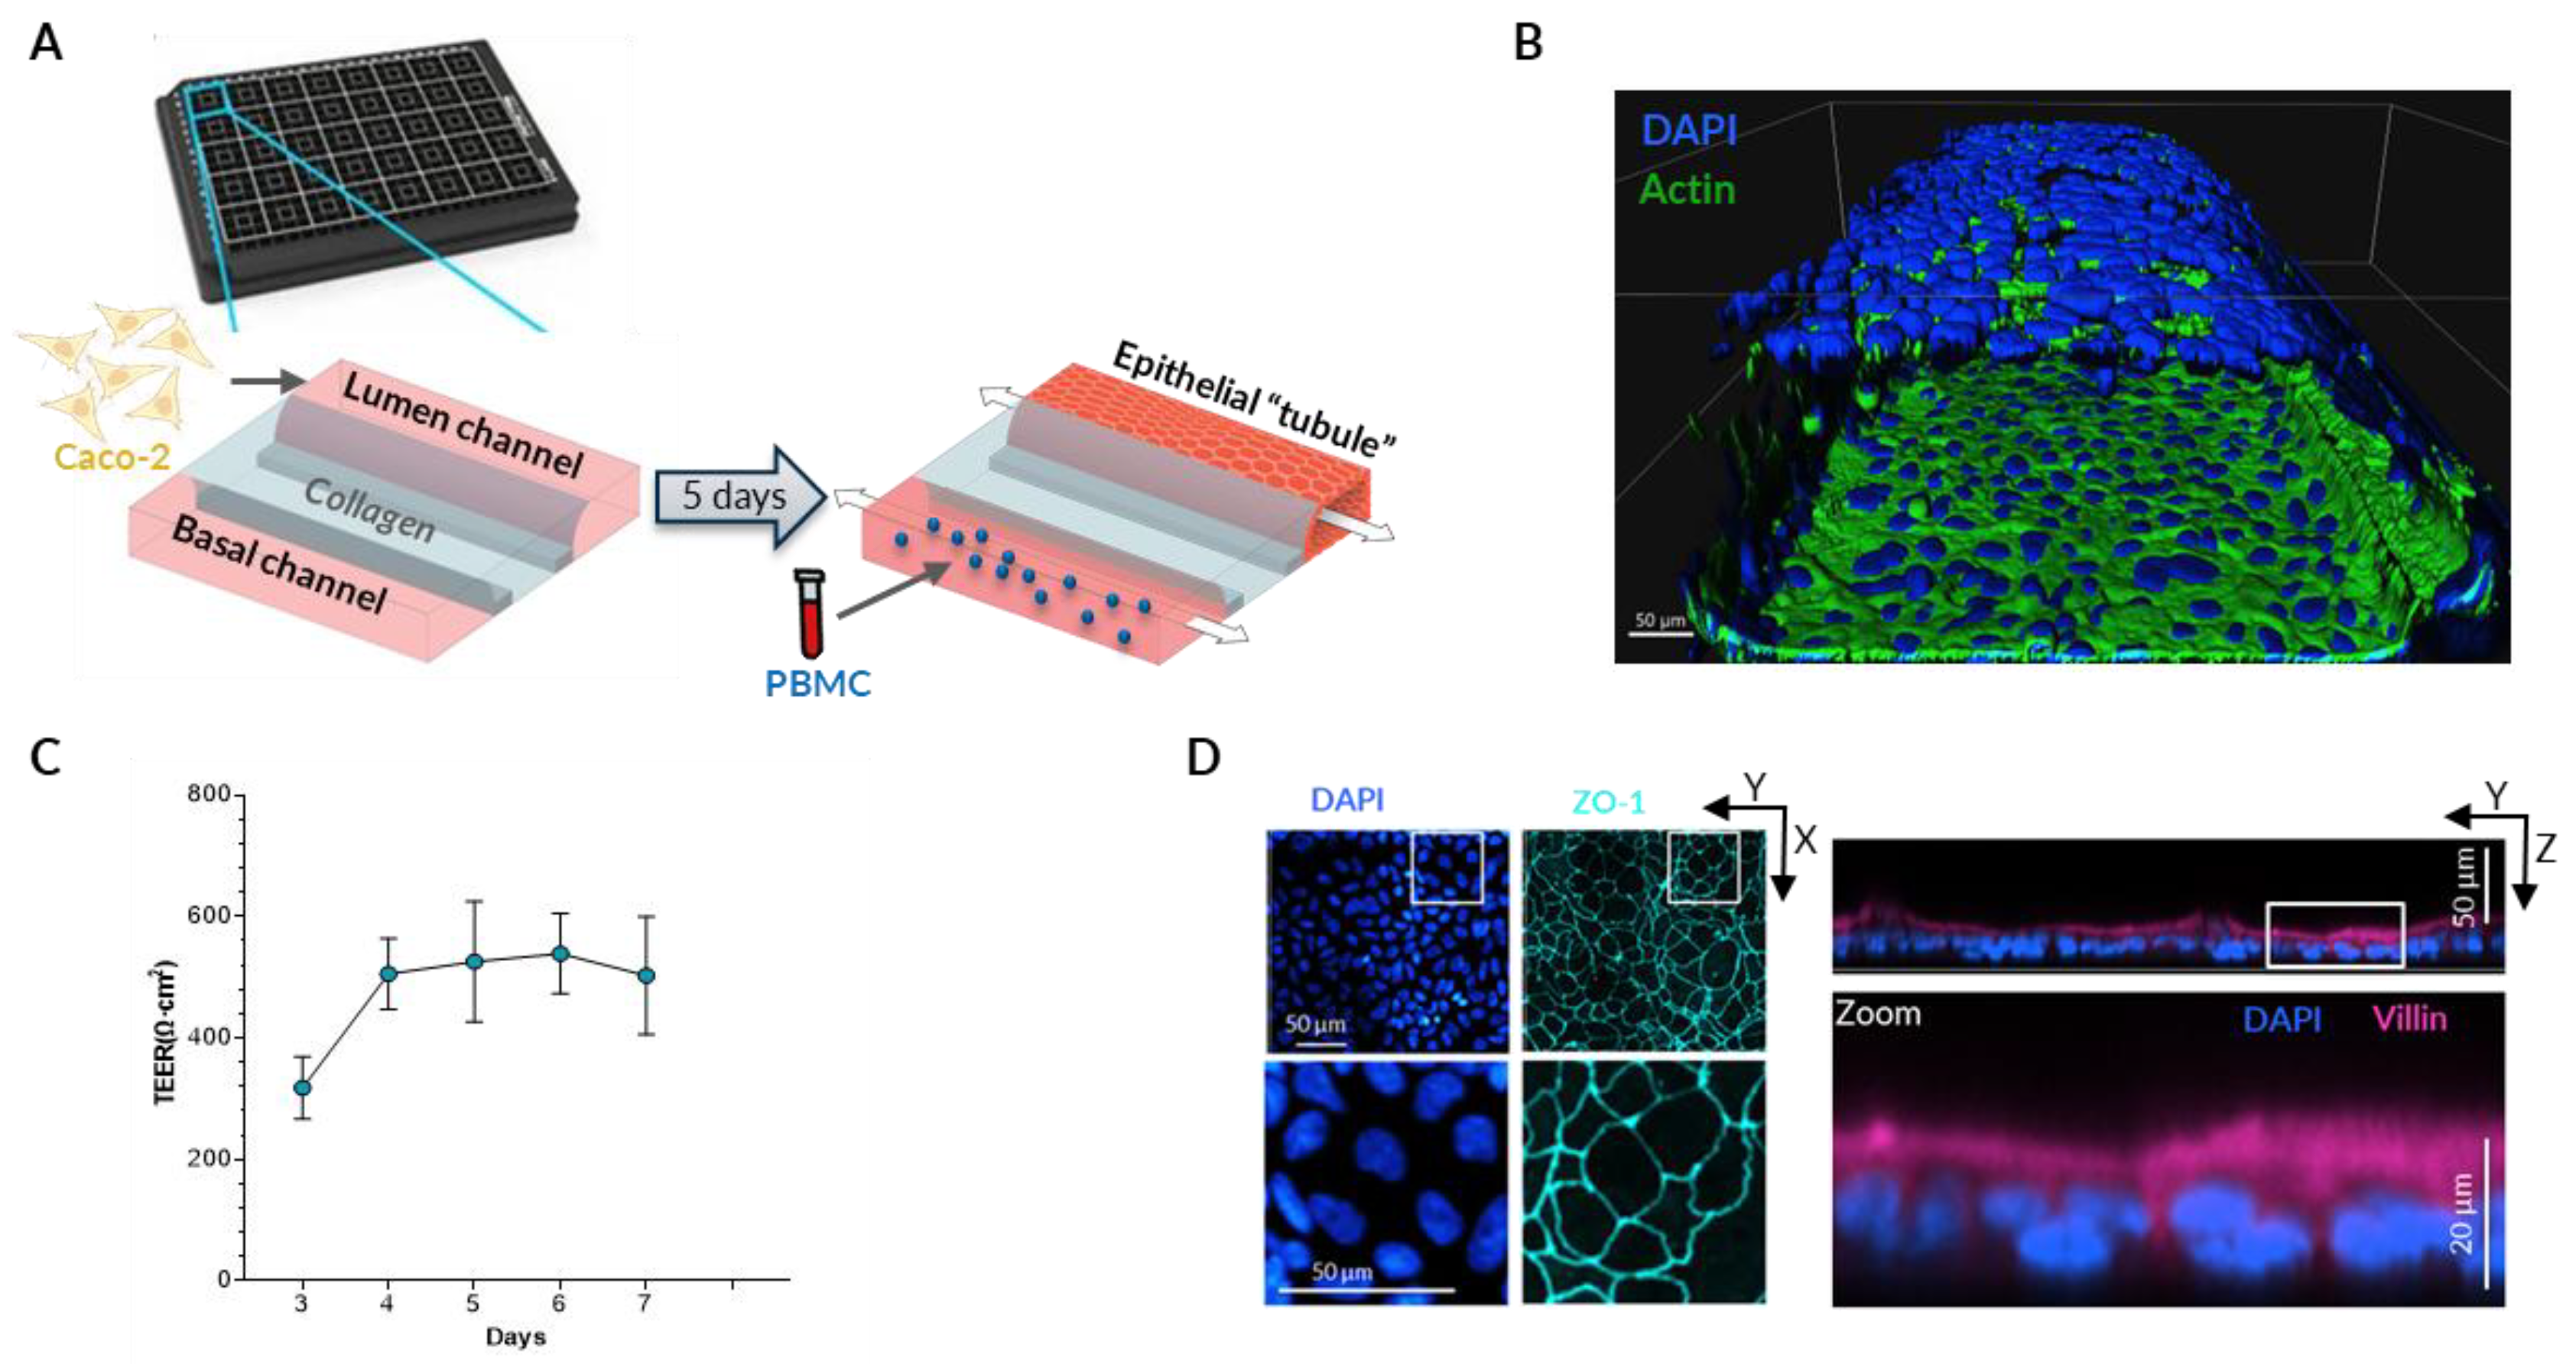
Figure 2.
Inflammation induction and monitoring in Gut-on-a-chip model. *, ** and *** represent statistical significance with p-value < 0.05, 0.01, and 0.001, respectively, when comparing “No PBMC, No LPS” treatment (grey asterisks) or “PBMC with LPS” treatment (orange asterisks) to the “PBMC, No LPS” group using non-parametric Wilcoxon test (6 PBMC donors, 3 independent experiments (N), 18 technical replicates per experimental condition (n)). (A) Relative change in cytokines concentration in Lumen (left) and Basal (right) channels 3 days upon LPS-stimulated (or non-stimulated) PBMC administration normalized to “PBMC, No LPS” group. (B) TEER values along the experiment normalized to the “day 0” just before the PBMC administration. (C) Relative gene expression of Caco-2 on Day 3 of the experiment normalized to the house-keeping gene expression.
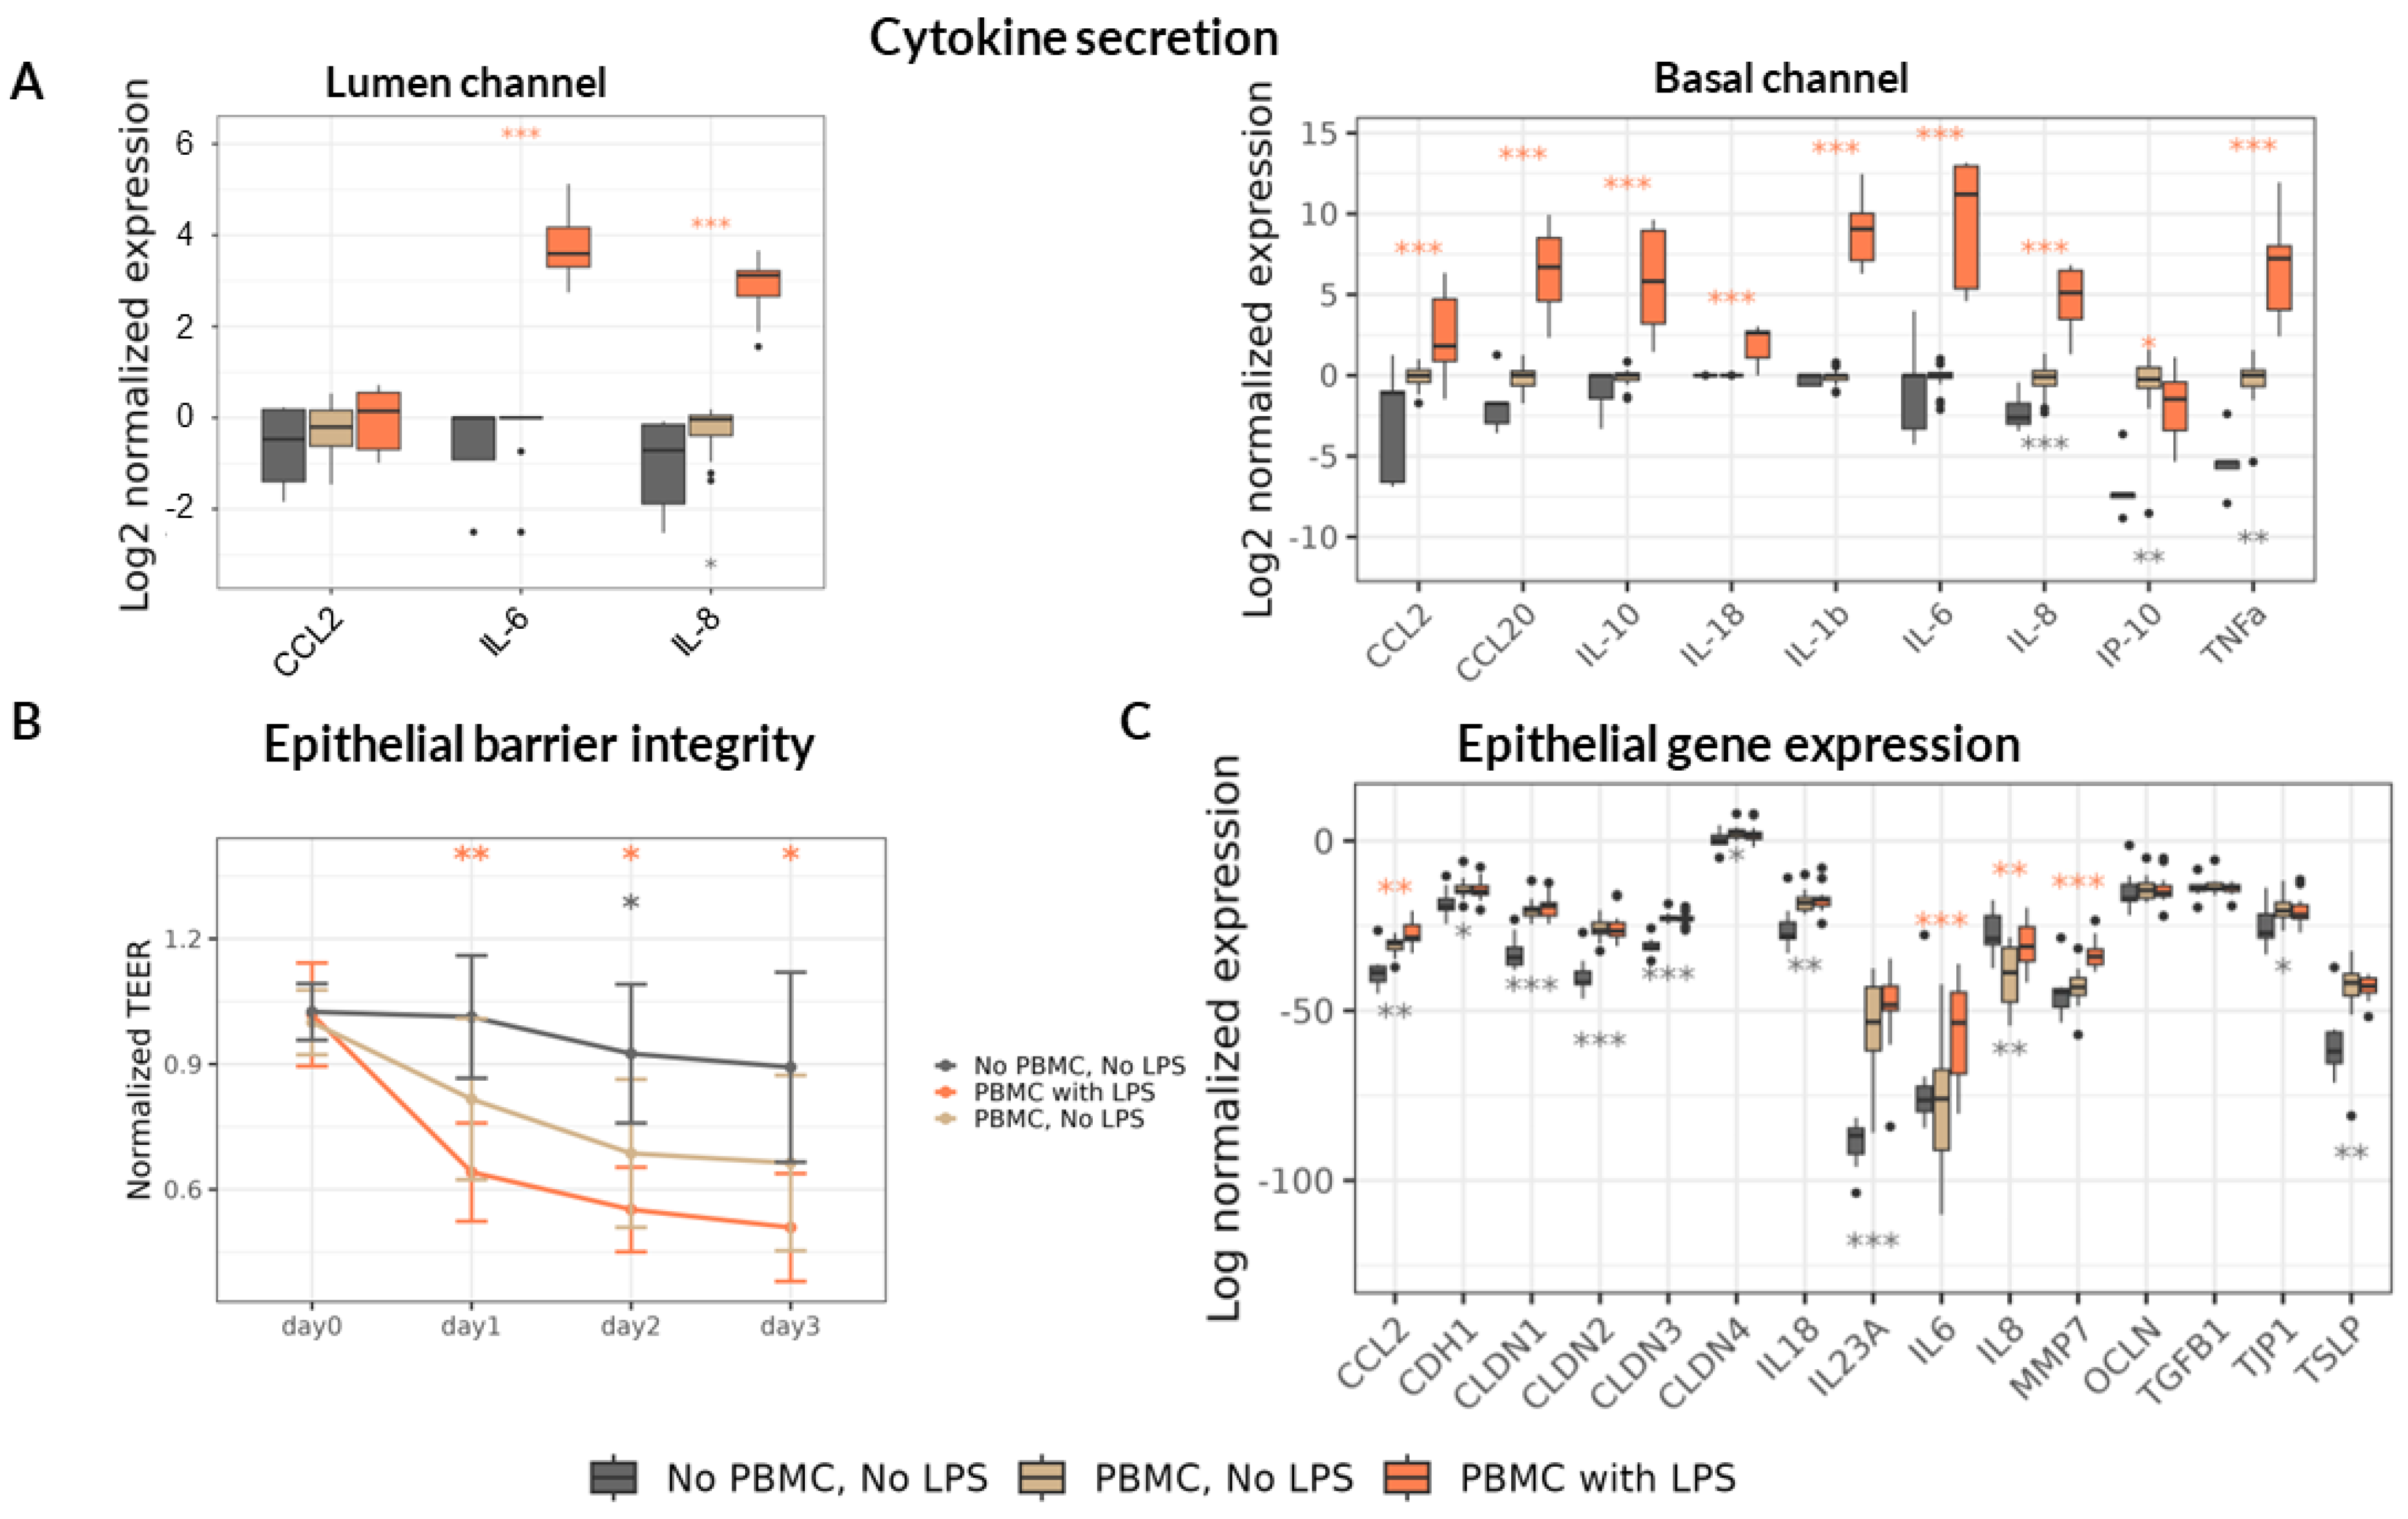
Figure 3.
B. infantis reference strain (ATCC 15697) dose-response protection of epithelial barrier. TEER values during the 3 days of the experiment normalized to Day0 just before the addition of LPS-stimulated (or non-stimulated) PBMC. *, ** and *** represent statistical significance with p-value < 0.05, 0.01, and 0.001, respectively, in comparison of “No sup, +LPS” treatment of the same day using non-parametric Wilcoxon test (6 PBMC donors, N=3, n=18).
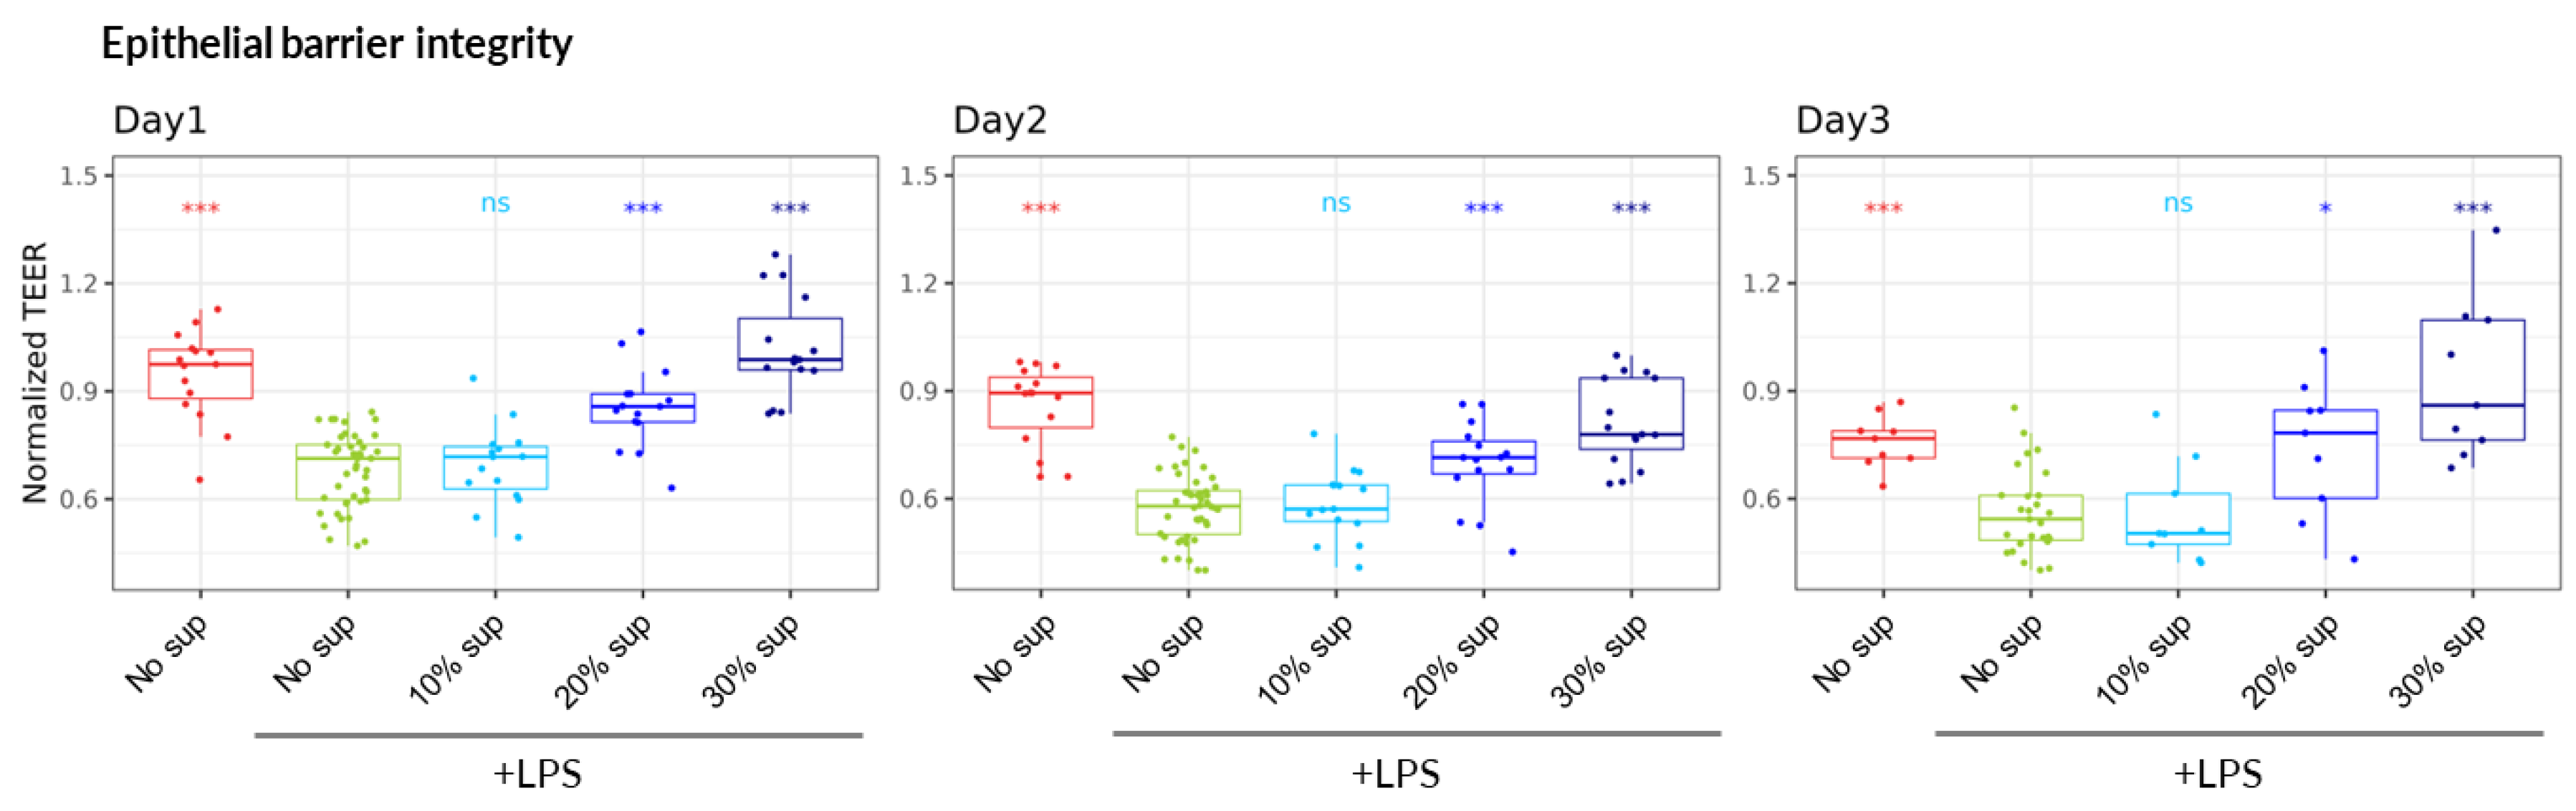
Figure 4.
Protective effect of the tested probiotics. Non-parametric Wilcoxon test was performed in comparison to “Control medium, +LPS” treatment while *, ** and *** represent statistical significance with p-value < 0.05, 0.01, and 0.001, respectively. (A) TEER values during the 3 days of the experiment normalized to Day0 just before the addition of LPS-stimulated (or non-stimulated) PBMC (7 PBMC donors, N=3, n=21). (B) Relative change in IL-8 concentration in Lumen (left) and Basal (right) channels 3 days upon LPS-stimulated (or non-stimulated) PBMC administration normalized PBMC “Control medium” without LPS treatment (4 PBMC donors, N=3, n=12).
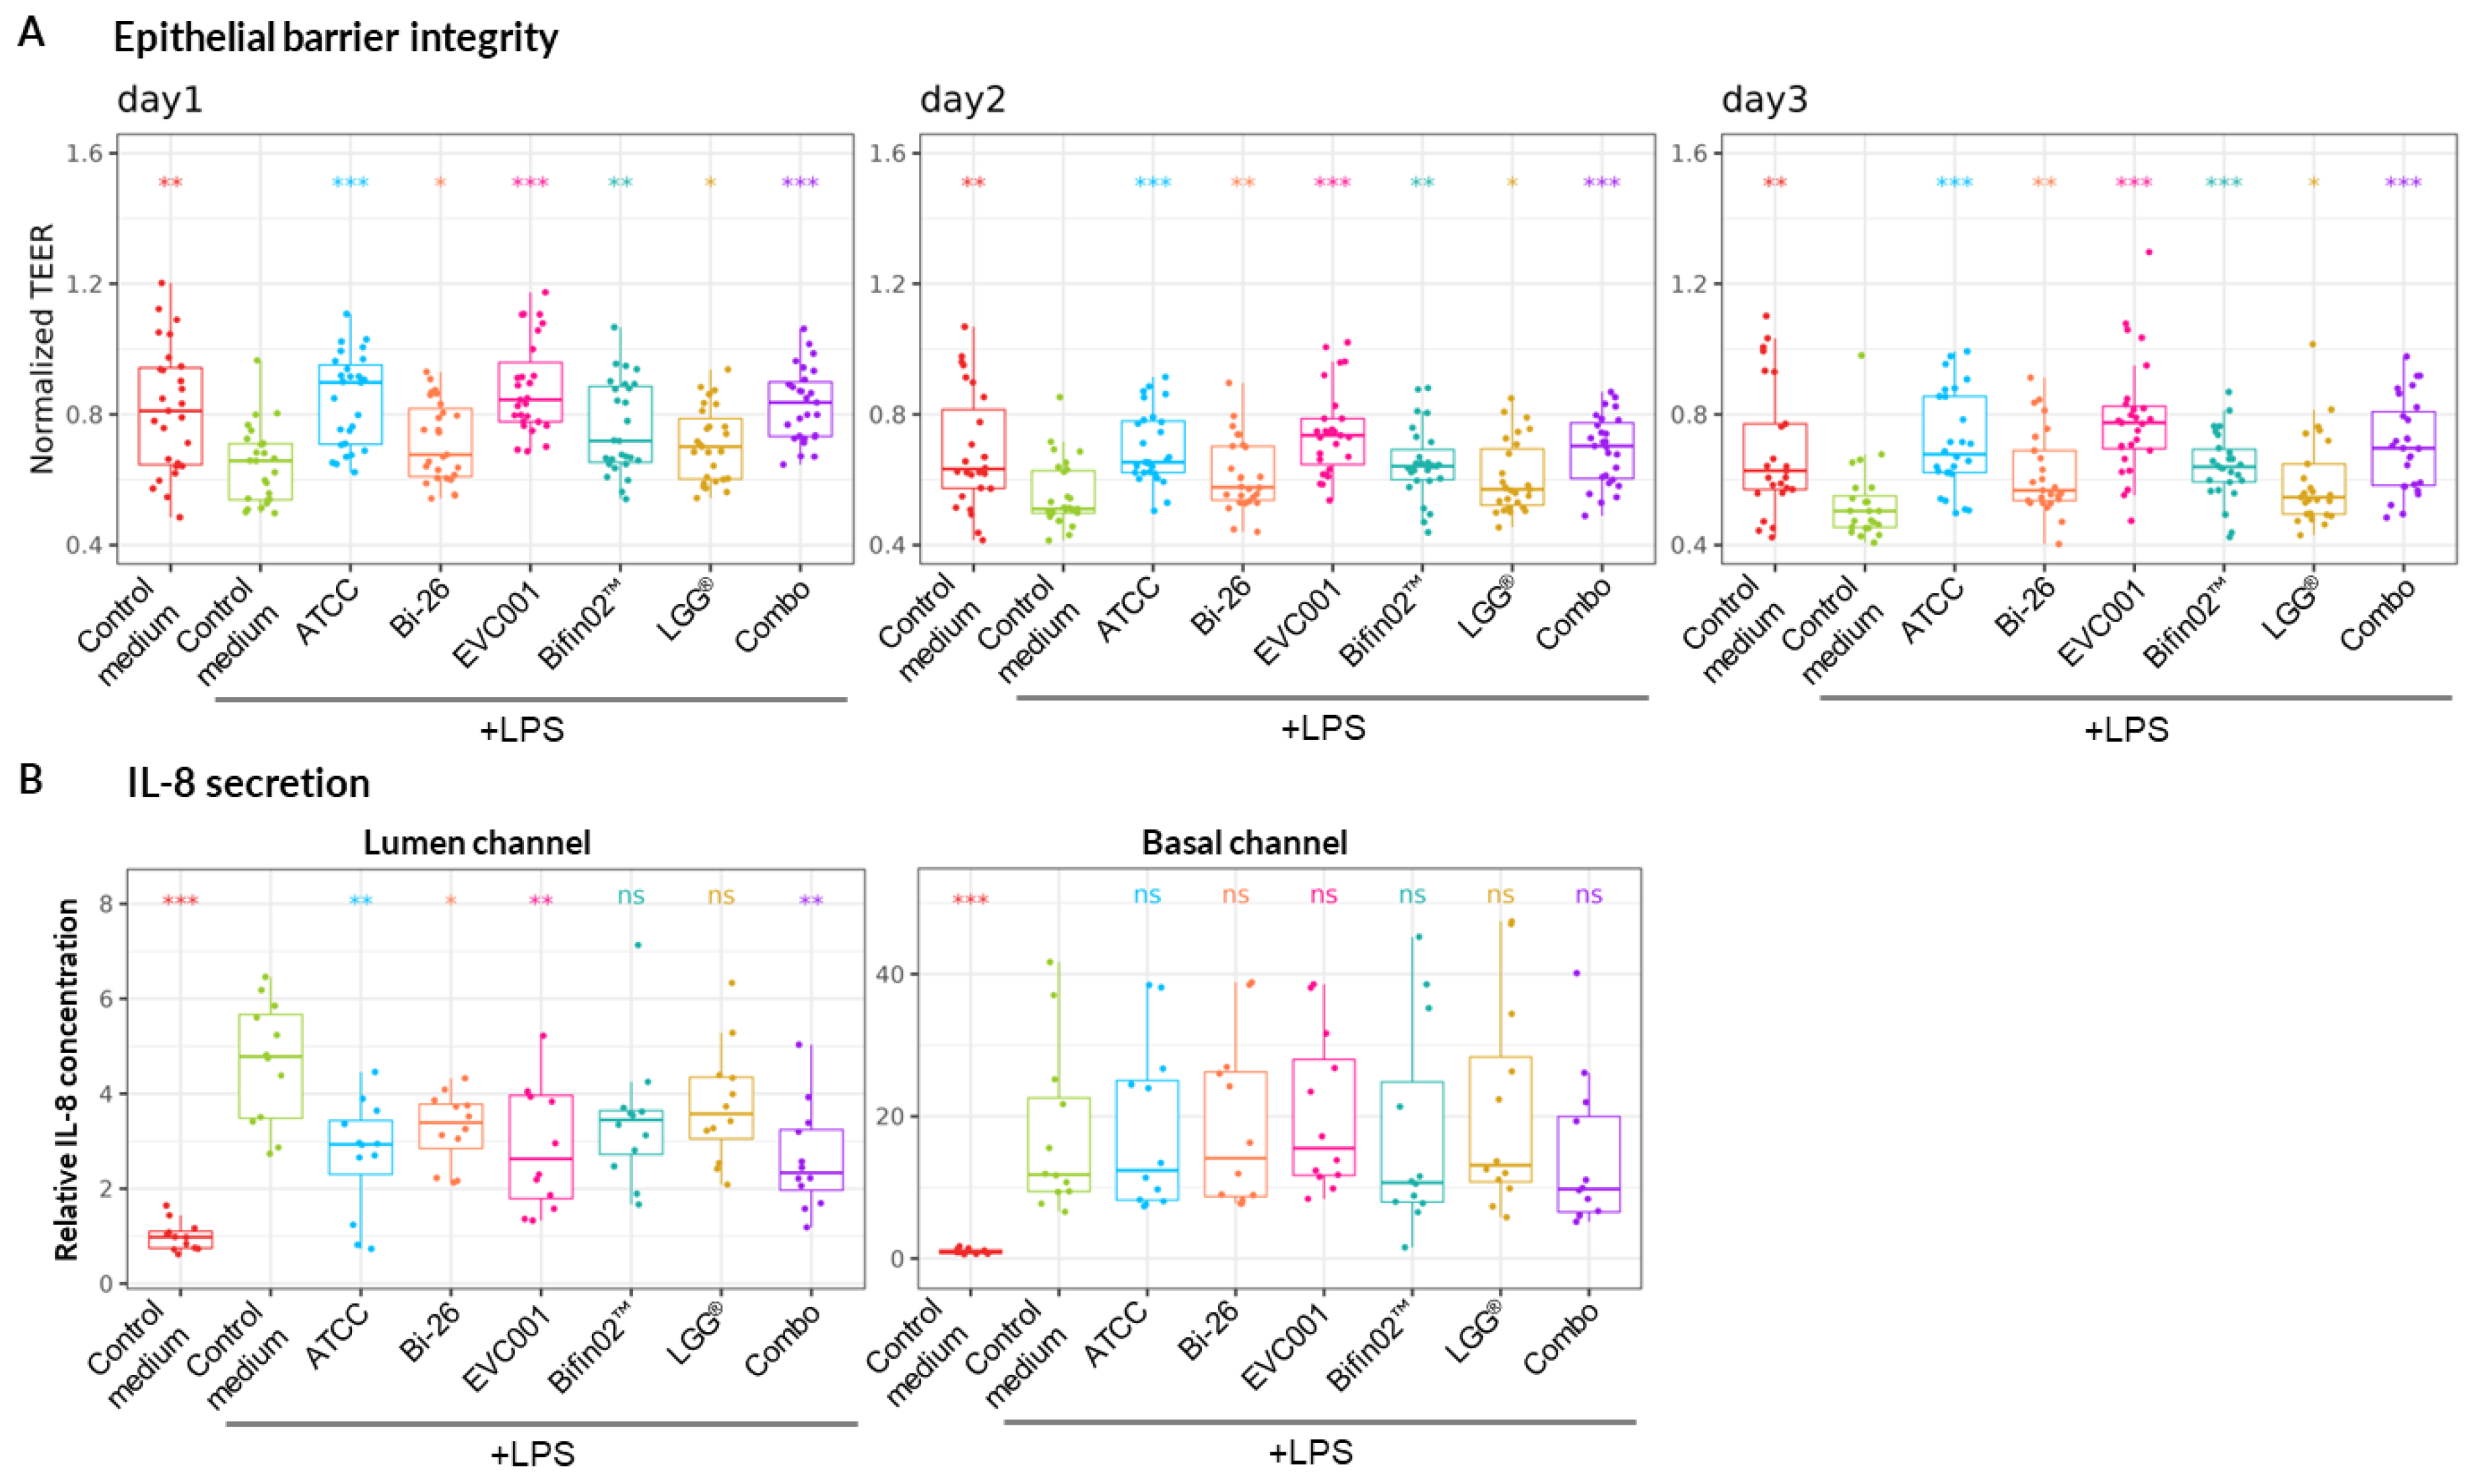
Figure 5.
SCFA and Tryptophane metabolites produced by probiotics in comparison to the fresh medium. Relative change in concentration of the tested metabolites is plotted only if the Descriptive Power (DP) > 2.5.
Figure 5.
SCFA and Tryptophane metabolites produced by probiotics in comparison to the fresh medium. Relative change in concentration of the tested metabolites is plotted only if the Descriptive Power (DP) > 2.5.
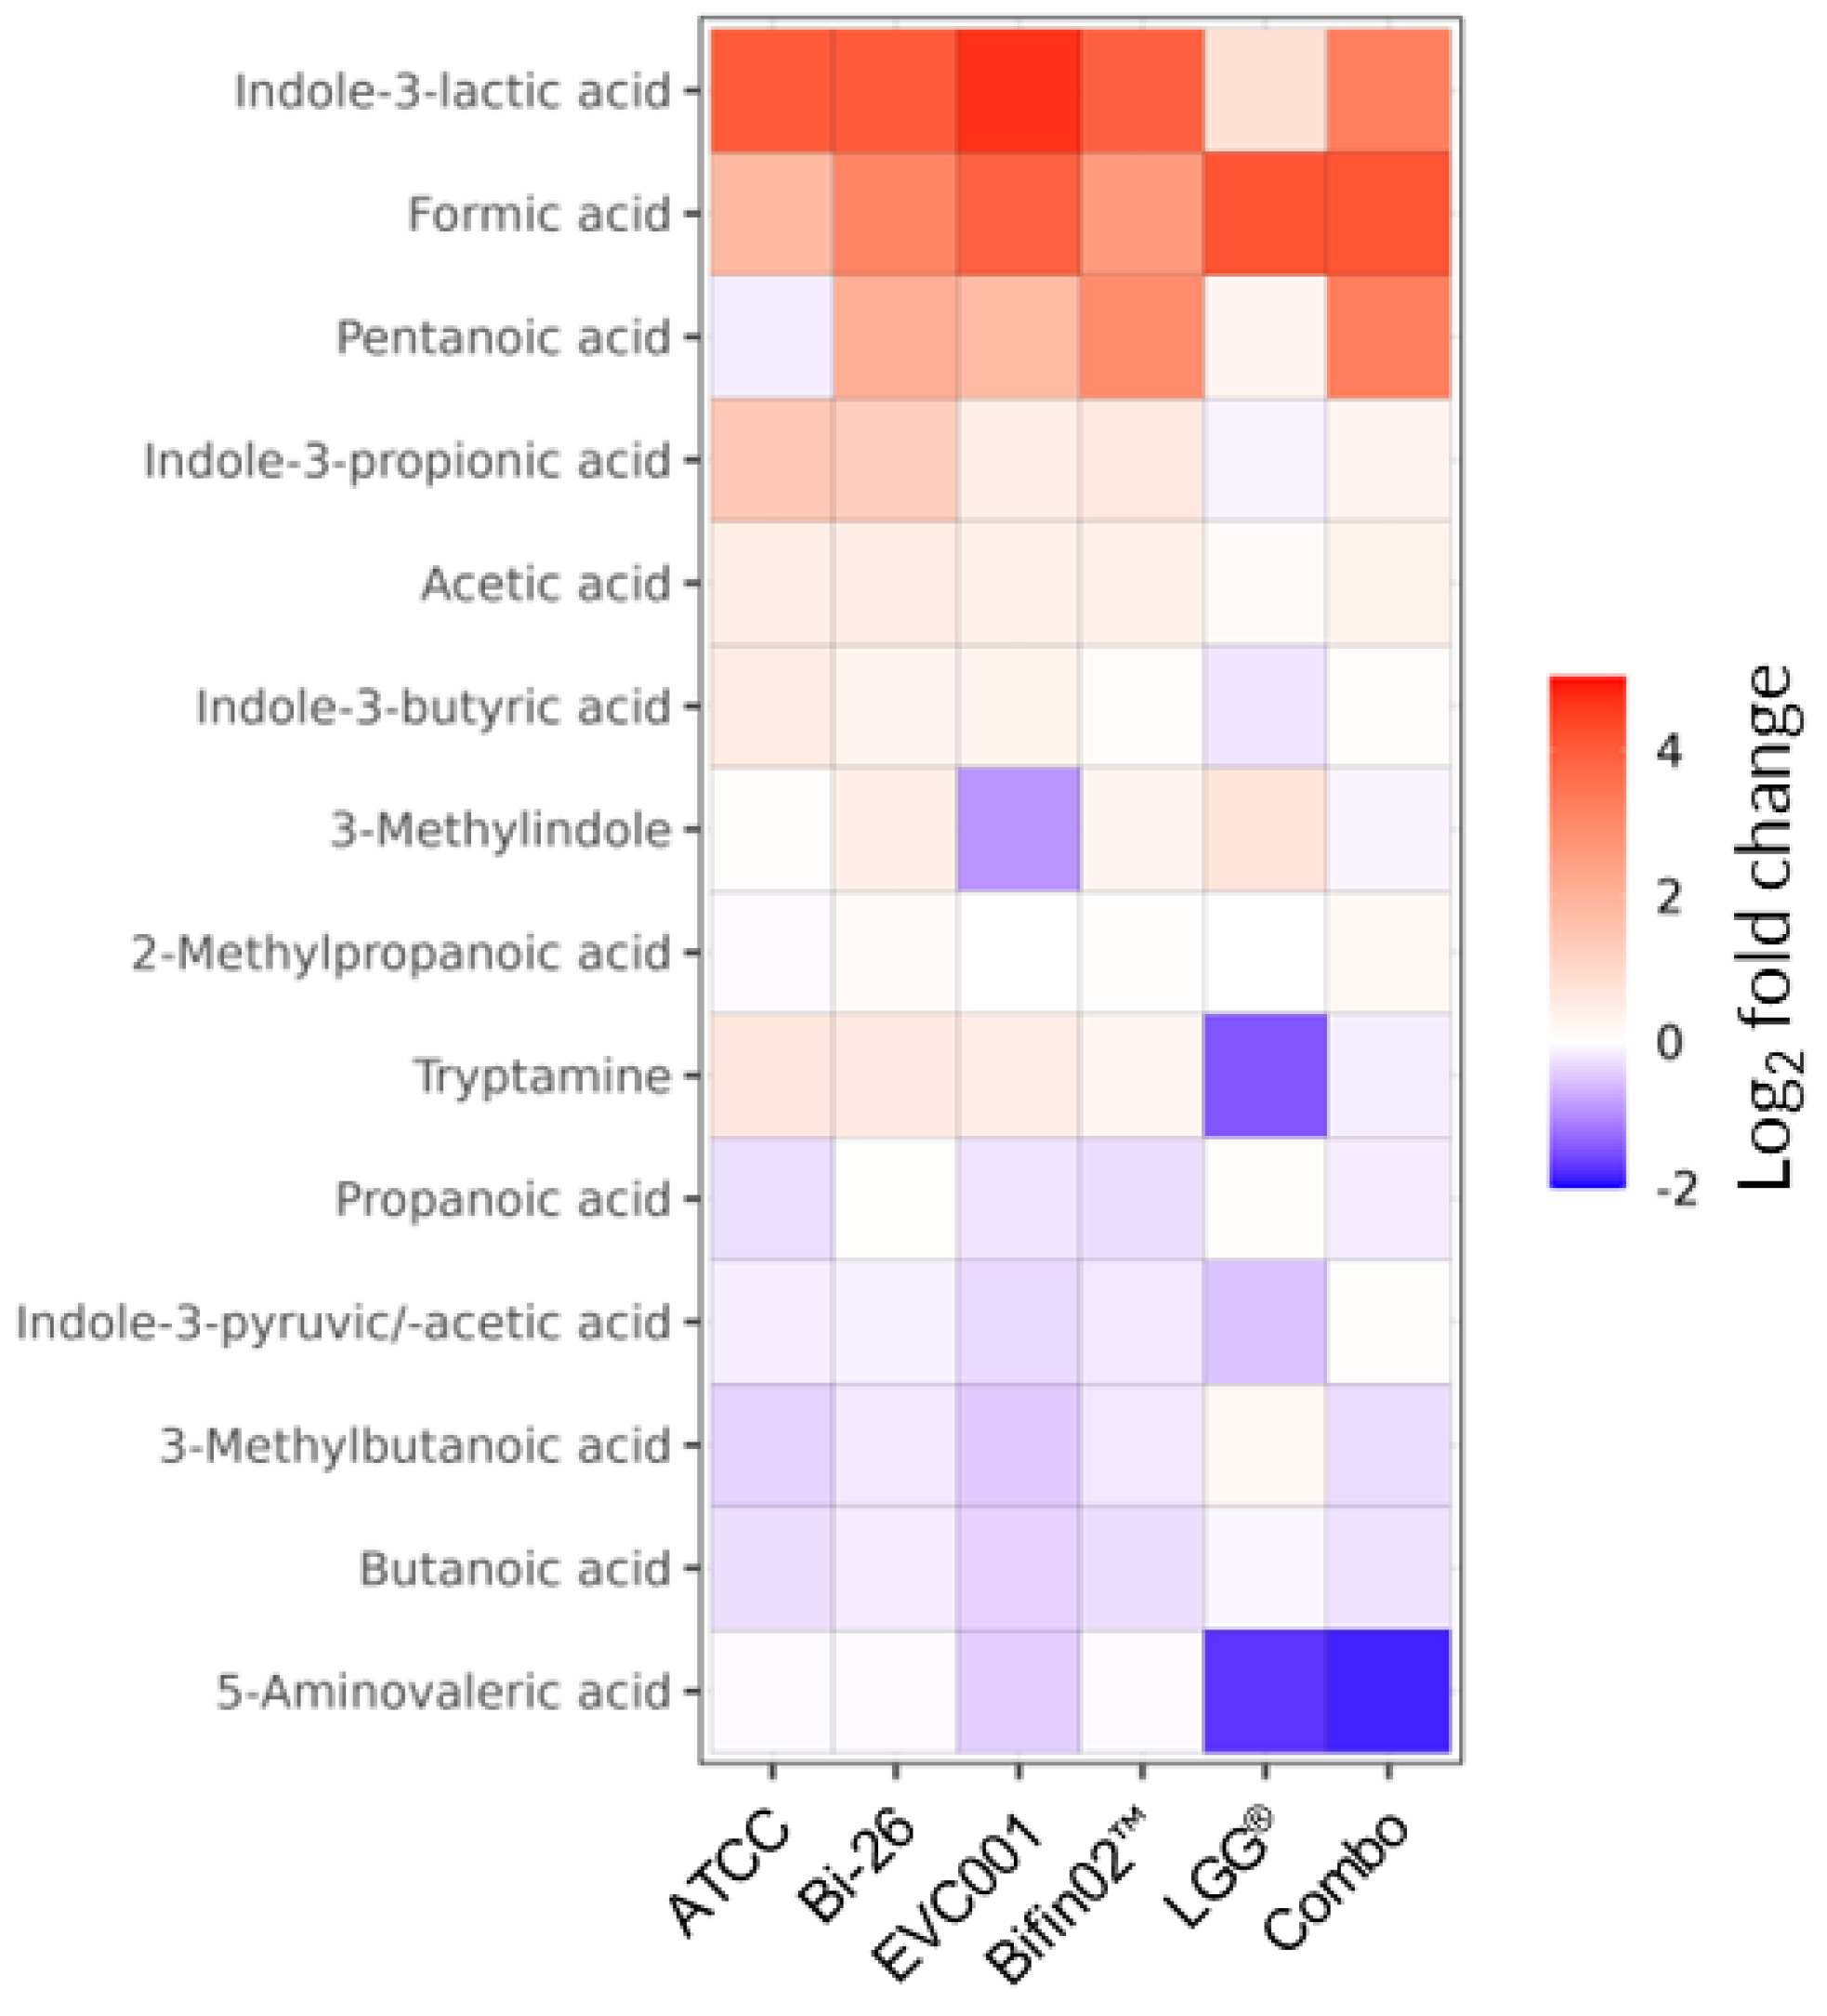
Figure 6.
Probiotic impact on cytokine secretion. Non-parametric Wilcoxon test was performed comparing each treatment to “Control medium, +LPS” while *, ** and *** represent statistical significance with p-value < 0.05, 0.01, and 0.001, respectively (6 PBMC donors, N=3, n=18). Relative change in cytokines concentration in Lumen and Basal channels 3 days upon LPS-stimulated (or non-stimulated) PBMC administration.
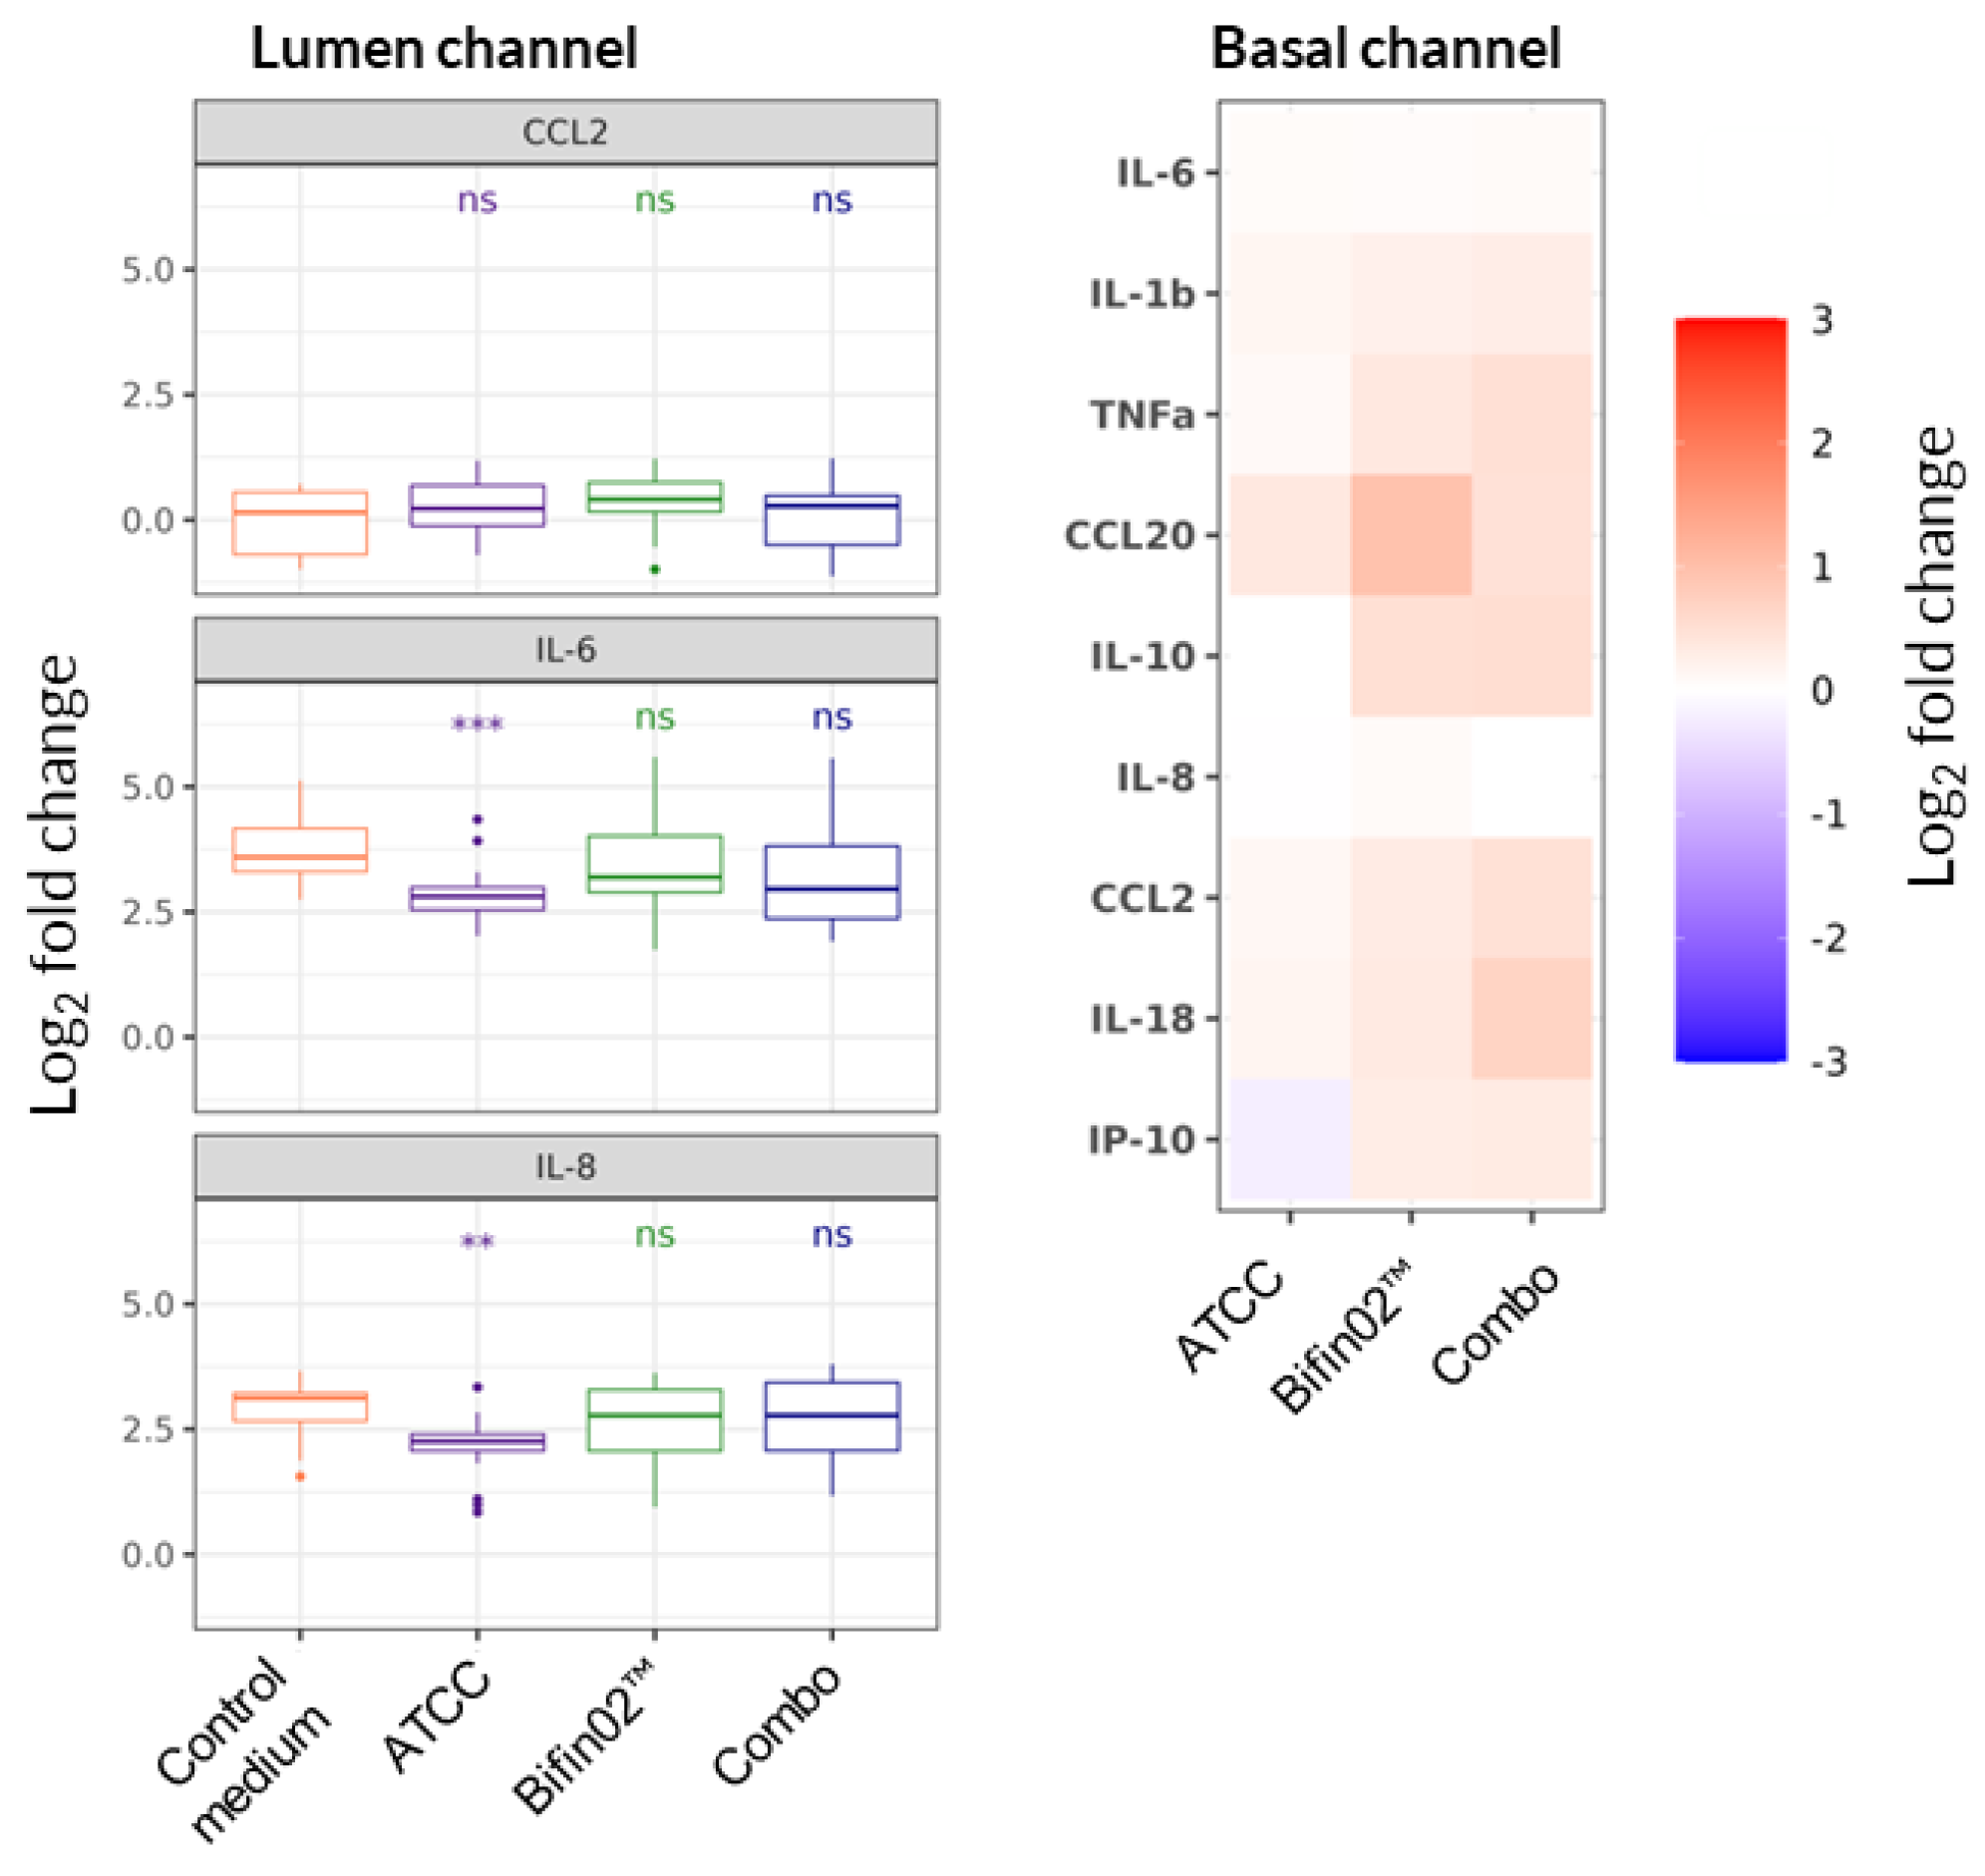
Figure 7.
Effect of probiotics on epithelial cell gene transcription. Relative gene expression of Caco-2 on Day 3 of the experiment compared to the control medium with LPS treatment using non-parametric Wilcoxon test while *, ** and *** represent statistical significance with p-value < 0.05, 0.01, and 0.001, respectively (6 PBMC donors, N=3, n=18).
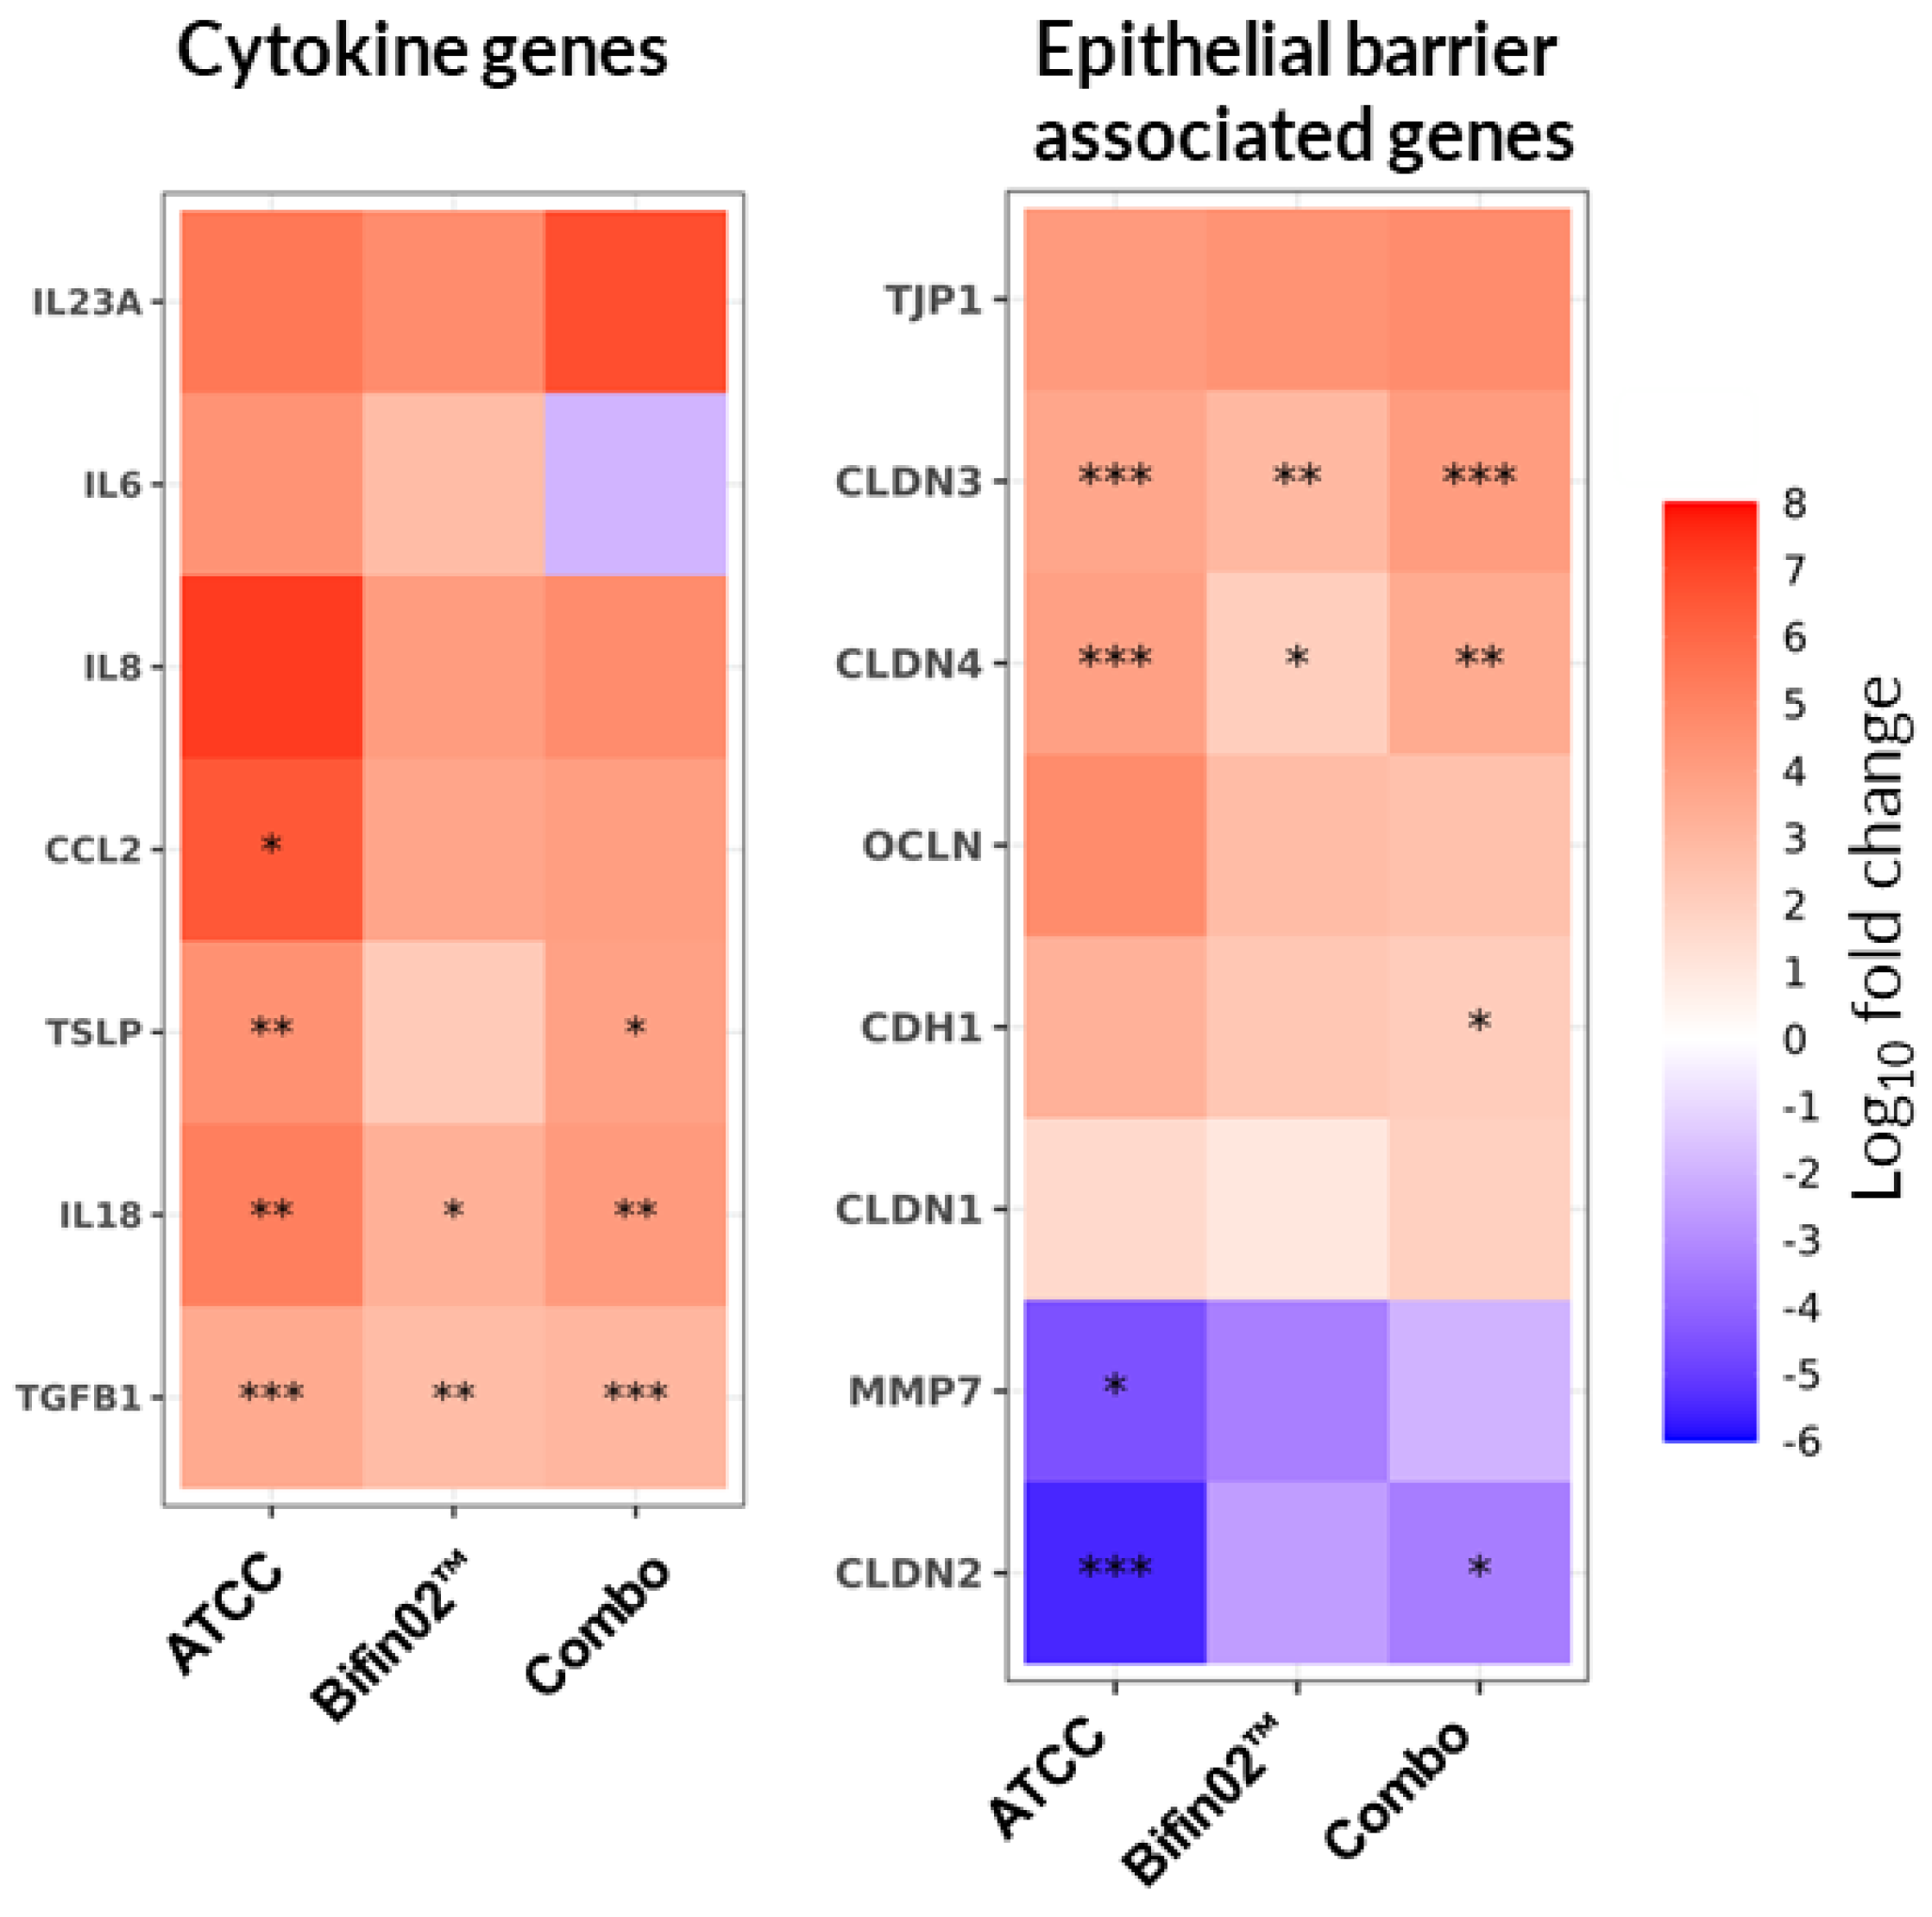

Table 1.
Bacteria growth.
 |
Disclaimer/Publisher’s Note: The statements, opinions and data contained in all publications are solely those of the individual author(s) and contributor(s) and not of MDPI and/or the editor(s). MDPI and/or the editor(s) disclaim responsibility for any injury to people or property resulting from any ideas, methods, instructions or products referred to in the content. |
© 2025 by the authors. Licensee MDPI, Basel, Switzerland. This article is an open access article distributed under the terms and conditions of the Creative Commons Attribution (CC BY) license (http://creativecommons.org/licenses/by/4.0/).
Copyright: This open access article is published under a Creative Commons CC BY 4.0 license, which permit the free download, distribution, and reuse, provided that the author and preprint are cited in any reuse.


