
Submitted:
25 September 2025
Posted:
25 September 2025
You are already at the latest version
Abstract
Background/Objectives: Serve speed in tennis can be influenced by physical strength and toss kinematics, yet their interaction remains unclear in junior athletes. This study investigated how toss-related variables (zenith height, impact height, and zenith–impact differential) relate to shoulder rotation strength and serve speed in junior tennis players. Methods: Thirteen nationally ranked junior male players (mean age: 15.8 ± 0.9 years; body mass: 65.9 ± 5 kg; height: 181 ± 7 cm) participated. Isokinetic shoulder internal and external rotation strength (concentric/excentric) were measured at 210°/s and 300°/s. High-speed 3D motion capture (Qualisys) recorded toss zenith, impact height, and zenith–impact differential during flat serves directed into a designated 1 × 2 m target zone. Serve speed was assessed using radar gun. Correlation, mediation, and moderation analyses were conducted. Results: Impact height showed a significant positive correlation with successful (ρ = 0.746, p = 0.003) and unsuccessful serve speed (ρ = 0.776, p = 0.002). Moderation analyses showed that lower variability in impact height (p = 0.043) and in zenith–impact differential (p = 0.048) significantly strengthened the association between shoulder-rotator strength and serve speed. Conclusions: Moderation analyses revealed that lower variability in impact height and in the zenith–impact differential strengthened the relationship between shoulder strength and serve speed. These findings suggest that training should emphasize toss consistency to maximize the translation of shoulder rotation strength into serve speed.
Keywords:
toss kinematics
; biomechanics
; isokinetic strength
1. Introduction
The tennis serve is a crucial component of competitive play, influencing match outcomes by dictating point initiation, player dominance, and rally control [1,2,3]. Serve effectiveness is typically assessed through speed and placement, as these factors determine an opponent’s ability to return the ball successfully [4,5,6,7,8]. Elite male players consistently achieve serve speeds exceeding 200 km/h by utilizing an optimized kinetic chain, in which force is sequentially transferred from the lower limbs through the trunk and upper extremity to the racket head [9,10]. Disruptions in this coordinated sequence, including inconsistencies in ball toss execution, may necessitate compensatory movements that can negatively affect power transfer and accuracy [11,12,13,14]. Therefore, understanding the factors contributing to serve performance is essential for advancing biomechanical knowledge and guiding evidence-based training approaches.
A stable and precise ball toss is essential for serve consistency, as it directly influences both power generation and shot accuracy [15,16,17]. Key biomechanical factors such as initial toss position, toss height, and overall repeatability determine whether a player can achieve an optimal impact point, ensuring effective timing and kinetic efficiency during ball contact [5,16]. Variability in toss placement may introduce disruptions in force application, requiring last-moment kinematic adjustments in the shoulder, elbow, and wrist, which can reduce energy efficiency and increase the likelihood of unforced errors [17]. These challenges are particularly pronounced in junior players, who tend to exhibit greater variability in toss execution [18], potentially affecting serve accuracy, velocity, and overall performance consistency [19,20]. Consequently, identifying specific toss-related metrics linked to successful serving can provide targeted feedback and drill design strategies for coaches working with developing tennis players.
One promising biomechanical metric from conducted studies is the vertical distance between the toss peak height (ball zenith or zenith height) and the ball’s position at impact (ball impact or impact height). This metric, termed the "zenith–impact differential," reflects the player's ability to initiate and effectively time the kinetic chain [21,22,23]. Greater discrepancies between toss ball zenith and ball impact height may reflect suboptimal temporal coordination or compensatory joint kinematics [24], particularly involving the shoulder and trunk [25,26]. Existing findings are derived from professional female players; hence, further investigation is needed across other populations, such as junior athletes, and into contributing variables. Consequently, the ball impact and zenith–impact differential represent a critical area that may yield deeper technical insights. Although toss quality is consistently associated with serve outcomes [25]. The mediational role of impact height, specifically its connection to strength and performance, remains untested. Given that serve performance is also influenced by upper limb strength, particularly shoulder rotator function, examining how the strength parameters interact with kinematic variables is essential.
Previous research has established a significant positive correlation between concentric isokinetic shoulder rotation strength [12,27,28], particularly at 210°/s, and serve speed in junior tennis players [29]. Anthropometric characteristics such as player height, total body mass, and limb length have also been shown to correlate with serve velocity due to biomechanical advantages related to leverage and force production capabilities [9,30]. Specifically, previous findings have indicated that increased upper limb muscle mass significantly facilitates force transfer during the serve motion [29,31]. Building on this established relationship, the present study examines how shoulder rotator strength translates through kinematic parameters, specifically whether impact height mediates this relationship. Understanding these interdependencies may provide a more transparent biomechanical framework for how strength relates to serve performance and informed targeted training strategies for junior tennis players.
Finally, serve speed and accuracy are key performance indicators in tennis. High serve speed can effectively limit an opponent's ability to return [32], whereas accuracy in hitting defined target zones is equally essential for success. Stable impact height has been linked to improvements in both serve speed and accuracy [22,25,32], yet empirical validation of these relationships in junior players remains scarce. The present study examines the relationships among toss characteristics, specifically zenith height, impact height, and their differential, serve accuracy, serve speed, and isokinetic shoulder strength variables in junior tennis players. It also investigates whether kinematic variables mediate the relationship between shoulder rotator strength and serve speed, and whether potential moderating effects are present. Based on prior evidence, we hypothesize that impact height will mediate the positive relationship between internal shoulder-rotator strength and serve speed in junior tennis players. Furthermore, toss-execution consistency (lower SD of impact height and zenith–impact differential) will moderate the strength–speed relationship such that the positive strength–speed slope is stronger when toss variability is low.
2. Materials and Methods
2.1. Study Design
We conducted a cross-sectional observational study extending our prior work [29] by integrating kinematic analysis of the tennis serve with isokinetic shoulder strength testing. The testing protocol comprised two sessions conducted 24 hours apart (Figure 1). Session one included isokinetic shoulder strength testing, and Session two comprised kinematic analysis of the serve and serve speed assessment. The study was approved by the Faculty of Physical Education and Sport Ethics Committee at Charles University (No. 243/2020) and conducted in accordance with the Declaration of Helsinki. Written informed consent was obtained from all participants and their legal guardians.
2.2. Participants
The study sample comprised thirteen nationally ranked male junior tennis players (mean ± SD: age 15.8 ± 0.9 years; height: 181 ± 7 cm; body mass: 65.9 ± 5 kg; body fat: 17.5 ± 2.2%, eleven right-handed and two left-handed junior tennis players). Body fat percentage was assessed using dual-energy X-ray absorptiometry. The participants in this study were nationally ranked Czech junior tennis players and were actively competing on both national and International Tennis Federation (ITF, ranking 400–800) junior circuits. All players trained approximately five times per week, combining technical, tactical, and physical conditioning sessions at recognized tennis clubs affiliated with national youth sports development programs. Their competitive backgrounds included 8–12 years of training and regular participation in national and ITF junior events. All participants completed one standardized familiarization session with the serve protocol and isokinetic strength protocol prior to testing. Inclusion criteria required participants to be free from performance-limiting injuries or musculoskeletal conditions for at least three months prior to testing.
2.3. Testing Protocol
The testing protocol comprised two separate sessions conducted 24 hours apart (Figure 1) during the competitive off-season period. Session one involved isokinetic strength testing of the dominant arm using a dynamometer (Humac Norm; CSMi, Stoughton, MA, USA) at two angular velocities: 210°/s and 300°/s. Participants performed three maximal-effort repetitions of internal and external shoulder rotations at each velocity, with standardized rest intervals between tests. The order of testing (angular velocity and internal vs. external rotation) was randomized to minimize order effects. All measurements were conducted under standardized indoor conditions at a controlled temperature of 22 ± 1 °C. Session two consisted of kinematic analysis and serve speed measurement. Participants completed a standardized 15-minute dynamic warm-up (see Section 2.4.2 for details), followed by two sets of 20 maximal-effort flat serves toward a defined target area (1 × 2 m) on the deuce side of the court. Serve speed was measured using a calibrated radar gun (Stalker Pro II, Applied Concepts Inc., Richardson, TX, USA) positioned on the baseline with the ball’s trajectory. Kinematic data were collected simultaneously using a calibrated six-camera motion capture system (Qualisys AB, Gothenburg, Sweden) operating at 200 Hz. Both sessions were designed to ensure participant safety, measurement consistency, and data reliability.
2.4. Instruments
This section details the methods and instruments used to measure the isokinetic strength of the shoulder rotators, tennis serve speed, and kinematic variables (zenith height and impact height) in the order in which they were conducted.
2.4.1. Isokinetic Strength Testing of the Shoulder
Isokinetic shoulder strength was assessed using a standard dynamometer (Humac Norm; CSMi, Stoughton, MA, USA) to measure concentric and eccentric internal and external rotations of the dominant (serving) shoulder [33]. Tests were conducted at angular velocities of 210°/s and 300°/s to evaluate peak torque, as these speeds reflect the predominant high-speed muscular contractions characteristic of tennis [27,28,34]. The dynamometer was calibrated at the beginning of each testing day according to the manufacturer’s guidelines to ensure accurate and reliable measurements. Gravity correction was performed prior to each set according to the manufacturer’s guidelines.
Prior to testing, participants completed a comprehensive warm-up to promote muscle readiness and reduce injury risk. This included 5 minutes of general aerobic activity (light jogging with leg swings, arm circles, and trunk rotations), followed by 5 minutes of shoulder-specific movements (low-resistance internal and external rotations at 90° shoulder abduction, 3 × 10 repetitions each, using elastic resistance bands) to prepare the rotator muscles for high-speed contractions [35]. Participants were positioned supine with the shoulder joint aligned with the dynamometer’s axis of rotation, the arm abducted to 90°, and the elbow flexed at 90°. The shoulder was stabilized with custom-made humeral support to ensure reproducibility and reduce trunk motion. This testing position offered both stability and functional relevance, closely resembling the arm position during the tennis serve [27]. The range of motion was individualized, set to 90% of each participant’s maximum external rotation and 65% of their maximum internal rotation, determined during a pre-test assessment to ensure safety while mimicking functional serving mechanics. Each participant performed three consecutive maximal voluntary contractions for both concentric and eccentric muscle actions at each angular velocity, with a 90-second rest between tests at different velocities to minimize fatigue. All tests were supervised by a physiotherapist, who ensured proper technique, alignment, and maximal effort, and who instructed participants to avoid compensatory movements (excessive trunk rotation or shoulder elevation) that could compromise measurement validity. The order of testing (angular velocity and internal vs. external rotation) was randomized to avoid order effects. For each condition, the mean of the peak torque from the three maximal repetitions was calculated and used for statistical analysis.
2.4.2. Serve Speed and Kinematic Variables
Following a standardized 15-minute dynamic warm-up, participants performed the serving protocol. The warm-up aimed to optimize neuromuscular readiness and reduce the risk of acute shoulder injury and consisted of 5 minutes of light aerobic activity (jogging) with dynamic lower-body movements (calf raises, hip hinges, lunges, squats, multidirectional hopping), followed by 10 minutes of upper-body activation targeting the glenohumeral and scapular stabilizers. Resistance band exercises included external and internal rotations at 90° shoulder abductions (3 × 10 repetitions), scapular retractions (3 × 10 reps), and diagonal patterns (3 × 10 reps per arm). To ensure familiarity with the procedure and minimize learning effects, each participant completed five submaximal serves toward the designated target zone prior to testing. The experimental protocol consisted of two series of 20 maximal-effort flat serves, delivered toward the deuce side of the court (right-handed perspective) in accordance with ITF rules. Each series was separated by a 3-minute passive rest and subdivided into four sets of five serves with 30-second rests to reduce fatigue accumulation. Verbal cues emphasized maximal power generation and directional control.
Serve speed was measured using a calibrated radar gun (Stalker Pro II, Applied Concepts Inc., Richardson, TX, USA) positioned on the opposite baseline from the serve side at a height of 1.5 m, directly aligned with the ball trajectory. The target zone was a 1 × 2 m rectangle located 1 m laterally from the center service line and extending 2 m toward the net from the service line, marked with white floor tape. From the 40 recorded serves, the first 10 successful serves (landing within the target zone) and the first 10 unsuccessful serves (landing outside or into the net) were analyzed to enable direct comparison between effective and ineffective executions.
Kinematic data were collected using a calibrated six-camera three-dimensional motion capture system (Qualisys AB, Gothenburg, Sweden) operating at 200 Hz. Calibration included L-frame spatial calibration and static marker set registration prior to each session. Reflective markers were placed at key equipment landmarks: three small circular patches cut from reflective tape were attached to the tennis ball (lightweight and symmetrically distributed to ensure constant visibility during ball rotation while adding negligible mass), and four markers on the racket (tip of the head, each lateral side of the frame, and base of the handle). These facilitated the computation of zenith height, impact height, and zenith–impact differential. The origin of the coordinate system was defined by the marker placed on the dorsal aspect of the fifth metatarsal of the lead foot. All testing was supervised by a three-member research team: one operated the radar gun and provided verbal serve speed feedback, one logged serve outcomes and marker visibility, and one fed balls and monitored rule compliance.
2.5. Data Collection
Primary outcome variables included peak torque values (Nm) for concentric and eccentric internal and external shoulder rotations at angular velocities of 210°/s and 300°/s, obtained from the isokinetic dynamometer. For each condition, the mean peak torque from three maximal trials was calculated and used in subsequent analyses. Serve speed (km/h) was calculated as the mean of the first 10 successful serves (landing within the target zone) and the mean of the first 10 unsuccessful serves (landing outside the target zone or into the net) from each participant. This selection was made to standardize comparisons while minimizing potential effects of fatigue across the 40 recorded serves. Kinematic variables were extracted from three-dimensional motion capture data processed in Qualisys Track Manager (QTM, Qualisys AB, Gothenburg, Sweden). Zenith height was defined as the maximum vertical position (m) of the ball marker during the toss phase, and impact height as the vertical position (m) of the ball marker at the instant of first contact with the racket, identified from synchronized kinematic data. For sensitivity analysis, a normalized impact height was also calculated as impact height normalized = Impact height/height. The zenith–impact differential (m) was computed as the vertical distance between zenith height and impact height. The motion capture system had a spatial accuracy of ±1 mm, and all vertical measurements were referenced to the laboratory coordinate system defined during spatial calibration. All data were time-synchronized, and mean values for each participant were used for statistical analysis.
2.6. Statistical Analysis
All statistical analyses were performed using IBM SPSS Statistics for Windows (version 25.0; IBM Corp., Armonk, NY, USA) and Microsoft Excel 2019 (version 2312; Microsoft Corp., Redmond, WA, USA). Prior to inferential analyses, data distributions were examined for normality using the Shapiro–Wilk test. Given the limited sample size (n = 13) and observed deviations from normality in some variables, bivariate associations were consistently evaluated using Spearman’s rank-order correlation (ρ), with corresponding p-values reported. Correlation analyses assessed the relationships between serve speed (successful and unsuccessful trials), isokinetic shoulder strength (mean peak torque at 210°/s and 300°/s, concentric and eccentric actions), and kinematic variables (zenith height, impact height, zenith–impact differential). Scatter plots with regression lines and 95% confidence bands were generated to aid interpretation.
To address the main hypotheses, three mediation models were tested to evaluate whether kinematic variables mediated the relationship between shoulder internal rotation strength and serve speed: (1) zenith height as mediator, (2) impact height as mediator, and (3) zenith–impact differential as mediator. Analyses were conducted using the PROCESS macro for SPSS (Model 4.3) with bias-corrected bootstrapping (1000 samples) to generate 95% confidence intervals for indirect effects [36]. In additional analysis, players' height was included as a covariate to control for anthropometric differences. All variables were standardized prior to mediation to facilitate effect size interpretation. Moderation analyses were conducted to examine whether toss consistency (standard deviation of zenith height, impact height, or zenith–impact differential) moderated the relationship between shoulder strength and serve speed. The PROCESS macro was used to test interaction terms (shoulder strength × toss variability). Significant interactions were probed with simple slopes analysis at ±1 SD of the moderator. No correction for multiple testing was applied, as the analyses were hypothesis-driven and involved a small number of planned contrasts.
Due to the limited sample size (n = 13), we conducted a sensitivity power analysis using G*Power (version 3.1.9.7) for all planned tests. In the case of (Exact) bi-variate correlations, with α = 0.05 and β = 0.20 (80% power) for a two-tailed test, the minimum detectable effect size was ρ ≥ 0.69. Thus, only correlations at or above this magnitude could be reliably detected in the present sample.
3. Results
Descriptive statistics for all key variables are summarized in Table 1. On average, successful serves reached 162.65 ± 8.03 km/h, while unsuccessful serves reached 161.16 ± 7.70 km/h. Mean zenith height was 3.404 ± 0.243 m for successful and 3.397 ± 0.253 m for unsuccessful serves (Δ≈0.007 m). Mean impact height was 2.680 ± 0.128 m (successful) and 2.677 ± 0.116 m (unsuccessful), and the zenith–impact differential averaged 0.724 ± 0.189 m and 0.720 ± 0.190 m, respectively, indicating only minimal between-condition differences.
3.1. Correlation Analysis Between Kinematics Variables and Isokinetic Strength or Serve Speed
Since several variables deviated from normality (Shapiro–Wilk), Spearman’s ρ was used for bivariate associations. For successful serves, impact height showed a strong positive association with serve speed (ρ = 0.746, p = 0.003, n = 13; Table 2). When impact height was normalized to player height (impact height/height), this association remained significant (ρ = 0.627, p = 0.022, n = 13), indicating that the relationship is not solely driven by anthropometric differences. In contrast, zenith height (ρ = 0.289, p = 0.338) and the zenith–impact differential (ρ = −0.217, p = 0.476) were not significant. Correlations between isokinetic strength and serve speed were non-significant (all p ≥ 0.094).
The same pattern emerged for kinematic variables in unsuccessful serves. Impact height correlated positively and significantly with serve speed (ρ = 0.776, p = 0.002; Table 3). When impact height was normalized to player height (impact height/height), the association weakened and did not reach significance (ρ = 0.518, p = 0.070, n = 13), suggesting that part of the raw relationship is attributable to body height. In contrast, zenith height (ρ = 0.269, p = 0.375) and the zenith–impact differential (ρ = −0.030, p = 0.921) were non-significant. Two strength variables showed significant positive associations with serve speed: internal rotation eccentric 210°/s (ρ = 0.615, p = 0.025) and external rotation eccentric 300°/s (ρ = 0.601, p = 0.030); all other strength–speed correlations were non-significant.
Across both conditions, no isokinetic strength variable correlated significantly with any kinematic variable (Table 2 and Table 3). Overall, these findings indicate that impact height consistently relates to serve speed, whereas shoulder-rotator strength shows limited direct associations with kinematic variables. This pattern motivated the subsequent mediation and moderation analyses to test whether kinematic variables, particularly impact height and their variability, act as a mechanistic or conditional link between strength and serve speed.
3.2. Graphical Representation of the Results
Scatterplots (Figure 2 and Figure 3) illustrate the association between serve speed and impact height. In absolute terms (Figure 2), there is a clear positive linear relationship for both successful (Figure 2a) and unsuccessful (Figure 2b) serves. The fitted OLS lines had similar positive slopes and comparable fit (R² ≈ 0.62 and 0.60, respectively). Note that OLS lines are descriptive; inference is based on Spearman’s ρ. This indicates that higher contact points are generally associated with faster serves, irrespective of serve outcome. When impact height was normalized to player stature (Figure 3), the same positive trend remained evident, suggesting that the relationship is not solely driven by differences in body height. The correlations reported in Section 3.1 confirmed significant positive associations for both absolute and relative impact height. Together, these analyses strengthen the interpretation that contacting the ball higher relative to one’s body height is consistently linked with greater serve velocity. Given the small sample (n = 13), the confidence bands are relatively wide, and the relationships should be interpreted cautiously as associative, not causal.
Figure 4 presents the linear relationships between eccentric internal shoulder rotation strength and impact height during successful serve attempts, evaluated at two angular velocities: 210°/s (left panel) and 300°/s (right panel). In both conditions, the regression models indicate a positive association, suggesting that players with greater eccentric shoulder strength tend to reach higher impact points. Despite the positive slopes, the relatively low R² values indicate weak linear associations in both cases. These findings imply that while eccentric shoulder strength may support higher impact contact positions, it alone cannot sufficiently explain this outcome.
3.3. Mediation Analyses
To examine whether kinematic parameters transmit the association between strength and performance, we specified three simple mediation models with internal shoulder rotation strength (eccentric, 210°/s) as the predictor (X) and serve speed as the outcome (Y). Each model entered one kinematic mediator (M) in turn: impact height, zenith height, or the zenith–impact differential. All variables were standardized (β coefficients are directly comparable). Indirect effects (a×b) were estimated using bootstrap resampling (1,000 iterations; two-tailed 95% CIs). In the a-path notation, “a” is the effect of X on M, “b” is the effect of M on Y controlling for X, and “c′” is the direct effect of X on Y controlling for M (Figure 5).
Successful serves. In the model with impact height, the a-path was positive but non-significant (β = 0.450, p = 0.123), whereas the b-path was positive and significant (β = 0.699, p = 0.008). Thus, players contacting the ball higher tended to achieve higher serve speeds even after accounting for shoulder strength, but shoulder strength itself did not reliably predict impact height. The indirect effect was a×b = 0.315 with 95% CI [−0.083, 0.737] (bootstrap two-tailed p = 0.124), and the direct effect c′ was small and non-significant (β = 0.193, p = 0.380). For the other mediators, indirect effects were likewise non-significant: zenith height (a = −0.015; b = 0.397; a×b = −0.006; 95% CI [−0.396, 0.334]) and zenith–impact differential (a = −0.324; b = 0.149; a×b = −0.048; 95% CI [−0.234, 0.365]).
Unsuccessful serves. With impact height as mediator, coefficients were a = 0.331 and b = 0.654, yielding an indirect effect a×b = 0.217 with 95% CI [−0.173, 0.681] (non-significant); the direct effect c′ was positive but non-significant (β = 0.360). Mediation via zenith height and zenith–impact differential was also non-significant.
Across models, none of the indirect-effect confidence intervals excluded zero, indicating that in this sample the tested kinematic variables did not reliably mediate the strength–speed relationship. Practically, although higher impact height is directly associated with greater serve speed (significant b-path), internal eccentric shoulder rotator strength did not consistently lead to a higher impact height (non-significant a-path). When players' height was added as a covariate, the indirect effect of impact height remained non-significant and further attenuated (successful serves: β_indirect ≈ 0.09; unsuccessful serves: β_indirect ≈ −0.03). Thus, no evidence of mediation was found even after controlling players' height.
3.4. Moderation Analyses
We tested whether toss consistency moderates the association between internal shoulder rotation strength (eccentric, 210°/s) and serve speed. Toss consistency was operationalized as the standard deviation (SD) of impact height and the zenith–impact differential. All predictors were standardized prior to model estimation; interaction terms were probed with simple slopes at ±1 SD of the moderator.
Successful serves. The interaction between strength and impact-height variability was significant (β_int = −0.417, p = 0.043, R² = 0.551). Simple slopes showed a strong, positive strength–speed association under low variability (−1 SD; β = 1.03, p = 0.015), but a weak, non-significant association under high variability (+1 SD; β = 0.19, p = 0.488). Likewise, the interaction with zenith–impact differential variability was significant (β_int = −0.493, p = 0.048, R² = 0.533). Simple slopes again indicated a robust positive association at low variability (−1 SD; β = 1.22, p = 0.012) that attenuated at high variability (+1 SD; β = 0.24, p = 0.384). These patterns (Figure 6) indicate that greater toss variability diminishes the extent to which shoulder-rotator strength translates into ball speed during successful serves. Unsuccessful serves. No interaction terms reached significance (all p > 0.25), suggesting that, for unsuccessful trials, toss variability did not materially alter the relation between strength and serve speed.
The negative interaction coefficients (β_int < 0) consistently show that higher toss variability weakens the otherwise positive link between internal eccentric rotation strength and serve speed. Practically, consistent toss execution appears necessary for players to convert shoulder strength into faster serves. Given the small sample size (n = 13), this moderation effect should be interpreted with caution. Nevertheless, it is theoretically consistent and supported by the simple-slope pattern.
4. Discussion
The present study extended prior work on shoulder rotation strength and serve speed relationship in junior tennis players by adding toss-phase kinematics to the analysis [29]. Guided by kinetic-chain models that emphasize sequential force transfer and timing over static positions [9,10], and by reports linking toss quality to serve outcomes [15,16,17,25], we hypothesized that a higher impact height and a smaller zenith–impact differential would benefit performance, with impact height serving as a proximal biomechanical checkpoint. Our findings partially supported this hypothesis: impact height showed a robust positive association with serve speed in both successful and unsuccessful serves. This association remained significant when impact height was normalized to the player's height for successful serves, indicating that the link is not purely anthropometric. For unsuccessful serves, the effect weakened after normalization, supporting the importance of consistency of execution. By contrast, zenith height and the zenith–impact differential were not directly related to serve speed in this sample. In this respect, our data suggests that not all toss kinematics contribute directly to serve speed in junior tennis players. A pattern that is broadly consistent with observations in elite junior players reported no significant associations between these kinematic variables and serve velocity [37], while partly diverging from those findings by showing an impact height effect here. The primary hypothesis of mediation through impact height was not supported. Instead, toss consistency was found to moderate the expression of shoulder strength in serve speed.
4.1. Association Between Kinematic Toss Variables and Shoulder Rotation Strength or Serve Speed
Correlation analyses provided further insights into the interplay between shoulder strength, kinematic parameters, and serve speed. As expected, concentric internal rotation strength of the dominant shoulder showed a positive correlation with serve speed across both angular velocities tested (210°/s and 300°/s). This is consistent with prior reports of significantly greater dominant arm internal rotation torque compared to the non-dominant arm in elite junior tennis players [27] .
Consistent with prior work on toss quality/consistency and contact-point characteristics [13,15,16,17,25,32], impact height showed a positive association with serve speed for successful and unsuccessful serves in our sample of junior tennis players. Because taller players tend to reach higher contact points and serve faster [9,30], we checked that when the impact height was normalized to players' height, the association remained significant for successful serves, indicating a technical component beyond anthropometry. By contrast, zenith height and the zenith–impact differential were not significantly related to serve speed, and none of the kinematic variables showed a reliable association with accuracy under the present binary definition (successful vs. unsuccessful). Taken together, these results support the view that the location of ball–racket contact is determinant of racket-head velocity, whereas toss geometry per se has limited predictive value unless integrated into a well-timed kinetic sequence [3,23,24]. Finally, no isokinetic strength variable correlated with the kinematic metrics (impact height, zenith height, and zenith-impact differential), suggesting that the influence of shoulder-rotator strength on performance emerges through coordination and execution consistency rather than through simple mapping onto contact geometry.
4.2. The Mediating Role of Impact Height
We originally posited impact height as a plausible biomechanical mediator transmitting the effect of internal shoulder-rotator strength to serve speed, consistent with kinetic-chain accounts of proximal-to-distal energy flow and with evidence that contact-point characteristics are closely tied to serve outcomes [3,13,21,23,24,32]. In junior cohorts, higher impact height has been associated with faster serve speed and related to strength capacities, particularly lower-limb power, supporting the rationale for a strength–impact height–serve speed pathway [38]. In our models, the b-path from impact height to speed (controlling strength) was significant, but the a-path from strength to impact height was not, yielding a non-significant indirect effect (a×b). Thus, while a higher contact point was directly associated with faster serves (and remained so when impact height was normalized to players' height for successful serves, we did not find evidence that greater shoulder strength reliably produces a higher impact point in this cohort. Mechanistically, this is coherent with the view that a higher contact point reduces the need for compensatory trunk/arm adjustments and supports coordinated timing within the kinetic chain [15,21,24], yet achieving that favorable contact still depends on how the motion is organized rather than on isolated torque alone [3,23,24].
Importantly, the present findings suggest a shift in emphasis for practice: rather than focusing on toss geometry in isolation, technical work should prioritize consistently attaining an efficient, elevated impact point, the proximal determinant of racket-head speed, while strength and power training are integrated to support that contact under repeatable timing [13,15,24,32]. In our data, this integration is echoed by the moderation results. When toss-execution consistency is high (lower SD of impact height or the zenith–impact differential), the positive strength–speed slope is expressed. Together, these patterns refine the mediation hypothesis that impact height matters for serve speed, but in this sample, it did not mediate the strength–speed link. Rather, execution consistency appears to be the conditional factor that allows shoulder-rotator strength to translate into faster serves. Importantly, the mediation effect of impact height did not reach significance even when players' height was statistically controlled. This suggests that the non-significant mediation was not an artifact of anthropometric differences but rather reflects the limited contribution of impact height as an intermediary between shoulder strength and serve speed in this junior cohort.
4.3. Toss Execution Consistency as a Moderator
Moderation analyses showed that toss variability (operationalized as the SD of impact height and of the zenith–impact differential across trials) significantly moderated the strength-speed association for successful serves. Specifically, simple-slopes tests indicated a positive strength–speed slope under low variability but a flat, non-significant slope under high variability. In practical terms, greater toss consistency amplifies the translation of shoulder-rotator strength into ball speed, whereas erratic kinematic execution dampens or nullifies this translation. This pattern aligns with work linking toss consistency and contact-point control to serve outcomes and with kinetic-chain accounts emphasizing that high racket-head speed emerges from repeatable timing and coordinated proximal-to-distal sequencing, not from isolated torque alone [8,22]. These findings also help reconcile mixed strength–speed correlations by indicating that strength is necessary but not sufficient: without stable toss execution, its effect on speed can be attenuated [28]. Collectively, the moderation results highlight toss-execution consistency as a conditional amplifier that enables available shoulder-rotator strength to manifest as higher serve speed. In the context of junior tennis players, who often display greater motor control variability, these results underscore the importance of stable toss mechanics in realizing strength-based performance advantages.
4.4. Successful Versus Unsuccessful Serves
Across conditions, serve speed and impact height were nearly identical (successful vs. unsuccessful: impact height ≈ 2.680 m vs. 2.677 m), indicating that neither serve speed nor vertical contact point alone discriminated serve outcome in this cohort. The only kinematic difference was a slightly higher toss zenith in successful serves (≈ +0.7 cm on average), which yielded a trivially larger zenith–impact differential. Although some frameworks would predict that a smaller zenith–impact gap reflects more efficient timing [15,25], the magnitude of the observed differences here was small, suggesting that vertical geometry by itself is unlikely to determine success at this developmental stage. Rather, success likely depends on how contact is organized in space and time (racket-face orientation, lateral toss placement, and location-specific kinematics), factors not captured by our vertical-only metrics [21,32]. This interpretation is consistent with evidence that toss consistency and contact-point control relate to serve outcomes [15,21,25], and that spatial characteristics (aiming/location patterns) contribute to success beyond ball speed per se [32]. Methodologically, our binary accuracy definition (first 10 successful vs. first 10 unsuccessful serves) may also have limited sensitivity relative to continuous placement error, and the predefined target zone could have attenuated variance. Together with our moderation results, where toss-execution consistency conditioned the translation of strength into speed for successful serves, these findings suggest that precision and repeatability in temporal-spatial execution (not simply higher speed or higher contact) are pivotal for converting physical capacity into successful serve outcomes in junior players [3,21,24,32].
4.5. Practical Applications
Our results reinforce a kinetic-chain view of the serve, in which racket-head speed emerges from repeatable, well-timed proximal-to-distal sequencing rather than from isolated joint torque [3,23,24]. The contact point (impact height) appears to be a proximal indicator of serve speed, whereas toss geometry per se has limited predictive value unless it supports achieving a stable, elevated impact height [13,15,21,25,32]. Finally, the observed moderation by toss-execution consistency indicates that strength is necessary, but its effective translation into serve speed requires sufficient stability of the technical execution. The translation of available shoulder-rotator strength into ball speed is amplified when variability in impact height or the zenith–impact differential is low [4,11,22]. Coaching should therefore pair shoulder rotation strength with contact-point stabilization (targeting a higher, more repeatable impact height) and toss-consistency drills, aligning technical practice with the kinetic-chain requirements for high-velocity serve. For monitoring, we recommend tracking impact height and variability of impact height and the zenith–impact differential as actionable markers of technical consistency and readiness to express strength in speed.
4.6. Limitations of the Study
This study has several limitations that should be considered when interpreting the findings. First, the sample was small and homogeneous (n = 13 nationally ranked junior males), which reduces power. A priori sensitivity indicated that only relatively large correlations (ρ ≥ 0.69) can be detected with 80% power. Given the small sample (n = 13) and correspondingly wide CIs, these mediation findings should be interpreted cautiously and viewed as hypothesis-generating for larger studies. Second, the design was cross-sectional. As such, the observed relationships cannot establish causality (whether increases in strength lead to higher impact points or faster serves). Third, measurement choices prioritize control over ecological validity. Isokinetic testing in a supine position with the shoulder at 90° abduction (ROM set to 90% ER and 65% IR) and test velocities of 210°/s and 300°/s do not replicate the ballistic, stretch–shortening dynamics and joint angular velocities of a live serve. Using the mean of three trials may also under-represent a player’s true peak capacity. Conversely, our kinematic model focused on vertical metrics (zenith height, impact height, zenith–impact differential). We did not quantify lateral/anterior–posterior toss displacement, time-to-impact, or temporal coupling with segmental rotations. All variables that likely contribute to contact quality. Motion capture at 200 Hz is adequate for toss but is near the lower bound for pinpointing impact events; small timing errors could add noise to impact height estimates. Although the radar was aligned with the ball trajectory, cosine error cannot be fully excluded. Fourth, operationalization of performance may have constrained sensitivity. Accuracy was treated as binary (successful vs. unsuccessful) within a predefined target zone. Continuous placement error might detect subtler effects. We analyzed the first 10 successful and first 10 unsuccessful serves from 40 attempts. While this standardized sample size across players, it may introduce selection/order effects and reduce the amount of trial-level data available for estimating within-player variability. Fifth, confounding and collinearity remain concerns. Body height correlates with impact height and serve speed, which can inflate bivariate associations. We addressed this by reporting height-normalized impact height, but residual confounding by other dimensions (e.g., limb segment lengths) is possible.
5. Conclusions
Impact height showed a robust positive association with serve speed. However, mediation of the relationship between shoulder-rotator strength and serve speed via impact height was not statistically supported, whereas toss-execution consistency significantly moderated this link (for successful serves). Practically, training should focus on stabilizing and elevating the impact point and reducing toss variability to better convert shoulder-rotator strength into ball speed.
Author Contributions
Conceptualization, M.V. and P.S.; methodology, M.V., J.V. and J.M.; software, J.V. and M.V.; validation, M.V. and P.S.; formal analysis, M.V. and J.M.; investigation, J.V., J.S., V.O. and M.V.; resources, M.V. and J.V.; data curation, J.V. and M.V.; writing—original draft preparation, M.V.; writing—review and editing, M.V., J.S., V.O. and J.M.; visualization, M.V. and J.M.; supervision, P.S.; project administration, J.V. and M.V.; funding acquisition, P.S. All authors have read and agreed to the published version of the manuscript.
Funding
Supported by the Charles University Cooperatio Program, research area Sport Sciences – Biomedical and Rehabilitation Medicine, and by UNCE24/SSH/012.
Institutional Review Board Statement
This study conformed to ethical sports and health research standards and received approval from the Faculty of Physical Education and Sport Ethics Committee, Charles University (No. 243/2020), on 3 November 2020. All procedures were conducted following the Declaration of Helsinki.
Informed Consent Statement
Informed consent was obtained from all subjects involved in this study, and because the participants were minors, consent was provided by their legal guardians prior to participation.
Data Availability Statement
The associated dataset for all performed analyses is available at the Open Science Framework [OSF] repository URL: https://osf.io/f5gdr/?view_only=8d53ca16ed444351841ee8a0edd3e2d9 (accessed on 2 August 2025).
Conflicts of Interest
The authors declare no conflicts of interest.
References
- Elliott, B.; Marsh, T.; Blanksby, B. A Three-Dimensional Cinematographic Analysis of the Tennis Serve. International Journal of Sport Biomechanics 1986, 2, 260–271. [Google Scholar] [CrossRef]
- Roetert, E.P.; Kovacs, M.; Knudson, D.; Groppel, J.L. Biomechanics of the Tennis Groundstrokes: Implications for Strength Training. Strength Cond J 2009, 31, 41–49. [Google Scholar] [CrossRef]
- Abrams, G.D.; Sheets, A.L.; Andriacchi, T.P.; Safran, M.R. Review of Tennis Serve Motion Analysis and the Biomechanics of Three Serve Types with Implications for Injury. Sports Biomech 2011, 10, 378–390. [Google Scholar] [CrossRef]
- Martin, C.; Kulpa, R.; Delamarche, P.; Bideau, B. Professional Tennis Players’ Serve: Correlation between Segmental Angular Momentums and Ball Velocity. Sports Biomech 2013, 12, 2–14. [Google Scholar] [CrossRef]
- Zhu, Z. Research on Sports Biomechanics Based on Tennis Serve Technique. In Proceedings of the 5th International Conference on Machinery, Materials and Computing Technology; 2017; Vol. 126; pp. 1333–1338. [Google Scholar]
- Hizan, H.; Whipp, P.; Reid, M. Comparison of Serve and Serve Return Statistics of High Performance Male and Female Tennis Players from Different Age-Groups. Int J Perform Anal Sport 2011, 11, 365–375. [Google Scholar] [CrossRef]
- Carboch, J.; Tufano, J.J.; Süss, V. Ball Toss Kinematics of Different Service Types in Professional Tennis Players. Int J Perform Anal Sport 2018, 18, 881–891. [Google Scholar] [CrossRef]
- Brito, A. V; Fonseca, P.; Costa, M.J.; Cardoso, R.; Santos, C.C.; Fernandez-fernandez, J.; Fernandes, R.J. The Influence of Kinematics on Tennis Serve Speed : An In-Depth Analysis Using Xsens MVN Biomech Link Technology. Bioengineering 2024, 11, 971. [Google Scholar] [CrossRef] [PubMed]
- Bonato, M.; Maggioni, M.A.; Rossi, C.; Rampichini, S.; Torre, A. Relationship between Anthropometric or Functional Characteristics and Maximal Serve Velocity in Professional Tennis Players. Journal of sports medicine and physical fitness 2015, 55, 1157–1165. [Google Scholar] [PubMed]
- Cui, Y.; Gómez, M.Á.; Gonçalves, B.; Sampaio, J. Performance Profiles of Professional Female Tennis Players in Grand Slams. PLoS One 2018, 13, 1–18. [Google Scholar] [CrossRef] [PubMed]
- Bahamonde, R.E. Changes in Angular Momentum during the Tennis Serve. J Sports Sci 2000, 18, 579–592. [Google Scholar] [CrossRef]
- Baiget, E.; Corbi, F.; Fuentes, J.P.; Fernández-Fernández, J. The Relationship Between Maximum Isometric Strength and Ball Velocity in the Tennis Serve. J Hum Kinet 2016, 53, 63–71. [Google Scholar] [CrossRef] [PubMed]
- Baiget, E.; Corbi, F.; López, J.L. Influence of Anthropometric, Ball Impact and Landing Location Parameters on Serve Velocity in Elite Tennis Competition. Biol Sport 2023, 40, 273–281. [Google Scholar] [CrossRef] [PubMed]
- Colomar, J.; Baiget, E.; Corbi, F. Influence of Strength, Power, and Muscular Stiffness on Stroke Velocity in Junior Tennis Players. Front Physiol 2020, 11, 1–9. [Google Scholar] [CrossRef]
- Elliott, B. Biomechanics and Tennis. Br J Sports Med 2006, 40, 392–396. [Google Scholar] [CrossRef] [PubMed]
- Hartoto, S.; Al Ardha, M.A.; Firmansyah, A.; Prakoso, B.B.; Pratama, S.A.; Bana, P. Biomechanics Analysis of Arm Flexion Isometric Force, Upper Extremity Movement, and Ball Toss Position Towards Ball Speed in Tennis Flat Serve. Proceedings of the International Joint Conference on Arts and Humanities 2021 (IJCAH 2021) 2022, 618, 388–393. [Google Scholar] [CrossRef]
- Otsuka, E.; Fujii, N. Biomechanical Case Study on Toss up Motion in Tennis Serve. In Proceedings of the ISBS-Conference Proceedings Archive; 2014; pp. 452–455. [Google Scholar]
- Whiteside, D.; Elliott, B.; Lay, B.; Reid, M. A Kinematic Comparison of Successful and Unsuccessful Tennis Serves across the Elite Development Pathway. Hum Mov Sci 2013, 32, 822–835. [Google Scholar] [CrossRef]
- Whiteside, D.; Elliott, B.; Lay, B.; Reid, M. The Effect of Age on Discrete Kinematics of the Elite Female Tennis Serve. J Appl Biomech 2013, 29, 573–582. [Google Scholar] [CrossRef]
- Reid, M.; Elliott, B.; Whiteside, D. Task Decomposition and the High Performance Junior Tennis Serve. International Symposium on Biomechanics in Sports: Conference Proceedings Archive 2010, 28, 1–4. [Google Scholar]
- Reid, M.; Whiteside, D.; Elliott, B. Serving to Different Locations: Set-up, Toss, and Racket Kinematics of the Professional Tennis Serve. Sports Biomech 2011, 10, 407–414. [Google Scholar] [CrossRef]
- Jacquier-Bret, J.; Gorce, P. Kinematics of the Tennis Serve Using an Optoelectronic Motion Capture System: Are There Correlations between Joint Angles and Racket Velocity? Sensors 2024, 24. [Google Scholar] [CrossRef]
- Fleisig, G.; Nicholls, R.; Elliott, B.; Escamilla, R. Tennis: Kinematics Used by World Class Tennis Players to Produce High-velocity Serves. Sports Biomech 2003, 2, 51–64. [Google Scholar] [CrossRef] [PubMed]
- Elliott, B.C. The Tennis Serve: A Biomedical Perspective. Sports Medicine 1988, 6, 285–294. [Google Scholar] [CrossRef]
- Whiteside, D.; Giblin, G.; Reid, M. Redefining the Spatial Consistency in the Ball Toss of the Professional Female Tennis Serve. Proceedings of the 32nd International Conference of Biomechanics in Sports 2014, 181–185. [Google Scholar]
- Landlinger, J.; Lindinger, S.J.; Stöggl, T.; Wagner, H.; MüLler, E. Kinematic Differences of Elite and High-Performance Tennis Players in the Cross Court and down the Line Forehand. Sports Biomech 2010, 9, 280–295. [Google Scholar] [CrossRef]
- Ellenbecker, T.; Roetert, E.P. Age Specific Isokinetic Glenohumeral Internal and External Rotation Strength in Elite Junior Tennis Players. J Sci Med Sport 2003, 6, 63–70. [Google Scholar] [CrossRef]
- Ölmez, C.; Hammami, N.; Apaydın, N.; Hattabi, S.; Şar, H.; Khezami, M.A.; İnce, A. Is Isokinetic Shoulder Strength a Determinant of Serve Ball Velocity in Tennis? Sports Biomech 2024. [Google Scholar] [CrossRef]
- Vacek, J.; Vagner, M.; Malecek, J.; Stastny, P. Tennis Serve Speed in Relation to Isokinetic Shoulder Strength, Height, and Segmental Body Mass in Junior Players. J Funct Morphol Kinesiol 2025, 10. [Google Scholar] [CrossRef]
- Sánchez-Pay, A.; Ramón-Llin, J.; Martínez-Gallego, R.; Sanz-Rivas, D.; Sánchez-Alcaraz, B.J.; Frutos, S. Fitness Testing in Tennis: Influence of Anthropometric Characteristics, Physical Performance, and Functional Test on Serve Velocity in Professional Players. PLoS One 2021, 16, 1–13. [Google Scholar] [CrossRef] [PubMed]
- Kraemer, W.J.; Hakkinen, K.; Travis Triplett-mcbride, N.; Fry, A.C.; Perry Koziris, L.; Ratamess, N.A.; Bauer, J.E.; Volek, J.S.; Mcconnell, T.; Newton, R.U.; et al. Physiological Changes with Periodized Resistance Training in Women Tennis Players. Med. Sci. Sports Exerc 2003, 35, 157–168. [Google Scholar] [CrossRef] [PubMed]
- Whiteside, D.; Reid, M. Spatial Characteristics of Professional Tennis Serves with Implications for Serving Aces: A Machine Learning Approach. J Sports Sci 2017, 35, 648–654. [Google Scholar] [CrossRef]
- Ellenbecker, T.S.; Davies, G.J.; Rowinski, M.J. Concentric versus Eccentric Isokinetic Strengthening of the Rotator Cuff: Objective Data versus Functional Test. Am J Sports Med 1988, 16, 64–69. [Google Scholar] [CrossRef]
- Ellenbecker, T.S. A Total Arm Strength Isokinetic Profile of Highly Skilled Tennis Players. Isokinet Exerc Sci 1991, 1, 9–21. [Google Scholar] [CrossRef]
- Ellenbecker, T.S.; Roetert, E.P. Testing Isokinetic Muscular Fatigue of Shoulder Internal and External Rotation in Elite Junior Tennis Players. Journal of Orthopedic & Sports Physical Therapy 1999, 29, 275–281. [Google Scholar]
- Hayes, A.F. Introduction to Mediation, Moderation, and Conditional Process Analysis: A Regression-Based Approach; 3rd ed.; New York, 2022; ISBN 9788578110796.
- Fett, J.; Oberschelp, N.; Vuong, J.L.; Wiewelhove, T.; Ferrauti, A. Kinematic Characteristics of the Tennis Serve from the Ad and Deuce Court Service Positions in Elite Junior Players. PLoS One 2021, 16, 1–14. [Google Scholar] [CrossRef] [PubMed]
- Koya, N.; Kitamura, T.; Takahashi, H. The Relationship between Service Performance and Physical Strength Focusing on Speed and Spin Rate in Japanese Elite Junior Tennis Players. Int. j. racket sports sci 2021, 3, 10–20. [Google Scholar] [CrossRef]
Figure 1.
Overview of the testing protocol.
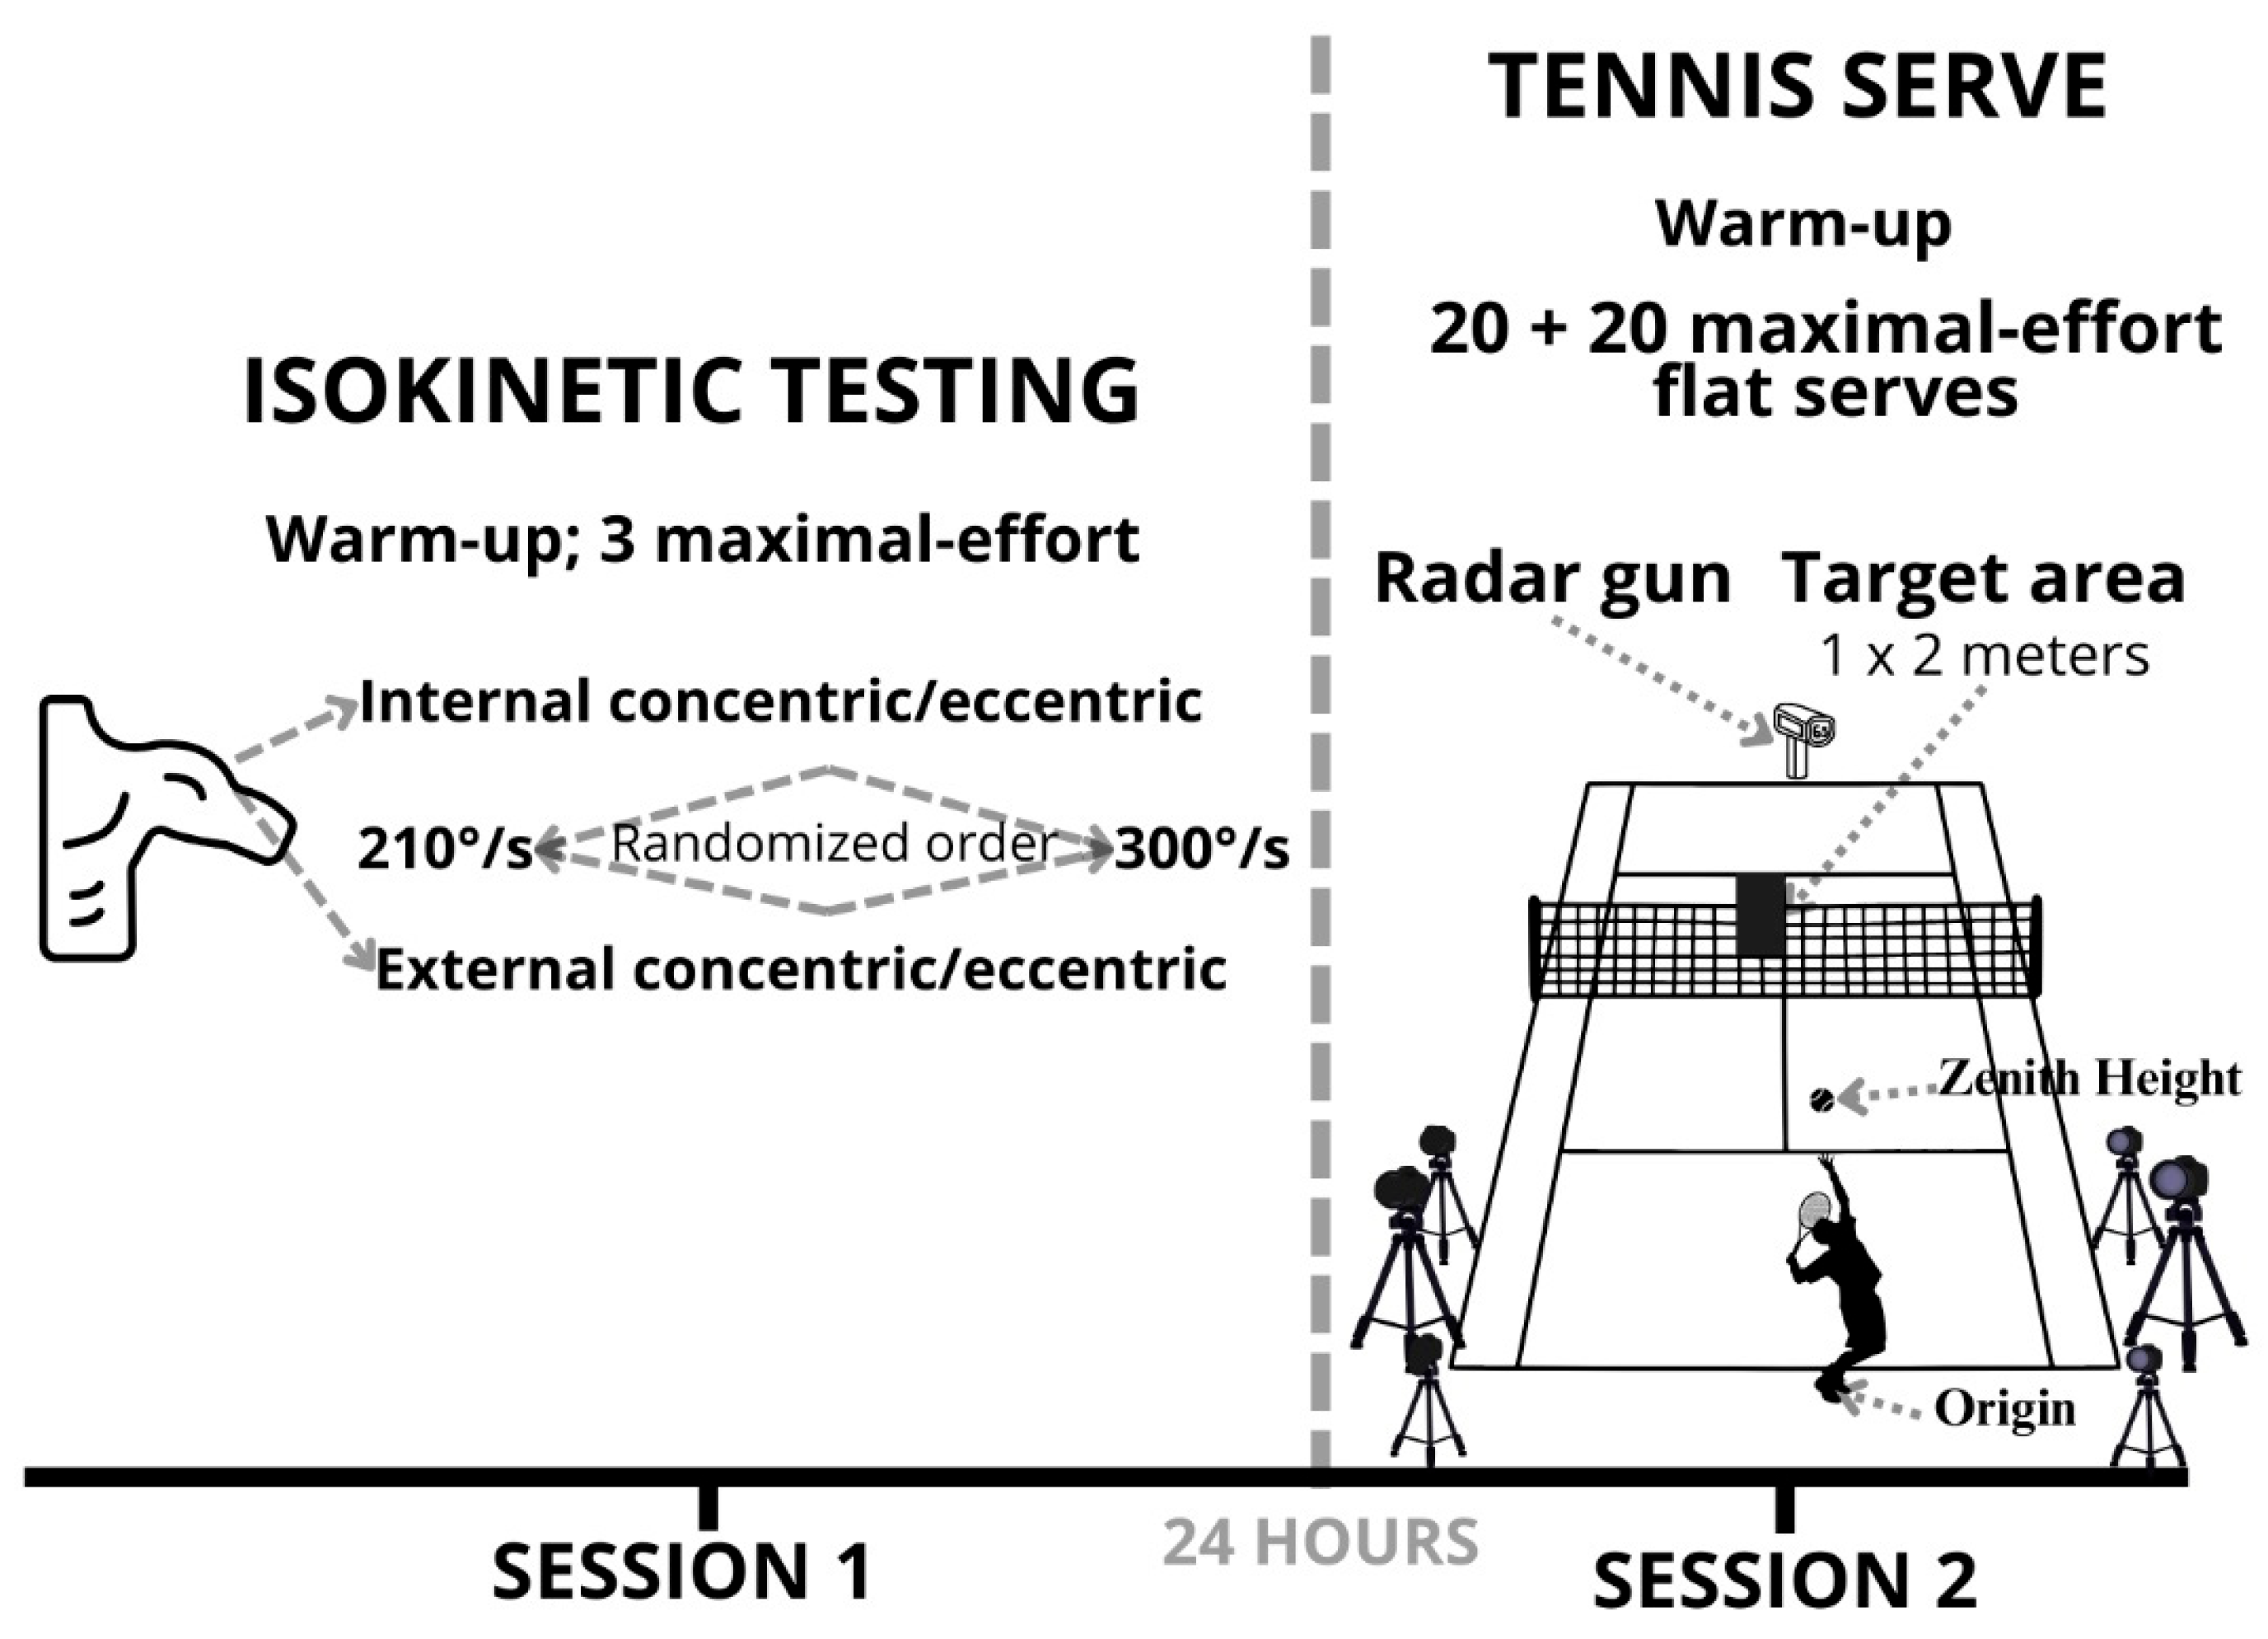
Figure 2.
Relationship between serve speed and impact height: (a) successful; (b) unsuccessful serves. Each dot represents a participant's mean (first 10 serves in the given category). The solid line shows the OLS linear fit + 95% CI. Note that OLS lines are descriptive; inference is based on Spearman’s ρ.
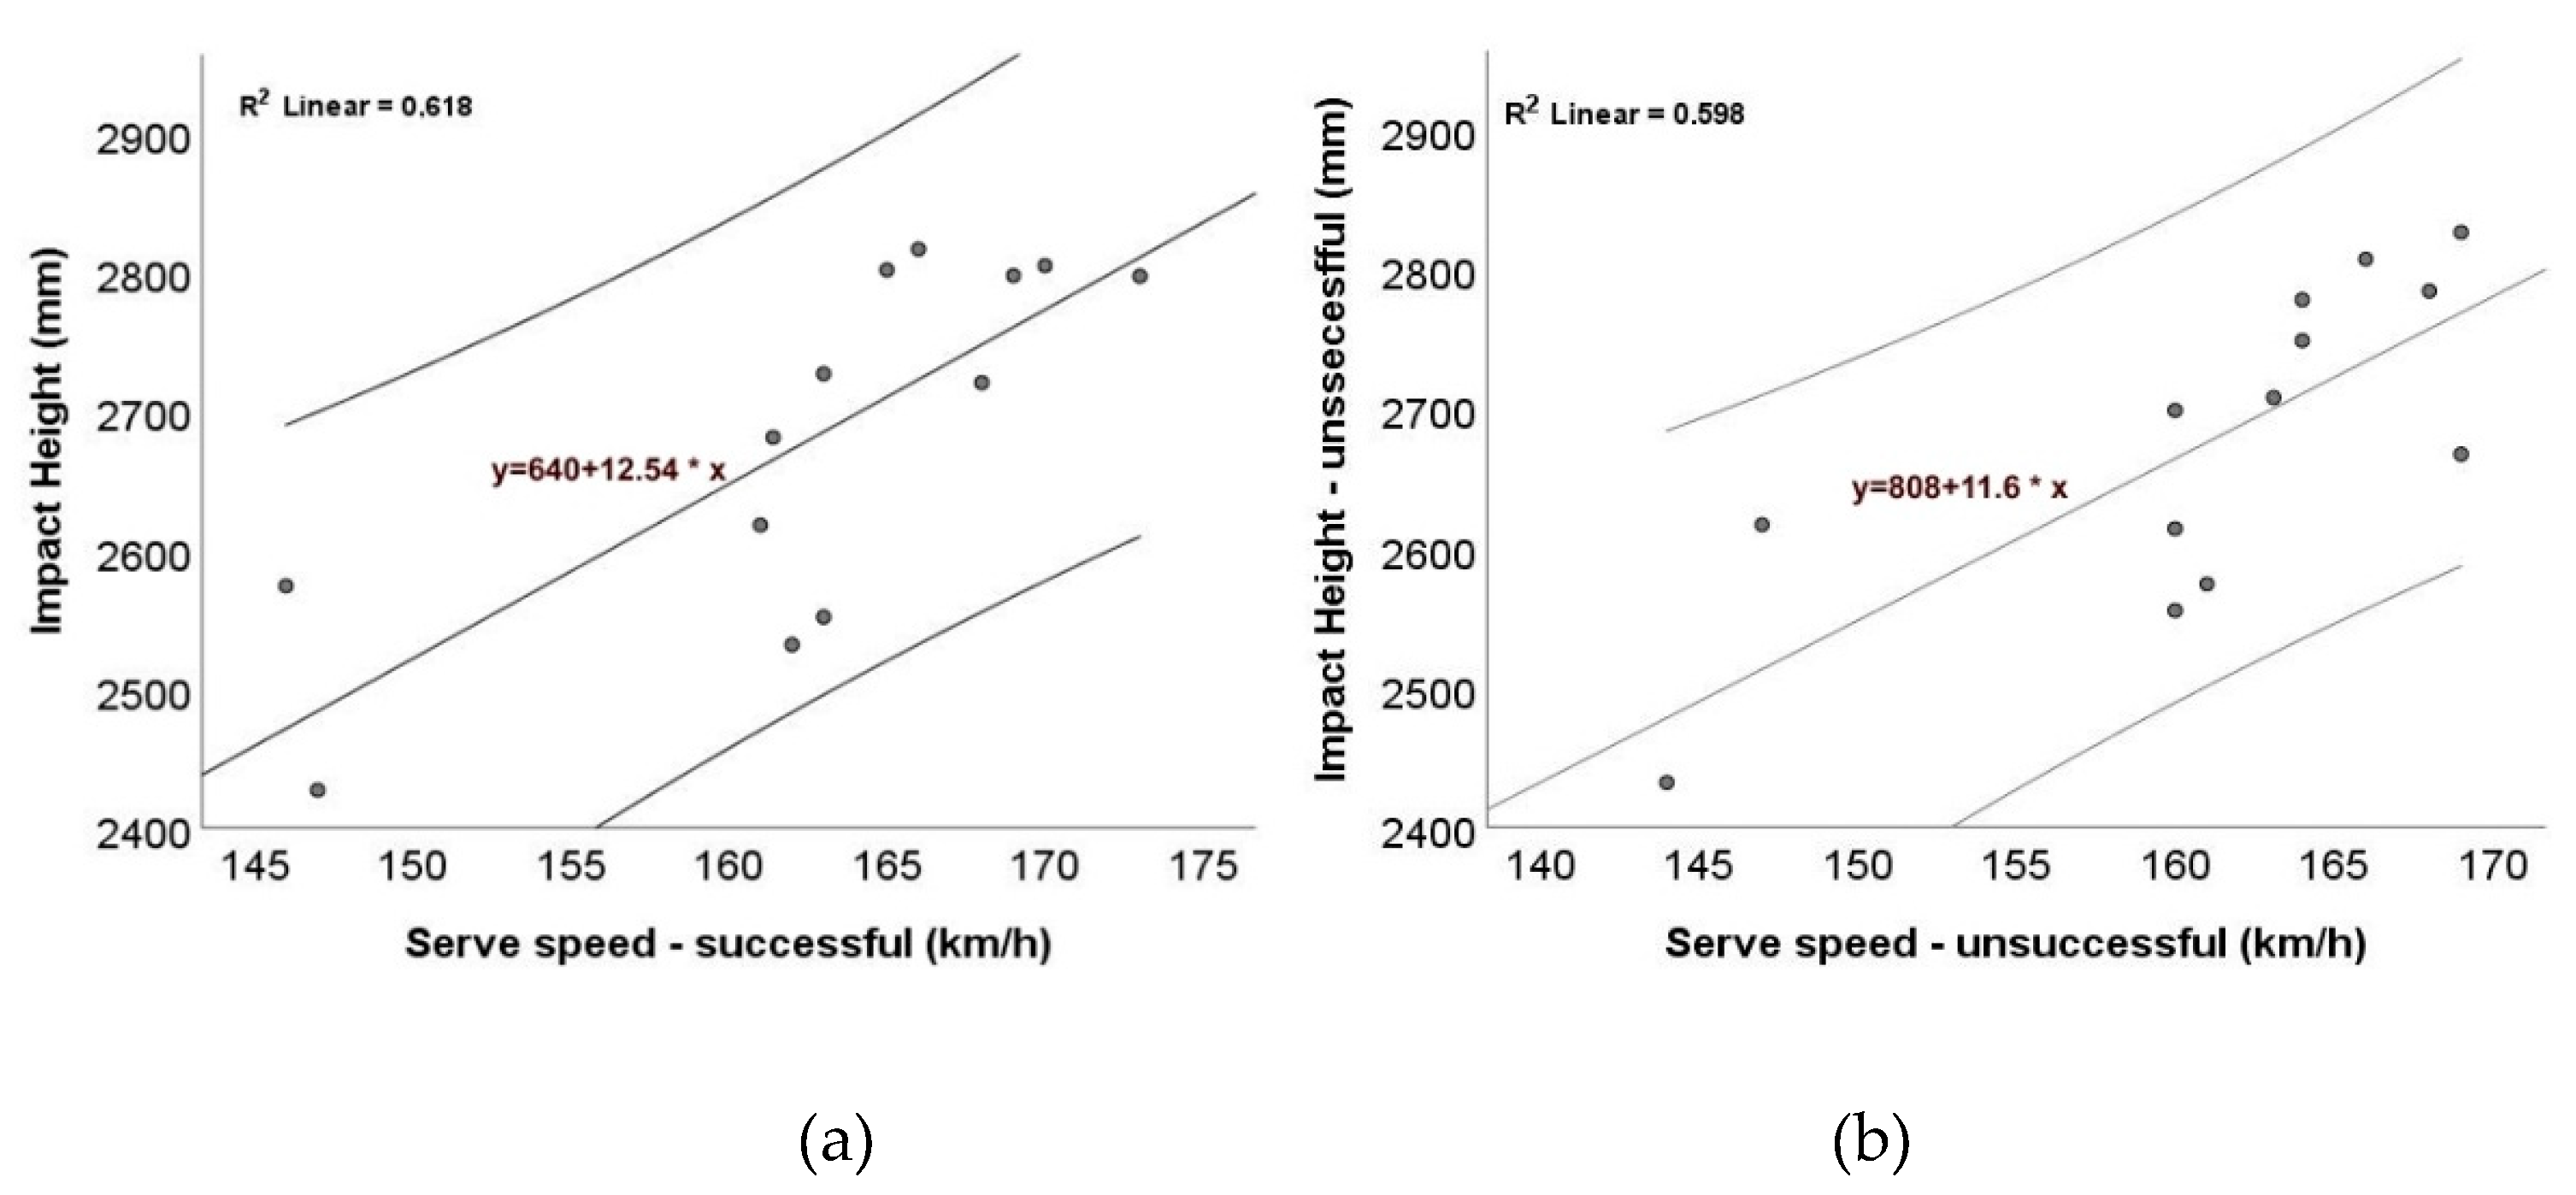
Figure 3.
Relationship between serve speed and impact height (normalized): (a) successful; (b) unsuccessful serves. Each dot represents a participant's mean (first 10 serves in the given category). The solid line shows the OLS linear fit + 95% CI. Note that OLS lines are descriptive; inference is based on Spearman’s ρ.
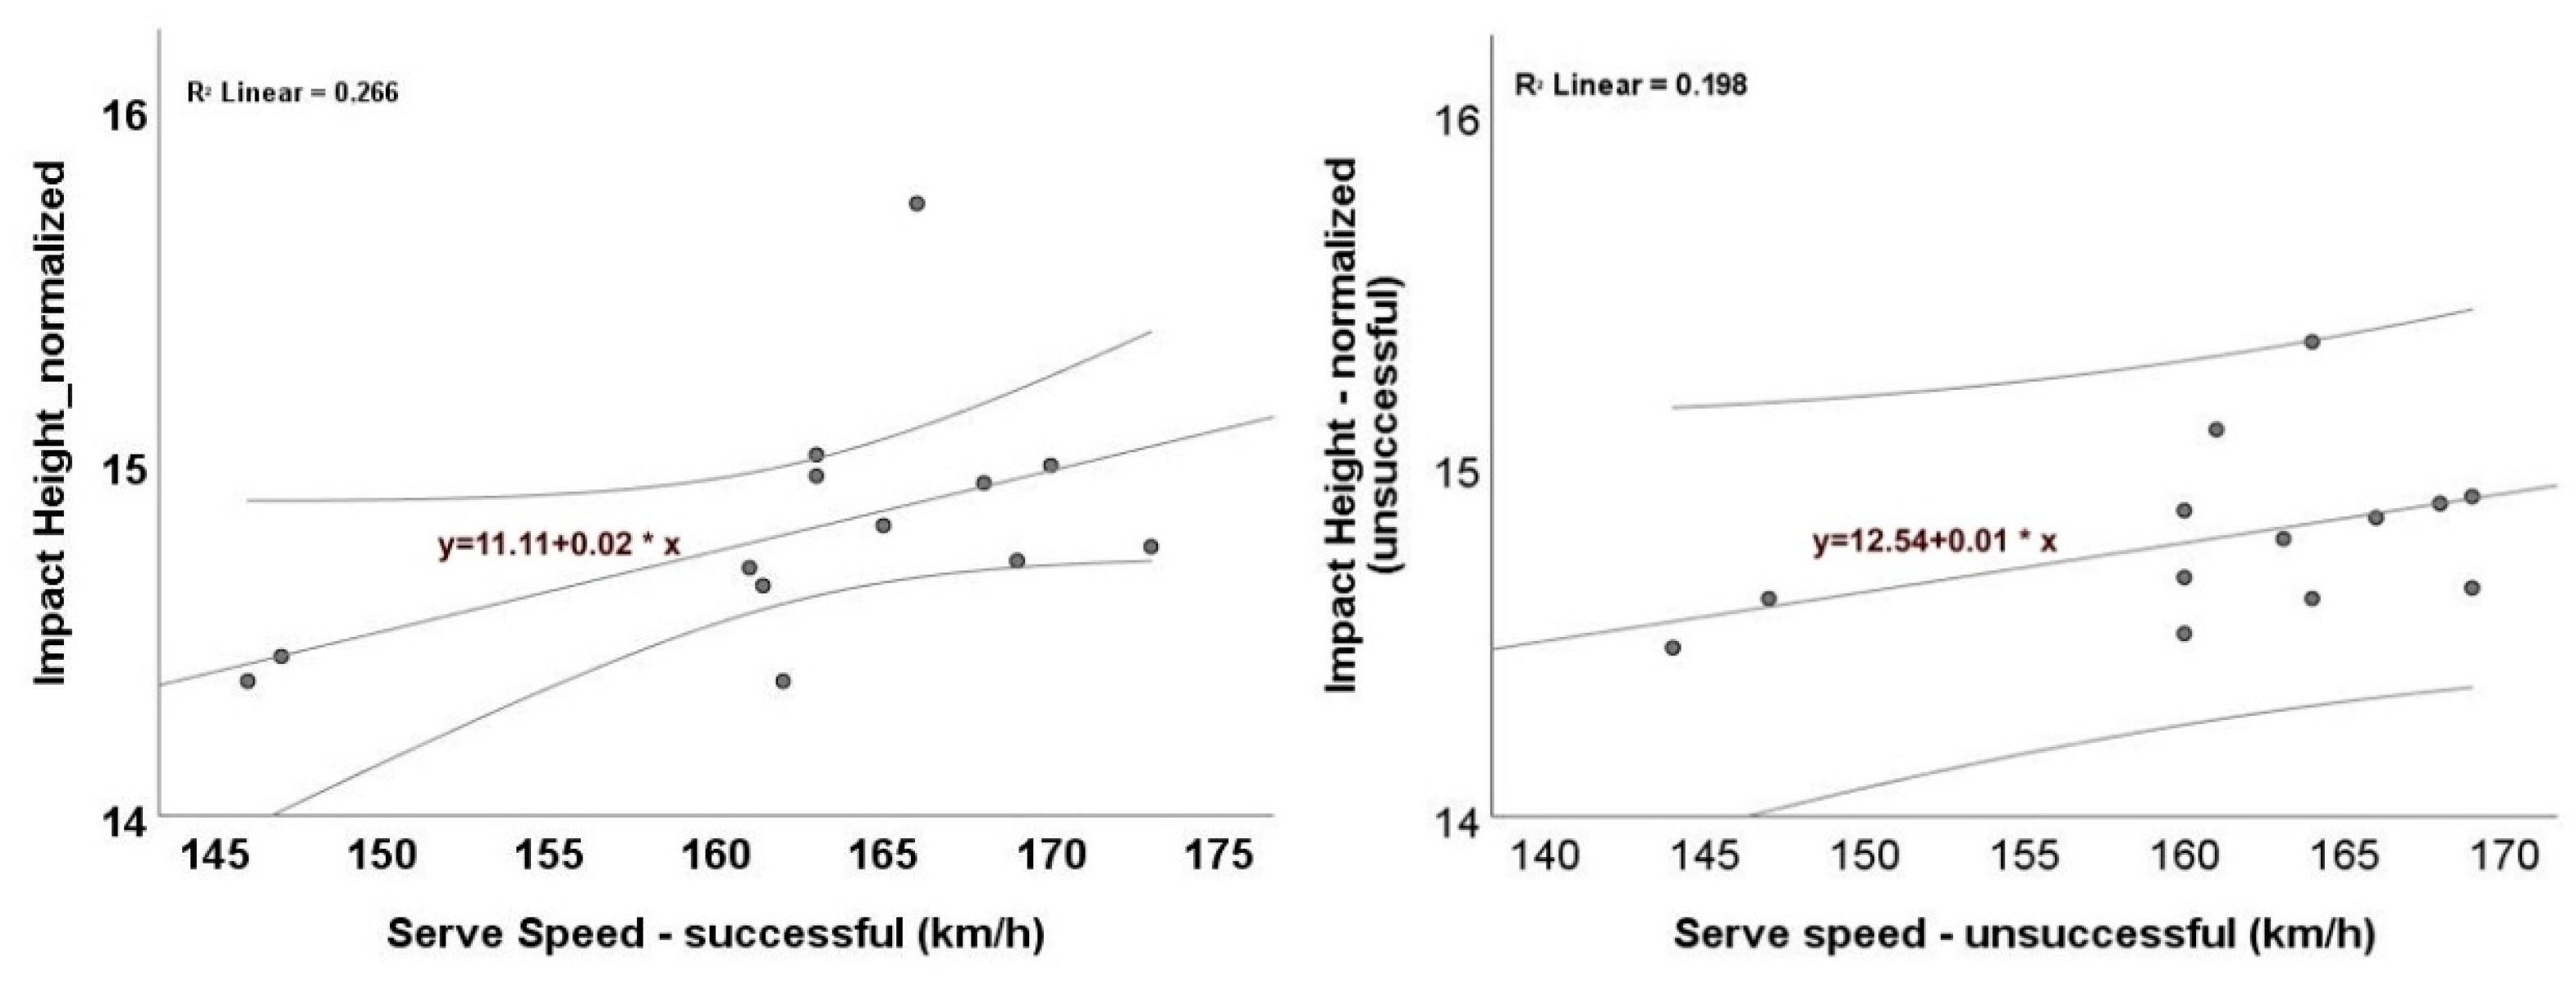
Figure 4.
Relationship between eccentric internal shoulder rotation strength and impact height during successful serves: (a) 210°/s; (b) 300°/s. Each dot represents a participant's mean (first 10 serves in the given category). The solid line shows the OLS linear fit + 95% CI. Note that OLS lines are descriptive; inference is based on Spearman’s ρ.
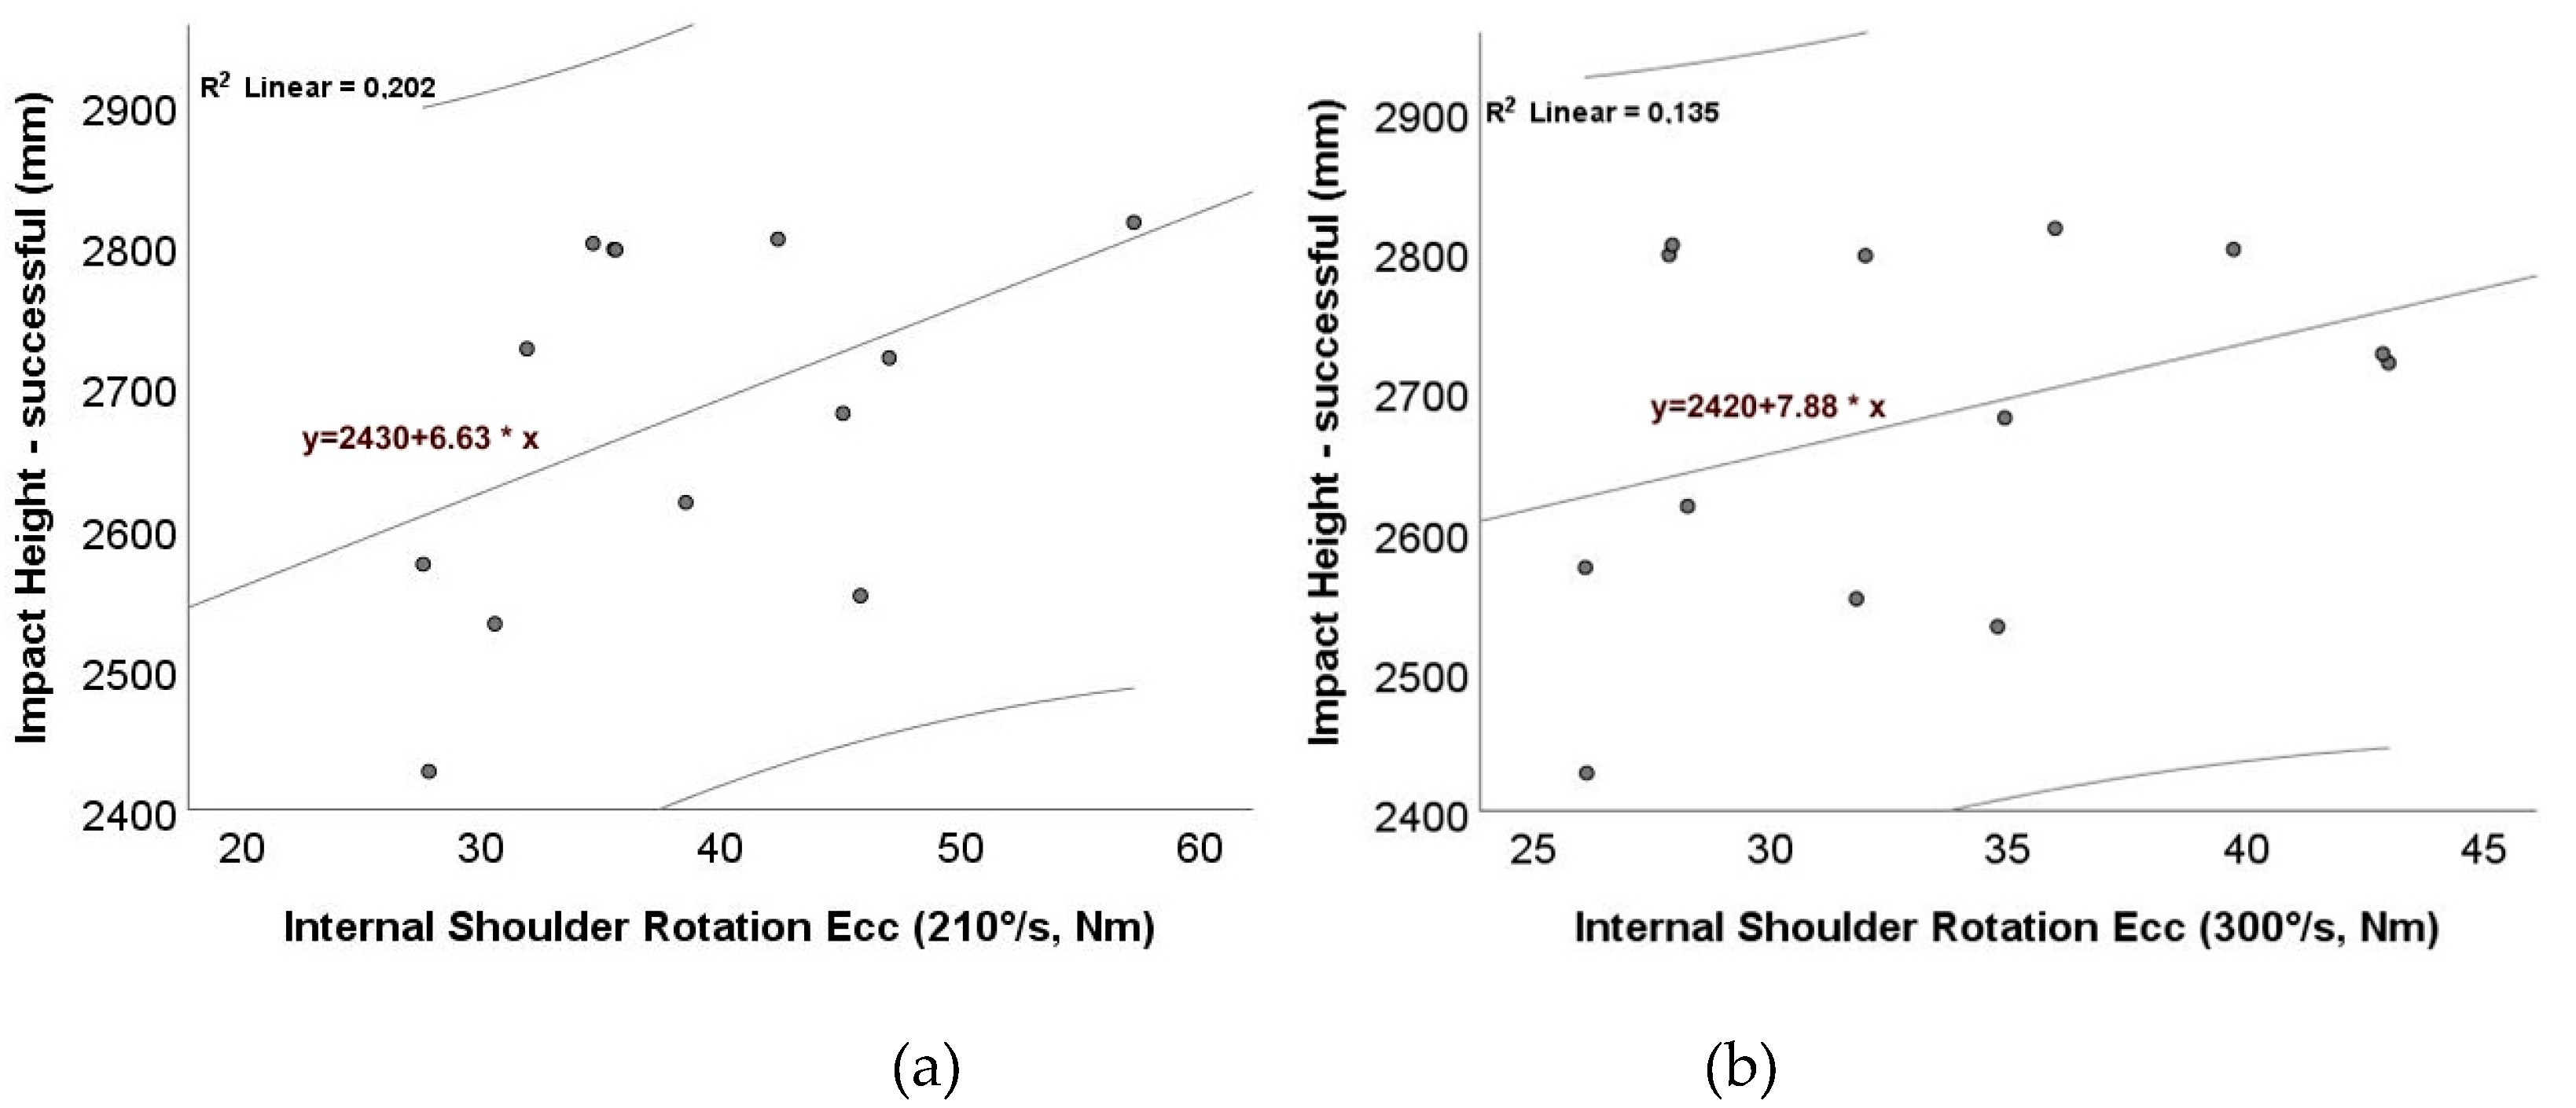
Figure 5.
Mediation model for successful serves (standardized coefficients). X = internal shoulder rotation eccentric strength at 210°/s; M = impact height; Y = serve speed. Path “a” denotes the effect of X on M; path “b” denotes the effect of M on Y, controlling for X; path “c′” denotes the direct effect of X on Y, controlling for M. Numbers shown next to paths are standardized β and two-tailed p values. The indirect effect (a×b) was estimated with bias-corrected bootstrap (1,000 resamples) and reported with 95% CI and two-tailed p; n = 13. (Dashed arrows indicate non-significant paths).
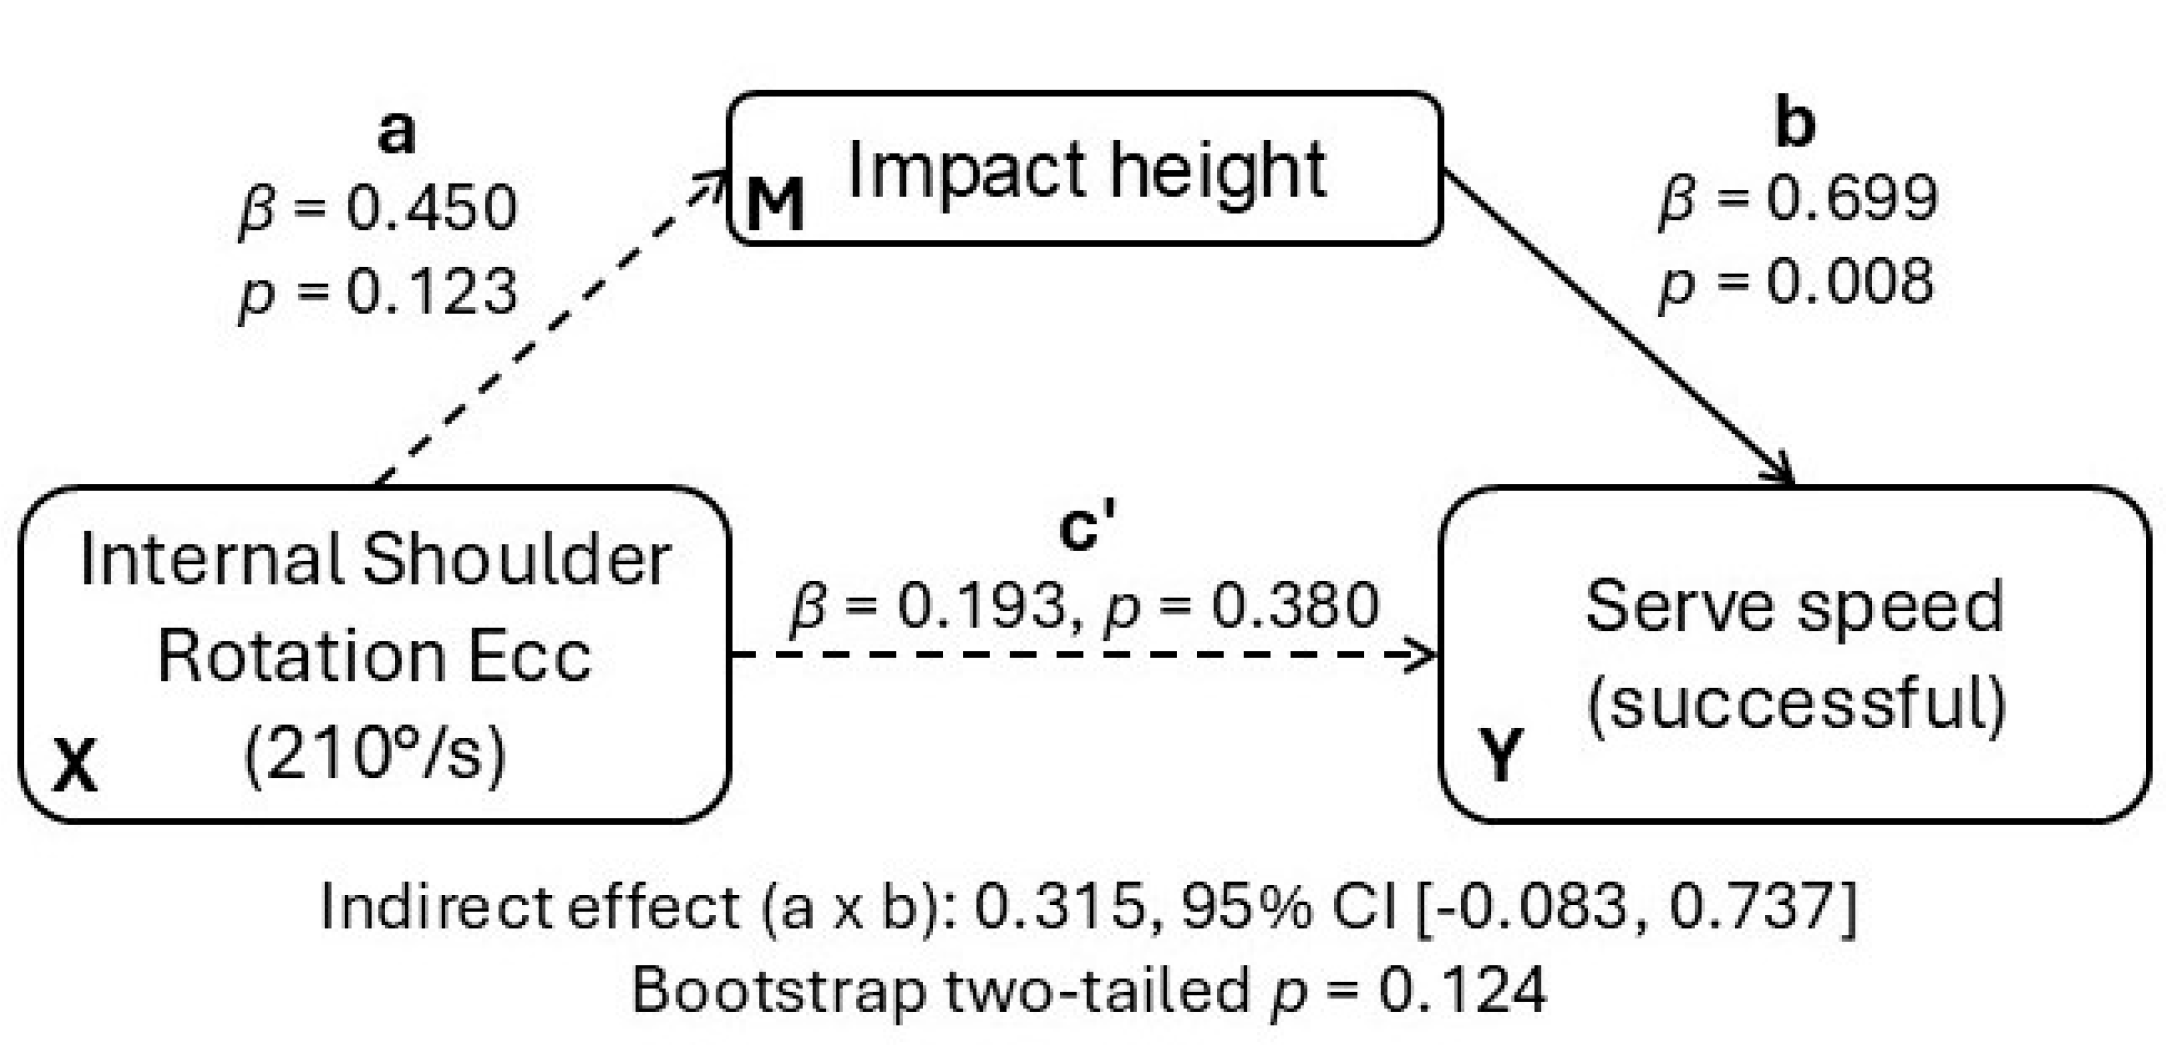
Figure 6.
Simple slopes of the relationship between eccentric internal shoulder-rotation strength (210°/s) and serve speed at low (−1 SD) and high (+1 SD) levels of toss variability for successful serves: (a) Impact-height variability; (b) Zenith–impact differential variability. Lines represent predicted values from OLS models with standardized predictors.
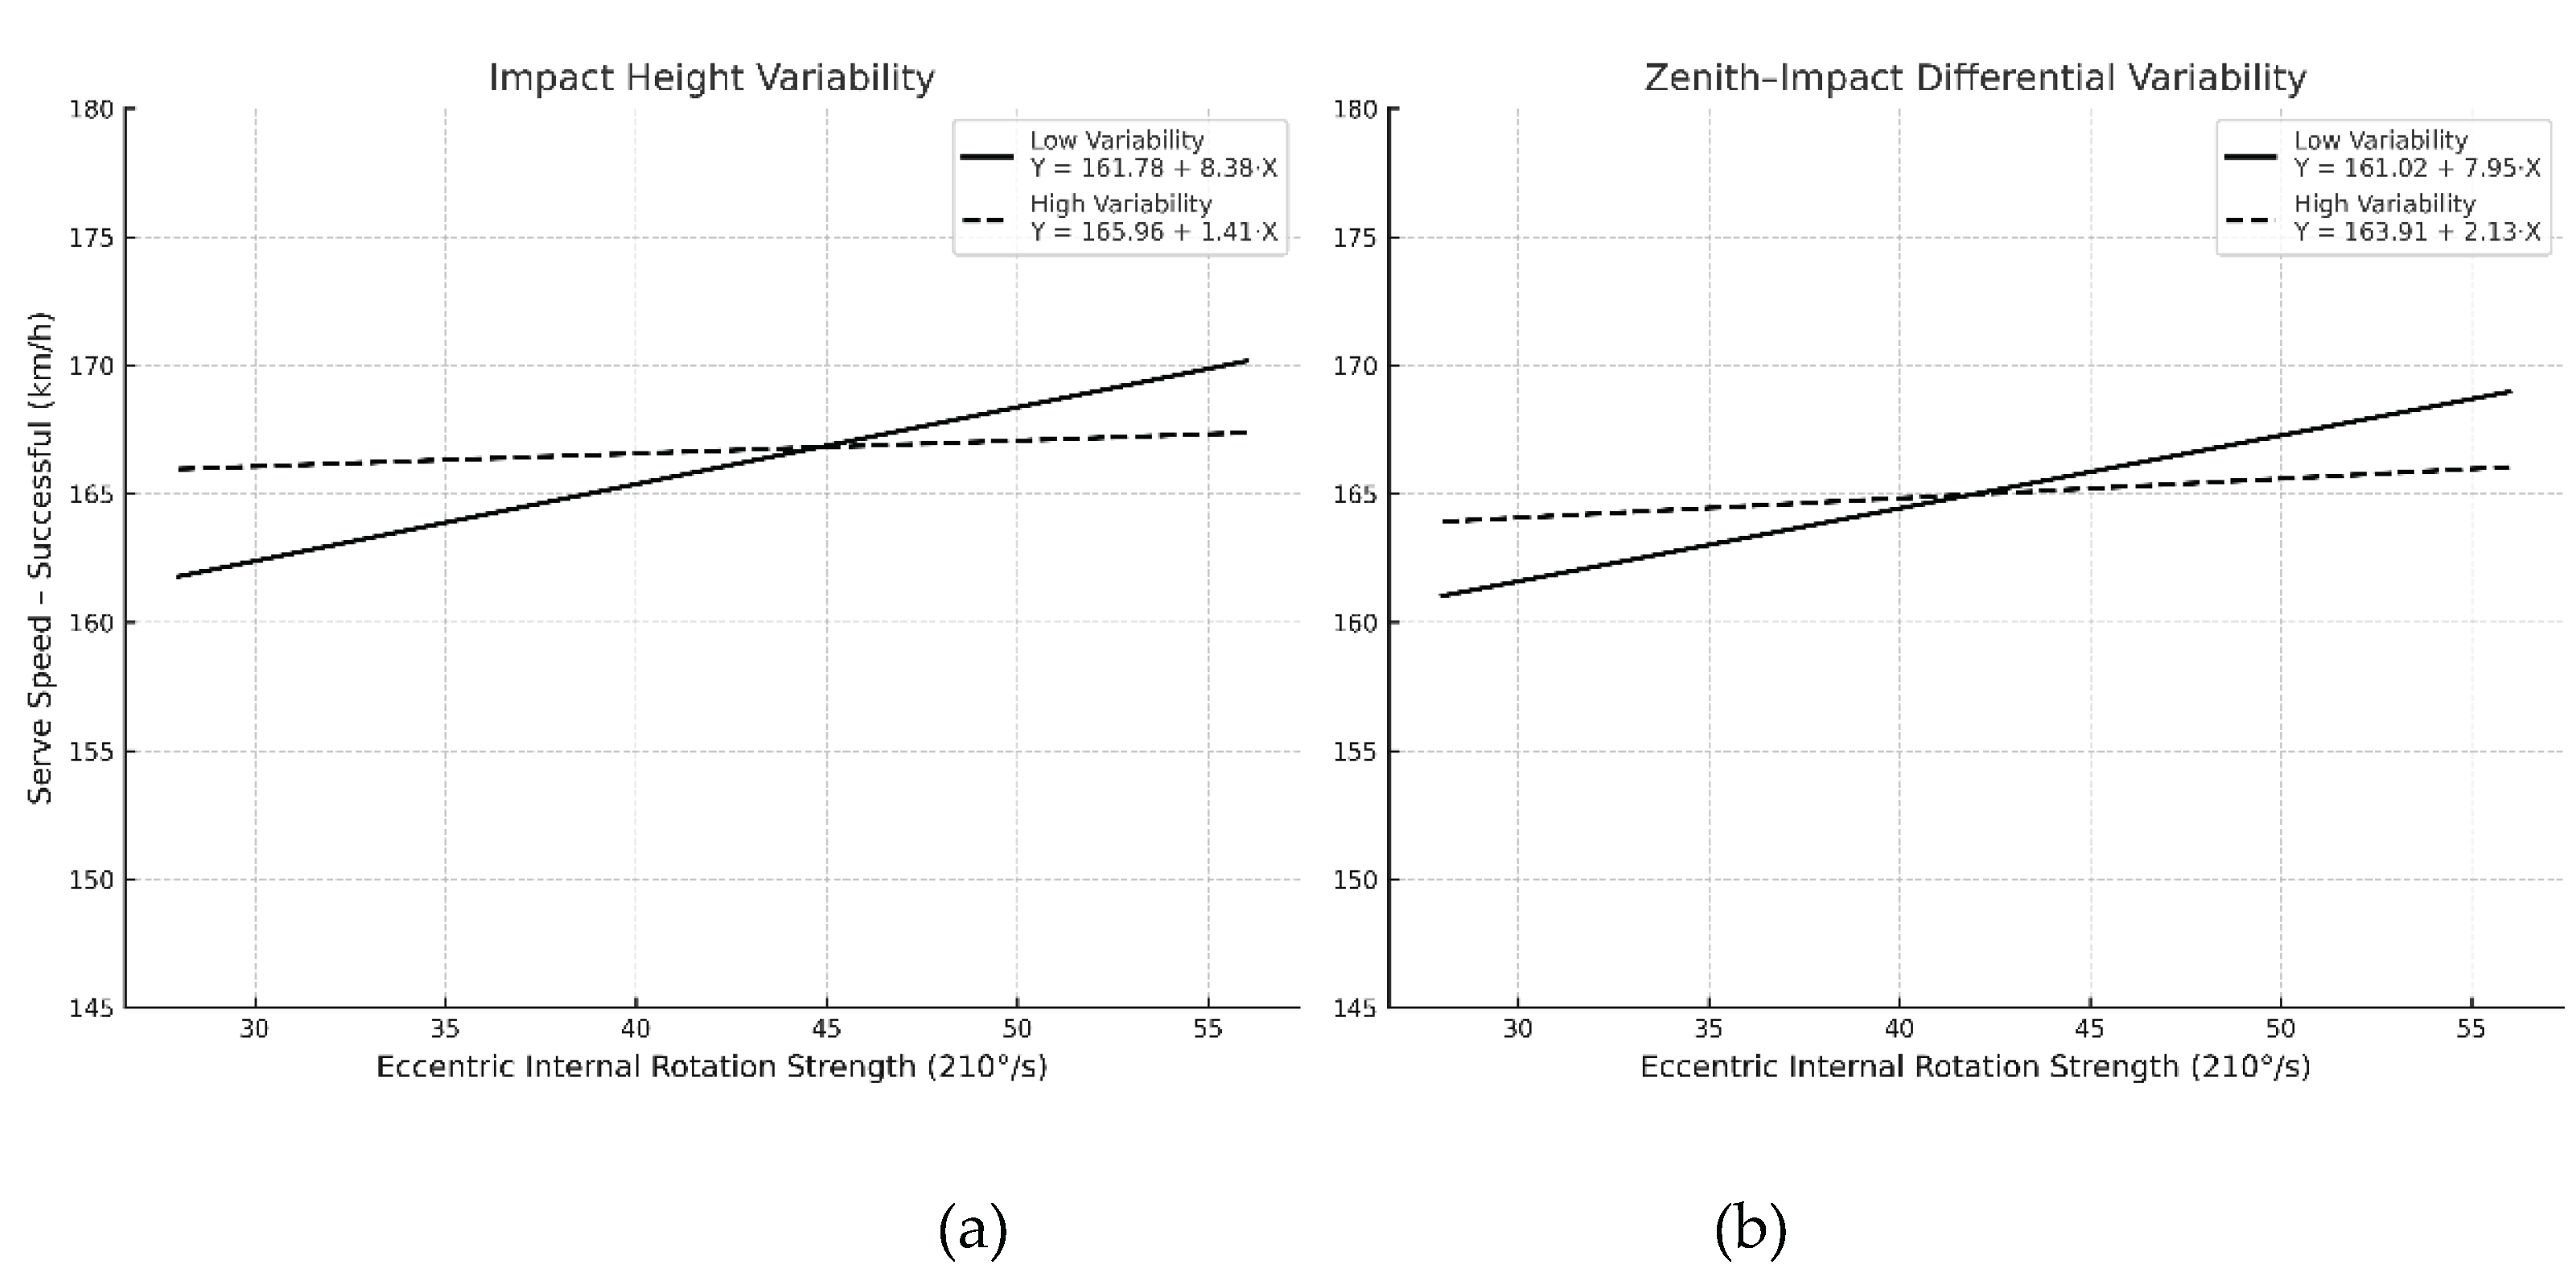

Table 1.
The performance of kinematic variables, isokinetic net moment, and serve speed.
| Variables | Mean | SD | CI Low-Up | SW |
|---|---|---|---|---|
| Zenith height – successful serve (m) | 3.404 | 0.24 | 3.257—3.550 | 0.84 |
| Zenith height – unsuccessful serve (m) | 3.397 | 0.25 | 3.244—3.549 | 0.77 |
| Impact height – successful serve (m) | 2.680 | 0.13 | 2.602—2.757 | 0.10 |
| Impact height – unsuccessful serve (m) | 2.677 | 0.12 | 2.607—2.747 | 0.58 |
| Zenith-impact differential – successful serve (m) | 0.724 | 0.19 | 0.61—0.84 | 0.81 |
| Zenith-impact differential – unsuccessful serve (m) | 0.720 | 0.19 | 0.61—0.83 | 0.66 |
| Serve Speed – successful serve (km/h) | 163 | 8 | 158—167 | 0.03 |
| Serve Speed – unsuccessful serve (km/h) | 161 | 8 | 157—166 | 0.01 |
| Internal Shoulder Rotation Con (210°/s, Nm) | 31.9 | 7.4 | 27.5—36.4 | 0.53 |
| External Shoulder Rotation Con (210°/s, Nm) | 21.0 | 4.5 | 18.3—23.8 | 0.82 |
| Internal Shoulder Rotation Ecc (210°/s, Nm) | 38.5 | 8.7 | 33—43.7 | 0.47 |
| External Shoulder Rotation Ecc (210°/s, Nm) | 32.2 | 7.9 | 27.4—37 | 0.10 |
| Internal Shoulder Rotation Ecc (300°/s, Nm) | 33.2 | 6.0 | 29.6—36.8 | 0.17 |
| External Shoulder Rotation Ecc (300°/s, Nm) | 30.1 | 5.4 | 26.8—33.4 | 0.55 |
| Internal Shoulder Rotation Con (300°/s, Nm) | 29.0 | 7.2 | 24.7—33.3 | 0.99 |
| External Shoulder Rotation Con (300°/s, Nm) | 20.8 | 4.0 | 18.4—23.2 | 1.00 |
Abbreviations: CI—95% confidence interval; SD—standard deviation; SW—p value Shapiro–Wilk test; Con—concentric; Ecc—eccentric.
Table 2.
Spearman’s coefficients between kinematics variables and isokinetic strength or serve speed in successful serves.
Table 2.
Spearman’s coefficients between kinematics variables and isokinetic strength or serve speed in successful serves.
| Zenith – suc. (m) | Impact – suc. (m) | Zenith-impact diff. – suc. (m) | ||||
|---|---|---|---|---|---|---|
| Variables | ρ | p | ρ | p | ρ | p |
| Internal Shoulder Rotation Con (210°/s) | -0.038 | 0.901 | 0.445 | 0.128 | -0.324 | 0.280 |
| External Shoulder Rotation Con (210°/s) | 0.198 | 0.517 | 0.456 | 0.117 | -0.110 | 0.721 |
| Internal Shoulder Rotation Ecc (210°/s) | -0.170 | 0.578 | 0.434 | 0.138 | -0.434 | 0.138 |
| External Shoulder Rotation Ecc (210°/s) | 0.005 | 0.986 | 0.203 | 0.505 | -0.088 | 0.775 |
| Internal Shoulder Rotation Ecc (300°/s) | 0.077 | 0.803 | 0.335 | 0.263 | -0.099 | 0.748 |
| External Shoulder Rotation Ecc (300°/s) | -0.176 | 0.566 | 0.231 | 0.448 | -0.396 | 0.181 |
| Internal Shoulder Rotation Con (300°/s) | -0.203 | 0.505 | 0.390 | 0.188 | -0.434 | 0.138 |
| External Shoulder Rotation Con (300°/s) | 0.044 | 0.887 | 0.511 | 0.074 | -0.324 | 0.280 |
| Serve Speed – successful serve (km/h) | 0.289 | 0.338 | 0.746† | 0.003 | -0.217 | 0.476 |
Abbreviations: ρ—Spearman’s correlation coefficient; † ρ ≥ 0.69; Con—concentric; Ecc—eccentric; suc.—successful serve, diff—differential.
Table 3.
Spearman’s coefficients between kinematics variables and isokinetic strength, serve speed in unsuccessful serves.
Table 3.
Spearman’s coefficients between kinematics variables and isokinetic strength, serve speed in unsuccessful serves.
| Zenith – unsuc. (m) | Impact – unsuc. (m) | Zenith-impact diff. – unsuc. (m) | ||||
|---|---|---|---|---|---|---|
| Variables | ρ | p | ρ | p | ρ | p |
| Internal Shoulder Rotation Con (210°/s) | -0.071 | 0.817 | 0.231 | 0.448 | -0.247 | 0.415 |
| External Shoulder Rotation Con (210°/s) | 0.148 | 0.629 | 0.324 | 0.280 | -0.060 | 0.845 |
| Internal Shoulder Rotation Ecc (210°/s) | -0.148 | 0.629 | 0.264 | 0.384 | -0.264 | 0.384 |
| External Shoulder Rotation Ecc (210°/s) | -0.027 | 0.929 | 0.077 | 0.803 | -0.016 | 0.957 |
| Internal Shoulder Rotation Ecc (300°/s) | 0.038 | 0.901 | 0.247 | 0.415 | 0.000 | 1.000 |
| External Shoulder Rotation Ecc (300°/s) | -0.181 | 0.553 | 0.176 | 0.566 | -0.253 | 0.405 |
| Internal Shoulder Rotation Con (300°/s) | -0.236 | 0.437 | 0.209 | 0.494 | -0.385 | 0.194 |
| External Shoulder Rotation Con (300°/s) | -0.011 | 0.972 | 0.374 | 0.209 | -0.269 | 0.374 |
| Serve Speed – unsuccessful serve (km/h) | 0.269 | 0.375 | 0.776** | 0.002 | -0.030 | 0.921 |
Abbreviations: ρ—Spearman’s correlation coefficient; **—ρ ≥ 0.69; Con—concentric; Ecc—eccentric; unsuc.—unsuccessful serve, diff—differential.
Disclaimer/Publisher’s Note: The statements, opinions and data contained in all publications are solely those of the individual author(s) and contributor(s) and not of MDPI and/or the editor(s). MDPI and/or the editor(s) disclaim responsibility for any injury to people or property resulting from any ideas, methods, instructions or products referred to in the content. |
© 2025 by the authors. Licensee MDPI, Basel, Switzerland. This article is an open access article distributed under the terms and conditions of the Creative Commons Attribution (CC BY) license (http://creativecommons.org/licenses/by/4.0/).
Copyright: This open access article is published under a Creative Commons CC BY 4.0 license, which permit the free download, distribution, and reuse, provided that the author and preprint are cited in any reuse.


