Preprint
Article

This version is not peer-reviewed.

Mapping the Climatic Suitability for Olive Groves in Greece

A peer-reviewed article of this preprint also exists.

Submitted:

25 September 2025

Posted:

26 September 2025

You are already at the latest version

Abstract

Oliviculture constitutes a fundamental Mediterranean rural activity and predominantly for Greece as it primarily accounts for the country’s substantial socio-economic development. Even though the olive tree represents one of the best acclimated species, its overall performance may be significantly impacted by changes of the climate expressed by the extreme weather conditions commonly observed in recent decades. Thus, by considering the lack of scientific detection on the climate suitability evaluation of the olive groves especially over the entire Greek territory, a conjunction between the geomorphological parameters’ mapping of Greece (altitude, aspect, slope and terrain roughness) and the respective required atmospheric conditions mandatory for the olive’s qualitative and quantitative attribution (temperature, precipitation, frost days) has been performed. Every parameter is reclassified to translate its value to a score, and the final suitability map is the outcome of the aggregation of all score maps. Individually, the overall geomorphological and climate suitability for oliviculture is high in Greece given the extensive area resulting as optimal geomorphological and climatic conditions (34.44% and 59.4%, respectively) and overall optimal pedoclimatic conditions (56.61%) for oliviculture. The model maybe characterized by simplicity, usability, flexibility and efficiency. The present modelling procedure may constitute means for identifying suitable areas for sustainable and productive development of the olive culture.

Keywords: 
;  ;  ;  ;  ;  

1. Introduction

According to the International Olive Council (2024), most of the olive cultivation surface (97.9%) is localized in the Mediterranean countries, with Greece being the fifth-largest producer after Spain, Italy, Turkey and Tunisia and having one of the largest annual per capita consumptions in the world (Marakis et al., 2021). The olive tree, Olea (Olea europaea L.), which derives its name from the Greek term ‘elea’ (Kostelenos and Kiritsakis, 2017) constitutes the most extensive cultivation over Greece. The olive groves occupy an area exceeding 2 million acres, which consists of approximately 130 million olive trees covering a significant percentage of the total agricultural land, including areas of limited possibilities for agricultural exploitation (den Herder et al., 2017). Thus, 25% of the farms in Greece are devoted to olive cultivation while this country along with Spain and Italy (main producers) contribute to 70% of the global production (Morin and Lees, 2018). The annual olive oil production in Greece varies between 300,000–400,000 tons, at the country level, with 80% of the produced olive oil falling into the extra virgin olive oil category (Skiada et al., 2019).
Apparently, olives compose an essential crop for Greece and constitute an integral factor in socio-economic growth possessing also a significant ecological role (Michalopoulos et al., 2020; Solomou and Sfougaris, 2021) and a beneficial role in human health, as the main derived olive oil is characterized by unique properties (Foscolou et al., 2018). In the concept of the Mediterranean diet, olive oil serves as the main dietary constituent as it is strongly recognized for its robust protective effects against cardiovascular diseases, diabetes, cancer, and age-related cognitive decline, in addition to the reduced likelihood of metabolic syndrome (Arvaniti et al., 2024; Jimenez-Lopez et al., 2020).
The climatic conditions are highly linked with the cultivation of the olive tree, and its development cycle considering that the crop is approximately limited by the 30◦ to 45◦ latitudinal belt and is fully adapted to the Mediterranean-type climate (Fraga et al., 2021). The typical Mediterranean climate, corresponding to the transition between the arid climate of Northern Africa and the temperate rainy climate of Central Europe, may be characterized as the most suitable for the cultivation of the olive tree (Moriondo et al., 2013), ensuring regular fruit production. Prolonged hot and dry summers, mild and humid winters, and high-level solar radiation, particularly during summer and spring are indicative of the Mediterranean climate (Lionello et al., 2023; Urdiales-Flores et al., 2024).
Greece is included in the Northern Hemisphere’s temperate continental climate zone Thus, the country’s climate conditions correspond to the typical Mediterranean features mainly described by relatively warm and dry summers, mild rainy winters, and extensive sunshine almost all through the annual period. The average annual temperature may exceed the value of 20 °C and may be less than 8 °C in certain mountainous areas in the northern parts. The average precipitation may approximate 300 mm per year in the Cyclades islands while it might amount to 2000 mm per year in the mountainous regions (e.g., the Pindos Mountain) (Koubouris and Psarras, 2024). Climate suitability for olive cultivation corresponds to the predominant part of the country supporting, thus, the continual extension of olive growing in new areas (Koubouris and Psarras, 2024).
Several scientific studies and literature reviews focus on the latest research achievements in the modelling of the olive for the monitoring of the crops behavior as affected by the climatic conditions. Modelling concerning the olive crop includes the analysis of the climatic and topographical conditions (GIS in conjunction with climatic variables) aimed at the characterization of the olive-growing areas (Honorio et al., 2024). Updated modelling and Decision Support Systems (DSS) have been developed upon the open-source Geospatial Cyberinfrastructure (GCI) platform (namely GeOlive) which provides a significant web-based operational tool better connecting olive productivity and environmental sustainability by processing static and dynamic data (e.g. pedology, daily climate) to perform simulation modelling via the Web (Manna et al., 2020). The Random forest algorithm has been exploited for the identification of suitable areas for olive cultivation based on resulting suitability maps by taking into account pedoclimatic parameters (e.g., average annual temperature, average annual precipitation, solar radiation, slope, aspect, land use capability class, land use capability sub-class, soil depth, other soil properties and land cover) (Ozalp and Akinci, 2023). Process-oriented simulation models (e.g., OliveCan) have been conceived for investigating the influence of environmental conditions and management applications on water relations, growth and productivity of the olive under different irrigation strategies (López-Bernal et al., 2018), enabling, thus, the comprehension of the olive orchard’s productive dynamics as impacted by heterogeneous agricultural practices and climatic conditions (Mairech et al., 2020), but also under different climate change scenarios (Mairech et al., 2021). Simulation of the effects of climate change and varying planting densities on the potential olive growth and olive oil production have also been performed by three-dimensional modeling of canopy photosynthesis, respiration and dynamic distribution of assimilates among organs (Morales et al., 2016). Dynamic modeling has been implemented for the forecasting of the expected olive flowering under natural temperature conditions (Smoly et al., 2025). Agro-hydrological models (e.g., FAO-56 model) have been utilized for the simulation of the transpiration fluxes of table olive groves under soil water deficit conditions (Rallo et al., 2014) and the evaluation of the crop water use and crop coefficient (e.g., SIMDualKc model) of irrigated olive groves (Puig-Sirera et al., 2021; Ramos et al., 2023). Simple process-based model (including phenological sub-model) simulations of biomass accumulation and yield of olive groves have been conducted interpreting the competition between ecosystem components, including olive tree growth and grass cover, for water (Moriondo et al., 2019).
Climate-crop models are essential tools for investigating the impacts of atmospheric parameters on crop development, growth and potential production through the combination of the scientific knowledge of crop physiology associated with changing environmental conditions (Moriondo et al., 2015; Villalobos et al., 2023). According to the aforementioned survey, several simulation models involving olive groves have been formulated so far in olive oil producing areas for serving several purposes, but there is lack of investigations corresponding to the climate suitability evaluation of the specific cultivation in individual regions of Greece and far more over the entire Greek territory.
Therefore, the main goal of this investigation is the evaluation of the olive cultivation’s suitability over Greece for the objective of predicting the changes of the latter owing to the atmospheric conditions’ alterations. For the realization of this purpose, a conjunction between the geomorphological data of Greece and the required atmospheric conditions for the specific crop’s cultivation has been accomplished.

2. Materials and Methods

The study area is Greece (38.85°N 24.4°E), located in the southern part of the Balkan area, with a total surface of 131.957 km2. Nearly 80% of this area is continental, while 20% is divided among ~3.000 islands.
A digital elevation model (DEM) with a spatial resolution of 250 m was applied to generate the necessary data for the area’s suitability assessment. From this dataset, spatial operations were performed to initiate digital data relative to the geomorphological indicators of aspect, slope, terrain roughness, and elevation (above sea level).
A Corine Land Cover (Büttner, 2014) dataset was exploited to compare the present study’s olive cultivation suitability results with olive cultivation locations illustrated for the year 2018.
From a climatic perspective (1970-2000), data from the WorldClim (Fick and Hijmans, 2017) dataset were exploited, while spatial operations were conducted for the generation of digital data involving the climatic indicators of temperature (mean minimum values from November to March, mean January values (as a measure of the necessary cool temperatures), mean July values, mean annual values), Precipitation (annual precipitation) and Frost days (annual number of frost days, Spring frost days). Thus, a total of 11 parameters were utilized for the construction of the model. The generalized method’s flowchart is depicted in Figure 1.
The applied method for the construction of the suitability model is the following
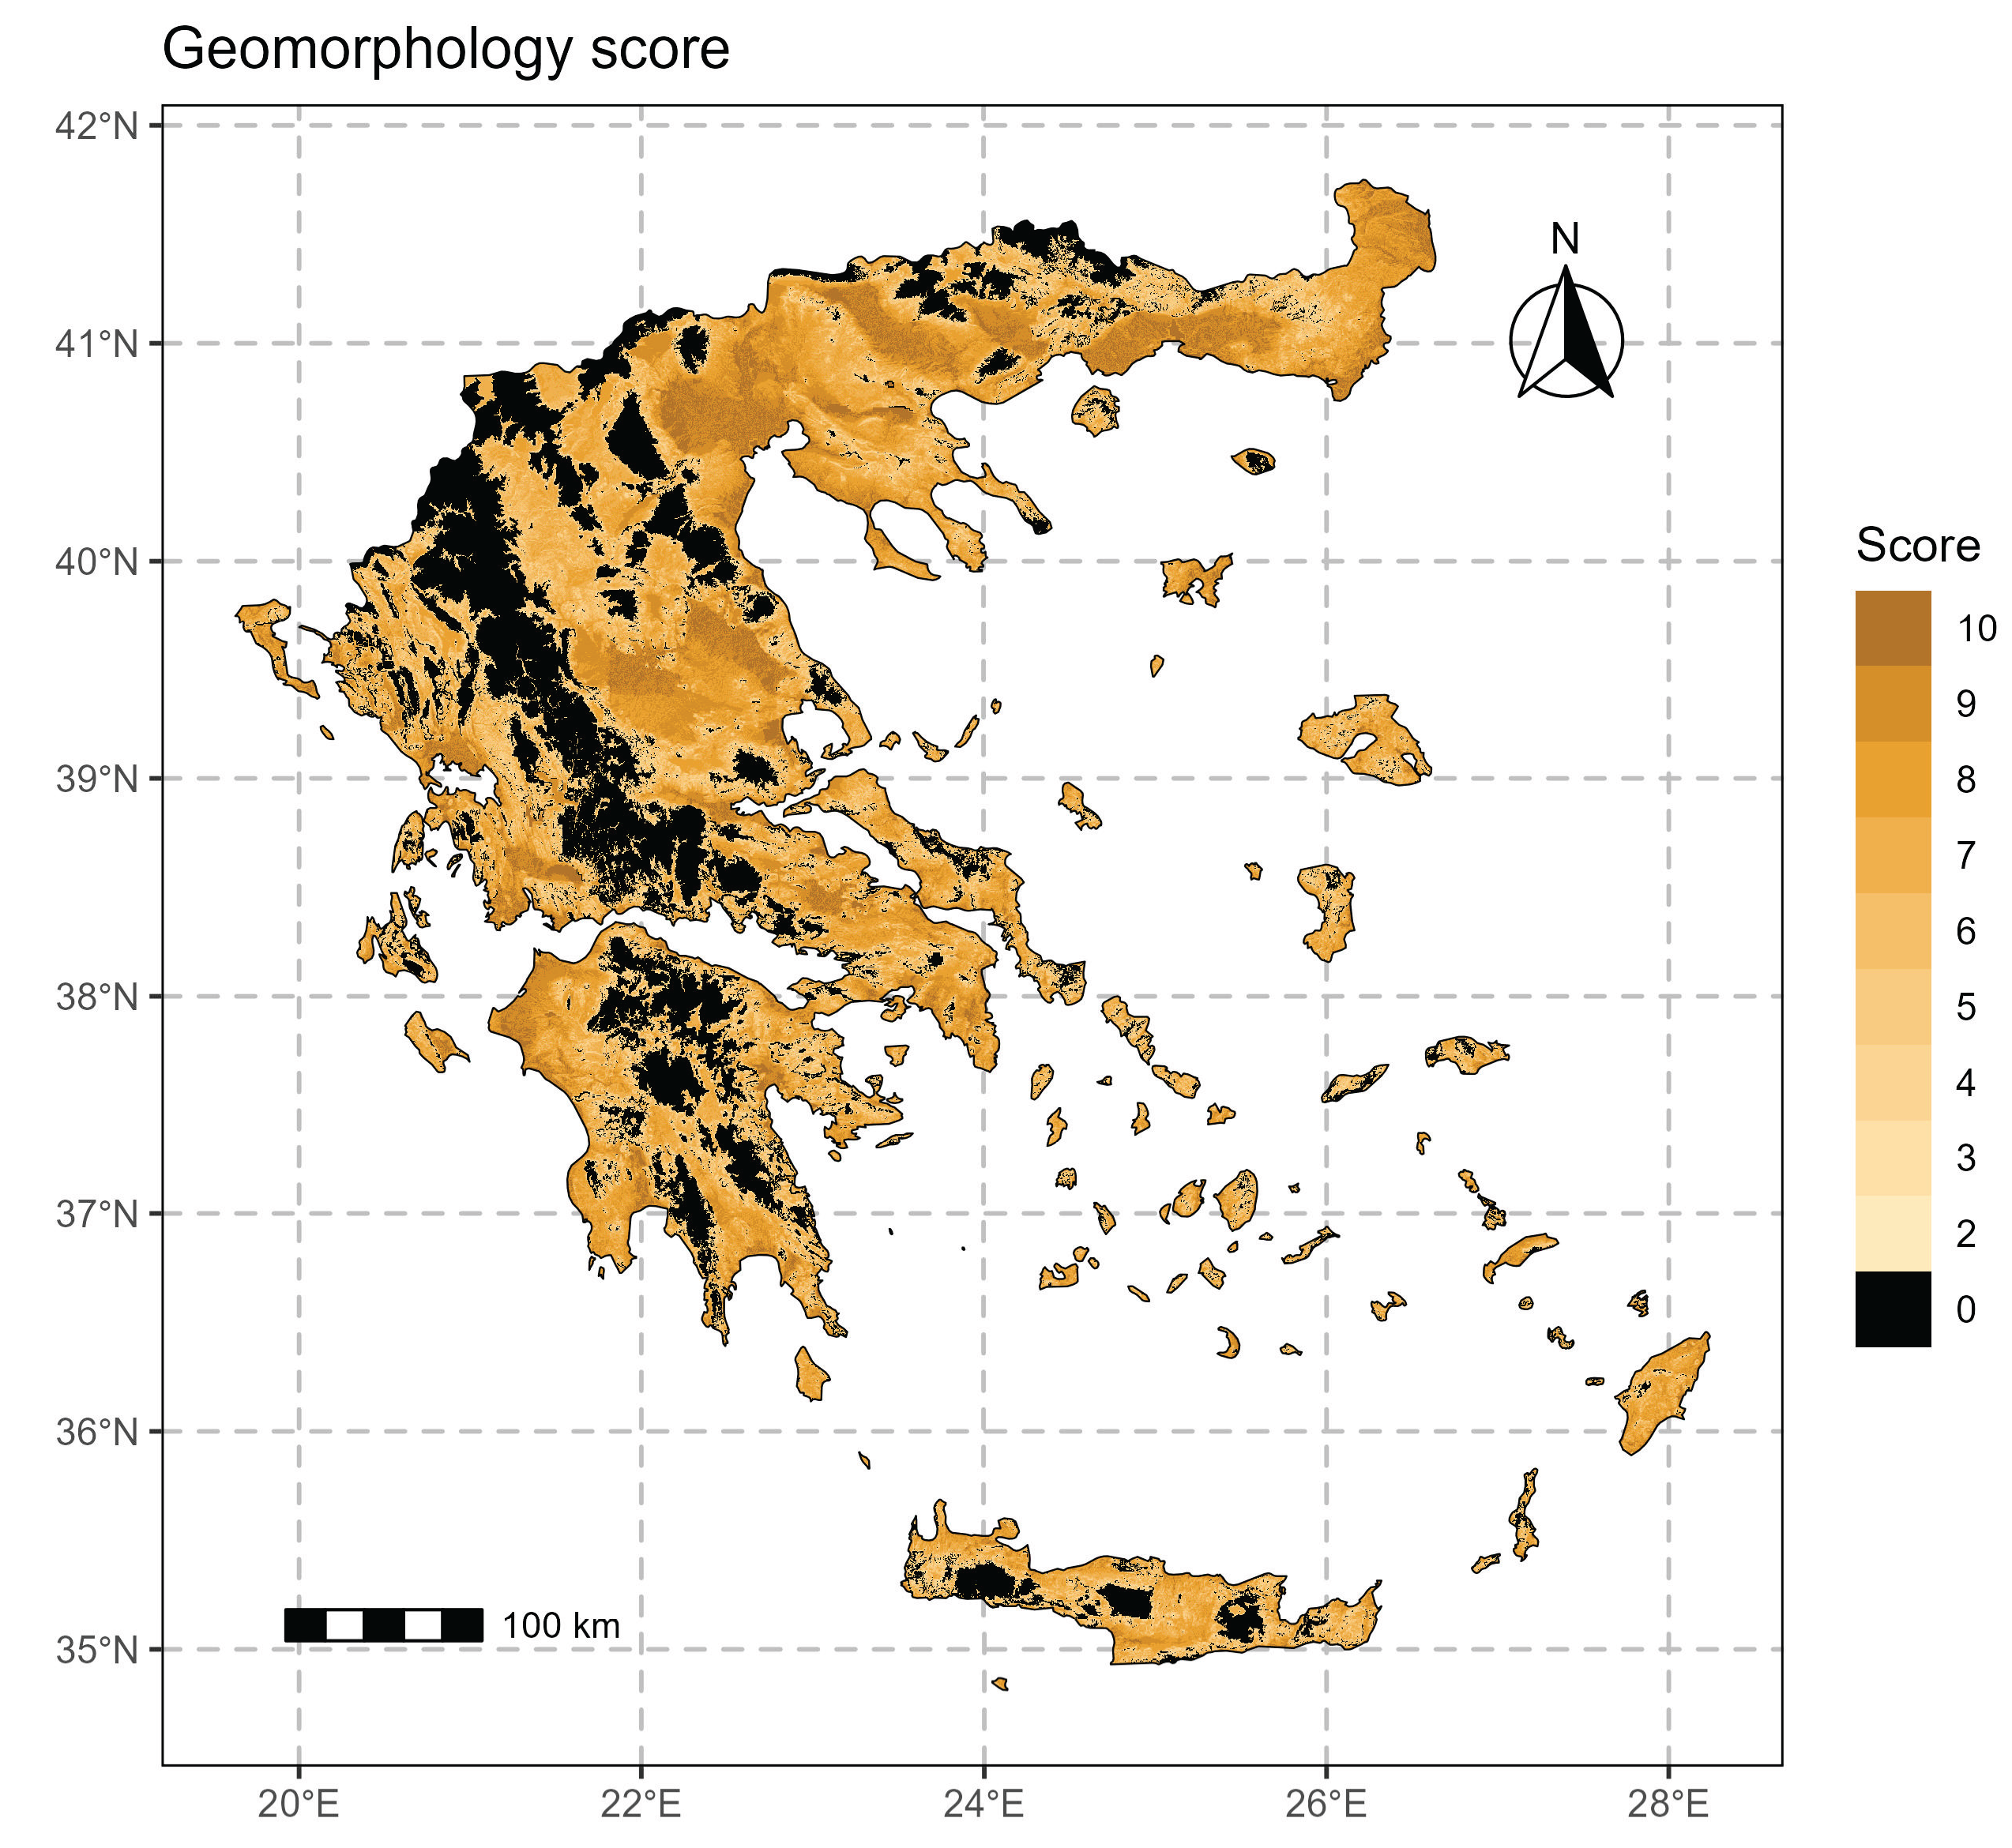
  • Each parameter is classified as a score from 1 to 10. The score 1 is assigned to acceptable conditions of the parameter in relation to olive tree cultivation and score 10 is assigned to the optimal conditions of this parameter. We can also assign a score of 0 where this parameter is unsuitable for cultivation. So, in case the conditions are unsuitable for olive groves the score is zero (0) and when are suitable for this cultivation the score can be from 1 (the lower suitability) to 10 (the higher suitability). In case for one model’s parameter the score is 0 in a site, this site remains unsuitable no matter the score of the rest parameters. The score tables can be found in the supplementary materials (Table S1 to Table S11).
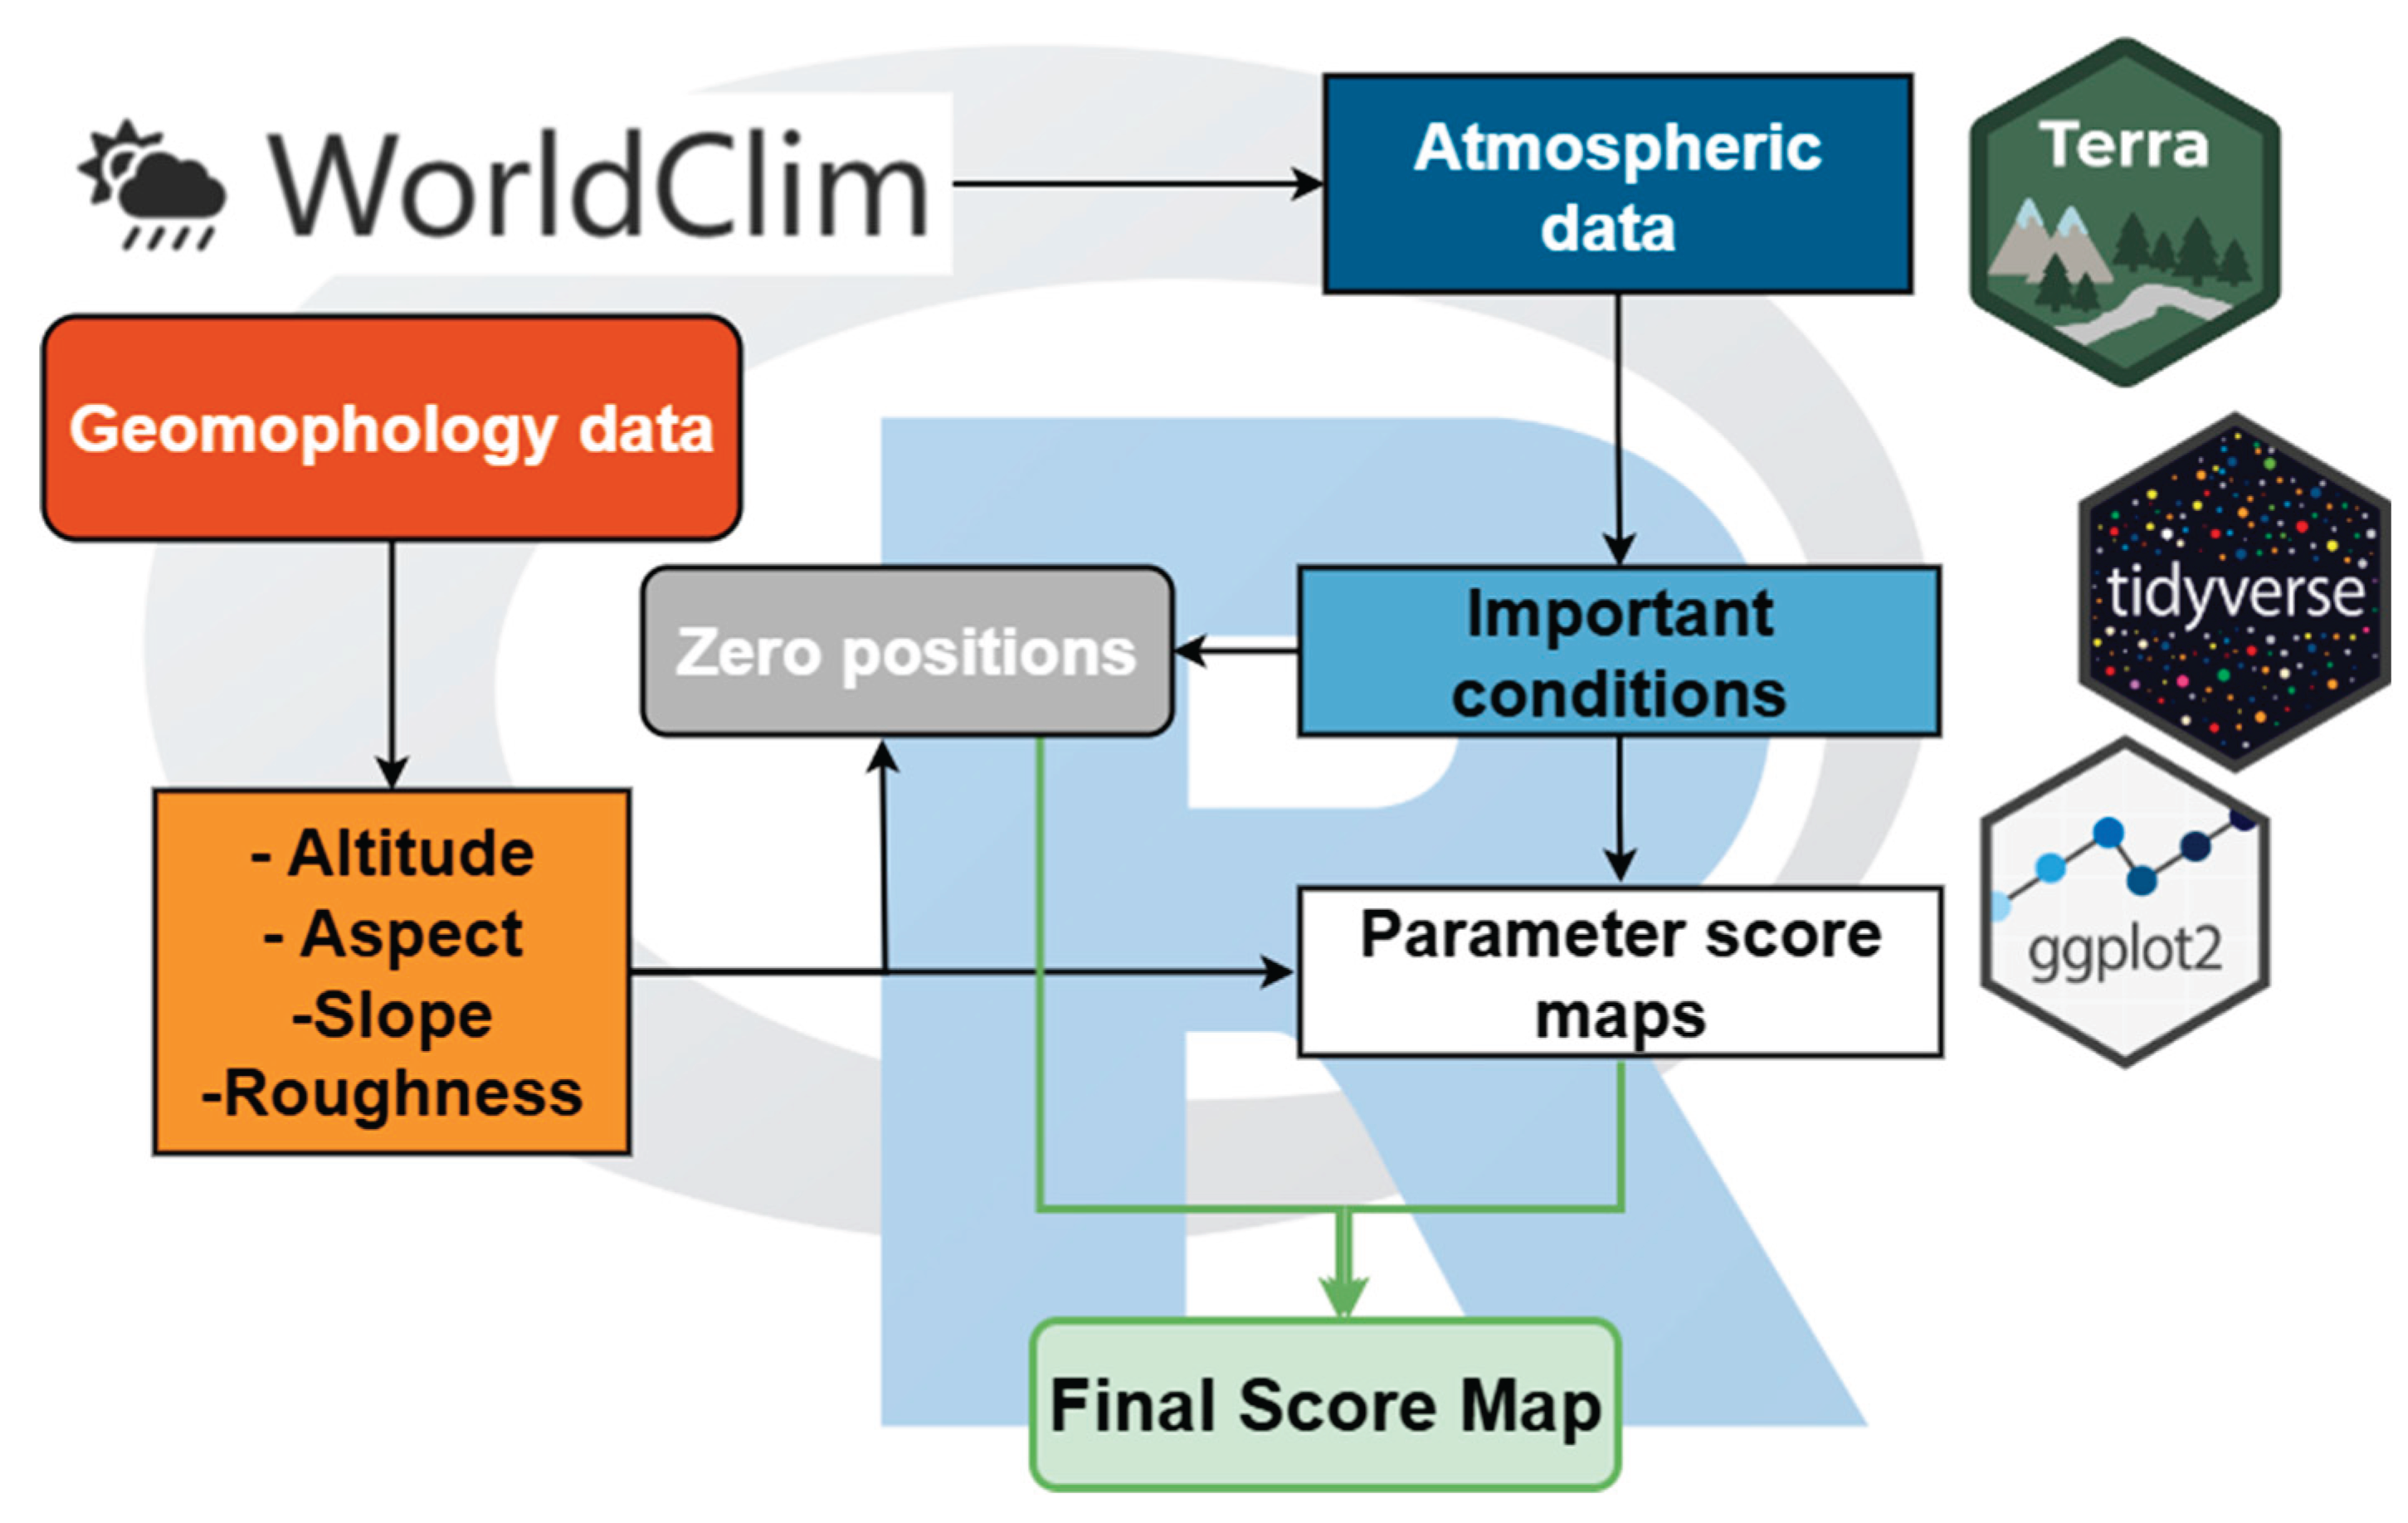
  • The geomorphological parameters after the classification to the suitability score (Figure S1 to figure S4) have been summed to a final geomorphological score raster. This raster has been linearly normalized to obtain a score from 1 to 10 for suitable sites. In case one parameter takes zero (0) score, this score remains to the final geomorphological map (Figure 2).
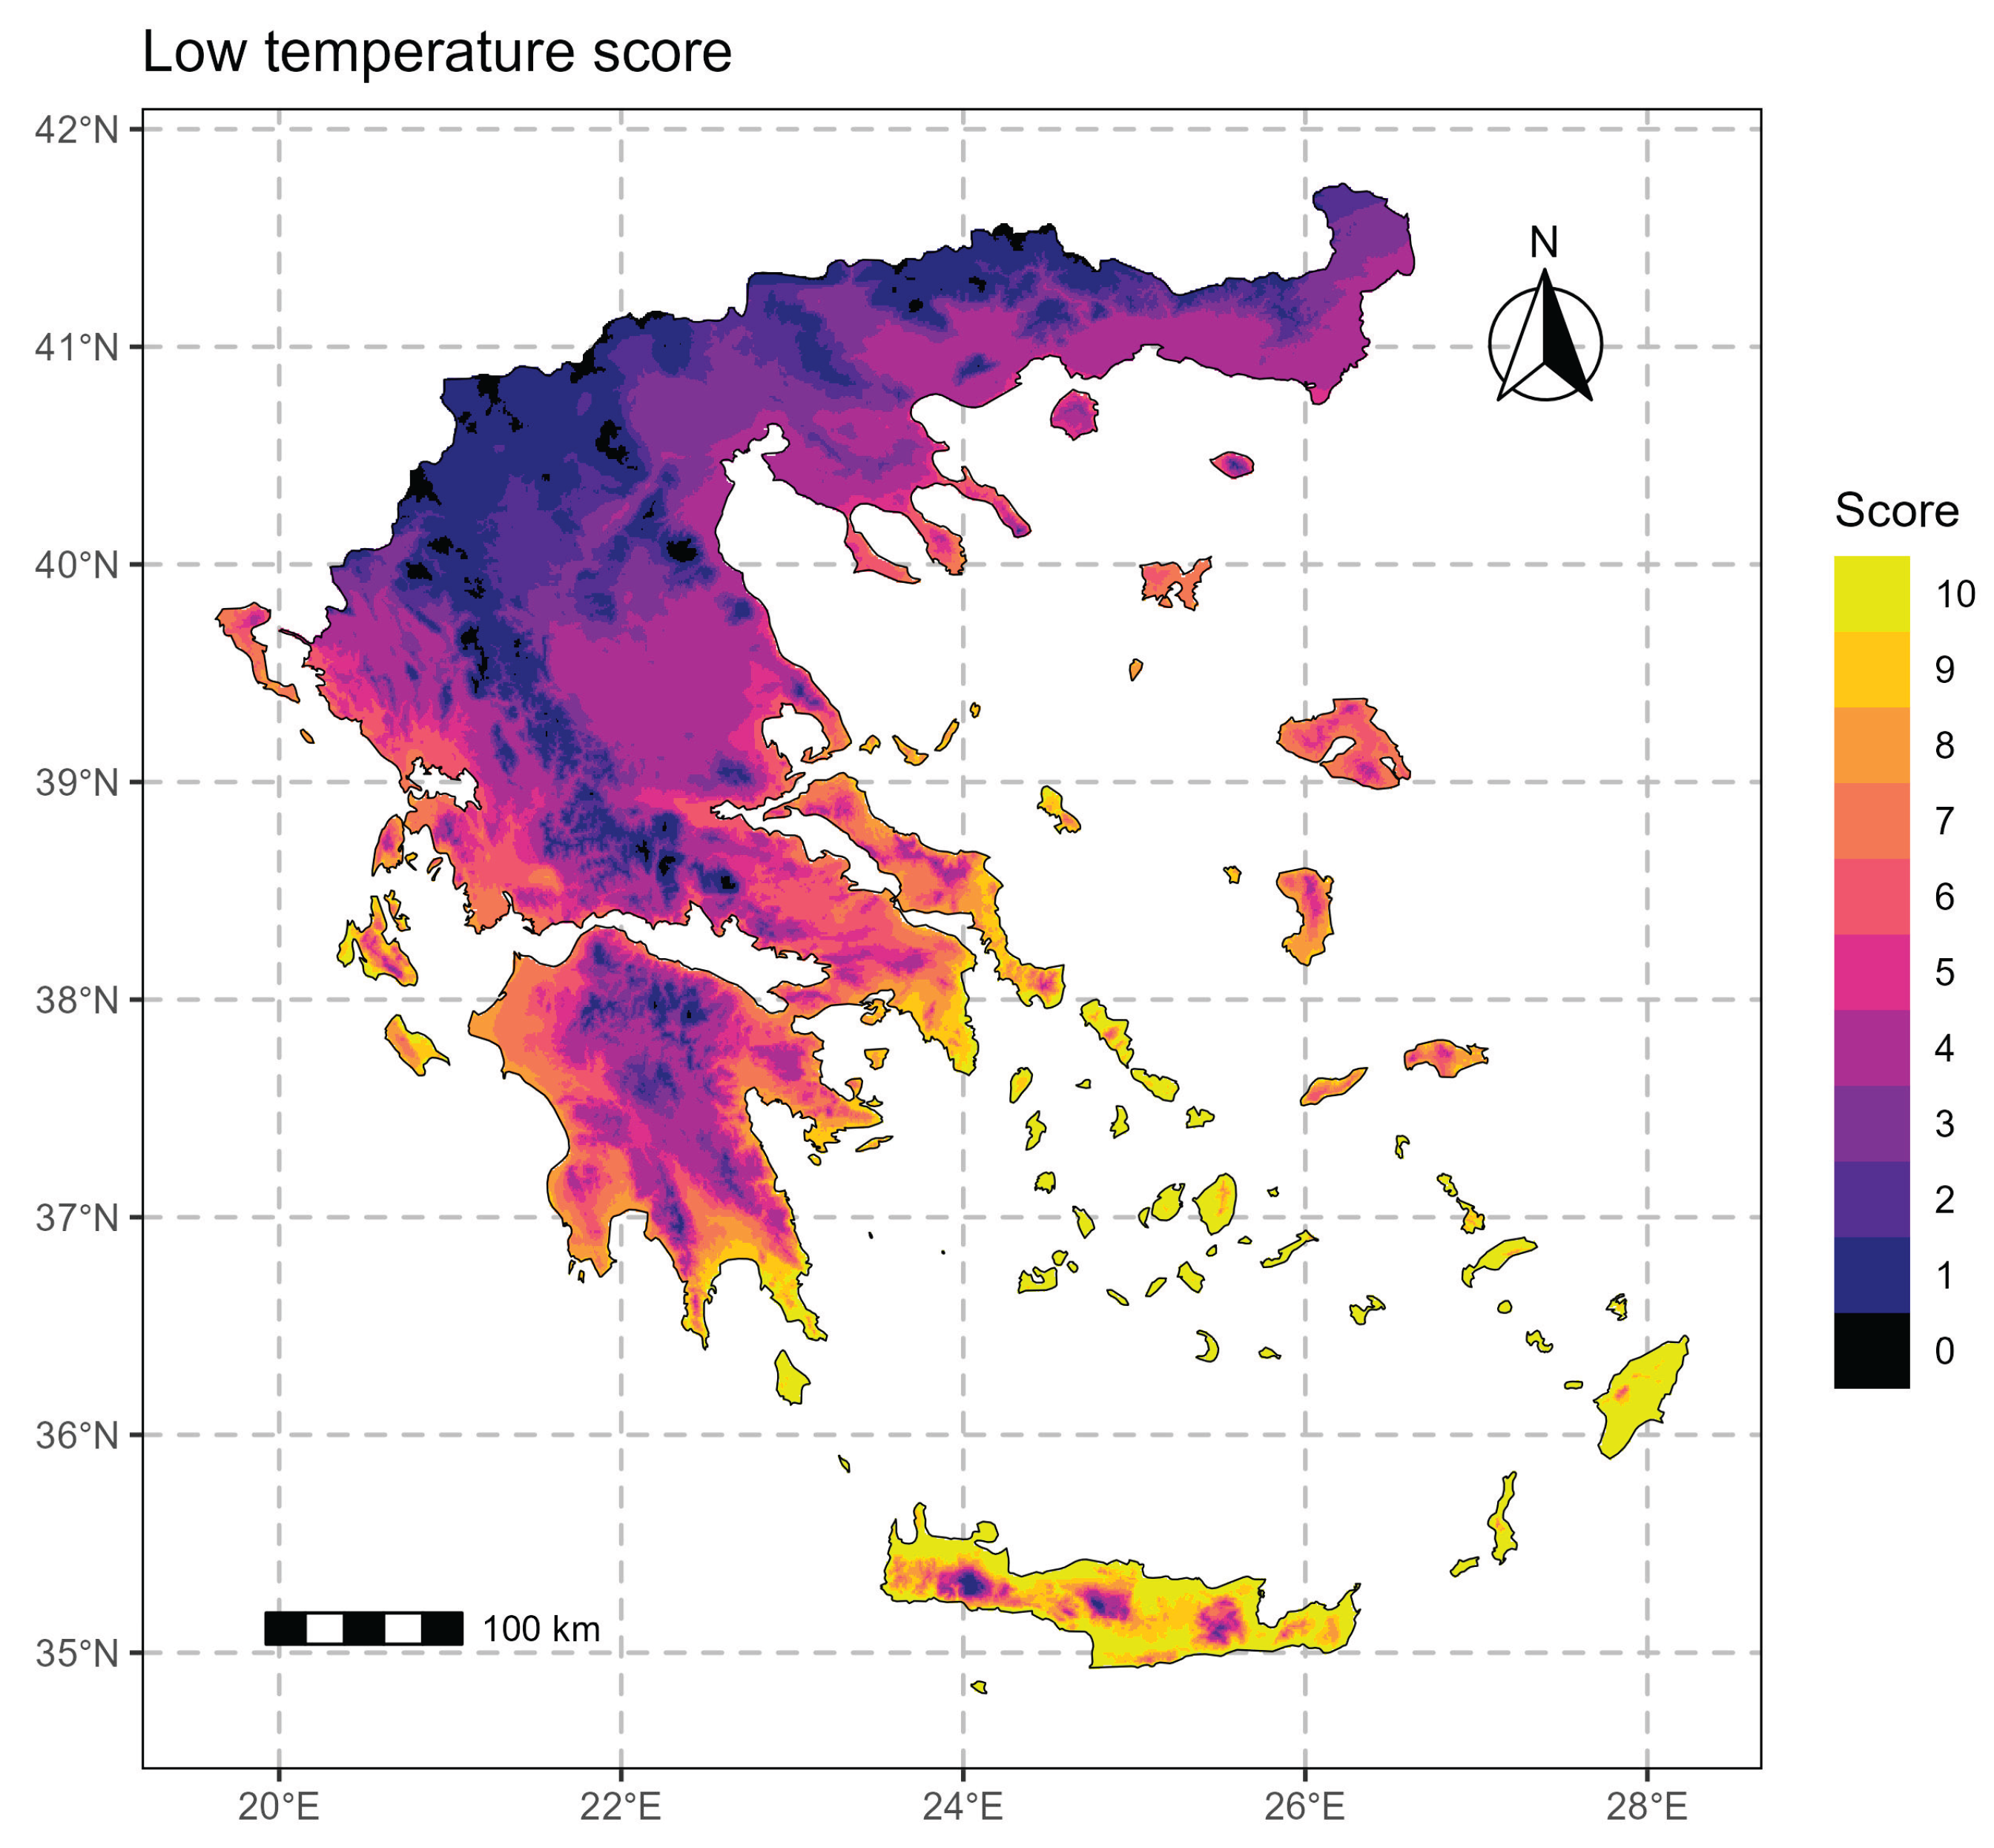
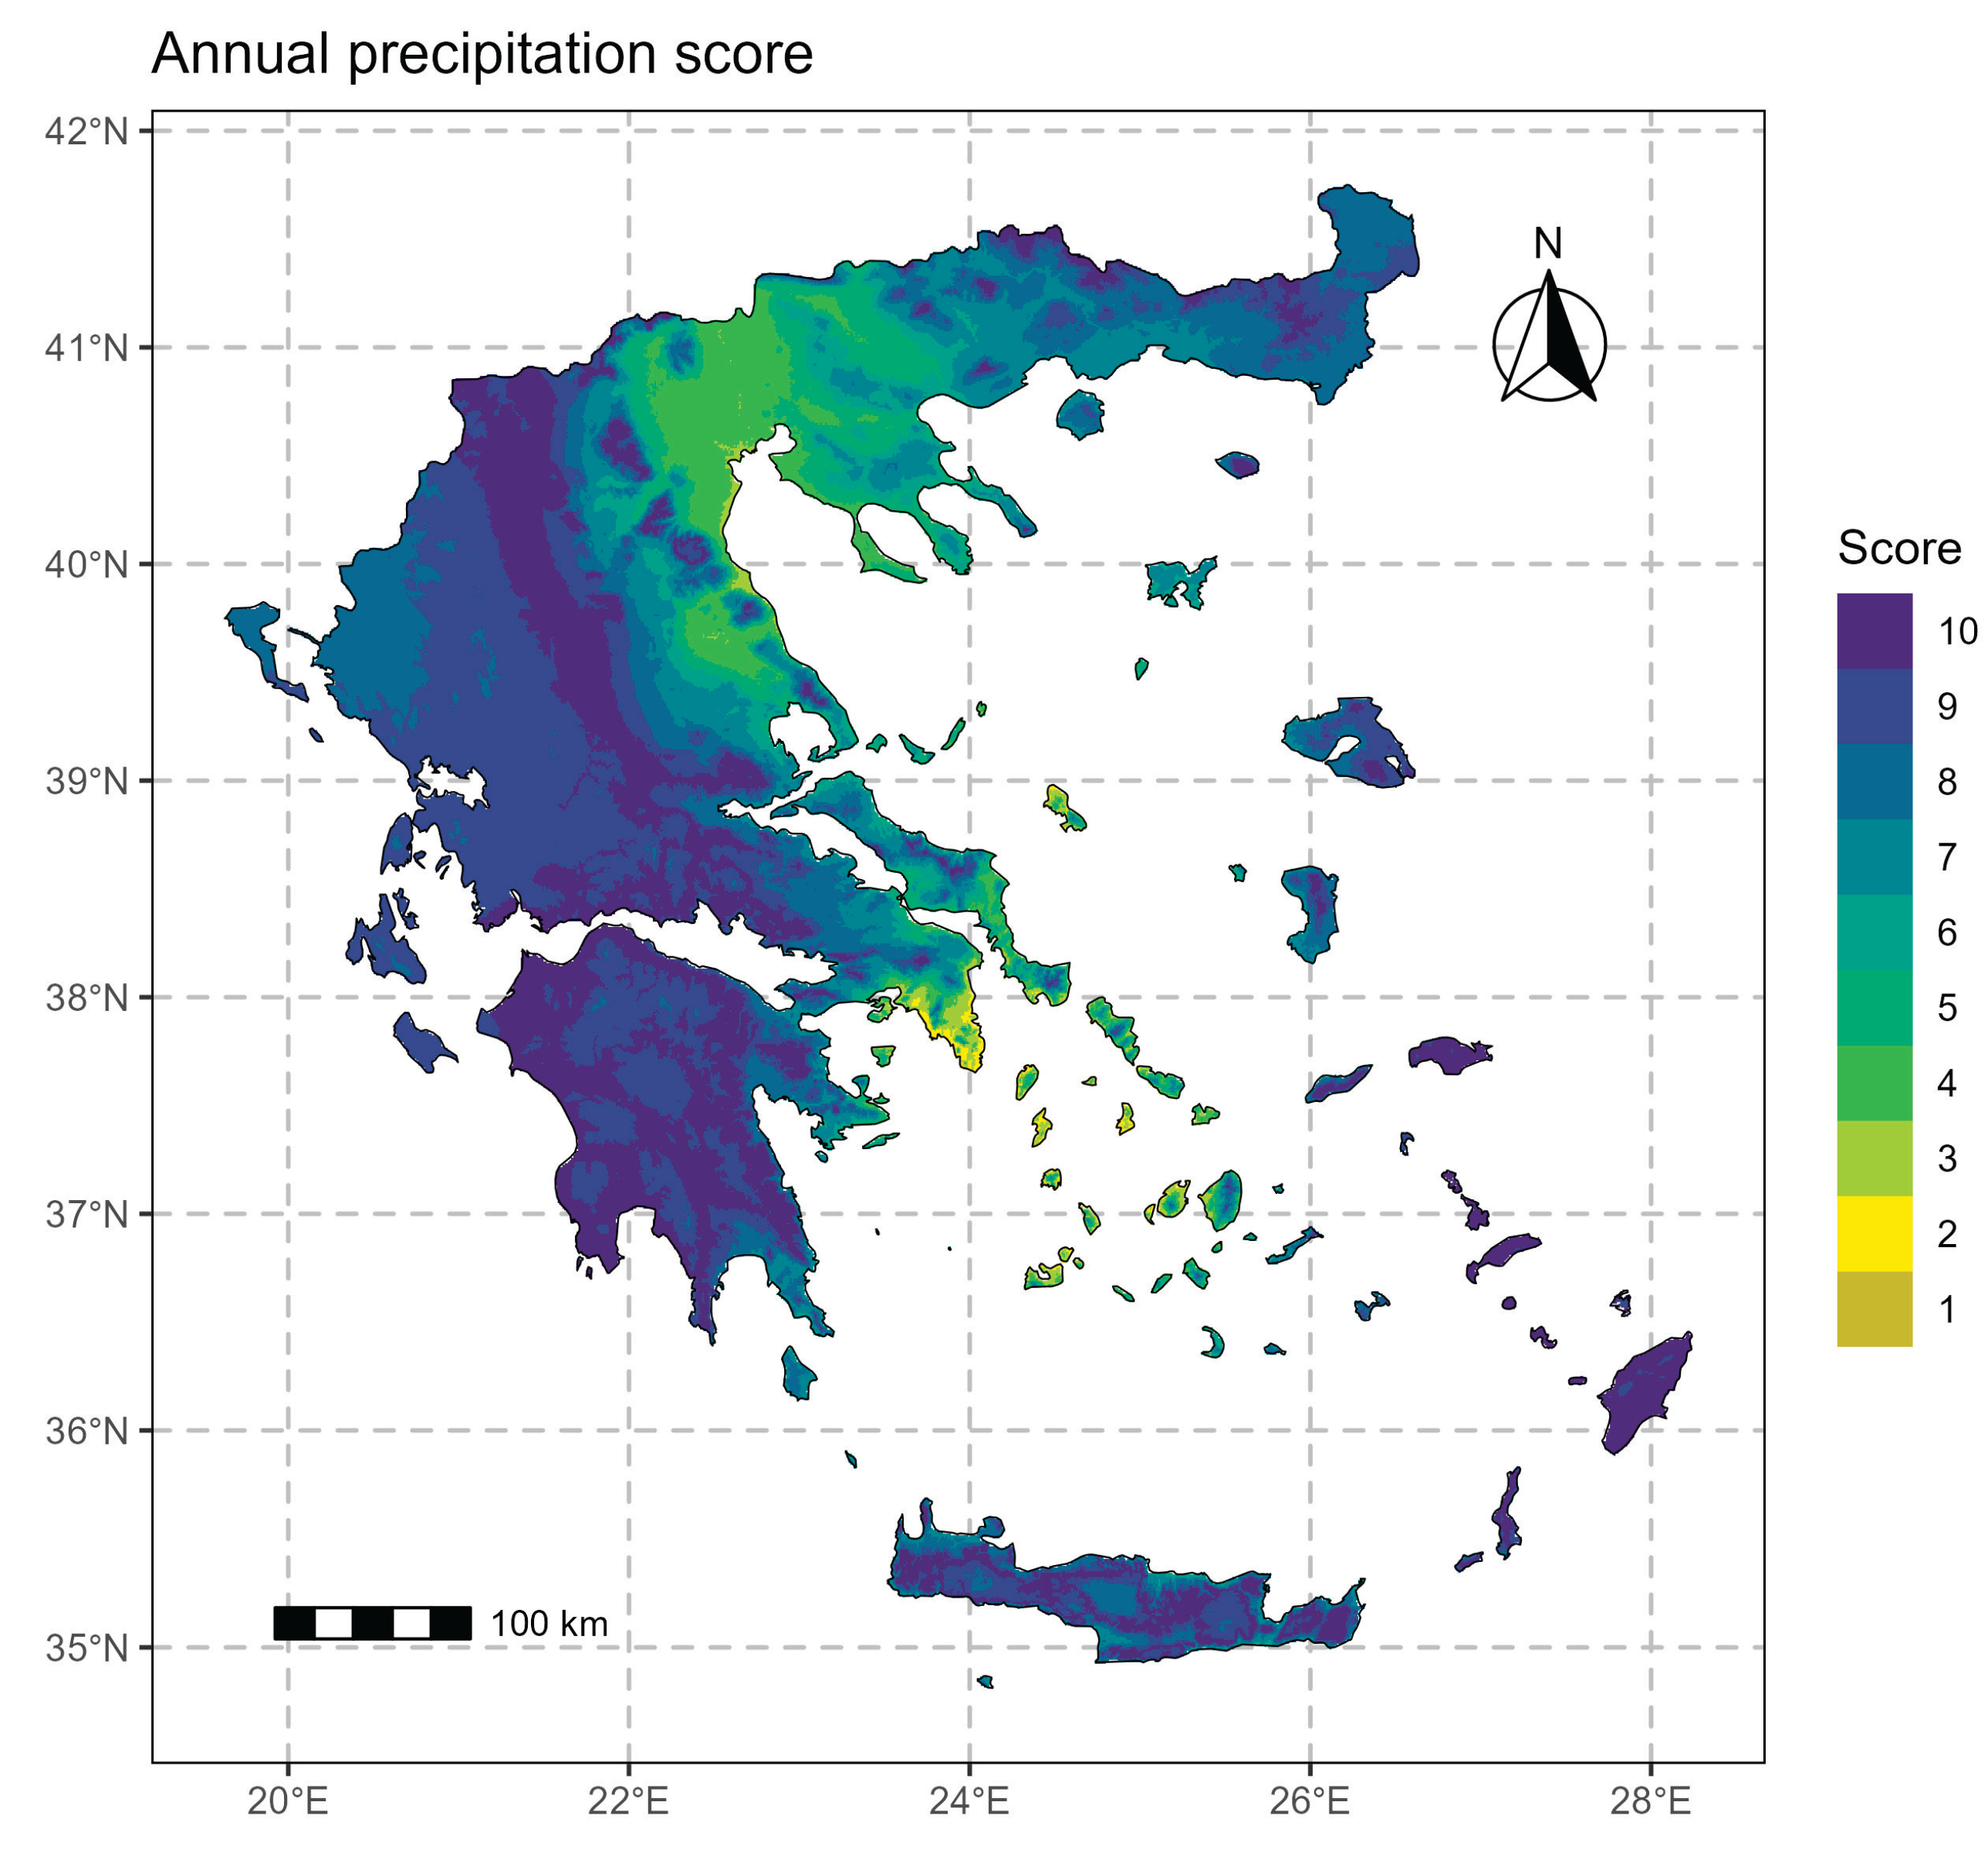
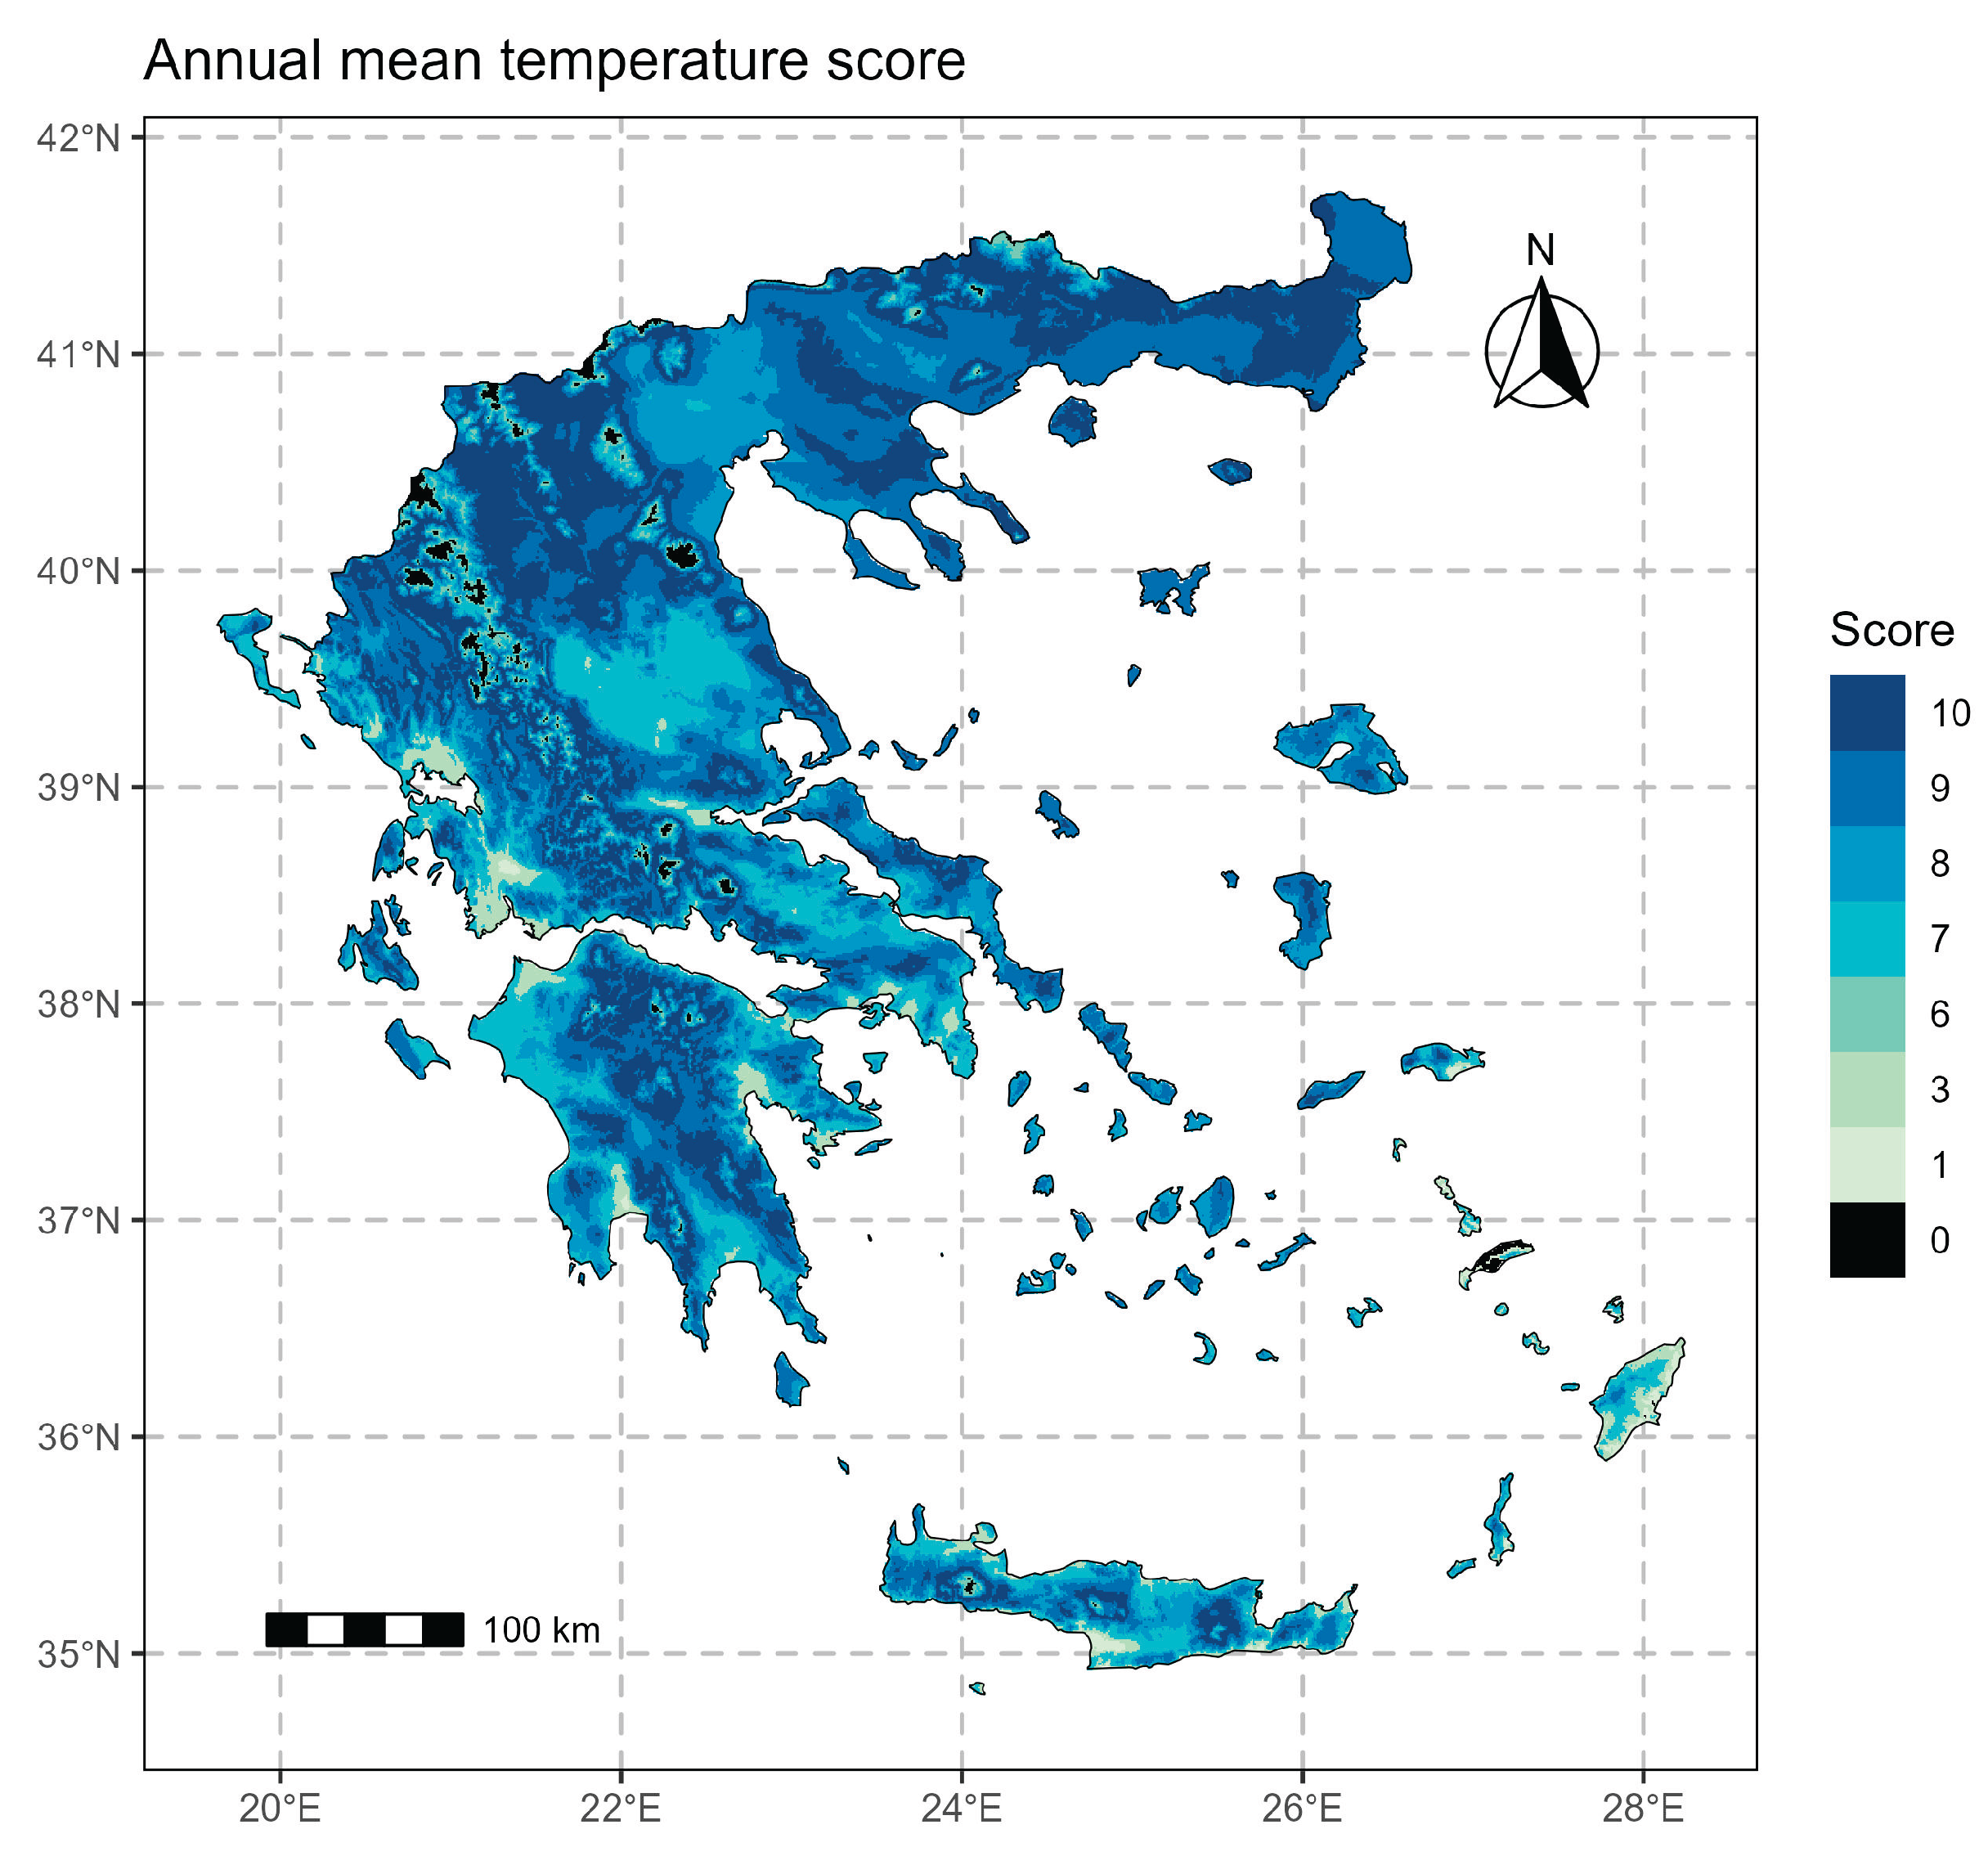
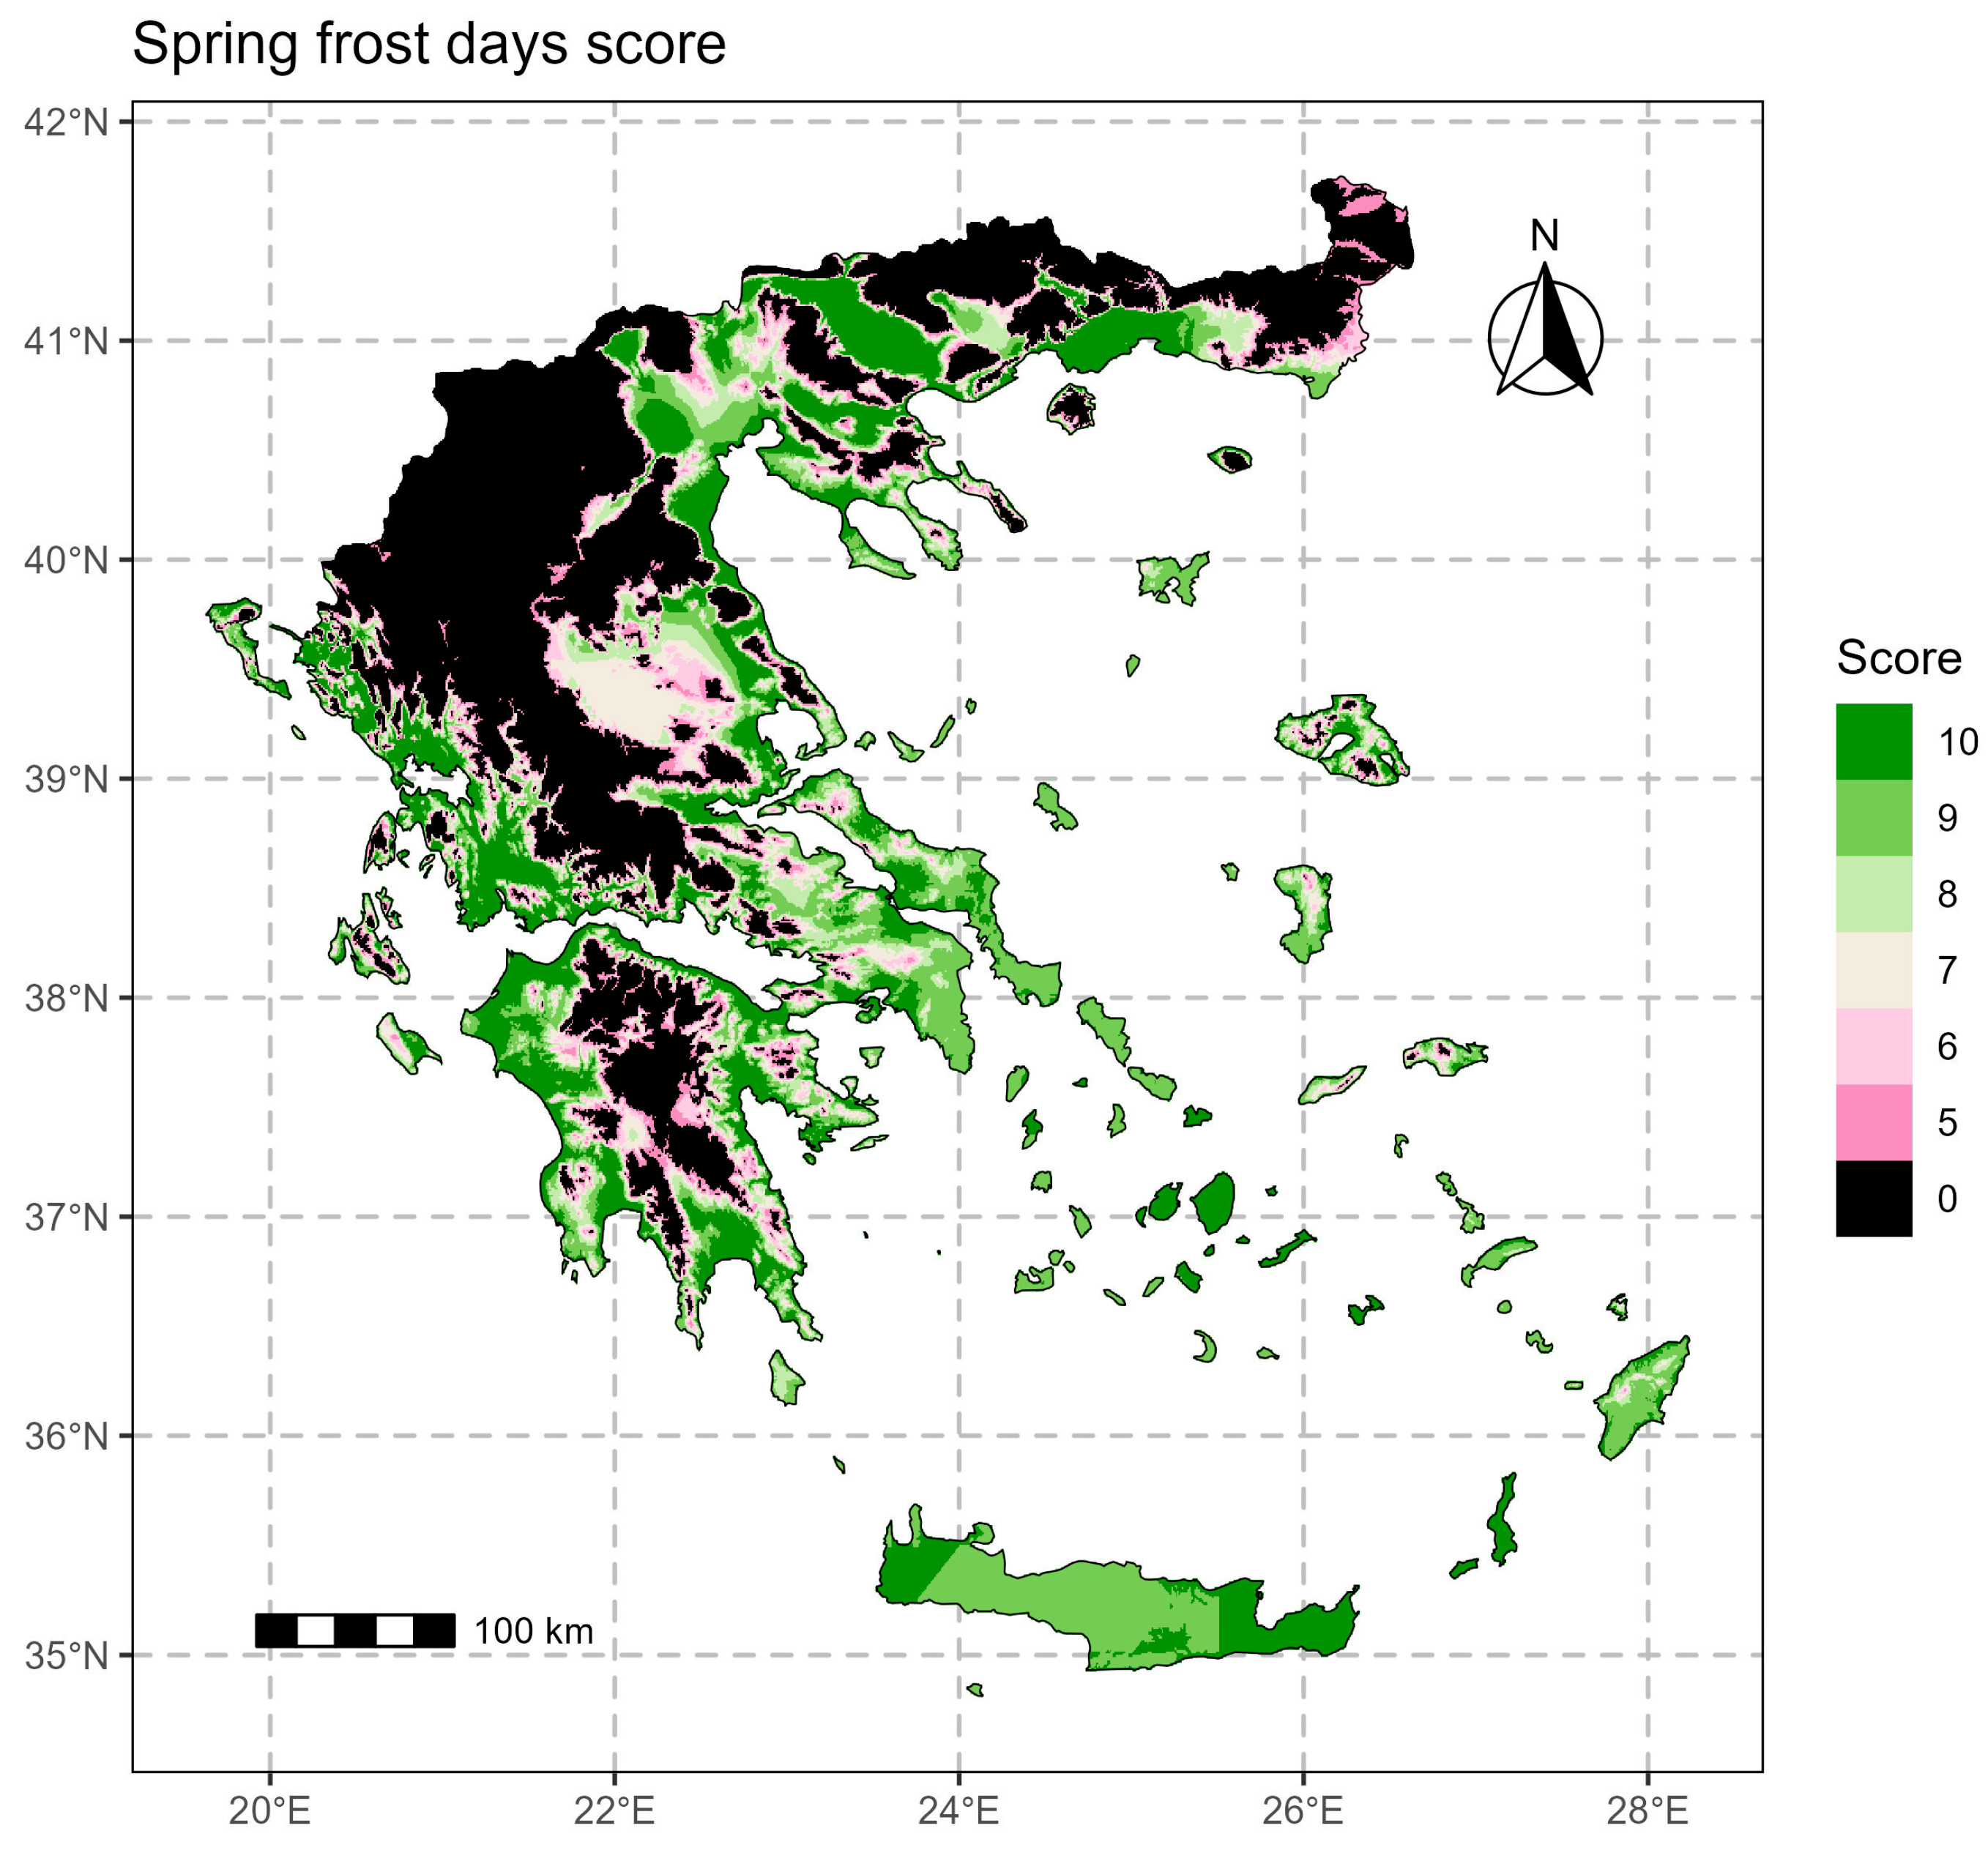
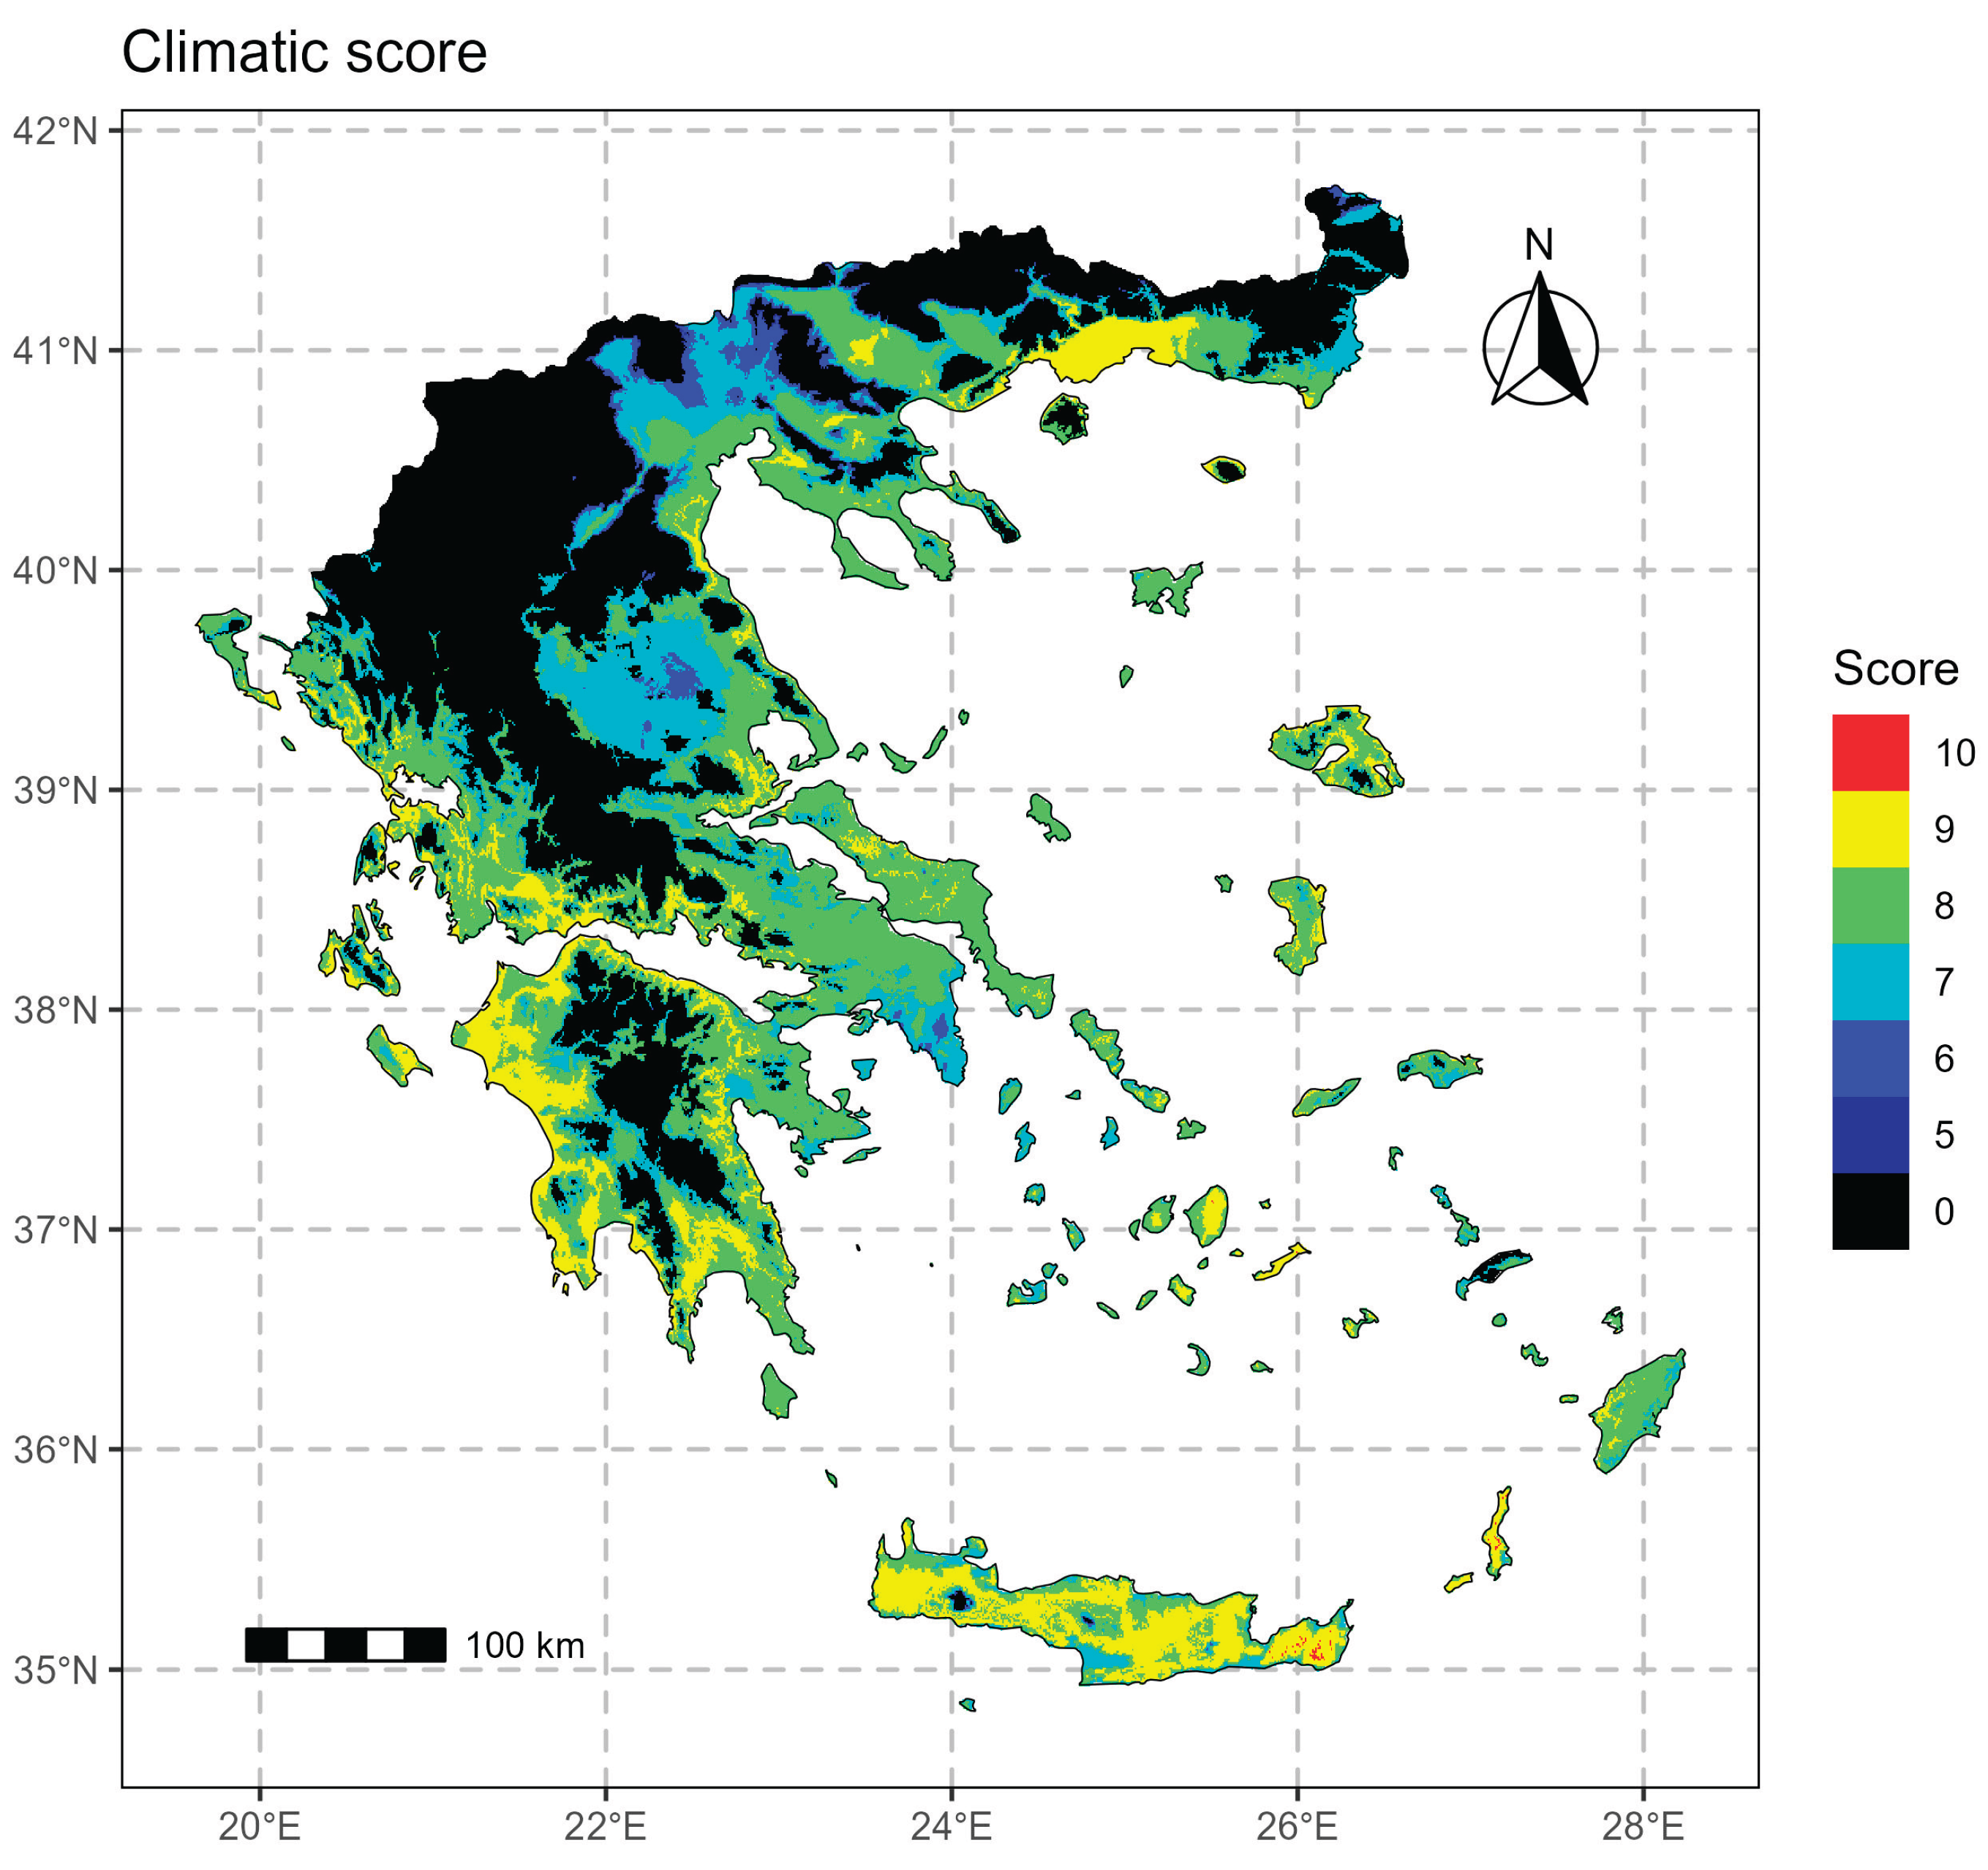
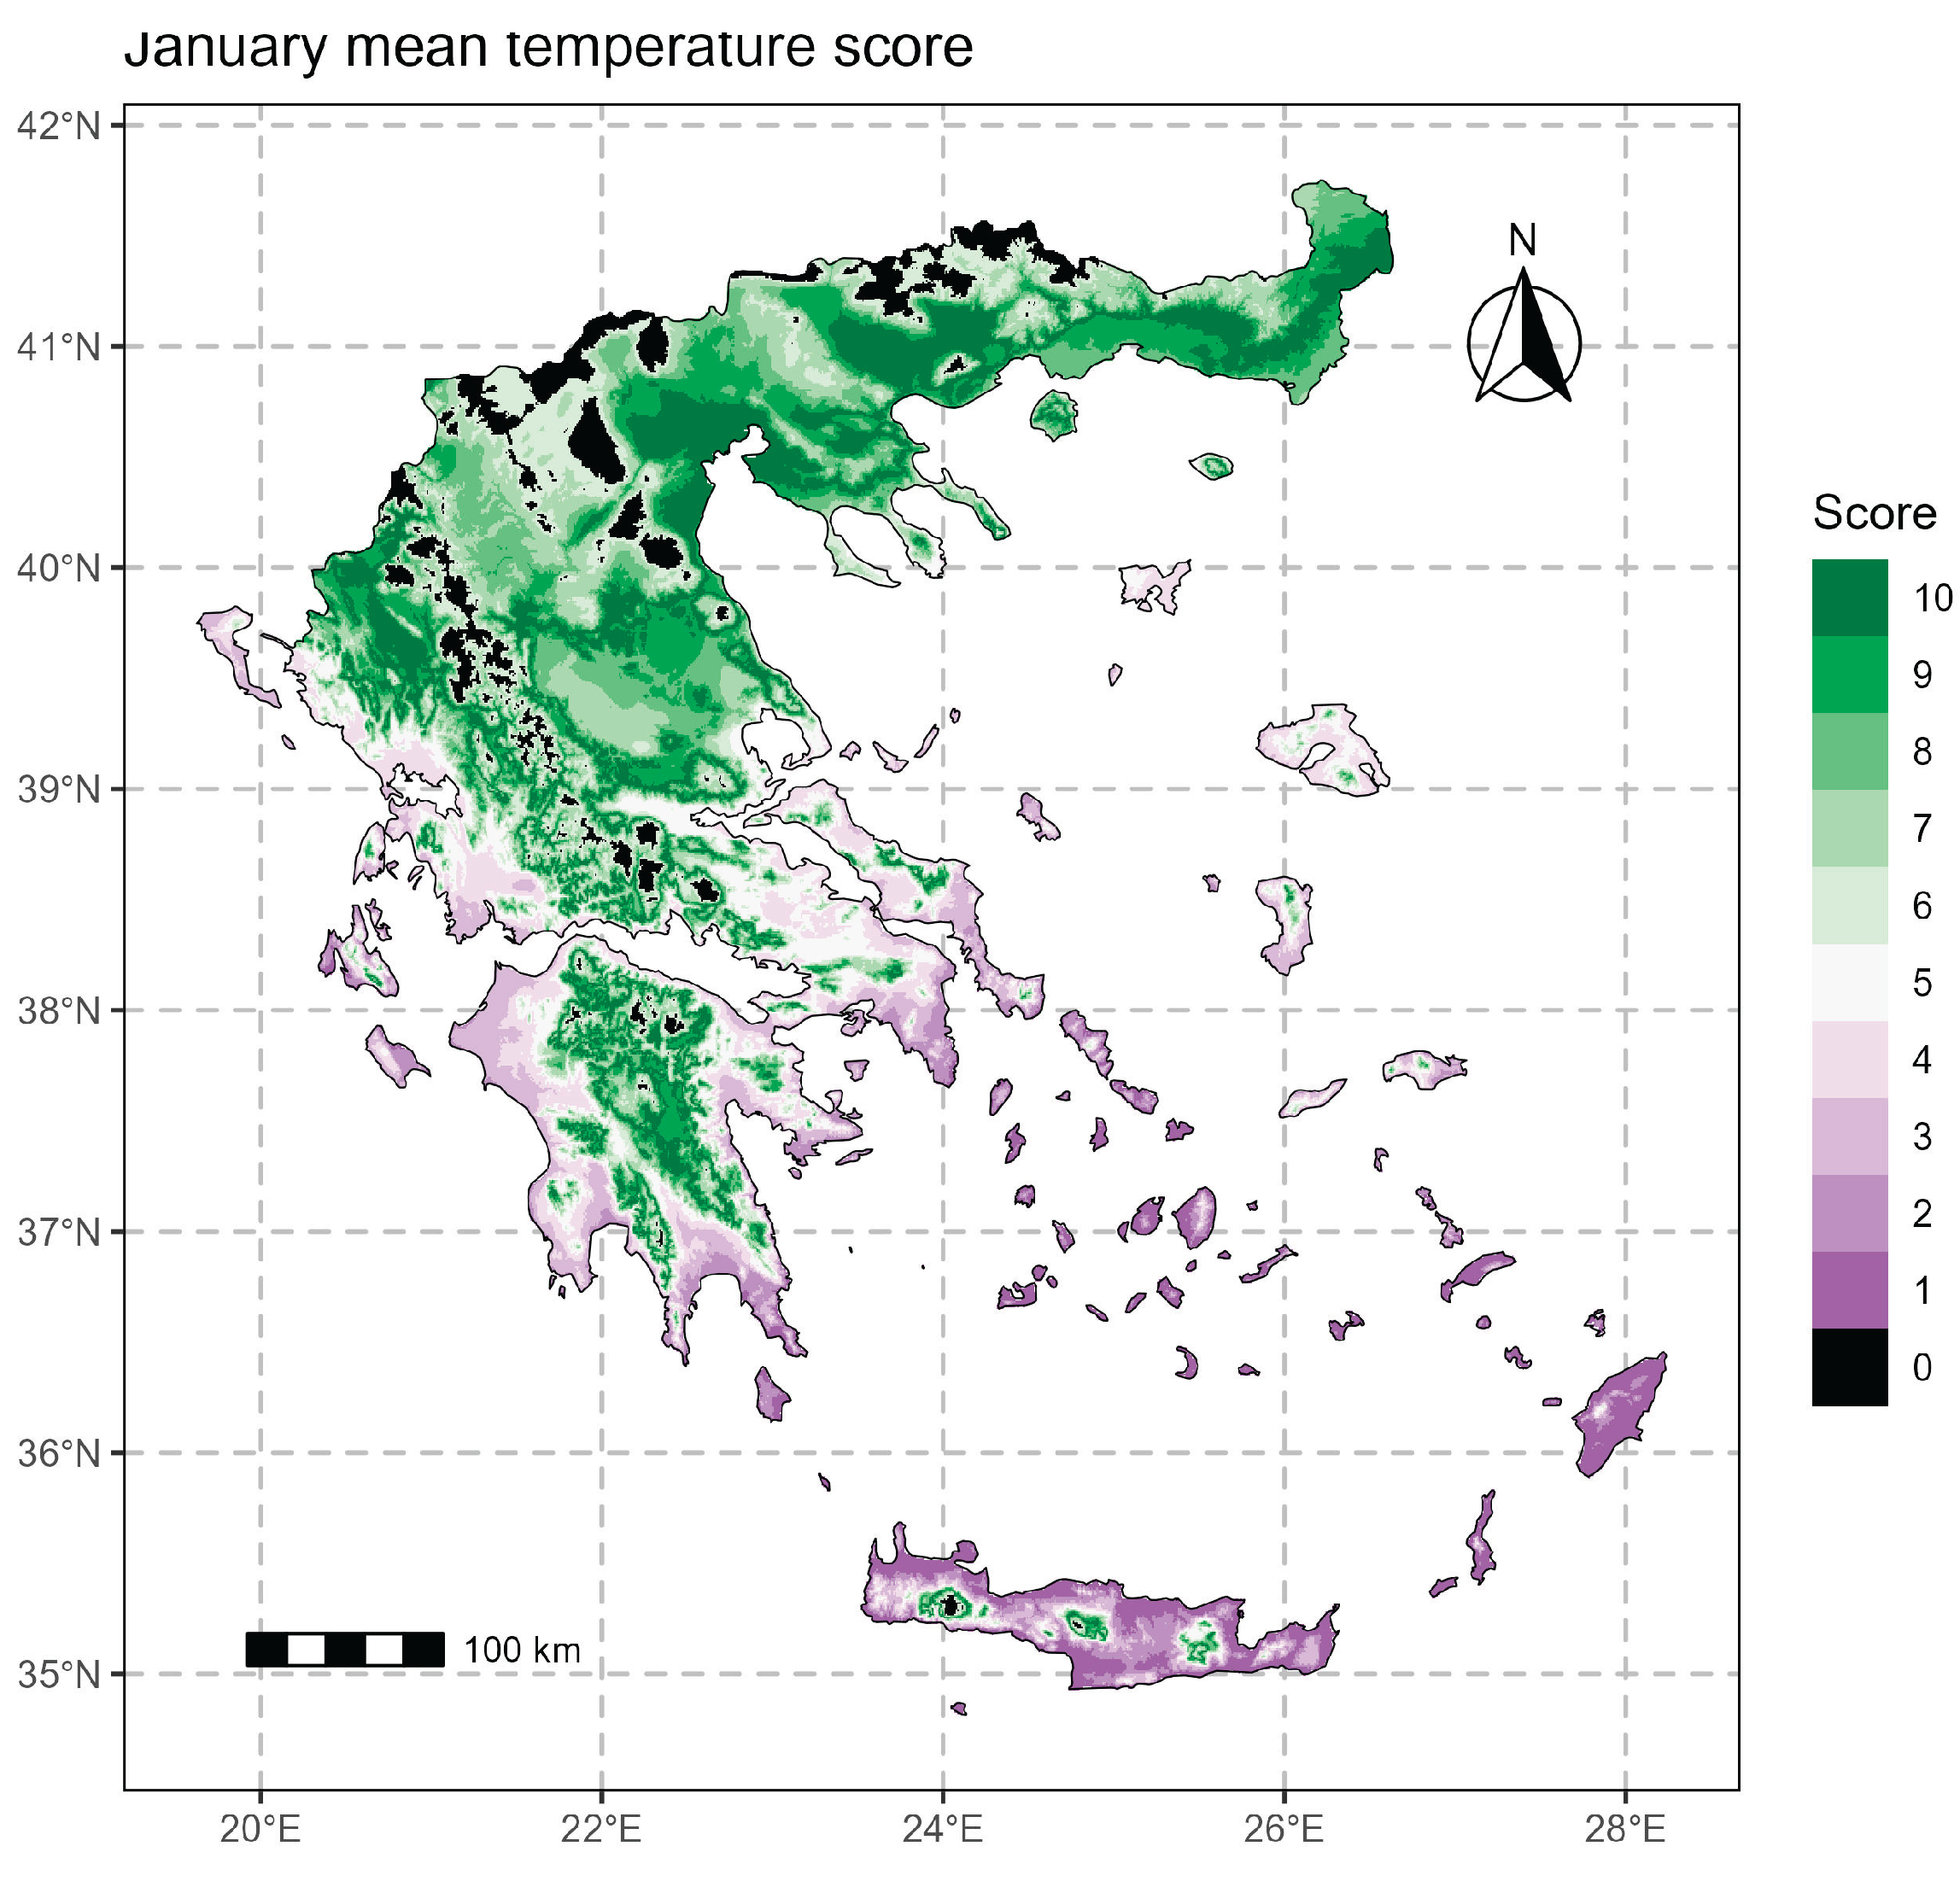
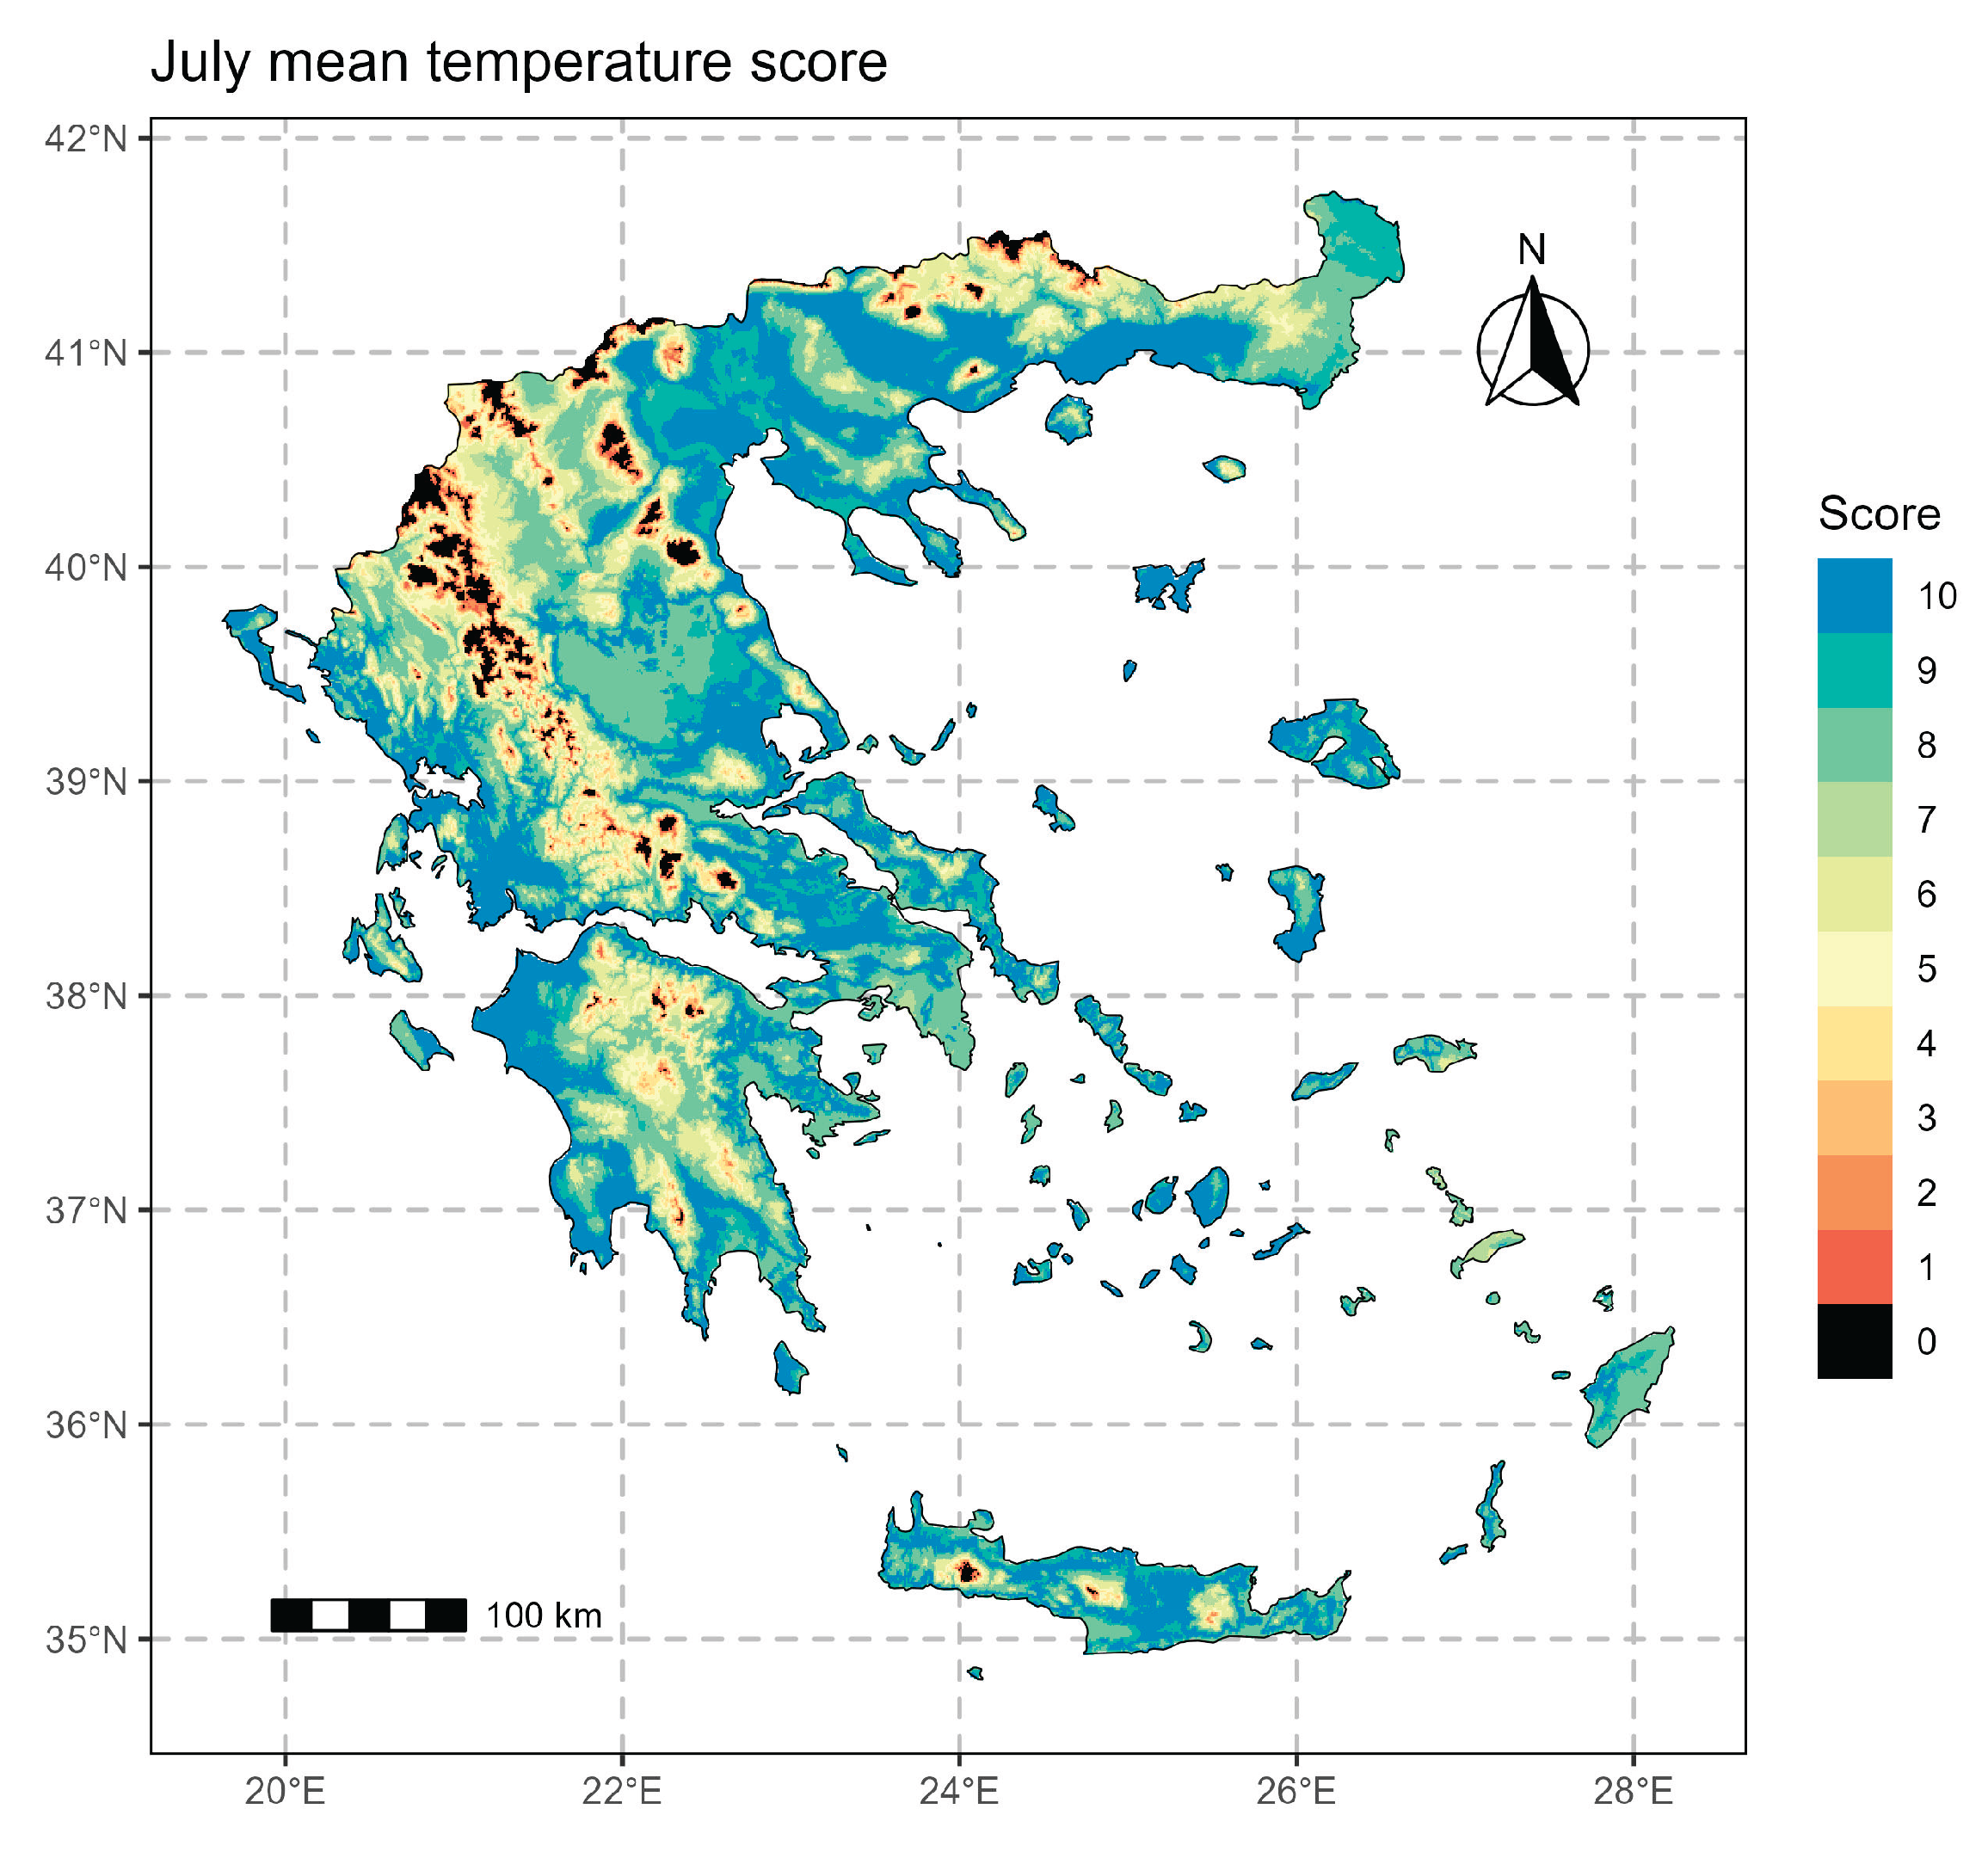
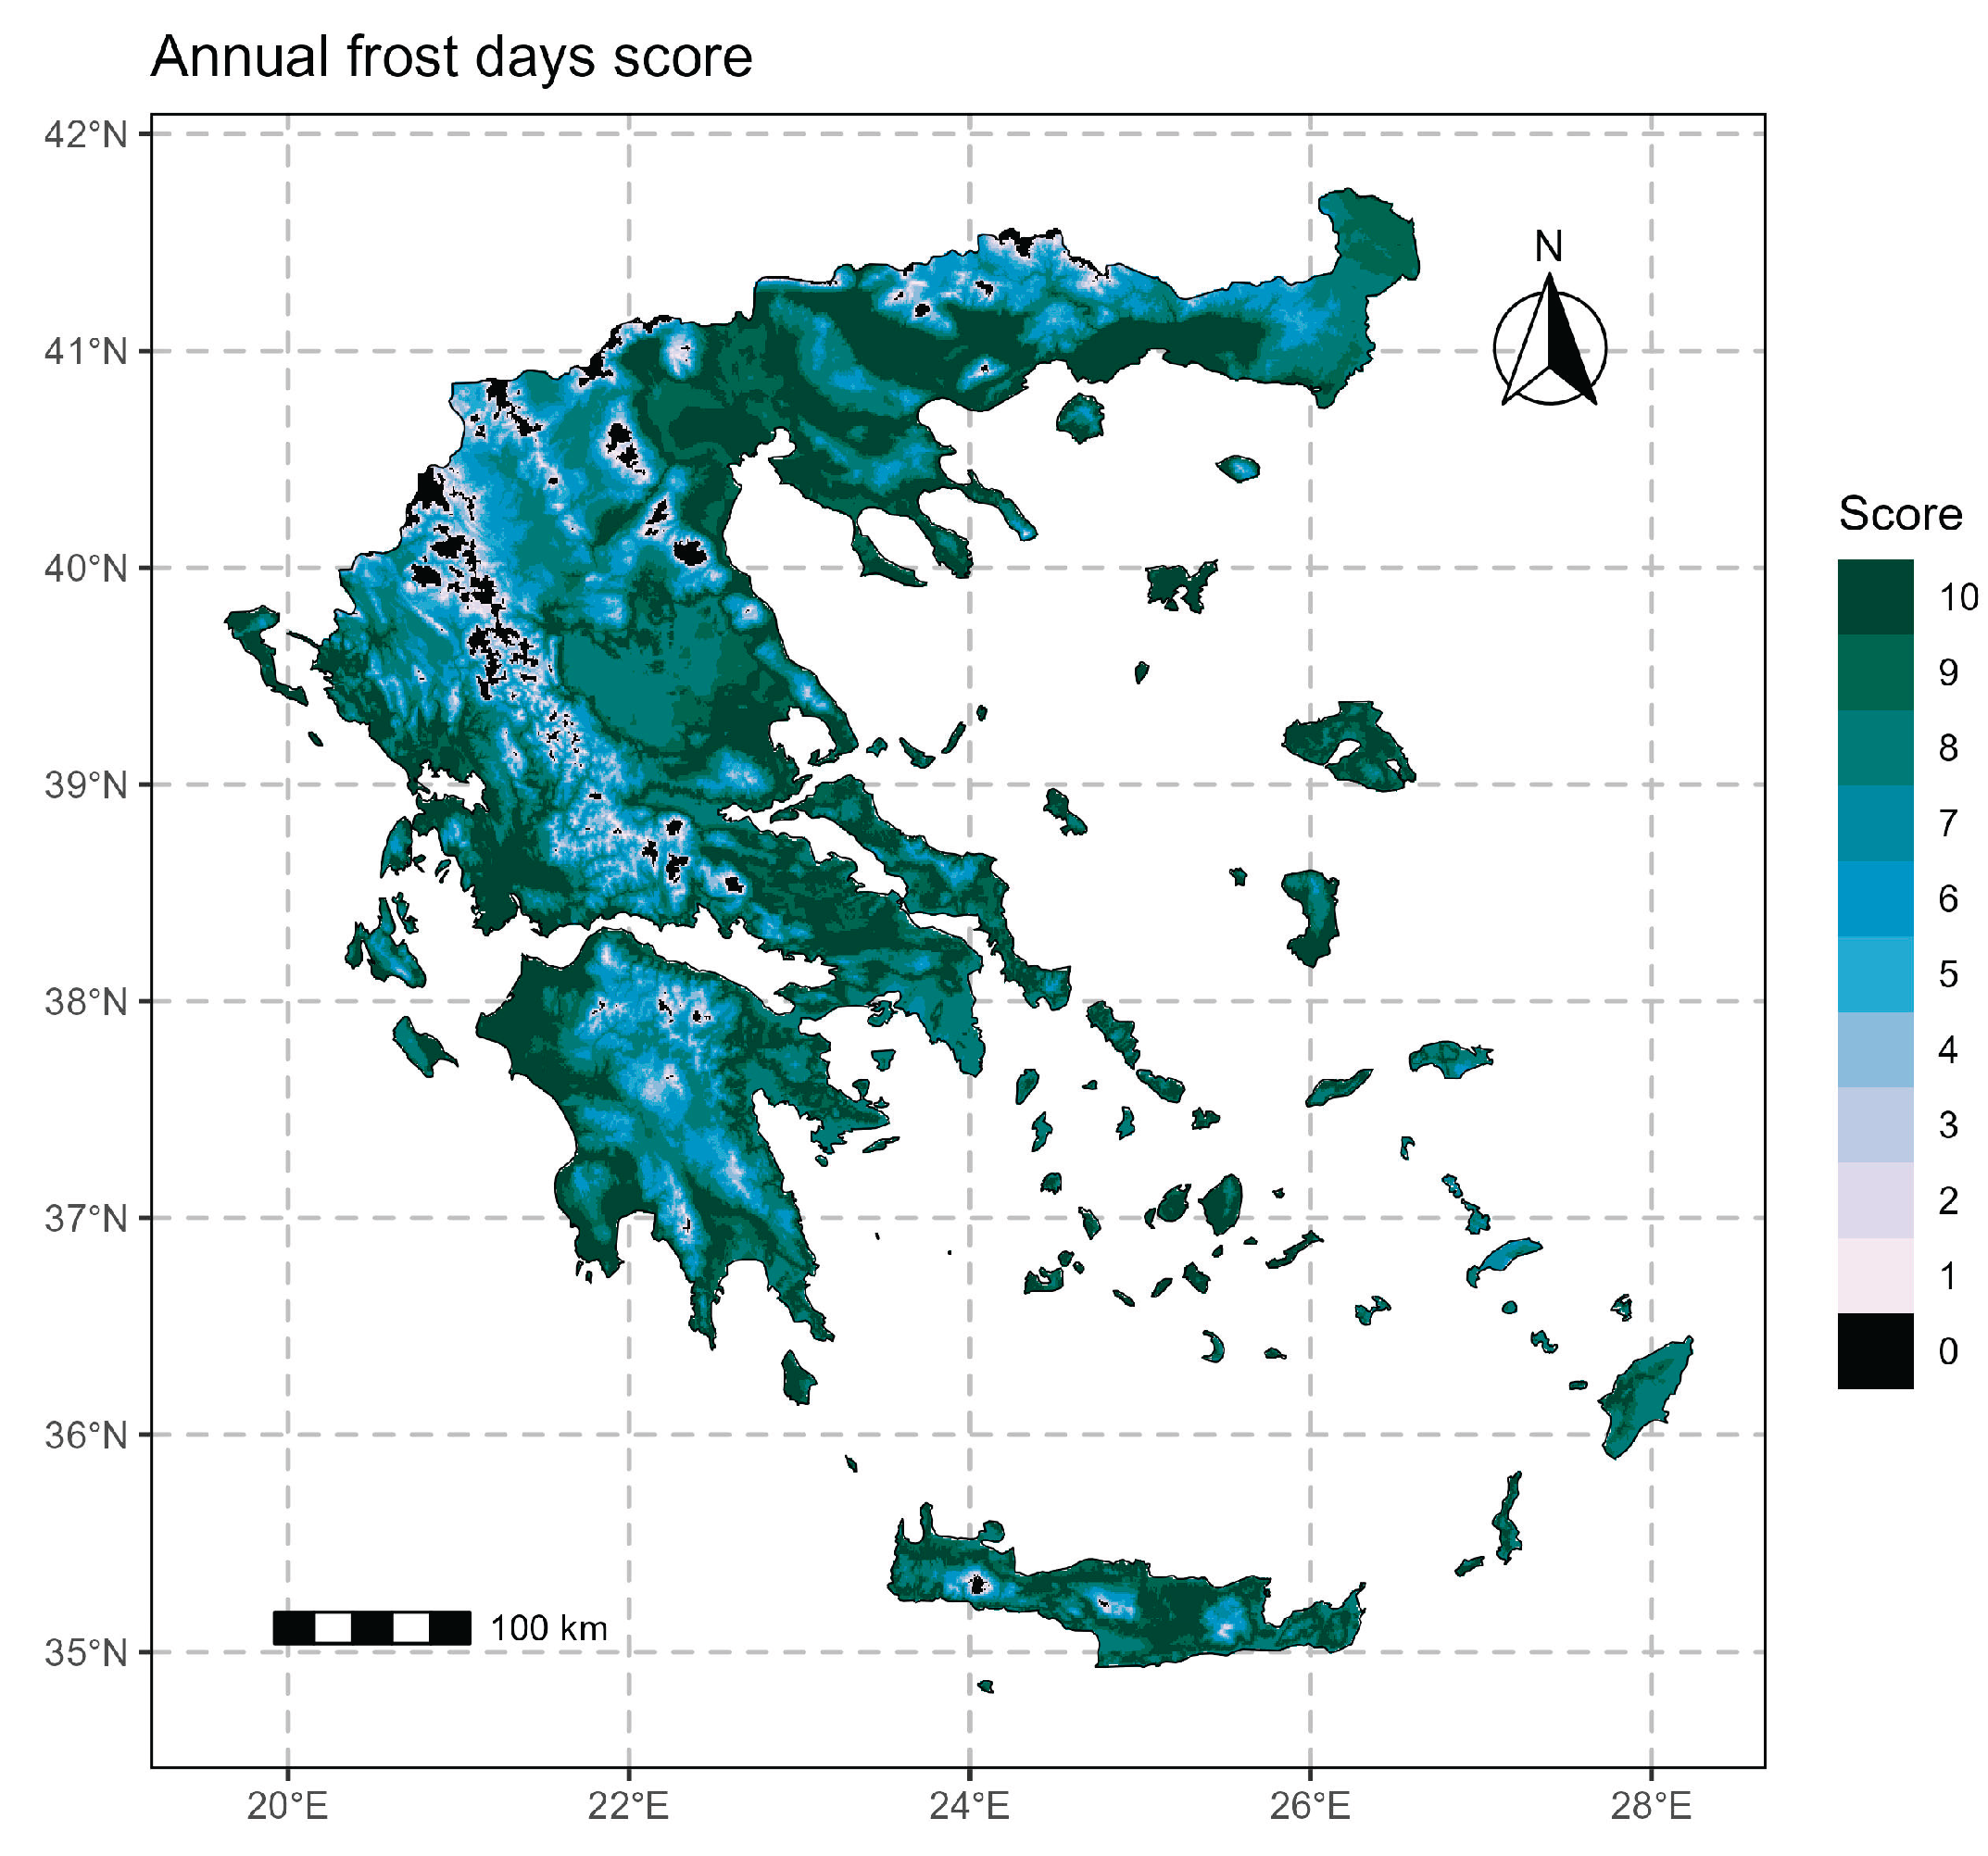
  • The climatic parameters rasters have been classified according to the related score tables (Table S5 to Table S11) and have been mapped (Figure 3 to Figure 9). After this step the climatic score rasters have been summed up to a final climatic score raster. This raster has been linearly normalized to have scores from 1 for the less suitable areas up to 10 for the optimal areas in terms of climatic conditions and has been mapped (Figure 10) accordingly. In case a climatic parameter does not allow olive cultivation, in the final raster has been set the zero score.
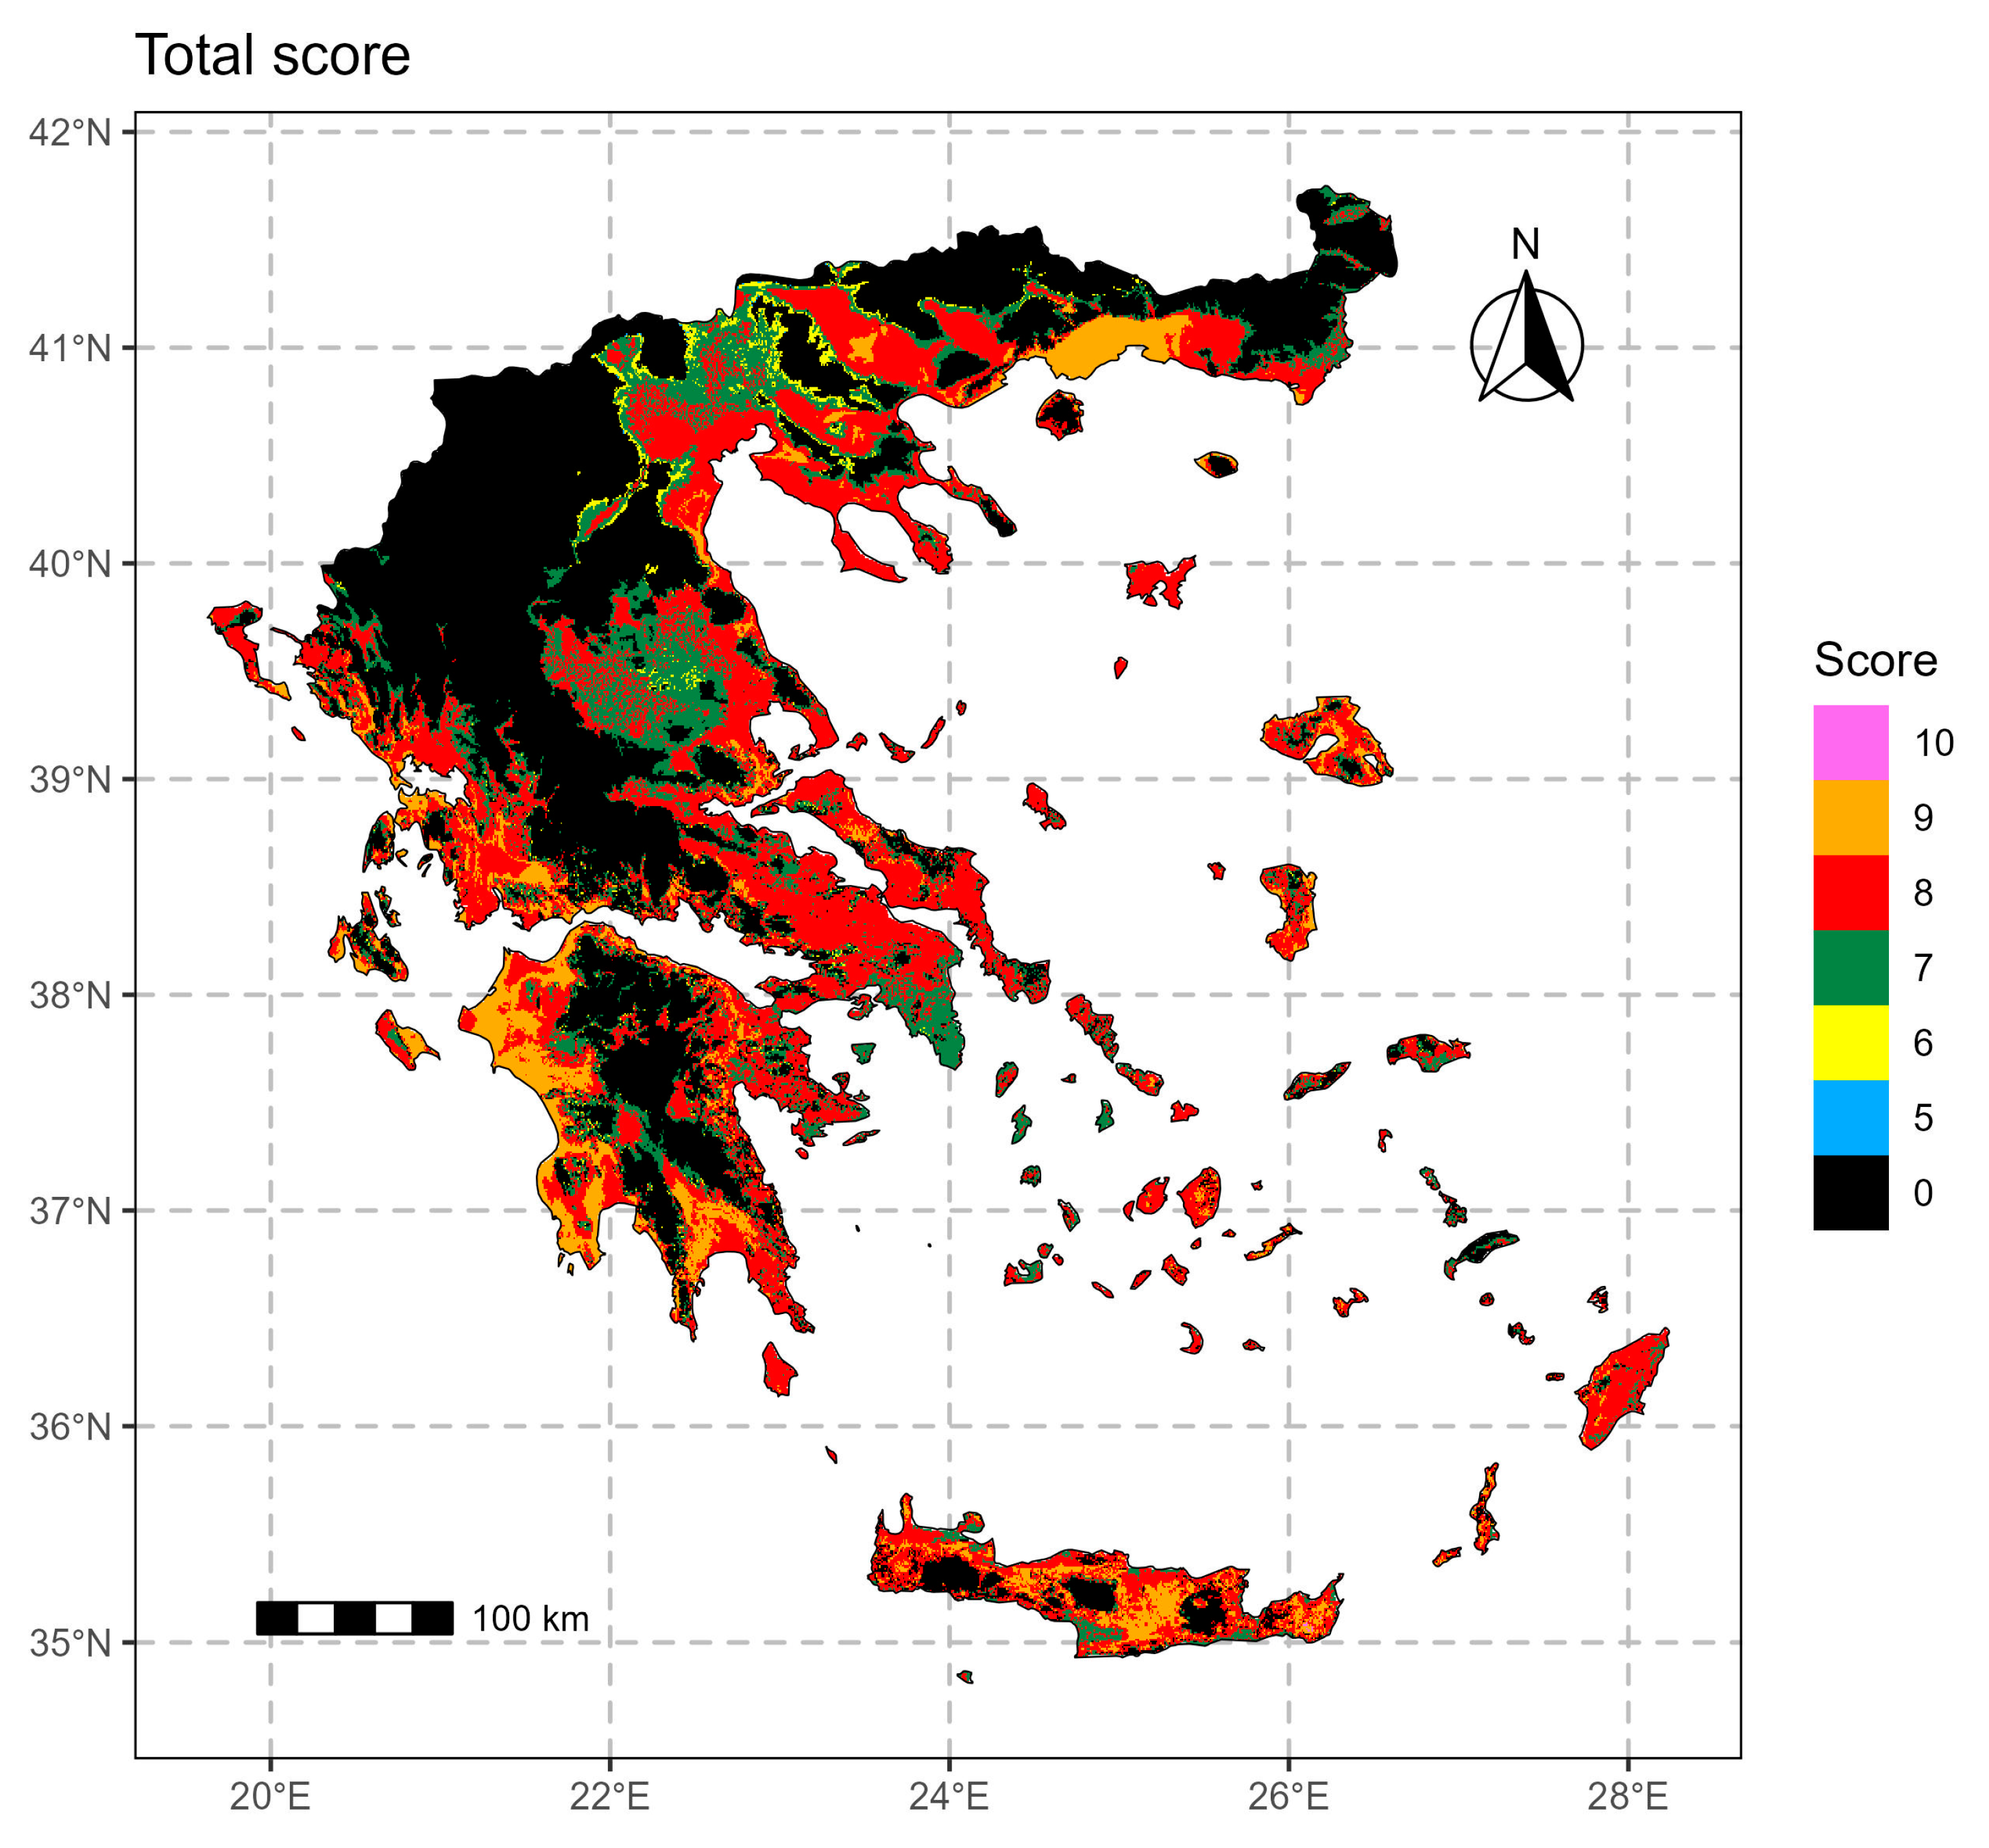
  • Finally, the geomorphology raster score and the climatic raster score have been added to a final suitability score raster. Geomorphology gives the 20% of the final score and the climate gives the rest 80% for this version of the model. The final score map has been linearly normalized to have scores from 1 to 10 for the suitable areas and 0 for unsuitable areas. This raster has been mapped in Figure 11.
Figure 2. Geomorphology score map.
Preprints 178175 g002
Figure 3. Low temperature score map.
Preprints 178175 g003
Figure 4. Annual precipitation score map.
Preprints 178175 g004
In order to clarify further the way we process the data, the low temperatures raster and its score map (Table S5 and Figure 3) is the minimum between months from November to March of the mean monthly minimum air temperature in a place. The annual precipitation raster and its score map (Table S6 and Figure 4) comes from the sum of annual precipitation in mm. The rest parameters are what their name’s declared.
All the above have been implemented using R language. So, we utilized packages (libraries) such as dplyr (Wickham et al., 2020b), terra (Hijmans et al., 2022), ggplot2 (Wickham et al., 2020a) and sf (Pebesma, 2018) for the utilization, management, analysis, and visualization of the overall applied geomorphological and climatic data, as it constitutes an appropriate tool for exploiting large volumes of data and creating maps and visualizations. Finally, comprehensive maps depicting the best distribution/scoring of olive cultivation from a climatic and geomorphological perspective and the conjunction of both elements, are illustrated over the entire area without further interventions.

3. Results and Discussion

The resulting olive’s geomorphological suitability map over Greece is shown in Figure 2. The presented color scale depicts the geomorphological suitability scores (0 for unsuitable areas and 1 to 10 for the suitable areas). The geomorphological suitability of each point on the map is formed by combining the results obtained from each of the parameters (Elevation, Aspect, Slope, Terrain roughness) for each point as mentioned in the materials and methods section.
As illustrated in Figure 2, many points correspond to the optimal suitability scores for olive cultivation. Overall, the geomorphology of Greece may be characterized as ideal for olive cultivation, except mainly for its mountainous areas (black colored mountainous points having zero score), where most geomorphological parameters correspond to the lowest score. The olive tree appears to be optimally grown in most of northeastern Greece, in a significant part of Central Greece, in most of the Peloponnese region, on many islands, and partly in the country’s western end.
The overall surface coverage of each geomorphological suitability score over Greece is peresented in Table 1. It is evident that, although a significant distribution of ~24% results as brohibiting (score 0), a large part of the country is suitable (41.44% relative to scores 2 to 7), while a quite extensive area appears with most optimal geomorphological conditions for oliviculture (34.44% corresponding to scores 8 to 10).
According to the score map shown in Figure 3, most of the country forms relatively suitable low temperature conditions for the olive groves, except for the mountainous terrain characterized by 0 score. More suitable environments gradually result southwards with low temperature scores over 7 (respective low temperature values over 5oC, Figure S5). These are mostly areas adjacent to the sea represented by the country’s central eastern–central western parts, significant areas of Peloponnese, and the Ionian and Aegean Islands, where most of the latter result with the optimal maximum score of 10.
The annual precipitation score map is illustrated in Figure 4. According to the model it appears that optimal precipitation conditions are formed over almost entire Greece peninsula with high scores between 7 to 10 (presipitation amount of 500–800mm, Table S6). Less suitable areas occur mainly in the country’s northern and eastern parts including some of th Aegean islands.
For the January mean air temperature, optimum scores over 5 (exceeding 8oC, Figure S7) are demonstrated in a significant part of mainland Greece (Figure 5) except for approximately the whole of the country’s islands where scores of 1 to 4 are dominative. Prohibitive conditions (0 score) appear in relatively restricted areas, mainly in upland Northern and Central Greece.
The domination of the optimal July mean temperature conditions is illustrated in Figure 6, given the extensive occurrence of scores 5 to 10 (respective 24–30oC, Table S8). Relatively unsuitable temperature regimes (scores below 3) along with the prohibitive 0 score result majorly over dispersed mountainous terrains (North, Central continental Greece, Peloponnese and Crete).
The mapping of the annual mean air temperature scores (Figure 7) reflects optimal conditions (15 to 23oC, Table S9) for oliviculture across the entire country. The less suitable and prohibitive conditions (below score 3 and 0 score, respectively) result in limited west central areas and restricted uplands of northern areas and of the Aegean islands.
Figure 7. Annual mean temperature score map.
Preprints 178175 g007
According to the annual frost days map (Figure 8), most optimal scores of 7 to 10 (20 to 0 frost days annually, Table S10) characterize substantial parts throughout the investigated area. Higher numbers of frost days (20 to 100) result majorly for upland Greece, while the restricting number of more than 100 days (score 0, Table S10) corresponds to the mountainous terrain considerably of continental Greece.
As exhibited in Figure 9, spring frost exceeding 5 days duration (0 score, Table S11) is unsuitable over a considerably extensive area. Scattered parts of the northern, central eastern-western mainland, around Peloponnese and most of the islands are excluded given their more optimal environment for oliviculture with scores of 8 to 10 (2 to 0 days, Table S110).
Figure 9. Spring frost days score map.
Preprints 178175 g009
The overall score of each point of the resulting final climate suitability map is shown in Figure 10. The mapping is obtained by adding up the individual scores of each point in the individual maps on all climatological indicators; maps of Temperature parameters (mean minimum values from November to March, mean January values, mean July values, mean annual values) and of Frost days (annual number of frost days, Spring frost days) (Figure 3,Figure 4,Figure 5,Figure 6,Figure 7,Figure 8,Figure 9).
As demonstrated (Figure 10), a substantial part of Greece is rated with 0, pinpointing thus many parts of the country as climatically unsuitable for olive cultivation. These parts include most areas of Northeastern and Central Greece, Central Peloponnese, especially located in the continental and mountainous regions. The same situation results for the Attica region and in minor parts of various islands, where the 0 score maybe attributed to either low rainfall or high temperature or to a combination of both. However, many areas in Central and Southern Greece result as suitable for the olive grove, while several others in which, although not corresponding to ideal conditions, the cultivation may be developed.
The overall surface coverage of each climatic suitability score over Greece is presented in Table 2. It is demonstrated that a significant coverage of 36.29% corresponds to 0 score highlighting unsuitable conditions for the olive cultivation. However more extensive areas covering 59.4% of the country’s surface result as more appropriate with scores of 8 to 10.
Figure 10. Climatic score map.
Preprints 178175 g010
There are no areas with scores ranging from 1 to 5. This may occur because when one parameter has a low score, another parameter for the same site may be zero. For instance, a site with a low altitude score might also receive a zero in the frost parameter. This signals a need for model recalibration in a future update.
The final suitability map for olive cultivation in Greece results from combining the overall geomorphological and climatic score maps (Figure 2 and Figure 10, respectively) and is demonstrated in Figure 11. The final score of each point was obtained by adding its individual score derived from the geomorphological and climatic maps, except for the points that were rated as unsuitable at least in one of the two maps. The final suitability map with respect to all the parameters examined (geomorphological and climatic) is analyzed by a colour scale corresponding to the aggregation of the climatic and geomorphological suitability and depicting the overall suitability score, ranging from the worst minimum score of 1to the optimal maximum score of 10 (zero values mean no suitability).
According to the resulting final suitability map (Figure 11), a significant part of the country is identified as unsuitable for olive cultivation (score 0). This fact is mainly attributed to the prevailing climatic conditions and the mountainous terrain that characterizes most of these areas. The unsuitability arises throughout Greece, mainly in the country’s Northern and Central parts and mountainous regions. Several areas characterized by improved suitability scores are observed further south. Although the combination of both climatic and geomorphological parameters may form a prohibitive environment (score of 0) for oliviculture in a significant part of the investigated area, it is demonstrated that good and high scores correspond to several places across the country. Thus, Greece partly appears to possess ideal conditions for olive growth, which documents the widespread appearance of oliviculture in spatially extensive areas. At this point, it is imperative to emphasize that these results are derived by considering only climate and geomorphology components without any other interventions (e.g., irrigation, soil texture and fertility, labour costs, pests hazard, etc).
Figure 11. Total score map.
Preprints 178175 g011
To have an accuracy test for the presented model and mapping, we use the Corine Land Cover (CLC) dataset which identifies several land covers classed over the European territory (Büttner, 2014). This data set provides information about the existence of a land cover, in our case olive groves but without information about the productivity of the trees etc. But it is a reliable test for the presented model.
Figure 12 presents the score over the existed olive groves according to CLC and Table 3 presents the percentage of Greece’s surface covered by each total suitability score resulting from the model and the respective surface covered by olive groves. It appears that the high values of the model coincide with the identified olive cultivation areas according to the CLC. This is demonstrated for example by the resulting 32.23% total area with a suitability score of 9 and the identified olive grove area covering 58.53% of the country’s surface. We pinpoint that there is no zero scores over the identified olive areas so we don’t have false positive errors. Moreover, we see that over existing olive areas (CLC) we have scored 6 and higher, which is a strong signal for the reliability of the model. On the other hand, we have low surface coverage (%) by score 10 over existing olive groves. This result is a signal for a need of model’s recalibration in future versions, especially if we have productivity or other qualitative and quantitative data.
Relatively recent investigations on the suitability of oliviculture over Europe are commonly involved in projections on the expected future fate of the olive groves, mainly under various climate change scenarios. In their study, Khan and Verma (2022), by compilation of global geographic occurrence data of a wild olive (Olea europaea subsp. Cuspidate), have projected its potential distribution in current and future climate scenarios. By utilizing ensemble modeling they predicted a significant decrease in the habitat suitability including also among regions, the coastal parts of Spain, France, Italy, and Greece.
Figure 12. The total score over the olive areas according to CLC.
Preprints 178175 g012
Guise et al. (2024) have performed a spatially explicit Ecological Niche Modelling approach for the projection of the environmental suitability for olive growing throughout the Iberian Peninsula under two distinct climate change scenarios (Representative Concentration Pathway RCP 4.5 and RCP 8.5), within the 2050-time horizon. The authors documented the alteration of environmentally suitable areas’ spatial distribution patterns along with the threatened ability of PDO regions to retain their current distinctive environmental conditions. By exploiting Species Distribution Models (SDMs), Arenas-Castro et al. (2020) have forecasted the reduction of the environmentally suitable areas for oliviculture and therefore of the olive production in Andalusia (Southern Spain). By combining high-resolution GIS data with Papadakis’ agro-climate classification Montsant et al. (2021), have demonstrated that in the 2031-2050 climate RCP4.5 scenario over 15% of Catalonia (Northeastern Spain) will no longer be adequate for non-irrigated olive, at locations in which it has been traditionally a rainfed crop.
Bordoni et al. (2025) have aimed at reconstructing different scenarios of environmental suitability of olive trees under current and future climatic scenarios, considering a marginal area (Oltrepò Pavese, South Lombardy, Northern Italy) not yet developed for oliviculture. By applying a data-driven method based on predictors representative of the main geological, geomorphological, climatic, and plant cover variables, future projections at different periods (by the years 2050, 2070 and 2100) have demonstrated the expansion of the suitable areas for olive groves. The increased suitability was justified by the projected temperature increase and the number of frost days decrease, especially in sectors located at higher latitudes and altitudes.
By constructing and exploiting simple and reliable equation modelling, Charalampopoulos et al. (2021) have calculated and projected the olive GDD (Growing Degree Days) over the Balkans. Among input parameters (time, altitude, distance from seashore and latitude) the time and latitude were most influential. Projections revealed a vast sprawl of olive cultivation areas (23.9% by 2040 and 20.3% by 2060) towards the northern parts of the examined area.
Under the scope of sustainable development, Tsiaras and Domakinis (2023) have aimed at the selection of suitable olive tree crop cultivation sites in mountainous less favored areas. Climatic, topographic, pedological and geological data layers were processed via a simple set of rules and with the aid of GIS geo-processing routines to produce optimum sustainable cultivation sites in the Pierion Municipal Unit (Municipality of Katerini, Northern Greece).
It is evident that the sustainability of traditional Mediterranean olive systems is under threat due to climate change issues mostly associated with future increases in temperature, reductions in rainfall (Cabezas et al., 2020; Lorite et al., 2018) and the occurrence of more frequent and extreme weather, which consist some of the problems that farmers will have to cope with in the upcoming decades. These impacts may potentially endanger the sustainability of the traditional olive orchards in southern Europe, which are barely economically viable even under the current environmental conditions (Bonizzato, 2020). This perspective triggers the necessity for the correct identification and implementation of adaptation measures to climate change. For implementing immediate actions, the acquirement and processing of extended knowledge related to oliviculture is fundamental as it will empower sustainable quantitative and qualitative production (Anastasiou et al., 2023).
For example, precision agriculture technologies may be exploited for the assistance of agricultural decisionmakers and the monitoring of complications related to diverse fields of olive cultivation management. Such actions may involve the application of efficient irrigation management strategies and the adoption of precision irrigation technologies establishing, thus, sustainable and resource-efficient oliviculture (Kakkavou et al., 2024; Kokkotos et al., 2021) . Other adaptation strategies may involve the implementation of soil and cover crops management techniques (e.g., no-tillage soil management, seed-mix cover crops) (Michalopoulos et al., 2020) and the application of spray compounds for the protection against extreme weather conditions (Brito et al., 2018). Also, critical long-term adaptation measures may include the appropriate selection of cultivars, the implementation of suitable breeding systems (Arenas-Castro et al., 2020; Cabezas et al., 2020) and the relocation of olive orchards (Ropero et al., 2019).
Future versions of the model may require recalibration. We can also incorporate climatic data based on projected scenarios to map suitability shifts from climate change. Adding parameters like soil conditions and irrigation will make the model more comprehensive. Ultimately, releasing it as an R package would facilitate use by agricultural scientists and researchers.

4. Conclusions

The conclusions deduced from the present investigation can be summarized as:
  • Individually, the overall geomorphological and climate suitability for oliviculture is high in Greece.
  • A quite extensive area (34.44% surface coverage) appears whith most optimal geomorphological conditions for oliviculture.
  • Large areas (59.4% surface coverage) result with most optimal climatic conditions for the olive culture.
  • Conjunction of geomorphology suitability and climatic suitability mapping highlights a substantial part of the country’s area (approximately 60%) appearing as optimal for the olive groves.
  • Overall, the olive suitability model may be characterized as efficient.
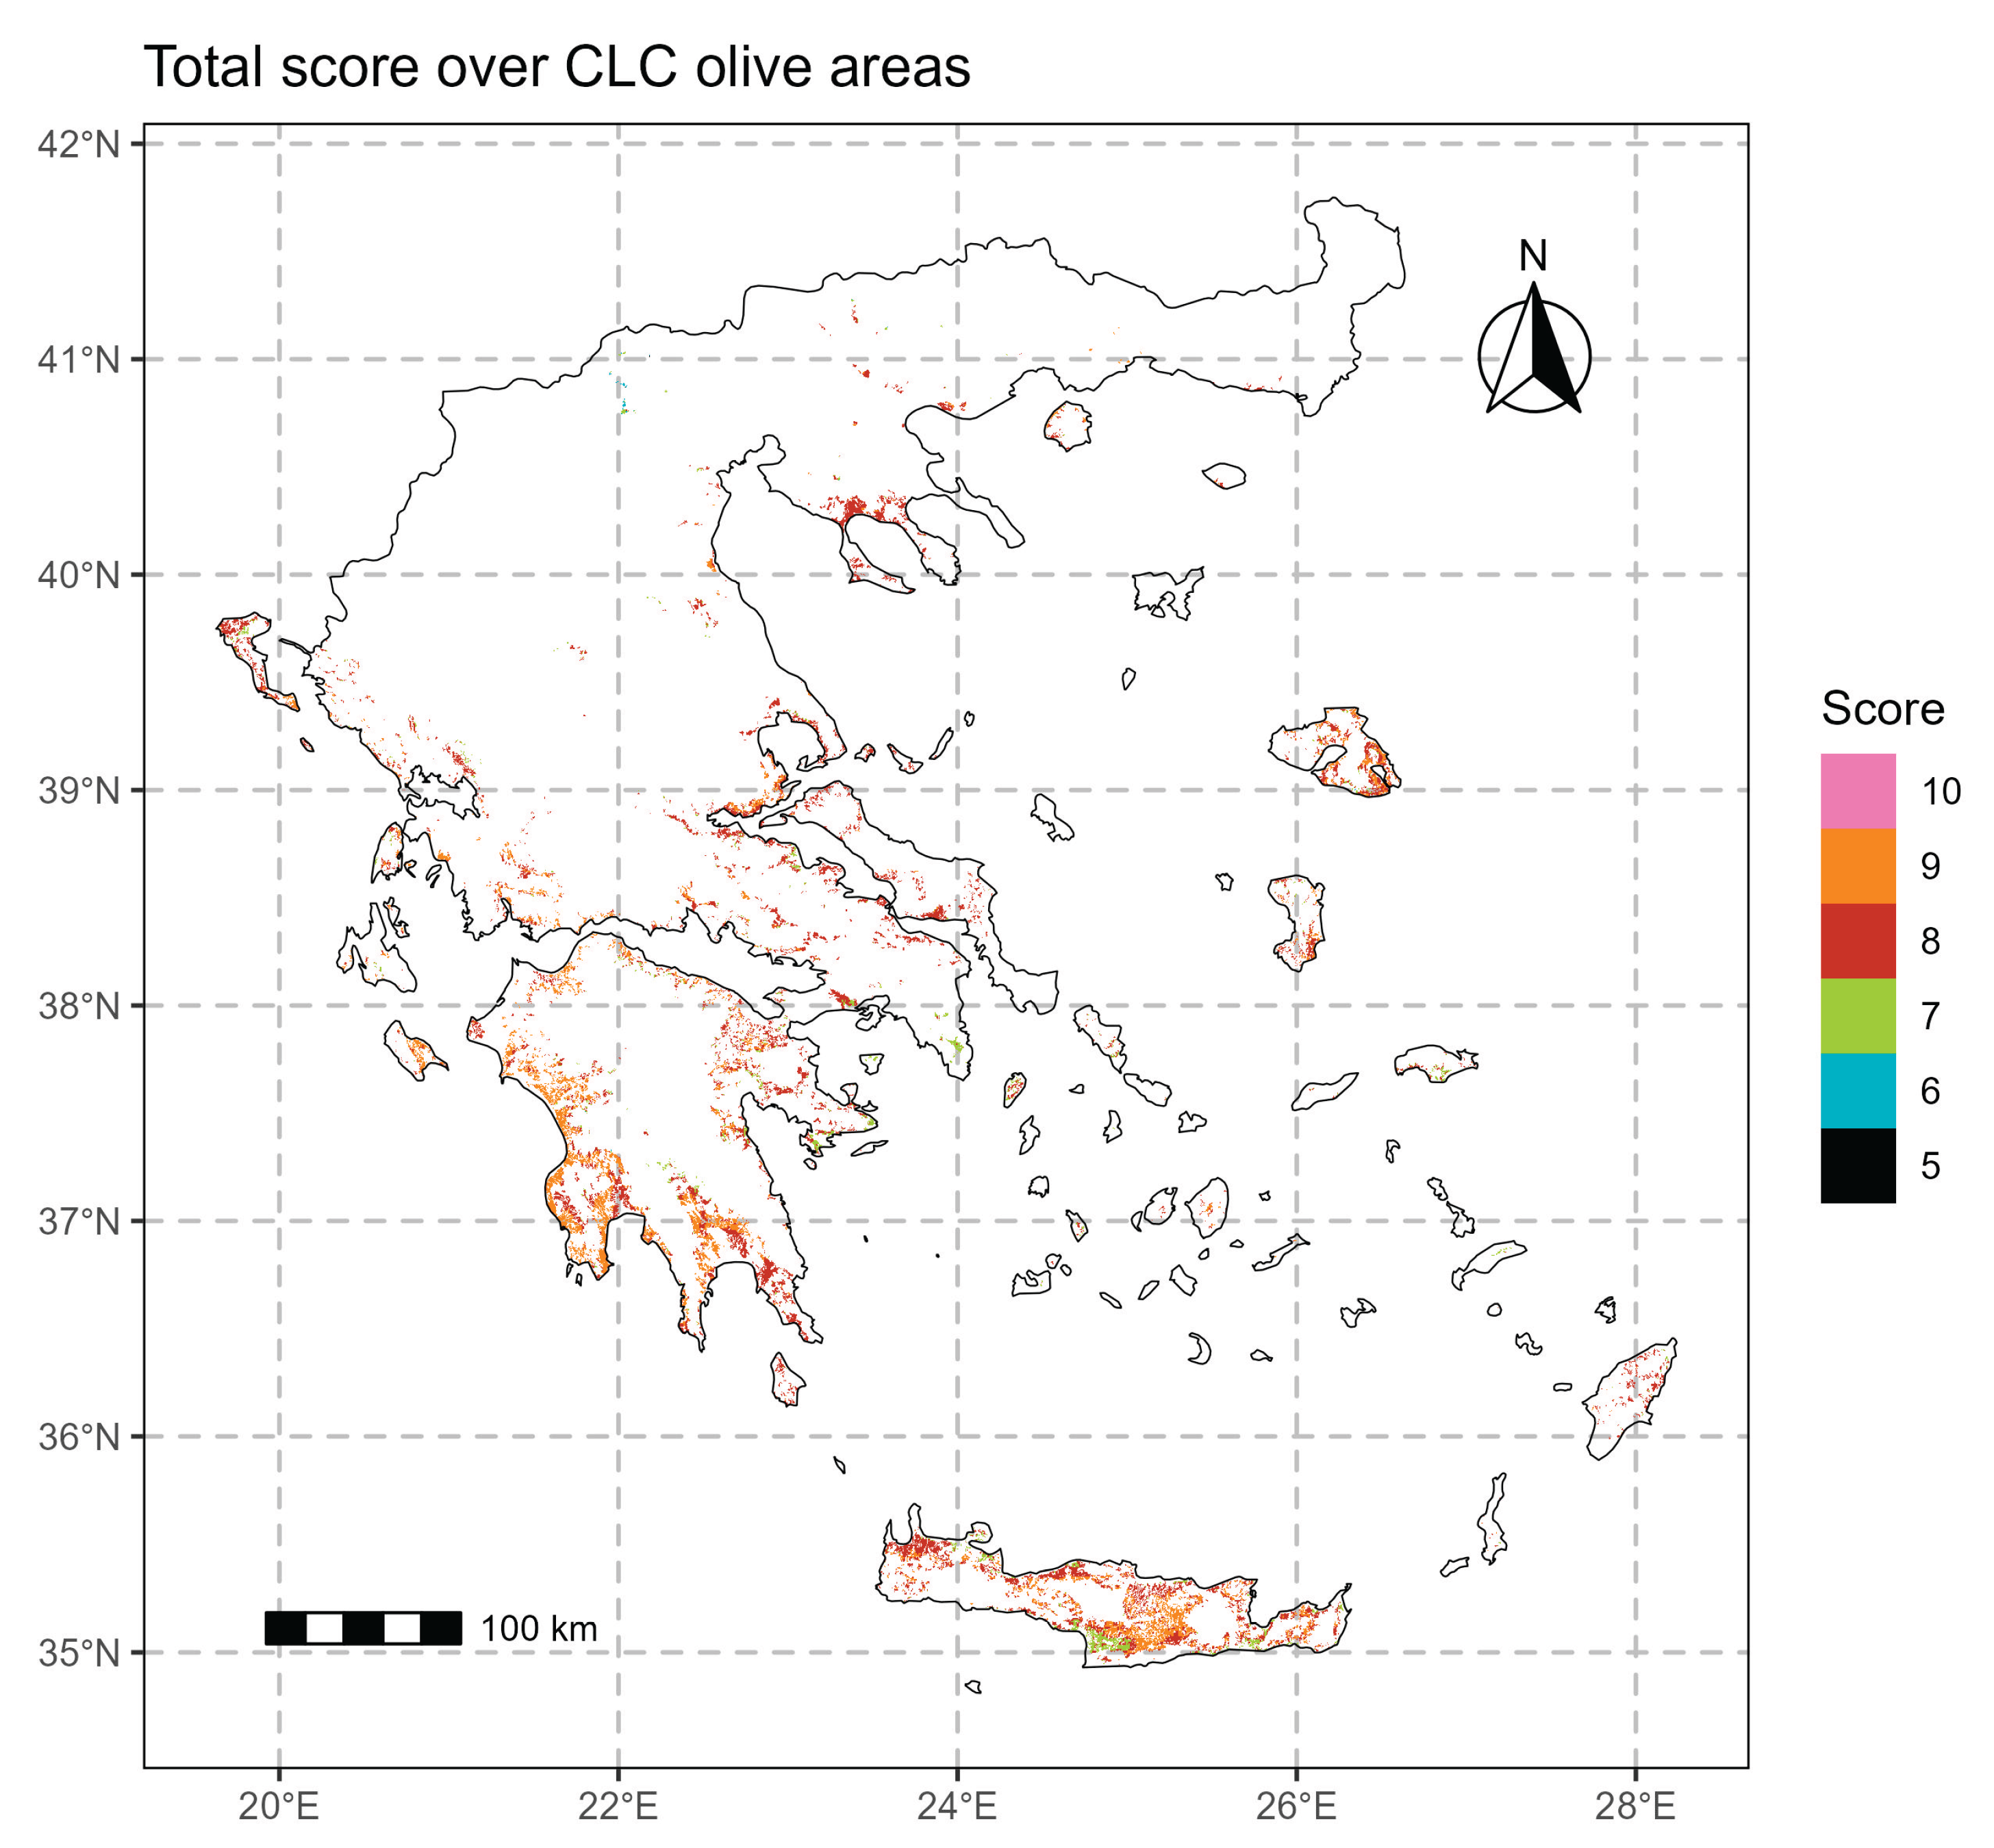
  • The observed differentiations of the model-derived final suitability map from the recorded olive growing areas over Greece may be justified by the application of limited climate and geo-morphology components in the model.
  • The present modeling procedure may serve as a tool for indicating suitable areas for the development of sustainable and productive olive culture.
  • The model is characterized by simplicity, usability, and flexibility.
  • Introducing environmental parameters impacted by future climate change into the model may create a new map of climatic suitability.

Supplementary Materials

The following supporting information can be downloaded at the website of this paper posted on Preprints.org, Figure S1. Altitude score map; Figure S2. Aspect score map.; Figure S3. Slope score map.; Figure S4. Roughness score map.; Table S1. The altitude score.; Table S2. The aspect score.; Table S3. The slope score.; Table S4. The roughness score.; Table S5. The low temperature from November to March score.; Table S6. The annual precipitation score.; Table S7. The January mean air temperature score.; Table S8. The July mean air temperature score.; Table S9. The annual mean air temperature score. Table S10. The annual frost days score.; Table S11. The spring frost days score.

Author Contributions

Conceptualization, I.C.; methodology, I.C.; investigation, I.C and N.M.; resources, F.D.; writing, F.D.; writing—materials and methods, I.C.; review and editing, I.C., F.D., N.M, P.A.S; visualization, I.C.; supervision, I.C. All authors have read and agreed to the published version of the manuscript.

Funding

This research received no external funding

Data Availability Statement

Data are available upon request.

Acknowledgments

The authors have reviewed and edited the output and take full responsibility for the content of this publication.”

Conflicts of Interest

The authors declare no conflicts of interest.

Abbreviations

The following abbreviations are used in this manuscript:
MDPI Multidisciplinary Digital Publishing Institute
DOAJ Directory of open access journals
TLA Three letter acronym
LD Linear dichroism

References

  1. Anastasiou, E., Balafoutis, A.T., Fountas, S., 2023. Trends in Remote Sensing Technologies in Olive Cultivation. Smart Agric. Technol. 3, 100103. [CrossRef]
  2. Arenas-Castro, S., Gonçalves, J.F., Moreno, M., Villar, R., 2020. Projected climate changes are expected to decrease the suitability and production of olive varieties in southern Spain. Sci. Total Environ. 709, 136161. [CrossRef]
  3. Arvaniti, O.S., Rodias, E., Terpou, A., Afratis, N., Athanasiou, G., Zahariadis, T., 2024. Bactrocera oleae Control and Smart Farming Technologies for Olive Orchards in the Context of Optimal Olive Oil Quality: A Review. Agronomy 14, 2586. [CrossRef]
  4. Bonizzato, A., 2020. The socio-economic impacts of organic and conventional olive growing in Italy - New Medit. URL https://newmedit.ciheam.org/2020/04/10/the-socio-economic-impacts-of-organic-and-conventional-olive-growing-in-italy/ (accessed 9.24.25).
  5. Bordoni, M., Gambarani, A., Giganti, M., Vivaldi, V., Rossi, G., Bazzano, P., Meisina, C., 2025. Present and Projected Suitability of Olive Trees in a Currently Marginal Territory in the Face of Climate Change: A Case Study from N-Italy. Sustainability 17, 1949. [CrossRef]
  6. Büttner, G., 2014. CORINE Land Cover and Land Cover Change Products, in: Manakos, I., Braun, M. (Eds.), Land Use and Land Cover Mapping in Europe, Remote Sensing and Digital Image Processing. Springer Netherlands, pp. 55–74. [CrossRef]
  7. Cabezas, J.M., Ruiz-Ramos, M., Soriano, M.A., Gabaldón-Leal, C., Santos, C., Lorite, I.J., 2020. Identifying adaptation strategies to climate change for Mediterranean olive orchards using impact response surfaces. Agric. Syst. 185, 102937. [CrossRef]
  8. Charalampopoulos, I., Polychroni, I., Psomiadis, E., Nastos, P., 2021. Spatiotemporal Estimation of the Olive and Vine Cultivations’ Growing Degree Days in the Balkans Region. Atmosphere 12, 148. [CrossRef]
  9. den Herder, M., Moreno, G., Mosquera-Losada, R.M., Palma, J.H.N., Sidiropoulou, A., Santiago Freijanes, J.J., Crous-Duran, J., Paulo, J.A., Tomé, M., Pantera, A., Papanastasis, V.P., Mantzanas, K., Pachana, P., Papadopoulos, A., Plieninger, T., Burgess, P.J., 2017. Current extent and stratification of agroforestry in the European Union. Agric. Ecosyst. Environ. 241, 121–132. [CrossRef]
  10. Fick, S.E., Hijmans, R.J., 2017. WorldClim 2: new 1-km spatial resolution climate surfaces for global land areas. Int. J. Climatol. 37, 4302–4315. [CrossRef]
  11. Foscolou, A., Critselis, E., Panagiotakos, D., 2018. Olive oil consumption and human health: A narrative review. Maturitas 118, 60–66. [CrossRef]
  12. Fraga, H., Moriondo, M., Leolini, L., Santos, J.A., 2021. Mediterranean Olive Orchards under Climate Change: A Review of Future Impacts and Adaptation Strategies. Agronomy 11, 56. [CrossRef]
  13. Guise, I., Silva, B., Mestre, F., Muñoz-Rojas, J., Duarte, M.F., Herrera, J.M., 2024. Climate change is expected to severely impact Protected Designation of Origin olive growing regions over the Iberian Peninsula. Agric. Syst. 220, 104108. [CrossRef]
  14. Hijmans, R.J., Bivand, R., Forner, K., Ooms, J., Pebesma, E., Sumner, M.D., 2022. terra: Spatial Data Analysis [WWW Document]. URL https://CRAN.R-project.org/package=terra (accessed 7.7.22).
  15. Honorio, F., Aguirado, C., Paniagua, L.L., García-Martín, A., Rebollo, L., Rebollo, F.J., 2024. Exploring the Climate and Topography of Olive Orchards in Extremadura, Southwestern Spain. Land 13, 495. [CrossRef]
  16. International Olive Council, 2024. World Market of Olive Oil and Table Olives - Data From December 2024. Int. Olive Counc. URL https://www.internationaloliveoil.org/world-market-of-olive-oil-and-table-olives-data-from-december-2024/ (accessed 9.23.25).
  17. Jimenez-Lopez, C., Carpena, M., Lourenço-Lopes, C., Gallardo-Gomez, M., Lorenzo, J.M., Barba, F.J., Prieto, M.A., Simal-Gandara, J., 2020. Bioactive Compounds and Quality of Extra Virgin Olive Oil. Foods 9, 1014. [CrossRef]
  18. Kakkavou, K., Gemtou, M., Fountas, S., 2024. Drivers and barriers to the adoption of precision irrigation technologies in olive and cotton farming—Lessons from Messenia and Thessaly regions in Greece. Smart Agric. Technol. 7, 100401. [CrossRef]
  19. Khan, S., Verma, S., 2022. Ensemble modeling to predict the impact of future climate change on the global distribution of Olea europaea subsp. cuspidata. Front. For. Glob. Change 5. [CrossRef]
  20. Kokkotos, E., Zotos, A., Tsirogiannis, G., Patakas, A., 2021. Prediction of Olive Tree Water Requirements under Limited Soil Water Availability, Based on Sap Flow Estimations. Agronomy 11, 1318. [CrossRef]
  21. Kostelenos, G., Kiritsakis, A., 2017. Olive Tree History and Evolution, in: Olives and Olive Oil as Functional Foods. John Wiley & Sons, Ltd, pp. 1–12. [CrossRef]
  22. Koubouris, G., Psarras, G., 2024. Pedoclimatic and Landscape Conditions of Greek Olive Groves, in: Muñoz-Rojas, J., García-Ruiz, R. (Eds.), The Olive Landscapes of the Mediterranean: Key Challenges and Opportunities for Their Sustainability in the Early XXIst Century. Springer Nature Switzerland, Cham, pp. 223–227. [CrossRef]
  23. Lionello, P., Giorgi, F., Rohling, E., Seager, R., 2023. Chapter 3 - Mediterranean climate: past, present and future, in: Schroeder, K., Chiggiato, J. (Eds.), Oceanography of the Mediterranean Sea. Elsevier, pp. 41–91. [CrossRef]
  24. López-Bernal, Á., Morales, A., García-Tejera, O., Testi, L., Orgaz, F., De Melo-Abreu, J.P., Villalobos, F.J., 2018. OliveCan: A Process-Based Model of Development, Growth and Yield of Olive Orchards. Front. Plant Sci. 9. [CrossRef]
  25. Lorite, I.J., Gabaldón-Leal, C., Ruiz-Ramos, M., Belaj, A., de la Rosa, R., León, L., Santos, C., 2018. Evaluation of olive response and adaptation strategies to climate change under semi-arid conditions. Agric. Water Manag. 204, 247–261. [CrossRef]
  26. Mairech, H., López-Bernal, Á., Moriondo, M., Dibari, C., Regni, L., Proietti, P., Villalobos, F.J., Testi, L., 2021. Sustainability of olive growing in the Mediterranean area under future climate scenarios: Exploring the effects of intensification and deficit irrigation. Eur. J. Agron. 129, 126319. [CrossRef]
  27. Mairech, H., López-Bernal, Á., Moriondo, M., Dibari, C., Regni, L., Proietti, P., Villalobos, F.J., Testi, L., 2020. Is new olive farming sustainable? A spatial comparison of productive and environmental performances between traditional and new olive orchards with the model OliveCan. Agric. Syst. 181, 102816. [CrossRef]
  28. Manna, P., Bonfante, A., Colandrea, M., Di Vaio, C., Langella, G., Marotta, L., Mileti, F.A., Minieri, L., Terribile, F., Vingiani, S., Basile, A., 2020. A geospatial decision support system to assist olive growing at the landscape scale. Comput. Electron. Agric. 168, 105143. [CrossRef]
  29. Marakis, G., Gaitis, F., Mila, S., Papadimitriou, D., Tsigarida, E., Mousia, Z., Karpouza, A., Magriplis, E., Zampelas, A., 2021. Attitudes towards Olive Oil Usage, Domestic Storage, and Knowledge of Quality: A Consumers’ Survey in Greece. Nutrients 13, 3709. [CrossRef]
  30. Michalopoulos, G., Kasapi, K.A., Koubouris, G., Psarras, G., Arampatzis, G., Hatzigiannakis, E., Kavvadias, V., Xiloyannis, C., Montanaro, G., Malliaraki, S., Angelaki, A., Manolaraki, C., Giakoumaki, G., Reppas, S., Kourgialas, N., Kokkinos, G., 2020. Adaptation of Mediterranean Olive Groves to Climate Change through Sustainable Cultivation Practices. Climate 8, 54. [CrossRef]
  31. Montsant, A., Baena, O., Bernárdez, L., Puig, J., 2021. Modelling the impacts of climate change on potential cultivation area and water deficit in five Mediterranean crops. Span. J. Agric. Res. 19, e0301–e0301. [CrossRef]
  32. Morin, J.-F., Lees, M., 2018. FoodIntegrity Handbook: Eurofins Analytics France.
  33. Moriondo, M., Ferrise, R., Trombi, G., Brilli, L., Dibari, C., Bindi, M., 2015. Modelling olive trees and grapevines in a changing climate. Environ. Model. Softw. 72, 387–401. [CrossRef]
  34. Moriondo, M., Leolini, L., Brilli, L., Dibari, C., Tognetti, R., Giovannelli, A., Rapi, B., Battista, P., Caruso, G., Gucci, R., Argenti, G., Raschi, A., Centritto, M., Cantini, C., Bindi, M., 2019. A simple model simulating development and growth of an olive grove. Eur. J. Agron. 105, 129–145. [CrossRef]
  35. Moriondo, M., Trombi, G., Ferrise, R., Brandani, G., Dibari, C., Ammann, C.M., Lippi, M.M., Bindi, M., 2013. Olive trees as bio-indicators of climate evolution in the Mediterranean Basin. Glob. Ecol. Biogeogr. 22, 818–833. [CrossRef]
  36. Ozalp, A.Y., Akinci, H., 2023. Evaluation of Land Suitability for Olive (Olea europaea L.) Cultivation Using the Random Forest Algorithm. Agriculture 13, 1208. [CrossRef]
  37. Pebesma, E., 2018. Simple Features for R: Standardized Support for Spatial Vector Data. R J. 10, 439–446.
  38. Puig-Sirera, À., Rallo, G., Paredes, P., Paço, T.A., Minacapilli, M., Provenzano, G., Pereira, L.S., 2021. Transpiration and Water Use of an Irrigated Traditional Olive Grove with Sap-Flow Observations and the FAO56 Dual Crop Coefficient Approach. Water 13, 2466. [CrossRef]
  39. Rallo, G., Baiamonte, G., Juárez, J.M., Provenzano, G., 2014. Improvement of FAO-56 Model to Estimate Transpiration Fluxes of Drought Tolerant Crops under Soil Water Deficit: Application for Olive Groves. J. Irrig. Drain. Eng. 140, A4014001. [CrossRef]
  40. Ramos, T.B., Darouich, H., Oliveira, A.R., Farzamian, M., Monteiro, T., Castanheira, N., Paz, A., Gonçalves, M.C., Pereira, L.S., 2023. Water use and soil water balance of Mediterranean tree crops assessed with the SIMDualKc model in orchards of southern Portugal. Agric. Water Manag. 279, 108209. [CrossRef]
  41. Ropero, R.F., Rumí, R., Aguilera, P.A., 2019. Bayesian networks for evaluating climate change influence in olive crops in Andalusia, Spain. Nat. Resour. Model. 32, e12169. [CrossRef]
  42. Skiada, V., Tsarouhas, P., Varzakas, T., 2019. Preliminary Study and Observation of “Kalamata PDO” Extra Virgin Olive Oil, in the Messinia Region, Southwest of Peloponnese (Greece). Foods 8, 610. [CrossRef]
  43. Smoly, I., Elbaz, H., Engelen, C., Wechsler, T., Elbaz, G., Ben-Ari, G., Samach, A., Friedlander, T., 2025. A model estimating the level of floral transition in olive trees exposed to warm periods during winter. J. Exp. Bot. 76, 1266–1284. [CrossRef]
  44. Solomou, A.D., Sfougaris, A., 2021. Contribution of Agro-Environmental Factors to Yield and Plant Diversity of Olive Grove Ecosystems (Olea europaea L.) in the Mediterranean Landscape. Agronomy 11, 161. [CrossRef]
  45. Tsiaras, S., Domakinis, C., 2023. Use of GIS in Selecting Suitable Tree Crop Cultivation Sites in Mountainous Less Favoured Areas: An Example from Greece. Forests 14, 1210. [CrossRef]
  46. Urdiales-Flores, D., Zittis, G., Hadjinicolaou, P., Cherchi, A., Alessandri, A., Peleg, N., Lelieveld, J., 2024. A Global Analysis of Historical and Future Changes in Mediterranean Climate-Type Regions. Int. J. Climatol. 44, 5607–5620. [CrossRef]
  47. Villalobos, F.J., López-Bernal, Á., García-Tejera, O., Testi, L., 2023. Is olive crop modelling ready to assess the impacts of global change? Front. Plant Sci. 14. [CrossRef]
  48. Wickham, H., Chang, W., Henry, L., Pedersen, T.L., Takahashi, K., Wilke, C., Woo, K., Yutani, H., Dunnington, D., 2020a. ggplot2: Create Elegant Data Visualisations Using the Grammar of Graphics [WWW Document]. URL https://CRAN.R-project.org/package=ggplot2 (accessed 2.5.20).
  49. Wickham, H., François, R., Henry, L., Müller, K., 2020b. dplyr: A Grammar of Data Manipulation [WWW Document]. URL https://CRAN.R-project.org/package=dplyr (accessed 4.25.20).
Figure 1. The method’s flowchart.
Preprints 178175 g001
Figure 5. January mean temperature score map.
Preprints 178175 g005
Figure 6. July mean temperature score map.
Preprints 178175 g006
Figure 8. Annual frost days score map.
Preprints 178175 g008
Table 1. The percentage of Greece’s surface covered by each geomorphological suitability score.
Geomorphological Suitability Score Total (%)
0 24.12
2 0.03
3 0.84
4 4.97
5 9.92
6 9.76
7 15.92
8 16.82
9 12.21
10 5.41
Table 2. The percentage of Greece’s surface covered by each climatic suitability score.
Climatic Suitability Score Area covered (%)
0 36.29
5 0.00
6 0.54
7 3.77
8 17.02
9 36.00
10 6.38
Table 3. The percentage per suitability score of the surface identified by CLC and national registry as olive groves.
Suitability Score Total (%) Over CLC areas (%)
0 41.93 0.00
5 0.02 0.00
6 1.44 0.13
7 14.61 8.28
8 32.23 58.53
9 9.76 33.05
10 0.01 0.01
Disclaimer/Publisher’s Note: The statements, opinions and data contained in all publications are solely those of the individual author(s) and contributor(s) and not of MDPI and/or the editor(s). MDPI and/or the editor(s) disclaim responsibility for any injury to people or property resulting from any ideas, methods, instructions or products referred to in the content.
Copyright: This open access article is published under a Creative Commons CC BY 4.0 license, which permit the free download, distribution, and reuse, provided that the author and preprint are cited in any reuse.
Prerpints.org logo

Preprints.org is a free preprint server supported by MDPI in Basel, Switzerland.

Subscribe

Disclaimer

Terms of Use

Privacy Policy

Privacy Settings

© 2025 MDPI (Basel, Switzerland) unless otherwise stated