
Submitted:
24 September 2025
Posted:
25 September 2025
You are already at the latest version
Abstract
Breast cancer is the most prevalent cancer among women and one of the leading causes of cancer mortality. Early detection and accurate staging are essential for improving survival rates, yet current methods heavily rely on invasive biopsies. Glycoproteins, crucial biomarkers in various cancers, offer a minimally invasive diagnostic alternative. This pilot study employed MALDI-TOF mass spectrometry to analyze the glycomic profiles of breast tissue and serum samples from 39 breast cancer patients and 10 healthy controls. Over 300 unique glycans were identified, with significant elevations of high mannose glycans observed in malignant tissue and serum compared to healthy controls (p< 0.0001). Moreover, high-mannose glycan levels correlated with advanced cancer stages (p< 0.001) and poor differentiation grades (p< 0.05). HER2-positive and ER-negative tumors dis-played distinct glycosylation patterns, indicating potential molecular subtypes. Notably, serum levels of specific complex N-glycans, H3N5F1 and H4N5F1, declined significantly with disease progression, underscoring their potential as biomarkers. These findings suggest that glycomic profiling could revolutionize breast cancer diagnostics, enabling earlier detection, disease monitoring, and molecular subtyping. Further investigation is warranted to validate these biomarkers and elucidate their mechanistic roles in breast cancer pathogenesis.
Keywords:
biomarkers
; breast cancer
; cancer
; complex N-glycans
; glycomics
; glycans
; high mannose glycans
; MALDI-TOF
1. Introduction
Breast cancer is the most common cancer in women globally and is the second leading cause of cancer death [1,2,3]. Early diagnosis and staging are critical to increasing chances of survival [4,5,6,7]. From 2012-2018, when breast cancers were caught and treated at stage I, the 5-year relative survival rate for patients, regardless of racial background, was >99% [8]. Currently, however, biomarkers that provide early diagnosis, prognosis or cancer subtyping are lacking. Diagnosis and staging instead rely heavily on biopsy and histology, which is invasive, costly and time-consuming [9].
One promising avenue for less invasive cancer screening is glycomics, the study of glycans, or sugar modifications on proteins and fats. Healthy cells express regulated glycan patterns, which often become aberrant in cancer [10,11]. Glycans have been implicated in tumor growth, spread and can alter response to treatment [10,11,12,13,14]. Glycomics allows comprehensive examination of glycan patterns in a given tissue or serum sample [15,16]. Identification of aberrant configurations associated with cancer would allow glycan profiles to serve as molecular signatures of disease state. While the study of glycomics lagged behind that of genomics and proteomics, advances in analytical tools now allow detailed mapping of glycan profiles, opening opportunities for early detection, identifying tumor subtypes, and monitoring disease progression through minimally invasive tests [15,16].
In recent years, glycoproteins are steadily becoming recognized as key biomarkers in a variety of disease processes including cancer [17]. Moreover, altered glycosylation has been implicated in cancer progression and metastasis [15,16,18]. Glycosylated proteins are actively secreted or leak into circulation from tissue, rendering their evaluation readily accessible through serum [19]. Glycosylation of proteins to form glycoproteins is a vital step in determining the protein’s function and it is estimated that over 50% of proteins in the human body are glycosylated [20]. Because of this, identifiable changes to glycan expression could be a useful early marker for pathogenic states like cancer [21]. Today, the majority of FDA-approved cancer biomarkers are glycoproteins or carbohydrate antigens, with a growing body of literature supporting its diagnostic and prognostic utility across tumor types [21]. Changes to the types, expression intensity, and concertation of glycans have been observed in the tumorigenesis of cervical, colorectal, and prostate cancer tissue [12,22]. Specific glycan profiles have been identified in stage II colorectal cancer tissues that express elevated high-mannose and sialylated N-glycans [23]. In human breast cancer, elevated high mannose glycan expression has been linked to an increased risk for tumor metastasis and worse overall disease prognosis [24]. While these are promising findings, there have been limited studies of glycosylation patterns in breast cancer or any studies that identified specific serum glycan biomarkers that can accurately indicate disease.
In this pilot study, we utilize MALDI-TOF mass spectrometry to analyze breast tissue and serum samples from 10 healthy individuals and 39 breast cancer patients. We aim to help characterize the glycomic profile of breast cancer tissue and identify differentially expressed glycans that could serve as potential molecular indicators of disease progression.
2. Materials and Methods
Tissue Collection and Preparation: Breast tissue samples were collected from 39 participants at the time of breast cancer diagnosis at Prisma Health. Each sample was weight to 100mg (+/- 10%) and washed with 100 µL ice-cold 10 mM sodium phosphate buffer (pH 7.5) twice. The tissue was transferred to 2 ml tube containing tissue homogenizing ceramic mix beads (Cayman Chemical #10409-2, Michigan) and 200 µL 10 mM sodium phosphate buffer (pH 7.5) was added to the tube. The tissues were homogenized and transferred to a new tube with 10% sodium dodecylsulfate (SDS) and incubated at 65oC for 30 min. Ice-cold acetone was added to the samples in 4:1 ratio and vortexed. After 1 min of sonication in a water bath, the samples were placed at -80oC overnight. After centrifugation at 14,000 rpm for 15 min, the supernatants were discarded. The pellet was washed with 400 µL ice-cold acetonitrile, vortexed and centrifuged at 14,000 x rpm for 15 min. The pellets were dried in speed-vac for 15 min.
Glycan Mass Spectrum Analysis and Glycomic Profiling: Permethylated samples were crystalized with α-dihydroxybenzoic acid (DHBA) matrix (20mg/mL in 50% acetonitrile) and analyzed using MALDI-TOF/LC Mass Spectroscopy by Emory Glycomics and Molecular Interactions Core to quantify their glycomic profiles. The known masses of glycans from different glycan composition groups (Hybrid, Complex and High Mannose) were used as a reference table to develop the glycomic profiles of the tissue samples.
Statistical Analysis: Analysis was performed with unpaired t-test when comparing two groups or ANOVA for multiple comparisons. Graphpad Prism 10.0 was used for data analysis, with p < 0.05 considered statistically significant.
3. Results
In this pilot study, diseased and healthy tissue samples from 39 breast cancer patients were collected from the Prisma Health Cancer Institute Biorepository and analyzed by MALDI-TOF MS. While the utilization of MALDI-TOF MS to define glycan structures has been previously established in serum-only studies, our work expands on this through paired analysis of both tissue and serum from a single patient [25]. Corresponding patient serum was also analyzed, while healthy control serum was provided by healthy donors. Patient samples varied in cancer types represented: ductal carcinoma (26), apocrine carcinoma (6), lobar carcinoma (2), metaplastic breast cancer (2), unclassified carcinoma (2), and adenocarcinoma (1). Samples also varied by cancer stage: stage I (10), stage II (11), stage III (9), and stage IV (9).
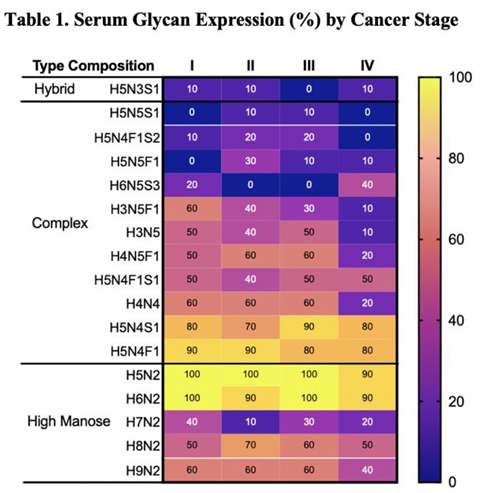
Using MALDI TOF Mass Spectroscopy to analyze all samples, more than 300 unique glycans were identified. Glycan levels of each glycan in a given sample were reported as a relative measurement of area under the curve (AUC) from the spectral data. As such, glycan levels could be compared across samples and conditions. Assessment of differential expressions of the over 300 glycans identified revealed some key patterns in glycosylation related to disease state, with approximately 21 samples consistently expressed in malignant samples (Table 1).
3.1. Potential Serum Biomarkers of Disease Severity
To identify candidate biomarkers of cancer severity, we analyzed expressions of selected serum and tissue glycans across cancer stages (Table 1 and Table 2). Four specific complex N-glycans (H3N5F1, H3N5, H4N5F1, and H4N4) exhibited stage-associated expression patterns in serum (Table 1). Levels of H3N5F1 steadily declined with advancing cancer stage, while H3N5, H4N5F1, and H4N4 expression precipitously dropped in stage IV samples compared to stages I-III (Table 1). Specifically, H3N5F1 expression gradually declined from 60% in stage I to 10% in stage IV. Expression of H3N5 decreased from 40-50% in stages I-III to 10% in stage IV; similarly, H4N5F1 and H4N4 dropped from 50-60% in stages I-III to 20% in stage IV (Table 1).
A parallel analysis of tissue samples reveals some complex N glycans that exhibit stage-associated expression pattern (Table 2).
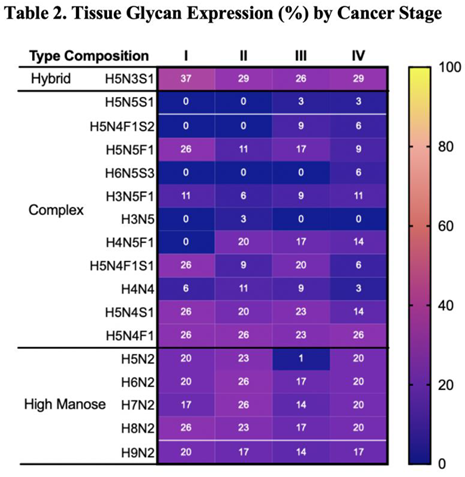
In contrast to expression patterns observed in serum samples, in which levels of H4H5F1 decrease with increasing disease severity, expression of this glycan is absent in stage I but expressed in higher cancer stages (Table 2). H5N5F1 expression decreases with increasing cancer stage, declining from 25% of stage I tissue to 9% of stage IV tissue (Table 2). Notably, some glycans are expressed exclusively in specific stages alone: H5N5S1 is absent in lower stages and expressed only in stages III (9%) and IV (6%), H6N5S3 is expressed only in stage IV (6%), and H3N5 expression is observed only in stage II (3%). Overall, while expression patterns in tissue samples vary less dramatically across cancer stages, the distinct stage-associated changes observed in serum glycans are particularly striking.
3.2. High Mannose Glycans
High mannose glycans (HMGs) are a diverse group of oligosaccharides, each characterized by a core structure of three mannose residues attached to two N-acetyl-glucosamine residues. These glycans are known to play a role in protein folding and quality control within cells. In cancer, HMGs have been linked to increased cell migration, invasion and metastatic potential of cancer cells [26,27]. HMGs were significantly elevated in malignant samples compared to healthy controls, in both serum (p < 0.0001) and tissue (p=0.0015) (Figures 1A,E). When compared to levels in healthy serum, HMG levels were increased in serum from stage II (p=0.0015), stage III (p=0.0084), and stage IV (p=0.0001). Comparing across stages, HMG expression in stage III serum was significantly greater than all other stages (Figure 1C). HMG levels in tissue followed a similar trend, where tissue from higher stages (III and IV) appear to express increased HMGs compared to healthy tissue; however, this pattern was not found to be significant (Figures 1F,G). Our pilot study of 39 samples may lack sufficient power to detect these differences. Future studies with larger sample sizes are needed to determine whether increased HMG levels in tissue from stages III and IV is significant. Interestingly, HMG expression was found to be significantly lower in stage II compared to healthy tissue (p=0.0005), stage I (p=0.0204) and stage III (p=0.0063) (Figure 1F,G). Increased sample size is needed to assess if this pattern is sustained and further studies are needed to understand the role of decreased HMGs during the transition from stage I to stage II followed by an increase in HMGs when transitioning from stage II to stage III. HMG expression was also assessed across tumor grade. Although there was no significant difference in serum HMG expression, tissue from grade 3 tumors expressed significantly greater levels of HMGs compared to grade 1 (p=0.0034) or grade 2 (p<0.0001) (Figure 1D,H). Collectively, these findings indicate that the increased expression of HMGs carries a strong indication of increased disease severity, correlating with advanced cancer staging and grading. Specifically, serum HMG expression may indicate advanced tumor stage, while tissue HMG expression may be predictive of advanced tumor grade. Accordingly, serum and tissue HMG expression may serve as potential markers for breast cancer progression.
Stratifying tumor samples by ER and HER2 expression also revealed significant glycomic differences. While serum HMG levels showed increase in ER+ and HER2- serum samples, these differences did not reach significance (Figure 2 and Figure 3). However, significant expression patters were observed in tissue samples. Tissue from ER- tissue expressed significantly higher levels of HMG compared to healthy tissue (p<0.0001) or ER+ tissue (p=0.0002) (Figure 4A). MALDI-TOF identified 5 unique HMGs among samples: H5N2, H6N2, H7N2, H8N2, and H9N2. Notably, H5N2, H6N2, and H8N2 were found to be significantly elevated in ER- tissue compared to healthy or ER+ tissue samples, whereas there were no significant differences in glycan expression levels of H7N2 or H9N2 across tissue types (Figures 2B-F). Analysis of tissue HMG expression stratified by HER2 status revealed that HER2+ tissue samples express significantly higher levels compared to healthy (p<0.0001) or HER2- tissue (p<0.0001) (Figure 5A). Specifically, levels of H5N2, H6N2, H7N2, and H8N2 are significantly increased, while there was no significant difference in levels of H9N2 (Figures 5B-F). Together, these patterns, observed independently of cancer grade and stage, suggests receptor-linked glycosylation changes which may reflect underlying subtype-specific mechanisms that may be targeted in diagnostics and/or therapeutics.
3.3. Complex N-Glycans
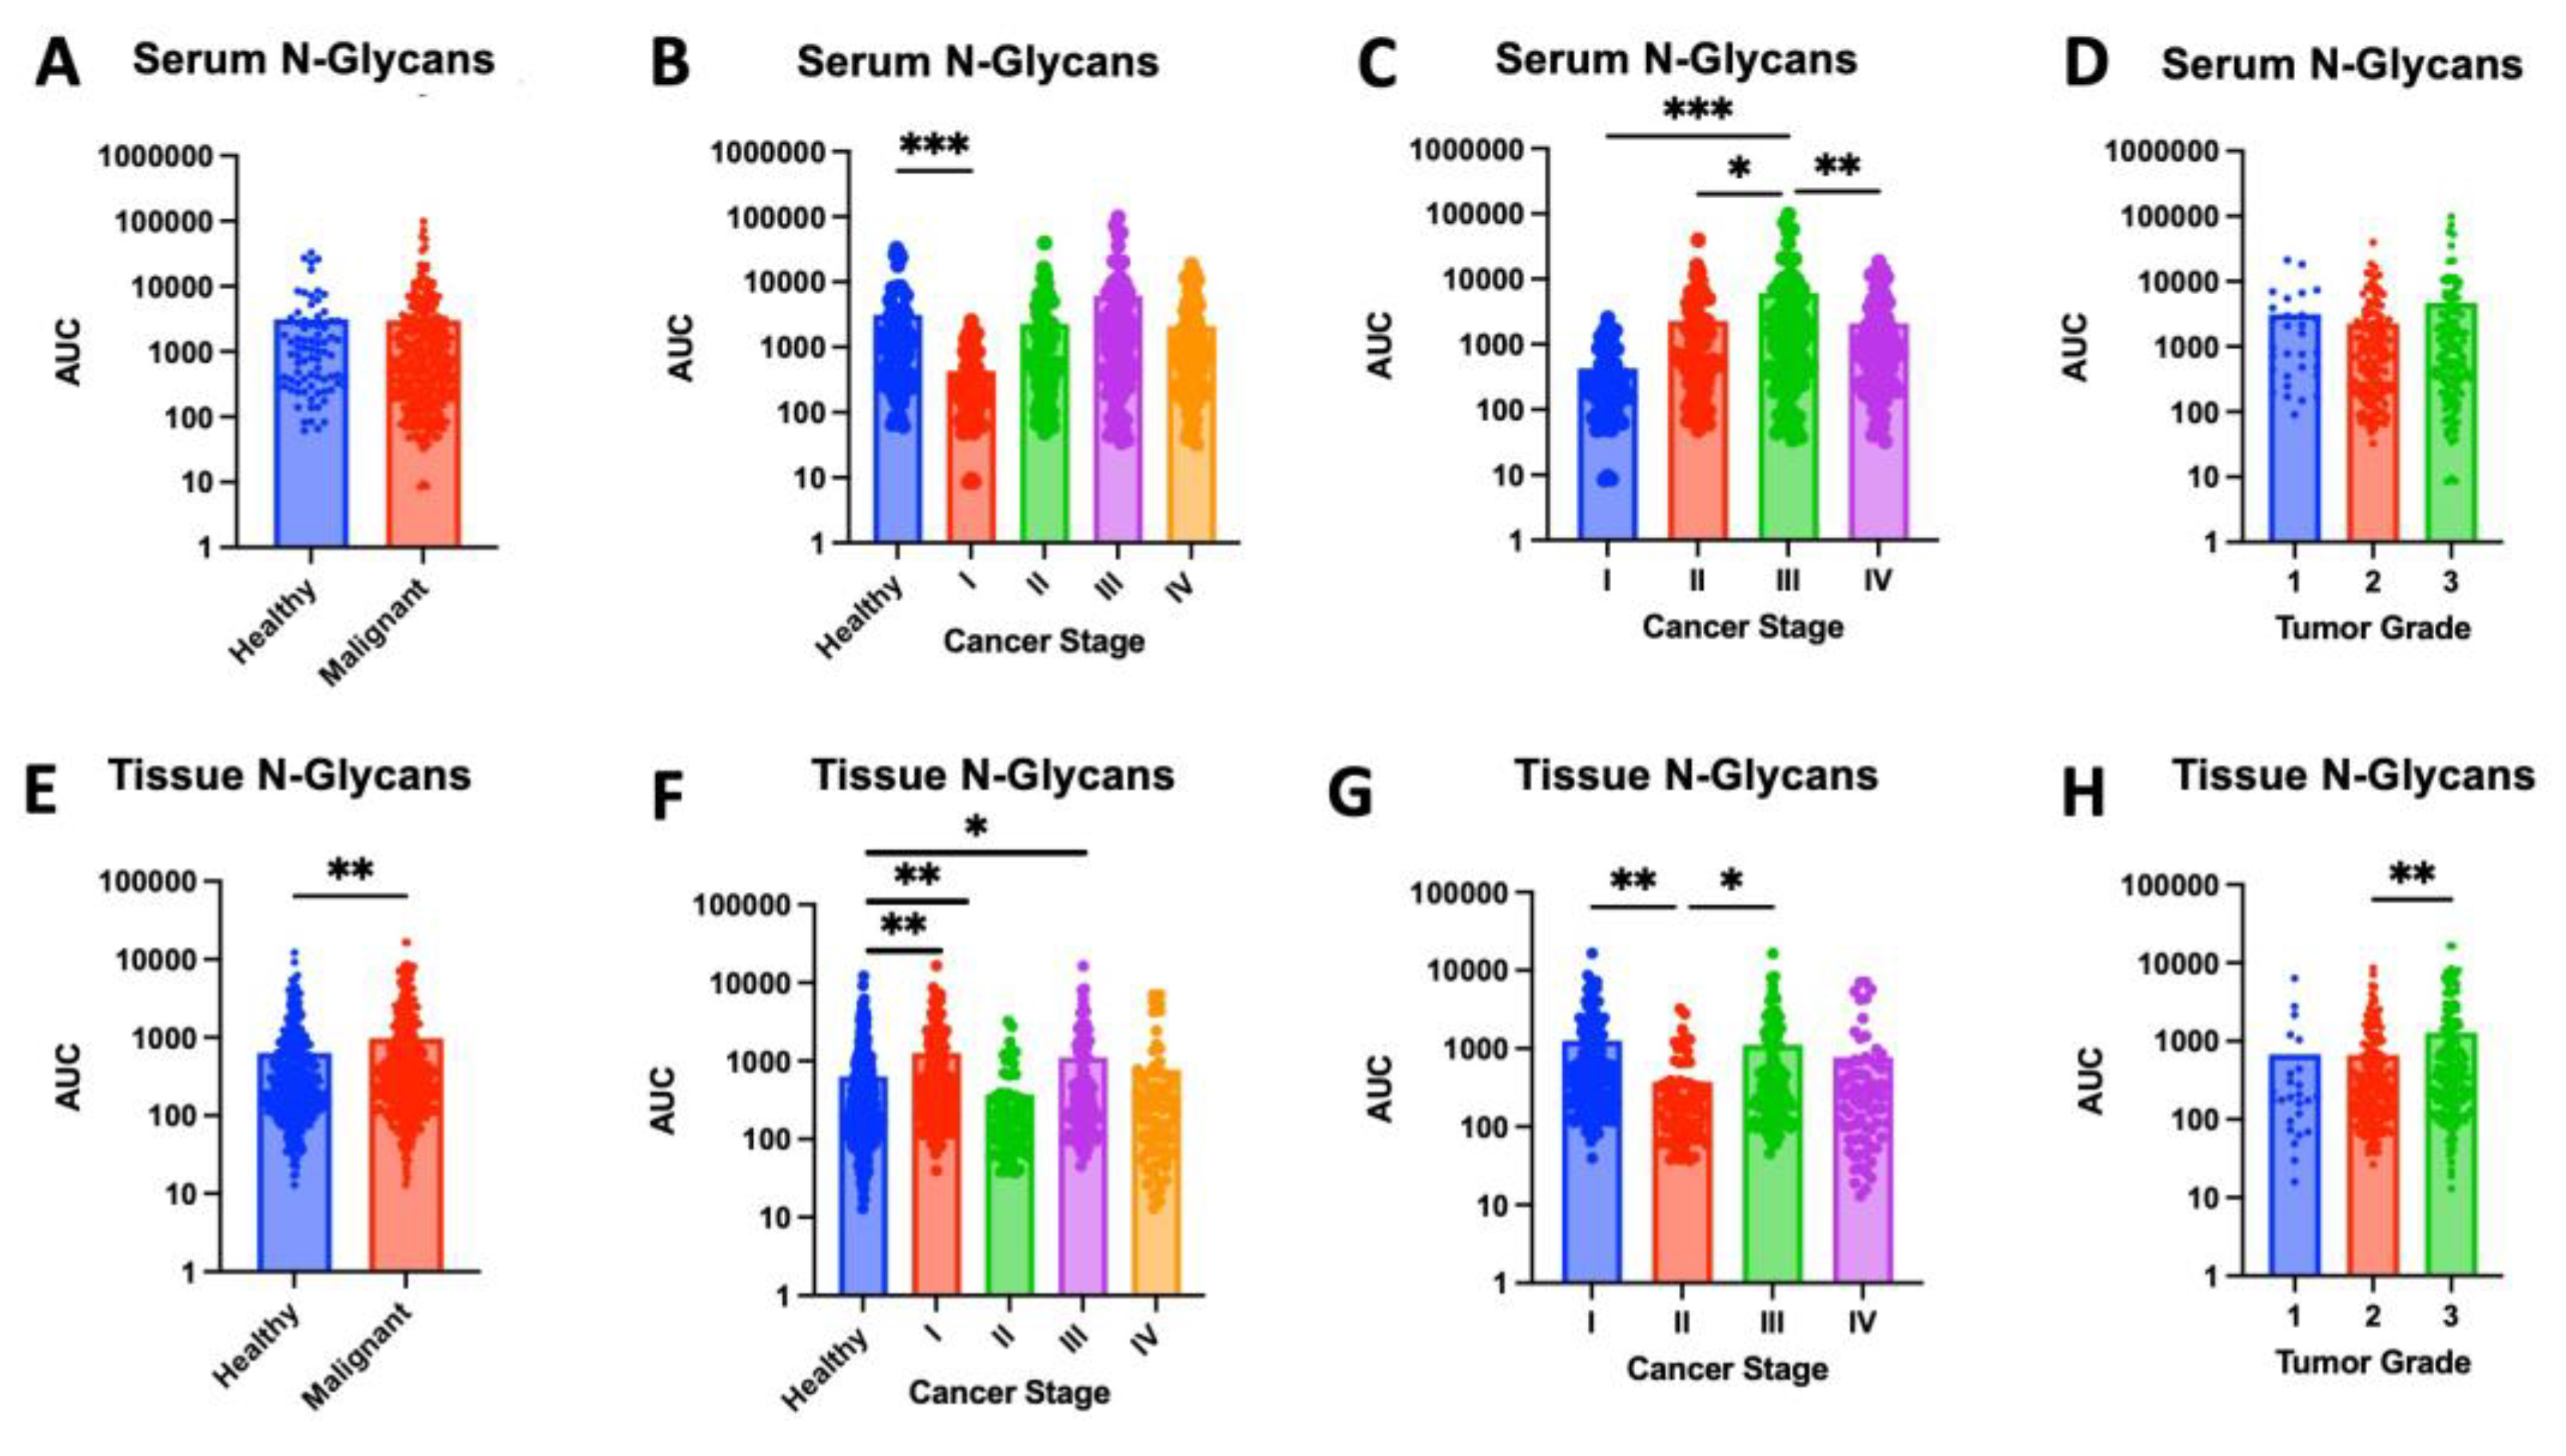
In addition to changes in high-mannose glycan expression, we noted differential expression of complex N-glycans across cancer stage and tumor grade. While complex N-glycan expression was elevated in malignant samples compared to healthy controls in both serum and tissue, this difference reached statistical significance only in tissue (p=0.0026) (Figure 6A,E). Further investigation in a larger cohort is warranted to determine if the observed increased expression of serum complex N-glycan also achieves statistical significance.
When comparing healthy and malignant serum across cancer stages, stage I demonstrates significantly lower levels of serum N-glycans (p = 0.0002), while significant difference was observed between healthy controls and stages II-IV (Figure 6B). Further studies are needed to determine if the decline in N-glycan expression in stage I is reproducible and the pathophysiological mechanisms underlying this reduction. If confirmed, the decline in serum complex N-glycan levels from healthy to stage I breast cancer may serve as a potential biomarker for early detection of disease. In contrast to these serum findings, tissue expression of complex N-glycans is significantly decreased in stage II compared to healthy controls (p = 0.0033) and significantly increased in stage I (p = 0.0016) and stage III (p = 0.0448) (Figure 6F). Further studies are needed to elucidate the role of N-glycan expression variation at each of these stages.
Comparing across stages, complex N-glycan expression in stage III serum was significantly greater than all other stages (Figure 6C) and expression in stage II tissue was significantly lower compared to stage I (p=0.0051) and stage III (p=0.0491) (Figure 6G). When comparing across tumor grade, there was no significant difference in serum N-glycan expression, though levels in grade 3 are significantly higher compared to grade 2 (p = 0.0057) (Figure 6H).
4. Discussion
In this small pilot study, we have identified candidate biomarkers with the potential to significantly improve breast cancer screening, which would allow earlier diagnosis and treatment, with a profound impact on patient outcomes. In contrast to previous studies that have largely evaluated either tissue or serum glycans singularly, our findings demonstrate the unique value of integrating both serum and tissue glycomics from the same patients for a more systemic understanding of glycosylation patterns in disease.
Consistent with previous hypothesis regarding glycan-mediated metastatic potential, we found distinct glycan patterns in high-stage and higher-grade breast cancer samples [18]. We identified a general rise in high-mannose glycans in advanced disease across both tissue and serum. These findings corroborate previous reports of elevated high-mannose glycans in breast tumors, further supporting the role of these structures in breast cancer biology [28]. With better understanding of high mannose glycan patterns in tissue and correlations with disease severity, staining for high mannose glycans can be used in surgery as an indicator for successfully obtaining negative margins during tumor resection. Serum levels of high-mannose glycans can also serve as biomarkers of disease. Consistent with earlier MALDI-based studies [29], we found elevated levels of high-mannose glycans in serum samples from metastatic breast cancer patients. While Kyselova et al. compared serum samples from metastatic vs. non-metastatic breast cancer, our work further explores across individual stages and grades of disease while also correlating with tumor tissue, highlighting a broader systemic glycomic signature. Interestingly, these results are in contrast to findings from Saldova et al., 2014, who reported decreased high-mannose glycans in serum from breast cancer patients, suggesting platform or cohort-dependent differences that should be further explored [30].
Consistent with prior studies linking serum N-glycans to clinical outcomes, we identified specific complex N-glycans associated with disease progression in breast cancer patient serum [31]. While validation in larger cohorts is essential, the observed precipitous declines of H3N5, H4N5F1, and H4N4 in stage IV, coupled with the progressive decrease of H3N5F1, highlight the sensitivity of serum glycan levels to disease progression. These stage-specific shifts in expression patterns position serum glycans as promising candidate biomarkers of cancer severity. Together these findings suggest that a simple blood test of glycan expression may hold clinical value in stratifying patients by disease stage and guiding prognostic assessment. Furthermore, these patterns can provide disease monitoring during treatment and a potential, low-cost and minimally-invasive complement to breast cancer screening.
Additionally, the stratification by HER2 and ER status highlights the glycomic diversity among subtypes. While recent studies have explored subtype-specific glycosylation patterns in breast cancer tissue, including HER2- and ER-positive tissue, our work builds on this by directly comparing matched serum and tissue glycomes from the same patients, providing a more systemic view of glycosylation patterns [32,33]. Our preliminary receptor-specific analysis revealed a consistent elevation of high-mannose glycans in HER2-positive and ER-negative tumors. This aligns with prior literature suggesting subtype-specific glycosylation patterns and highlights the potential of glycan profiling for refining breast cancer subtyping and informing therapeutic strategies. Interestingly, given the known role of N-linked glycans in cell-cell adhesion, the elevated expression of high-mannose glycans in poorly differentiated and higher-stage tumors may reflect disrupted adhesion that promote metastasis. Accordingly, aberrant early-stage glycan expression may prove to be a useful future diagnostic marker for metastatic potential.
Further studies are needed to elucidate the exact roles and correlations of these glycans in the context of disease progression. Although we identified strong correlation in glycosylation patterns across cancer severity, we did not observe differences in glycosylation patterns across cancer types. While these patterns likely exist, our pilot study consisted largely of ductal carcinoma samples and did not have a sufficiently representative sample from each cancer type. For adequate comparison of glycosylation patterns between these groups, a larger study with equally representative samples across breast cancer types is needed. Nevertheless, findings from this study strongly indicate that glycan expression in both tissue and serum evolve in breast cancer disease progression and need to be studied for improved diagnostics. A better understanding of the role of glycans in breast cancer may also play a role in advancing therapeutics and personalized cancer therapy.
5. Conclusions
This pilot study demonstrates that the glycan profile of serum and breast tissue provides valuable insights into the molecular phenotype and progression of breast cancer. Alterations in high-mannose glycans and complex N-glycans correlate with cancer stage, grade and receptor status. Elevated levels of high mannose glycans was observed in malignant samples compared to healthy controls. Increased expression of high mannose glycans also correlated with ER- and HER2+ status. Serum levels of specific N-glycans (H3N5F1, H3N5, H4N5F1, and H4N4) were found to decrease in advanced cancer stage.
Taken together, these findings underscore the potential of glycomic profiles as biomarkers of disease. Glycan patterns can provide insight in disease detection, disease monitoring and subtype stratification. Serum findings are especially promising, providing a cost-effective and minimally-invasive tool in diagnostics. Future studies in larger and more diverse cohorts are needed to verify the candidate biomarkers identified in this pilot study. Ultimately, a better understanding of glycosylation patterns and their role in disease progression would help guide diagnostics and management, improving patient outcomes.
Author Contributions
Conceptualization, A.V.B.; methodology, A.V.B., Y.L., X.S., C.M.A.; data analysis, N.A.H.K., C.E., A.F., I.A., H.V.; writing—original draft preparation, N.A.H.K., C.E., A.F., I.A.; writing—review and editing, A.V.B., J.E., H.V., A.F.; resources, A.V.B., J.M., J.E.; funding acquisition, A.V.B., C.M.A., J.M., J.E.; supervision, A.V.B. All authors have read and agreed to the published version of the manuscript.
Funding
This research was funded by the Prisma Health transformative seed grant. C.E. was funded by 2023 Summer Scholar stipend through the SOARinG Research Program at the University of South Carolina School of Medicine Greenville. The APC was funded by the Department of Biomedical Sciences at the University of South Carolina School of Medicine Greenville.
Institutional Review Board Statement
Institutional Review Board Statement: The study was approved by the Tissue Utilization Committee per the IRB-approved biorepository protocol and SOPs (IRB #Pro00069834) under the project title ITOR BIO 01: Greenville Health System Institute for Translational Oncology Research (ITOR) Biorepository with reference number 1853278-7. Informed consent was obtained from all subjects involved in the study.
Data Availability Statement
All data are available in the manuscript.
Acknowledgments
The authors would like to acknowledge Prisma health cancer institute biorepository staff for providing cancer patient serum and tissue samples. Authors would also like to acknowledge Alexandra Kesic and Jonah Shealy for assistance with data analysis.
Conflicts of Interest
The authors declare no conflicts of interest.
Abbreviations
The following abbreviations are used in this manuscript:
| MALDI-TOF | Matrix-Assisted Laser Desorption/Ionization-Time of Flight |
| HMG | High mannose glycans |
References
- Kocarnik JM, Compton K, Dean FE, et al. (2022). Cancer incidence, mortality, years of life lost, years lived with disability, and disability-adjusted life years for 29 cancer groups from 2010 to 2019: a systematic analysis for the global burden of disease study 2019. JAMA Oncology, 8(3), 420-444.
- Kim J, Harper A, McCormack V, et al. (2025). Global Patterns and Trends in Breast Cancer Incidence and Mortality Across 185 Countries. Nature Medicine, 31(4):1154-1162.
- Arnold M, Morgan E, Rumgay H, et al. (2022). Current and Future Burden of Breast Cancer: Global Statistics for 2020 and 2040. Breast, 66:15-23.
- Huang S, Westvold SJ, Soulos PR, et al. (2025). Screening History, Stage at Diagnosis, and Mortality in Screen-Detected Breast Cancer. JAMA Network Open, 8(4):e255322.
- Saadatmand S, Bretveld R, Siesling S, Tilanus-Linthorst MM. (2015). Influence of Tumour Stage at Breast Cancer Detection on Survival in Modern Times: Population Based Study in 173,797 Patients. BMJ, 351:h4901.
- Shen Y, Yang Y, Inoue LY, at al. (2005). Role of Detection Method in Predicting Breast Cancer Survival: Analysis of Randomized Screening Trials. Journal of the National Cancer Institute, 97(16):1195-203.
- Duggan C, Trapani D, Ilbawi AM, et al. (2021). National Health System Characteristics, Breast Cancer Stage at Diagnosis, and Breast Cancer Mortality: A Population-Based Analysis. The Lancet, 22(11):1632-1642.
- Giaquinto, A. N., Sung, H., Miller, K. D., Kramer, J. L., Newman, L. A., Minihan, A., Jemal, A., & Siegel, R. L. (2022). Breast Cancer Statistics, 2022. CA: A Cancer Journal for Clinicians, 72(6), 524–541. [CrossRef]
- Matsen CB and Neumayer LA. (2013). Breast Cancer: A Review for the General Surgeon. JAMA Surgery, 148(10):971-9.
- Thomas D, Rathinavel AK, Radhakrishnan P. (2021). Altered Glycosylation in Cancer: A Promising Target for Biomarkers and Therapeutics. Biochimica Et Biophysica Acta. Reviews on Cancer, 1875(1):188464.
- Bangarh R, Khatana C, Kaur S, et al. (2023). Aberrant Protein Glycosylation: Implications on Diagnosis and Immunotherapy. Biotechnology Advances, 66:108149.
- Pinho, S. S., & Reis, C. A. (2015). Glycosylation in cancer: Mechanisms and clinical implications. Nature Reviews. Cancer, 15(9), 540–555. [CrossRef]
- Qusairy Z and Rada M. (2025). Glycosylation in Cancer: Mechanisms, Diagnostic Markers, and Therapeutic Applications. Molecular and Cellular Biochemistry, 10.1007/s11010-025-05303-1.
- Munkley J and Elliott DJ. (2016). Hallmarks of Glycosylation in Cancer. Oncotarget, 7(23):35478-89.
- Chen S, Qin R, Mahal LK. (2021). Sweet Systems: Technologies for Glycomic Analysis and Their Integration into Systems Biology. Critical Reviews in Biochemistry and Molecular Biology, 56(3):301-320.
- Chau TH, Chernykh A, Ugonotti J, et al., (2023). Glycomics-Assisted Glycoproteomics Enables Deep and Unbiased N-Glycoproteome Profiling of Complex Biological Specimens. Methods in Molecular Biology, 2628:235-263.
- Adamczyk, B., Tharmalingam, T., & Rudd, P. M. (2012). Glycans as cancer biomarkers. Biochimica et Biophysica Acta (BBA) - General Subjects, 1820(9), 1347–1353. [CrossRef]
- Kölbl, A. C., Andergassen, U., Jeschke, U., Friese, K., Mayr, D., & Schindlbeck, C. (2015). The role of glycosylation in breast cancer metastasis and the involvement of epithelial-mesenchymal transition. BMC Cancer, 15, 863.
- Anderson NL and Anderson NG (2002). The human plasma proteome: history, character, and diagnostic prospects. Molecular & Cellular Proteomics, 1(11):845-867.
- Drake, R. R., Powers, T. W., Jones, E. E., Bruner, E., Mehta, A. S., & Angel, P. M. (2017). MALDI Mass Spectrometry Imaging of N-Linked Glycans in Cancer Tissues. Advances in Cancer Research, 134, 85–116. [CrossRef]
- Scott, D. W., & Drake, R. R. (2019). Glycosylation and its implications in breast cancer. Expert Review of Proteomics, 16(8), 665–680. [CrossRef]
- Vercoutter-Edouart, A.-S., Slomianny, M.-C., Dekeyzer-Beseme, O., Haeuw, J.-F., & Michalski, J.-C. (2008). Glycoproteomics and glycomics investigation of membrane N-glycosylproteins from human colon carcinoma cells. PROTEOMICS, 8(16), 3236–3256. [CrossRef]
- Boyaval, F., Zeijl, R. van, Dalebout, H., Holst, S., Pelt, G. van, Fariña-Sarasqueta, A., Mesker, W., Tollenaar, R., Morreau, H., Wuhrer, M., & Heijs, B. (2021). N-Glycomic Signature of Stage II Colorectal Cancer and Its Association With the Tumor Microenvironment. Molecular & Cellular Proteomics, 20. [CrossRef]
- Ščupáková, K., Adelaja, O. T., Balluff, B., Ayyappan, V., Tressler, C. M., Jenkinson, N. M., Claes, B. S. R., Bowman, A. P., Cimino-Mathews, A. M., White, M. J., Argani, P., Heeren, R. M. A., & Glunde, K. (2021). Clinical importance of high-mannose, fucosylated, and complex N-glycans in breast cancer metastasis. JCI Insight, 6(24), e146945. [CrossRef]
- Lee, L. Y., Chien, H. C., Chen, Y. J., Lee, C. Y., Lin, C. Y., & Hsu, C. C. (2020). Quantitative analysis of serum N-glycome using MALDI-TOF mass spectrometry for breast cancer diagnosis. Cancers, 12(6), 1425. [CrossRef]
- Park, D. D., C. Phoomak, G. Xu, L. P. Olney, K. A. Tran, S. S. Park, N. E. Haigh, G. Luxardi, W. Lert-Itthiporn, M. Shimoda, Q. Li, N. Matoba, F. Fierro, S. Wongkham, E. Maverakis and C. B. Lebrilla (2020). "Metastasis of cholangiocarcinoma is promoted by extended high-mannose glycans." Proc Natl Acad Sci U S A 117(14): 7633-7644.
- Oh, Y. J., M. W. Dent, A. R. Freels, Q. Zhou, C. B. Lebrilla, M. L. Merchant and N. Matoba (2022). "Antitumor activity of a lectibody targeting cancer-associated high-mannose glycans." Mol Ther 30(4): 1523-1535.
- Li, Qinying et al. “Comprehensive N-Glycome Profiling of Cells and Tissues for Breast Cancer Diagnosis.” Journal of proteome research vol. 18,6 (2019): 2559-2570. [CrossRef]
- Kyselova A, Mechref Y, Al Batanaineh MM, Dobrolecki LE, Hickey RJ, Vinson J, Sledge GW & Novotny MV (2008). Alterations in the serum glycome due to metastatic breast cancer. Journal of Proteome Research, 6(9), 3712-3721.
- Saldova, Radka et al. (2014). Association of N-glycosylation with breast carcinoma and systemic features using high-resolution quantitative UPLC. Journal of proteome research 13(5): 2314-27. [CrossRef]
- Haakensen, V. D., Liu, Y., Navjord, D., Dumeaux, V., McKay, J., Egeland, T., & Børresen-Dale, A. L. (2016). Serum N-glycan profiles related to breast tissue characteristics; a study among healthy women and breast cancer patients. Molecular Oncology, 10(1), 59–72.
- Benesova, I., Vodickova L, Vodicka, P., Liskova, A., Hauzik, M., & Kolarova, H. (2024). Glycan profiling of breast cancer tissues identifies subtype-specific signatures. Glycoconjugate Journal.
- Vreeker GCM, Wuhrer M, & Clerc F (2021). Serum N-glycome analysis reveals breast cancer subtypes with different glycomic signatures. Molecular & Cellular Proteomics, 20, 100044.
Figure 1.
High-mannose glycan (HMG) expression in serum and tissue samples. (A) Serum samples from cancer patients show significantly higher levels of high-mannose glycans (HMGs) compared to healthy controls (p<0.0001). (B) While there were no significant differences observed in HMG levels between serum samples from healthy controls and stage I breast cancer (p = 0.3108), significantly higher levels of high-mannose glycans were found in serum samples from stages II, III, and IV compared to healthy controls (p = 0.0015, 0.0084, and 0.0001, respectively). (C) HMG levels in serum samples from stage 3 breast cancer patients are significantly higher compared to HMG levels in serum samples from stage I, II and IV (p = 0.0029, 0.0472, and 0.0428, respectively). (D) There were no significant differences of HMG levels in serum samples from breast cancer patients across tumor grades. (E) Cancerous tissue samples show elevated high-mannose glycan expression compared to adjacent healthy tissue (p = 0.0015). (F) While there were no significant differences observed in HMG levels between tissue samples from healthy controls and those with stage I (p = 0.1794), stage III (p = 0.3714) or stage IV (p = 0.2905), significantly higher levels of high-mannose glycans were found in tissue samples from stages II compared to healthy controls (p = 0.0005). (G) HMG levels in tissue samples from stage II breast cancer were significantly lower than those from stage I (p = 0.0204) or stage III (p = 0.0063). (H) HMG levels in tissue samples from grade 3 breast cancer were significantly greater compared to grade 1 (p = 0.0034) or grade 2 (p < 0.0001).
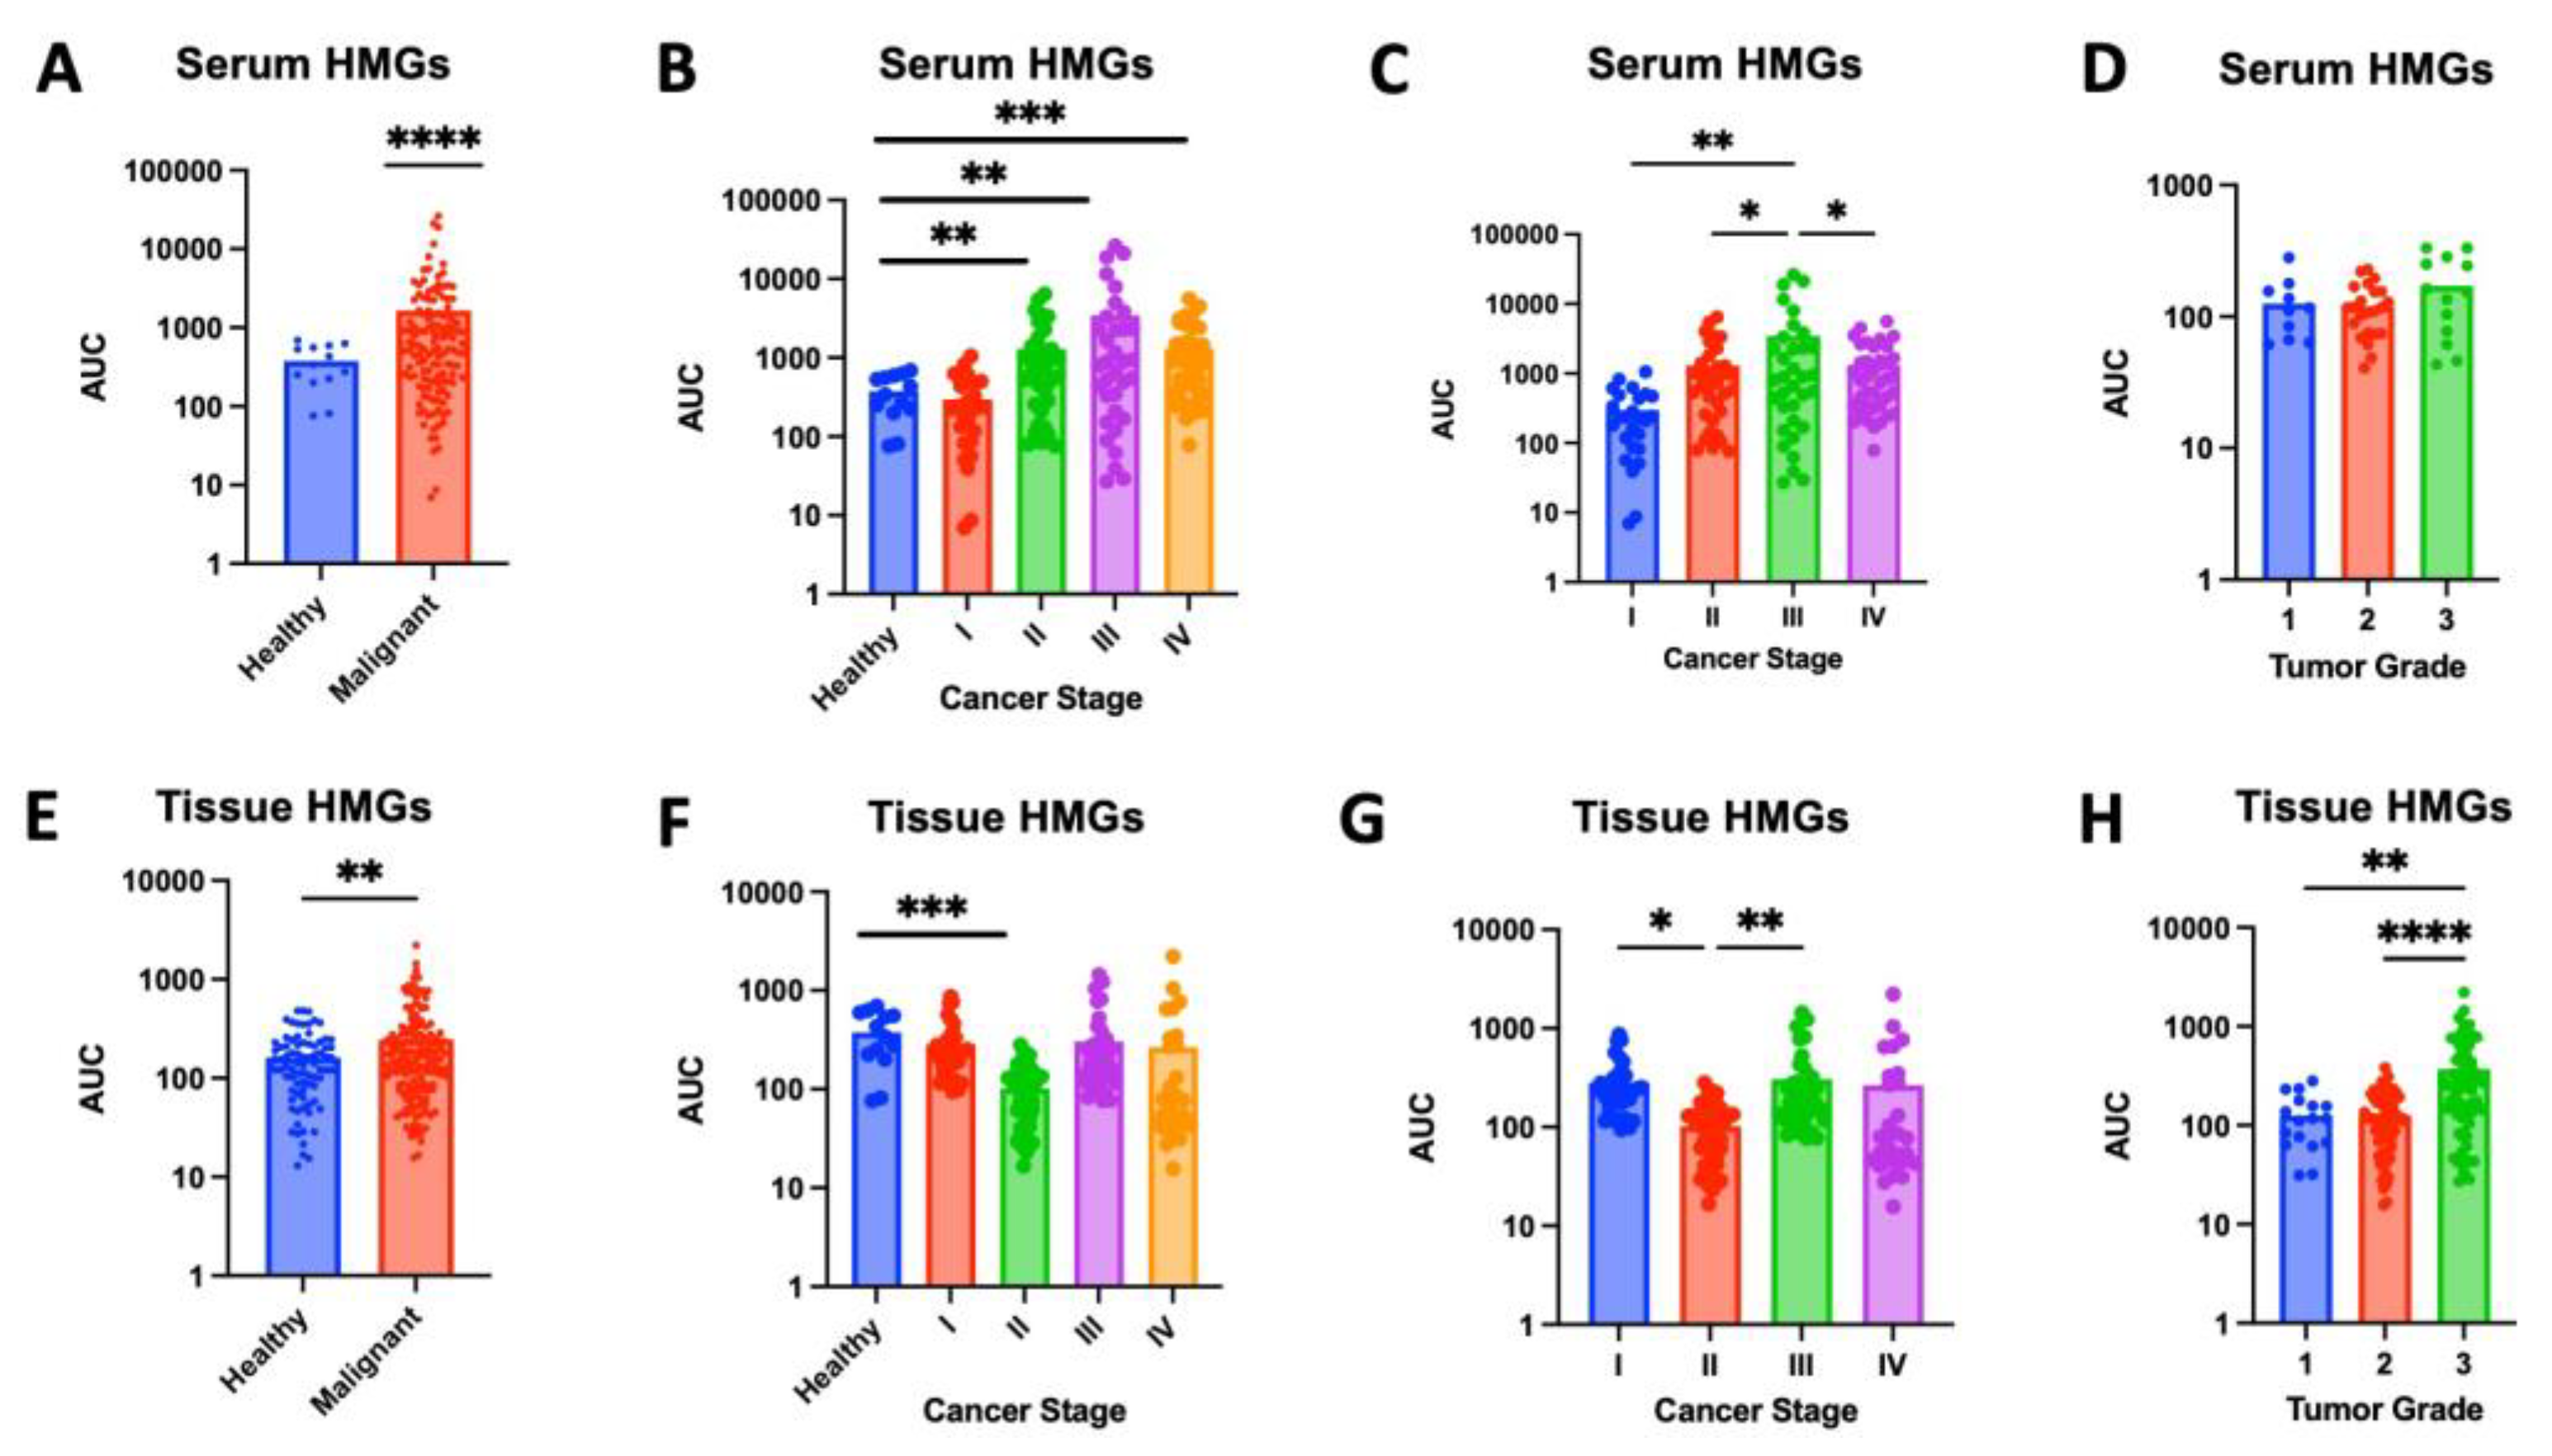
Figure 2.
Total serum high mannose glycan (HMG) expression across breast cancer subtypes by human-epidermal-growth-factor-receptor-2 (HER2) status and estrogen-receptor (ER) status. (A) Levels of high-mannose glycans (HMGs), measured as area under the curve (AUC), in serum samples from healthy participants, HER2+ breast cancer patients, and HER2- breast cancer patients. (B) Levels of high-mannose glycans (HMGs), measured as area under the curve (AUC), in serum samples from healthy participants, ER+ breast cancer patients, and ER- breast cancer patients.
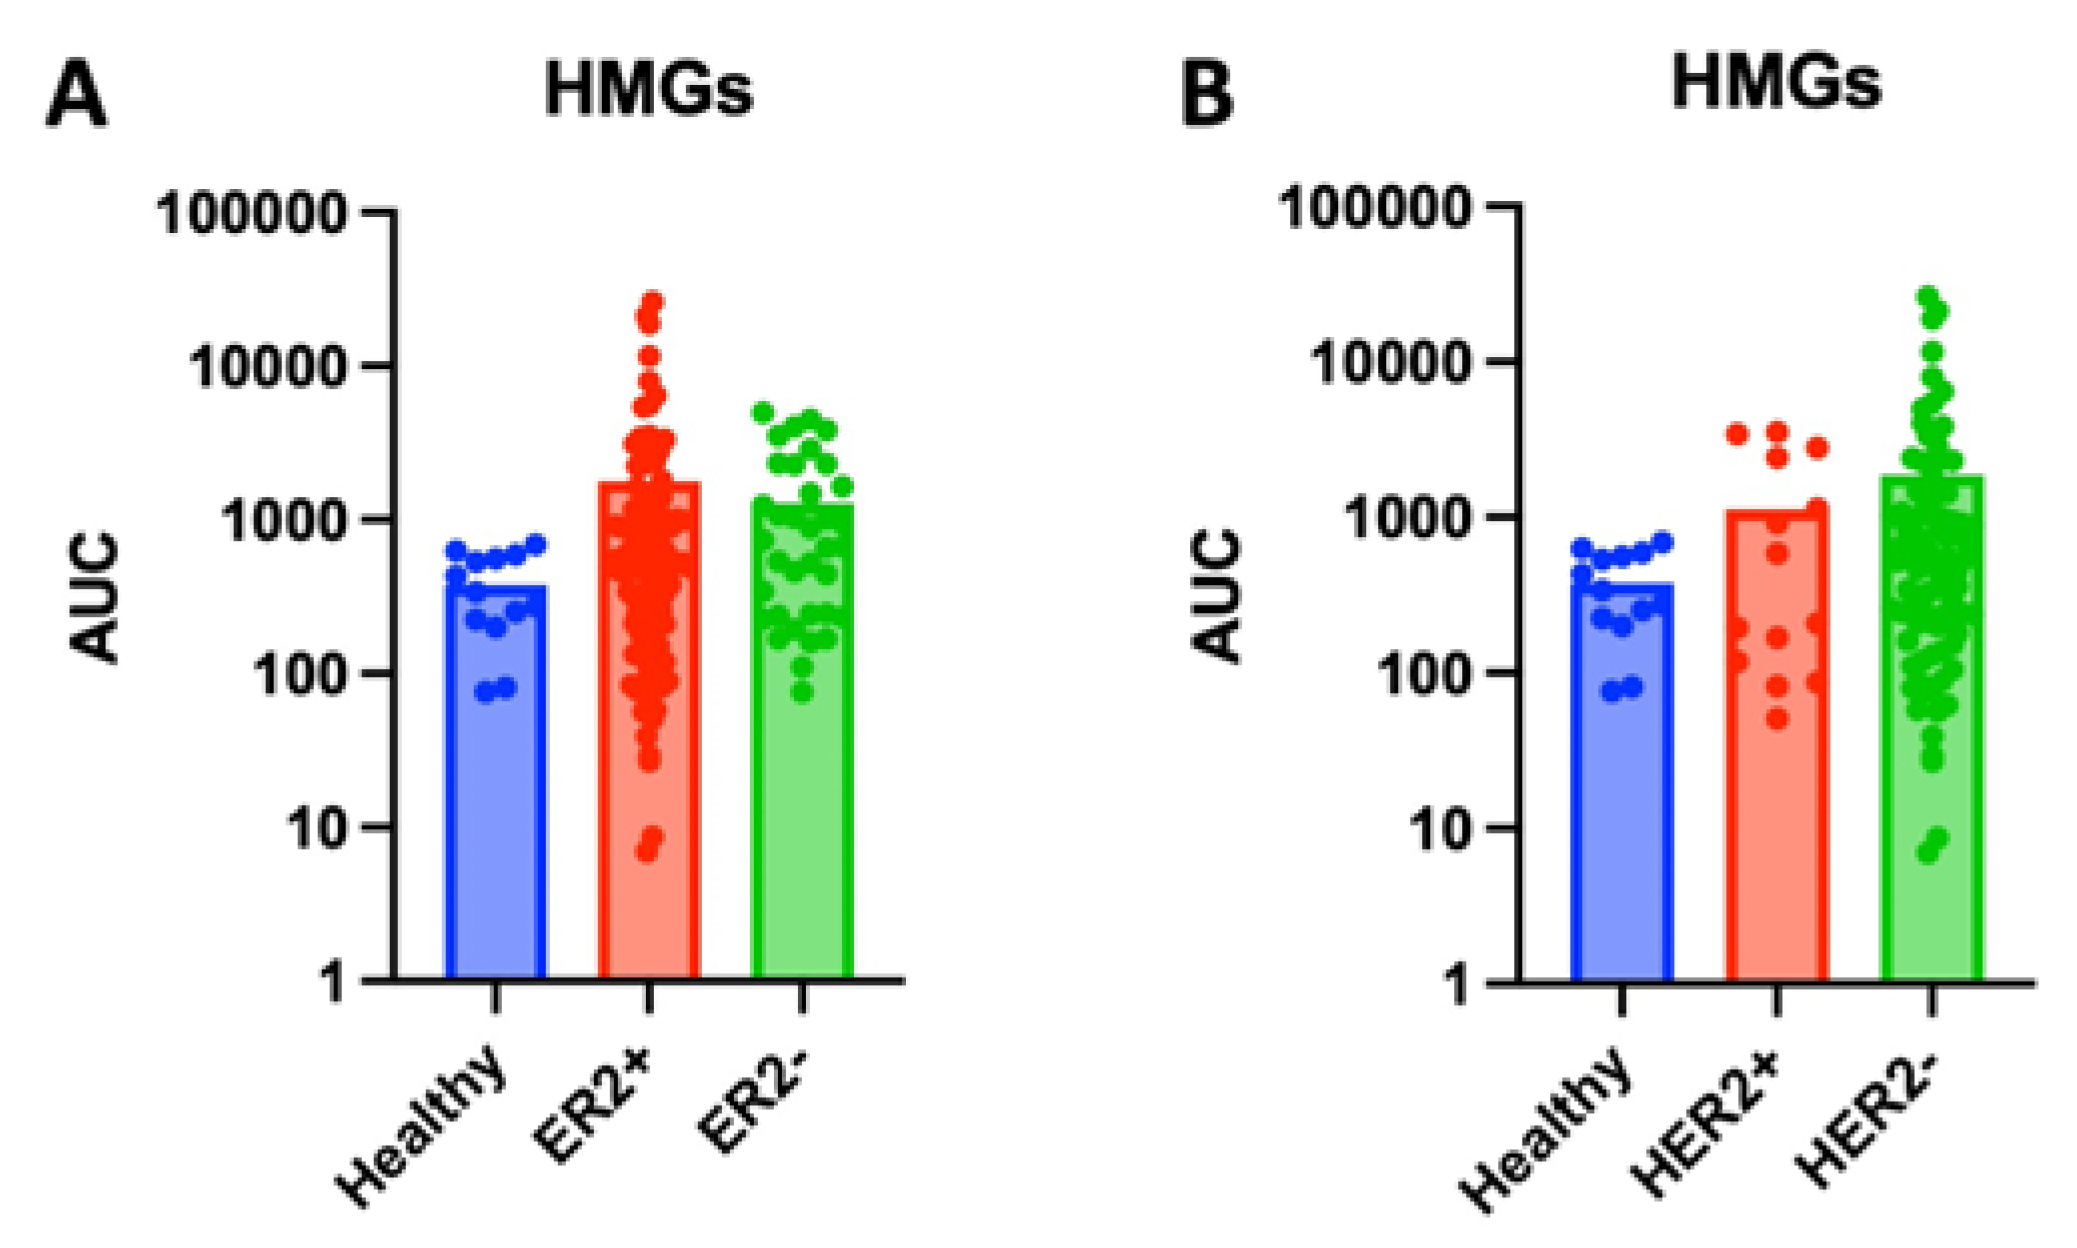
Figure 3.
Serum high mannose glycan (HMG) expression across breast cancer molecular subtypes, human-epidermal-growth-factor-receptor-2 (HER2) status and estrogen-receptor (ER) status. (A-E) Serum levels of high-mannose glycans (H5N2, H6N2, H7N2, H8N2, and H9N2) measured as area under the curve (AUC) in samples from HER2+, HER2-, and healthy control samples. (F-J) Serum levels of high-mannose glycans (H5N2, H6N2, H7N2, H8N2, and H9N2) measured as area under the curve (AUC) in samples from ER+, ER-, and healthy control samples.
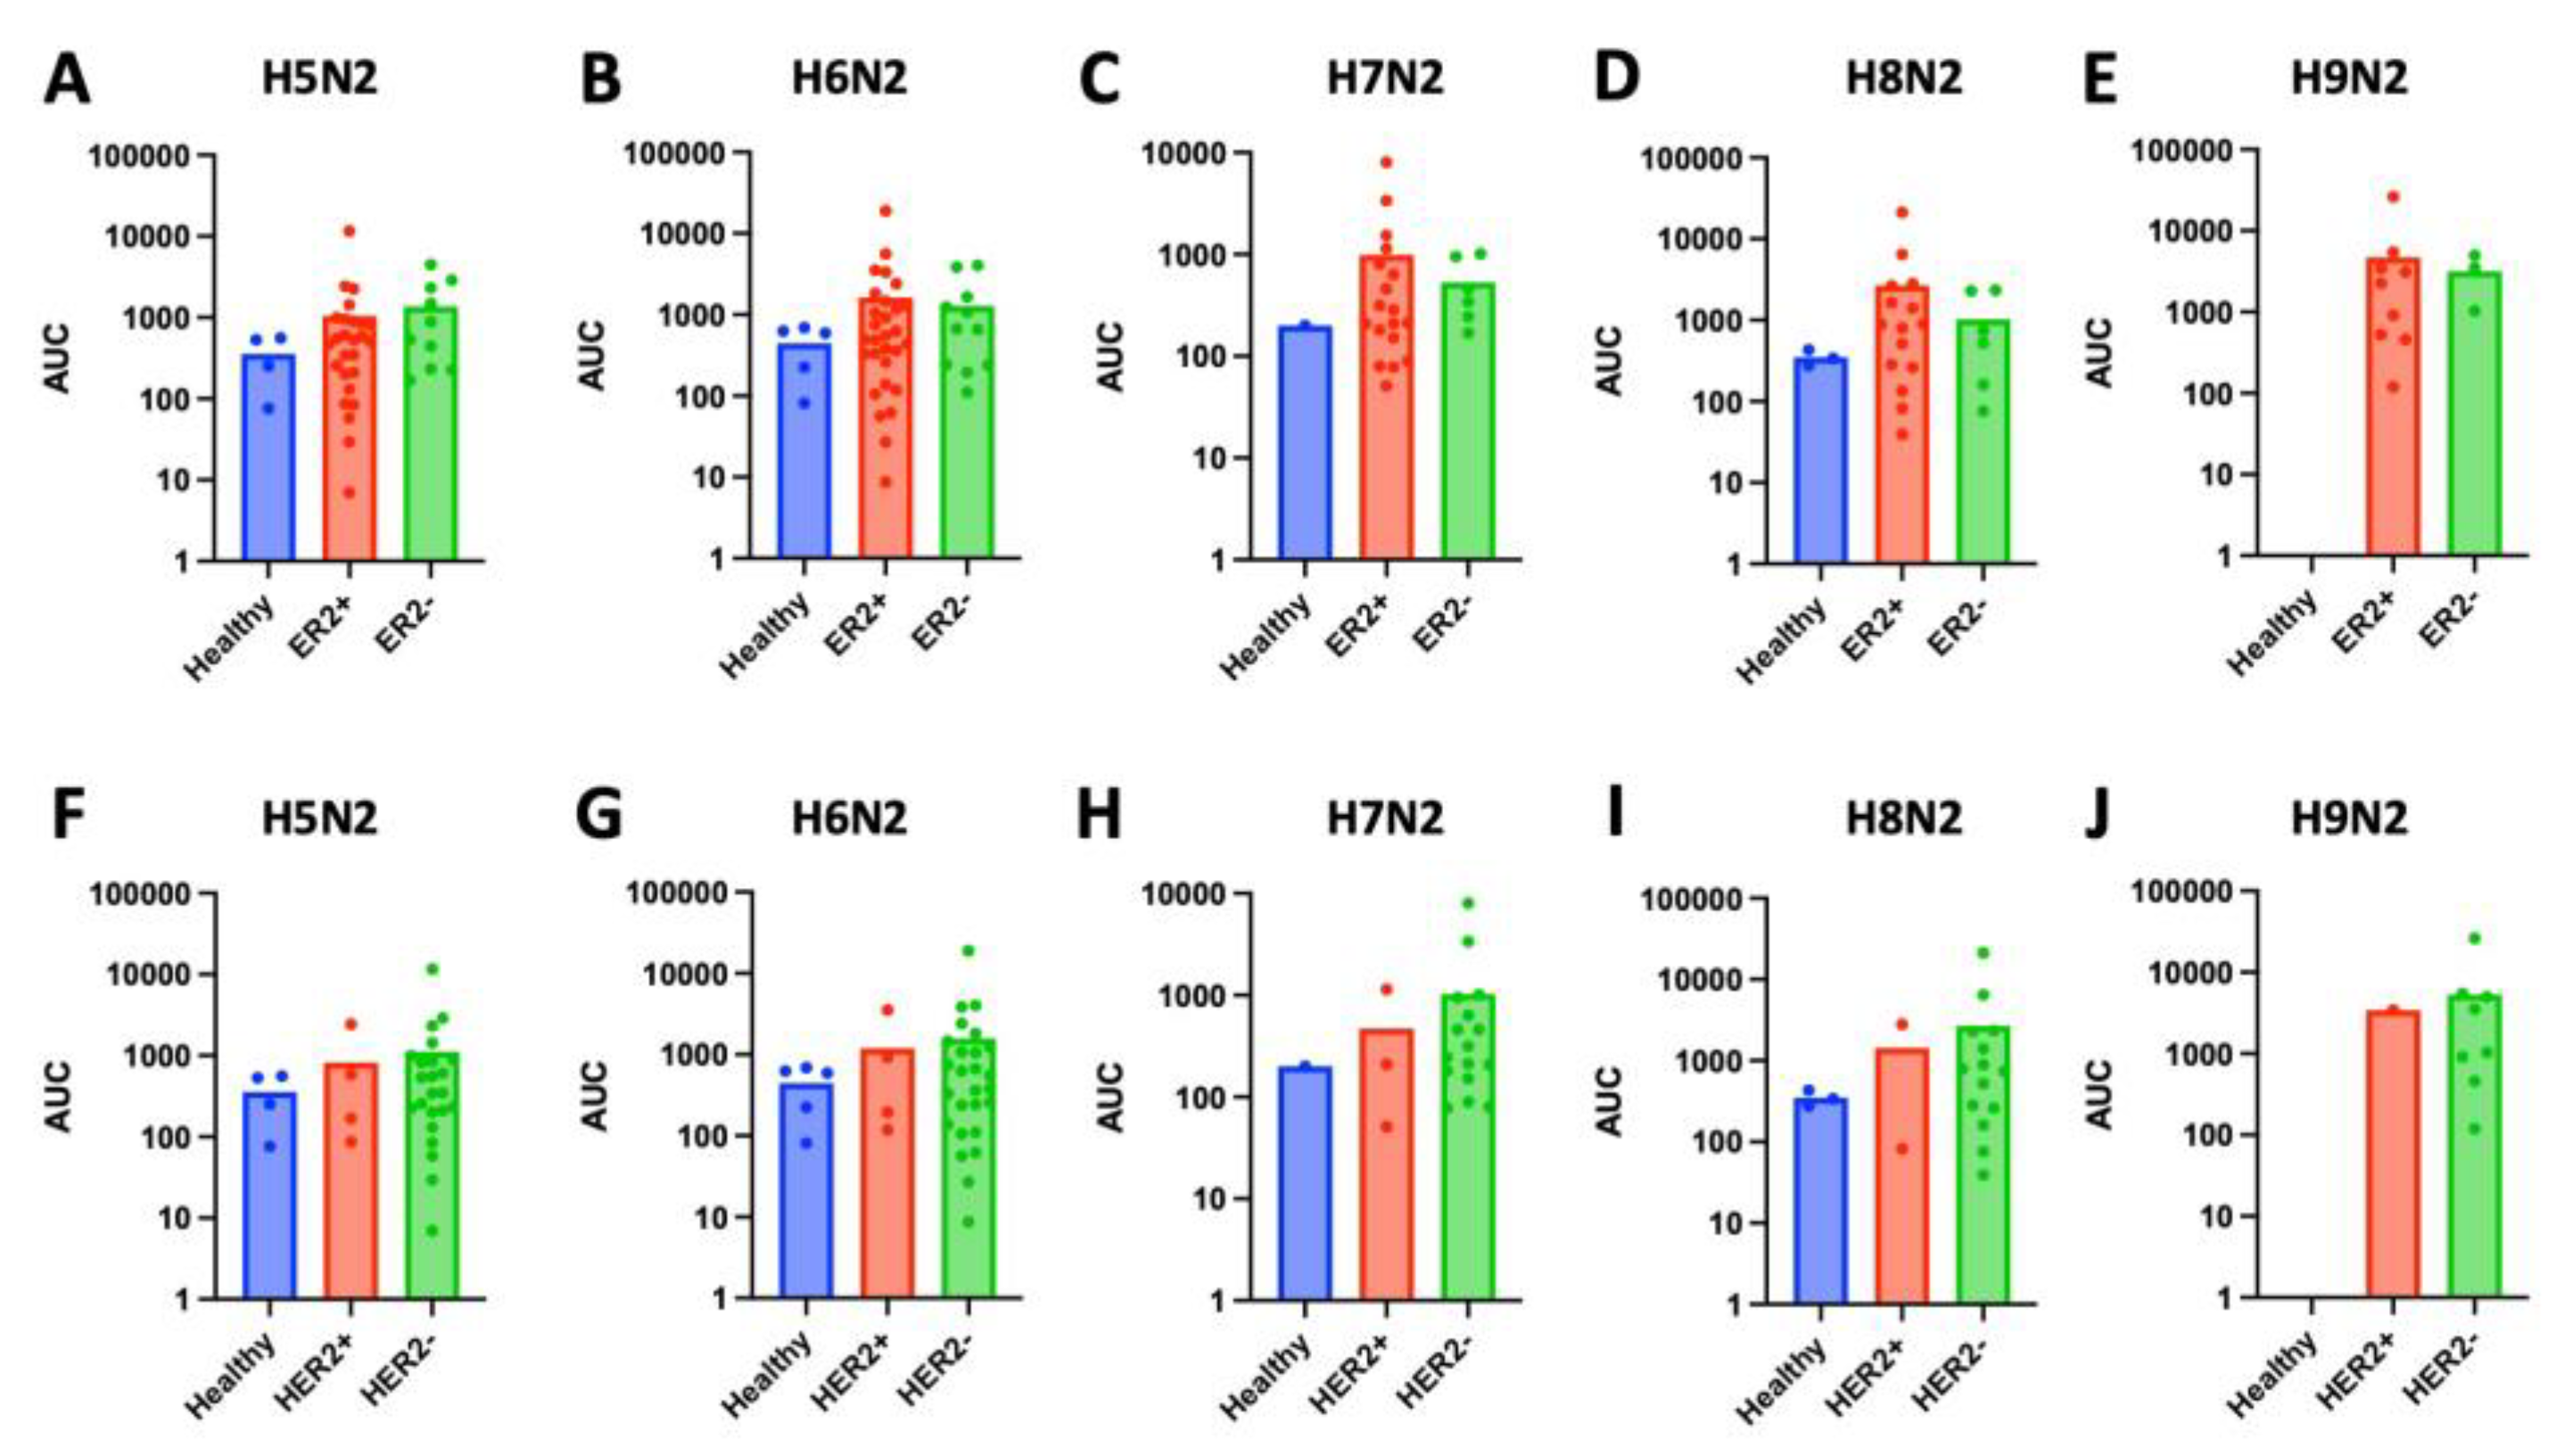
Figure 4.
High-mannose glycan (HMG) expression across breast cancer molecular subtype by estrogen-receptor (ER) status. (A) Levels of high-mannose glycans, measured as area under the curve (AUC), in tissue samples from estrogen-receptor negative (ER-) was significantly higher than in tissue from healthy controls (p < 0.0001) or estrogen-receptor positive (ER+) samples (p = 0.0002). (B-F) Levels of specific HMGs (H5N2, H6N2, H7N2, H8N2, and H9N2) in tissue from ER+, ER-, and healthy control samples. (B) Expression of H5N2 is significantly higher in ER- samples compared to healthy tissue (p < 0.001) or ER+ tissue (p = 0.0008). (C) Expression of H6N2 is significantly higher in ER- samples compared to healthy tissue (p < 0.001) or ER+ tissue (p < 0.001). (D) There was no significant difference in levels of H7N2 across healthy, ER+, or ER- tissue. (E) Levels of H8N2 is significantly higher in ER- samples compared to healthy tissue (p < 0.0001) or ER+ tissue (p = 0.0004). (F) There was no significant difference in levels of H9N2 across healthy, ER+, or ER- tissue.
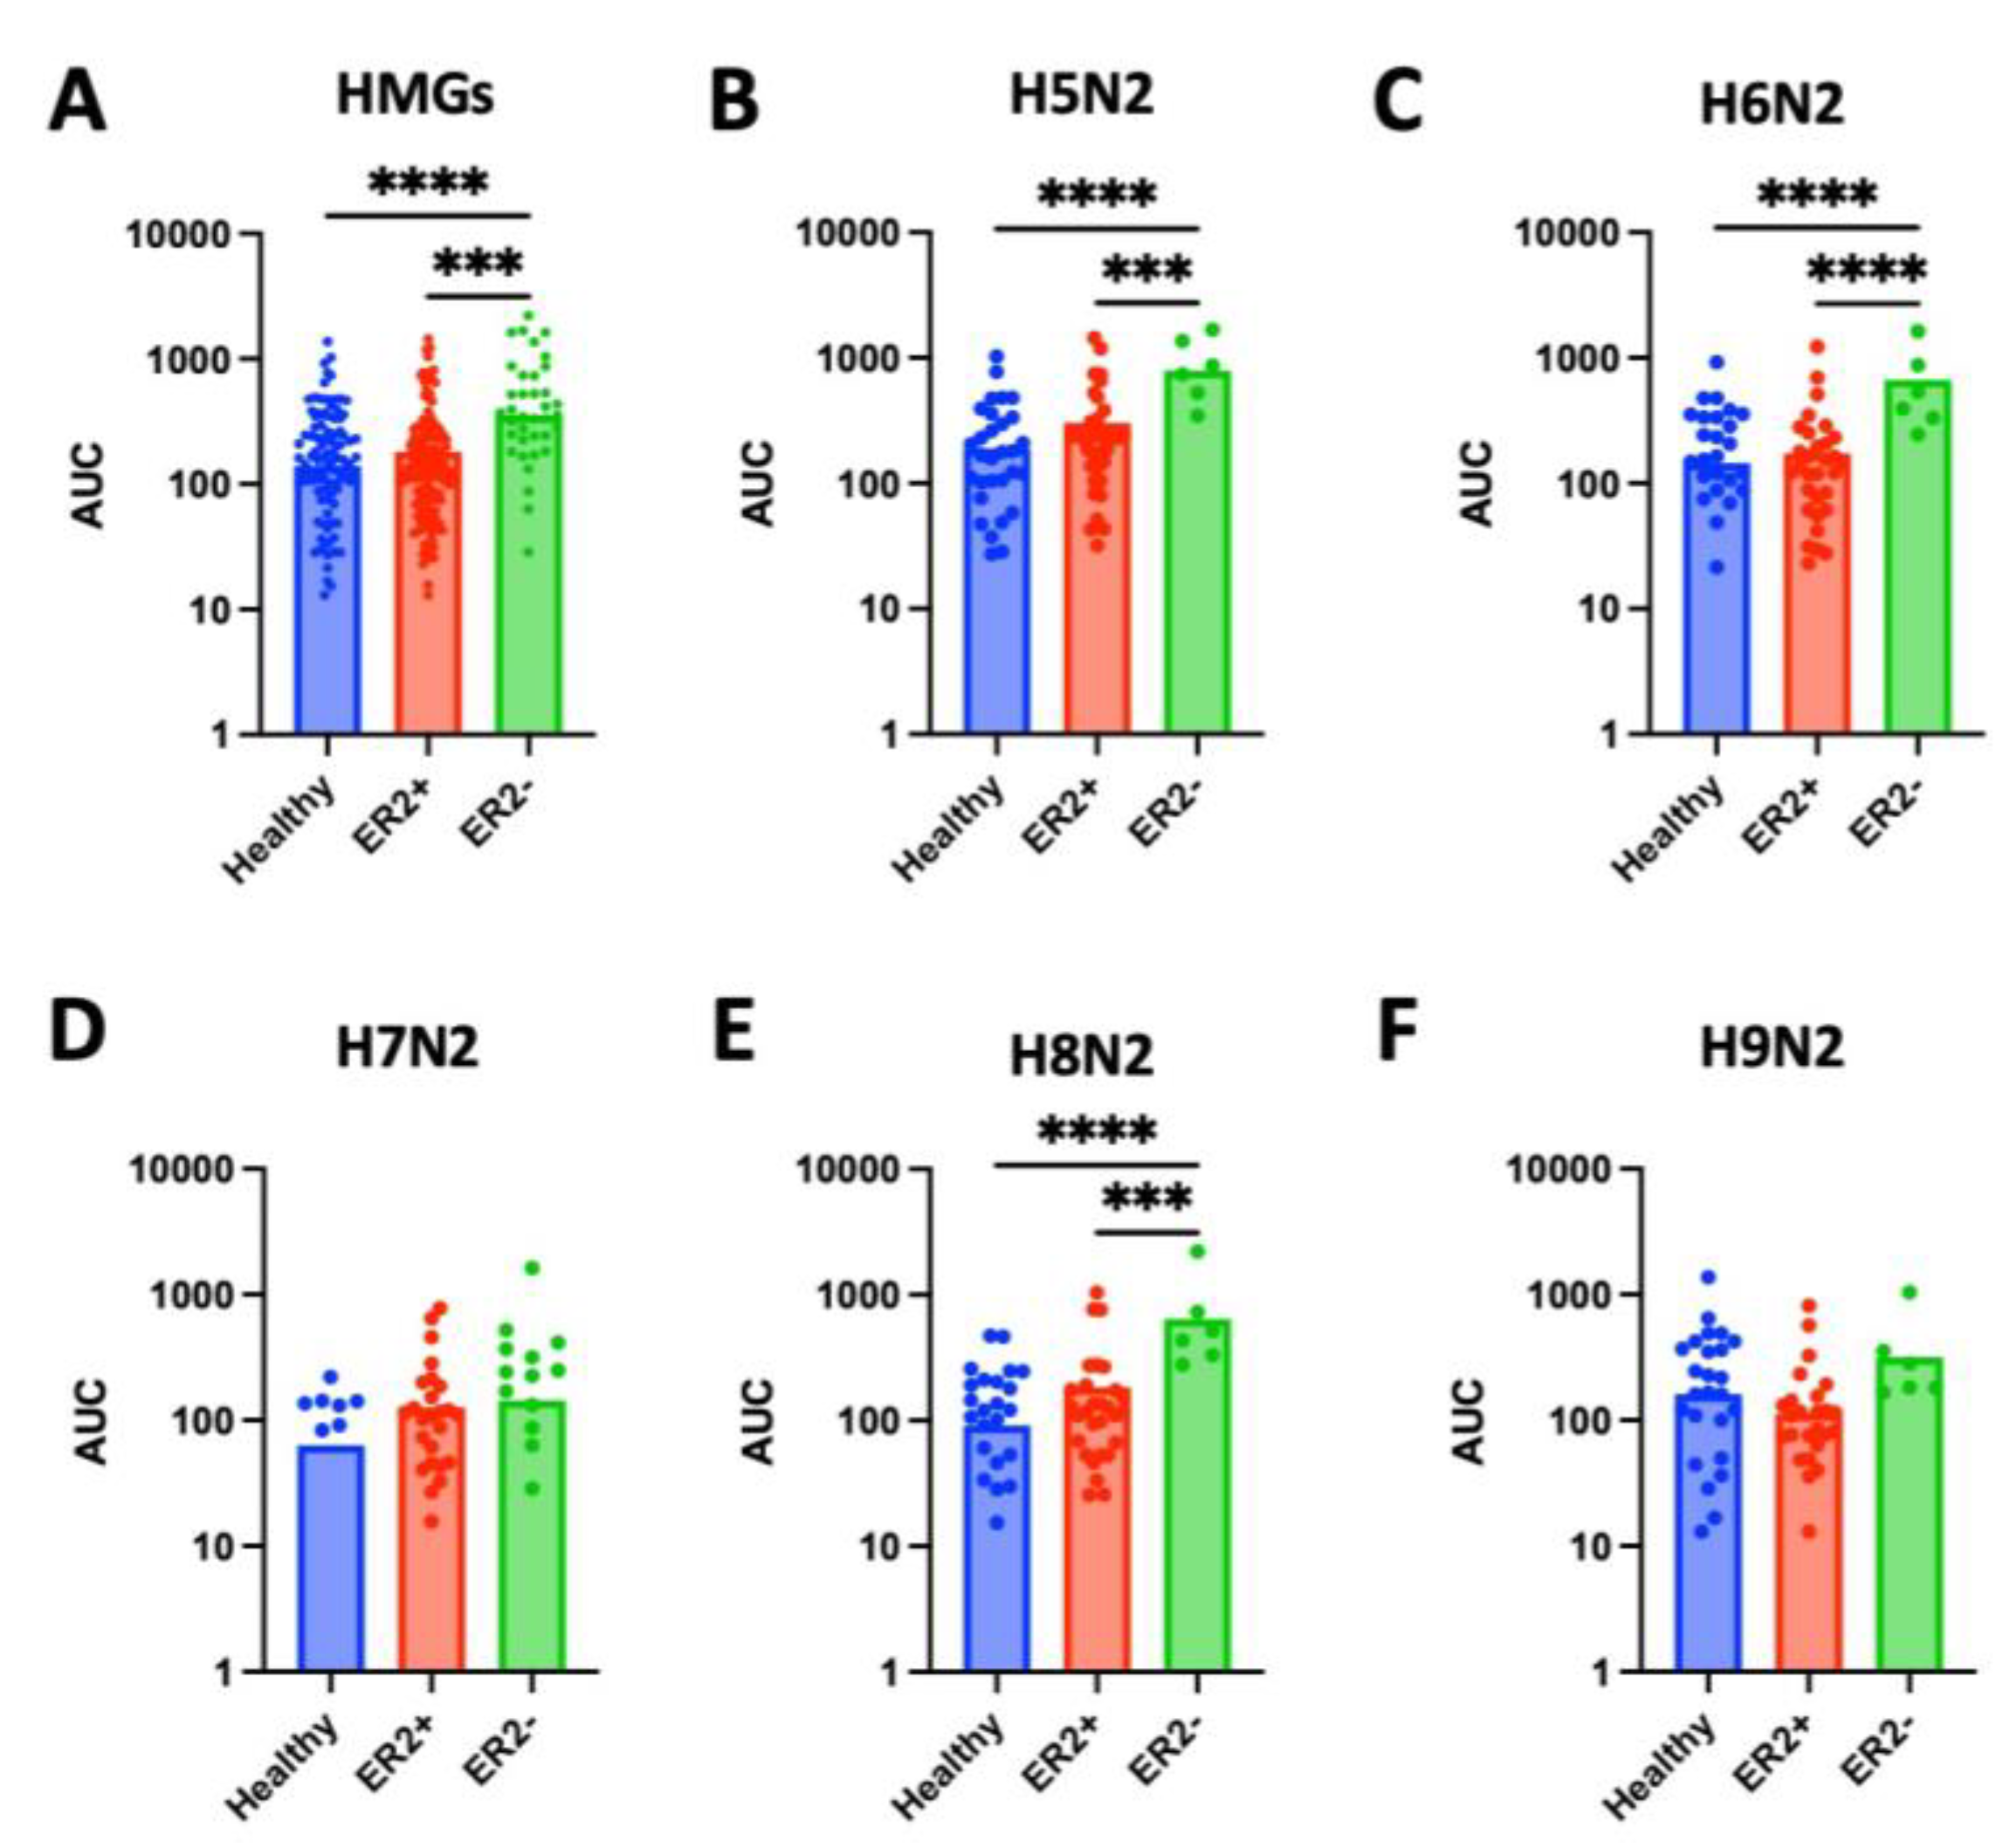
Figure 5.
High-mannose glycan (HMG) expression across breast cancer molecular subtype by human-epidermal-growth-factor-receptor-2 (HER2) status. (A) Levels of high-mannose glycans (HMGs), measured as area under the curve (AUC), in tissue samples from HER2+ was significantly higher than in tissue from healthy controls (p < 0.0001) or HER2- samples (p < 0.0001). (B-F) Levels of specific HMGs (H5N2, H6N2, H7N2, H8N2, and H9N2) in tissue from HER2+, HER2-, and healthy control samples. (B) Expression of H5N2 is significantly higher in HER2+ samples compared to healthy tissue (p = 0.0002) or HER2- tissue (p = 0.0031). (C) Expression of H6N2 is significantly higher in HER2+ samples compared to healthy tissue (p = 0.0023) or HER2- tissue (p = 0.0215). (D) Expression of H7N2 is significantly higher in HER2+ samples compared to healthy tissue (p = 0.0019) or HER2- tissue (p = 0.0058). (E) Levels of H8N2 is significantly higher in HER+ samples compared to healthy tissue (p = 0.0021) and approaching significance when compared to HER2- tissue (p = 0.050). (F) There was no significant difference in levels of H9N2 across healthy, HER2+, or HER2- tissue.
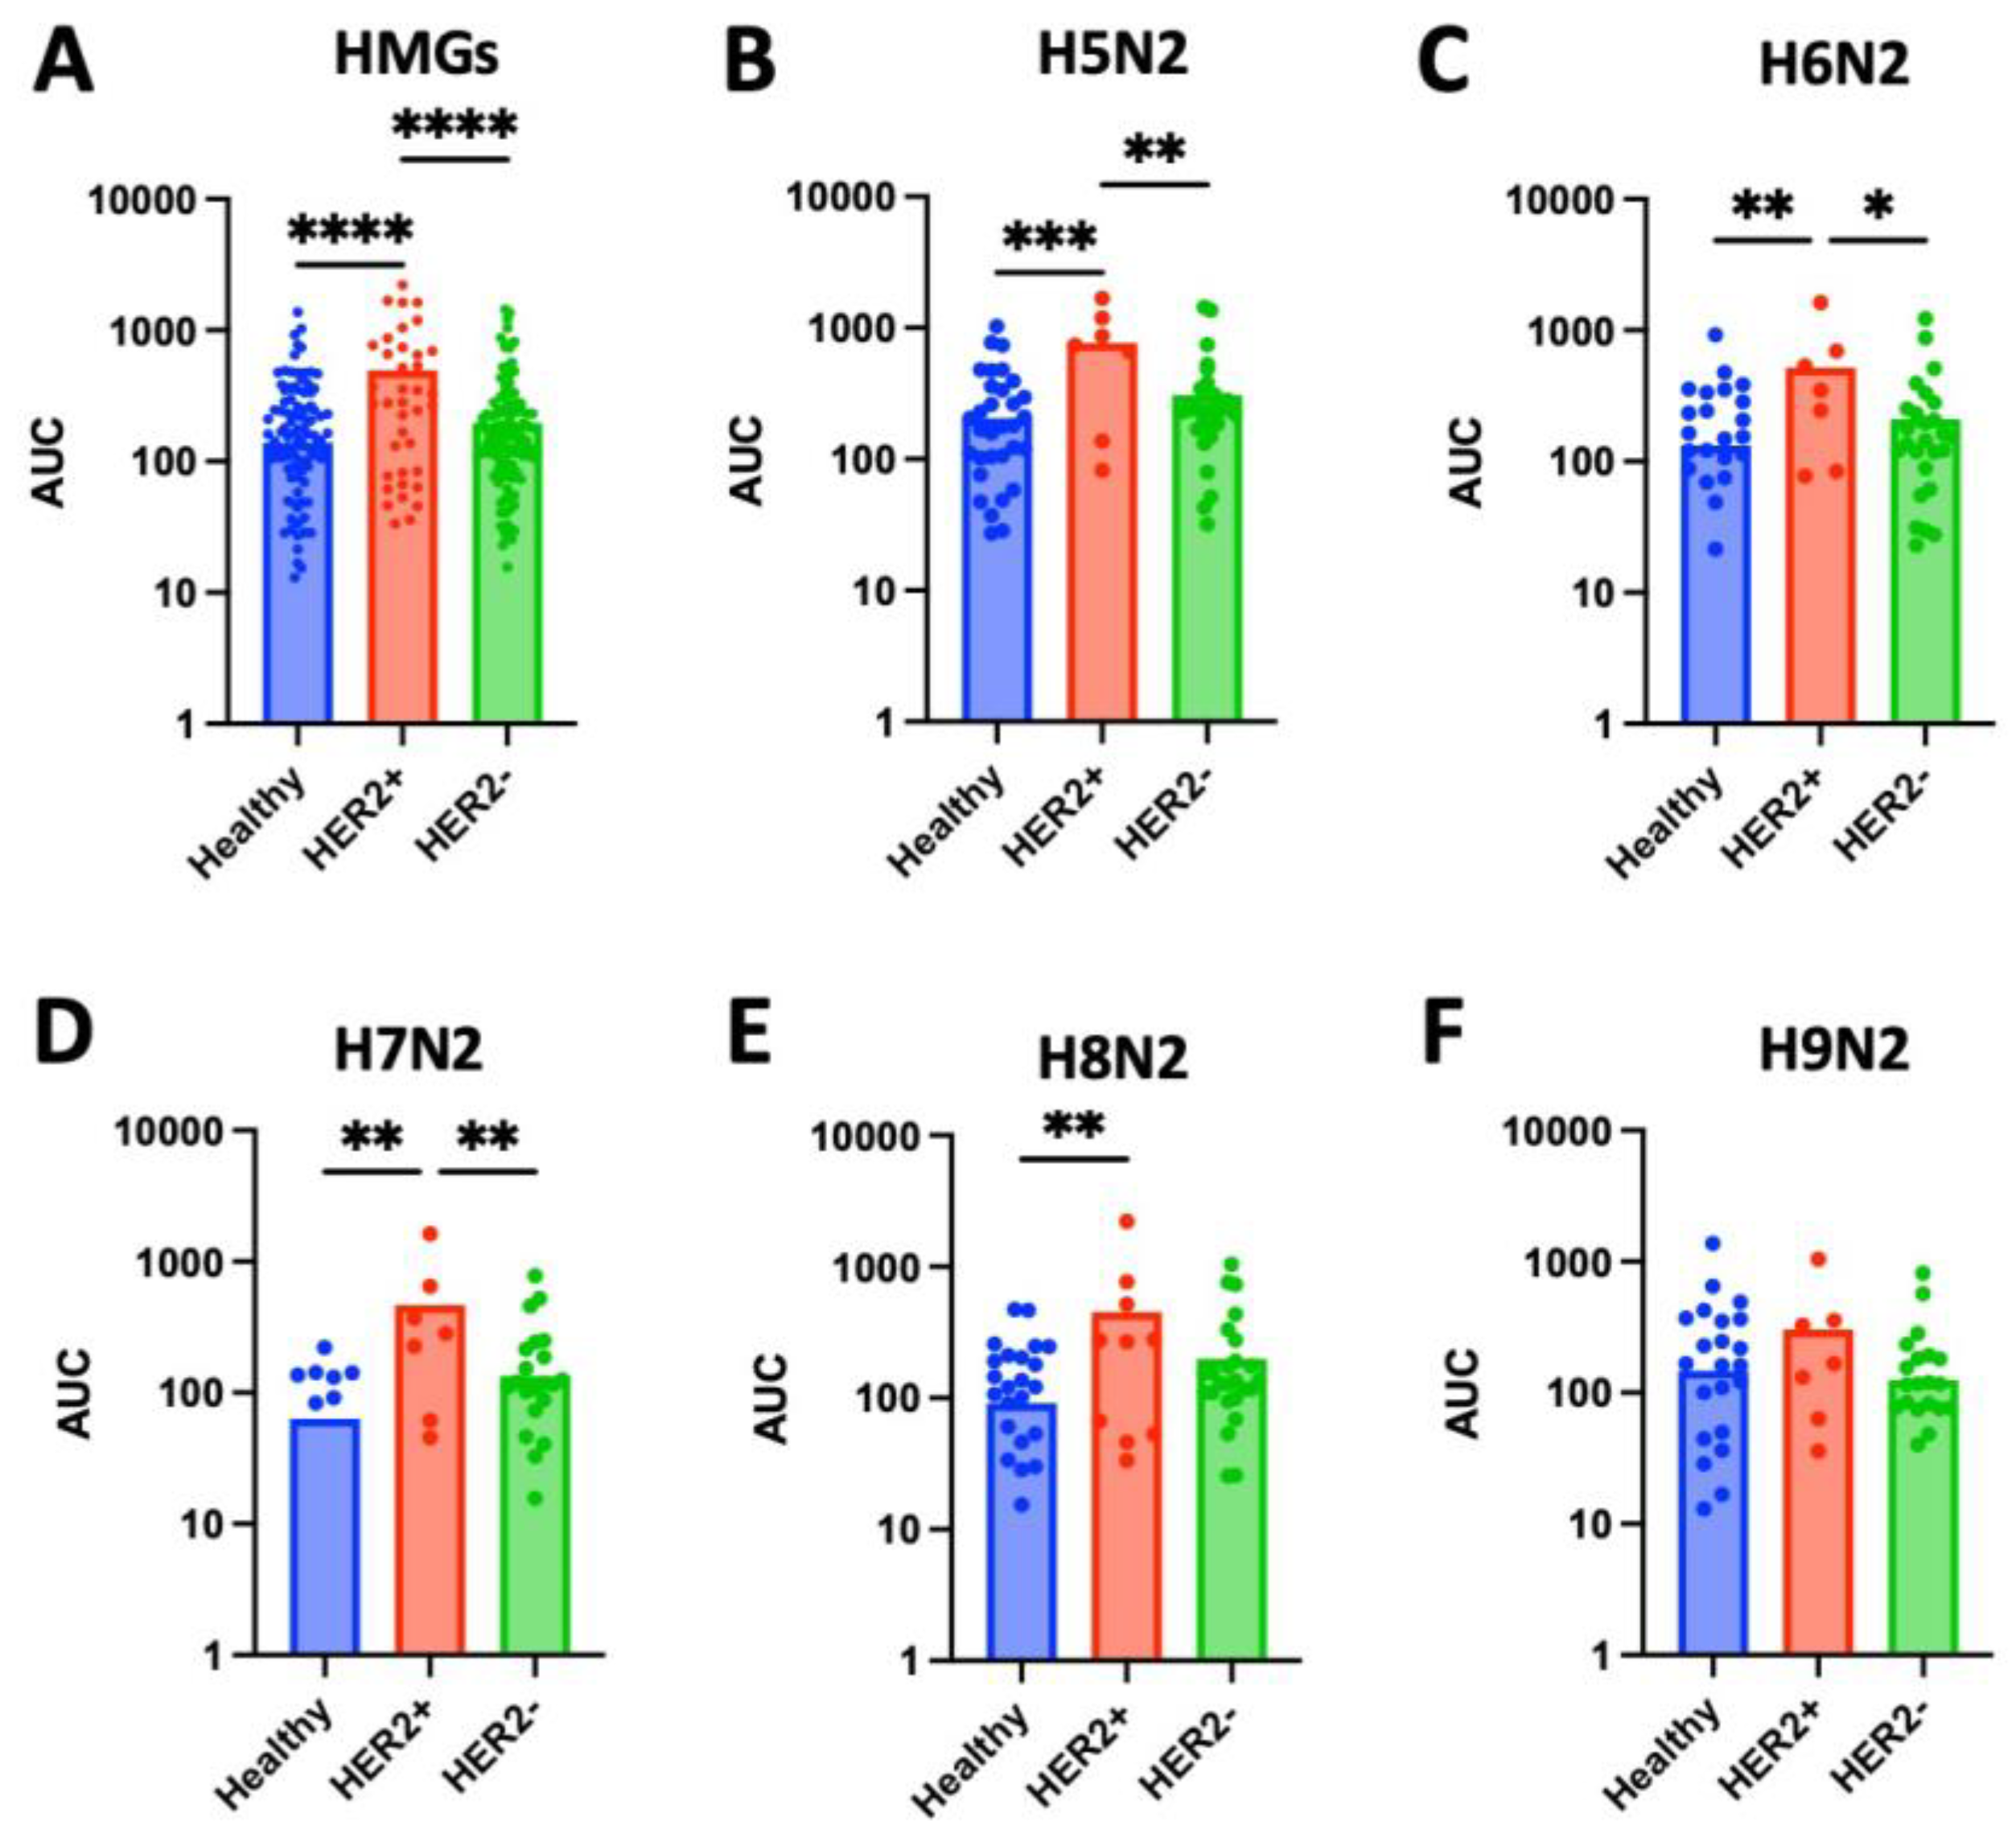
Figure 6.
N-glycan expression in serum and tissue samples. (A) Serum samples from cancer patients show no significant difference in levels of N-glycan expression compared to healthy controls. (B) While there were no significant differences observed in N-glycan levels between serum samples from healthy controls and stage II breast cancer (p = 0.3330), stage III (p = 0.0788), or stage IV (p = 0.1891), significantly higher levels of high-mannose glycans were found in serum samples from stages I (p = 0.0002), III, and IV compared to healthy controls (p = 0.0015, 0.0084, and 0.0001, respectively). (C) N-glycan levels in serum samples from stage 3 breast cancer patients are significantly higher compared to N-glycan levels in serum samples from stage I, II and IV (p = 0.0005, 0.0124, and 0.0075, respectively). (D) There were no significant differences of N-glycan levels in serum samples from breast cancer patients across tumor grades. (E) Cancerous tissue samples show elevated N-glycan expression compared to adjacent healthy tissue (p = 0.0026). (F) While significantly higher levels of N-glycans were found in tissue samples from stage I (p = 0.0016) and stage III (p = 0.0448) compared to healthy controls, significantly lower levels were found in tissue samples from stage II (p = 0.0033) and no significant differences were observed in stage IV (p = 0.4620). (G) N-glycan levels in tissue samples from stage II breast cancer were significantly lower than those from stage I (p = 0.0051) or stage III (p = 0.0491). (H) HMG levels in tissue samples from grade 3 breast cancer were significantly greater compared to grade 2 (p = 0.0057).
Disclaimer/Publisher’s Note: The statements, opinions and data contained in all publications are solely those of the individual author(s) and contributor(s) and not of MDPI and/or the editor(s). MDPI and/or the editor(s) disclaim responsibility for any injury to people or property resulting from any ideas, methods, instructions or products referred to in the content. |
© 2025 by the authors. Licensee MDPI, Basel, Switzerland. This article is an open access article distributed under the terms and conditions of the Creative Commons Attribution (CC BY) license (http://creativecommons.org/licenses/by/4.0/).
Copyright: This open access article is published under a Creative Commons CC BY 4.0 license, which permit the free download, distribution, and reuse, provided that the author and preprint are cited in any reuse.


