Submitted:
23 September 2025
Posted:
24 September 2025
You are already at the latest version
Abstract
Synchronized oscillatory fluctuations in intracellular calcium concentration across extended neuronal networks represent a functional indicator of connectivity and signal coordination. In this study, human dopaminergic neurons (LUHMES cell line) have been used to establish a robust protocol for generating reproducible intracellular Ca²⁺ oscillations in both two-dimensional monolayers and three-dimensional spheroids. Oscillatory activity was induced by defined ionic conditions in combination with potassium channel blockade. It was characterized by stable frequencies of approximately 0.2 Hz and high synchronization indices across millimeter-scale cultures. These properties were consistently reproduced in independent experiments and across laboratories. Single-cell imaging confirmed that oscillations were coordinated throughout large cell populations. Pharmacological interventions demonstrated that neither excitatory nor inhibitory chemical synaptic transmission influenced oscillatory dynamics. Gap junction blockers completely disrupted synchronization, while leaving individual cell activity unaffected. Functional dye-transfer assays provided additional evidence for electrical coupling This was further supported by connexin-43 expression profiles and immunostaining. Collectively, these findings indicate that synchronized Ca²⁺ oscillations in LUHMES cultures are mediated by gap junctional communication rather than by conventional synaptic mechanisms. This system offers a practical platform for studying fundamental principles of network coordination and for evaluating pharmacological or toxicological modulators of intercellular coupling. Moreover, it may provide a relevant human-based model to explore aspects of neuronal maturation and to assess compounds with potential neurodevelopmental toxicity.
Keywords:
Ca2+ oscillations
; gap junctions
; human dopaminergic neurons
; network synchronization
1. Introduction
Calcium (Ca2+) signaling, characterized by tightly regulated intracellular Ca2+ fluctuations, is essential for healthy neurodevelopment and mature neuronal functioning. These Ca2+ dynamics activate various second messenger systems, crucial for neural network formation and communication (1). A special form of intracellular Ca2+ dynamics are oscillations in which the concentration of free intracellular Ca2+ is periodically up- and down-regulated. This phenomenon has been observed in various neuronal cells and culture conditions (2-4). Calcium oscillations in the brain often exhibit a high degree of synchronization between many neurons (5-7). Aberrant patterns of Ca2+ oscillations have been observed in epileptic seizures or after stroke (8, 9), suggesting a crucial role of oscillations in neuronal networks in normal brain functions.
Several hypotheses are being discussed about the mechanisms involved in the generation and maintenance of oscillatory activity in the brain during neurodevelopment. As chemical synapses are the most important key players in adult neuronal signaling, it is assumed that they also play a role in the immature nervous system. However, electrical synapses, based on gap junction coupling could contribute to the maintenance of the oscillatory synchronization during neurodevelopment (10, 11). Gap junctions are pores composed of interconnected connexin (Cx) protein subunits in hexameric arrays within the plasma membranes of two adjoining cells. They can be found in many tissues, in which rapid signal transfer in the form of ions and/or neurotransmitters is crucial (12, 13). They are critical during neurodevelopment, mediating proliferation and differentiation processes, and play an essential role in the formation of the first neural circuits before chemical synapses are established (12, 14). Moreover, the importance of gap junctions is also evident from mutations in the connexin genes that result in severe diseases, such as Charcot-Marie-Tooth disease or non-syndromic deafness (15-18).
The involvement of electrical synapses during human neurodevelopment is relatively understudied. Moreover, human cell-based models that develop electrical synapses and that allow capturing their function at a reasonably high throughput are scarce.
Here, Ca2+ oscillatory behavior was studied in a well-established human dopaminergic neuronal model (LUHMES). These cells are of human origin, can be differentiated into fully post-mitotic dopaminergic neurons (19), and have been extensively used for the investigation of neurodegenerative diseases such as Parkinson’s disease (20, 21), but also for neurotoxicology screenings (22-27). Importantly, LUHMES cells have been characterized for their gene expression and electrophysiological properties (19, 28-30). They exhibit synchronous Ca2+ oscillations under certain conditions (29).
In this study, we explored the usefulness of LUHMES cultures to establish a novel model of Ca2+ oscillations in human neurons. After characterization of the Ca2+ spiking pattern in two-dimensional monolayers, also three-dimensional spheroids were generated to measure the oscillation pattern at various differentiation time points. Data from a combination of phenotyping and functional studies, combined with pharmacological intervention experiments were obtained to determine the role of gap junctions. Finally, we aimed to characterize and optimize this novel test system to allow future laboratory transfers and a screening campaign to identify factors affecting neuronal coordination and thus neurodevelopmental functions.
2. Methods
2.1. LUHMES Cell Culture
LUHMES cells were cultured following established protocols (19, 31, 32). Briefly, cell culture flasks were pre-coated with 1 µg/mL fibronectin (Merck KGaA, Missouri, USA) and 50 µg/mL poly-L-ornithine (PLO) (Merck KGaA, Missouri, USA). Precursor cells were maintained in Advanced DMEM/F12 (Dulbecco’s Modified Eagle Medium/Ham’s F-12) (GIBCOTM, New York, USA) supplemented with 2 mM L-glutamine (Merck KGaA, Missouri, USA), 1 x N2-supplement (GIBCOTM, New York, USA), and 40 µg/mL fibroblast growth factor (FGF) (R&D systems, Minnesota, USA). Cells were passaged upon reaching approximately 70% confluency. For passaging, cells were washed once with phosphate buffered saline (PBS), detached using 0.05% trypsin-ethylenediaminetetraacetic acid (EDTA) (GIBCOTM, New York, USA), which was incubated for 1 min at 37 °C with 5% CO2, resuspended in medium, and centrifuged at 300 × g for five minutes at room temperature. For differentiation, cells were cultured in advanced DMEM/F12 supplemented with 2 mM L-glutamine, 1 x N2-supplement, 1 mM N6,2′-O-dibutyryl 3′,5′-cyclic adenosine monophosphate (cAMP) (Merck KGaA, Missouri, USA), 1 µg/mL tetracycline (Merck KGaA, Missouri, USA), and 2 ng/mL glial cell line-derived neurotrophic factor (GDNF) (R&D systems, Minnesota, USA). After two days of differentiation in PLO/fibronectin-coated flasks, cells were transferred to the final culture dish. The detachment process followed the previously described protocol, with the modification that trypsin was incubated for 5 min. For two-dimensional cultures, cells were seeded at a density of 200,000 cells per cm2 onto culture plates pre-coated with 0.1% polyethylenimine (PEI) (Merck KGaA, Missouri, USA). To prepare the coating, 0.1% PEI was added to the wells and incubated for 1 h at 37 °C with 5% CO2. After incubation, the coating solution was removed, and the wells were washed four times with double distilled water. The water was then removed, and the plates were allowed to dry under a sterile hood. Half-media changes were performed every other day, and monolayer cultures were recorded on day 9 of in vitro differentiation (DIV 9). For three-dimensional cultures, LUHMES cells were cultivated using protocols established earlier (33). Briefly, cells were seeded into 96-well ultra-low attachment plates (BIOFLOAT™, Sarstedt, Nümbrecht, Germany) at a density of 7,500 cells per well, following a two-day differentiation process in flasks (as described for 2D cultures). The plates were centrifuged at 290× g for 3 min to facilitate spheroid formation. Medium changes were performed every other day. On the sixth day, spheroids were transferred to plates coated with matrigel (Merck KGaA, Missouri, USA; 1, 25 in medium). Cultivation continued for two more days, and spheroids were analyzed/recorded on DIV 10.
2.2. Ca2+—Imaging
High-throughput Ca2+ imaging recordings were performed using the FDSS/µCell (Hamamatsu Photonics, Hamamatsu City, Japan). Intracellular Ca2+ changes were visualized using the Ca2+ indicator Cal-520™ (AAT Bioquest, Pleasanton, USA) with cells stained at 1 µM for two-dimensional cultures and 2 µM for three-dimensional cultures. The Ca2+ indicator dye was incubated for 1h at 37 °C and 5% CO2. The system records the mean fluorescence intensity across the entire well over the recording period. An underside camera captures images of up to 384 wells simultaneously, while a dispensing head applies up to 384 different compounds at once, allowing the simultaneous measurement of compound effects across the entire plate. Compounds were applied as a 1, 10 dilution to achieve the final concentration in the wells. Recordings were performed in a buffer containing [in mM]: 135 sodium chloride, 1 potassium chloride, 10 D-glucose, 0.2 magnesium chloride, 10 HEPES, and 3.8 calcium chloride. The pH was adjusted to 7.4, and the osmolarity was set to 300 ± 5 mOsm. Compounds were applied after a 2.5 min baseline period. A second compound application was done after another 5 min. For Ca2+-imaging recordings Greiner 384 well μClear™ microwell plates (Greiner Bio-One GmbH, Frickenhausen, Germany) were used.
The FDSS/µCell system has limited resolution, preventing the visualization of single-cell activity or the activity of subpopulations. To achieve higher resolution, a Nikon Ti2 Eclipse system (Nikon Instruments, Amstelveen, Netherlands) with an Andor iXon Life 897 EMCCD camera (acal bfi, Dietzenbach, Germany) was utilized. Cell handling, recording buffer and calcium dye preparation were conducted as described above.
2.3. Patch Clamp Recordings
For patch clamp recordings, LUHMES cells were seeded onto glass coverslips at a density of 1,500 cells/µL in 20 µL droplets. The coverslips were pre-coated with 0.1% PEI solution. In brief, the PEI coating solution was added to the glass coverslips and incubated for 1h at 37 °C and 5% CO2. The coverslips were then washed with double distilled water four times and allowed to dry under the sterile hood. GB150TF-10 glass pipettes (Science Products, Hofheim, Germany) were prepared on the day of recording using a micropipette puller (Sutter Instrument P-1000, Novato, USA) and had a resistance of 3–4 MΩ. Electrophysiological recordings were performed using an EPC 10 USB patch clamp amplifier in combination with the PatchMaster software (version 2×90.5; HEKA Elektronik, Lambrecht, Germany). The internal solution consisted of [mM]: 107 K-gluconate, 10 KCl, 1 MgCl2, 10 HEPES, 5 EGTA, 4 Na2ATP and 0.2 NaGTP. The pH was adjusted to 7.2, and the osmolarity was set to 280 ± 5 mOsm. The external solution consisted of [mM]: 140 NaCl, 4 KCl, 1 MgCl2, 1.8 CaCl2, 10 HEPES and 10 D-glucose. The pH was adjusted to 7.4, and the osmolarity was set to 300 ± 5 mOsm.
2.4. Dye-transfer Experiments
For dye transfer experiments, 50 µM Alexa-488 (Life technologies, Carlsbad, USA) was loaded into a recording pipette. The internal and external solutions as well as the patching protocol were identical to those used for patch clamp recordings, apart from the Alexa-488 dye. Cells were patched in whole-cell mode (34). The dye was allowed to distribute within the cell over a 15-min period. The dye was injected by the application of hyperpolarizing current pulses of 1nA for 200ms. In some experiments, 30 µM 18β-GA (Merck KGaA, Missouri, USA) was applied to the bath solution 15 min before patching the cell with the Alexa-488-filled recording pipette.
2.5. Immunocytochemistry
Immunohistochemistry was performed using an adapted protocol from (19). LUHMES cells were seeded at a density of 215,000 cells per well (207,000/cm2) onto coated 8-well ibidi slides (Ibidi GmbH, Gräfelfing, Germany). Wells were coated with 300 μL of an adapted coating solution containing PLO [100 μg/mL] and fibronectin [2 μg/mL] in Milli-Q water. On the day of seeding, wells were washed twice with 300 μL PBS. Cells were cultivated until differentiation d0, d3, and d9. Cell culture medium was removed and replaced with 10% paraformaldehyde (PFA) for fixation at room temperature for 15 min. Cells were then rinsed once with PBS. Permeabilization was carried out using permeabilization buffer for IHC (0.6% Triton X-100 in PBS) for 10 min at room temperature, followed by a PBS wash. For blocking, cells were incubated in IHC blocking buffer (5% FCS, 0.1% Triton X-100 in PBS) for 1 h at room temperature. Primary antibodies, rabbit anti-connexin 43 alpha serum (1, 400), mouse IgG2 anti-TUJ1 (1, 1000), and anti-tyrosine hydroxylase clone LNC1 (1, 200), were diluted in blocking buffer for IHC and incubated overnight at 4 °C. After incubation, cells were washed once with PBS. Secondary antibodies, Alexa FluorTM 488 chicken anti-rabbit IgG (H+L), Alexa FluorTM 647 goat anti-mouse Ig2a (y2a) and Alexa FluorTM 555 goat anti-mouse IgG1 (y1), all diluted 1, 1000 in blocking buffer, and Hoechst-33342 (1, 1000 in blocking buffer) were added for 30 min at room temperature in the dark. Finally, cells were washed once with PBS.
Imaging was performed using a Zeiss LSCM880 confocal microscope with either a 40x/1.40 PlanApochromat (Oil) objective or a 63x/1.40 PlanApochromat (Oil) objective, utilizing the appropriate fluorescence channels corresponding to the respective fluorophores. Multiple images were captured per well, with focus individually adjusted for each structure. Images were exported in TIFF format. Qualitative analysis was conducted in ImageJ Fiji (version 1.54p), with adjustments to brightness and contrast applied solely for visualization purposes. Scale bars inserted were 20 μm.
2.6. Transcriptomics
LUHMES cells were seeded at a density of 60,000 cells/well (207,000 cells/cm2). Every other day (d) 50% of the medium was exchanged. Samples were taken on d0, d1, d2, d4, d6, d8, and d9. For sample preparation, the medium in 96-well plates was replaced by BioSpyder lysis buffer (33 µL/well; BioSpyder Technologies, Glasgow, UK). Following a 10 min incubation at 37 °C and 5% CO2, the plates were sealed and frozen at -80 °C for lysis completion.
Targeted transcriptome sequencing (including QC, alignment and read quantification) was conducted at Bioclavis (BioSpyder Technologies, Glasgow, UK) using the TempO-Seq technology. For each of the targeted genes, a 50 bp fragment was amplified, while also introducing sample-specific barcodes, which subsequently enabled sample pooling for the next-generation sequencing of the collection. A reference library containing the collection of all amplification products was used for assigning read counts to each targeted gene. A pre-filtering step for library size (<0.2 million) and average gene count (<1.5) was performed. The counts per gene were normalized to counts per million by dividing by the total number of mapped reads per sample and multiplying by 106. The effect of normalization was checked by boxplots and distribution plots (not shown) and no outlier samples were identified. A gene set list of interest was defined to account for all gap junction genes and expression values were obtained for these genes. For the heatmap generation the mean counts of the specified gene list were used. The mean counts for each differentiation day (dx) are shown as log2 values indicated by color, blue for low log2 values and red for high log2 values.
2.7. Data Analysis
Data were analyzed using either Python (35) or RStudio (36) based scripts.
In this study, the global synchronization index (GSI) was used to assess the synchronization of the culture. The GSI was computed using Python-based scripts (v7.0.8) (courtesy of Emilio Pardo-Gonzalez) and was originally introduced by (37) to quantify neuronal synchronization across multiple sites, unlike other methods that compare only two time series. This approach constructs a correlation matrix for all pairs of recorded signals. For each imaging series within a single well, the activity of 10 individual regions of interest (ROIs) was correlated. Fluorescence data was extracted using ImageJ (FIJI). This correlation matrix was then used in an eigenvalue-based algorithm to determine the GSI from the recorded data. The GSI ranges from 0 to 1, where 0 indicates non-coordinated activity, and 1 signifies a highly interconnected network of cells (37).
The following packages were used for the computation of the GSI: Pandas (38), NumPy (39), Matplotlib (40), seaborn (41).
All other graphs were generated using RStudio (v4.2.3). For frequency analysis, a fast fourier transformation (FFT) was performed using the genecycle package (42, 43). The function periodogram from the same package was used to compute the power spectral density and fourier frequencies. The package incorporates the approaches originally presented in other work (42, 44, 45).
The following R-packages were used to generate the figures: ggplot2 (46), dplyr (47), broom (48), drc (49), cowplot (50), grid (51), multicomp (52), magrittr (53), plotrix (54), patchwork (55), ggbeeswarm (56), readr (57), readxl (58), genecycle (42, 43), ggsignif (59), purr (60).
2.8. Data Handling and Statistics
All data sets include at least three repeats. Unless stated otherwise, error bars represent the mean ± SEM. A p-value of <0.05 was considered statistically significant. All data presented in manuscript figures are available in Excel files, so that other displays or statistical approaches may be applied to them.
3. Results
3.1. Synchronous Ca2+ oscillations
Highly synchronized Ca2+ oscillations have been observed in LUHMES cells under some specific pharmacological stimulation conditions (29). To follow-up on this, we explored culture conditions that would favor oscillations (i) that are highly reproducible (ii) co-ordinated over long (mm dimension) ranges, (iii) stable over extended periods (> 15 min) (iv) not requiring fine-tuning of exact concentrations of a potent pharmacological agent, (v) and being suitable for neurobiological and toxicological characterization. We found that culture of LUHMES cells in a high extracellular calcium [3.8 mM] and low potassium [1 mM] environment favors their oscillation tendency. On this basis, long-lasting synchronization was reproducibly triggered by the addition of tetraethylammonium chloride (TEA) [20 mM], a known blocker of a large variety of potassium channels (61-64).
To make sure that only signals from long-range synchronized Ca2+-changes were observed, we used an imaging system (FDSS/µCELL) that records the average fluorescence signal from an entire culture in each well of a 384-well plate (producing one single fluorescence value per time point and well). We assumed that neurons in their resting state, or non-synchronized cultures of many neurons (about 20,000 cells/well) would produce an average Ca2+ signal that does not change in a regular (oscillating) way over time. Based on this, we interpreted regular oscillations of Ca2+ as indication that neurons from all locations within the well had a synchronized activity, i.e., that activities of individual cells would not result in a relatively constant average sum (Figure 1A).
We observed exactly this functional response: Following TEA addition, a sharp rise of average intracellular free Ca2+-concentrations (shortly called “Ca2+ levels” in the following text) was observed. This was immediately followed by synchronous and highly reproducible Ca2+ oscillations around a relatively constant average value, which was clearly increased relative to the original baseline. Oscillations persisted for at least 15 min (sometimes for an hour or longer). (Figure 1.B)
To obtain more detailed data on the oscillations and their robustness, we analyzed the oscillation frequency across multiple wells from five independent experiments (conducted over a period of more than one year). The oscillatory activity demonstrated remarkable reproducibility across experiments and wells, with a frequency of 0.200 ± 0.007 Hz (Figure 1C).
After a clear indication for Ca2+ oscillations obtained by whole-well imaging, it was important to confirm these results by single-cell imaging. Such an approach is not only an essential experimental verification, but it also allows to obtain more detailed information about the propagation of the signal throughout the neuronal culture. The experimental protocol was essentially similar, but the fluorescence signal was recorded by a high-resolution camera mounted on an inverted microscope. Thus, the fluorescence of ROIs was recorded in parallel within one culture. First, a large ROI was used which corresponded to the entire imaging field. A clear oscillation of the signal was observed (Figure 2A). This control experiment showed that the alternative recording on two imaging devices showed essentially similar results. Next, several ROI, corresponding to the positions of selected cell bodies, were defined. An oscillating signal was observed for all cells, and oscillations occurred synchronously (as by visual inspection) (Figure 2B).
To obtain a quantitative measure of synchronicity, we assessed network coordination by calculating the global synchronicity index (GSI) for ten randomly selected ROIs across entire wells (Figure 2C, D). The two-dimensional culture exhibited a GSI of 0.84 ± 0.02 (n = 9 experiments), indicating a highly interconnected network.
3.2. Oscillatory Activity in a 3D Model
Given the complex three-dimensional architecture of the human brain, we next evaluated whether oscillatory activity could also be observed in a 3D spheroid model, based on the same cells. Large lots of LUHMES spheroids were generated in suspension cultures (33). For experiments, single spheroids were transferred to imaging plates and left to adhere for two days. Using the same induction protocol as for the two-dimensional system, robust and long-lasting oscillations were successfully elicited in the 3D spheroids (Figure 3A-D).
The oscillation frequency was quantified for 20 spheroids from five independent differentiations, collected over a period of more than one year. The 3D cultures exhibited a frequency of 0.200 ± 0.004 Hz. Thus, the mean frequency in spheroids was highly similar to the one recorded for 2D cultures. This provides evidence for a high reproducibility and consistency of the model across formats (Figure 3E, F).
To assess network synchronization, the GSI was calculated across multiple spheroids, using ten randomly selected ROIs per spheroid. The 3D cultures demonstrated a GSI of 0.89 ± 0.02, reflecting a high degree of coordinated activity within a given spheroid similar to 2D cultures (Figure 3G).
3.3. Transferability and Reproducibility of the Model System
For later applications of the novel model system described above, e.g., for toxicity testing and basic mechanistic research, it is important that the method can be run in other laboratories, by other operators, and possibly using other analytical instrumentation (65-69). This was tested by a transfer between the NMI in Reutlingen (see affiliations) and the University of Konstanz. Two different imaging devices were used at the recipient laboratory, and two different operators performed the experiments there over a period of one year. The stable and long-lasting oscillations were consistently reproduced, with similar quantitative characteristics (frequency, synchronization) (Figure 4).
3.4. Continuation of Oscillatory Activity in the Presence of Strong Modulators of Chemical Synapses
Besides some potential intracellular changes that affect [Ca2+]i, there must be a mechanism that is responsible for co-ordination between individual cells. The most established mechanisms for this in the nervous system are chemical and electrical synapses (6, 7, 70-73). We first examined the contribution of chemical synapses, as they play the dominant role in the mature nervous system (74-76). As glutamate is by far the most important excitatory neurotransmitter in the human brain, the effect of blocking glutamate receptors was studied: we applied CNQX to block AMPA receptor-mediated signaling and AP-5 to inhibit NMDA receptor activity. To further evaluate the overall contribution of glutamatergic transmission, the effect of exogenous glutamate application was tested. The oscillatory activity remained unaffected by any of these interventions. A quantification of the oscillation frequency showed that none of the compounds (CNQX, AP-5, and glutamate) had a significant effect (Figure 5A-B).
We additionally examined the role of the GABAergic system in regulating oscillatory activity. Picrotoxin was used to block GABAA-receptors, and phaclofen to inhibit GABAB-receptors. To assess the effect of GABA as an inhibitory neurotransmitter, exogenous GABA was also applied. Similar to the glutamatergic manipulations, none of these treatments affected the oscillation frequency, which remained at approximately 0.2 Hz (similar to control conditions) (Figure 5C).
3.5. Expression and Role of Gap Junctions
Gap junctions form direct electrical connections between adjacent cell membranes, enabling the passage of electrical signals (12, 77). We next explored whether electrical synapses play a role in the observed oscillatory activity in LUHMES cells. To this end, we applied two different gap junction blockers, carbenoxolone (CBX) and octanol and assessed if gap junctional communication and connectivity is present in LUHMES cells. Both compounds completely abolished the oscillatory activity, indicating a critical role of electrical synapses in mediating network synchronization (Figure 6A-C). A subsequent FFT analysis of four recordings after treatment with gap junction blockers showed that there was no clear frequency peak at all. These data suggest that there was no synchronous pattern of Ca2+ oscillations under these conditions (Figure 6D). These experiments were also reproduced in a second laboratory to make sure that the observed phenomena (similar in both laboratories) also were due to the same mechanistic basis (Figure 4H).
We wanted to provide an additional line of evidence for the existence of functional gap junctions between LUHMES neurons, independent of the use of pharmacological modifiers. For this reason, we examined the transfer of a low molecular weight, membrane-impermeable fluorescent dye (Alexa-488) from an injected cell towards its non-manipulated neighbor cells. Following loading of a single cell in a d4 culture with a dye-filled patch clamp pipette, we observed the spread of the fluorescence signal to about 5-17 (5 cells n=1; 6 cells n=1, 7 cells, n=1, 9 cells n=1, 11 cells, n=1, 17 cells n=1) neighboring cells (Figure 7). Dye spread was also observed at later stages of differentiation, but only to one or two neighboring cells (1 cell n=5, 2 cells n=1). The gap junction inhibitor 18β-glycyrrhetinic acid (18β-GA) blocked dye-transfer at d4 completely in five experiments and nearly completely (one neighboring cell stained) in one experiment. In d9 cells, 18β-GA completely abolished dye transfer in all experiments (n=6). These data suggest that there are gap junctions between LUHMES cells that allow intercellular transfer of small molecules. The peak of gap junctional connectivity appears to be at earlier stages of differentiation. However, it is maintained until at least d9, and may therefore account for the observed Ca2+ oscillations.
As further line of evidence, we obtained gene expression data for gap junction constituents over the time course of LUHMES differentiation. Expression of the GJA1 gene, encoding the major gap junction protein connexin 43, was particularly high. The maximum levels were observed in immature neurons, but substantial expression was also observed in more mature (d9) neurons used here as a model system (Figure 6E). These results are fully in line with the functional dye transfer data.
3.6. Identification of Gap Junctions Between Adjacent LUHMES Cell Membranes
To investigate whether the gene expression results translate to protein levels, immunocytochemistry for connexin 43 was performed on LUHMES cells. The staining intensity was most pronounced for d0 cells. It slowly decreased throughout the differentiation but was still clearly visible at d9. This is in concordance with the results from the gene expression analysis.
A dot like staining was observed at contact points of cell membranes. Gap junctions at such positions may support the formation of electrical synapses between neighboring cells. The signal was not only located on the somata of the cells but also on their neurites, indicating that electrical coupling to neighboring cells may involve neurites, in addition to the somata (Figure 8, Figure 4D). The studies on gene expression, protein localization and dye coupling all suggested that gap junctions, as basis for oscillatory activity, were already present in immature (early stage differentiation) cultures, Therefore, we also investigated, whether early stage cells already exhibited oscillatory activity. Indeed, oscillations were observed already early in the differentiation process (Suppl. Figure 3). These results are in line with other findings that suggest a particularly important role of gap junctions in the electrical coupling of neuronal networks at early developmental stages (14, 78, 79). For instance, it has been shown that gap junctions can propagate changes in Ca2+ levels rapidly and directly to neighboring cells (80, 81). The data presented here also agree with findings that connexin 43 is prominently expressed in the nervous system (82-84).
3.7. Inhibition of Gap Junctions Stops Network Connectivity, but Not Single Cell Activity
We hypothesized that gap junctions primarily mediate the synchronization of network activity, rather than being necessary for the intrinsic activity of single cells (as suggested in another model (10)). To obtain experimental evidence, Ca2+-imaging was performed with single cell resolution in the presence or absence of CBX (to block gap junctions). The response of randomly selected cells was analyzed before and after the addition of CBX, to assess changes in synchronization. Under control conditions, the cells exhibited highly synchronized activity. Following the addition of CBX, this synchronicity was disrupted. However, some individual cells continued to display some re-current Ca2+ spikes (mostly non-synchronized and not at one given frequency) (Figure 9A, B). To quantitatively assess this de-synchronization, we calculated the GSI before and after drug application for the same randomly selected ROIs (corresponding to single cells). Prior to drug application, the GSI was 0.84 ± 0.02, indicating strong network synchronization. After the addition of CBX, the GSI dropped significantly to 0.06 ± 0.03 (n=9), reflecting a substantial loss of coordinated activity across the culture without loss of individual cell activity (Figure 9C-E).
As an alternative technical approach, we performed current-clamp recordings using the same (as for imaging) high-calcium, low-potassium buffer in combination with TEA to induce oscillatory activity. The cells showed spontaneous activity as evidenced by frequent spikes (action potential-like depolarization of the cell membrane). In between the spikes, small depolarization events consistent with spikelet activity were identified. Spikelets are spike-like responses with amplitudes below 30 mV and typically indicative of electrical coupling via gap junctions (85-87). They were observed in 10 out of 13 recorded cells (Figure 9F, G). Spikelets are known in electrophysiology as the result of an action potential that originates from an electrically connected cell, whose signal is filtered and transmitted via gap junctions (88-90). We found that spikelet activity was almost completely abolished following the application of the gap junction blocker 18β-GA. This suggests that electrical coupling via gap junctions plays a key role in spikelet generation. This implies, at least indirectly, that electrical coupling of LUHMES cells was also observed by an electrophysiological approach. The generation of spikes (cell activity pattern) was also strongly decreased (remaining activity was only recorded in 3 out of 12 cells) after application of 18β-GA (Figure 9H). These electrophysiological data suggest that “spontaneous activity” of the cells was, at least in part, due to their coupling within an oscillating network.
4. Discussion
We presented here a novel experimental model that allows a reproducible and quantitative assessment of Ca2+ oscillatory activity in human dopaminergic neurons. The consistent reproduction of the data in two independent laboratories, in different culture formats, and on different imaging systems provides evidence for the reliability of the method. The highly synchronized Ca2+ oscillations occurred at the same frequency in both 2D and 3D cultures. Pharmacological activation (via glutamate) or inactivation (via inhibition of AMPA and NMDA receptors) of excitatory synapses did not change the pattern of oscillations. Also, the activation or block of inhibitory (e.g., GABAergic receptors) synaptic transmission had no effect. This indicates an alternative mechanism to the classical chemical transmission. Indeed, our findings suggest that synchronous Ca2+ oscillations may occur via gap junctions.
A main finding of our study is that LUHMES cells are functionally coupled via gap junctions and that such cell-cell connections are crucial for synchronous Ca2+ oscillations. We not only identified this network feature, but we also established a high-throughput assay that is suitable for studying such complex neuronal network functions and their disturbances.
Electrophysiological, imaging, and transcriptome data highlight the neuronal identity and functionality of the LUHMES cell cultures. We had also observed previously the induction of synchronized Ca2+ oscillations, which suggested the presence of a complex neuronal network that could be activated in a controlled manner, for example upon dopamine application or modulation of the dopamine transporter (29). We originally assumed that special conditions involving neurotransmitters would be required for this synchronized oscillatory network activity. Our present study indicates that long-term stable oscillations can be induced by simple shifts of ion balances.
Previously, Wang and colleagues also found that inhibition of potassium channels using TEA or another inhibitor of potassium channels (4-AP), leads to synchronized Ca2+ waves in cortical neurons. They speculate that transmitter release at the presynaptic membrane may play a role in this (6). In our model, it is more likely that the specific ionic conditions of the buffer in combination with TEA-induced depolarization provide the necessary electrophysiological state initiating and maintaining synchronized Ca2+ oscillations. Under these conditions, the synchronized Ca2+ oscillations are unlikely to be mediated by synaptic neurotransmitter release. Instead, electrical synapses, constituted by gap junctions are key players.
Gap junctions are found in various brain regions and between different cell types of the human nervous system (91, 92). They are typically composed of hexamers, called connexins (Cx), that are expressed in the cell membrane of neighbouring cells and form the gap junctions upon alignment (93, 94). Transcriptomic data shows that Cx43 is highly expressed in LUHMES cells. Cx43 can be found between astrocytes (95) and in the cortex during neurodevelopment, and is thought to play a key role in the regulation of neurogenesis (96).
Gap junctional coupling and the initiation of synchronized Ca2+ waves have been shown to be strongly influenced by the ionic composition of the extracellular environment (97-100). Blockade of gap junctions in vivo provides neuroprotection after perinatal global ischemia. Notably, elevated extracellular potassium levels, such as those observed during epileptic activity, can enhance gap junctional conductance (97, 98). Conversely, an increase in intracellular Ca2+ levels has been shown to result in gap junction uncoupling (99, 100) which is prevented in the presence of high extracellular potassium (e.g., concentration of about 90 mM) (99, 100).
The similarity of network oscillations which we observe in different culture formats suggests some cell intrinsic mechanism. So far, the mechanistic basis for this is unknown. A potential explanation for this may be exhaustion of energy stores as described for the pancreatic β-cell (101, 102) or dissipation of ion gradients that require time to be restored, before the next oscillation spike can occur. This potential intracellular mechanistic basis was beyond the scope of the present study, but it certainly requires attention in the future.
In our study, extracellular Ca2+ was elevated from 2.5 mM to 3.8 mM. We speculate that the higher extracellular Ca2+ concentration does not necessarily lead to strongly increased intracellular Ca2+ concentrations, as these would have resulted in cell death. We favor the hypothesis that the conductivity of receptors and transporters in the cell membrane was tweaked by the increased calcium levels in a way that favored oscillations. However, detailed electrophysiological studies are required to obtain clear evidence for this.
Our data, including the early onset of oscillatory activity at d2 and dye-transfer experiments showing spread to more than ten cells at d4, but only to one or two cells by d9, suggest that electrical synapses are more prominent during early stages of differentiation. They diminish as maturation progresses, but they are still well retained on d9. Gene expression analysis and immunohistochemistry staining also revealed that gap junction occurrence was higher during early development stages and declines with neuronal maturation. This observation aligns with the theory proposed initially by Fischbach in 1972, which posits that electrical synapses contribute to the initial formation of neuronal circuits during neurodevelopment prior to the emergence of chemical synapses (14, 78, 79). This is supported by findings in which coordinated Ca2+ transients in neighboring cells could be observed only in neuronal precursor cells of the developing brain and not in later stages (103). Our data indicate that LUHMES cells offer a unique opportunity to form electrically-coupled neuronal networks as observed during neurodevelopment in the human brain. This may allow the development of a toxicological new approach methodology (NAM) for developmental neurotoxicity testing that is complementary to already existing methods. Presently available NAMs of the developmental neurotoxicity test battery (as described by a consensus of international stakeholders (104, 105)) focus on morphological endpoints and electrical changes but may fail to detect toxicant actions on electrical synapses.
The lack of models, knowledge, and experience with factors that modulate electrically coupled neuronal networks is a serious concern for research on developmental neurotoxicants. Without suitable model systems, it is difficult to identify potential toxicants that trigger developmental neurotoxicity (DNT) by disturbing electrical synapses. Missing to identify such toxicants would increase the risk for the human population to be exposed to such harmful agents, with potential consequences for an increased liability to develop neuropsychiatric and neurological disorders. This situation has been referred to as the silent pandemic of neurodevelopmental toxicity (106).
Gap junctional communication not only plays a role in neurodevelopment, but also in several pathologies, ranging from brain tumors (107, 108) to stroke-like conditions (109, 110). The oxygen-glucose deprivation (OGD) typically caused by a stroke leads to increased electrical coupling of neuronal cells and results eventually in neuronal cell death (97). The gap junction blocker CBX has been shown to exhibit neuroprotective features during ischemic or hypoxic conditions indicating that electrical synapses play a role in cell death mechanisms after OGD (97). Another study using a trauma model, in which severe neuronal injury was induced by dropping a weight onto the neurons, also led to an increase in electrical connectivity (111). The authors could demonstrate that cell death could partially be protected by blocking gap junctions. This indicates that gap junctions are involved in cell death signaling, possibly by spreading stress factors from cell to cell via electrical synapses (111), Klicken oder tippen Sie hier, um Text einzugeben.underscoring the need for reliable in vitro systems to study gap junctional communication. Thus, in addition to establishing neurodevelopmental toxicity assays, the LUHMES cell model could also have potential in studying brain injury mechanisms after stroke or trauma.
The importance of developing an in vitro gap junction functional assay, especially in a human cell model, is further accentuated by the fact that a variety of connexin knock outs in mice are lethal or cause severe impairments (112-114). Moreover, in humans, more than 30 inherited connexin-linked diseases have been identified that range from motor-sensory neuropathy e.g., X-linked Charcot-Marie-Tooth disease (115, 116) to deafness (16-18), skin defects (117, 118), and eye disorders (119, 120).
In summary, we propose that the LUHMES cell model mimics the highly complex neuronal developmental process in which gap junction communication is the first neuronal circuit to form a functional network before chemical synapses take over. This may be a suitable model for studying this process without relying on animal models. It further opens the possibility to study DNT mechanisms but also possibly neuronal injuries in which gap junctional communication also plays a role.
Supplementary Materials
Suppl. Figure 1, Calculation of oscillation frequency using Fourier transformation after synaptic manipulation. Power spectra analysis of oscillation frequency after application of different concentrations of A exogenous glutamate B CNQX C DL-AP5 D exogenous GABA E GABAA receptor blocker picrotoxin and F GABAB receptor blocker phaclofen. Suppl. Figure 2, Calculation of the Global Synchronization Index (GSI) following gap junction inhibition. A,B Superimposed fluorescence traces from ten randomly selected ROIs, recorded using a high-resolution microscope (top). A After the addition of CBX, synchronized oscillatory activity persisted for 2–3 additional waves before network synchronicity was lost (top). The correlation matrix during this initial phase showed artificially elevated values, causing the GSI to appear higher for the whole experiment than the actual synchronicity level (A bottom). This delay likely reflects the time required for the drug to exert its full effect. B These initial oscillatory waves were excluded from the analysis to calculate the correlation matrix (top), which then clearly demonstrates the loss of connectivity within the network (B bottom). Suppl. Figure 3, Development of Ca2+ oscillations over a nine-day differentiation time course. A–F: Representative fluorescence traces showing synchronous activity at different time points after start of differentiation. Suppl. Figure 4, Correlation matrix plots used for the calculation of the global synchronization index (GSI) following gap junction inhibition. LUHMES cells were used as described in Figure 4, after transfer to a second laboratory (University of Konstanz). Different regions of interest (ROI) were defined in the cultures (as described in Figure 2) and Ca2+ signals were recorded from these regions. This data was used as input for an algorithm that calculates the synchronization index A Representative correlation matrix plot after the induction of oscillations in 2D LUHMES cells used for the calculation of the GSI. B Representative correlation matrix plot after gap junction inhibition in LUHMES cells used for the calculation of the GSI in Figure 4H. Suppl. Table 1, The counts per gene were normalised to counts per million by dividing by the total number of mapped reads per sample and multiplying by 106. The effect of normalization was checked by boxplots and distribution plots (not shown) and no outlier samples were identified. A gene set list of interest was defined to account for all gap junction genes and expression values were obtained for these genes. For the heatmap generation the mean counts (Table 1) of the specified gene list were used. The mean counts for each DIV are shown as log2 values indicated by color, blue for low log2 values and red for high log2 values.
Author Contributions
Conceptualization, J.K., U.K. and M.L.; methodology, J.K., E.C., A.AA., U.K. and M.L.; software, J.K., E.C., A.AA., J.S., Y.T., K.W.; validation, J.K.; formal analysis, J.K., E.C., A.AA.; investigation, J.K., E.C., A.AA., J.S., Y.T., K.W.; resources, U.K., M.L.; data curation, J.K., U.K. and M.L.; writing—original draft preparation, J.K., E.C., A.AA., U.K. and M.L.; writing—review and editing, J.K., E.C., U.K. and M.L.; visualization, J.K., U.K. and M.L.; supervision, J.K., U.K. and M.L.; project administration, J.K., E.C., U.K. and M.L.; funding acquisition, U.K. and M.L. All authors have read and agreed to the published version of the manuscript.
Funding
This work received financial support from the German Federal Ministry of Education and Research BMFTR (NeuroTool, grant agreement number #16LW0147), the Baden-Württemberg Ministry for Science, Research and Art through the “Kooperatives Promotionskolleg (KPK) InViTe2 Sigmaringen/Konstanz”. Funding was also received from the European Union’s Horizon 2020 research and innovation program under grant agreements No. 964537 (RISK-HUNT3R), No. 964518 (ToxFree) and No. 101057014 (PARC). Support was also received from the BMFTR via KMU Innovativ (PRADA, grant agreement number 16LW0575) and the State Ministry of Baden-Wuerttemberg for Economic Affairs, Labour and Tourism.
Acknowledgments
We would like to thank Timm Danker and Clemens Möller for the fruitful discussions. We would also like to thank Hanna Müller and Karin Gebhardt for their technical assistance. The authors would also like to thank the bioimaging center at the University of Konstanz. We would also like to thank Christiaan Karreman for writing analytical scripts.
Data availability
All data presented in manuscript figures are available in Excel files, so that other displays or statistical approaches may be applied to them.
Conflicts of Interest
The authors declare no conflict of interest.
References
- Brini M, Calì T, Ottolini D, Carafoli E. Neuronal calcium signaling: function and dysfunction. Cell Mol Life Sci. 2014, 71, 2787–2814. [Google Scholar] [CrossRef] [PubMed]
- Müller W, Swandulla D. Synaptic feedback excitation has hypothalamic neural networks generate quasirhythmic burst activity. J Neurophysiol. 1995, 73, 855–861. [CrossRef]
- Ogura A, Iijima T, Amano T, Kudo Y. Optical monitoring of excitatory synaptic activity between cultured hippocampal neurons by a multi-site Ca2+ fluorometry. Neurosci Lett. 1987, 78, 69–74. [Google Scholar] [CrossRef]
- Murphy TH, Blatter LA, Wier WG, Baraban JM. Spontaneous synchronous synaptic calcium transients in cultured cortical neurons. J Neurosci. 1992, 12, 4834–4845. [Google Scholar] [CrossRef]
- Lawrie AM, Graham ME, Thorn P, Gallacher DV, Burgoyne RD. Synchronous calcium oscillations in cerebellar granule cells in culture mediated by NMDA receptors. Neuroreport. 1993, 4, 539–542. [Google Scholar] [CrossRef]
- Wang X, Gruenstein EI. Mechanism of synchronized Ca2+ oscillations in cortical neurons. Brain Res. 1997, 767, 239–249. [Google Scholar] [CrossRef]
- Nunez L, Sanchez A, Fonteriz RI, Garcia-Sancho J. Mechanisms for synchronous calcium oscillations in cultured rat cerebellar neurons. Eur J Neurosci. 1996, 8, 192–201. [Google Scholar] [CrossRef]
- Sasaki T, Hisada S, Kanki H, Nunomura K, Lin B, Nishiyama K, Kawano T, Matsumura S, Mochizuki H. Modulation of Ca2+ oscillation following ischemia and nicotinic acetylcholine receptors in primary cortical neurons by high-throughput analysis. Sci Rep. 2024, 14, 27667. [Google Scholar] [CrossRef] [PubMed]
- Anwar H, Khan QU, Nadeem N, Pervaiz I, Ali M, Cheema FF. Epileptic seizures. Discoveries. 2020, 8, e110. [Google Scholar] [CrossRef] [PubMed]
- Leznik E, Llinás R. Role of gap junctions in synchronized neuronal oscillations in the inferior olive. J Neurophysiol. 2005, 94, 2447–2456. [Google Scholar] [CrossRef] [PubMed]
- LeBeau FEN, Traub RD, Monyer H, Whittington MA, Buhl EH. The role of electrical signaling via gap junctions in the generation of fast network oscillations. Brain Res Bull. 2003, 62, 3–13. [Google Scholar] [CrossRef]
- Goodenough DA, Goliger JA, Paul DL. Connexins, connexons, and intercellular communication. Annu Rev Biochem. 1996, 65, 475–502. [Google Scholar] [CrossRef]
- Weber PA, Chang H-C, Spaeth KE, Nitsche JM, Nicholson BJ. The permeability of gap junction channels to probes of different size is dependent on connexin composition and permeant-pore affinities. Biophys J. 2004, 87, 958–973. [Google Scholar] [CrossRef] [PubMed]
- Connors BW, Benardo LS, Prince DA. Coupling between neurons of the developing rat neocortex. J Neurosci. 1983, 3, 773–782. [Google Scholar] [CrossRef]
- White TW, Paul DL. Genetic diseases and gene knockouts reveal diverse connexin functions. Annu Rev Physiol. 1999, 61, 283–310. [Google Scholar] [CrossRef] [PubMed]
- Kelsell DP, Dunlop J, Stevens HP, Lench NJ, Liang JN, Parry G, Mueller RF, Leigh IM. Connexin 26 mutations in hereditary non-syndromic sensorineural deafness. Nature. 1997, 387, 80–83. [Google Scholar] [CrossRef] [PubMed]
- Zelante L, Gasparini P, Estivill X, Melchionda S, D’Agruma L, Govea N, Milá M, Monica MD, Lutfi J, Shohat M, Mansfield E, Delgrosso K, Rappaport E, Surrey S, Fortina P. Connexin26 mutations associated with the most common form of non-syndromic neurosensory autosomal recessive deafness (DFNB1) in Mediterraneans. Hum Mol Genet. 1997, 6, 1605–1609. [Google Scholar] [CrossRef]
- Estivill X, Fortina P, Surrey S, Rabionet R, Melchionda S, D’Agruma L, Mansfield E, Rappaport E, Govea N, Milà M, Zelante L, Gasparini P. Connexin-26 mutations in sporadic and inherited sensorineural deafness. Lancet. 1998, 351, 394–398. [Google Scholar] [CrossRef]
- Scholz D, Pöltl D, Genewsky A, Weng M, Waldmann T, Schildknecht S, Leist M. Rapid, complete and large-scale generation of post-mitotic neurons from the human LUHMES cell line. J Neurochem. 2011, 119, 957–971. [Google Scholar] [CrossRef]
- Zhang X-M, Yin M, Zhang M-H. Cell-based assays for Parkinson’s disease using differentiated human LUHMES cells. Acta Pharmacol Sin. 2014, 35, 945–956. [Google Scholar] [CrossRef]
- Prahl JD, Pierce SE, van der Schans EJC, Coetzee GA, Tyson T. The Parkinson’s disease variant rs356182 regulates neuronal differentiation independently from alpha-synuclein. Hum Mol Genet. 2023, 32, 1–14. [Google Scholar] [CrossRef]
- Harris G, Hogberg H, Hartung T, Smirnova L. 3D Differentiation of LUHMES Cell Line to Study Recovery and Delayed Neurotoxic Effects. Curr Protoc Toxicol. 2017, 73, 11. [Google Scholar]
- Witt B, Friese S, Walther V, Ebert F, Bornhorst J, Schwerdtle T. Cellular mechanisms of copper neurotoxicity in human, differentiated neurons. Arch Toxicol. 2025, 99, 689–699. [Google Scholar] [CrossRef]
- Tong ZB, Kim H, El Touny L, Simeonov A, Gerhold D. LUHMES Dopaminergic Neurons Are Uniquely Susceptible to Ferroptosis. Neurotox Res. 2022, 40, 1526–1536. [Google Scholar] [CrossRef]
- Tong ZB, Sakamuru S, Travers J, Xu T, Yang S, Xia M, Simeonov A, Huang R, Gerhold D. MT1G activation in dopaminergic neurons identifies chelators and their relationships to cytotoxicity. SLAS Discov. 2025, 35, 100244. [Google Scholar] [CrossRef]
- Harischandra DS, Rokad D, Neal ML, Ghaisas S, Manne S, Sarkar S, Panicker N, Zenitsky G, Jin H, Lewis M, Huang X, Anantharam V, Kanthasamy A, Kanthasamy AG. Manganese promotes the aggregation and prion-like cell-to-cell exosomal transmission of alpha-synuclein. Sci Signal. 2019, 12(572).
- Matelski L, Morgan RK, Grodzki AC, Van de Water J, Lein PJ. Effects of cytokines on nuclear factor-kappa B, cell viability, and synaptic connectivity in a human neuronal cell line. Mol Psychiatry. 2021, 26, 875–887. [Google Scholar] [CrossRef] [PubMed]
- Keighron CN, Avazzedeh S, Quinlan LR. Robust In Vitro Models for Studying Parkinson’s Disease? LUHMES Cells and SH-SH5Y Cells. Int J Mol Sci. 2024, 25(23).
- Loser D, Schaefer J, Danker T, Möller C, Brüll M, Suciu I, Ückert A-K, Klima S, Leist M, Kraushaar U. Human neuronal signaling and communication assays to assess functional neurotoxicity. Arch Toxicol. 2021, 95, 229–252. [Google Scholar] [CrossRef] [PubMed]
- Neuhof A, Tian Y, Reska A, Falkenburger BH, Grunder S. Large Acid-Evoked Currents, Mediated by ASIC1a, Accompany Differentiation in Human Dopaminergic Neurons. Front Cell Neurosci. 2021, 15, 668008. [Google Scholar] [CrossRef] [PubMed]
- Schildknecht S, Karreman C, Pöltl D, Efrémova L, Kullmann C, Gutbier S, Krug A, Scholz D, Gerding HR, Leist M. Generation of genetically-modified human differentiated cells for toxicological tests and the study of neurodegenerative diseases. ALTEX. 2013, 30, 427–444. [Google Scholar] [CrossRef]
- Krug AK, Balmer NV, Matt F, Schönenberger F, Merhof D, Leist M. Evaluation of a human neurite growth assay as specific screen for developmental neurotoxicants. Arch Toxicol. 2013, 87, 2215–2231. [Google Scholar] [CrossRef]
- Brüll M, Geese N, Celardo I, Laumann M, Leist M. Preparation of viable human neurites for neurobiological and neurodegeneration studies. Cells. 2024, 13(3).
- Hamill OP, Marty A, Neher E, Sakmann B, Sigworth FJ. Improved patch-clamp techniques for high-resolution current recording from cells and cell-free membrane patches. Pflugers Arch. 1981, 391, 85–100. [Google Scholar] [CrossRef]
- Rossum, Gv. Python tutorial, Technical Report CS-R9526, Centrum voor Wiskunde en Informatica (CWI), Amsterdam. 1995.
- Team, RC. R: A language and environment for statistical computing. R Foundation for Statistical Computing, Vienna, Austria. 2020.
- Li X, Cui D, Jiruska P, Fox JE, Yao X, Jefferys JGR. Synchronization measurement of multiple neuronal populations. J Neurophysiol. 2007, 98, 3341–3348. [Google Scholar] [CrossRef]
- McKinney, W. Data Structures for Statistical Computing in Python. Proceedings of the 9th Python in Science Conference. Proceedings of the Python in Science Conference: SciPy, 2010. p. 56–61.
- Harris CR, Millman KJ, van der Walt SJ, Gommers R, Virtanen P, Cournapeau D, Wieser E, Taylor J, Berg S, Smith NJ, Kern R, Picus M, Hoyer S, van Kerkwijk MH, Brett M, Haldane A, Del Río JF, Wiebe M, Peterson P, Gérard-Marchant P, Sheppard K, Reddy T, Weckesser W, Abbasi H, Gohlke C, Oliphant TE. Array programming with NumPy. Nature. 2020, 585, 357–362. [Google Scholar] [CrossRef] [PubMed]
- Hunter, JD. Matplotlib: A 2D Graphics Environment. Comput Sci Eng. 2007, 9, 90–95. [Google Scholar] [CrossRef]
- Waskom, M. seaborn: statistical data visualization. J Open Source Softw. 2021, 6, 3021. [Google Scholar] [CrossRef]
- Wichert S, Fokianos K, Strimmer K. Identifying periodically expressed transcripts in microarray time series data. Bioinformatics. 2004, 20, 5–20.
- Ahdesmaki M, Fokianos K, Strimmer K. CRAN: Contributed Packages2006.
- Ahdesmäki M, Lähdesmäki H, Gracey A, Shmulevich L, Yli-Harja O. Robust regression for periodicity detection in non-uniformly sampled time-course gene expression data. BMC bioinformatics. 2007, 8, 233. [Google Scholar]
- Ahdesmäki M, Lähdesmäki H, Pearson R, Huttunen H, Yli-Harja O. Robust detection of periodic time series measured from biological systems. BMC bioinformatics. 2005, 6, 117. [Google Scholar]
- Wickham H, editor. ggplot2, Elegant Graphics for Data Analysis: Springer-Verlag New York, 2016.
- Hadley Wickham RF, Lionel Henry, Kirill Müller. dplyr: A Grammar of Data Manipulation. 2022.
- Robinson D, Hayes A, Couch S. broom: Convert Statistical Objects into Tidy Tibbles. 2025.
- Ritz C, Baty F, Streibig JC, Gerhard D. Dose-Response Analysis Using R. PLoS One. 2015, 10, e0146021.
- Wilke, CO. CRAN: Contributed Packages2015.
- Murrell, P. The Grid Graphics Package. R J. 2013, 148–160. [Google Scholar] [CrossRef]
- Hothorn T, Bretz F, Westfall P. Simultaneous inference in general parametric models. Biom J. 2008, 50, 346–363. [Google Scholar] [CrossRef]
- Bache SM, Wickham H. magrittr: A Forward-Pipe Operator for R2022.
- Jim Lemon BB, Sander Oom, Eduardo Klein, Barry Rowlingson, Hadley Wickham, Anupam Tyagi, Olivier Eterradossi, Gabor Grothendieck, Michael Toews, John Kane, Rolf Turner, Carl Witthoft, Julian Stander, Thomas Petzoldt, Remko Duursma, Elisa Biancotto, Ofir Levy, Christophe Dutang, Peter Solymos, Robby Engelmann, Michael Hecker, Felix Steinbeck, Hans Borchers, Henrik Singmann, Ted Toal, Derek Ogle, Darshan Baral, Ulrike Groemping, Bill Venables, The CRAN Team, Duncan Murdoch. Plotrix: a package in the red light district of R. 6 ed2006.
- Pedersen, TL. patchwork: The Composer of Plots. 2025.
- Erik Clarke SS-M, Charlotte Dawson. ggbeeswarm: Categorical Scatter (Violin Point) Plots. 2023.
- Wickham H, Bryan J. readr: Read Rectangular Text Data. 2024.
- Wickham H, Bryan J. readxl: Read Excel Files. 2025.
- Ahlmann-Eltze C, Patil I. ggsignif: R Package for Displaying Significance Brackets for ‘ggplot2’2021.
- Hadley Wickham, LH. purrr: Functional Programming Tools. 2025.
- Lenaeus MJ, Vamvouka M, Focia PJ, Gross A. Structural basis of TEA blockade in a model potassium channel. Nat Struct Mol Biol. 2005, 12, 454–459. [Google Scholar] [CrossRef]
- Kirsch GE, Taglialatela M, Brown AM. Internal and external TEA block in single cloned K+ channels. Am J Physiol. 1991, 261(4 Pt 1):C583-590.
- Kutluay E, Roux B, Heginbotham L. Rapid intracellular TEA block of the KcsA potassium channel. Biophys J. 2005, 88, 1018–1029. [Google Scholar] [CrossRef]
- Armstrong, CM. Interaction of tetraethylammonium ion derivatives with the potassium channels of giant axons. J Gen Physiol. 1971, 58, 413–437. [Google Scholar] [CrossRef]
- Hartung, T. The validation of regulatory test methods—Conceptual, ethical, and philosophical foundations. ALTEX. 2024, 41, 525–544. [Google Scholar] [PubMed]
- Weiner AMJ, Irijalba I, Gallego MP, Ibarburu I, Sainz L, Goni-de-Cerio F, Quevedo C, Muriana A. Validation of a zebrafish developmental defects assay as a qualified alternative test for its regulatory use following the ICH S5(R3) guideline. Reprod Toxicol. 2024, 123, 108513. [Google Scholar] [CrossRef]
- van der Zalm AJ, Barroso J, Browne P, Casey W, Gordon J, Henry TR, Kleinstreuer NC, Lowit AB, Perron M, Clippinger AJ. A framework for establishing scientific confidence in new approach methodologies. Arch Toxicol. 2022, 96, 2865–2879. [Google Scholar] [CrossRef] [PubMed]
- Bal-Price A, Hogberg HT, Crofton KM, Daneshian M, FitzGerald RE, Fritsche E, Heinonen T, Hougaard Bennekou S, Klima S, Piersma AH, Sachana M, Shafer TJ, Terron A, Monnet-Tschudi F, Viviani B, Waldmann T, Westerink RHS, Wilks MF, Witters H, Zurich MG, Leist M. Recommendation on test readiness criteria for new approach methods in toxicology: Exemplified for developmental neurotoxicity. ALTEX. 2018, 35, 306–352. [Google Scholar]
- Hendriks G, Adriaens E, Allemang A, Clements J, Cole G, Derr R, Engel M, Hamel A, Kidd D, Kellum S, Kiyota T, Myhre A, Naessens V, Pfuhler S, Roy M, Settivari R, Schuler M, Zeller A, van Benthem J, Vanparys P, Kirkland D. Interlaboratory validation of the ToxTracker assay: An in vitro reporter assay for mechanistic genotoxicity assessment. Environ Mol Mutagen. 2024, 65, 4–24. [Google Scholar] [CrossRef]
- Bacci A, Verderio C, Pravettoni E, Matteoli M. Synaptic and intrinsic mechanisms shape synchronous oscillations in hippocampal neurons in culture. Eur J Neurosci. 1999, 11, 389–397. [Google Scholar] [CrossRef] [PubMed]
- Traub RD, Kopell N, Bibbig A, Buhl EH, LeBeau FE, Whittington MA. Gap junctions between interneuron dendrites can enhance synchrony of gamma oscillations in distributed networks. J Neurosci. 2001, 21, 9478–9486. [Google Scholar] [CrossRef]
- Tchumatchenko T, Clopath C. Oscillations emerging from noise-driven steady state in networks with electrical synapses and subthreshold resonance. Nat Commun. 2014, 5, 5512. [Google Scholar] [CrossRef] [PubMed]
- Galarreta M, Hestrin S. A network of fast-spiking cells in the neocortex connected by electrical synapses. Nature. 1999, 402, 72–75. [Google Scholar] [CrossRef] [PubMed]
- Iversen, LL. The chemistry of the brain. Sci Am. 1979, 241, 134–149. [Google Scholar] [CrossRef]
- Martin AO, Alonso G, Guerineau NC. Agrin mediates a rapid switch from electrical coupling to chemical neurotransmission during synaptogenesis. J Cell Biol. 2005, 169, 503–514. [Google Scholar] [CrossRef]
- Haydon PG, Carmignoto G. Astrocyte control of synaptic transmission and neurovascular coupling. Physiol Rev. 2006, 86, 1009–1031. [Google Scholar] [CrossRef]
- Kanno Y, Loewenstein WR. Low-resistance coupling between gland cells. Some observations on intercellular contact membranes and intercellular space. Nature. 1964, 201, 194–195. [Google Scholar] [CrossRef]
- Fischbach, GD. Synapse formation between dissociated nerve and muscle cells in low density cell cultures. Dev Biol. 1972, 28, 407–429. [Google Scholar] [CrossRef]
- Peinado A, Yuste R, Katz LC. Gap junctional communication and the development of local circuits in neocortex. Cereb Cortex. 1993, 3, 488–498. [Google Scholar] [CrossRef] [PubMed]
- Sanderson MJ, Charles AC, Boitano S, Dirksen ER. Mechanisms and function of intercellular calcium signaling. Mol Cell Endocrinol. 1994, 98, 173–187. [Google Scholar] [CrossRef] [PubMed]
- Giaume C, Venance L. Intercellular calcium signaling and gap junctional communication in astrocytes. Glia. 1998, 24, 50–64. [Google Scholar] [CrossRef]
- Spray DC, Dermietzel R. Gap Junctions in the Nervous System. Berlin, Heidelberg: Springer Berlin Heidelberg, 1996.
- Wang M, Chen JJ, Huang Q, Su X, Yu YC, Liu LY. Connexin43 in neonatal excitatory neurons is important for short-term motor learning. Brain Res. 2019, 1720, 146287. [Google Scholar] [CrossRef] [PubMed]
- Homkajorn B, Sims NR, Muyderman H. Connexin 43 regulates astrocytic migration and proliferation in response to injury. Neurosci Lett. 2010, 486, 197–201.
- Hughes SW, Blethyn KL, Cope DW, Crunelli V. Properties and origin of spikelets in thalamocortical neurones in vitro. Neuroscience. 2002, 110, 395–401. [Google Scholar] [CrossRef]
- Fuentealba P, Crochet S, Timofeev I, Bazhenov M, Sejnowski TJ, Steriade M. Experimental evidence and modeling studies support a synchronizing role for electrical coupling in the cat thalamic reticular neurons in vivo. Eur J Neurosci. 2004, 20, 111–119. [Google Scholar] [CrossRef]
- Michalikova M, Remme MWH, Schmitz D, Schreiber S, Kempter R. Spikelets in pyramidal neurons: generating mechanisms, distinguishing properties, and functional implications. Rev Neurosci. 2019, 31, 101–119. [Google Scholar] [CrossRef]
- Bennett MV, Zukin RS. Electrical coupling and neuronal synchronization in the Mammalian brain. Neuron. 2004, 41, 495–511. [Google Scholar] [CrossRef]
- Zhang X-L, Zhang L, Carlen PL. Electrotonic coupling between stratum oriens interneurones in the intact in vitro mouse juvenile hippocampus. J Physiol. 2004, 558(Pt 3):825–839.
- Mercer A, Bannister AP, Thomson AM. Electrical coupling between pyramidal cells in adult cortical regions. Brain Cell Biol. 2006, 35, 13–27. [Google Scholar]
- Brightman MW, Reese TS. Junctions between intimately apposed cell membranes in the vertebrate brain. J Cell Biol. 1969, 40, 648–677. [Google Scholar] [CrossRef]
- Giaume C, Naus CC, Sáez JC, Leybaert L. Glial Connexins and Pannexins in the Healthy and Diseased Brain. Physiol Rev. 2021, 101, 93–145. [Google Scholar] [CrossRef] [PubMed]
- Talukdar S, Emdad L, Das SK, Fisher PB. GAP junctions: multifaceted regulators of neuronal differentiation. Tissue barriers. 2022, 10, 1982349. [Google Scholar] [CrossRef] [PubMed]
- Stephan J, Eitelmann S, Zhou M. Approaches to Study Gap Junctional Coupling. Front Cell Neurosci. 2021, 15, 640406. [Google Scholar] [CrossRef]
- Giaume C, Fromaget C, el Aoumari A, Cordier J, Glowinski J, Gros D. Gap junctions in cultured astrocytes: single-channel currents and characterization of channel-forming protein. Neuron. 1991, 6, 133–143. [Google Scholar] [CrossRef] [PubMed]
- Nadarajah B, Jones AM, Evans WH, Parnavelas JG. Differential expression of connexins during neocortical development and neuronal circuit formation. J Neurosci. 1997, 17, 3096–3111. [Google Scholar] [CrossRef]
- Pina-Benabou MHd, Szostak V, Kyrozis A, Rempe D, Uziel D, Urban-Maldonado M, Benabou S, Spray DC, Federoff HJ, Stanton PK, Rozental R. Blockade of gap junctions in vivo provides neuroprotection after perinatal global ischemia. Stroke. 2005, 36, 2232–2237. [Google Scholar] [CrossRef]
- Enkvist MO, McCarthy KD. Astroglial gap junction communication is increased by treatment with either glutamate or high K+ concentration. J Neurochem. 1994, 62, 489–495. [Google Scholar] [CrossRef]
- Rose B, Loewenstein WR. Permeability of cell junction depends on local cytoplasmic calcium activity. Nature. 1975, 254, 250–252. [Google Scholar] [CrossRef]
- Xu Q, Kopp RF, Chen Y, Yang JJ, Roe MW, Veenstra RD. Gating of connexin 43 gap junctions by a cytoplasmic loop calmodulin binding domain. Am J Physiol Cell Physiol. 2012, 302, C1548–1556. [Google Scholar] [CrossRef]
- Bertram R, Sherman A, Satin LS. Metabolic and electrical oscillations: partners in controlling pulsatile insulin secretion. Am J Physiol Endocrinol Metab. 2007, 293, E890–900. [Google Scholar] [CrossRef]
- Magnus G, Keizer J. Minimal model of beta-cell mitochondrial Ca2+ handling. Am J Physiol. 1997, 273(2 Pt 1):C717-733.
- Owens DF, Kriegstein AR. Patterns of intracellular calcium fluctuation in precursor cells of the neocortical ventricular zone. J Neurosci. 1998, 18, 5374–5388. [Google Scholar] [CrossRef] [PubMed]
- Celardo I, Aschner M, Ashton RS, Carstens KE, Cediel-Ulloa A, Collen E, Crofton KM, Debad SJ, Dreser N, Fitzpatrick S, Fritsche E, Gutsfeld S, Hardy B, Hartung T, Hessel E, Heusinkveld H, Hogberg HT, Hsieh JH, Kanda Y, Knight GT, Knudsen T, Koch K, Kuchovska E, Mangas I, Marty MS, Melching-Kollmuss S, Muller I, Muller P, Myhre O, Paparella M, Pitzer E, Bal-Price A, Sachana M, Schluppmann K, Shafer TJ, Schafer J, Smirnova L, Tal T, Tanaskov Y, Tangianu S, Testa G, Uckert AK, Whelan M, Leist M. Developmental neurotoxicity (DNT): A call for implementation of new approach methodologies for regulatory purposes: Summary of the 5th International Conference on DNT Testing. ALTEX. 2025, 42, 323–349. [Google Scholar]
- Collen E, Bartmann K, Blum J, Carstens K, Celardo I, Chatterjee N, Corvaro M, Dreser N, Fritsche E, Hartung T, Hogberg HT, Knudsen T, Koch K, Kreutz A, Lislien M, Magel V, Marty MS, Pallocca G, Bal-Price A, Rovida C, Sachana M, Shafer TJ, Smirnova L, Suciu I, Tanaskov Y, Tangianu S, Wolfbeisz C, Leist M. Mapping out strategies to further develop human-relevant, new approach methodology (NAM)-based developmental neurotoxicity (DNT) testing. ALTEX. 2025, 42, 308–322. [Google Scholar]
- Grandjean P, Landrigan PJ. Developmental neurotoxicity of industrial chemicals. Lancet. 2006, 368, 2167–2178. [Google Scholar] [CrossRef] [PubMed]
- Smyth JW, Guo S, Chaunsali L, O’Rourke L, Dahlka J, Deaver S, Lunski M, Nurmemmedov E, Sontheimer H, Sheng Z, Gourdie RG, Lamouille S. Cytoplasmic connexin43-microtubule interactions promote glioblastoma stem-like cell maintenance and tumorigenicity. Cell Death Dis. 2025, 16, 388. [Google Scholar] [CrossRef] [PubMed]
- Bonacquisti EE, Nguyen J. Connexin 43 (Cx43) in cancer: Implications for therapeutic approaches via gap junctions. Cancer Lett. 2019, 442, 439–444.
- Oguro K, Jover T, Tanaka H, Lin Y, Kojima T, Oguro N, Grooms SY, Bennett MV, Zukin RS. Global ischemia-induced increases in the gap junctional proteins connexin 32 (Cx32) and Cx36 in hippocampus and enhanced vulnerability of Cx32 knock-out mice. J Neurosci. 2001, 21, 7534–7542. [Google Scholar] [CrossRef]
- Wang Y, Song J-H, Denisova JV, Park W-M, Fontes JD, Belousov AB. Neuronal gap junction coupling is regulated by glutamate and plays critical role in cell death during neuronal injury. J Neurosci. 2012, 32, 713–725. [Google Scholar] [CrossRef]
- Frantseva MV, Kokarovtseva L, Naus CG, Carlen PL, MacFabe D, Perez Velazquez JL. Specific gap junctions enhance the neuronal vulnerability to brain traumatic injury. J Neurosci. 2002, 22, 644–653. [Google Scholar] [CrossRef] [PubMed]
- Reaume AG, Sousa PAd, Kulkarni S, Langille BL, Zhu D, Davies TC, Juneja SC, Kidder GM, Rossant J. Cardiac malformation in neonatal mice lacking connexin43. Science. 1995, 267, 1831–1834. [Google Scholar] [CrossRef]
- Pérez-Atencio LF, Casarrubios AM, Ibarz JM, Barios JA, Medrano C, Pestaña D, Paul DL, Barrio LC. Respiratory disturbances and high risk of sudden death in the neonatal connexin-36 knockout mouse. Physiol Rep. 2021, 9, e15109. [Google Scholar]
- King TJ, Lampe PD. Mice deficient for the gap junction protein Connexin32 exhibit increased radiation-induced tumorigenesis associated with elevated mitogen-activated protein kinase (p44/Erk1, p42/Erk2) activation. Carcinogenesis. 2004, 25, 669–680. [Google Scholar] [CrossRef]
- Ouvrier R, Geevasingha N, Ryan MM. Autosomal-recessive and X-linked forms of hereditary motor and sensory neuropathy in childhood. Muscle Nerve. 2007, 36, 131–143.
- Abrams C, Oh S, Ri Y, Bargiello T. Mutations in Connexin32, The molecular and biophysical bases for the X-linked form of Charcot-Marie-Tooth disease. J Peripher Nerv Syst. 2000, 5, 246–247. [Google Scholar] [CrossRef]
- Zwart-Storm EAd, Martin PE, van Steensel Ma. Gap junction diseases of the skin: novel insights from new mutations. Expert Rev Dermatol. 2009, 4, 455–468.
- Lilly E, Sellitto C, Milstone LM, White TW. Connexin channels in congenital skin disorders. Semin Cell Dev Biol. 2016, 50, 4–12. [Google Scholar] [CrossRef] [PubMed]
- Ponnam SPG, Ramesha K, Tejwani S, Ramamurthy B, Kannabiran C. Mutation of the gap junction protein alpha 8 (GJA8) gene causes autosomal recessive cataract. J Med Genet. 2007, 44, e85. [Google Scholar] [CrossRef]
- Szarka G, Balogh M, Tengölics ÁJ, Ganczer A, Völgyi B, Kovács-Öller T. The role of gap junctions in cell death and neuromodulation in the retina. Neural Regen Res. 2021, 16, 1911–1920. [Google Scholar] [CrossRef]
Figure 1.
Triggering synchronized Ca2+ oscillations in conventional (2D) cultures of LUHMES neurons at network level. LUHMES cells were plated in 384-well plates and differentiated for a total time of nine days (d9 cultures). The differentiation medium was exchanged for oscillation medium and cells were loaded with a Ca2+ indicator dye. Compounds were added by a robotic device. The total fluorescence of the entire well area was recorded (simultaneously for all 384 wells) continuously over time (one data point per well per time point). A Schematic representation of the recording protocol: (a) A two-minute baseline was recorded prior to the addition of TEA (20 mM). (b,c) In compound screening experiments, test substances (or solvent controls) were added (c) five minutes after TEA. B Exemplary fluorescence trace (time on x-axis), showing a stable baseline, followed by robust oscillations induced by TEA. C A fast fourier transformation (FFT) was performed on recordings from five independent experiments (Diff1-5) to analyze the oscillation frequency distribution. The FFT for each experiment shows the average of 4 wells per experiment (n=20).
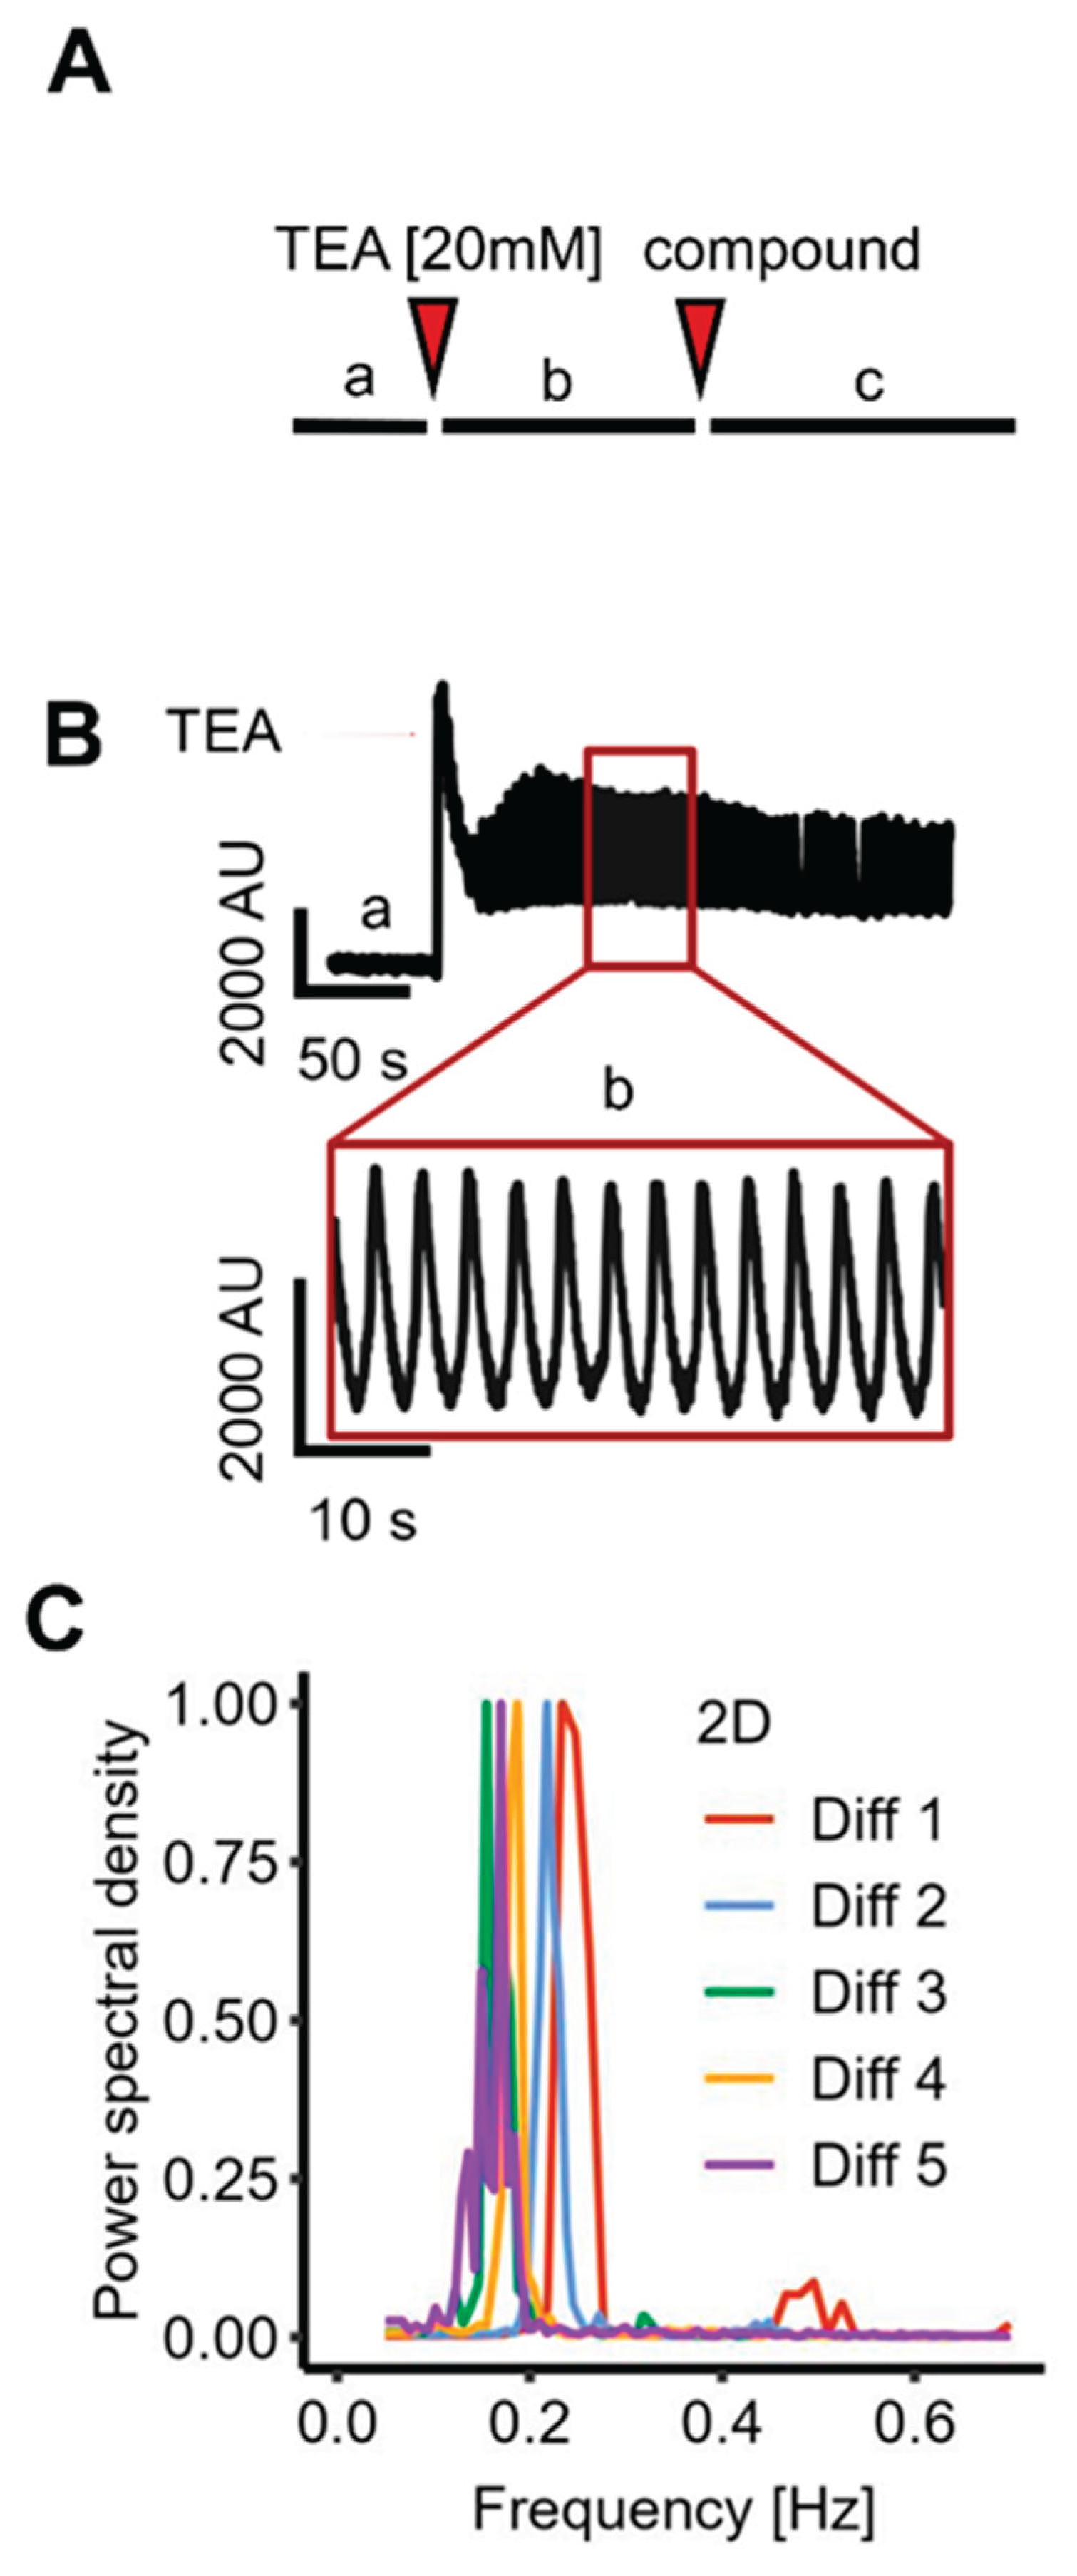
Figure 2.
Assessment of synchronized Ca2+ oscillation in 2D-cultured LUHMES at single cell level. Cells were treated as in Figure 1 (no test compound addition). A shows a fluorescence trace of an entire well with synchronized oscillatory activity. B Superimposed fluorescence traces from ten randomly selected regions of interest (ROIs). C Representative image of a 2D culture. The marked ROIs correspond to the ten cells shown in panel B. D The ten selected ROIs from panel C were used to generate a correlation matrix representing pairwise activity comparisons. This matrix served as the basis for calculating the global synchronization index (GSI), which yielded a value of 0.84 ± 0.02 for the 2D cultures, when it was calculated from nine different experiments.
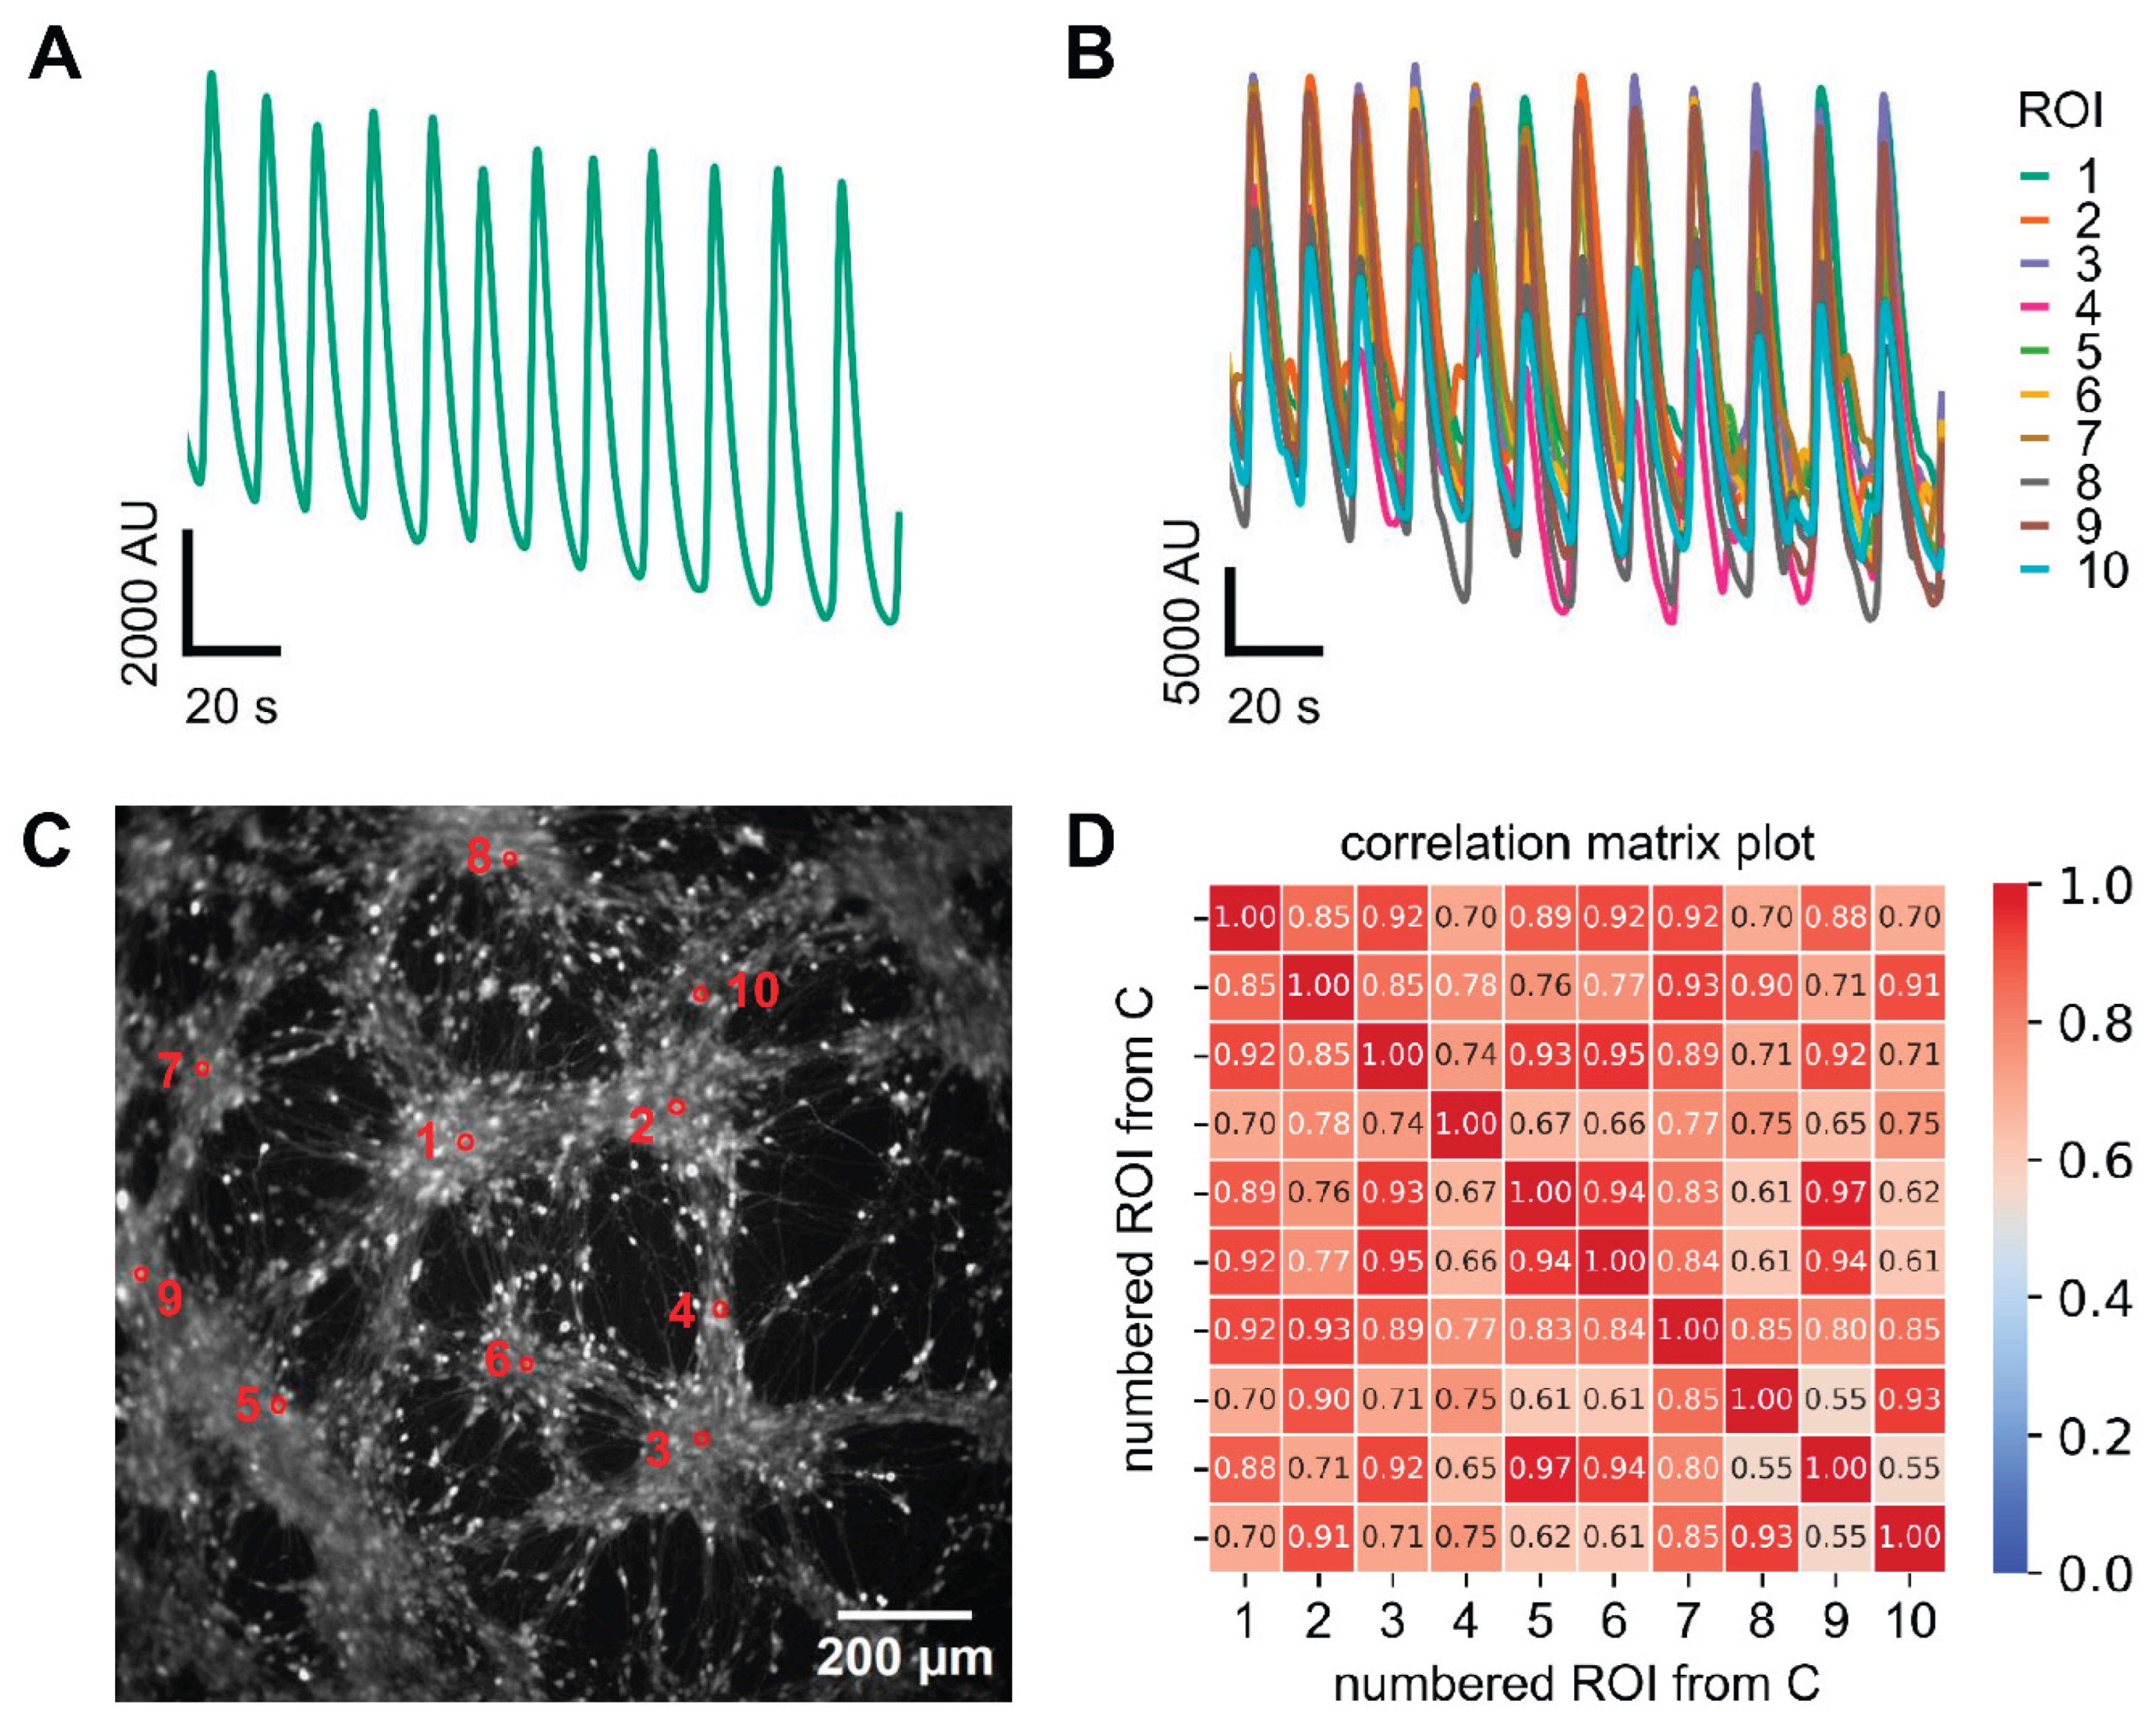
Figure 3.
Assessment of synchronized Ca2+-oscillations in a 3D LUHMES spheroid model. LUHMES cells were grown as floating spheroids and then plated into imaging wells. Experiments were started and data were recorded 48 h later. A Representative image of a spheroid stained with 2 µM of the calcium indicator dye Cal-520. Ten randomly selected ROIs that were used for analysis are highlighted. B The ten selected ROIs from panel A were used to generate a correlation matrix representing pairwise activity comparisons. This matrix served as the basis for calculating the GSI. C Fluorescence trace based on data from whole-well imaging (i.e., recording fluorescence from the entire spheroid). D Superimposed fluorescence traces from ten randomly selected ROIs within the spheroid. E A fast fourier transform (FFT) was performed on recordings from four wells per differentiation stage across five independent experiments to determine oscillation frequency (n=20). The FFT for each experiment shows the average of the 4 wells per experiment. F The 3D spheroids exhibited a mean oscillation frequency of 0.200 ± 0.004 Hz (n=20), comparable to that of 2D cultures (0.200 ± 0.007 Hz, n=20). The difference was not statistically significant (Welch two sample t-Test: t = -0.0062, p = 0.9951; Wilcoxon rank sum test: p= 0.7045). G The GSI was 0.89 ± 0.02 for 3D spheroids (n=9, mean ± SEM) and thus did not differ from 2D cultures (see Figure 2). The difference was not statistically significant, (Welch two sample t-Test: t = -1.8937, p = 0.0783; Wilcoxon rank sum test: p= 0.1443).
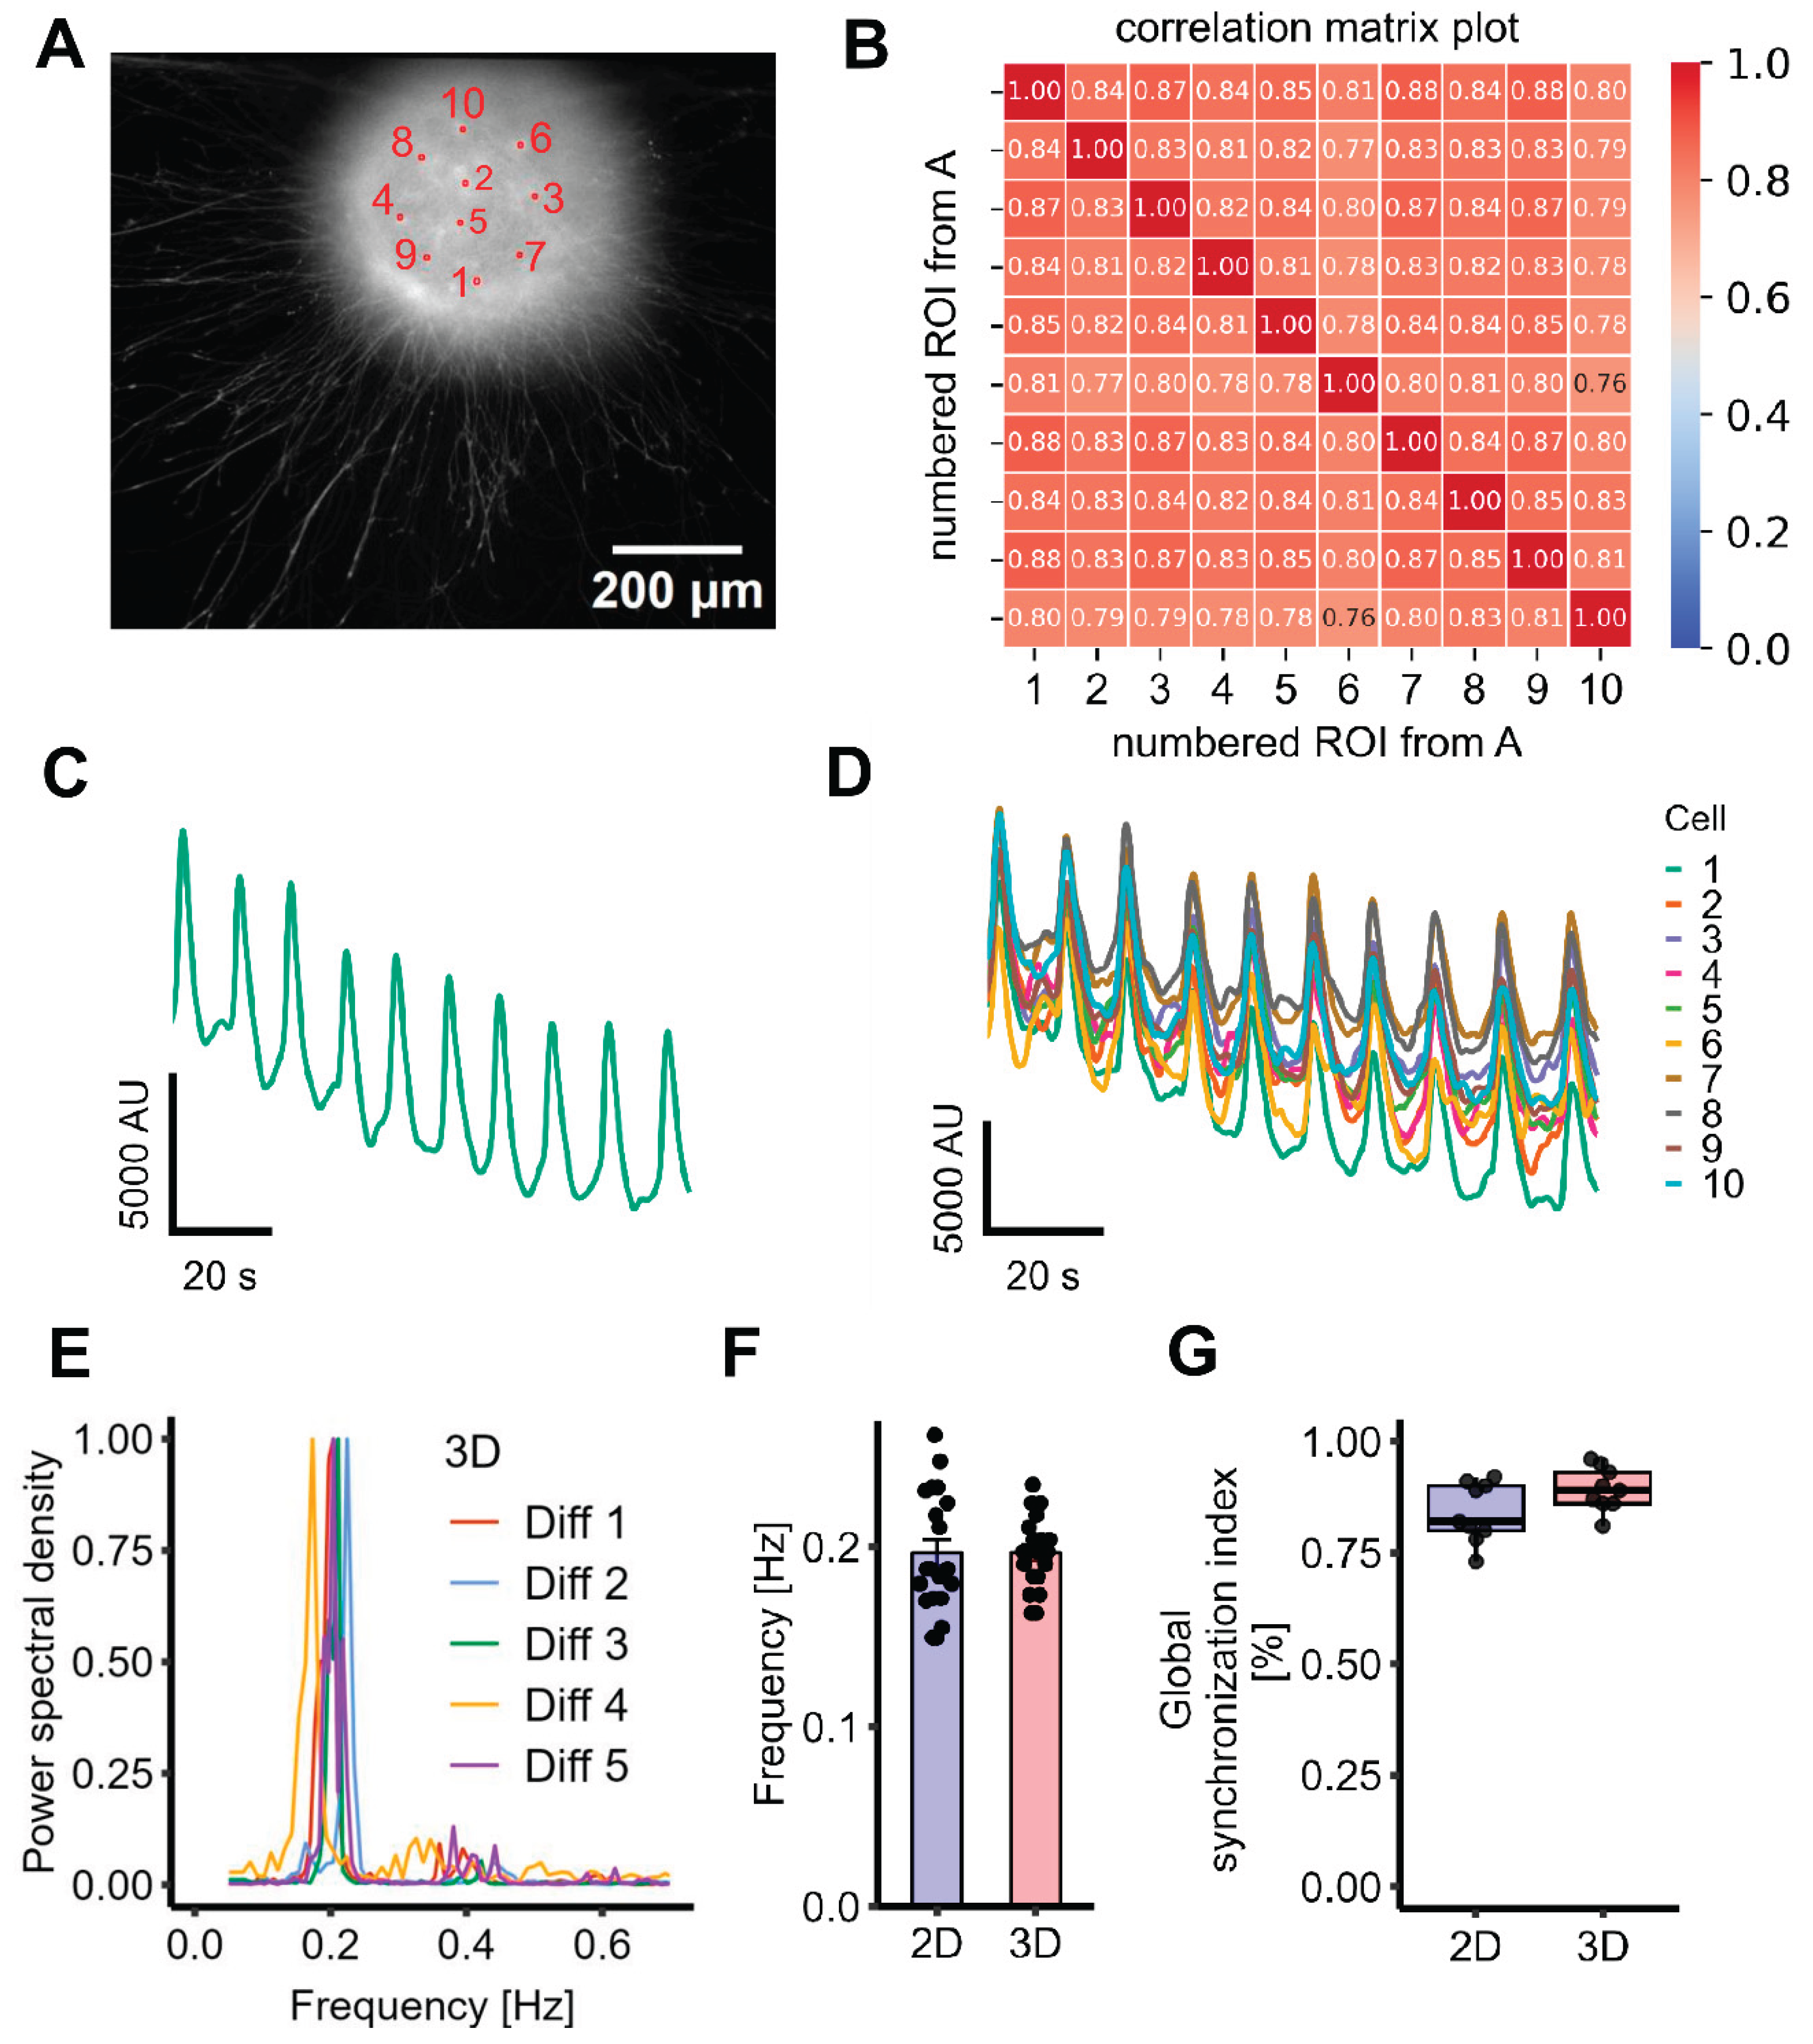
Figure 4.
Inter-laboratory transferability of the assay for coordinated Ca2+ oscillations in neuronal cultures. LUHMES cells were prepared for recording as in Figure 1&3. A Representative fluorescent image (Cal520 indicator) of a 2D neuronal cell culture, taken at the peak of an oscillation. Ten regions of interest (ROIs), at distances up to 900 µm are shown. Note that some ROIs are within the magnified insert and represent single cells. B Fluorescence trace of the entire field of view (FOV), as indicated in A. C Superimposed fluorescence traces from ten randomly selected ROIs within the FOV shown in A,B. D Middle image: Representative image of a 3D neuronal cell culture at the peak of an oscillation. A magnification is shown to the left. Right image: magnification of the spheroid’s neurite area E Fluorescence trace of the entire spheroid. F Fluorescence trace of the neurites in the selected field (on the right side of A), showing synchronized oscillatory activity. G Comparison of the mean frequency between 2D (0.19 ± 0.022 Hz) and 3D (0.22 ± 0.016 Hz) neuronal cultures. There was no significant difference. H Comparison of the global synchronization index (GSI) of untreated 2D LUHMES cells (control; GSI = 0.82 ± 0.018 %) and Carbenoxelone (CBX; 100 µM)-treated cells (GSI = 0.11 ± 0.012 %). The representative correlation matrix plots are shown in Suppl. Figure 4.
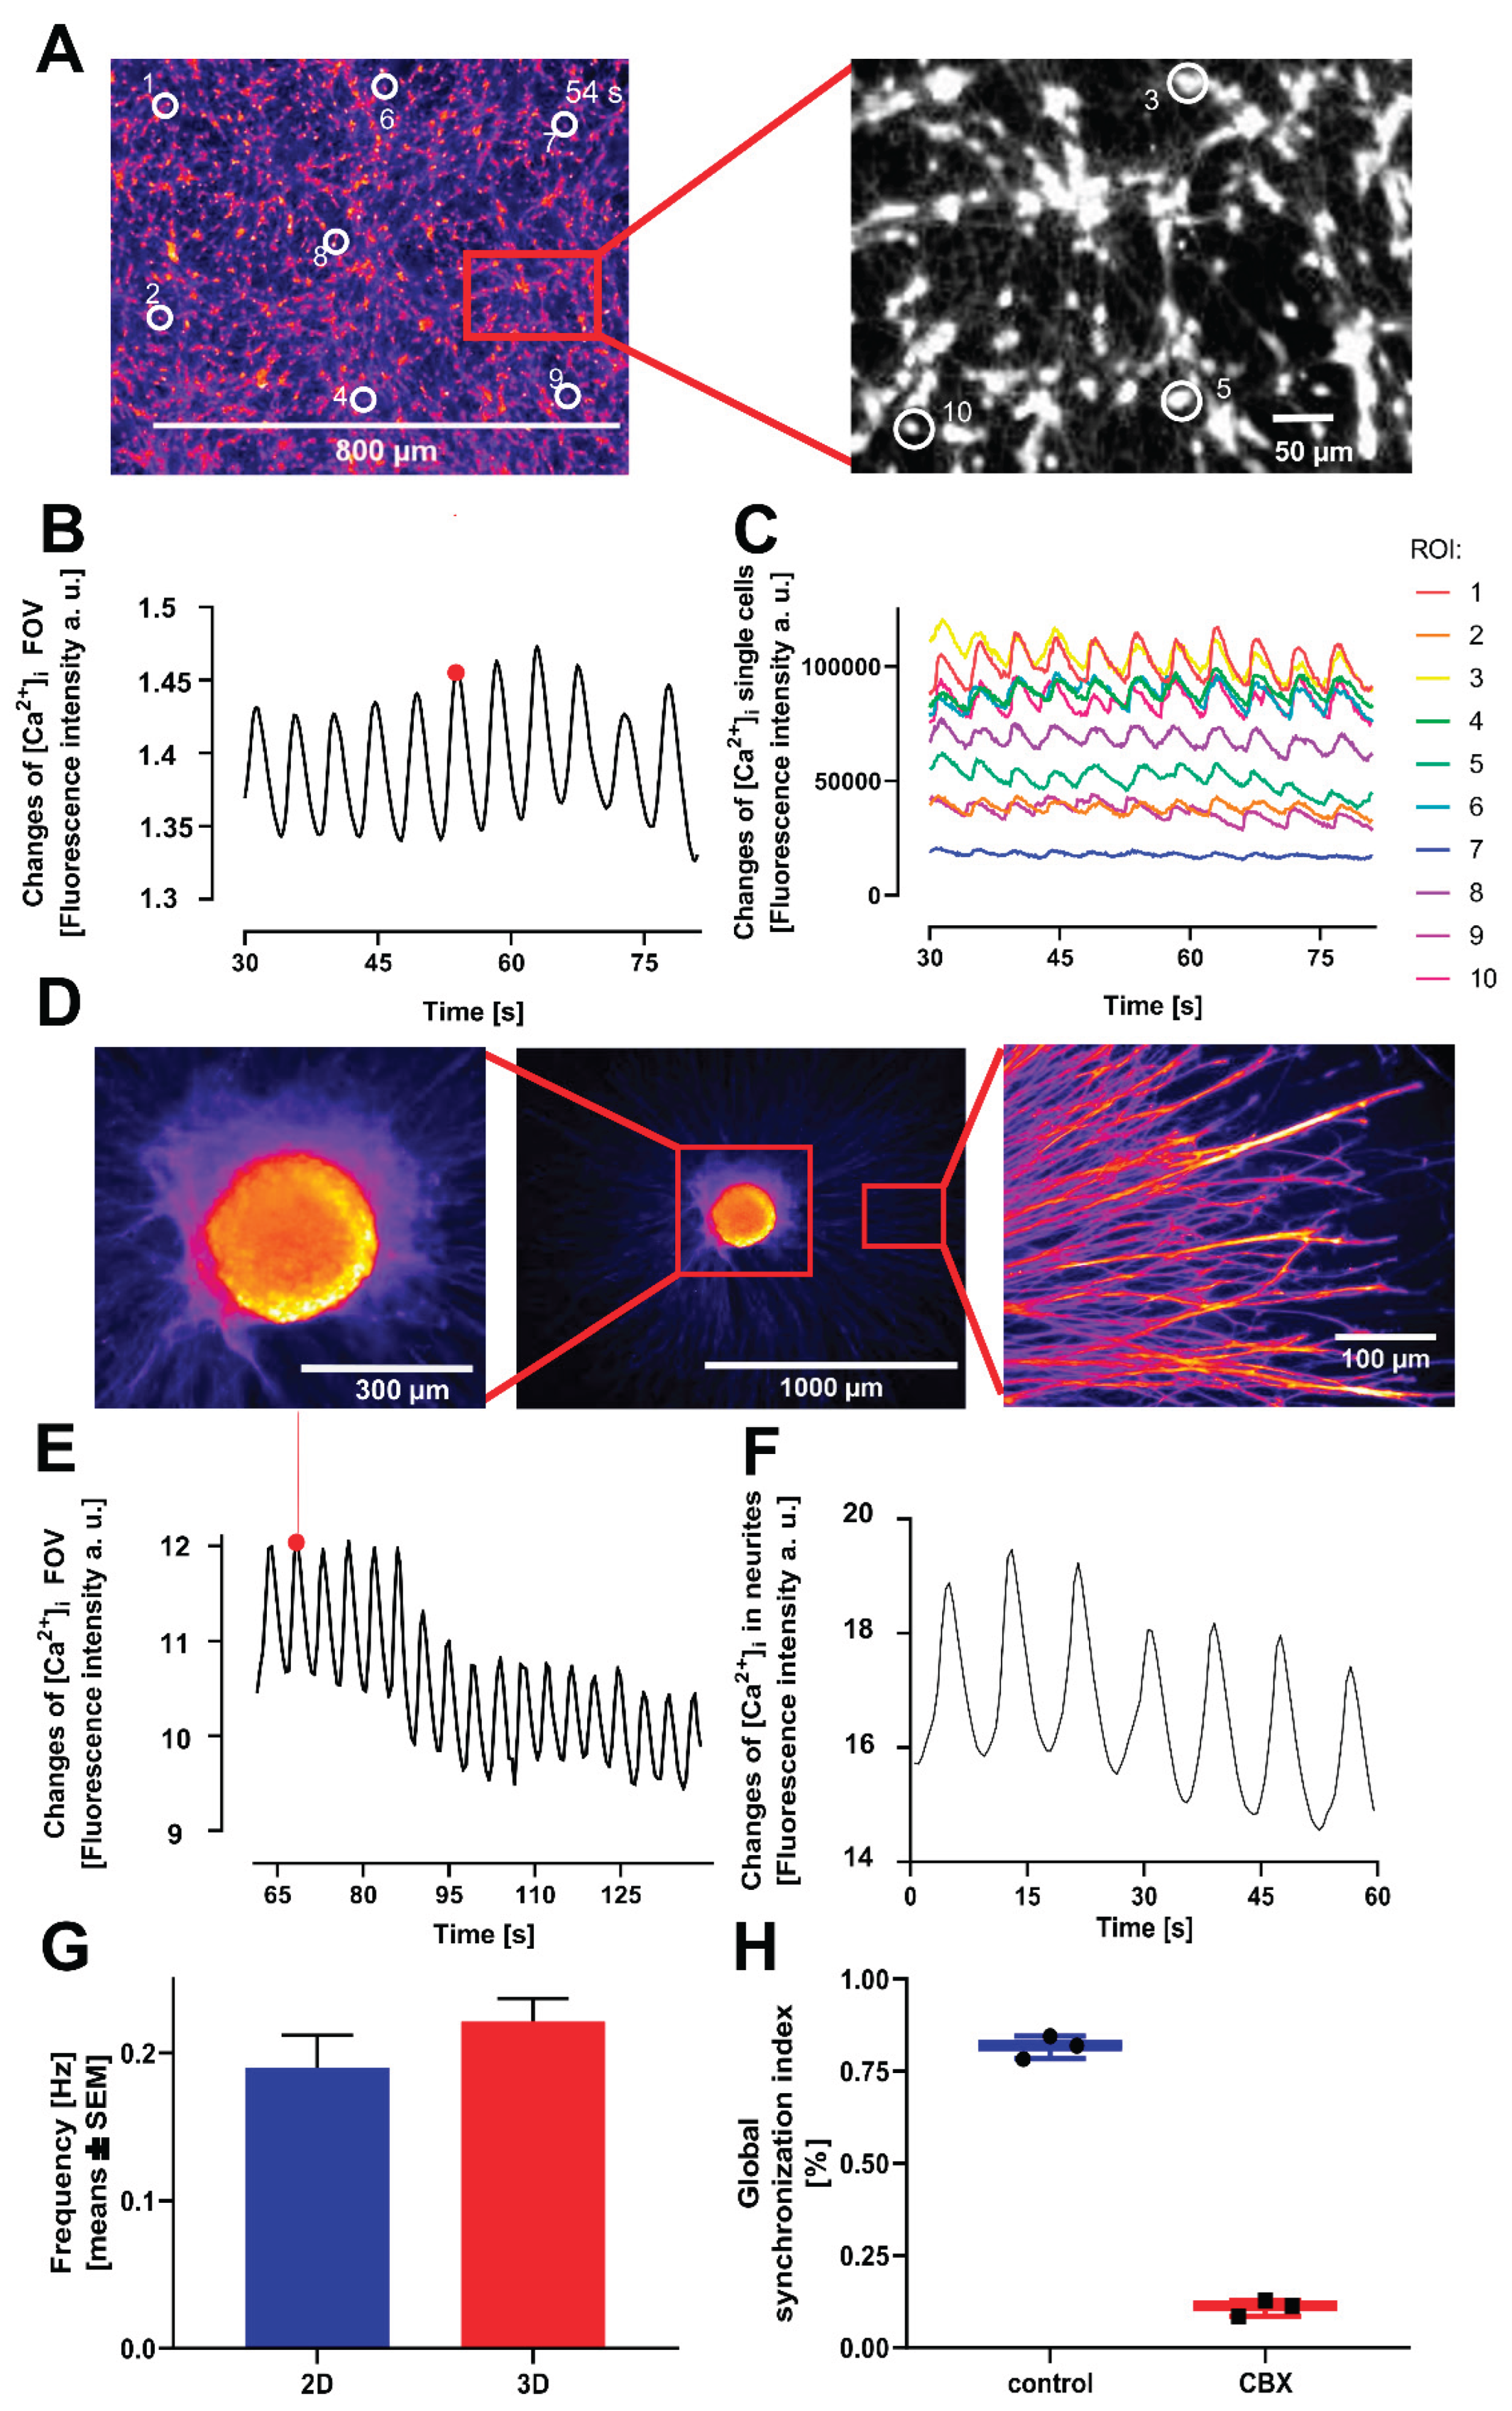
Figure 5.
Mechanistic investigation of oscillatory activity using known synaptic modulators. Cells were prepared for the experiments as in Figure 1. A CNQX, an AMPA receptor antagonist, did not alter the oscillation frequency. B Pharmacological inhibition of the glutamatergic system was performed using CNQX (0.190 ± 0.008 Hz, mean ± SEM, n=3) and DL-AP5 (NMDA receptor blocker, 0.180 ± 0.002 Hz, n=3). Additionally, glutamate was exogenously applied (oscillation frequency: 0.200 ± 0.006, mean ± SEM, n=3). C The role of the GABAergic system was examined by applying picrotoxin (GABAA receptor antagonist, 0.190 ± 0.006 Hz, mean ± SEM, n=3) and phaclofen (GABAB receptor antagonist, 0.190 ± 0.009 Hz, mean ± SEM, n=3). Additionally, GABA was added (oscillation frequency: 0.220 ± 0.007 Hz, mean ± SEM, n=3). None of the treatments had a significant effect on the oscillation frequency.
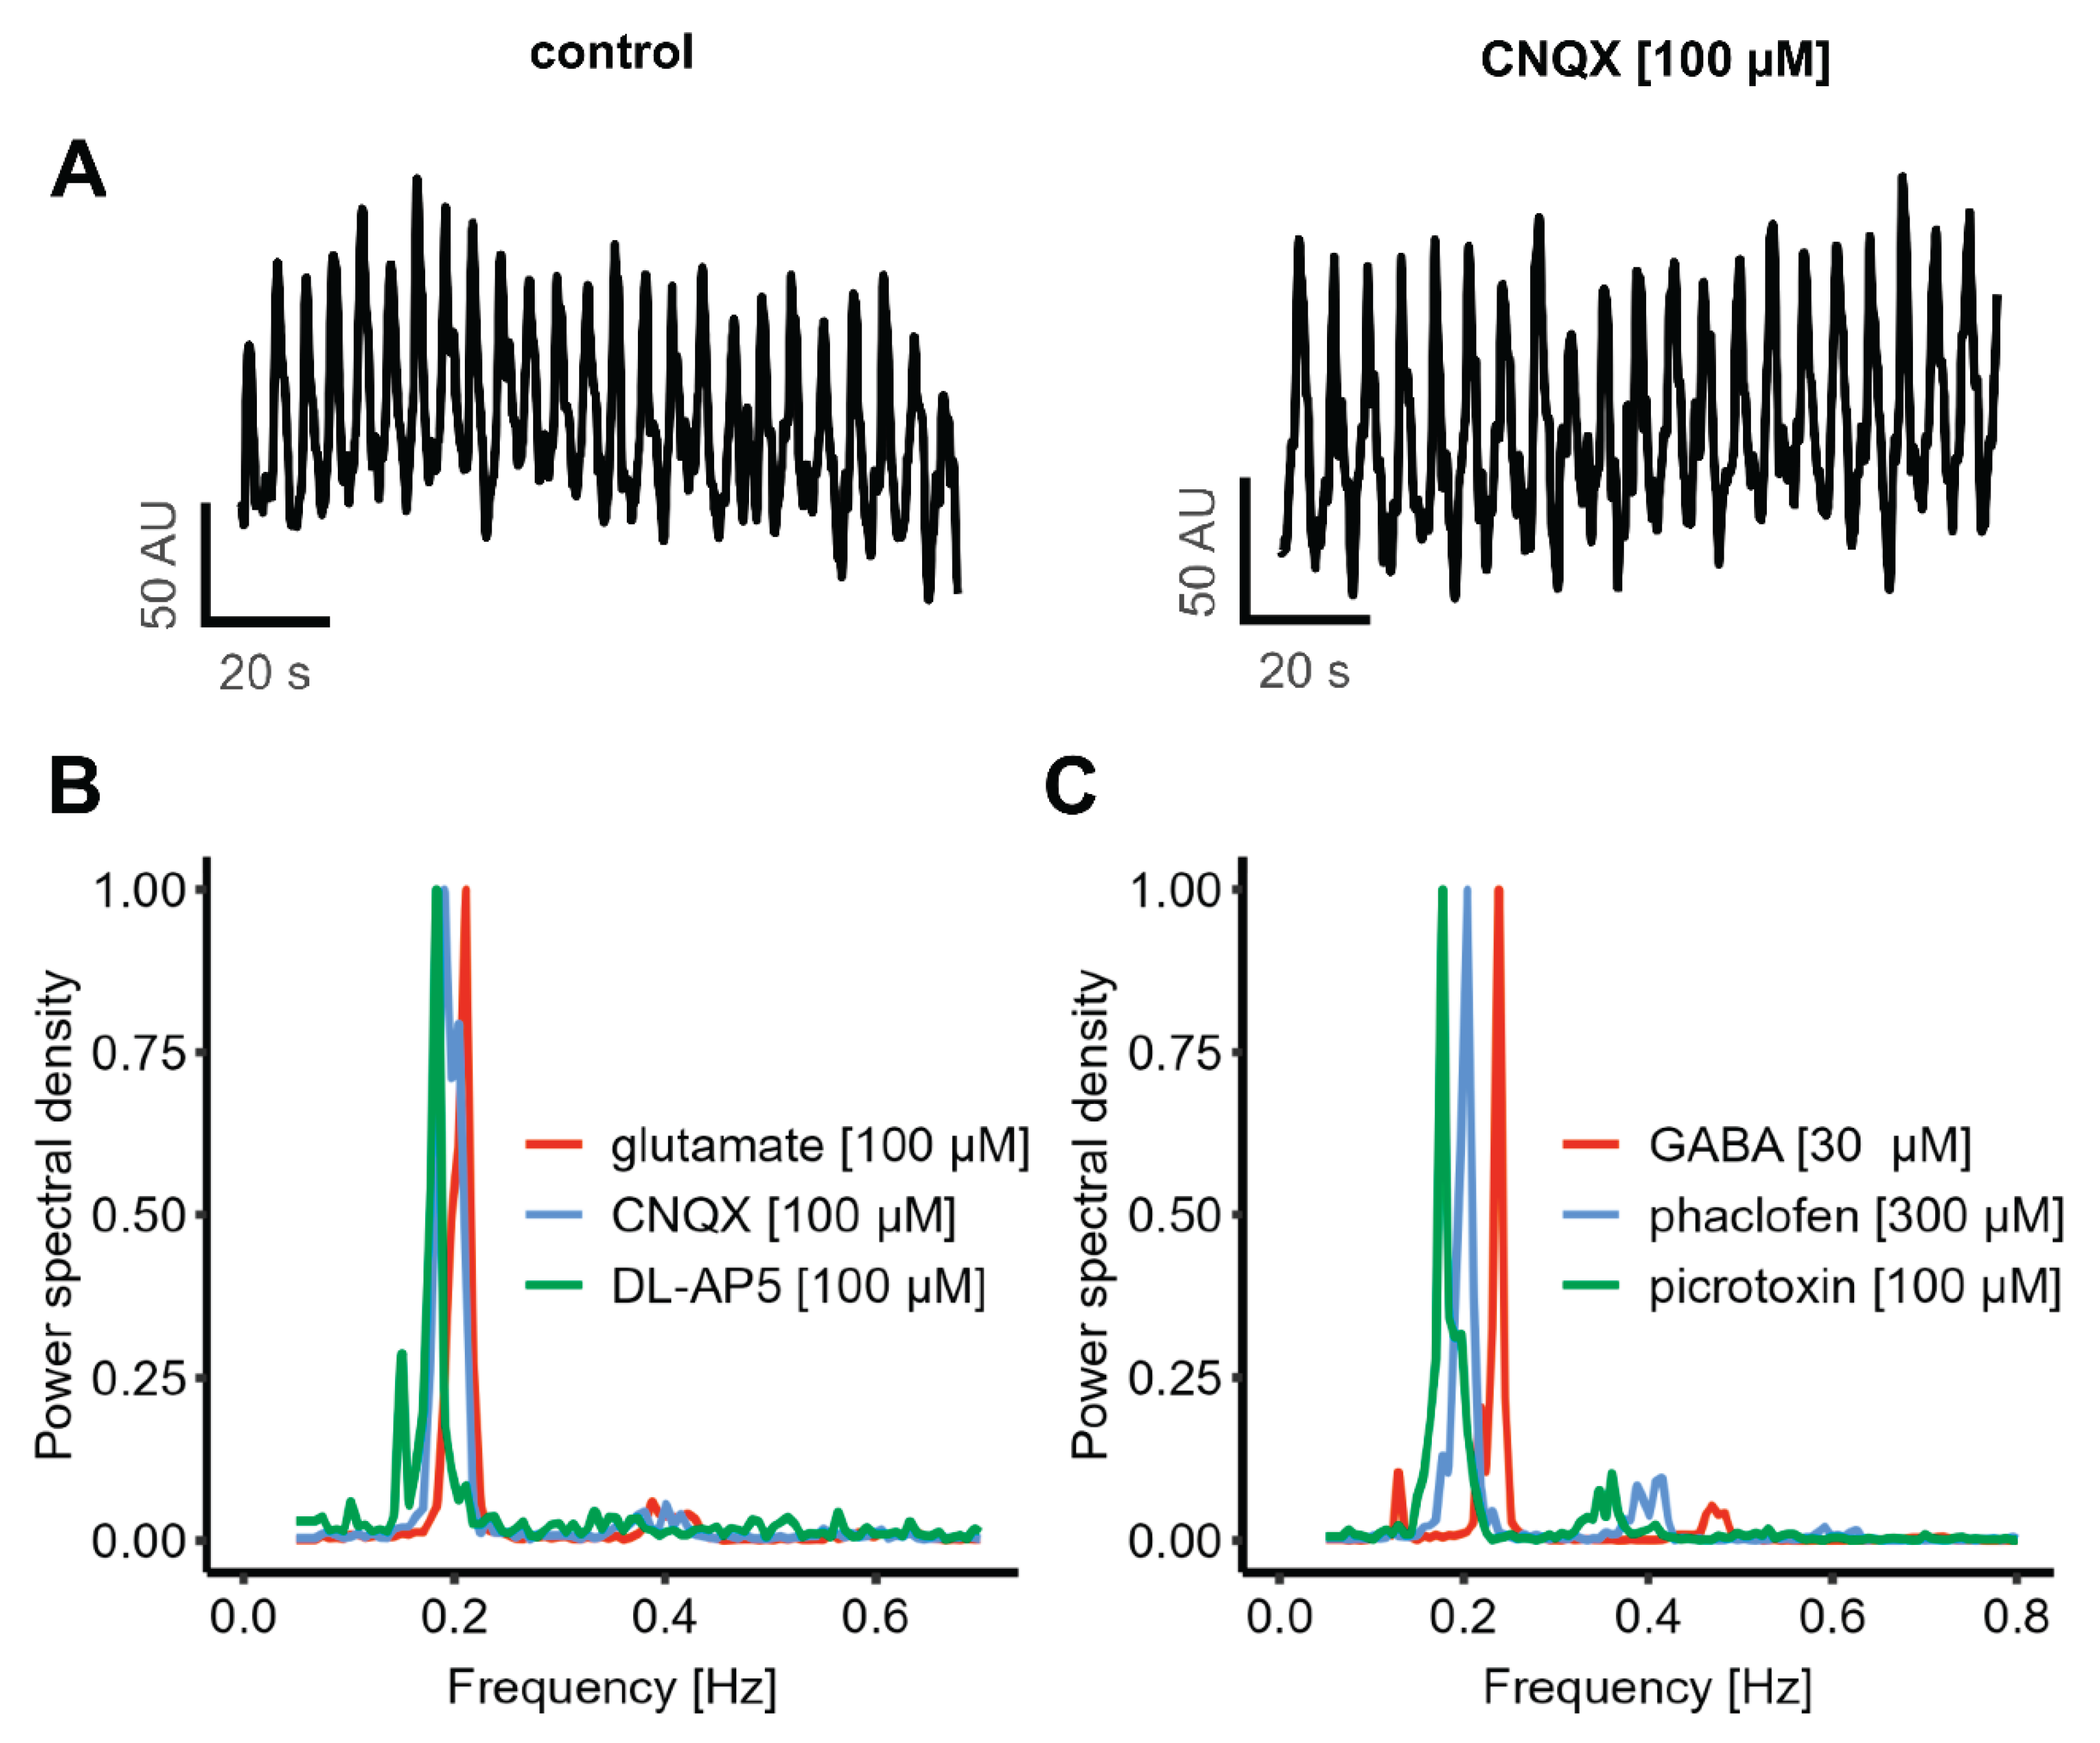
Figure 6.
Characterization of gap junctions in LUHMES cells. Cells were prepared for the experiments as in Figure 1. A-C The inhibition of gap junctions was performed with carbenoxolone (CBX) and octanol. Representative oscillation traces are shown. D FFT of the fluorescence signal following CBX (n=4) and Octanol (n=4) treatment: no clear frequency peaks were detectable. E The expression level of genes coding for gap junction proteins was quantified by TempOSeq analysis. Data are presented in form of a heat map for different differentiation days of LUHMES (x-axis). Gap junction (GJ) gene GJA1 (encoding connexin 43) is shown in the top line. Pink to red colors indicate expression levels of 4-16 counts per million reads (log2-scaled coding). The expression pattern for GJC1 and GJC2 was similar in that it was highest in immature cells and then declined slowly (the full original data set is found in the supplementary information).
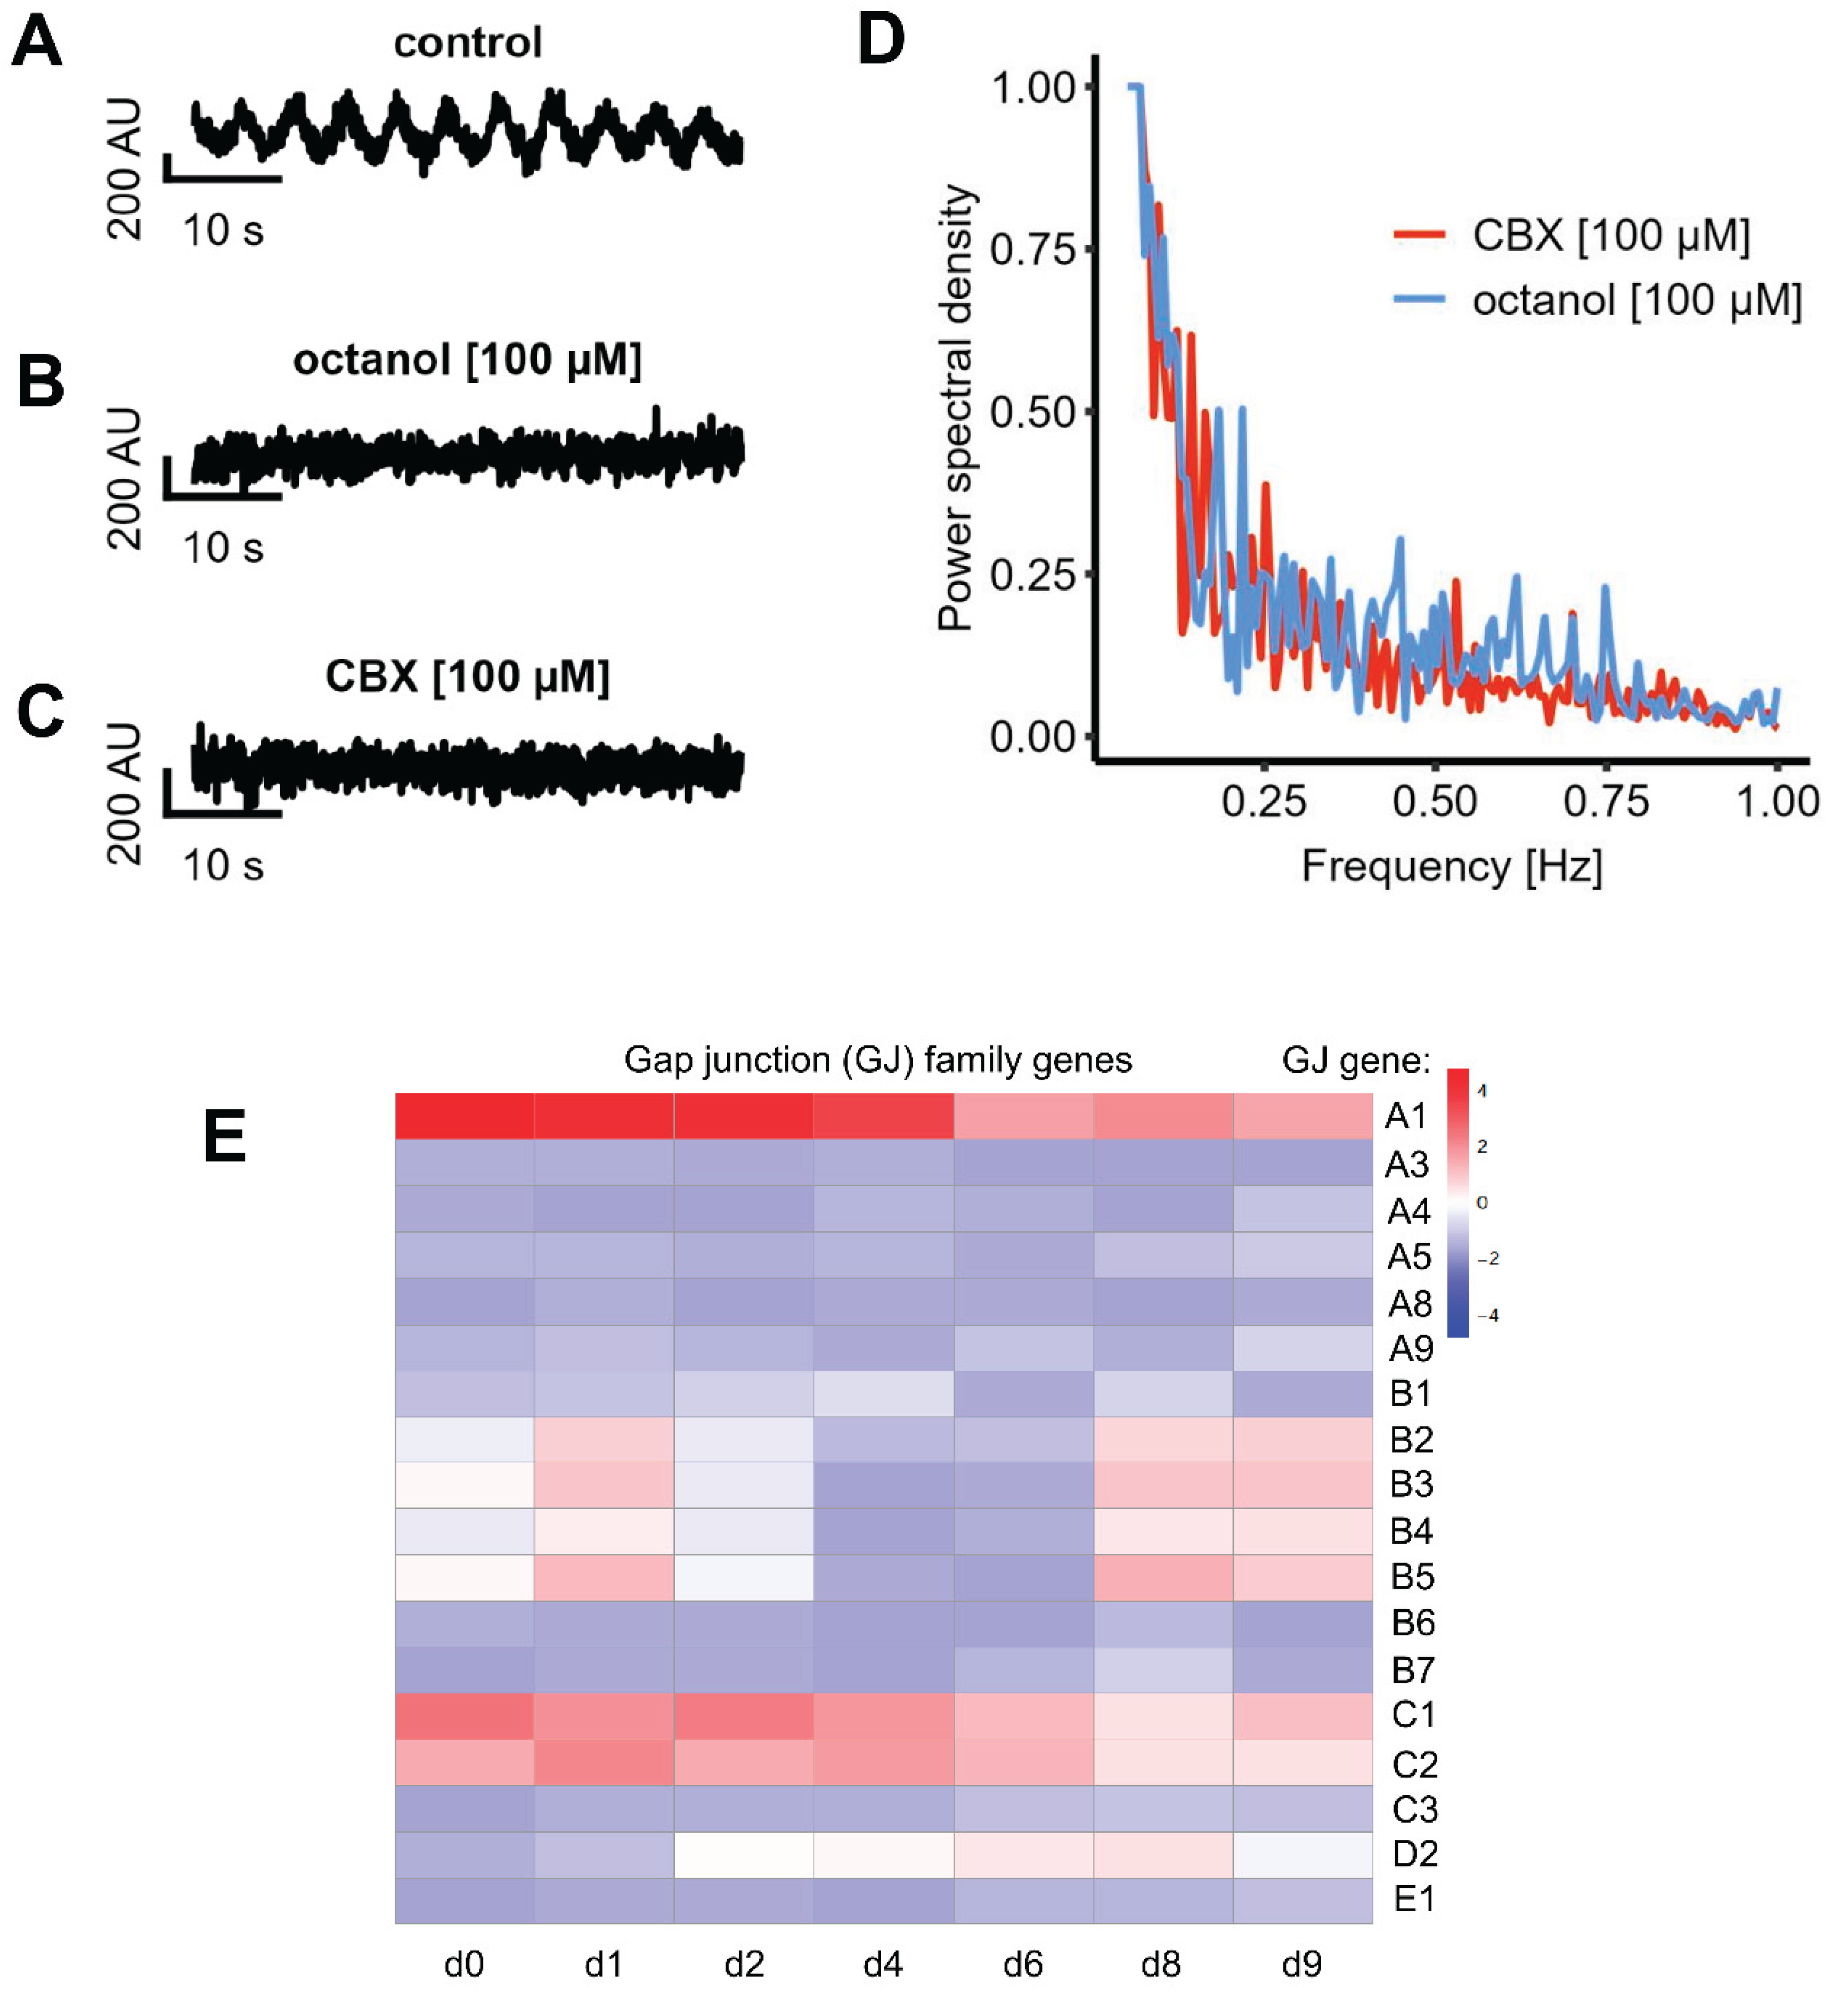
Figure 7.
Dye transfer experiments using patch-clamp to demonstrate functional gap junction coupling in LUHMES cells. Alexa-488 was used to assess intercellular dye transfer at two various differentiation stages. A At d4, the dye diffused to more than ten neighboring cells under control conditions (n=6), indicating robust gap junction connectivity. Following application of the gap junction blocker 18β-GA, dye transfer was either completely inhibited or limited to a single adjacent cell (n=6). B At d9, under control conditions, dye spread was restricted to only one or two neighboring cells (n=6). In the presence of 18β-GA, the dye remained confined to the patched cell (n=6).
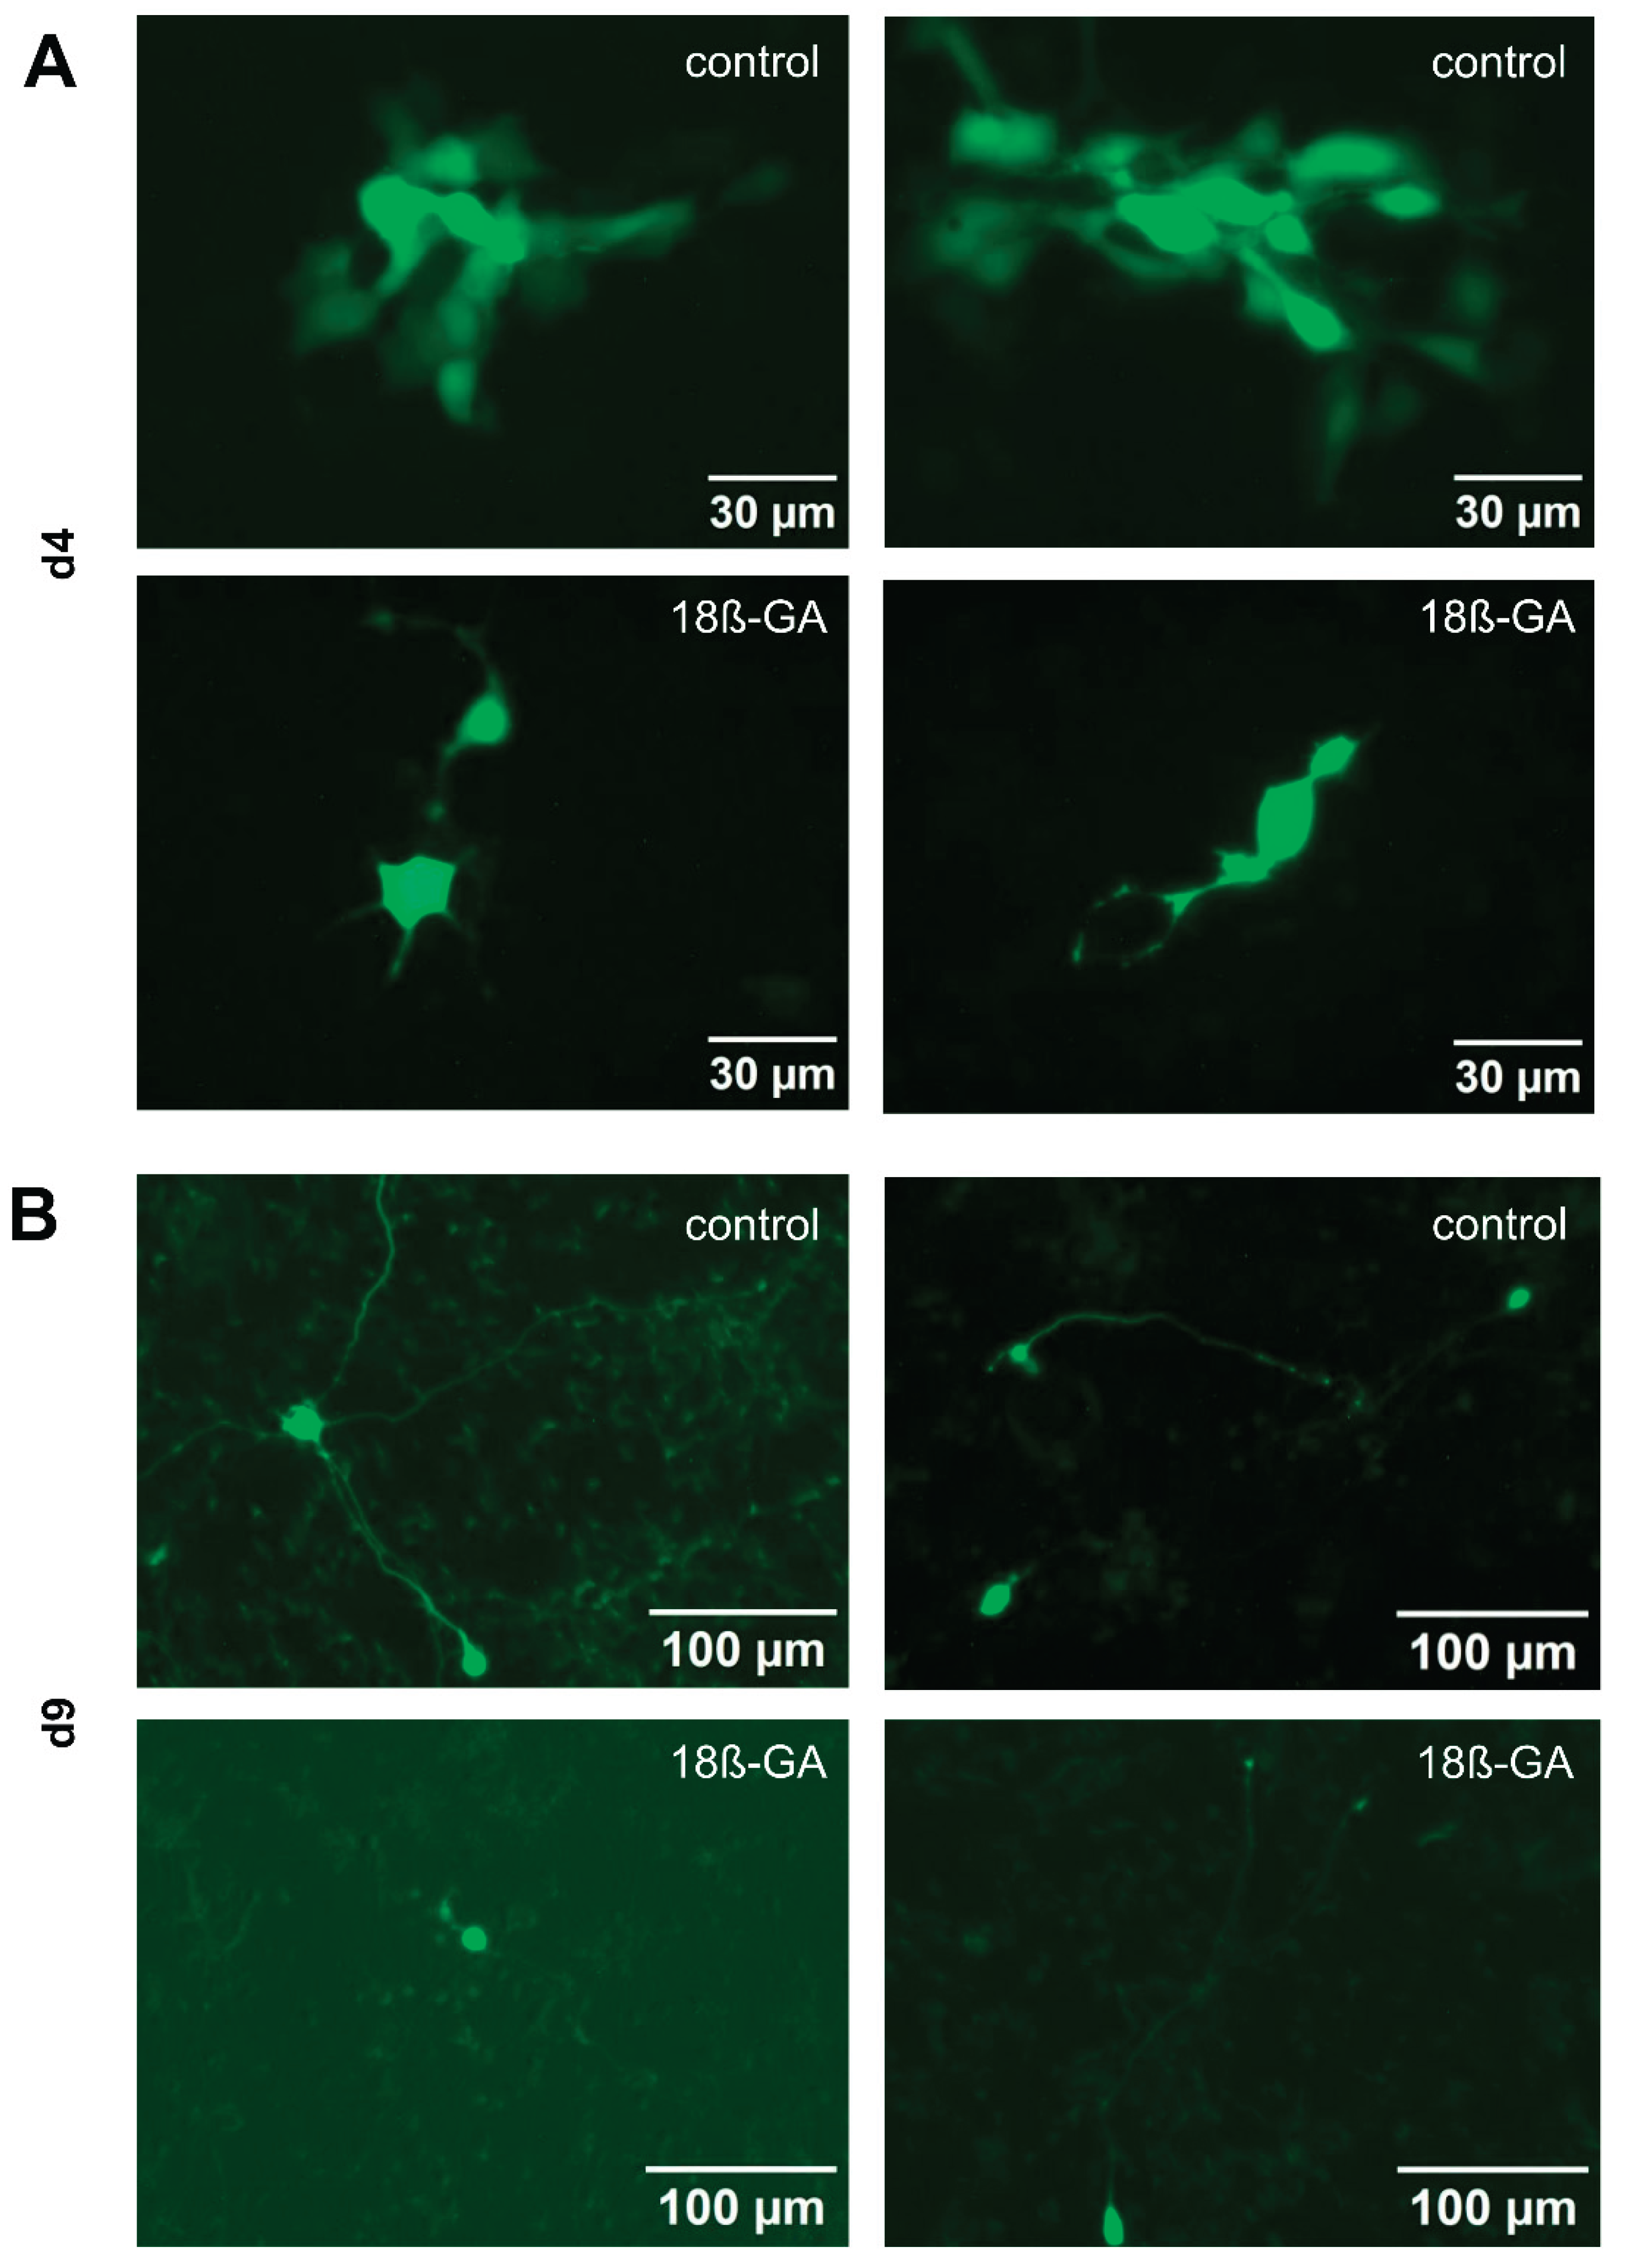
Figure 8.
Immunohistochemistry staining for the expression of gap junction protein connexin 43α, ßIII-Tubuling and HOECHST in LUHMES cells. LUHMES cells were differentiated for 0, 3 or 9 days on IBIDI 8-well slides, respectively. The LUHMES cells were then fixed and stained with antibodies against connexin 43α, ßIII-Tubuling and Hoechst H-33342 and imaged using a confocal microscope. Connexin 43α staining is shown in green, ßIII-Tubulin staining in red and HOECHST H33342in blue.
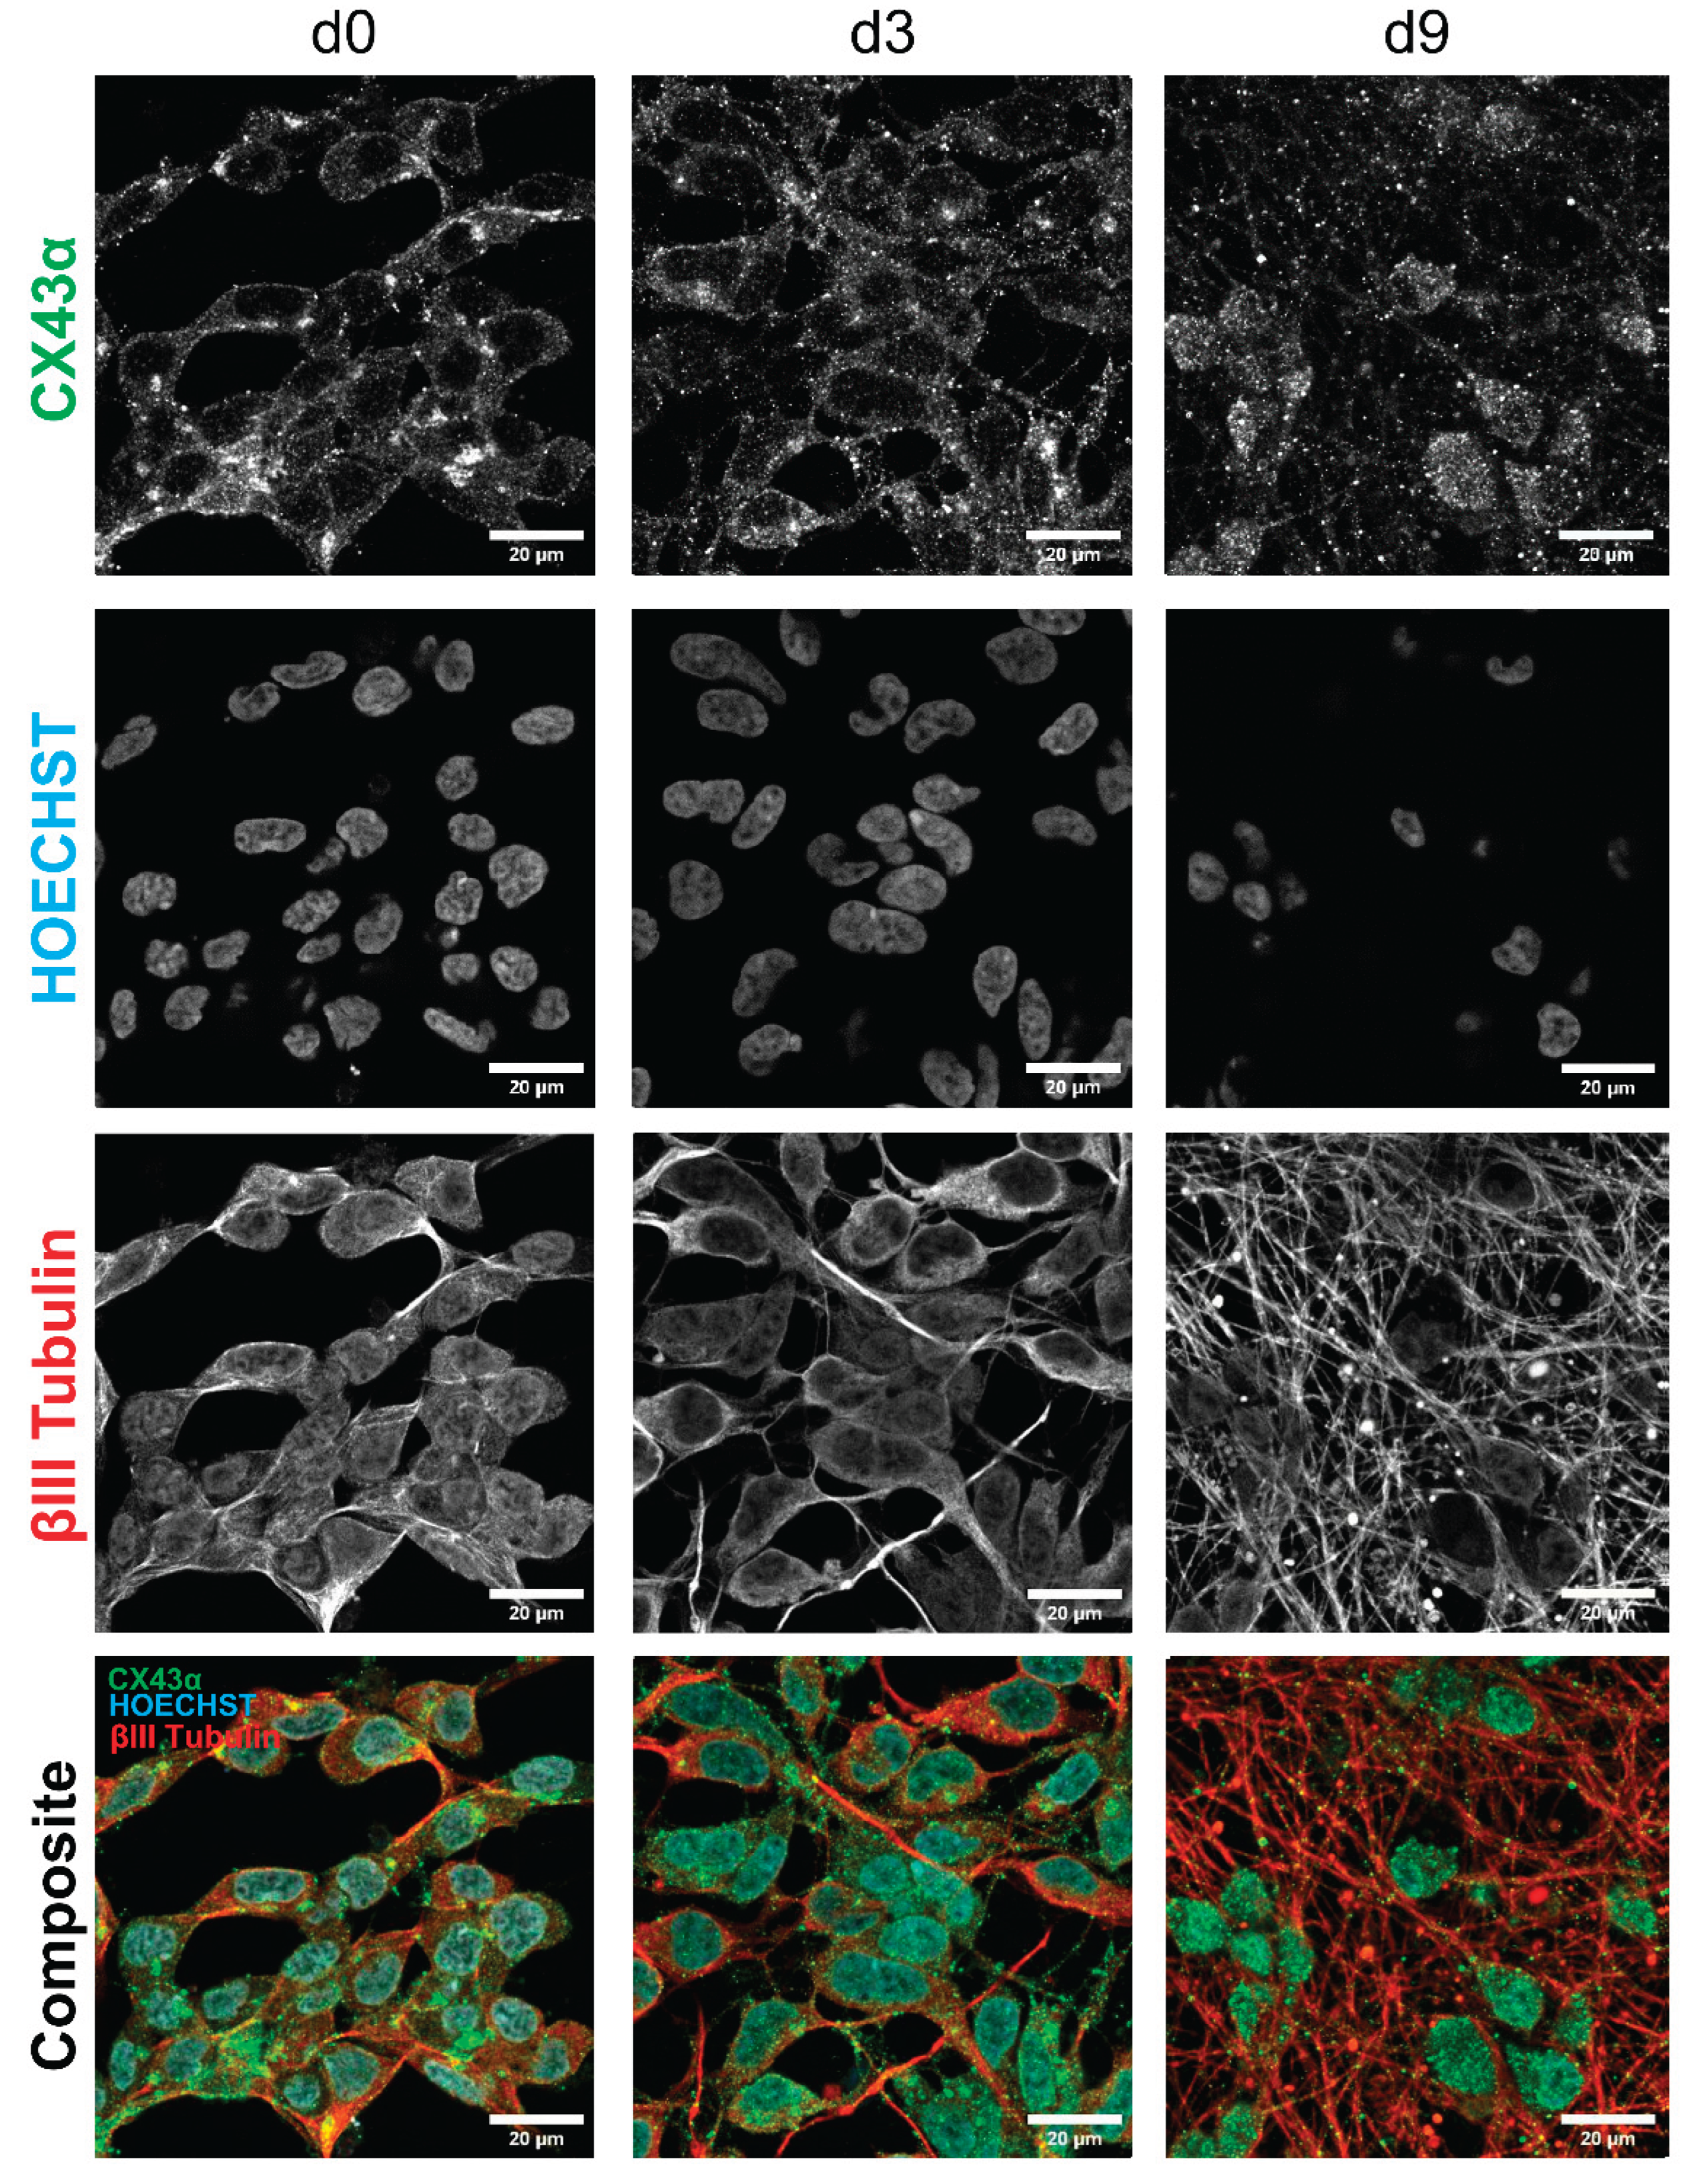
Figure 9.
Analysis of the contribution of gap junctions to Ca2+ oscillations in LUHMES cells. A,B Superimposed fluorescence traces from ten randomly selected ROIs, recorded using a high-resolution microscope, reveal synchronized oscillatory activity under control condition (A). Following the application of the gap junction blocker Carbenoxolone, oscillatory activity persists at the single-cell level, but synchrony is lost (B). C,D The corresponding correlation matrices indicate a highly synchronized activity under control condition (C) but very low to no synchronized activity in the presence of CBX. E The GSI under control conditions was 0.84 ± 0.02. After CBX treatment, the GSI decreases significantly to 0.06 ± 0.03 (Welch two sample t-Test: t = 21.326, p = 1.092e-12; Wilcoxon rank sum test: p= 0.0004). F,G Whole-cell patch-clamp recordings from LUHMES cells under oscillatory conditions revealed small (amplitude < 30 mV) depolarization events (“spikelets”), characteristic of gap junction-mediated electrical coupling. H Overall activity was decreased after the application of the gap junction blocker 18β-GA. 25% of the cells still showed spontaneous activity.
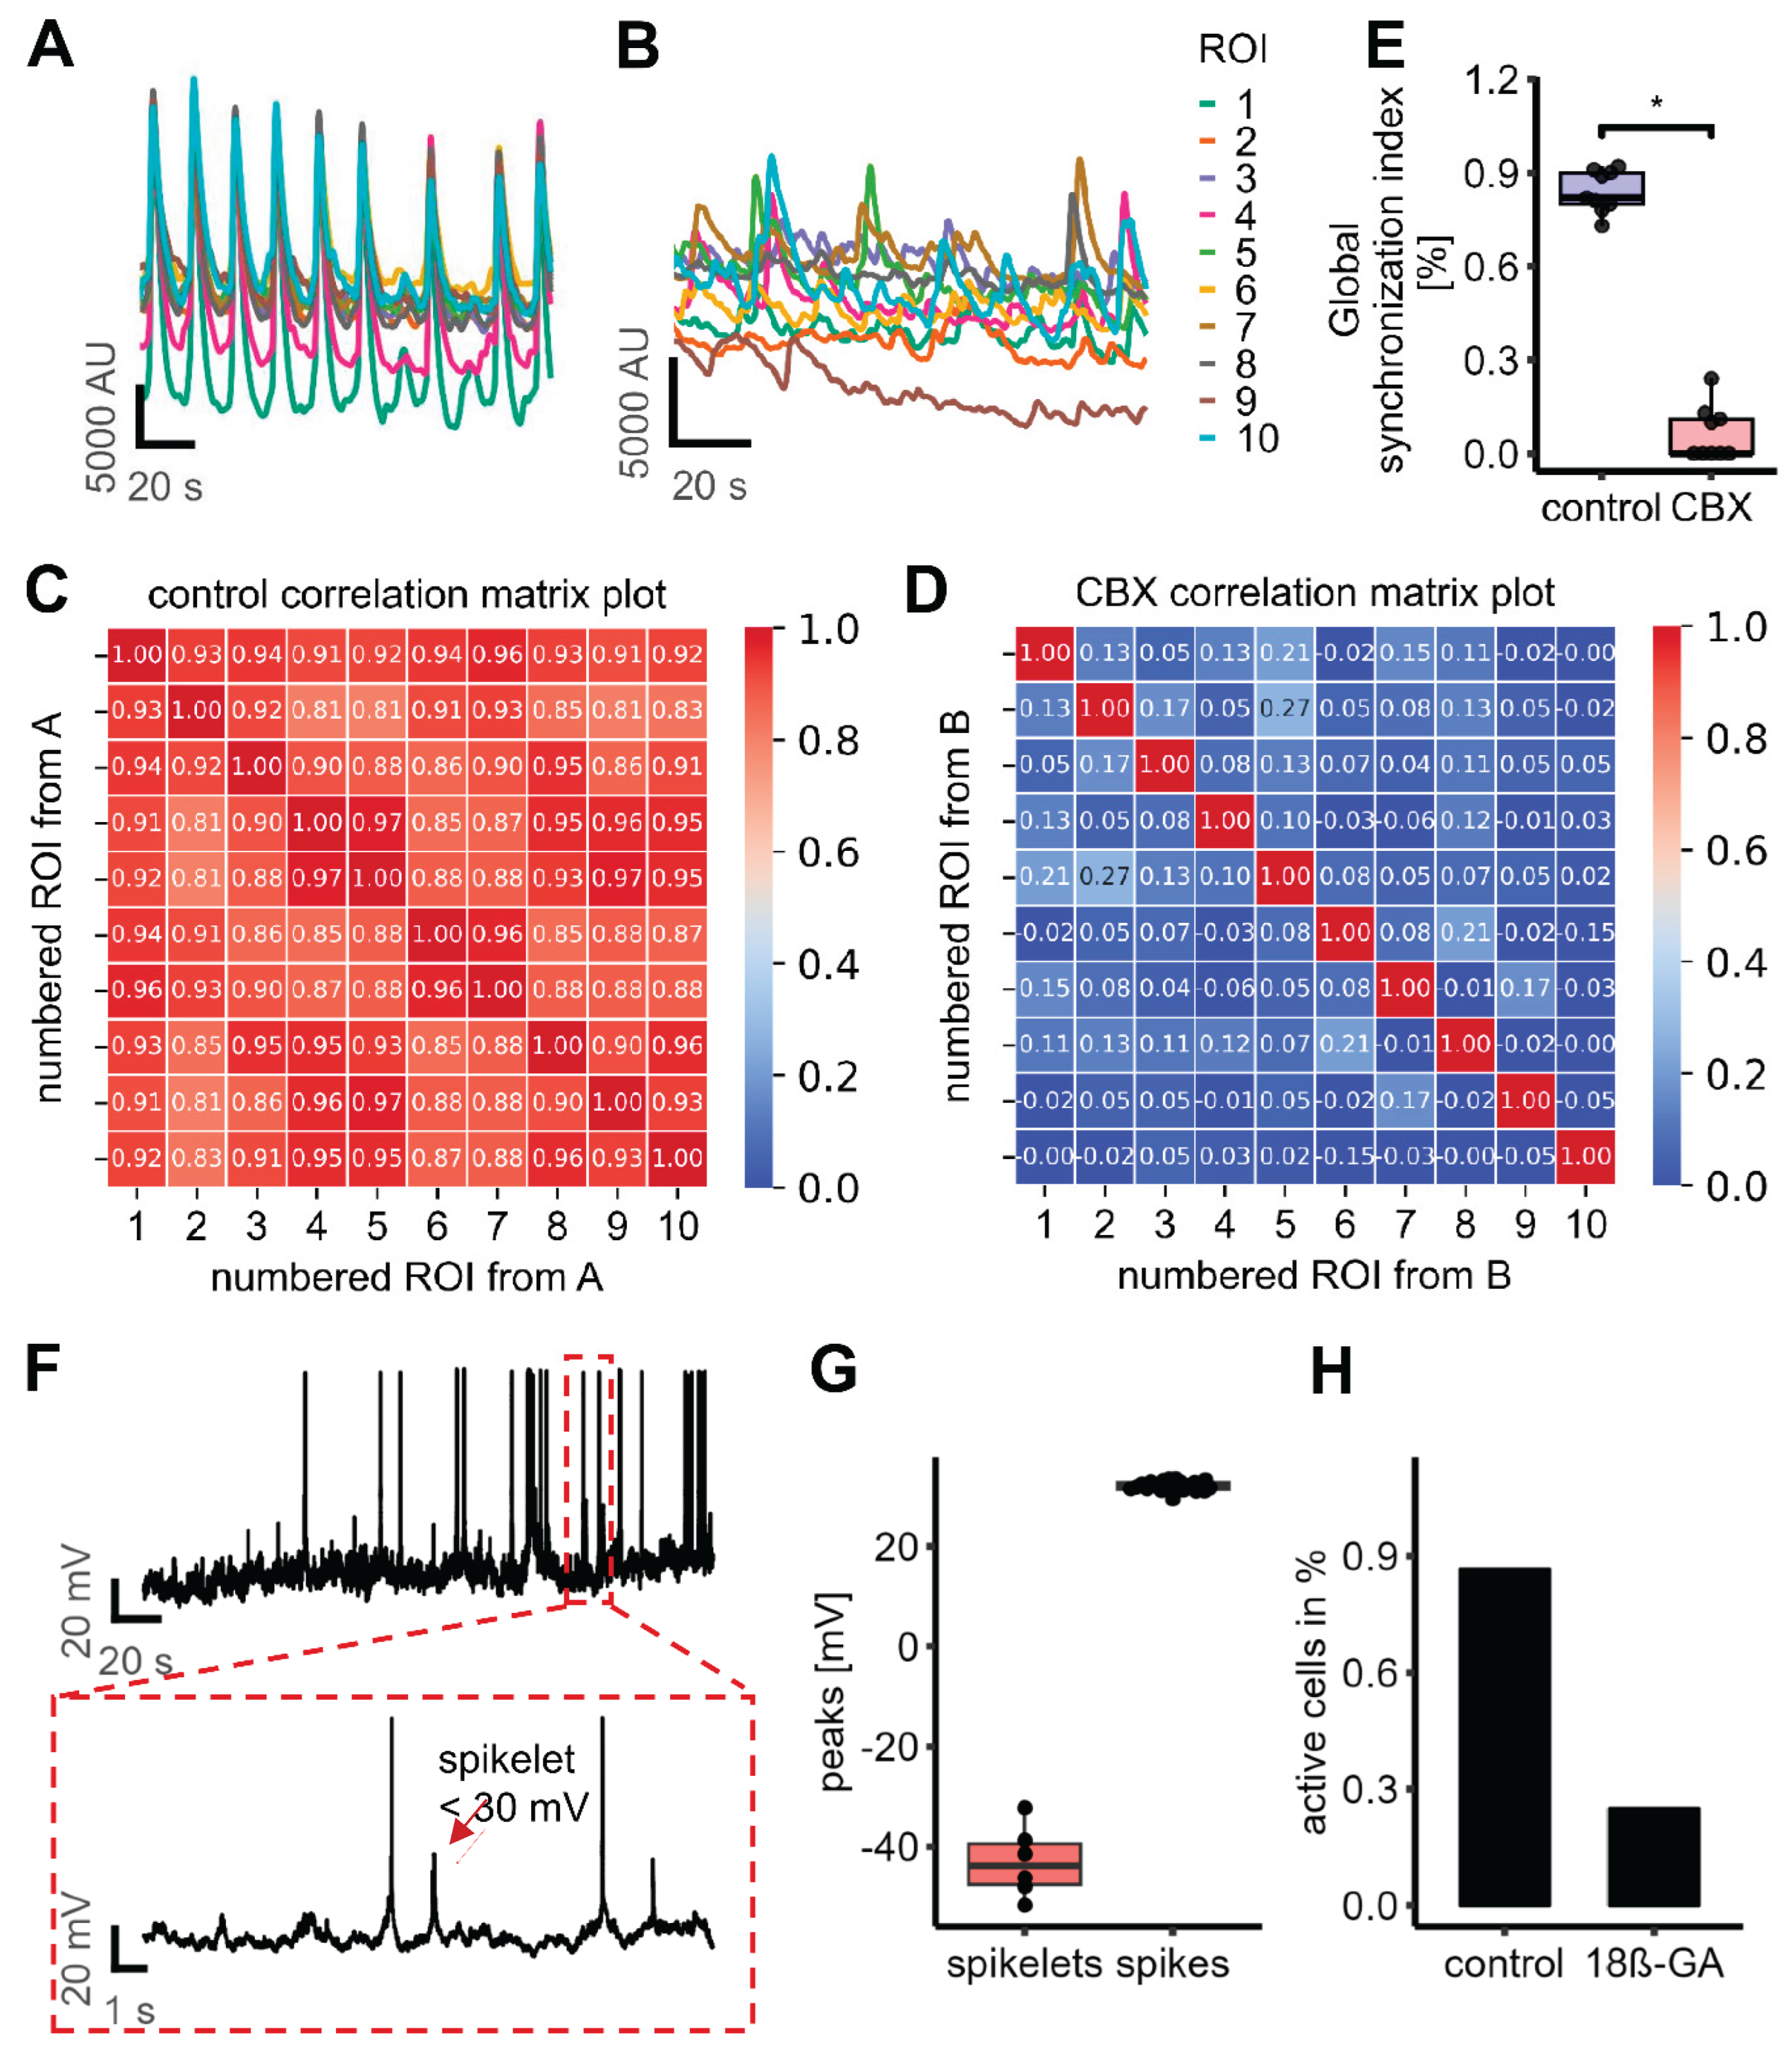
Disclaimer/Publisher’s Note: The statements, opinions and data contained in all publications are solely those of the individual author(s) and contributor(s) and not of MDPI and/or the editor(s). MDPI and/or the editor(s) disclaim responsibility for any injury to people or property resulting from any ideas, methods, instructions or products referred to in the content. |
© 2025 by the authors. Licensee MDPI, Basel, Switzerland. This article is an open access article distributed under the terms and conditions of the Creative Commons Attribution (CC BY) license (http://creativecommons.org/licenses/by/4.0/).
Copyright: This open access article is published under a Creative Commons CC BY 4.0 license, which permit the free download, distribution, and reuse, provided that the author and preprint are cited in any reuse.


