
Submitted:
22 September 2025
Posted:
24 September 2025
You are already at the latest version
Abstract
Background: This study’s objective was to be the first to explore the ethnicity/cultural origins, gender identity, ability/disability, sexual orientation, socioeconomic background and harassment/discrimination experiences of Canadian radiation oncologists (ROs). Methods: Following a literature review and input from content experts, an eth-ics-approved survey was developed in English and French and electronically distributed to all ROs in Canada (n=598). Descriptive statistics summarized responses. Comparisons between groups were performed using Chi-square tests and content analysis was per-formed on open-ended responses. Results: The survey response rate was 48% (298/598). Most respondents were male (62%), 35-44 years old (39%) and heterosexual (90%). 41% identified as belonging to a racialized group, which is higher than the overall Canadian population (27%), but Black, Indigenous and South Asian ROs were underrepresented (2% vs 4%, < 1% vs 5% and 1% compared to 4% respectively). A significant subset analysis showed that only 20% (21/105) of racialized ROs were women whereas Caucasian women comprised 49% (74/150) of Caucasian respondents (p < 0.001). While 75% of re-spondents reported job satisfaction, 42% reported experiencing workplace discrimina-tion/harassment within the past 5 years; most commonly this was perpetrated by fellow faculty (32%; 58/183) or patients or their family members (32%; 58/183). Respondents felt that gender, race/ethnicity, and age were the three top reasons for discrimina-tion/harassment with double the amount of racialized ROs reporting harassment com-pared to White ROs (p < 0.001). Nearly half (45%; 114/252) did not understand how to report, or felt uncomfortable reporting, workplace discrimination/harassment. Conclu-sions: This study highlights high harassment and discrimination rates amongst Canadian ROs, especially amongst racialized women, which may affect career satisfaction and attrition rates. Compared to census data, Black, Indigenous and South Asian ROs were underrepresented, and amongst racialized ROs, racialized women were significantly underrepresented. These findings underscore the need for targeted diversity initiatives, improved mentorship programs, and stronger institutional policies to address harass-ment and foster an inclusive work environment.
Keywords:
diversity
; equity
; workplace discrimination
; Canadian
; radiation oncologists
; race
; gender
; harassment
; ethnicity
; age
1. Introduction
A U.S. diversity assessment of radiation oncologists (ROs) found that women and individuals underrepresented in medicine (URiM) (including Black, Hispanic and Indigenous people), were significantly underrepresented in radiation oncology compared to other specialties [1]. URiM physicians report lower career satisfaction, fewer mentorship and promotion opportunities, and higher attrition rates than their non-URiM peers [2]. Studies also consistently show higher rates of discrimination among non-White physicians, especially Black physicians and non-White women, with negative impacts on career advancement, work environment, and health [3,4,5]. Those most affected by harassment and discrimination often lacked knowledge of reporting mechanisms, and fewer than 25% were satisfied with how their reports were handled [4]. Data from the European Society for Radiotherapy and Oncology (ESTRO), showed that inclusion scores for radiation oncology professionals who belonged to a minority group, were significantly lower than non-minorities, with the lowest overall favourable obtained for those who selected “gender” as their minority criterion [6].
While there is existing diversity assessment for Canadian ROs, related fields show similar patterns. In 2021, the Canadian Organization of Medical Physicists (COMP) conducted its first equity, diversity, and inclusion (EDI) Climate Survey [7]. Only 36% of respondents were women, and Indigenous representation was less than 1%, despite Indigenous people comprising 5% of Canada’s workforce. Fewer women (58%) reported access to professional opportunities compared to men (70%), and 17% (mostly women) reported experiencing sexual harassment in the past five years [7].
The American College of Radiology (ACR) Commission for Women and Diversity found that radiation oncology training programs have less diverse trainee populations than medical schools or specialties like internal medicine [8]. They emphasized that a broader, more diverse talent pool improves patient care, communication and outcomes through greater cultural competence and trust [9,10,11].
Ethnicity also plays a key role in cancer outcomes [1,12]. For example, U.S. Black men are twice as likely to die from prostate cancer as White men and are less likely to receive screening, even after adjusting for socioeconomic factors [13]. Similarly, South Asian women in Ontario are diagnosed with breast cancer at later stages than others, and U.S. African American and Hispanic women are more likely to present with advanced disease [14,15]. The race of your physician/oncologist can also be an important aspect of a person’s health. The National Academy of Medicine’s 2005 report “Unequal Treatment, Confronting Racial and Ethnic Disparities in Health Care” outlines how provider implicit biases can explain some aspects of racial disparities in health [16]. Relatedly, US study, Black, Hispanic, and Asian patients reported greater satisfaction with care if their doctor was of the same race or ethnic background than if their doctor was of a different background because of increased comfort and trust [11]. Recruiting and retaining a diverse physician workforce strengthens the healthcare system by incorporating varied experiences and values, improving patient advocacy, and reducing barriers to care in diverse populations [17,18].
To date, a diversity assessment and workplace culture inventory of the Canadian radiation oncology workforce has not been performed. This study’s objectives were then, to be the first study to analyze and evaluate the demographics of Canadian ROs, while looking at career satisfaction, workplace culture, and lived experiences of discrimination and harassment. This is in line with the American College of Radiology (ACR) who made numerous recommendations to improve equity, diversity, and inclusion (EDI) in the field of radiation oncology in their Diversity Report, including: i) advocacy and awareness through publications, ii) the creation and dissemination of metrics, and iii) the collection of data that quantifies existing disparities so that specific areas can be targeted though EDI initiatives [19].
2. Materials and Methods
2.1. Study Population and Survey Measures
The study was approved by our Institutional Research Ethics Board. A 45-question survey was developed to gather anonymous cross-sectional data, informed by a literature review and input from experts across Canada and the U.S. to ensure questions were inclusive, culturally sensitive, and able-focused rather than disability-focused. The concept of underrepresented and minoritized individuals was based on the AAMC’s definition of representation in medicine relative to the general population [20]. Survey questions were screened for clarity, and definitions for terms like sexual orientation, gender identity, race/ethnicity, and workplace concepts such as "culture of respect" and "discrimination" were provided. Explanations for specific questions were included to give participants context. Ethnic and cultural origin questions followed the 2021 Canadian Census format, allowing respondents to identify multiple origins. Racialized status was defined per the 2016 Canadian Census for comparability. Gender identity questions included definitions and allowed for multiple responses, including options like agender, non-binary, and transgender, with a self-identification option.
The survey had four sections: i) Demographics, ii) Career Satisfaction and Mentorship, iii) Workplace Culture and Discrimination, and iv) Suggestions for Improvement (Supplemental Materials). It included multiple-choice (with multi-selection options), open-ended questions for thematic analysis (e.g., improving oncology hiring practices), 5-point Likert scales (e.g., rating workplace climate on cooperation, support, and diversity), and yes/no questions. "Culture of respect" was defined as colleagues' attitudes, behaviors, and standards related to inclusion, access, and respect for diverse backgrounds and identities. Discrimination was defined as unjust treatment based on traits like race, age, gender, or sex.
The survey was created in tandem with a trainee-focused survey and was delivered in English and French to encourage survey participation in either one of Canada’s two official languages (Supplementary Materials, [21]). The survey was electronically distributed via Qualtrics (Qualtrics, Provo, UT) to all practicing ROs in Canada via the Canadian Association of Radiation Oncology email registry and through administrative leaders at all 52 cancer facilities in Canada with radiotherapy services. The survey was not linked in any way to a person’s IP address, institution or email address and anonymous responses were collected between July 2023 and December 2023 after three email reminders to participate were sent out over a period of 6 weeks.
2.2. Data Analysis
Descriptive statistics were used to summarize the survey data. Survey questions were analyzed individually to incorporate responses by individuals who did not finish the entire survey or chose not to answer certain questions, but completed parts of it. Canadian population-level 2021 census data was obtained for relevant comparisons where the data exists and was supplied by Statistics Canada [22]. Canadian RO-specific data was obtained from the Canadian Institute for Health Information’s (CIHI) Scott’s Medical Database [23]. Chi-square tests were used to analyze between group differences with race and gender. A p-value < 0.05 was deemed statistically significant.
3. Results
3.1. Survey Response
Of the estimated 598 practicing Canadian ROs identified by the Canadian Institute of Health Information (CIHI) [24], 289 provided consent to participate in the survey for a survey response rate was 48% (with no response from the remaining 309 ROs). Of these, 273 answered at least one survey question (with 16 respondents quitting the survey without choosing any answers). There were 265 respondents whom completed the entire sociodemograhics section, and 254 (85%) respondents completed the entire survey (Figure 1). For some questions, respondents had the ability to select as many responses as they felt applicable, which is why response numbers vary per question.
3.2. Demographics
Demographic data included questions regarding: gender identity, age, sexual orientation, race/ethnicity, religion, geographic location of practice, citizenship status, marital status, dependency status, disability status, primary language spoken, degrees earned, years of practice, academic rank, socioeconomic background and scholarly work.
The gender and geographic distribution of respondents were similar to existing CIHI data for ROs and aligned with 2021 Canadian Census data (Table 1, p=0.54) [24]. Most respondents practiced in Ontario (36%; 95/265) or Quebec (26%; 68/265). The majority were men (63%; 168/267), aged 35-44 (39%; 107/273), married or in a domestic relationship (85%; 228/267), and heterosexual (94%; 246/262). English was the primary language for 59% (157/264), though respondents spoke over 32 languages. Gender distribution was consistent with previous studies (62% male here, 63% male in past studies), but women were underrepresented compared to the general Canadian population (Table 1, p<0.001) [25].
Regarding racial identity, 59% of respondents did not identify as a visible minority, while 41% (105/255) were racialized, primarily Chinese (15%; 39/255) and South Asian (12%; 31/255). Compared to the Canadian population, Caucasian ROs were underrepresented (59% vs. 70%), while racialized ROs were overrepresented (41% vs. 27%, p<0.001). However, Black (2%), Southeast Asian (1%), and Indigenous (less than 1%) ROs were underrepresented compared to their proportions in the general population.
A subset chi-square analysis of race and gender revealed that of racialized ROs, only 20% (21/105) were women whereas White women comprised 49% (74/150) of White ROs (Table 1, p<0.001). There were 4 racialized male ROs for every racialized female RO (Figure 2). Regarding sexual orientation, 4% (10/261) of respondents identified as gay and 2% (5/261) identified as bisexual or as asexual.
Most ROs (96%; 255/265) were Canadian citizens (67% by birth and 29% by immigration). The majority of ROs identify as Christian (41%; 107/264) or had no religious affiliation (40%; 106/264). When asked if the respondents had a disability, 4% (10/260) replied “yes,” with deaf/hearing impairment, mobility/physical impairment, and mental health being the top disabilities reported.
3.3. Career Satisfaction and Mentorship
The second part of the survey focused on career satisfaction and mentorship (Table 2). Most respondents (75%; 187/248) were satisfied with their job. Although not statistically significant (Chi-square p=0.18), more male ROs (13%; 22/168) than female ROs (8%; 8/99) were unsatisfied with their job, compared to those who were satisfied. Significantly more racialized ROs (17%; 18/105) compared to White ROs (8%; 12/150) reported dissatisfaction with their job compared to those who were satisfied however (Chi-square p<0.03). Overall, 81% (211/262) had considered moving institutions, and 9% (24/262) often or very often regretted becoming a physician. Most respondents lacked formal mentorship: 59% (153/260) said no program existed in their department, 55% (143/260) did not mentor others, and 75% (196/260) did not have a mentor. The absence of mentorship was similar across gender (73% male, 72% female) and race (77% White, 75% racialized). Only 17% (46/260) agreed that having a mentor with similar demographic characteristics was important; 45% (116/260) were neutral.
3.4. Workplace Culture and Experiences of Discrimination or Harassment
The third part of the survey aimed to understand how ROs felt about the culture/environment of their oncology centre and characterise their lived experiences of harassment/discrimination (Table 3). The “culture of respect” in respondents departments’ was reported as good to excellent by 76% (200/263). However, 42% of respondents (106/252) reported experiencing discrimination in the past 5 years with 21% (54/252) of respondents being discriminated against 2-4 times, 10% (25/252) 5-10 times and 8% (19/252) of respondents reporting experiencing discrimination on a regular and ongoing basis. The majority of those discriminated against listed gender (26%; 52/201), race/ethnicity (20%; 41/201), and age (15%; 31/201) as the primary reasons for discrimination, however, pregnancy/caregiving burden (9%; 19/201), national origin (6%; 13/201), marital status (4%; 8/201), level of education (3%; 7/201) and political views (3%; 6/201) were also top reasons listed. Fellow faculty members and patients/family members were the main sources of discriminatory behaviour (32% for each; 58/183) but administrative or non-faculty staff was also a top source listed (14%, 25/183). Of respondents who experienced discrimination by a faculty member, 19% (48/251) reported that the staff member was in a position of power and that they could directly affect the respondent’s academic or professional opportunities. Of respondents who experienced discrimination by a patient or the patient’s family member, race/ethnicity (36%; 43/120) was the number one reason cited, followed by gender (24%; 29/120) and age (23%; 27/120).
A large number (45%; 114/252) of respondents either felt uncomfortable reporting incidents or did not understand how to. Subset analyses found that female and male ROs report significantly different sources of discrimination (chi-squared = 39.2, p<0.001). Female ROs overwhelmingly reported gender as source of discrimination more than male ROs (44/52; 85% vs 7/47; 15%) whereas male ROs meaningfully reported race/ethnicity more than female ROs as a reason of discrimination (30/47; 64% vs 12/52; 23%). Female ROs also reported age (46%, 24/52), pregnancy/caregiver responsibilities (27%; 14/52) and marital status (13%; 7/52) as other top reasons of discrimination whereas male ROs reported these factors less frequently [age (19%; 9/27) and childcare/caregiving responsibilities (8.5%; 4/47)]. Racialized ROs were twice as likely to significantly report experiencing discrimination compared to White ROs (60%; 67/111 vs. 30%, 44/149, chi-squared =24.713, p<0.001).
Types of anti-discrimination training provided to ROs were also evaluated. While the most common forms of training were via an online module or via a review of institutional policy, 44% (119/271) had no 2SLGBTQIA+ training, 36% (99/278) had no learner mistreatment training, 31% (82/266) had no anti-racism training, 25% (68/276) reporting no sexual harassment training, 24% (69/282) had no equity, diversity, and inclusion (EDI) training and 17% (50/286) had no Aboriginal/Indigenous health training.
4. Discussion
To the best of our knowledge, this study is the first to explore the socio-demographic characteristics of practicing ROs across Canada. Although most respondents reported a culture of respect and satisfaction with their job, discrimination was reported by almost half of respondents.
Despite overall job satisfaction, nearly half of respondents reported experiencing discrimination. Key findings revealed that women are underrepresented in radiation oncology (37%) compared to the Canadian labour force (49%), medical school entrants (59%), and active physicians (43%), though representation is higher than in the U.S. (36% vs 26%) [22,25,26,27,28]. Racialized Canadian female ROs are significantly underrepresented, comprising only 20% of racialized ROs, unlike White ROs, where gender distribution is nearly equal (51% men vs 49% women, p<0.001). Women were significantly more likely to report gender-based discrimination while men reported race/ethnicity discrimination and racialized ROs were twice as likely (30% vs 60%) to report discrimination than White ROs. This is similar to the survey results from the Brazilian Society of Clinical Oncology in which high rates of gender-based discrimination was reported by their female members (70.5% of women versus 1.8% of men) [29]. These findings highlight the need for targeted mentorship, family-friendly policies, wellness programs, and inclusive recruitment strategies to improve diversity in radiation oncology.
We also identified that certain underrepresented races/ethnicities were present in the Canadian RO workforce (First Nations, Black, Southeast Asian) for whom targeted pathway or mentorship programs may be beneficial. For example, the University of Toronto’s Black Student Application Program, launched in 2018, increased Black medical student representation from a single student in 2016 to 24 in 2020 (which was 9% of the class, compared to 7.5% of Toronto’s population) [30,31]. Similarly, in the U.S., Black, Hispanic, Indigenous, and Pacific Islander ROs remain significantly underrepresented, with Black ROs comprising only 3% of the workforce versus 13% of the general population [28]. Most respondents (82%; 214/260) felt neutral or disagreed that having a mentor with similar characteristics was important however, which means that mentees may be open to a wider variety/pool of potential mentors.
The high rate of reported discrimination (42%) and the fact that 45% of respondents were unaware of or uncomfortable with reporting harassment is concerning. Similar findings were seen in a U.S. medical physics study, where The American Association of Physicists in Medicine (AAPM) found that 38% of respondents experienced at least one type of discrimination [32]. The ESTRO diversity, equity, inclusion and workforce engagement study also revealed that minority members reported low inclusion scores on access to opportunity, cultural competence and respect, while the largest difference between minority and non-minority respondents was on “trust”. These results underscore the need for supportive and respectful environments in regards to diversity, clear anti-discrimination policies, and effective training [6]. However, punitive measures alone are insufficient and should be paired with strategies to address underlying prejudice and bias [33]. Discrimination is a complex, multi-factor phenomenon but research shows that strong institutional support can shift public perceptions of social norms and can increase acceptance of marginalized groups as individuals often use perceptions of what is common or accepted in a collective as a guide to their own behaviour. For example, support for same-sex marriage increased after the 2015 U.S. Supreme Court ruling [34]. And while existing research shows that intergroup prejudices are deeply ingrained, studies show that brief, empathy-driven conversations can reduce prejudice. Broockman and Kalla found that when people were encouraged to adopt a transgender person’s perspective, their support for anti-discrimination laws rose significantly [35]. Anonymous reporting systems may help ROs report harassment, especially since 32% experienced harassment from colleagues—19% by someone in a position of power. Still, reporting systems alone may be ineffective if institutional culture does not support meaningful change [36]. Current anti-discrimination training is often inadequate, especially when delivered online.
Discrimination was most commonly reported from fellow faculty and patients or their families, with gender, race/ethnicity, and age cited as the top reasons. Similar patterns were seen in a study of medical physicists, where women faced gender-based barriers related to family planning, childcare, and career advancement [37]. In terms of patient or family members of patients who perpetrated discriminatory behaviour, social identity-based discrimination against healthcare providers is a prevalent and well-documented phenomenon that needs to be addressed at a systems and institutional level to hold patients accountable [38].
Limitations of our study include the possibility of selection or sampling bias (as respondents needed to be reached via our established e-mail communication lists), low numbers of certain demographic groups which limits our ability to understand their lived experience and survey constraints including the survey design that may limit the breadth of responses along with a lack of ability to probe answers further. With a survey that deals with sensitive topics such as ours, non-responders who are unwilling to answer may also reflect a population differing from those who do. Therefore, generalizing these results to Canadian ROs as a whole has to be done with caution. Still, 42% of Canadian ROs completed the survey which is a strength, and the geographic distribution of responses aligns with national CIHI data.

Table 4.
Thematic content and select quotes from open-text questions regarding how oncology centres can improve.
Table 4.
Thematic content and select quotes from open-text questions regarding how oncology centres can improve.
| Question | Select Summarized and Representative Quotes |
|---|---|
| What should oncology departments do to address mistreatment or harassment? | (i) training/education: “Better training with easily accessible resources. Publicize them to make them known to everyone. “Open discussions at the department meetings. Educational workshops. Form special committees.” (ii) having clear institutional policies on how to report mistreatment (anonymously or via a structured complaint pathway): “Have open in-person conversations led by leadership to clarify expectations, policies and procedures, and have a forum to confidentially report mistreatment/harassment to for victims and an avenue for understanding options for formal reporting.” “A standardized / easy to access / anonymous reporting method is needed. There should be an independent process/body to administrate this to reduce bias.” (iii) having meaningful and measured corrective measures or repercussions to mistreatment: “Incidents should be fully investigated and sorted out and a clear message of no tolerance for any form of mistreatment or harassment should be in place.” “We need more than investigation of just the incident. There needs to be an assessment of the work environment to determine if this is an isolated behaviour or whether more widespread issues exist. Mistreatment and harassment should not be tolerated in any form.” (iv) creating safe environments where reporting mistreatment or harassment is encouraged: “Explore the cultural factors that are leading to the issues and be willing to significantly disrupt culture that is perpetuating these factors. There needs to be a way to report incidents in a confidential and safe manner.” “Need more diversity in leadership. Most leaders are one gender and appear the same, we need to hire people from multiple backgrounds that represent all ROs to be leaders/administration.” |
| What should oncology departments do to advance equity diversity and inclusion (EDI) in the workplace? | (i) advancement supports for underrepresented persons in RO to achieve leadership positions: “Support leadership training for underrepresented faculty and trainee members.” “Stop looking for a certain archetype as this creates a selection bias. We need to clear policies for promotion to hire people in leadership positions with different skills and backgrounds.” (ii) mandatory and comprehensive EDI education and training: “There needs to be in-person mandatory presentations to learn what EDI is and how it may manifest, clear training on policies and institutional goals related to EDI, with discussion around how to mitigate barriers to EDI goals.” “We need to educate ourselves on best practices and make conscious efforts to advance and seek expertise to improve EDI training.” |
|
What should oncology departments do to make faculty hiring practices more equitable? |
(i) transparent, inclusive, and equitable hiring practices: “We need better diversity in hiring practices, and teaching on why this is valuable. Departments need to make this a priority and openly discuss how they are taking the lead on improving recruitment processes and mitigating unconscious biases.” “There needs to be formal processes and hiring practices, informed by EDI experts, that supports the development of a diverse work force and decrease barriers for those who are underrepresented with inclusive language.” (ii) ensuring that hiring committees are diverse themselves: “Committees should be composed of a diverse group of individuals to make hiring decisions. Members should have mandatory training on hiring policies and best practices.” “Follow established university hiring practices that already focus on EDI and fairness and seek advice from hospital/university affiliates to ensure that the committee and department hiring is open to equity and diversity and hiring members are from diverse backgrounds.” (iii) hiring candidates externally/from a different training background: “There should be an external review of any hire that confirms that a job posting was publicly available with specific considerations as to whether potential hires external to the department were given due consideration. The hiring of our own trainees can perpetuate the retention of a stagnant culture, which is reinforced when we are disrupted by an external hire (i.e., the culture conflict often makes everyone wish the hire was internal, when in fact the disruption of group think was a positive). |
5. Conclusions
In conclusion, this survey summarizes the sociodemographic information of ROs in Canada and identifies that women and certain racialized minorities such as First Nations, Black and Southeast Asians are underrepresented in radiation oncology. It also identifies areas of concern related to high levels of mistreatment and discrimination that ROs experience, particularly amongst women and racialized ROs and provides suggestions from ROs themselves for improvement. The findings in this study suggest that the creation of targeted mentorship/pathway programs, physician wellness plans, diversity initiatives and the construction of more clearly defined, transparent and robust institutional policies to tackle mistreatment and discrimination will help advance EDI within the field of radiation oncology in Canada.
Supplementary Materials
The following supporting information can be downloaded at the website of this paper posted on Preprints.org.
Author Contributions
Conceptualization, A.K, J.C., S.L.; methodology, A.K, J.C., S.L.; software, A.K.; validation, A.K.; formal analysis, A.K. R.B.; investigation, A.K, J.C., S.L.; resources, A.K, S.A., I.G., R.B., G.B., D.B., J.R., R.J., J.C., S.L; data curation, A.K, R.B., J.C., S.L.; writing—original draft preparation, A.K, J.C., S.L.; writing—review and editing, A.K, S.A., I.G., R.B., G.B., D.B., J.R., R.J., J.C., S.L; visualization, A.K., R.B.; supervision, J.C., S.L.; project administration, A.K, J.C., S.L.; funding acquisition, A.K. All authors have read and agreed to the published version of the manuscript.
Funding
This research was funded by The American College of Radiation Oncology – Luther Brady Educational Grant and Professional Association of Resident Physicians of Alberta – Wellness Research Funding.
Institutional Review Board Statement
The study was conducted in accordance with the Declaration of Helsinki, and approved by the Health Research Ethics Board of Alberta Cancer Committee (HREBA.CC-22-0145, July 22, 2023).
Informed Consent Statement
Written informed consent was obtained from all subjects involved in the study.
Data Availability Statement
Due to the sensitive nature of this study and to protect the privacy of respondents’ personal information, supporting data is not available.
Acknowledgments
The authors gratefully acknowledge Rachel Ellaway, Matthew MacDonald, Sebastian MacDonald, Yang Xu and the Mozell Family Analysis Core Group for their statistical and conceptual support of this work.
Conflicts of Interest
The authors declare no conflicts of interest.
References
- K. M. Winkfield and D. Gabeau, “Why Workforce Diversity in Oncology Matters,” Int. J. Radiat. Oncol. Biol. Phys., vol. 85, no. 4, pp. 900–901, Mar. 2013. [CrossRef]
- E. A. Germino et al., “Tailored Mentorship for the Underrepresented and Allies in Radiation Oncology: The Association of Residents in Radiation Oncology Equity and Inclusion Subcommittee Mentorship Experience,” Int. J. Radiat. Oncol., vol. 116, no. 2, pp. 368–374, Jun. 2023. [CrossRef]
- Filut, M. Alvarez, and M. Carnes, “Discrimination Toward Physicians of Color: A Systematic Review,” J. Natl. Med. Assoc., vol. 112, no. 2, pp. 117–140, Apr. 2020. [CrossRef]
- S. M. Ruzycki, P. Roach, J. Holroyd-Leduc, C. Barnabe, and S. B. Ahmed, “Experiences and Perceptions of Racism and Sexism Among Alberta Physicians: Quantitative Results and Framework Analysis of a Cross-Sectional Survey,” J. Gen. Intern. Med., vol. 38, no. 1, pp. 165–175, Jan. 2023. [CrossRef]
- L. N. Dyrbye et al., “Physicians’ Experiences With Mistreatment and Discrimination by Patients, Families, and Visitors and Association With Burnout,” JAMA Netw. Open, vol. 5, no. 5, p. e2213080, May 2022. [CrossRef]
- Gasnier et al., “Establishing a benchmark of diversity, equity, inclusion and workforce engagement in radiation oncology in Europe – An ESTRO collaborative project,” Radiother. Oncol., vol. 171, pp. 198–204, Jun. 2022. [CrossRef]
- G. Aldosary et al., “A First Look at Equity, Diversity, and Inclusion of Canadian Medical Physicists: Results From the 2021 COMP EDI Climate Survey,” Int. J. Radiat. Oncol. Biol. Phys., vol. 116, no. 2, pp. 305–313, Jun. 2023. [CrossRef]
- J. B. Lightfoote et al., “Improving Diversity, Inclusion, and Representation in Radiology and Radiation Oncology Part 1: Why These Matter,” J. Am. Coll. Radiol. JACR, vol. 11, no. 7, p. 673, 2014. [CrossRef]
- L. E. Gomez and P. Bernet, “Diversity improves performance and outcomes,” J. Natl. Med. Assoc., vol. 111, no. 4, pp. 383–392, Aug. 2019. [CrossRef]
- T. H. Swartz, A.-G. S. Palermo, S. K. Masur, and J. A. Aberg, “The Science and Value of Diversity: Closing the Gaps in Our Understanding of Inclusion and Diversity,” J. Infect. Dis., vol. 220, no. Suppl 2, pp. S33–S41, Sep. 2019. [CrossRef]
- J. Takeshita et al., “Association of Racial/Ethnic and Gender Concordance Between Patients and Physicians With Patient Experience Ratings,” JAMA Netw. Open, vol. 3, no. 11, p. e2024583, Nov. 2020. [CrossRef]
- T. Haque et al., “Cancer mortality rates by racial and ethnic groups in the United States, 2018-2020,” JNCI J. Natl. Cancer Inst., vol. 115, no. 7, pp. 822–830, Apr. 2023. [CrossRef]
- T. Gilligan, P. S. Wang, R. Levin, P. W. Kantoff, and J. Avorn, “Racial differences in screening for prostate cancer in the elderly,” Arch. Intern. Med., vol. 164, no. 17, pp. 1858–1864, Sep. 2004. [CrossRef]
- Dehal, A. Abbas, and S. Johna, “Racial disparities in clinical presentation, surgical treatment and in-hospital outcomes of women with breast cancer: analysis of nationwide inpatient sample database,” Breast Cancer Res. Treat., vol. 139, no. 2, pp. 561–569, Jun. 2013. [CrossRef]
- M. Ginsburg et al., “A population-based study of ethnicity and breast cancer stage at diagnosis in Ontario,” Curr. Oncol., vol. 22, no. 2, pp. 97–104, Apr. 2015. [CrossRef]
- of Medicine, Unequal Treatment Confronting Racial and Ethnic Disparities in Healthcare. Washington: National Academies Press, 2002.
- F. C. Stanford, “The Importance of Diversity and Inclusion in the Healthcare Workforce,” J. Natl. Med. Assoc., vol. 112, no. 3, pp. 247–249, Jun. 2020. [CrossRef]
- M. Winkfield, C. R. Flowers, and E. P. Mitchell, “Making the Case for Improving Oncology Workforce Diversity,” Am. Soc. Clin. Oncol. Educ. Book, no. 37, pp. 18–22, May 2017. [CrossRef]
- S. S. Wang, E. H. Dibble, I. C. Gibbs, E. Rubin, and J. R. Parikh, “The 2021 ACR/Radiology Business Management Association Workforce Survey: Diversity in Radiology,” J. Am. Coll. Radiol. JACR, vol. 20, no. 12, pp. 1269–1276, Dec. 2023. [CrossRef]
- “Does the AAMC’s Definition of ‘Underrepresented in Medicine’ Promote Justice and Inclusivity?,” AMA J. Ethics, vol. 23, no. 12, pp. E960-964, Jan. 2021. [CrossRef]
- S. Allen et al., “Understanding Equity, Diversity and Inclusion within Canadian Radiation Oncology: Experiences of Residents and Fellows,” Int. J. Radiat. Oncol., vol. 120, no. 2, Supplement, pp. e2–e3, Oct. 2024. [CrossRef]
- S. C. Government of Canada, “Census Profile, 2021 Census of Population.” Accessed: Aug. 02, 2024. [Online]. Available: https://www12.statcan.gc.ca/census-recensement/2021/dp-pd/prof/index.cfm?Lang=E.
- “Scott’s Medical Database metadata | CIHI.” Accessed: Aug. 02, 2024. [Online]. Available: https://www.cihi.ca/en/scotts-medical-database-metadata.
- “Supply, Distribution and Migration of Physicians in Canada, 2022 — Methodology Notes”.
- K. Kwok, N. Samson, C. M. Doll, L. Barbera, and S. K. Loewen, “Representation of Women in Canadian Radiation Oncology Trainees and Radiation Oncologists: Progress or Regress?,” Adv. Radiat. Oncol., vol. 7, no. 6, Nov. 2022. [CrossRef]
- S. K. Loewen et al., “National Trends and Dynamic Responses in the Canadian Radiation Oncology Workforce From 1990 to 2018,” Int. J. Radiat. Oncol. Biol. Phys., vol. 105, no. 1, pp. 31–41, Sep. 2019. [CrossRef]
- Pickel and N. Sivachandran, “Gender trends in Canadian medicine and surgery: the past 30 years,” BMC Med. Educ., vol. 24, no. 1, p. 100, Jan. 2024. [CrossRef]
- H. Chapman, W.-T. Hwang, and C. Deville, “Diversity based on race, ethnicity, and sex, of the US radiation oncology physician workforce,” Int. J. Radiat. Oncol. Biol. Phys., vol. 85, no. 4, pp. 912–918, Mar. 2013. [CrossRef]
- A. Suzuki et al., “Gender Equity and Workplace Mistreatment in Oncology: Results From a Survey by the Brazilian Society of Clinical Oncology,” JCO Glob. Oncol., no. 11, p. e2400323, Apr. 2025. [CrossRef]
- “Black medical students accepted to class of 2024 are largest contingent in Canadian history,” The Varsity. Accessed: Apr. 17, 2025. [Online]. Available: https://thevarsity.ca/2020/06/24/black-medical-students-accepted-to-class-of-2024-are-largest-contingent-in-canadian-history/.
- S. C. Government of Canada, “More than half of Canada’s Black population calls Ontario home.” Accessed: Apr. 17, 2025. [Online]. Available: https://www.statcan.gc.ca/o1/en/plus/441-more-half-canadas-black-population-calls-ontario-home.
- K. R. G. Hendrickson et al., “2021 AAPM Equity, Diversity, and Inclusion Climate Survey Executive Summary,” Int. J. Radiat. Oncol. Biol. Phys., vol. 116, no. 2, pp. 295–304, Jun. 2023. [CrossRef]
- M.-A. Valfort, “Do anti-discrimination policies work?,” IZA World Labor, May 2018. [CrossRef]
- E. Tankard and E. L. Paluck, “The Effect of a Supreme Court Decision Regarding Gay Marriage on Social Norms and Personal Attitudes,” Psychol. Sci., vol. 28, no. 9, pp. 1334–1344, Sep. 2017. [CrossRef]
- Broockman and J. Kalla, “Durably reducing transphobia: A field experiment on door-to-door canvassing,” Science, vol. 352, no. 6282, pp. 220–224, Apr. 2016. [CrossRef]
- Narayan, “The limits of using grievance procedures to combat workplace discrimination,” Ind. Relat. J. Econ. Soc., vol. 63, no. 1, pp. 26–42, 2024. [CrossRef]
- K. C. Paradis et al., “Gender-Based Discrimination and Sexual Harassment in Medical Physics,” Int. J. Radiat. Oncol. Biol. Phys., vol. 116, no. 2, pp. 314–327, Jun. 2023. [CrossRef]
- N. Chary, M. O. Fofana, and H. S. Kohli, “Racial Discrimination from Patients: Institutional Strategies to Establish Respectful Emergency Department Environments,” West. J. Emerg. Med., vol. 22, no. 4, pp. 898–902, Jul. 2021. [CrossRef]
Figure 1.
Flowchart of survey responses.
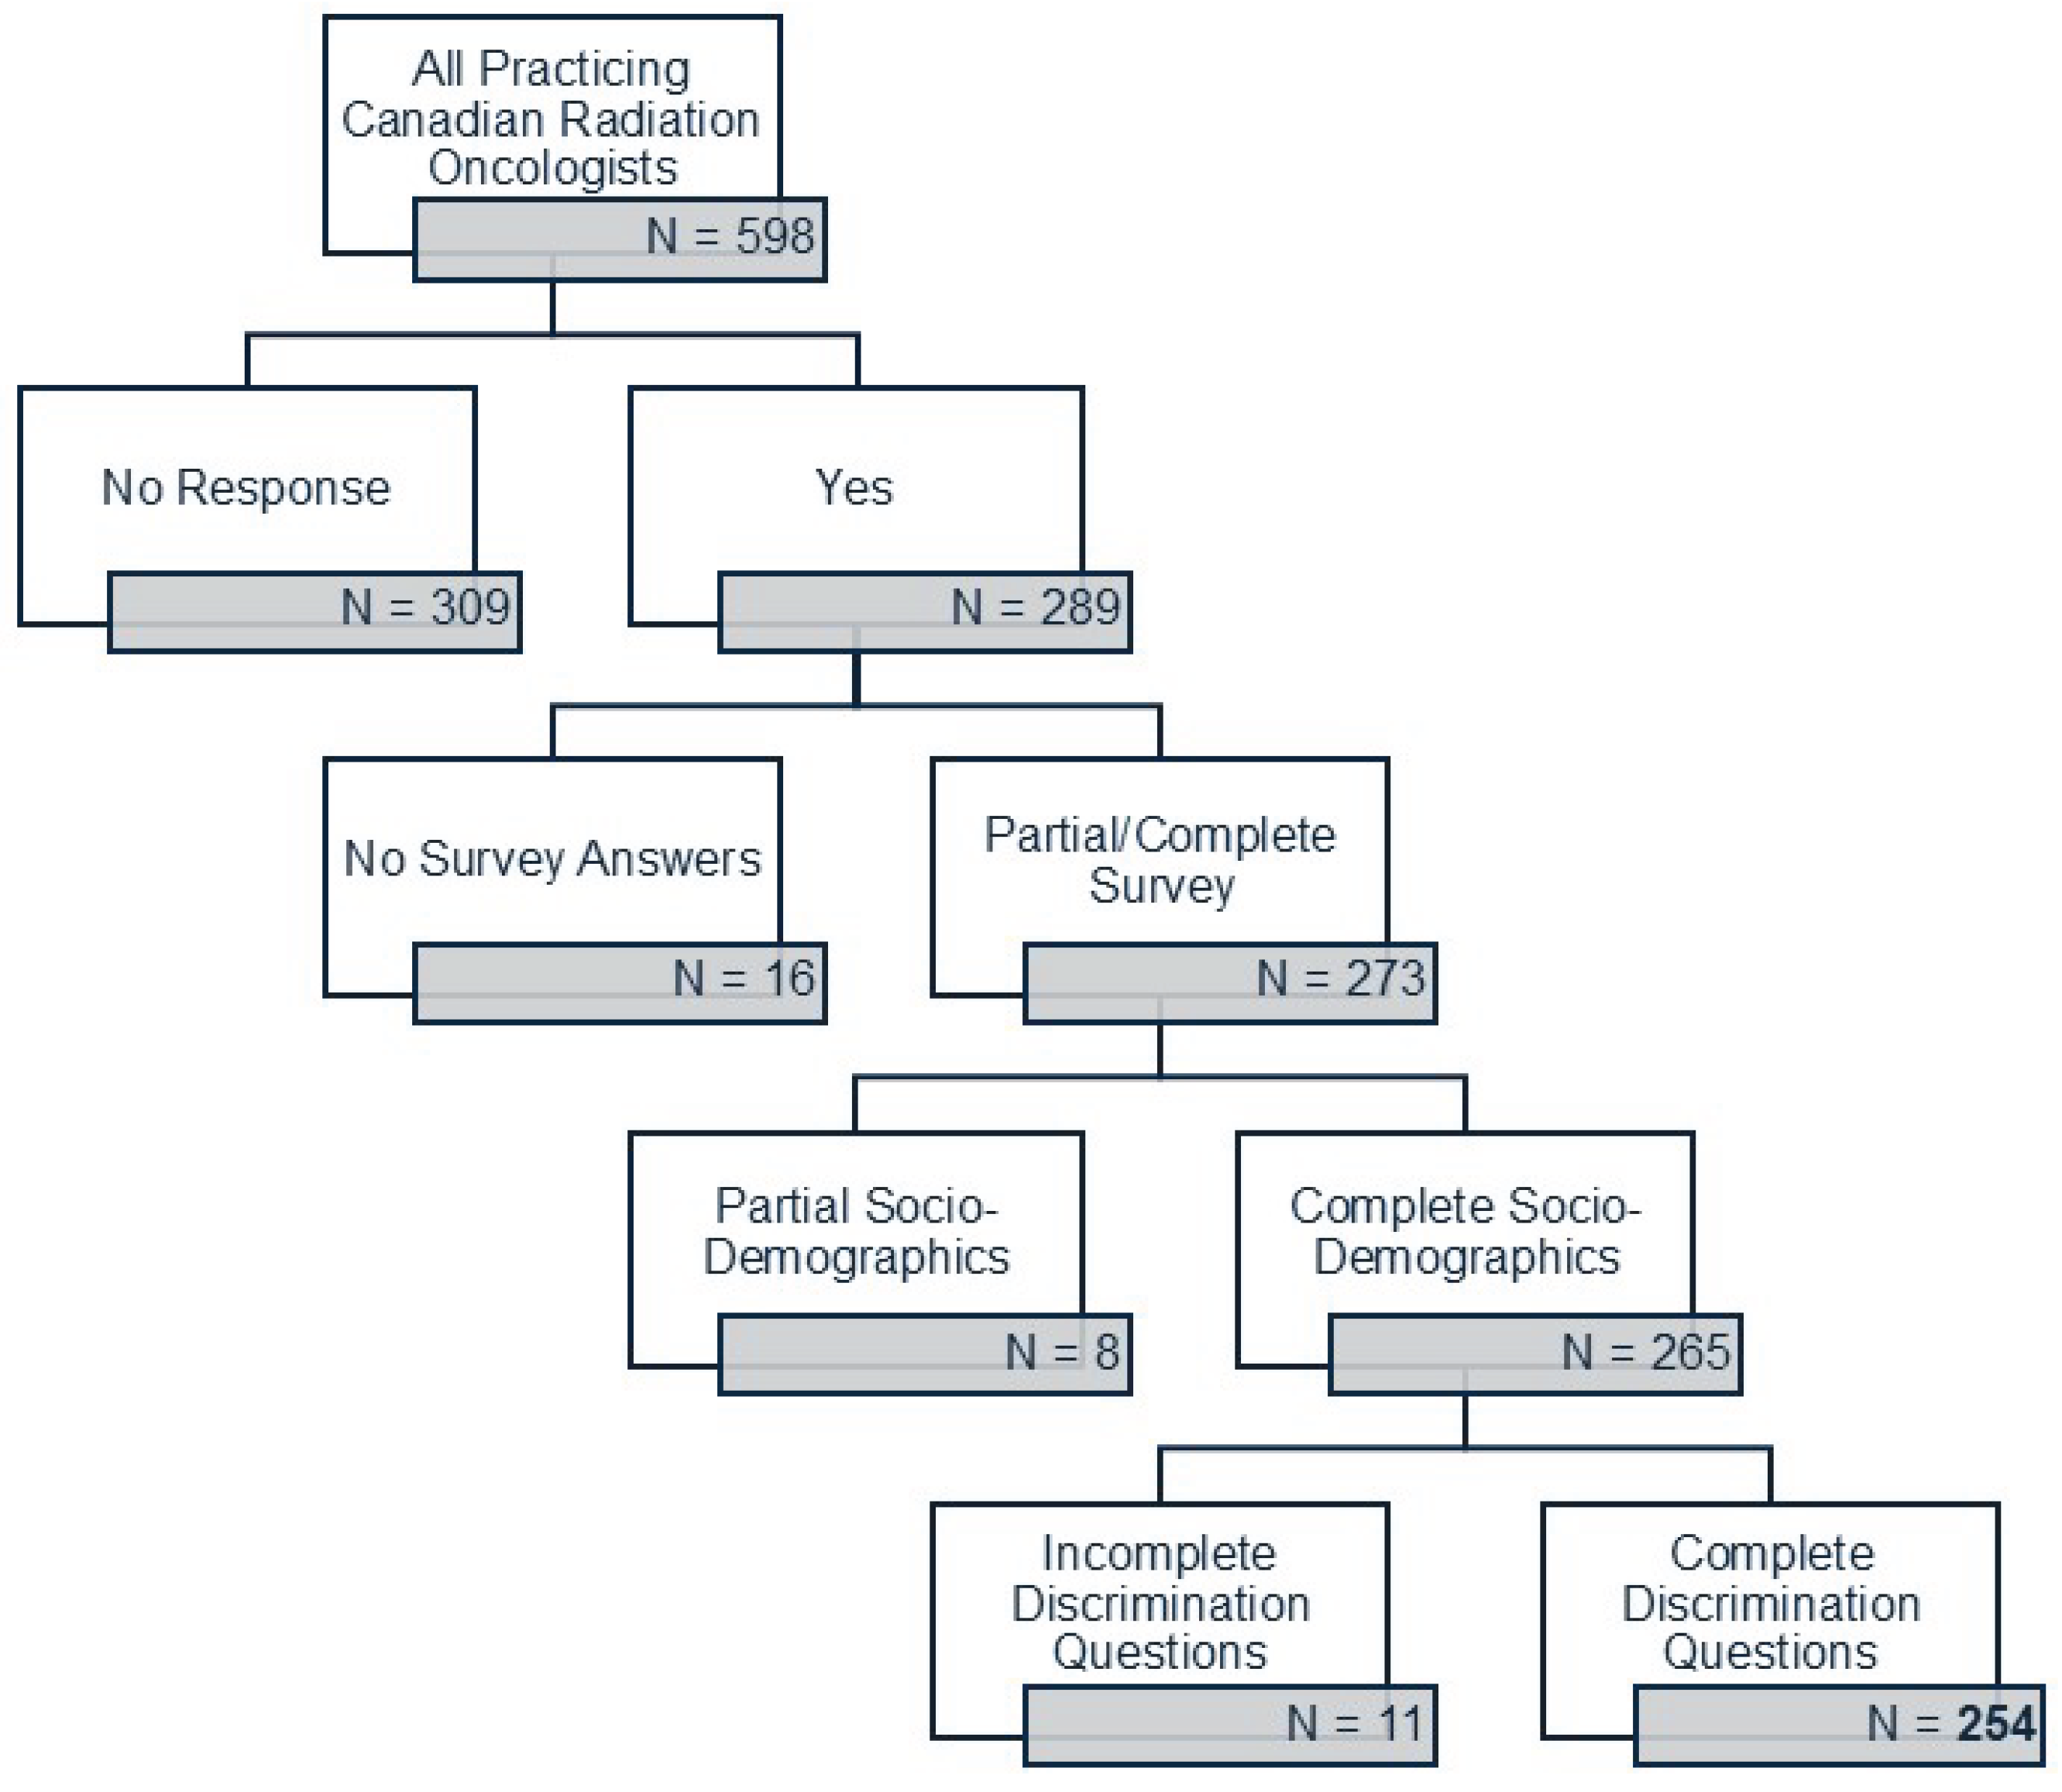
Figure 2.
Radiation oncology staff representation by race and gender.
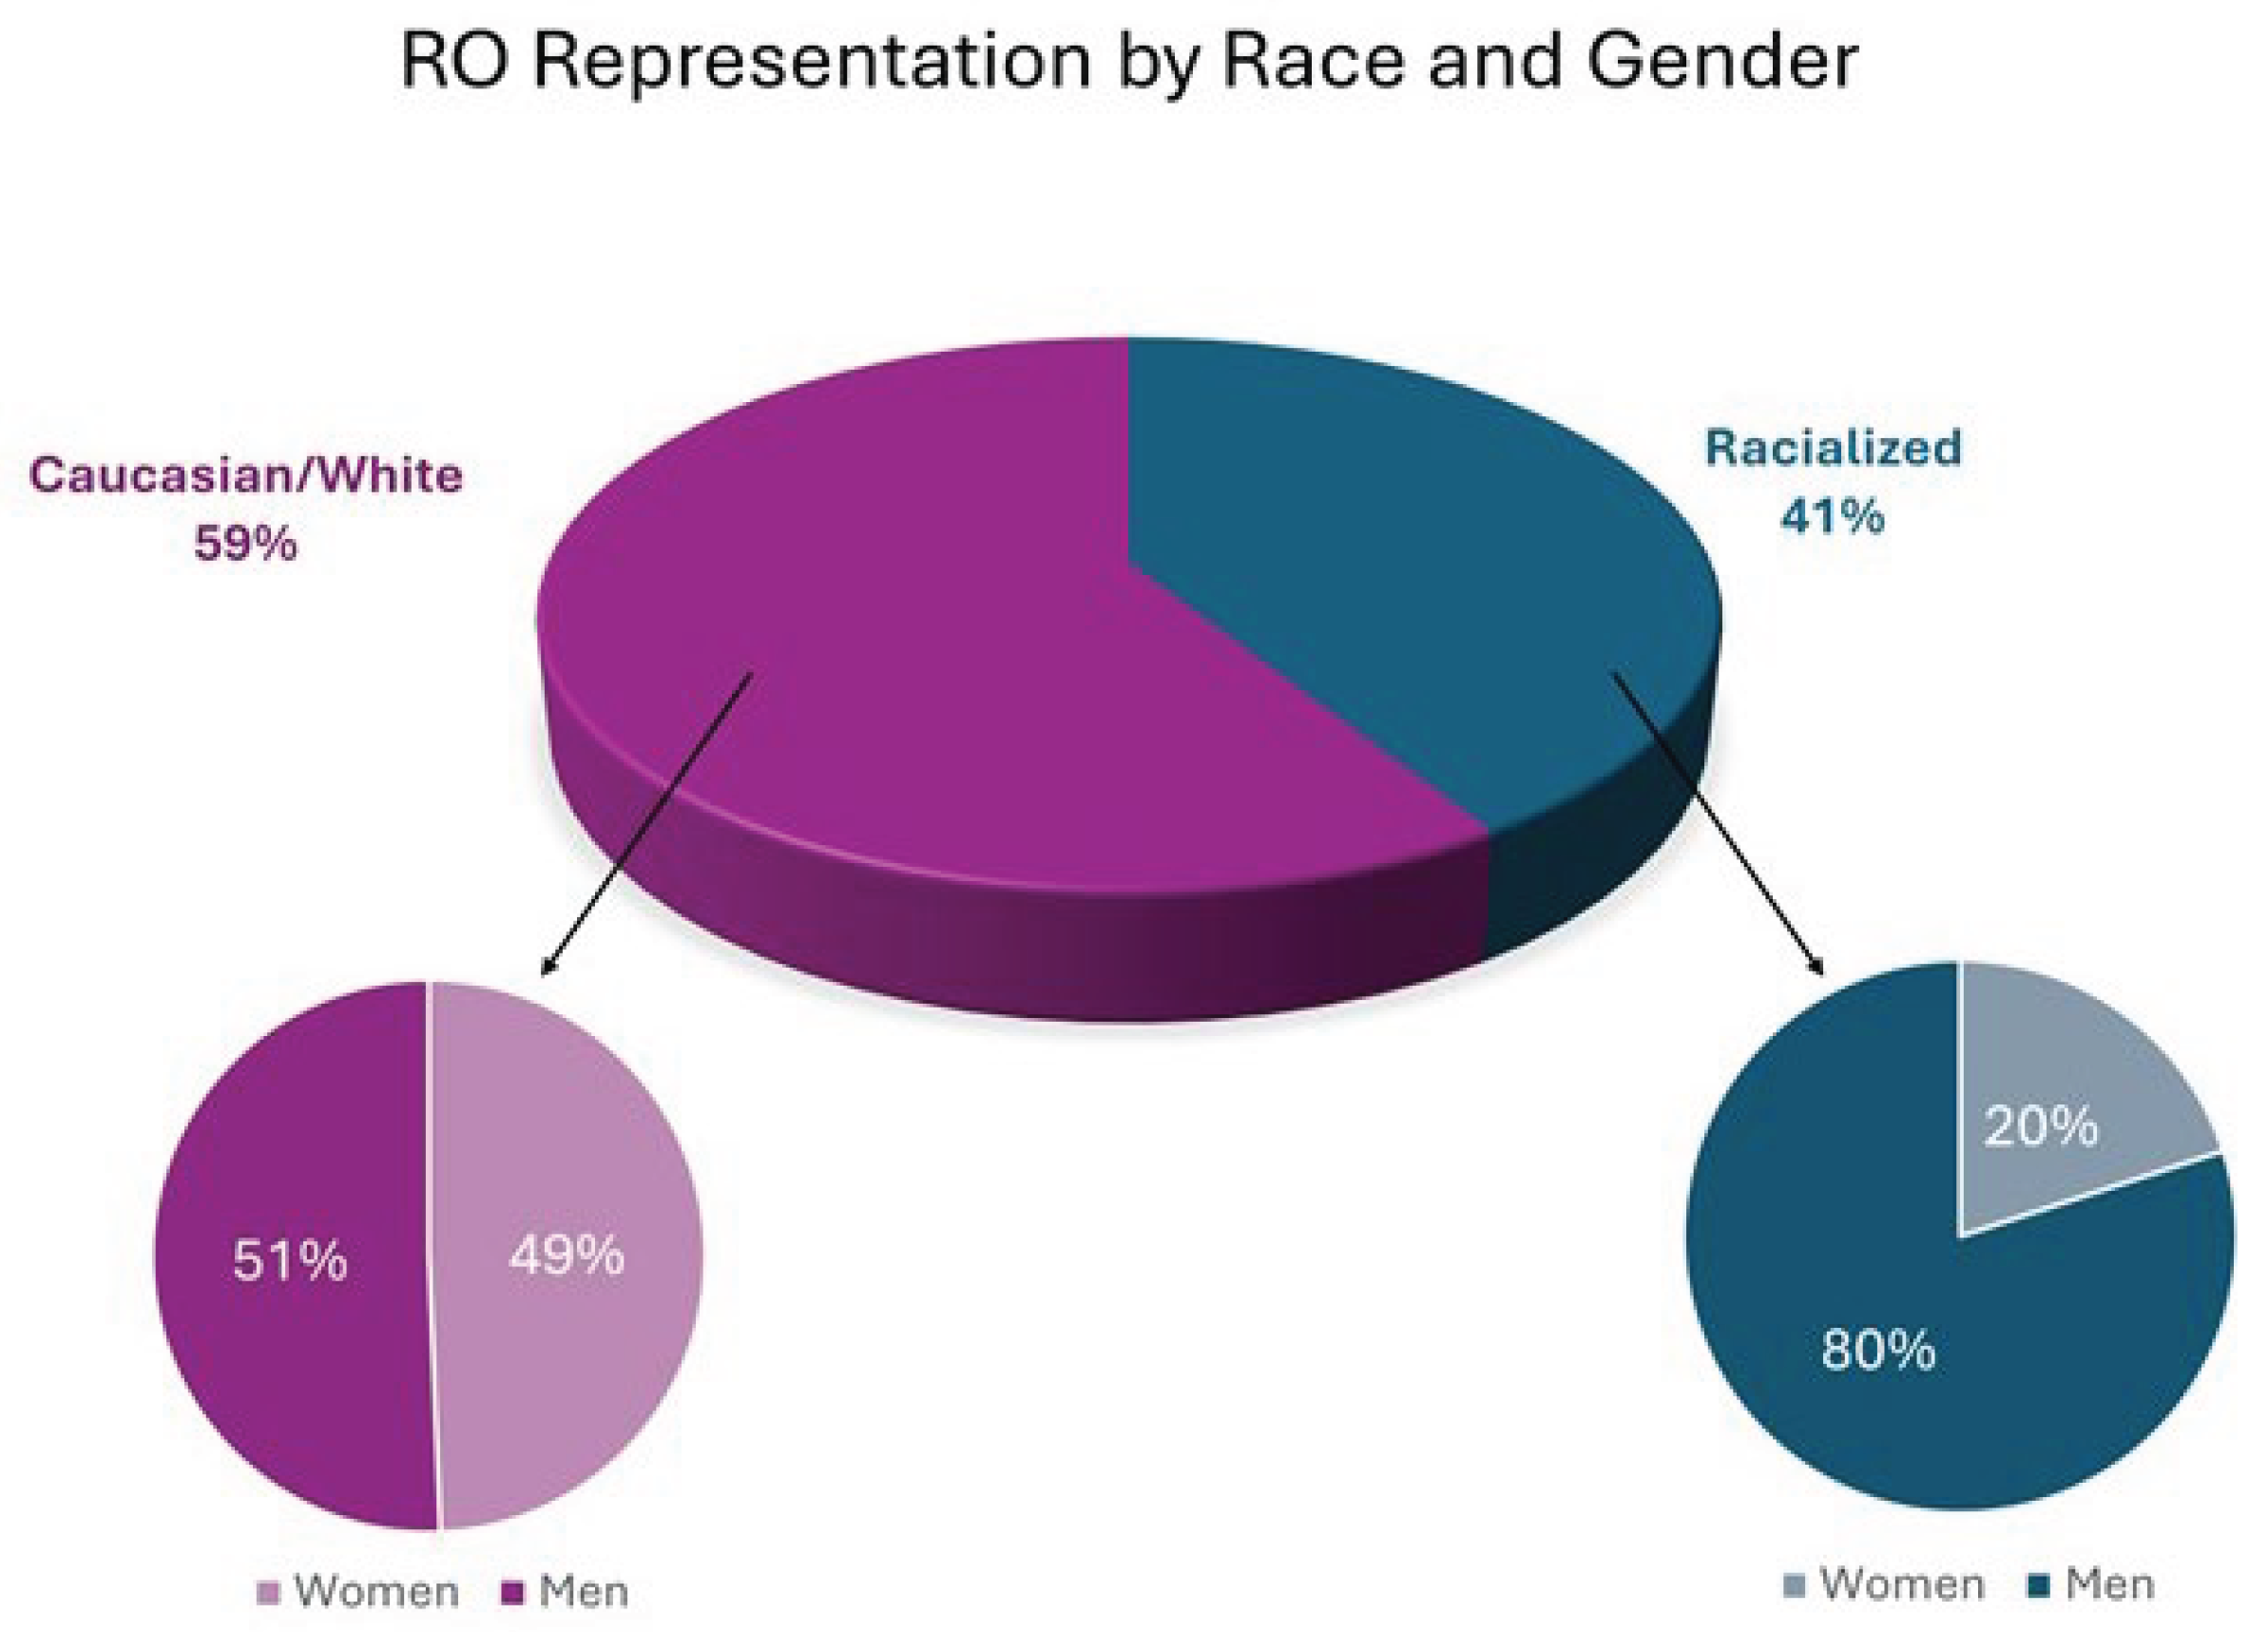
Table 1.
Demographic data of respondents to the survey. Italic font signifies significant statistical findings.
Table 1.
Demographic data of respondents to the survey. Italic font signifies significant statistical findings.
| Demographic category (number of respondents) | Demographic characteristic | Survey – RO data | 2022 CIHI data - RO population1 | 2021 Census data2 | Significance/Notes |
|---|---|---|---|---|---|
|
Gender Identity (267) |
Man Woman |
168 (63%) 99 (37%) |
380 (64%) 218 (36%) |
12.9m (48%) 13.8m (52%) |
|
|
Age (273) |
25-34 35-44 45-54 55-64 65+ |
15 (5%) 107 (39%) 82 (30%) 47 (17%) 22 (8%) |
- |
4.4m (22%) 4.4m (22%) 4.0m (20%) 3.3m (16%) .95m (4%) |
Census data only included for working persons, not the general population |
|
Sexual Orientation (Multiselect, 261) |
Heterosexual Gay Bisexual Asexual Queer Pansexual Questioning |
246 (94%) 10 (4%) 4 (2%) 1 (<1%) 0 0 0 |
- | - | |
|
Race/Ethnicity (Multiselect, 255) |
Caucasian/White Racialized Group Chinese South Asian4 Black Southeast Asian5 First Nations Pooled Others |
150 (59%) 105 (41%) 39 (15%) 31 (12%) 5 (2%) 4 (1%) 1 (<1%) 25 (10%) |
- |
25m (70%) 9.6m (27%) 1.7m (5%) 2.5m (7%) 1.5m (4%) 1.3m (4%) 1.8m (5%) 2.5m (7%) |
|
| Race and Gender – Subset Analysis | Caucasian Overall Caucasian Male RO Caucasian Female RO |
150 (59%) 76 (51%) 74 (49%) |
- |
25m (70%) 9.6m (27%) |
Chi-squared for Caucasian women vs racialized women = 22.7, p<0.001 |
| Racialized Overall Racialized Male RO Racialized Female RO |
105 (41%) 84 (80%) 21 (20%) |
||||
|
Religion (Multiselect, 264) |
Christianity Atheist/No religion Hinduism Islam Spiritual Judaism Buddhism Sikhism Other |
107 (41%) 106 (40%) 12 (5%) 11 (4%) 11 (4%) 11 (4%) 3 (1%) 1 (<1%) 2 (<1%) |
- |
19.3m (53%) 12.6m (34%) .83m (2%) 1.7m (5%) 80k (<1%) .36m (1%) .34m (1%) .77m (2%) 229k (<1%) |
|
|
Are you identifiable as a member of a religion? (262) |
Definitely yes Probably yes Probably no Definitely no Not sure |
17 (6%) 23 (9%) 75 (29%) 133 (51%) 14 (5%) |
- |
- |
|
|
What religion would people assume you belong to? (Multiselect, 252) |
Christianity Hinduism Buddhism Islam Judaism Confucianism Sikhism Atheist/Agnostic |
159 (63%) 20 (8%) 19 (8%) 19 (8%) 18 (7%) 8 (3%) 5 (2%) 3 (1%) |
- |
- |
|
|
Geography (265) |
Ontario Manitoba and West Quebec Maritimes |
95 (36%) 85 (32%) 68 (26%) 17 (6%) |
233 (39%) 179 (30%) 143 (24%) 43 (7%) |
10.3m (38%) 8.4m (31%) 6.2m (23%) 2.0m (8%) |
|
|
Citizenship Status (265) |
Canadian *By birth *By immigration PR Work Visa |
255 (96%) 178 (67%) 77 (29%) 6 (2%) 4 (1%) |
- |
33.1m (91%) 27m (74%) 6.1m (17%) - - |
|
|
Marital Status (267) |
Married/Domestic Single Widowed Divorced/Separated |
228 (85%) 26 (10%) 4 (1%) 9 (3%) |
- |
4.9m (57%) 3.7m (43%) - - |
|
|
How many dependents do you have? (273) |
0 1 2 3+ |
78 (29%) 42 (15%) 79 (29%) 74 (27%) |
- | - | |
|
Primary language (264) |
English French Another language |
157 (59%) 54 (20%) 53 (20%) |
- | 27.8m (76%) 8m (22%) .67m (2%) |
|
|
Degrees earned (Multiselect, 273) |
MD Masters PhD MBA JD |
273 (100%) 89 (33%) 32 (12%) 10 (4%) 2 (1%) |
- | - | |
|
Where MD was obtained (273) |
Canada International |
220 (81%) 53 (19%) |
454 (76%) 144 (24%) |
- |
|
|
Residency Training Location (273) |
Canada Elsewhere |
239 (88%) 34 (12%) |
- |
- |
|
|
Years of Practice (273) |
<5 6-10 11-15 16-20 21-25 26+ |
41 (15%) 58 (21%) 66 (24%) 24 (9%) 37 (14%) 47 (17%) |
- | - | |
|
Academic Rank (273) |
Assistant Professor Associate Full Professor Lecturer No Appointment |
110 (40%) 81 (30%) 41 (15%) 25 (9%) 16 (6%) |
- | - | |
|
How large is your practice group? (273) |
1-5 6-10 11-20 21-30 30+ |
16 (6%) 41 (15%) 113 (41%) 68 (25%) 35 (13%) |
- | - | |
|
Do parents have a degree(s)? (273) |
One Both Neither No answer |
57 (21%) 117 (43%) 94 (34%) 5 (2%) |
- | - | |
|
Income when growing up (235) |
$150,000 + $100,000-$150,000 $50,000-$100,000 $25,000-$50,000 < $25,000 I don’t know No answer |
54 (23%) 38 (16%) 76 (32%) 28 (12%) 21 (9%) 3 (1%) 15 (6%) |
- | - | |
|
How many peer-reviewed publications have you been an author on? (260) |
<5 5-10 10-25 25-50 50-100 >100 |
59 (23%) 49 (19%) 52 (20%) 40 (15%) 26 (10%) 34 (13%) |
- | - | |
|
Do you view yourself as having a disability? (270) |
Yes No Prefer not to answer |
10 (4%) 256 (95%) 4 (1%) |
- | 27%3 73% N/A |
|
|
What is your disability? (multi-select, 16) |
Deaf/hearing Mobility/physical Mental health Autism Cognitive Chronic illness Speech Other |
3 (19%) 3 (19%) 3 (19%) 2 (13%) 1 (6%) 1 (6%) 1 (6%) 2 (13%) |
- | - |
1: Canadian Institute for Health Information. Supply, Distribution and Migration of Physicians in Canada, 2022 — Data Tables. Ottawa, ON: CIHI; 2023. https://www.cihi.ca/en/scotts-medical-database-metadata; 2: Statistics Canda – Data Tables for the 2021 Census of Population. Ottawa, ON, 2021. https://www12.statcan.gc.ca/census-recensement/2021/dp-pd/dt-td/index-eng.cfm; 3: Statistics Canda – Data Tables for the 2022 Canadian Survey on Disability. Ottawa, ON, 2022. https://www23.statcan.gc.ca/imdb/p2SV.pl?Function=getSurvey&SDDS=3251; 4. Comprised of persons from Indian, Bangladesh, Pakistan, Sri Lanka, Nepal, Bhutan and Maldives and can include peoples of South Asian ancestry who historically immigrated to places like Trinidad and Tobago, Guyana and East/South Africa; 5. Comprised of persons from Cambodia, Indonesia, Lao, Malaysia, Singapore, Thailand and Vietnam.
Table 2.
Career satisfaction and mentorship status of respondents to the survey.
| Question (Number of Respondents) | Study Sample | Significance/Notes | |
|---|---|---|---|
|
"All in all, I feel satisfied with my job” (248) |
Strongly disagree Disagree Neither agree nor disagree Agree Strongly agree |
14 (6%) 16 (6%) 31 (13%) 114 (46%) 73 (29%) |
|
|
"All in all, I feel satisfied with my job” – Subset Analysis by gender of those picking “Disagree” or “Strongly Disagree” (30, percentage is of overall gender) |
Male Female |
22 (13%) 8 (8%) |
Chi-squared comparing gender vs satisfaction = 1.745, p=0.18 |
|
"All in all, I feel satisfied with my job” – Subset Analysis by race of those picking “Disagree” or “Strongly Disagree” (30, percentage is of overall race) |
Caucasian/White Racialized |
12 (8%) 18 (17%) |
Chi-squared comparing race vs satisfaction = 4.563, p<0.03 |
|
How often have you thought about moving to a different institution? (262) |
Never Once or twice Sometimes Often Very often |
51 (19%) 83 (32%) 87 (33%) 23 (9%) 18 (7%) |
|
|
How often have you felt regret about deciding to become a physician? (262) |
Never Once or twice Sometimes Often Very often |
131 (50%) 50 (19%) 57 (22%) 16 (6%) 8 (3%) |
|
|
A formal mentorship program exists within my department (260) |
Yes No |
107 (41%) 153 (59%) |
|
|
I currently act as a mentor to a trainee(s) and/or colleague(s) (260) |
Yes, trainee(s) Yes, colleague(s) Yes, trainee(s) and colleague(s) No |
62 (24%) 22 (8%) 35 (13%) 143 (55%) |
|
|
I currently have at least one mentor (258) |
Yes No |
64 (25%) 194 (75%) |
|
|
I currently have at least one mentor – Subset Analysis by gender for “No” responses (194, percentage is of overall gender) |
Male Female |
123 (73%) 71 (72%) |
|
|
I currently have at least one mentor – Subset Analysis by race for “No” responses (194, percentage is of overall race) |
Caucasian/White Racialized |
115 (77%) 79 (75%) |
|
|
It is important I have a mentor with similar demographic characteristics to me (260) |
Strongly disagree Disagree Neither agree nor disagree Agree Strongly agree |
33 (13%) 65 (25%) 116 (45%) 40 (15%) 6 (2%) |
|
Table 3.
Workplace culture, discrimination, and harassment experience of respondents to the survey.
| Question (Number of Respondents) | Study Sample | Significance/Notes | |
|---|---|---|---|
|
Thinking about the past year, how would you rate the culture of respect in your department? (263) |
Excellent Very good Good Adequate Poor Very Poor |
59 (22%) 87 (33%) 54 (21%) 33 (13%) 20 (8%) 10 (4%) |
|
|
How often did you feel that you experienced discrimination in the past 5 years while working as a radiation oncologist? (252) |
Never Once 2 - 4 times 5 - 10 times Regularly/ongoing basis |
146 (58%) 8 (3%) 54 (21%) 25 (10%) 19 (8%) |
|
|
In the past 5 years as an RO on what basis have you felt discriminated upon? (Multiselect, 201) |
Gender Race/ethnicity Age Pregnancy / caregiving National origin Marital status Level of education Political view Disability Religion Language Sexual orientation Socioeconomic status Lack of research interest Seniority IMG status Caring for elderly parents Travelling during Covid Lack of children Medical specialty |
52 (26%) 41 (20%) 31 (15%) 19 (9%) 13 (6%) 8 (4%) 7 (3%) 6 (3%) 4 (2%) 4 (2%) 5 (2%) 3 (1%) 1 (<1%) 1 (<1%) 1 (<1%) 1 (<1%) 1 (<1%) 1 (<1%) 1 (<1%) 1 (<1%) |
|
|
What was the role of the person(s) who discriminated against you? (Multiselect, 183) |
Faculty member Patient / Patient’s family Staff (administrative, non-faculty) Other allied health professional Nurse Resident / Clinical Fellow Funding agencies |
58 (32%) 58 (32%) 25 (14%) 19 (10%) 16 (9%) 6 (3%) 1 (<1%) |
|
|
Was the person who discriminated against you someone in a position to directly affect your academic, and/or professional opportunities? (251) |
Yes No Not sure Does not apply No answer |
48 (19%) 52 (21%) 7 (3%) 138 (55%) 6 (2%) |
|
|
If you experienced harassment/discrimination perpetrated by a patient/family at any time during your career, on what basis did they discriminate against you? (Multiselect, 120) |
Race/ethnicity Gender Age National origin Other Sexual orientation Disability Religion |
43 (36%) 29 (24%) 27 (23%) 10 (8%) 8 (7%) 1 (<1%) 1 (<1%) 1 (<1%) |
Chi-squared comparing sources of discrimination by gender = 39.2, p<0.0001 |
|
Women and Reported Discrimination Reasons - Subset Analysis (Multiselect, 52) |
Gender Age Pregnancy/Caregiver Responsibilities Race/ethnicity Marital Status Other |
44 (85%) 24 (46%) 14 (27%) 12 (23%) 7 (13%) 5 (10%) |
|
|
Men and Reported Discrimination Reasons - Subset Analysis (Multiselect, 47) |
Race/ethnicity Age Gender Childcare/Caregiver Responsibilities Marital Status Other |
30 (64%) 9 (19%) 7 (15%) 4 (8.5%) 1 (2%) 14 (30%) |
|
| Ethnicity and Reporting at Least One Type of Discrimination - Subset Analysis | White Racialized |
44/149 (30%) 67/111 (60%) |
Chi-squared = 24.713, p<0.001 |
|
"I understand how to and feel comfortable reporting harassment incidents at my workplace“ (252) |
Strongly disagree Somewhat disagree Neither agree/disagree Somewhat agree Strongly agree |
39 (15%) 75 (30%) 44 (17%) 66 (26%) 28 (11%) |
|
|
I have training regarding sexual harassment (multiselect, 276) |
No training In person Online module Review of institutional policy |
68 (25%) 10 (4%) 149 (54%) 49 (18%) |
|
|
I have training regarding racism (multiselect, 266) |
No training In person Online module Review of institutional policy |
82 (31%) 9 (3%) 127 (48%) 48 (18%) |
|
|
I have training regarding LGBTQ2+ peoples (multiselect, 271) |
No training In person Online Review of institutional policy |
119 (44%) 10 (4%) 95 (35%) 47 (17%) |
|
|
I have training regarding Aboriginal/Indigenous health (multiselect, 286) |
No training In person Online module Review of institutional policy |
50 (17%) 26 (9%) 164 (57%) 46 (16%) |
|
|
I have training regarding learner mistreatment (multiselect, 278) |
No training In person Online module Review of institutional policy |
99 (36%) 23 (8%) 105 (38%) 51 (18%) |
|
|
I have training regarding equity, diversity and inclusion (multiselect, 282) |
No training In person Online module Review of institutional policy |
69 (24%) 18 (6%) 145 (51%) 50 (18%) |
|
Disclaimer/Publisher’s Note: The statements, opinions and data contained in all publications are solely those of the individual author(s) and contributor(s) and not of MDPI and/or the editor(s). MDPI and/or the editor(s) disclaim responsibility for any injury to people or property resulting from any ideas, methods, instructions or products referred to in the content. |
© 2025 by the authors. Licensee MDPI, Basel, Switzerland. This article is an open access article distributed under the terms and conditions of the Creative Commons Attribution (CC BY) license (http://creativecommons.org/licenses/by/4.0/).
Copyright: This open access article is published under a Creative Commons CC BY 4.0 license, which permit the free download, distribution, and reuse, provided that the author and preprint are cited in any reuse.


