Submitted:
23 September 2025
Posted:
24 September 2025
You are already at the latest version
Abstract
Plants exposed to combined abiotic and biotic stresses often show complex physiological responses that cannot be predicted from single stress factors. This study examined the interactive effects of temperature stress and Erwinia amylovora infection on pear (Pyrus pyrifolia) leaves using chlorophyll fluorescence analysis and RGB imaging. Photosynthetic performance remained stable under temperature stress alone at 25℃, while pathogen inoculation reduced chlorophyll content and impaired PSII energy dissipation. Disease progression, assessed by the area under the disease progress curve (AUDPC), peaked at 25℃, followed by 30℃, 15℃, 10℃, and 35℃. Distinct PSII responses were observed under combined stresses: photoprotective NPQ activity at 10 ℃, partial efficiency loss at 15 ℃, severe impairment with elevated non-regulated energy dissipation (ФNO) at 25℃, enhanced oxidative damage at 30℃, and suppressed pathogen activity with partial photoprotection at 35℃. Linear mixed-effects modeling confirmed significant main effects of temperature and infection on PSII parameters, with ФNO particularly sensitive, while three-way interactions (T:I:D) in Fm, Fv, and Fp highlighted the interdependent impact of combined stresses. These findings reveal temperature-dependent resilience strategies of pear leaves against fire blight and underscore the value of chlorophyll fluorescence for assessing tolerance mechanisms and informing cultivar selection and disease management in complex stress environments.
Keywords:
temperature
; Erwinia amylovora
; combined stress
; chlorophyll fluorescence
; linear mixed model (LMM)
1. Introduction
Plants are increasingly exposed to complex environmental conditions due to simultaneous exposure to heterogeneous abiotic factors, such as extreme temperature fluctuations, drought or waterlogging, and nutrient imbalances in soil as well as biotic factors, e.g., pathogens and pests [1,2]. As illustrated in Figure 1, plant diseases develop when three key factors—host, pathogen, and environment—interact together under favorable conditions [3]. The interactions between biotic and abiotic stressors and their impact on the plant host lead to changes in primary metabolism that affect phytosynthetic performance, growth, and development as well as alterations in secondary metabolism that induce defense mechanisms [4].
Fire blight, caused by the Gram-negative bacterium Erwinia amylovora (E. amylovora), is one of the destructive diseases of pear tree (Pyrus spp.) and other Rosaceae species [5]. Temperature has been identified as a critical environmental factor that influences the activity of E. amylovora [6]. The pathogen E. amylovora can grow within a wide temperature range of 4℃ to 37℃, with an optimal growth range between 25℃ and 28℃ [7,8]. While numerous studies have investigated plant responses to abiotic or biotic stresses individually, the physiological responses of pear to E. amylovora infection under different temperature regimes remain poorly understood. Climate change is expected to increase the frequency of temperature fluctuations that can affect pathogen dynamics, disease progression, and host resistance, making the physiological differences exhibited by plants when infected by pathogens under diverse temperature environments crucial [9,10].
Meanwhile, photosynthesis is essential for plant survival and growth, with photosystem II (PSII) playing a central role in photosynthetic electron transport. In recent years, chlorophyll fluorescence analysis has emerged as a rapid and non-destructive tool for assessing PSII activity and detecting stress responses. Because a decline in PSII photochemical efficiency is directly linked to reduced photosynthetic performance, chlorophyll fluorescence parameters are highly effective for the early diagnosis of PSII impairment [11,12,13,14]. Abiotic stresses, such as heat or cold, can inhibit photosynthetic enzymes and electron transport, while biotic stresses, such as pathogen invasion, reduce chlorophyll content and impair electron transport by damaging chloroplast structure [15,16,17,18]. Although chlorophyll fluorescence has been widely used to evaluate the effects of individual stress factors, few studies have applied this approach to examine the combined impacts of abiotic and biotic stresses on plant photophysiology [19,20,21,22,23].
Moreover, such interactions involve complex relationships that cannot be fully captured by analyzing only the main effects, making it essential to clearly identify cross-effects among multiple factors [24]. The linear mixed-effects model (LMM) accounts for both fixed effects (main factors) and random effects (variability among samples). This approach enables the modeling of interactions among temperature, pathogen infection, and time, thereby allowing a quantitative evaluation of not only the main effects but also their interactions. Furthermore, because LMM can incorporate time-series responses of plants, it can account for both temporal correlations in repeated measurements and variability among individual plants [25,26,27,28].
Taken together, this study aims to assess fire blight progression and photosynthetic performance in pear leaves under combined abiotic and biotic stress. In this context, RGB imaging was employed to monitor pathogen activity across temperature treatments, followed by chlorophyll fluorescence analysis and linear mixed-effects modeling to determine the key factors and interactions influencing physiological responses.
2. Materials and Methods
2.1. Sample Preparation and Treatments
Leaf samples were collected from healthy, 20-year-old pear trees (Pyrus pyrifolia cv. Shingo) grown at the Hankyong National University Experimental Farm (37°00′46″N, 127°19′20″E). Fully grown leaves from the current season’s shoots were selected, and uniform leaf discs (2.5 cm in diameter) containing the midrib were prepared using a hole punch. The E. amylovora strain, obtained with permission from the Rural Development Administration, was cultured on tryptic soy agar (TSA) medium at 30℃ for 48 hours and then suspended in sterile water at a concentration of 1 × 10⁸ CFU mL⁻¹. For inoculation, the leaf discs were immersed in the bacterial suspension for 5 minutes. For each treatment condition, a minimum of three independent biological replicates (leaf discs derived from different trees) were prepared. After inoculation, the discs were placed in square dishes lined with tissue paper soaked in sterile water to maintain humidity and stored in a plant growth room. For single stress treatments, healthy (non-infected) leaf discs were incubated at 10℃, 15℃, 25℃, 30℃, and 35℃. For combined stress treatments, inoculated leaf discs were exposed to the same temperature conditions to simultaneously experience temperature and pathogen stress. To prevent cross-contamination of pathogens, each treatment was maintained in a separate growth chamber. All growth chambers (HB-303D, Hanbaek, Republic of Korea) were set to a 12-hour light/12-hour dark photoperiod.
2.2. Disease Assessment
2.2.1. Image Capture and Analysis
Disease severity was assessed by capturing RGB (red, green, blue) images of inoculated leaf discs at different temperatures. Images were taken using a digital camera (ILCE-7, Sony, Japan) inside a photo box (RM-PB4840, RAMI, Republic of Korea) at a fixed distance of 40 cm from the sample. The images were analyzed using the “FIELDimageR” package in R (version 4.3.2) to calculate the proportion of darkened tissue, a typical symptom of fire blight infection [29], as shown in Equation (1).
Lesion Area (%) =
(Total lesion pixels in leaf disc / Total pixels in leaf disc) × 100.
2.2.2. Disease Progression Analysis
For each treatment, multiple leaf discs were sampled per Plant at each time point. Because different discs were used at different dates, we first averaged the lesion area values of replicate discs within each plant × date combination. This yielded one plant-level mean lesion area per sampling time. Based on these plant-level lesion area time series, we calculated the area under the disease progress curve (AUDPC) for each Plant using the trapezoidal rule (Equation 2) [30].
= mean lesion area(%) at the ith observation,
= time (days after inoculation) at the ith observation,
= total number of observations.
The resulting plant-level AUDPC values were then treated as independent replicates in statistical analyses. Standard errors (SE) and 95% confidence intervals (CI) were computed across plants within each temperature treatment group.
2.3. Measurement of Chlorophyll Fluorescence Response
Chlorophyll fluorescence analysis is a simple, rapid, and non-destructive technique widely used to assess photosynthetic performance under stress conditions by estimating PSII efficiency [31]. In this study, chlorophyll fluorescence was measured using a Closed FluorCam system (Photon Systems Instruments, Drásov, Czech Republic). Prior to measurements, leaf discs from each treatment group were dark-adapted for 30 minutes. Chlorophyll fluorescence induction curves were then recorded using quenching kinetics analysis to evaluate PSII activity [32,33]. Measurements were performed under controlled room temperature (25℃) using an integrated red–blue actinic LED light source. The measuring light was set to 200 µmol m⁻² s⁻¹, and the continuous actinic light was set to 1,250 µmol m⁻² s⁻¹.
For each treatment condition, chlorophyll fluorescence was recorded from at least three independent biological replicates (leaf discs collected from different trees). Measurements were performed at 1, 3, 5, and 7 days after treatment (DAT) for both inoculated and non-inoculated samples. Raw fluorescence parameters were extracted using FluorCam software (Fluorcam 7, version 1.5.0.46), and parameter values were obtained using the manual acquisition function of the software.
The parameters analyzed are listed in Table 1. These include minimum fluorescence (Fo), maximal fluorescence (Fm), and variable fluorescence (Fv), which reflect the structural integrity and excitation potential of PSII. In addition, indices of maximum photochemical efficiency (Fv/Fm), operating efficiency (ФPSII), and non-photochemical dissipation (NPQ), as well as photochemical quenching coefficients (qP, qL), were evaluated. These parameters were chosen as they represent widely accepted indicators of PSII stability, electron transport efficiency, and photoprotective capacity [11,34].
2.5. Data Analysis
2.5.1. Statistical Tests for Single Stress Treatments
To assess the significance of chlorophyll fluorescence parameters under temperature stress treatments (10, 15, 25, 30, and 35℃), one-way ANOVA was performed with three biological replicates (n ≥ 3), followed by Duncan’s multiple range test for post-hoc comparisons. For pathogen stress treatments (non-infected, infected), a t-test was used. All statistical analyses were performed using R software (version 4.3.2) [35].
2.5.2. Linear Mixed Effects Model (LMM)
To analyze the main effects of stressors and their interactions under combined stress conditions, a linear mixed-effects model (LMM) was applied to chlorophyll fluorescence parameters. A total of 261 observations (with at least three biological replicates per treatment and four time points per replicate) were included in the analysis. Temperature, pathogen treatment (Infection), and days after treatment (DAT) were in-cluded as fixed effects. Individual plants were included as random intercepts (1|PlantID) to account for inter-individual variability and repeated measurements across DAT. The model was fitted using the lme4 package in R (version 4.3.2), and the significance of fixed effects was evaluated using Type III ANOVA with Satterthwaite’s approximation. The model equation is shown in Equation (3).
To facilitate interpretation of the linear mixed-effects model, Table 2 summarizes each fixed-effect coefficient (β₀ –β₇), the random effect for individual plants, and the residuals, along with their respective roles in the model.
3. Results and Discussion
3.1. Analysis of Chlorophyll Fluorescence Response of Pear Leaves to Single Stress Conditions
3.1.1. Temperature as a Single Stress Factor
To evaluate the effects of temperature stress on chlorophyll fluorescence responses, leaf discs were treated at 10℃, 15℃, 25℃, 30℃, and 35℃, and fluorescence parameters were measured. For comparison of relative changes across treatments, each chlorophyll fluorescence parameter was normalized to its maximum value and visualized as radar plots (Figure 2). Statistical analyses were conducted using the actual, non-normalized values, which are provided in Appendix (Table A1).
Indices related to maximum photochemical efficiency, such as Fm, Fv, Fp, Fv/Fo, Fv/Fm, and Fv′/Fm′, were higher at 25℃ than at other temperature treatments. This suggests that maximum photochemical efficiency in the PSII reaction center is optimally maintained, and electron transfer is efficient even under light-saturated conditions [36,37]. In contrast, фPSII and photochemical quenching coefficients (qP, qL) were relatively low. This is interpreted as a result of the already high electron transfer efficiency of PSII, which limits the use of additional electron acceptor systems, thereby reducing the proportion of excitation energy used for actual electron transfer [38]. Furthermore, non-regulated energy loss (фNO) was lowest at 25℃, indicating that light energy was most efficiently converted to photochemical reactions [39]. Therefore, pear leaves exhibit optimal photosynthetic performance at 25℃, minimizing non-photochemical losses and maximizing photochemical utilization while stably maintaining PSII structure and function [40].
At low temperatures (10℃, 15℃), maximum fluorescence values and photosynthetic efficiency indices such as Fm, Fv, and Fp decreased. In particular, at 10℃, Fo, Fm, Fv, and Fp decreased rapidly from the outset, and NPQ was suppressed, confirming a decline in non-photochemical energy dissipation capacity (Figure 2a). Simultaneously, фNO increased, indicating inefficient energy loss. This is consistent with the observation that low temperatures delay electron transfer, increase ROS accumulation, accelerate damage to D1, a key PSII protein, and inhibit D1 turnover, leading to photoinhibition [41,42,43]. In contrast, at 15℃, damage was relatively mild, and фPSII, qP, and qL values remained high, indicating that electron transfer efficiency and the open state ratio of the reaction center were actually better than at 25℃. This suggests that the PSII reaction center is effectively maintained even at low temperatures, and a certain level of photoprotection is in operation [44,45].
Different adaptation strategies were observed at high temperatures (30℃, 35℃). At 30℃, fluorescence values were similar to those at 25℃, but NPQ was highest, and фPSII, qP, and qL values significantly decreased (Figure 2b, 2c and Table A1). This suggests that photochemical electron transfer efficiency was suppressed, but a strategy to release excess light energy through NPQ was activated. Meanwhile, at 35℃, photochemical properties were initially significantly reduced, but some recovery was observed after 3 days. фPSII was highest, while NPQ was lowest, indicating that energy utilization through electron transfer was enhanced over non-photochemical dissipation during high-temperature acclimation (Figure 2b~2d). Furthermore, at 35℃, qP and qL values increased after 5~7 days, confirming a trend toward an expanded open state of the reaction center.
Consequently, PSII employs opposing energy distribution strategies under temperature stress conditions. At low temperatures, it maintains an open state with a reaction center and minimizes structural damage through energy redistribution, while at high temperatures, it adopts an adaptive strategy through NPQ-dependent energy release or electron transfer recovery [46,47,48,49,50,51]. These results suggest that PSII activates different photoprotective mechanisms depending on the temperature.
3.1.2. Pathogen (E. amylovora) Inoculation as a Single Stress Factor
For comparison of relative changes across treatments, each chlorophyll fluorescence parameter was normalized to its maximum value and visualized as radar plots (Figure 3), which allowed us to examine the differences in parameter responses between non-infected and E. amylovora-infected leaves under the optimal photosynthetic temperature of 25℃. Statistical analyses were conducted using the actual, non-normalized values, which are provided in Appendix (Table A2).
Fo, Fm, and Fv parameters were lower in the pathogen-inoculated leaves compared to healthy leaves. This suggests that some PSII reaction centers were temporarily closed or electron transfer efficiency was limited, preventing the full utilization of absorbed light energy during the early stages of photosynthesis. The Fp and NPQ parameters also decreased, indicating that some energy dissipation pathways were restricted and excess energy was not efficiently converted to heat. While the decrease in Fv/Fo closed some PSII reaction centers, Fv/Fm and Fv′/Fm′ remained stable overall, confirming that the maximum PSII photochemical efficiency was not significantly impaired.
In particular, the effective quantum efficiency (фPSII) of PSII showed a higher trend compared to healthy leaves, indicating that the photoprotective mechanism was activated in the remaining healthy tissues and an adaptive response to maintain the efficiency of PSII despite some chloroplasts and cells being damaged by pathogen invasion. This trend has also been observed in pine wilt (Bursaphelenchus xylophilus) infection [52] and tobacco wilt (Pseudomonas syringae) infection [53], and is interpreted to have appeared in the process of defending against pathogen spread through cell death associated with a hypersensitive response [54,55].
In conclusion, Erwinia amylovora infection of pear trees induces changes in some indices, including Fo, Fm, Fv, Fp, and NPQ, thereby modulating PSII electron transport and non-photochemical dissipation. However, Fv/Fm, Fv′/Fm′, and фPSII remain stable, indicating that the photochemical efficiency of PSII reaction centers is not significantly impaired, suggesting that an adaptive photoprotective strategy against pathogen stress is in operation.
3.2. Assessment of Disease Progression at Different Temperatures in Leaf Discs Inoculated with E. amylovora
In this study, RGB images were captured to visually assess lesion development over different temperature treatments (10, 15, 25, 30, and 35℃) and time points. Lesion areas measured from these images were used to calculate the area under the disease progress curve (AUDPC) to investigate the pattern of fire blight disease development under various temperature conditions (Figure 4).
For each time point, the mean disease area and standard error (SE) were calculated, and 95% confidence intervals (CI) were derived (Figure 5a). Fire blight lesions characterized by black necrosis were first observed at 3 days after inoculation. Consistent with previous studies, the Total AUDPC value was highest at 25℃ (98.1), which corresponds to the optimal growth temperature of E. amylovora [56,57]. The 15℃ and 30℃ treatments exhibited similar disease patterns until 5 days after inoculation; however, by day 7, the AUDPC at 30℃ increased sharply to 65.7, whereas the value at 15℃ remained at 47.3. Under lowest (10℃) and highest (35℃) temperatures, pathogen growth was delayed, resulting in slower disease progression, with Total AUDPC values of 43 and 40.4, respectively (Figure 5b).
In conclusion, AUDPC analysis using RGB images revealed that disease severity fol-lowed the order 25℃ > 30℃ > 15℃ > 10℃ > 35℃. This indicates that E. amylovora is most active under optimal growth conditions, promoting cell wall invasion and proliferation. In contrast, under non-optimal temperatures, the plant’s basal defenses and hypersensitive responses were relatively more effective, thereby restricting lesion spread [2,54].
3.3. Analysis of Chlorophyll Fluorescence Parameters Under Combined Stress
This study investigated the photophysiological responses of pear leaves exposed simultaneously to different temperatures (10, 15, 25, 30, and 35℃) and E. amylovora inoculation. Based on the results obtained under single-stress conditions, the effects of combined stresses on the stability and photochemical efficiency of PSII reaction centers were analyzed using chlorophyll fluorescence parameters. A linear mixed model (LMM) was further employed to examine the interactions among factors and their influence on chlorophyll fluorescence variables.
3.3.1. Changes in Chlorophyll Fluorescence Parameters Under Combined Stress
For comparison of relative changes across combined treatments, each chlorophyll fluorescence parameter was normalized to its maximum value and visualized as radar plots (Figure 6). Statistical analyses were conducted using the actual, non-normalized values, which are provided in Appendix (Table A3).
The T 10℃ × pathogen treatment generally maintained high structural stability of PSII (Fo, Fm, Fv) and exhibited a protective response of PSII through the maintenance of NPQ parameters, indicating excess energy dissipation. Under low-temperature stress, plants promote the production of reactive oxygen species (ROS), salicylic acid (SA), and abscisic acid (ABA). In particular, ABA regulates the expression of defense-related genes through stomatal closure and interactions with various cellular kinases and phosphatases (PP2C), while salicylic acid induces the production of PR proteins at the infection site and systemically, providing resistance against pathogen invasion [58,59,60]. Therefore, the T 10℃ × pathogen treatment appeared to suppress pathogen spread through the enhancement of the antioxidant system induced by low-temperature stress, and although photochemical efficiency decreased due to electron acceptor saturation (qP, qL, ФNO↓), the PSII response remained the most stable among the combined stress treatments.
In contrast, in the T 15℃ × pathogen treatment, pathogen activity increased compared to the T 10℃ × pathogen treatment, leading to more pronounced tissue infection. As a result, Fo and Fm remained low, and by 7 days after treatment (DAT), the response pattern resembled that of the T 25℃ × pathogen treatment. The decrease in qP and qL suggests a transition of PSII reaction centers from the open state to the closed state, where excited electrons are temporarily unable to be efficiently transferred to electron acceptors, causing the reaction centers to close [51,61]. This corresponds with the high NPQ values observed at 7 DAT (Figure 6d), indicating the activation of protective responses to dissipate excess light energy as heat and mitigate PSII damage [44,62,63]. Therefore, the T 15℃ × pathogen treatment showed reduced PSII efficiency due to both pathogen proliferation and reduced enzyme activity under low temperature, accompanied by energy dissipation through thermal quenching.
Among the combined stress treatments, the T 25℃ × pathogen treatment exhibited the highest AUDPC, indicating vigorous pathogen growth. Over time, energy transfer from the PSII antenna complex to the reaction centers became unstable, and photochemical saturation could not be maintained (Fo, Fm↓). The reduction in Fv/Fo suggested damage to the D1 protein of PSII and the QA, QB electron transport chain, indicating decreased structural resilience [11,64,65]. Additionally, over time, PSII reaction centers failed to dissipate excess energy as heat via non-photochemical quenching, resulting in irreversible damage through non-regulated energy loss (NPQ↓, ФNO↑). Previous studies have reported that E. amylovora secretes exopolysaccharides (EPS) such as amylovoran and levan during infection, disrupting intercellular water movement and electron transport [66,67]. Consequently, the T 25℃ × pathogen treatment likely accumulated PSII damage due to interference in chloroplast signaling and increased ROS caused by EPS secretion and type III secretion system effector proteins [68,69,70,71].
In the T 30℃ × pathogen treatment, Fm, Fv, Fp, and Fv/Fo decreased from the early stage (1–3 DAT), indicating impaired PSII structural stability and a substantial reduction in energy transfer efficiency between antenna complexes and reaction centers [21]. By 5 DAT, Fo increased while Fm and Fv reached minimum values, and ФPSII temporarily increased, suggesting partial redistribution of electron transport as a compensatory response. The increase in qP and qL indicated a compensatory mechanism to maintain reaction centers in a partially open state [72,73], but ФNO remained high, reflecting activation of non-regulated non-photochemical quenching [74]. By 7 DAT, these trends persisted, with NPQ showing little increase and ФNO remaining high, indicating the accumulation of oxidative damage due to excess excitation energy being converted to ROS. In conclusion, the T 30℃ × pathogen treatment exhibited the most severe combined stress response due to high-temperature stress inhibiting PSII recovery, differing from the T 25℃ × pathogen treatment.
In the T 35℃ × pathogen treatment, AUDPC remained low, indicating suppressed pathogen activity. Nevertheless, chlorophyll fluorescence responses revealed the effects of high temperature on PSII stability. From 1–3 DAT, reaction centers could not efficiently process excitation energy under light-saturated conditions (Fm, Fv↓), and by 5–7 DAT, Fo increased, indicating thylakoid membrane damage and reduced structural stability due to prolonged high-temperature stress [75]. Unlike the T 30℃ × pathogen treatment, electron transport bottlenecks were less severe under 35℃, allowing partial maintenance of PSII function (qP, qL↑) and activation of photoprotective mechanisms through NPQ [14].
3.3.2. Statistical Assessment Using Linear Mixed Models
The radar plots in Figure 6 (Section 3.3.1) provide a descriptive overview of the relative changes in chlorophyll fluorescence parameters under combined temperature and pathogen treatments. However, because radar plots only illustrate mean patterns without formal hypothesis testing, we applied linear mixed-effects models (LMM) that account for plant-to-plant variability (random effect) to test the statistical significance of treatment effects (Table 3 and Table 4).
The main effect analysis revealed that the effect of days after treatment (DAT, D) was not statistically significant for most chlorophyll fluorescence parameters, whereas temperature treatment (T) and pathogen inoculation (I) tended to influence some parameters (T : фPSII, I : фPSII, NPQ; p < 0.1). Notably, фNO showed significant effects of both temperature and pathogen inoculation (p < 0.05), suggesting that non-regulated energy dissipation in PSII is sensitive to temperature and pathogen infection even under single stress conditions. In addition, Fo and Fv’/Fm’ tended to be affected by pathogen inoculation (p < 0.1), indicating that the maximal efficiency of PSII reaction centers may be partially modulated by pathogen infection. Overall, PSII function remained relatively stable under single stress conditions, but фNO highlighted the sensitivity of non-regulated energy dissipation to these stressors.
In the two-way interaction analysis, most combinations of T:I, T:D, and I:D were not significant, although the T:I interaction showed a trend for changes in NPQ and ФPSII (Table 4). This indicates that the combined effect of two single factors does not strongly affect PSII function, implying that plants can partially defend against photoinhibition even when exposed to two concurrent stressors [76,77].
By contrast, the three-way interaction (T:I:D) resulted in significant changes in major chlorophyll fluorescence parameters, including Fm (F = 4.21), Fv (F = 4.46), and Fp (F = 5.14) (p < 0.01). Significant interaction effects were also observed for Fv/Fo (F = 2.77) and qL (F = 2.88) (p < 0.05). These findings suggest that the combined effects of temperature, pathogen infection, and cumulative time exert cumulative and interdependent impacts on the electron transport capacity and photochemical efficiency of PSII. Such changes in chlorophyll fluorescence parameters indicate that the redox state of electron acceptors is regulated under combined stress, and that the plant photosynthetic system exhibits more dynamic and interdependent response patterns under combined stress than under single stress conditions [20,77,78,79].
4. Conclusions
Plants are exposed to complex stresses in diverse environments, and the interaction between abiotic stress and pathogen infection exerts intricate effects on plant–pathogen interactions. However, studies on the photosynthetic physiological responses under such interactions remain limited. Therefore, this study analyzed the chlorophyll fluorescence responses of pear trees under temperature stress and Erwinia amylovora infection as a combined stress.
Leave subjected to abiotic stress alone maintained photosynthetic performance at 25℃, whereas biotic stress caused by E. amylovora induced chlorophyll degradation and PSII system damage, preventing efficient dissipation of photosynthetic energy as heat. To evaluate pathogen activity under different temperature conditions, AUDPC assessments were conducted, revealing that disease progression followed the order of 25℃ > 30℃ > 15℃ > 10℃ > 35℃.
Moreover, the combined stress of temperature and E. amylovora infection had temperature-dependent and stepwise effects on PSII responses. Under 10℃, PSII structural stability was maintained, and enhanced NPQ indicated protective energy dissipation. At 15℃, pathogen proliferation and partial closure of reaction centers reduced photochemical efficiency, although some NPQ response was observed. At 25℃, PSII electron transport and photochemical efficiency were substantially impaired, and non-regulated energy dissipation (ФNO increase) indicated cumulative damage to the photosystem. At 30℃, redistribution of electron transport and limited compensatory responses were observed, but damage intensified. At 35℃, pathogen proliferation was suppressed, some PSII functions were retained, and NPQ-mediated photoprotection was activated, although long-term high temperature decreased structural stability.
Furthermore, linear mixed model (LMM) analysis quantitatively confirmed the main effects and interactions of pathogen, temperature, and time on chlorophyll fluorescence parameters.
This experiment was conducted under controlled environmental conditions to analyze the photophysiological responses of pear leaves to various temperatures and Erwinia amylovora infection, which may limit the direct applicability of the findings to orchard conditions. Nevertheless, this study provides fundamental insights into the photosynthetic physiological responses of pear trees under fire blight infection across different temperatures and serves as a basis for plant disease management and resilience enhancement under combined stress conditions.
Author Contributions
Conceptualization, Y.H. and S.Y.; methodology, K.P.; validation, Y.H., K.P. and S.Y.; investigation, Y.H.; resources, K.P.; data curation, Y.H.; writing—original draft preparation, Y.H.; writing—review and editing, K.P.,S.Y. and T.K.; visualization, Y.H.; supervision, S.Y., T.K.; funding acquisition, T.K. All authors have read and agreed to the published version of the manuscript.
Funding
This research was funded by the Rural Development Administration (RDA), Republic of Korea, grant number RS-2021-RD012471. The APC was funded by the Rural Development Administration, Republic of Korea.
Data Availability Statement
The data presented in this study are available upon request from the first author (Y.H.).
Acknowledgments
The authors gratefully acknowledge the support of the Rural Development Administration (RDA) and their valuable feedback during the course of this study.
Conflicts of Interest
The authors declare no conflicts of interest.
Abbreviations
The following abbreviations are used in this manuscript:
| E. amylovora | Erwinia amylovora |
| PSII | Photosystem II |
| RGB | Red, Green, Blue |
| CFU | Colony forming unit |
| AUDPC | Area under the disease progress curve |
| SE | Standard error |
| CI | Confidence interval |
| DAT(D) | Days after treatment |
| LMM | Linear mixed effects model |
| ROS | Reactive oxygen species |
| SA | Salicylic acid |
| ABA | Abscisic acid |
| EPS | Exoploysaccharides |
| T | Temperature |
| I | Infection |
Appendix A
Appendix A.1 Significance Test of Chlorophyll Fluorescence Parameters Under Single (Temperature) Stress
The effects of single temperature stress on chlorophyll fluorescence parameters were statistically evaluated, and results are presented in Appendix Table A1. For each parameter, one-way ANOVA was conducted across five temperature treatments (10, 15, 25, 30, and 35℃), followed by Duncan’s multiple range test for post-hoc comparisons. Values represent the mean ± SE of three biological replicates (n ≥ 3), and statistically significant differences among treatments (p < 0.05) are indicated by different letters.

Table A1.
Mean ± SE of chlorophyll fluorescence parameters (n ≥ 3) and statistical significance across temperature treatments (10, 15, 25, 30, and 35℃) at 1, 3, 5, and 7 DAT, determined by one-way ANOVA and Duncan’s multiple range test. Different lowercase letters indicate significant differences among treatments (p < 0.05). Asterisks denote significance levels (ns: not significant; .: p < 0.1; *: p < 0.05; **: p < 0.01; *** : p < 0.001).
| Days after treatment | Parameter | Temperature | p-value | ||||
|---|---|---|---|---|---|---|---|
| 10℃ | 15℃ | 25℃ | 30℃ | 35℃ | |||
| 1 DAT | Fo | 1726 ± 88.6a | 1787 ± 140.5a | 1988 ± 54.4a | 1761 ± 116.1a | 985 ± 12.2b | *** |
| Fm | 12475 ± 165.2c | 13348 ± 503.9bc | 14918 ± 294.7a | 13966 ± 425.4ab | 6400 ± 290.6d | *** | |
| Fv | 10749 ± 159.2c | 11562 ± 404.4bc | 12930 ± 281.1a | 12205 ± 321.3ab | 5414 ± 294.7d | *** | |
| Fp | 5333 ± 218.0b | 5174 ± 331.4b | 6635 ± 413.5a | 6371 ± 297.9a | 2746 ± 120.7c | *** | |
| Fv/Fo | 6.3 ± 0.317ab | 6.6 ± 0.336a | 6.5 ± 0.204a | 7.0 ± 0.297a | 5.5 ± 0.331b | . | |
| Fv/Fm | 0.9 ± 0.007ab | 0.9 ± 0.008a | 0.9 ± 0.004a | 0.9 ± 0.005a | 0.8 ± 0.008b | . | |
| Fv’/Fm’ | 0.8 ± 0.008a | 0.8 ± 0.008a | 0.8 ± 0.008a | 0.8 ± 0.004a | 0.8 ± 0.015b | * | |
| фPSII | 0.6 ± 0.008a | 0.7 ± 0.003a | 0.6 ± 0.020b | 0.6 ± 0.023b | 0.6 ± 0.011b | *** | |
| NPQ | 0.3 ± 0.014c | 0.4 ± 0.030abc | 0.4 ± 0.045bc | 0.5 ± 0.045ab | 0.5 ± 0.077a | * | |
| qP | 0.8 ± 0.015ab | 0.8 ± 0.008a | 0.7 ± 0.026bc | 0.7 ± 0.029c | 0.8 ± 0.016ab | ** | |
| qL | 0.4 ± 0.032ab | 0.4 ± 0.023a | 0.3 ± 0.036bc | 0.3 ± 0.035c | 0.4 ± 0.033ab | * | |
| фNO | 6.5 ± 0.147a | 6.1 ± 0.131ab | 6.2 ± 0.477ab | 5.1 ± 0.356b | 5.4 ± 0.364b | * | |
| 3 DAT | Fo | 1841 ± 82.0 | 1638 ± 32.4 | 1834 ± 63.6 | 1560 ± 83.6 | 1738 ± 226.4 | ns |
| Fm | 13245 ± 306.7ab | 12089 ± 208.4b | 14352 ± 470.2a | 12125 ± 601.8b | 10483 ± 669.8c | *** | |
| Fv | 11404 ± 316.2ab | 10451 ± 225.7b | 12519 ± 413.0a | 10564 ± 518.4b | 8745 ± 640.4c | *** | |
| Fp | 5369 ± 127.4bc | 5132 ± 203.8bc | 6679 ± 396.3a | 5737 ± 239.7b | 4635 ± 458.4c | ** | |
| Fv/Fo | 6.3 ± 0.330a | 6.4 ± 0.236a | 6.8 ± 0.107a | 6.8 ± 0.047a | 5.2 ± 0.908b | . | |
| Fv/Fm | 0.9 ± 0.007a | 0.9 ± 0.003a | 0.9 ± 0.002a | 0.9 ± 0.000a | 0.8 ± 0.024b | * | |
| Fv’/Fm’ | 0.8 ± 0.008 | 0.8 ± 0.004 | 0.8 ± 0.007 | 0.8 ± 0.003 | 0.8 ± 0.024 | ns | |
| фPSII | 0.6 ± 0.008a | 0.6 ± 0.017a | 0.5 ± 0.022b | 0.5 ± 0.003b | 0.6 ± 0.000a | *** | |
| NPQ | 0.4 ± 0.009b | 0.4 ± 0.029b | 0.4 ± 0.052b | 0.6 ± 0.025a | 0.4 ± 0.021b | ** | |
| qP | 0.8 ± 0.017a | 0.8 ± 0.020a | 0.6 ± 0.026b | 0.6 ± 0.004b | 0.8 ± 0.025a | *** | |
| qL | 0.4 ± 0.036a | 0.4 ± 0.030a | 0.2 ± 0.022b | 0.2 ± 0.005b | 0.5 ± 0.067a | *** | |
| фNO | 6.1 ± 0.114a | 6.1 ± 0.291a | 5.0 ± 0.348b | 4.3 ± 0.066b | 5.9 ± 0.095a | *** | |
| 5 DAT | Fo | 1818 ± 74.7 | 1725 ± 96.6 | 1846 ± 53.7 | 1611 ± 80.2 | 1898 ± 222.1 | ns |
| Fm | 12479 ± 305.8ab | 12283 ± 732.8b | 14015 ± 188.8a | 11892 ± 469.6b | 9823 ± 615.0c | *** | |
| Fv | 10661 ± 288.7ab | 10558 ± 638.8b | 12169 ± 160.3a | 10281 ± 390.5b | 7925 ± 723.0c | *** | |
| Fp | 4851 ± 175.2b | 4901 ± 406.1b | 6845 ± 455.2a | 5253 ± 140.2b | 4225 ± 202.8b | *** | |
| Fv/Fo | 5.9 ± 0.247a | 6.1 ± 0.090a | 6.6 ± 0.175a | 6.4 ± 0.089a | 4.4 ± 0.835b | * | |
| Fv/Fm | 0.9 ± 0.006a | 0.9 ± 0.002a | 0.9 ± 0.003a | 0.9 ± 0.003a | 0.8 ± 0.031b | * | |
| Fv’/Fm’ | 0.8 ± 0.007a | 0.8 ± 0.003a | 0.8 ± 0.007a | 0.8 ± 0.002a | 0.7 ± 0.033b | ** | |
| фPSII | 0.7 ± 0.008a | 0.6 ± 0.007a | 0.5 ± 0.024d | 0.5 ± 0.009c | 0.6 ± 0.021b | *** | |
| NPQ | 0.4 ± 0.016b | 0.4 ± 0.045ab | 0.4 ± 0.046ab | 0.5 ± 0.003a | 0.5 ± 0.047ab | . | |
| qP | 0.8 ± 0.015a | 0.8 ± 0.007a | 0.6 ± 0.026c | 0.6 ± 0.011b | 0.8 ± 0.014a | *** | |
| qL | 0.4 ± 0.034ab | 0.4 ± 0.008b | 0.2 ± 0.012c | 0.3 ± 0.011c | 0.5 ± 0.050a | *** | |
| фNO | 6.3 ± 0.143a | 6.1 ± 0.302ab | 4.8 ± 0.326cd | 4.5 ± 0.048d | 5.4 ± 0.181bc | *** | |
| 7 DAT | Fo | 2114 ± 202.3 | 1798 ± 88.8 | 1849 ± 38.3 | 1637 ± 76.0 | 2011 ± 210.2 | ns |
| Fm | 12110 ± 336.4b | 12540 ± 603.9ab | 13701 ± 216.4a | 10623 ± 491.5c | 9191 ± 343.5d | *** | |
| Fv | 9997 ± 354.4bc | 10743 ± 522.1ab | 11851 ± 178.7a | 8986 ± 423.1c | 7180 ± 487.5d | *** | |
| Fp | 5438 ± 306.4b | 5673 ± 414.9b | 6793 ± 341.0a | 4477 ± 187.7c | 4301 ± 139.2c | *** | |
| Fv/Fo | 4.9 ± 0.519bc | 6.0 ± 0.121ab | 6.4 ± 0.042a | 5.5 ± 0.122ab | 3.8 ± 0.656c | ** | |
| Fv/Fm | 0.8 ± 0.016ab | 0.9 ± 0.002a | 0.9 ± 0.003a | 0.8 ± 0.003a | 0.8 ± 0.030b | ** | |
| Fv’/Fm’ | 0.8 ± 0.016a | 0.8 ± 0.005a | 0.8 ± 0.003a | 0.8 ± 0.002a | 0.7 ± 0.032b | ** | |
| фPSII | 0.6 ± 0.021a | 0.6 ± 0.012b | 0.5 ± 0.017c | 0.6 ± 0.018ab | 0.6 ± 0.026b | *** | |
| NPQ | 0.4 ± 0.034c | 0.5 ± 0.046ab | 0.5 ± 0.031bc | 0.6 ± 0.020a | 0.5 ± 0.039ab | * | |
| qP | 0.8 ± 0.044a | 0.7 ± 0.013b | 0.6 ± 0.020c | 0.8 ± 0.026ab | 0.8 ± 0.021ab | *** | |
| qL | 0.6 ± 0.103a | 0.3 ± 0.016bc | 0.2 ± 0.015c | 0.4 ± 0.038ab | 0.5 ± 0.044a | *** | |
| фNO | 6.2 ± 0.376a | 5.0 ± 0.182b | 4.4 ± 0.117b | 5.0 ± 0.203b | 4.9 ± 0.174b | *** | |
Appendix A.2 Significance Test of Chlorophyll Fluorescence Parameters Under Single (Pathogen) Stress
For pathogen stress treatments (non-infected vs. infected), independent-samples t-tests were conducted, and the results are summarized separately in Appendix Table A2. All values are expressed as the mean ± SE of three biological replicates (n ≥ 3). Statistically significant differences were determined at p < 0.05, with different letters asterisks indicating significant group differences.
Table A2.
Mean ± SE of chlorophyll fluorescence parameters (n ≥ 3) for non-infected and infected treatments at 1,3,5, and 7 DAT, with statistical significance determined by independent-samples t-tests. Significant differences are indicated by p-values (ns: not significant; *: p < 0.05; **: p < 0.01; *** : p < 0.001).
| Days after treatment | Parameter | Treatments | t-value | df | Sig. | |
|---|---|---|---|---|---|---|
| Non-infected | Infected | |||||
| 1 DAT | Fo | 1988 ± 54.4 | 1700 ± 73.1 | 3.161 | 13.709 | * |
| Fm | 14918 ± 294.7 | 14019 ± 417.9 | 1.758 | 13.488 | ns | |
| Fv | 12930 ± 281.1 | 12319 ± 384.9 | 1.282 | 13.638 | ns | |
| Fp | 6635 ± 413.5 | 6826 ± 483.2 | -0.300 | 13.998 | ns | |
| Fv/Fo | 6.53 ± 0.204 | 7.32 ± 0.284 | -2.269 | 13.561 | * | |
| Fv/Fm | 0.87 ± 0.004 | 0.88 ± 0.005 | -1.788 | 13.964 | ns | |
| Fv’/Fm’ | 0.83 ± 0.008 | 0.84 ± 0.006 | -0.894 | 12.309 | ns | |
| фPSII | 0.60 ± 0.020 | 0.57 ± 0.018 | 1.173 | 13.366 | ns | |
| NPQ | 0.36 ± 0.045 | 0.42 ± 0.028 | -1.171 | 10.453 | ns | |
| qP | 0.72 ± 0.026 | 0.68 ± 0.024 | 1.307 | 13.271 | ns | |
| qL | 0.32 ± 0.036 | 0.26 ± 0.028 | 1.221 | 12.305 | ns | |
| фNO | 6.18 ± 0.477 | 5.34 ± 0.233 | 1.570 | 8.832 | ns | |
| 3 DAT | Fo | 1834 ± 63.6 | 1385 ± 61.3 | 5.083 | 13.975 | *** |
| Fm | 14352 ± 470.2 | 11078 ± 411.6 | 5.24 | 12.726 | *** | |
| Fv | 12519 ± 413.0 | 9693 ± 355.0 | 5.189 | 12.496 | *** | |
| Fp | 6679 ± 396.3 | 4965 ± 233.5 | 3.725 | 8.672 | * | |
| Fv/Fo | 6.83 ± 0.107 | 7.04 ± 0.122 | -1.288 | 16.009 | ns | |
| Fv/Fm | 0.87 ± 0.002 | 0.88 ± 0.002 | -1.269 | 16.702 | ns | |
| Fv’/Fm’ | 0.83 ± 0.007 | 0.84 ± 0.002 | -2.123 | 6.304 | ns | |
| фPSII | 0.51 ± 0.022 | 0.58 ± 0.011 | -2.639 | 7.418 | * | |
| NPQ | 0.44 ± 0.052 | 0.33 ± 0.021 | 1.969 | 6.622 | ns | |
| qP | 0.62 ± 0.026 | 0.68 ± 0.012 | -2.339 | 7.277 | ns | |
| qL | 0.22 ± 0.022 | 0.26 ± 0.010 | -1.492 | 7.134 | ns | |
| фNO | 5.01 ± 0.348 | 6.05 ± 0.260 | -2.392 | 10.807 | * | |
| 5 DAT | Fo | 1846 ± 53.7 | 1416 ± 106.0 | 3.619 | 7.112 | * |
| Fm | 14015 ± 188.8 | 11694 ± 407.4 | 5.168 | 6.852 | ** | |
| Fv | 12169 ± 160.3 | 10278 ± 328.3 | 5.175 | 7.005 | ** | |
| Fp | 6845 ± 455.2 | 4851 ± 269.4 | 3.769 | 5.094 | * | |
| Fv/Fo | 6.61 ± 0.175 | 7.39 ± 0.379 | -1.887 | 6.838 | ns | |
| Fv/Fm | 0.87 ± 0.003 | 0.88 ± 0.006 | -1.665 | 6.553 | ns | |
| Fv’/Fm’ | 0.82 ± 0.007 | 0.84 ± 0.006 | -2.189 | 7.042 | ns | |
| фPSII | 0.47 ± 0.024 | 0.56 ± 0.013 | -3.31 | 4.837 | * | |
| NPQ | 0.42 ± 0.046 | 0.37 ± 0.022 | 0.922 | 4.434 | ns | |
| qP | 0.57 ± 0.026 | 0.67 ± 0.015 | -3.107 | 5.115 | * | |
| qL | 0.19 ± 0.012 | 0.24 ± 0.015 | -2.536 | 7.998 | * | |
| фNO | 4.77 ± 0.326 | 5.55 ± 0.185 | -2.058 | 4.937 | ns | |
| 7 DAT | Fo | 1849 ± 38.3 | 1338 ± 45.5 | 8.599 | 10.926 | *** |
| Fm | 13701 ± 216.4 | 9278 ± 447.2 | 8.903 | 12.878 | *** | |
| Fv | 11851 ± 178.7 | 7940 ± 424.4 | 8.494 | 12.546 | *** | |
| Fp | 6793 ± 341.0 | 4183 ± 230.4 | 6.341 | 5.990 | *** | |
| Fv/Fo | 6.41 ± 0.042 | 5.95 ± 0.285 | 1.591 | 10.413 | ns | |
| Fv/Fm | 0.87 ± 0.003 | 0.85 ± 0.007 | 1.441 | 12.627 | ns | |
| Fv’/Fm’ | 0.81 ± 0.003 | 0.82 ± 0.007 | -0.472 | 12.794 | ns | |
| фPSII | 0.48 ± 0.017 | 0.60 ± 0.013 | -5.526 | 6.762 | ** | |
| NPQ | 0.49 ± 0.031 | 0.32 ± 0.016 | 4.800 | 4.664 | * | |
| qP | 0.59 ± 0.020 | 0.73 ± 0.020 | -5.170 | 9.090 | ** | |
| qL | 0.21 ± 0.015 | 0.34 ± 0.031 | -3.864 | 12.871 | ** | |
| фNO | 4.44 ± 0.117 | 6.15 ± 0.167 | -8.362 | 12.295 | *** | |
Appendix A.3. Significance Test of Chlorophyll Fluorescence Parameters Under Combined Stress
The effects of combined stress(temperature x pathogen) on chlorophyll fluorescence parameters were statistically evaluated, and results are presented in Appendix Table A3. For each parameter, one-way ANOVA was conducted across combined treatments (10, 15, 25, 30, and 35℃), followed by Duncan’s multiple range test for post-hoc comparisons. Values represent the mean ± SE of three biological replicates (n ≥ 3), and statistically significant differences among treatments (p < 0.05) are indicated by different letters.
Table A3.
Mean ± SE of chlorophyll fluorescence parameters (n ≥ 3) and statistical significance across temperature x pathogen treatments (10, 15, 25, 30, and 35℃) at 1, 3, 5, and 7 DAT, determined by one-way ANOVA and Duncan’s multiple range test. Different lowercase letters indicate significant differences among treatments (p < 0.05). Asterisks denote significance levels (ns: not significant; .: p < 0.1; *: p < 0.05; **: p < 0.01; *** : p < 0.001).
| Days after treatment | Parameter | Temperature x pathogen | p-value | ||||
|---|---|---|---|---|---|---|---|
| 10℃ x pathogen | 15℃ x pathogen | 25℃ x pathogen | 30℃ x pathogen | 35℃ x pathogen | |||
| 1 DAT | Fo | 1841 ± 23.2 | 1631 ± 101.1 | 1700 ± 73.1 | 1818 ± 97.5 | 1874 ± 74.0 | ns |
| Fm | 15049 ± 215.8 | 13846 ± 317.5 | 14019 ± 285.9 | 14062 ± 308.8 | 14595 ± 566.7 | ns | |
| Fv | 13208 ± 196.4 | 12215 ± 277.4 | 12319 ± 246.8 | 12244 ± 262.3 | 12721 ± 475.4 | ns | |
| Fp | 6751 ± 213.5 | 5967 ± 281.6 | 6826 ± 263.3 | 7085 ± 278.9 | 6252 ± 317.6 | ns | |
| Fv/Fo | 7.2 ± 0.058ab | 7.6 ± 0.054a | 7.3 ± 0.053ab | 6.8 ± 0.084b | 6.8 ± 0.171b | * | |
| Fv/Fm | 0.9 ± 0.001 | 0.9 ± 0.001 | 0.9 ± 0.001 | 0.9 ± 0.001 | 0.9 ± 0.002 | ns | |
| Fv’/Fm’ | 0.8 ± 0.004ab | 0.8 ± 0.004a | 0.8 ± 0.004a | 0.8 ± 0.004b | 0.8 ± 0.004ab | . | |
| фPSII | 0.6 ± 0.012abc | 0.6 ± 0.011ab | 0.6 ± 0.008bc | 0.6 ± 0.008c | 0.6 ± 0.009a | * | |
| NPQ | 0.5 ± 0.038 | 0.5 ± 0.042 | 0.4 ± 0.041 | 0.5 ± 0.026 | 0.4 ± 0.029 | ns | |
| qP | 0.7 ± 0.015ab | 0.7 ± 0.013ab | 0.7 ± 0.010b | 0.7 ± 0.010b | 0.7 ± 0.011a | * | |
| qL | 0.3 ± 0.017ab | 0.3 ± 0.015ab | 0.3 ± 0.013b | 0.3 ± 0.014b | 0.3 ± 0.015a | . | |
| фNO | 5.3 ± 0.163 | 5.5 ± 0.173 | 5.3 ± 0.155 | 5.0 ± 0.134 | 5.7 ± 0.150 | ns | |
| 3 DAT | Fo | 1543 ± 99.4 | 1556 ± 76.4 | 1385 ± 61.3 | 1452 ± 103.7 | 1469 ± 131.9 | ns |
| Fm | 12789 ± 772.5a | 12786 ± 595.2a | 11078 ± 411.6ab | 9932 ± 612.0b | 9322 ± 588.2b | *** | |
| Fv | 11246 ± 675.2a | 11230 ± 520.4a | 9693 ± 355.0b | 8481 ± 515.1bc | 7853 ± 472.8c | *** | |
| Fp | 6032 ± 492.0a | 5128 ± 256.3ab | 4965 ± 233.5b | 4320 ± 277.2bc | 3954 ± 325.9c | *** | |
| Fv/Fo | 7.3 ± 0.113a | 7.2 ± 0.075a | 7.0 ± 0.122a | 5.9 ± 0.169b | 5.5 ± 0.246c | *** | |
| Fv/Fm | 0.9 ± 0.002a | 0.9 ± 0.001a | 0.9 ± 0.002a | 0.9 ± 0.004b | 0.8 ± 0.007c | *** | |
| Fv’/Fm’ | 0.8 ± 0.006b | 0.8 ± 0.004ab | 0.8 ± 0.002a | 0.8 ± 0.008c | 0.8 ± 0.008c | *** | |
| фPSII | 0.6 ± 0.011 | 0.6 ± 0.013 | 0.6 ± 0.011 | 0.6 ± 0.013 | 0.6 ± 0.011 | ns | |
| NPQ | 0.6 ± 0.053a | 0.5 ± 0.031ab | 0.3 ± 0.021c | 0.5 ± 0.038a | 0.4 ± 0.024bc | *** | |
| qP | 0.7 ± 0.012b | 0.7 ± 0.015ab | 0.7 ± 0.012b | 0.7 ± 0.020ab | 0.7 ± 0.019a | * | |
| qL | 0.3 ± 0.015c | 0.3 ± 0.016c | 0.3 ± 0.010c | 0.4 ± 0.028ab | 0.4 ± 0.031a | *** | |
| фNO | 4.9 ± 0.173c | 5.4 ± 0.172bc | 6.0 ± 0.260a | 5.1 ± 0.181bc | 5.6 ± 0.167ab | ** | |
| 5 DAT | Fo | 1686 ± 101.0 | 1550 ± 134.0 | 1416 ± 106.0 | 1569 ± 80.5 | 1617 ± 124.5 | ns |
| Fm | 13872 ± 593.2a | 13274 ± 745.4ab | 11694 ± 407.4bc | 10044 ± 301.2c | 11280 ± 618.6c | *** | |
| Fv | 12186 ± 500.0a | 11724 ± 611.5a | 10278 ± 328.3b | 8475 ± 240.2c | 9663 ± 512.5bc | *** | |
| Fp | 6615 ± 425.4a | 5804 ± 482.5ab | 4851 ± 269.4bc | 4229 ± 109.1c | 4527 ± 462.8c | *** | |
| Fv/Fo | 7.3 ± 0.220a | 7.6 ± 0.247a | 7.4 ± 0.379a | 5.5 ± 0.239b | 6.0 ± 0.271b | *** | |
| Fv/Fm | 0.9 ± 0.004a | 0.9 ± 0.004a | 0.9 ± 0.006a | 0.8 ± 0.006b | 0.9 ± 0.006b | *** | |
| Fv’/Fm’ | 0.8 ± 0.007b | 0.8 ± 0.005ab | 0.8 ± 0.006a | 0.8 ± 0.008c | 0.8 ± 0.010c | *** | |
| фPSII | 0.6 ± 0.012b | 0.6 ± 0.017b | 0.6 ± 0.013b | 0.6 ± 0.021a | 0.6 ± 0.018b | * | |
| NPQ | 0.7 ± 0.031a | 0.6 ± 0.019ab | 0.4 ± 0.022c | 0.5 ± 0.062b | 0.7 ± 0.035a | *** | |
| qP | 0.7 ± 0.018b | 0.7 ± 0.019b | 0.7 ± 0.015b | 0.8 ± 0.026a | 0.7 ± 0.025b | *** | |
| qL | 0.3 ± 0.023c | 0.3 ± 0.018c | 0.2 ± 0.015c | 0.5 ± 0.042a | 0.4 ± 0.038b | *** | |
| фNO | 4.6 ± 0.075b | 4.7 ± 0.162b | 5.5 ± 0.185a | 5.7 ± 0.400a | 4.8 ± 0.170b | ** | |
| 7 DAT | Fo | 1459 ± 157.5ab | 1217 ± 162.4b | 1338 ± 45.5ab | 1640 ± 83.2a | 1382 ± 88.2ab | * |
| Fm | 11793 ± 1259.6a | 9727 ± 1354.6ab | 9278 ± 447.2b | 8415 ± 567.4b | 7923 ± 344.8b | * | |
| Fv | 10334 ± 1105.0a | 8510 ± 1193.7ab | 7940 ± 424.4b | 6776 ± 543.6b | 6541 ± 307.2b | ** | |
| Fp | 5818 ± 646.4a | 4655 ± 658.8b | 4183 ± 230.4bc | 3924 ± 249.3bc | 3332 ± 142.2c | ** | |
| Fv/Fo | 7.1 ± 0.154a | 7.0 ± 0.173a | 6.0 ± 0.285b | 4.2 ± 0.344c | 4.8 ± 0.281c | *** | |
| Fv/Fm | 0.9 ± 0.002a | 0.9 ± 0.004a | 0.9 ± 0.007a | 0.8 ± 0.013b | 0.8 ± 0.009b | *** | |
| Fv’/Fm’ | 0.8 ± 0.006a | 0.8 ± 0.002a | 0.8 ± 0.007a | 0.7 ± 0.013b | 0.8 ± 0.012b | *** | |
| фPSII | 0.5 ± 0.022bc | 0.5 ± 0.016c | 0.6 ± 0.013ab | 0.6 ± 0.010a | 0.6 ± 0.021a | ** | |
| NPQ | 0.6 ± 0.053a | 0.7 ± 0.026a | 0.3 ± 0.016c | 0.4 ± 0.040b | 0.5 ± 0.042b | *** | |
| qP | 0.7 ± 0.028b | 0.7 ± 0.021b | 0.7 ± 0.020b | 0.8 ± 0.018a | 0.8 ± 0.024a | *** | |
| qL | 0.3 ± 0.029b | 0.3 ± 0.019b | 0.3 ± 0.031b | 0.6 ± 0.042a | 0.5 ± 0.038a | *** | |
| фNO | 4.7 ± 0.180b | 4.5 ± 0.128b | 6.1 ± 0.167a | 5.8 ± 0.198a | 5.7 ± 0.325a | *** | |
References
- Atkinson, N.J.; Urwin, P.E. The interaction of plant biotic and abiotic stresses: from genes to the field. Journal of experimental botany 2012, 63, 3523–3543. [Google Scholar] [CrossRef]
- Zandalinas, S.I.; Mittler, R. Plant responses to multifactorial stress combination. New Phytologist 2022, 234, 1161–1167. [Google Scholar] [CrossRef]
- Scholthof, K.-B.G. The disease triangle: pathogens, the environment and society. Nature Reviews Microbiology 2007, 5, 152–156. [Google Scholar] [CrossRef]
- Berger, S.; Sinha, A.K.; Roitsch, T. Plant physiology meets phytopathology: plant primary metabolism and plant–pathogen interactions. Journal of experimental botany 2007, 58, 4019–4026. [Google Scholar] [CrossRef]
- Ham, H.; Lee, Y.-K.; Kong, H.G.; Hong, S.J.; Lee, K.J.; Oh, G.-R.; Lee, M.-H.; Lee, Y.H. Outbreak of Fire Blight of Apple and Asian Pear in 2015–2019 in Korea. Research in Plant Disease 2020, 26, 222–228. [Google Scholar] [CrossRef]
- Santander, R.D.; Oliver, J.D.; Biosca, E.G. Cellular, physiological, and molecular adaptive responses of Erwinia amylovora to starvation. FEMS Microbiology Ecology 2014, 88, 258–271. [Google Scholar] [CrossRef]
- Zwet, T.; Orolaza-Halbrendt, N.; Zeller, W. Fire blight: history, biology, and management. 2012. [Google Scholar] [CrossRef]
- Santander, R.D.; Biosca, E.G. Erwinia amylovora psychrotrophic adaptations: evidence of pathogenic potential and survival at temperate and low environmental temperatures. PeerJ 2017, 5, e3931. [Google Scholar] [CrossRef] [PubMed]
- Liao, H.; Lyon, C.J.; Ying, B.; Hu, T. Climate change, its impact on emerging infectious diseases and new technologies to combat the challenge. Emerging microbes & infections 2024, 13, 2356143. [Google Scholar] [CrossRef]
- Greenspan, S.E.; Bower, D.S.; Roznik, E.A.; Pike, D.A.; Marantelli, G.; Alford, R.A.; Schwarzkopf, L.; Scheffers, B.R. Infection increases vulnerability to climate change via effects on host thermal tolerance. Scientific reports 2017, 7, 9349. [Google Scholar] [CrossRef] [PubMed]
- Maxwell, K.; Johnson, G.N. Chlorophyll fluorescence—a practical guide. Journal of experimental botany 2000, 51, 659–668. [Google Scholar] [CrossRef]
- Kalaji, H.M.; Bosa, K.; Kościelniak, J.; Hossain, Z. Chlorophyll a fluorescence—a useful tool for the early detection of temperature stress in spring barley (Hordeum vulgare L.). Omics: a journal of integrative biology 2011, 15, 925–934. [Google Scholar] [CrossRef]
- Yoo, S.-Y.; Eom, K.-C.; Park, S.-H.; Kim, T.-W. Possibility of Drought stress Indexing by Chlorophyll Fluorescence Imaging Technique in Red Pepper (Capsicum annuum L.). Korean Society of Soil Science and Fertillizer 2012, 45, 676–682. [Google Scholar] [CrossRef]
- Murchie, E.H.; Lawson, T. Chlorophyll fluorescence analysis: a guide to good practice and understanding some new applications. Journal of experimental botany 2013, 64, 3983–3998. [Google Scholar] [CrossRef]
- Lorenzini, G.; Guidi, L.; Nali, C.; Ciompi, S.; Soldatini, G.F. Photosynthetic response of tomato plants to vascular wilt diseases. Plant science 1997, 124, 143–152. [Google Scholar] [CrossRef]
- Pinto, L.S.R.C.; Azevedo, J.L.; Pereira, J.O.; Vieira, M.L.C.; Labate, C.A. Symptomless infection of banana and maize by endophytic fungi impairs photosynthetic efficiency. The New Phytologist 2000, 147, 609–615. [Google Scholar] [CrossRef]
- Zhang, Z.; Wu, P.; Zhang, W.; Yang, Z.; Liu, H.; Ahammed, G.J.; Cui, J. Calcium is involved in exogenous NO-induced enhancement of photosynthesis in cucumber (Cucumis sativus L.) seedlings under low temperature. Scientia Horticulturae 2020, 261, 108953. [Google Scholar] [CrossRef]
- Eom, T.S.; Jang, S.Y.; Hwang, Y.B.; Yoo, S.Y.; Kang, S.K.; Park, J.S.; Kim, T.W. Chlorophyll Fluorescence Analysis for the Assessment of High Temperature Stress in Citrus During the Coloration Period. Journal of Environmental Science International 2024, 33, 613–623. [Google Scholar] [CrossRef]
- Mittler, R. Abiotic stress, the field environment and stress combination. Trends in plant science 2006, 11, 15–19. [Google Scholar] [CrossRef] [PubMed]
- Suzuki, N.; Rivero, R.M.; Shulaev, V.; Blumwald, E.; Mittler, R. Abiotic and biotic stress combinations. New Phytologist 2014, 203, 32–43. [Google Scholar] [CrossRef] [PubMed]
- Pandey, P.; Ramegowda, V.; Senthil-Kumar, M. Shared and unique responses of plants to multiple individual stresses and stress combinations: physiological and molecular mechanisms. Frontiers in plant science 2015, 6, 723. [Google Scholar] [CrossRef] [PubMed]
- Zhang, H.; Sonnewald, U. Differences and commonalities of plant responses to single and combined stresses. The Plant Journal 2017, 90, 839–855. [Google Scholar] [CrossRef]
- Saijo, Y.; Loo, E.P.i. Plant immunity in signal integration between biotic and abiotic stress responses. New Phytologist 2020, 225, 87–104. [Google Scholar] [CrossRef] [PubMed]
- Smith, A.; Cullis, B.R.; Thompson, R. The analysis of crop cultivar breeding and evaluation trials: an overview of current mixed model approaches. The Journal of Agricultural Science 2005, 143, 449–462. [Google Scholar] [CrossRef]
- Schabenberger, O.; Pierce, F.J. Contemporary statistical models for the plant and soil sciences; CRC press: 2001.
- Buckley, Y.M.; Briese, D.T.; Rees, M. Demography and management of the invasive plant species Hypericum perforatum. I. Using multi-level mixed-effects models for characterizing growth, survival and fecundity in a long-term data set. Journal of Applied Ecology 2003, 40, 481–493. [Google Scholar] [CrossRef]
- Spyroglou, I.; Skalák, J.; Balakhonova, V.; Benedikty, Z.; Rigas, A.G.; Hejátko, J. Mixed models as a tool for comparing groups of time series in plant sciences. Plants 2021, 10, 362. [Google Scholar] [CrossRef]
- Spyroglou, I.; Rybka, K.; Maldonado Rodriguez, R.; Stefański, P.; Valasevich, N.M. Quantitative estimation of water status in field-grown wheat using beta mixed regression modelling based on fast chlorophyll fluorescence transients: A method for drought tolerance estimation. Journal of Agronomy and Crop Science 2021, 207, 589–605. [Google Scholar] [CrossRef]
- Matias, F.I.; Caraza-Harter, M.V.; Endelman, J.B. FIELDimageR: An R package to analyze orthomosaic images from agricultural field trials. The Plant Phenome Journal 2020, 3, e20005. [Google Scholar] [CrossRef]
- Das, M.K.; Rajaram, S.; Mundt, C.C.; Kronstad, W.E. Inheritance of slow-rusting resistance to leaf rust in wheat. Crop science 1992, 32, 1452–1456. [Google Scholar] [CrossRef]
- Moustakas, M.; Guidi, L.; Calatayud, A. Chlorophyll fluorescence analysis in biotic and abiotic stress, volume II. 2022, 13, 1066865. [CrossRef]
- Genty, B.; Briantais, J.-M.; Baker, N.R. The relationship between the quantum yield of photosynthetic electron transport and quenching of chlorophyll fluorescence. Biochimica et Biophysica Acta (BBA)-General Subjects 1989, 990, 87–92. [Google Scholar] [CrossRef]
- Barbagallo, R.P.; Oxborough, K.; Pallett, K.E.; Baker, N.R. Rapid, noninvasive screening for perturbations of metabolism and plant growth using chlorophyll fluorescence imaging. Plant physiology 2003, 132, 485–493. [Google Scholar] [CrossRef]
- Stirbet, A.; Lazár, D.; Kromdijk, J.; Govindjee. Chlorophyll a fluorescence induction: can just a one-second measurement be used to quantify abiotic stress responses? Photosynthetica 2018, 56, 86–104. [Google Scholar] [CrossRef]
- R Core Team. R: A Language and Environment for Statistical Computing; R Foundation for Statistical Computing: Vienna, Austria, 2023; Available online: https://www.R-project.org (accessed on 17 July 2023).
- Martinazzo, E.G.; Ramm, A.; Bacarin, M.A. The chlorophyll a fluorescence as an indicator of the temperature stress in the leaves of Prunus persica. Brazilian Journal of Plant Physiology 2012, 24, 237–246. [Google Scholar] [CrossRef]
- Neri, P.; Gu, L.; Song, Y. The effect of temperature on photosystem II efficiency across plant functional types and climate. Biogeosciences 2024, 21, 2731–2758. [Google Scholar] [CrossRef]
- Shi, S.; Shi, R.; Zhou, D.; Li, T.; De, K.; Gao, X.; Ma, J.; Wang, F. Reduction of PSII photosynthetic performance by low temperature is the reason for the growing inhibition of Kobresia pygmaea Clarke. Brazilian Journal of Botany 2023, 46, 527–539. [Google Scholar] [CrossRef]
- Shin, Y.K.; Bhandari, S.R.; Lee, J.G. Monitoring of salinity, temperature, and drought stress in grafted watermelon seedlings using chlorophyll fluorescence. Frontiers in Plant Science 2021, 12, 786309. [Google Scholar] [CrossRef]
- Drepper, B.; Gobin, A.; Remy, S.; Van Orshoven, J. Comparing apple and pear phenology and model performance: what seven decades of observations reveal. Agronomy 2020, 10, 73. [Google Scholar] [CrossRef]
- Bascuñán-Godoy, L.; Sanhueza, C.; Cuba, M.; Zuñiga, G.E.; Corcuera, L.J.; Bravo, L.A. Cold-acclimation limits low temperature induced photoinhibition by promoting a higher photochemical quantum yield and a more effective PSII restoration in darkness in the Antarctic rather than the Andean ecotype of Colobanthus quitensis Kunt Bartl (Cariophyllaceae). BMC Plant Biology 2012, 12, 114. [Google Scholar] [CrossRef] [PubMed]
- Bhandari, S.R.; Kim, Y.H.; Lee, J.G. Detection of temperature stress using chlorophyll fluorescence parameters and stress-related chlorophyll and proline content in paprika (Capsicum annuum L.) seedlings. Horticultural Science and Technology 2018, 36, 619–629. [Google Scholar] [CrossRef]
- Chauhan, J.; Prathibha, M.; Singh, P.; Choyal, P.; Mishra, U.N.; Saha, D.; Kumar, R.; Anuragi, H.; Pandey, S.; Bose, B. Plant photosynthesis under abiotic stresses: Damages, adaptive, and signaling mechanisms. Plant Stress 2023, 10, 100296. [Google Scholar] [CrossRef]
- Ruban, A.V. Nonphotochemical chlorophyll fluorescence quenching: mechanism and effectiveness in protecting plants from photodamage. Plant physiology 2016, 170, 1903–1916. [Google Scholar] [CrossRef]
- Dong, Z.; Men, Y.; Li, Z.; Zou, Q.; Ji, J. Chlorophyll fluorescence imaging as a tool for analyzing the effects of chilling injury on tomato seedlings. Scientia Horticulturae 2019, 246, 490–497. [Google Scholar] [CrossRef]
- Feierabend, J.; Schaan, C.; Hertwig, B. Photoinactivation of catalase occurs under both high-and low-temperature stress conditions and accompanies photoinhibition of photosystem II. Plant Physiology 1992, 100, 1554–1561. [Google Scholar] [CrossRef] [PubMed]
- Baker, N.R.; Rosenqvist, E. Applications of chlorophyll fluorescence can improve crop production strategies: an examination of future possibilities. Journal of experimental botany 2004, 55, 1607–1621. [Google Scholar] [CrossRef] [PubMed]
- Ensminger, I.; Busch, F.; Huner, N.P. Photostasis and cold acclimation: sensing low temperature through photosynthesis. Physiologia Plantarum 2006, 126, 28–44. [Google Scholar] [CrossRef]
- Ikeuchi, M.; Sato, F.; Endo, T. Allocation of absorbed light energy in photosystem II in NPQ mutants of Arabidopsis. Plant and Cell Physiology 2016, 57, 1484–1494. [Google Scholar] [CrossRef]
- Aazami, M.A.; Asghari-Aruq, M.; Hassanpouraghdam, M.B.; Ercisli, S.; Baron, M.; Sochor, J. Low temperature stress mediates the antioxidants pool and chlorophyll fluorescence in Vitis vinifera L. cultivars. Plants 2021, 10, 1877. [Google Scholar] [CrossRef]
- Murakami, A.; Kim, E.; Minagawa, J.; Takizawa, K. How much heat does non-photochemical quenching produce? Frontiers in Plant Science 2024, 15, 1367795. [Google Scholar] [CrossRef]
- Shen, L.; Lin, X.; Liu, F.; Huang, Y.; Ye, J.; Tan, J. Early Diagnosis of Pine Wood Nematode Disease Based on Chlorophyll Fluorescence Parameters and Organic Acids. Forests 2023, 14, 1582. [Google Scholar] [CrossRef]
- Tomaszewska-Sowa, M.; Keutgen, N.; Lošák, T.; Figas, A.; Keutgen, A.J. Pseudomonas syringae Infection Modifies Chlorophyll Fluorescence in Nicotiana tabacum. Agriculture 2022, 12, 1504. [Google Scholar] [CrossRef]
- Mur, L.A.; Kenton, P.; Lloyd, A.J.; Ougham, H.; Prats, E. The hypersensitive response; the centenary is upon us but how much do we know? Journal of experimental Botany 2008, 59, 501–520. [Google Scholar] [CrossRef]
- Hwang, Y.B.; Eom, T.S.; Yoo, S.Y.; Choi, J.Y.; Kim, T.W. Chlorophyll Fluorescence Image Interpretation Based on Fire Blight Severity Assessment in Pear Trees. Journal of Environmental Science International 2024, 33, 923–931. [Google Scholar] [CrossRef]
- Billing, E. The effect of temperature on the growth of the fireblight pathogen, Erwinia amylovora. Journal of Applied Microbiology 1974, 37, 643–648. [Google Scholar] [CrossRef]
- Shwartz, H.; Shtienberg, D.; Vintal, H.; Kritzman, G. The interacting effects of temperature, duration of wetness and inoculum size on the infection of pear blossoms by Erwinia amylovora, the causal agent of fire blight. Phytoparasitica 2003, 31, 174–187. [Google Scholar] [CrossRef]
- Alazem, M.; Lin, N.S. Roles of plant hormones in the regulation of host–virus interactions. Molecular plant pathology 2015, 16, 529–540. [Google Scholar] [CrossRef] [PubMed]
- Kamber, T.; Buchmann, J.P.; Pothier, J.F.; Smits, T.H.; Wicker, T.; Duffy, B. Fire blight disease reactome: RNA-seq transcriptional profile of apple host plant defense responses to Erwinia amylovora pathogen infection. Scientific reports 2016, 6, 21600. [Google Scholar] [CrossRef]
- Qian, Z.; He, L.; Li, F. Understanding cold stress response mechanisms in plants: an overview. Frontiers in Plant Science 2024, 15, 1443317. [Google Scholar] [CrossRef] [PubMed]
- Magyar, M.; Sipka, G.; Han, W.; Li, X.; Han, G.; Shen, J.-R.; Lambrev, P.H.; Garab, G. Characterization of the rate-limiting steps in the dark-to-light transitions of closed photosystem II: temperature dependence and invariance of waiting times during multiple light reactions. International journal of molecular sciences 2022, 24, 94. [Google Scholar] [CrossRef]
- Yang, S.-J.; Wales, D.J.; Woods, E.J.; Fleming, G.R. Design principles for energy transfer in the photosystem II supercomplex from kinetic transition networks. Nature Communications 2024, 15, 8763. [Google Scholar] [CrossRef] [PubMed]
- Ramakers, L.A.; Harbinson, J.; van Amerongen, H. A Novel Multivariate Analysis: Overturning Long-Held Beliefs About Non-Photochemical Quenching. Physiologia Plantarum 2025, 177, e70420. [Google Scholar] [CrossRef] [PubMed]
- Adir, N.; Zer, H.; Shochat, S.; Ohad, I. Photoinhibition–a historical perspective. Photosynthesis research 2003, 76, 343–370. [Google Scholar] [CrossRef]
- Nishiyama, Y.; Allakhverdiev, S.I.; Murata, N. A new paradigm for the action of reactive oxygen species in the photoinhibition of photosystem II. Biochimica et Biophysica Acta (BBA)-Bioenergetics 2006, 1757, 742–749. [Google Scholar] [CrossRef] [PubMed]
- Launay, A.; Patrit, O.; Wénès, E.; Fagard, M. DspA/E Contributes to Apoplastic Accumulation of ROS in Non-host A. thaliana. Frontiers in Plant Science 2016, 7, 545. [Google Scholar] [CrossRef]
- Lee, Y.; Ko, Y.M.; Kwak, Y.-S. Genetic and Nutritional Dynamics of SynCom in Suppressing Apple Fire Blight. The Plant Pathology Journal 2025, 41, 380. [Google Scholar] [CrossRef]
- Bonasera, J.M.; Kim, J.F.; Beer, S.V. PR genes of apple: identification and expression in response to elicitors and inoculation with Erwinia amylovora. BMC Plant Biology 2006, 6, 23. [Google Scholar] [CrossRef]
- Torres, M.A.; Jones, J.D.; Dangl, J.L. Reactive oxygen species signaling in response to pathogens. Plant physiology 2006, 141, 373–378. [Google Scholar] [CrossRef] [PubMed]
- Abdollahi, H.; Ghahremani, Z.; Erfaninia, K.; Mehrabi, R. Role of electron transport chain of chloroplasts in oxidative burst of interaction between Erwinia amylovora and host cells. Photosynthesis Research 2015, 124, 231–242. [Google Scholar] [CrossRef]
- Piqué, N.; Miñana-Galbis, D.; Merino, S.; Tomás, J.M. Virulence factors of Erwinia amylovora: a review. International journal of molecular sciences 2015, 16, 12836–12854. [Google Scholar] [CrossRef]
- Suárez, J.C.; Vanegas, J.I.; Contreras, A.T.; Anzola, J.A.; Urban, M.O.; Beebe, S.E.; Rao, I.M. Chlorophyll fluorescence imaging as a tool for evaluating disease resistance of common bean lines in the western Amazon region of Colombia. Plants 2022, 11, 1371. [Google Scholar] [CrossRef]
- Levin, G.; Yasmin, M.; Liran, O.; Hanna, R.; Kleifeld, O.; Horev, G.; Wollman, F.-A.; Schuster, G.; Nawrocki, W.J. Processes independent of nonphotochemical quenching protect a high-light-tolerant desert alga from oxidative stress. Plant physiology 2025, 197, kiae608. [Google Scholar] [CrossRef]
- Ivanov, D.A.; Bernards, M.A. Chlorophyll fluorescence imaging as a tool to monitor the progress of a root pathogen in a perennial plant. Planta 2016, 243, 263–279. [Google Scholar] [CrossRef] [PubMed]
- Oh, S.; Moon, K.H.; Son, I.-C.; Song, E.Y.; Moon, Y.E.; Koh, S.C. Growth, Photosynthesis and Chlorophyll Fluorescence of Chinese Cabbage in Response to High Temperature Horticultural Science and Technology 2014, 32, 318-329. [CrossRef]
- Chojak-Koźniewska, J.; Kuźniak, E.; Zimny, J. The effects of combined abiotic and pathogen stress in plants: insights from salinity and Pseudomonas syringae pv lachrymans interaction in cucumber. Frontiers in plant science 2018, 9, 1691. [Google Scholar] [CrossRef] [PubMed]
- Balfagón, D.; Zandalinas, S.I.; dos Reis de Oliveira, T.; Santa-Catarina, C.; Gómez-Cadenas, A. Reduction of heat stress pressure and activation of photosystem II repairing system are crucial for citrus tolerance to multiple abiotic stress combination. Physiologia plantarum 2022, 174, e13809. [Google Scholar] [CrossRef] [PubMed]
- Pinheiro, C.; Chaves, M.M. Photosynthesis and drought: can we make metabolic connections from available data? Journal of experimental botany 2011, 62, 869–882. [Google Scholar] [CrossRef] [PubMed]
- Ramegowda, V.; Senthil, A.; Senthil-Kumar, M. Stress combinations and their interactions in crop plants. Plant Physiology Reports 2024, 29, 1–5. [Google Scholar] [CrossRef]
Figure 1.
The disease triangle which occurs due to the complex interactions between the host, pathogen, and environmental factors.
Figure 1.
The disease triangle which occurs due to the complex interactions between the host, pathogen, and environmental factors.
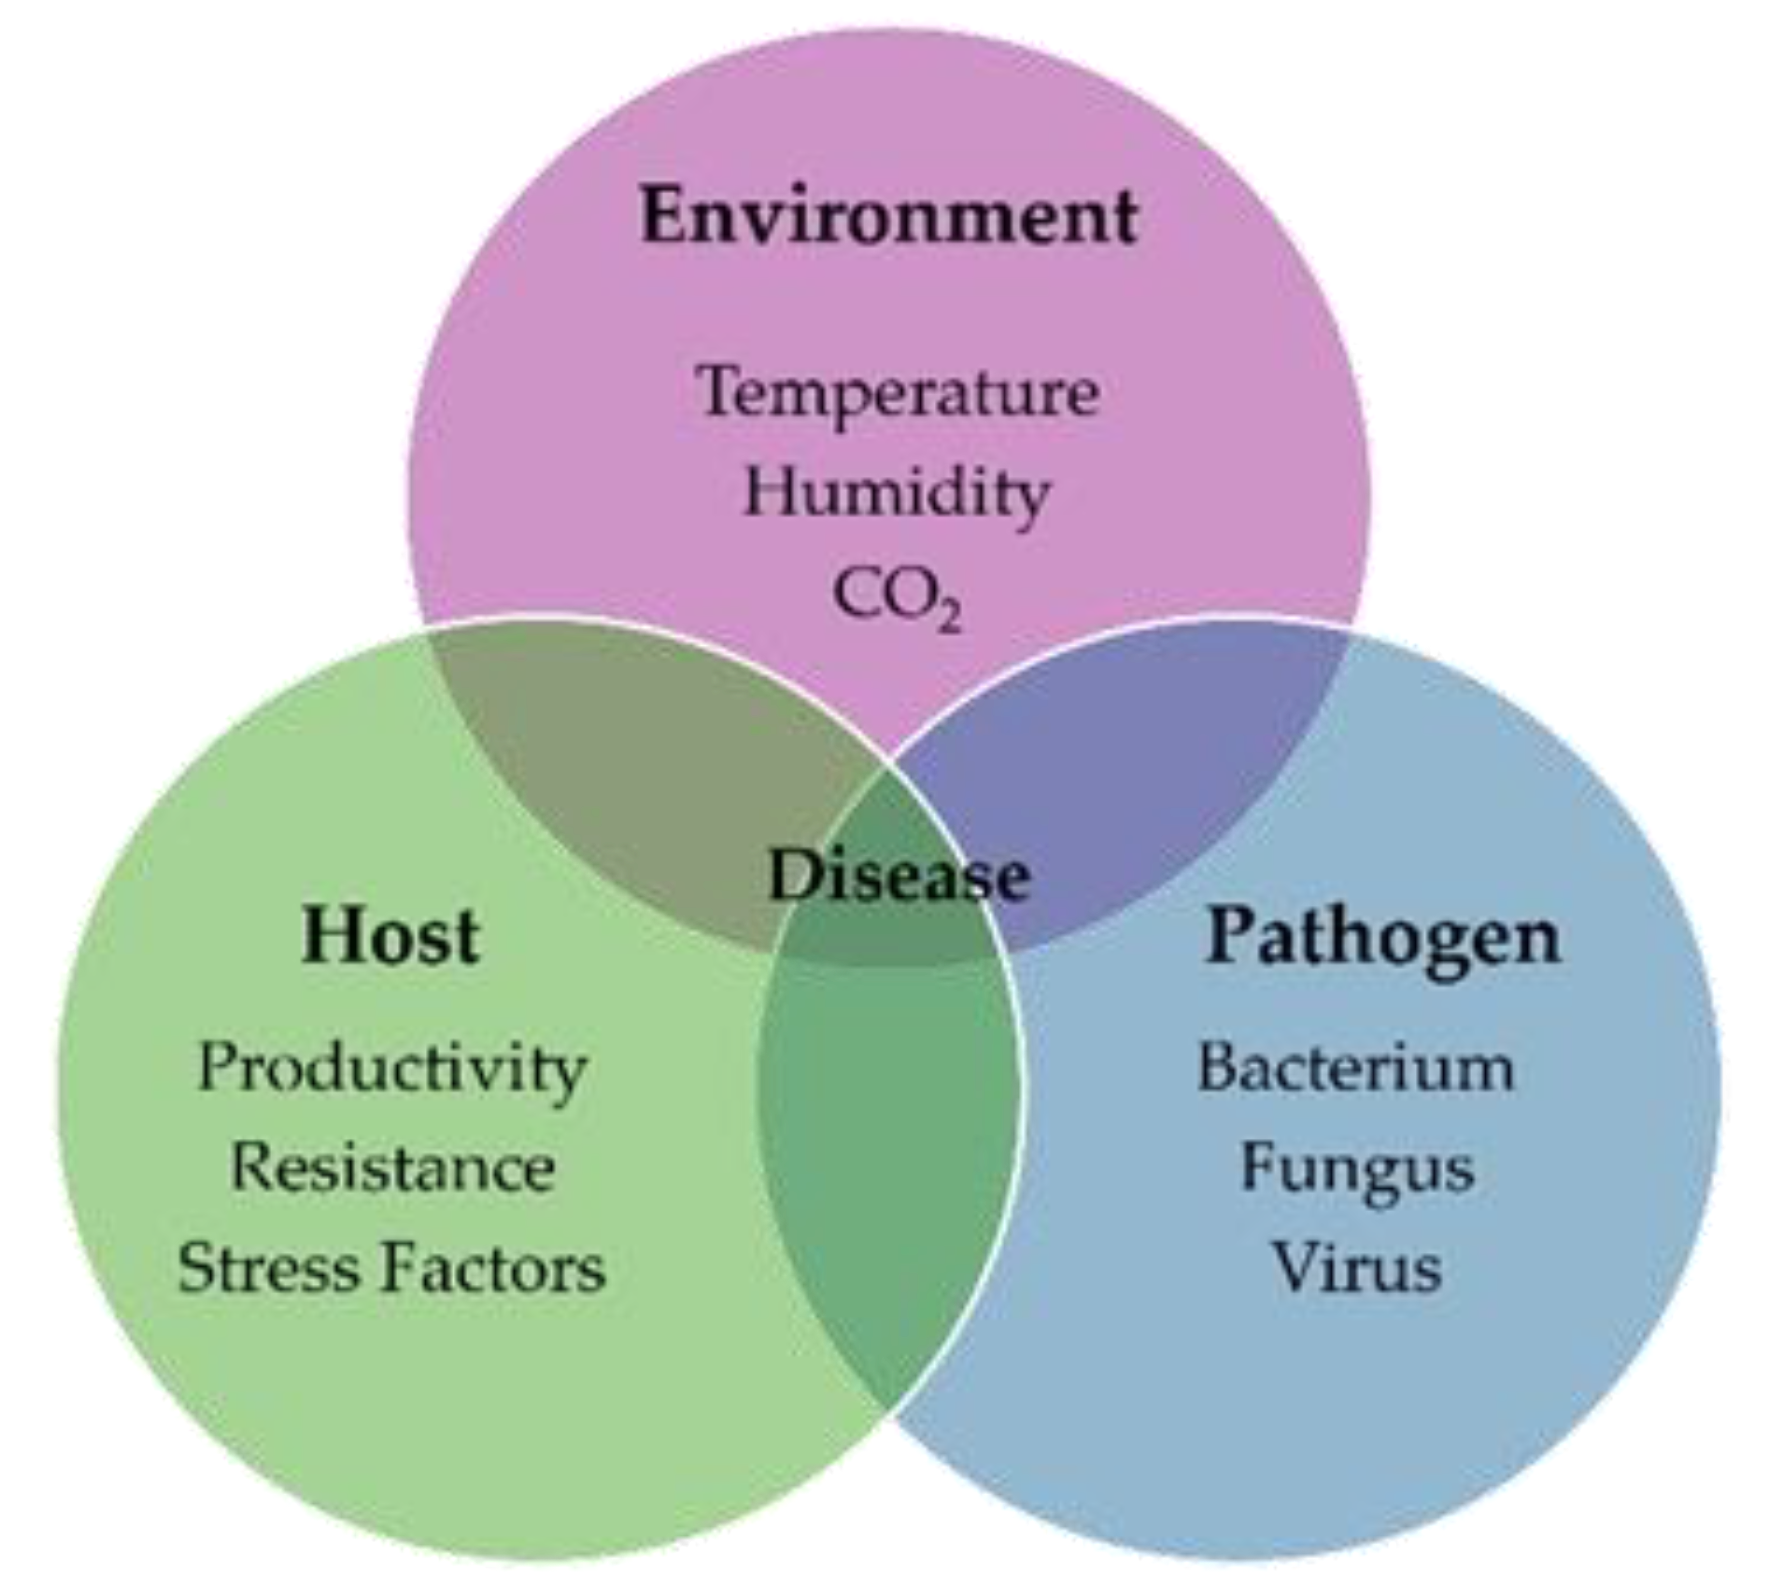
Figure 2.
Relative chlorophyll fluorescence responses of pear leaves under different temperature treatments (10, 15, 25, 30, and 35℃). Radar plots illustrate the relative values of chlorophyll fluorescence parameters at (a) 1, (b) 3, (c) 5, and (d) 7 days after treatment. All parameters were normalized to their maximum values within each treatment (set to 1) to facilitate visualization of relative changes. Actual non-normalized values and statistical analyses are provided in Appendix Table A1.
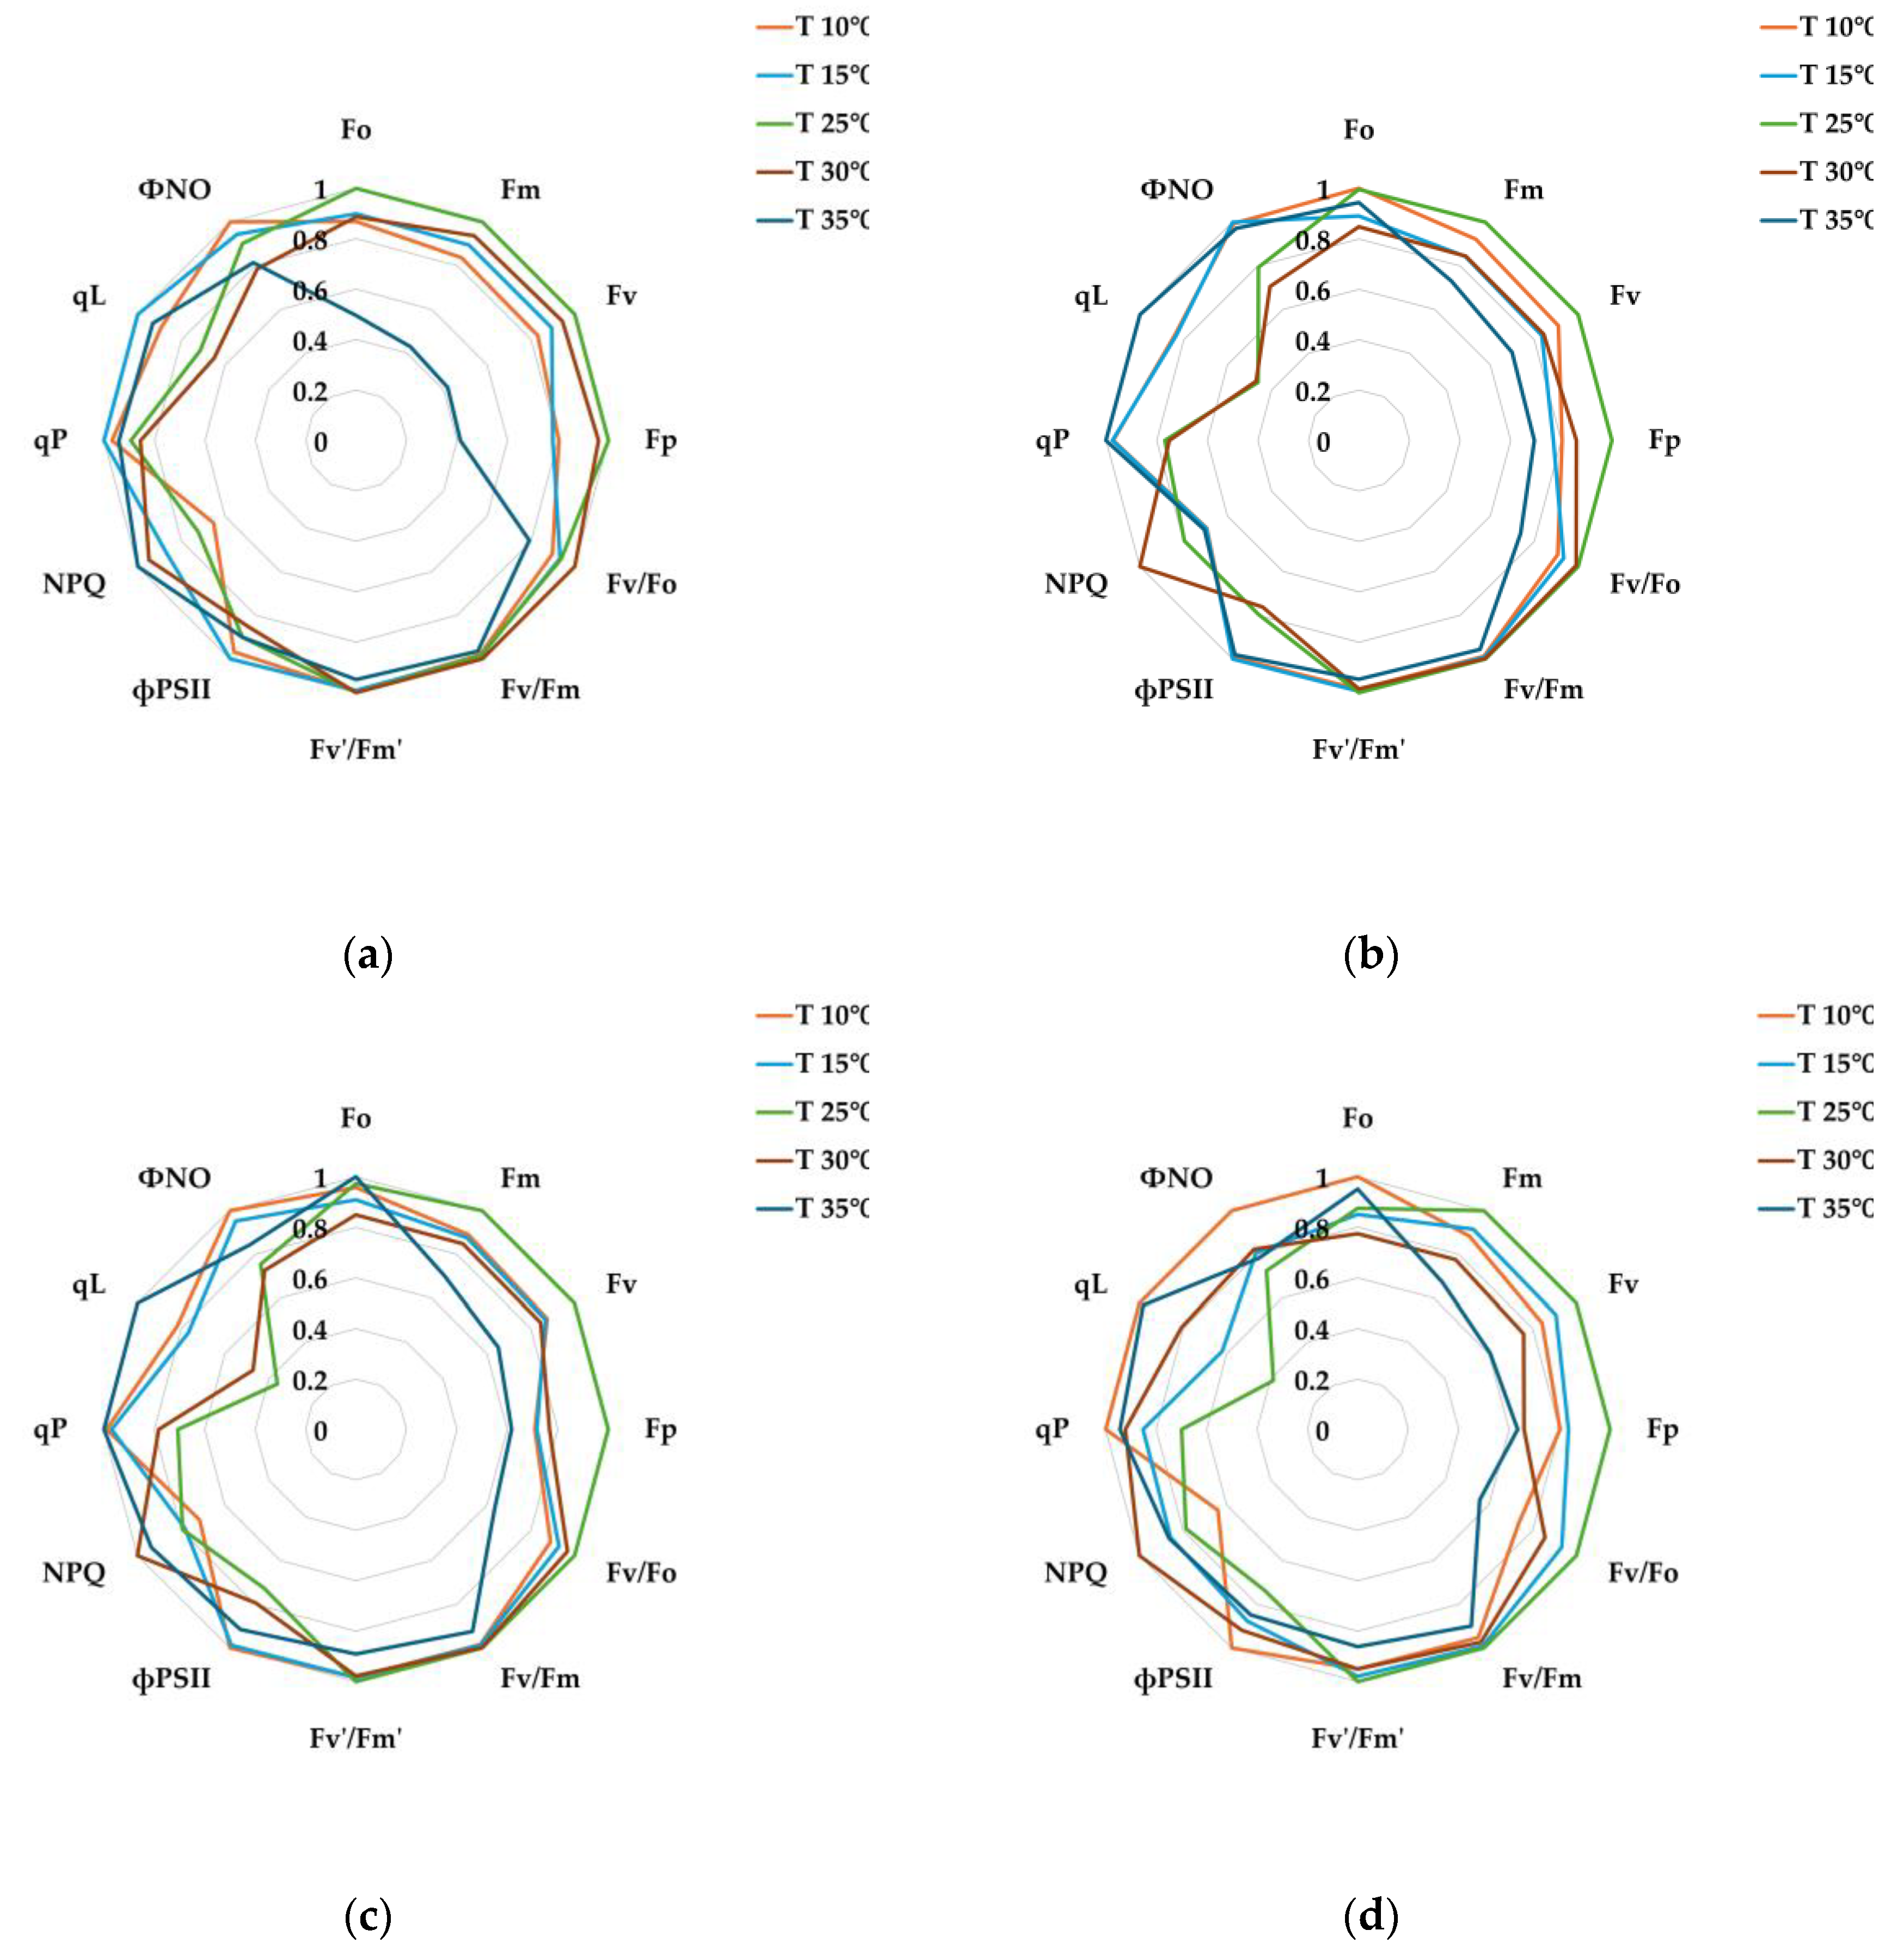
Figure 3.
Relative chlorophyll fluorescence responses of pear leaves under pathogen treatments (non-inoculated vs. E. amylovora inoculated) at the optimal photosynthetic temperature (25℃). Radar plots display normalized values of chlorophyll fluorescence parameters at (a) 1, (b) 3, (c) 5, and (d) 7 days after inoculation. Parameters were normalized to their maximum values within each treatment to highlight relative differences. Corresponding raw data and statistical comparisons are available in Appendix Table A2.
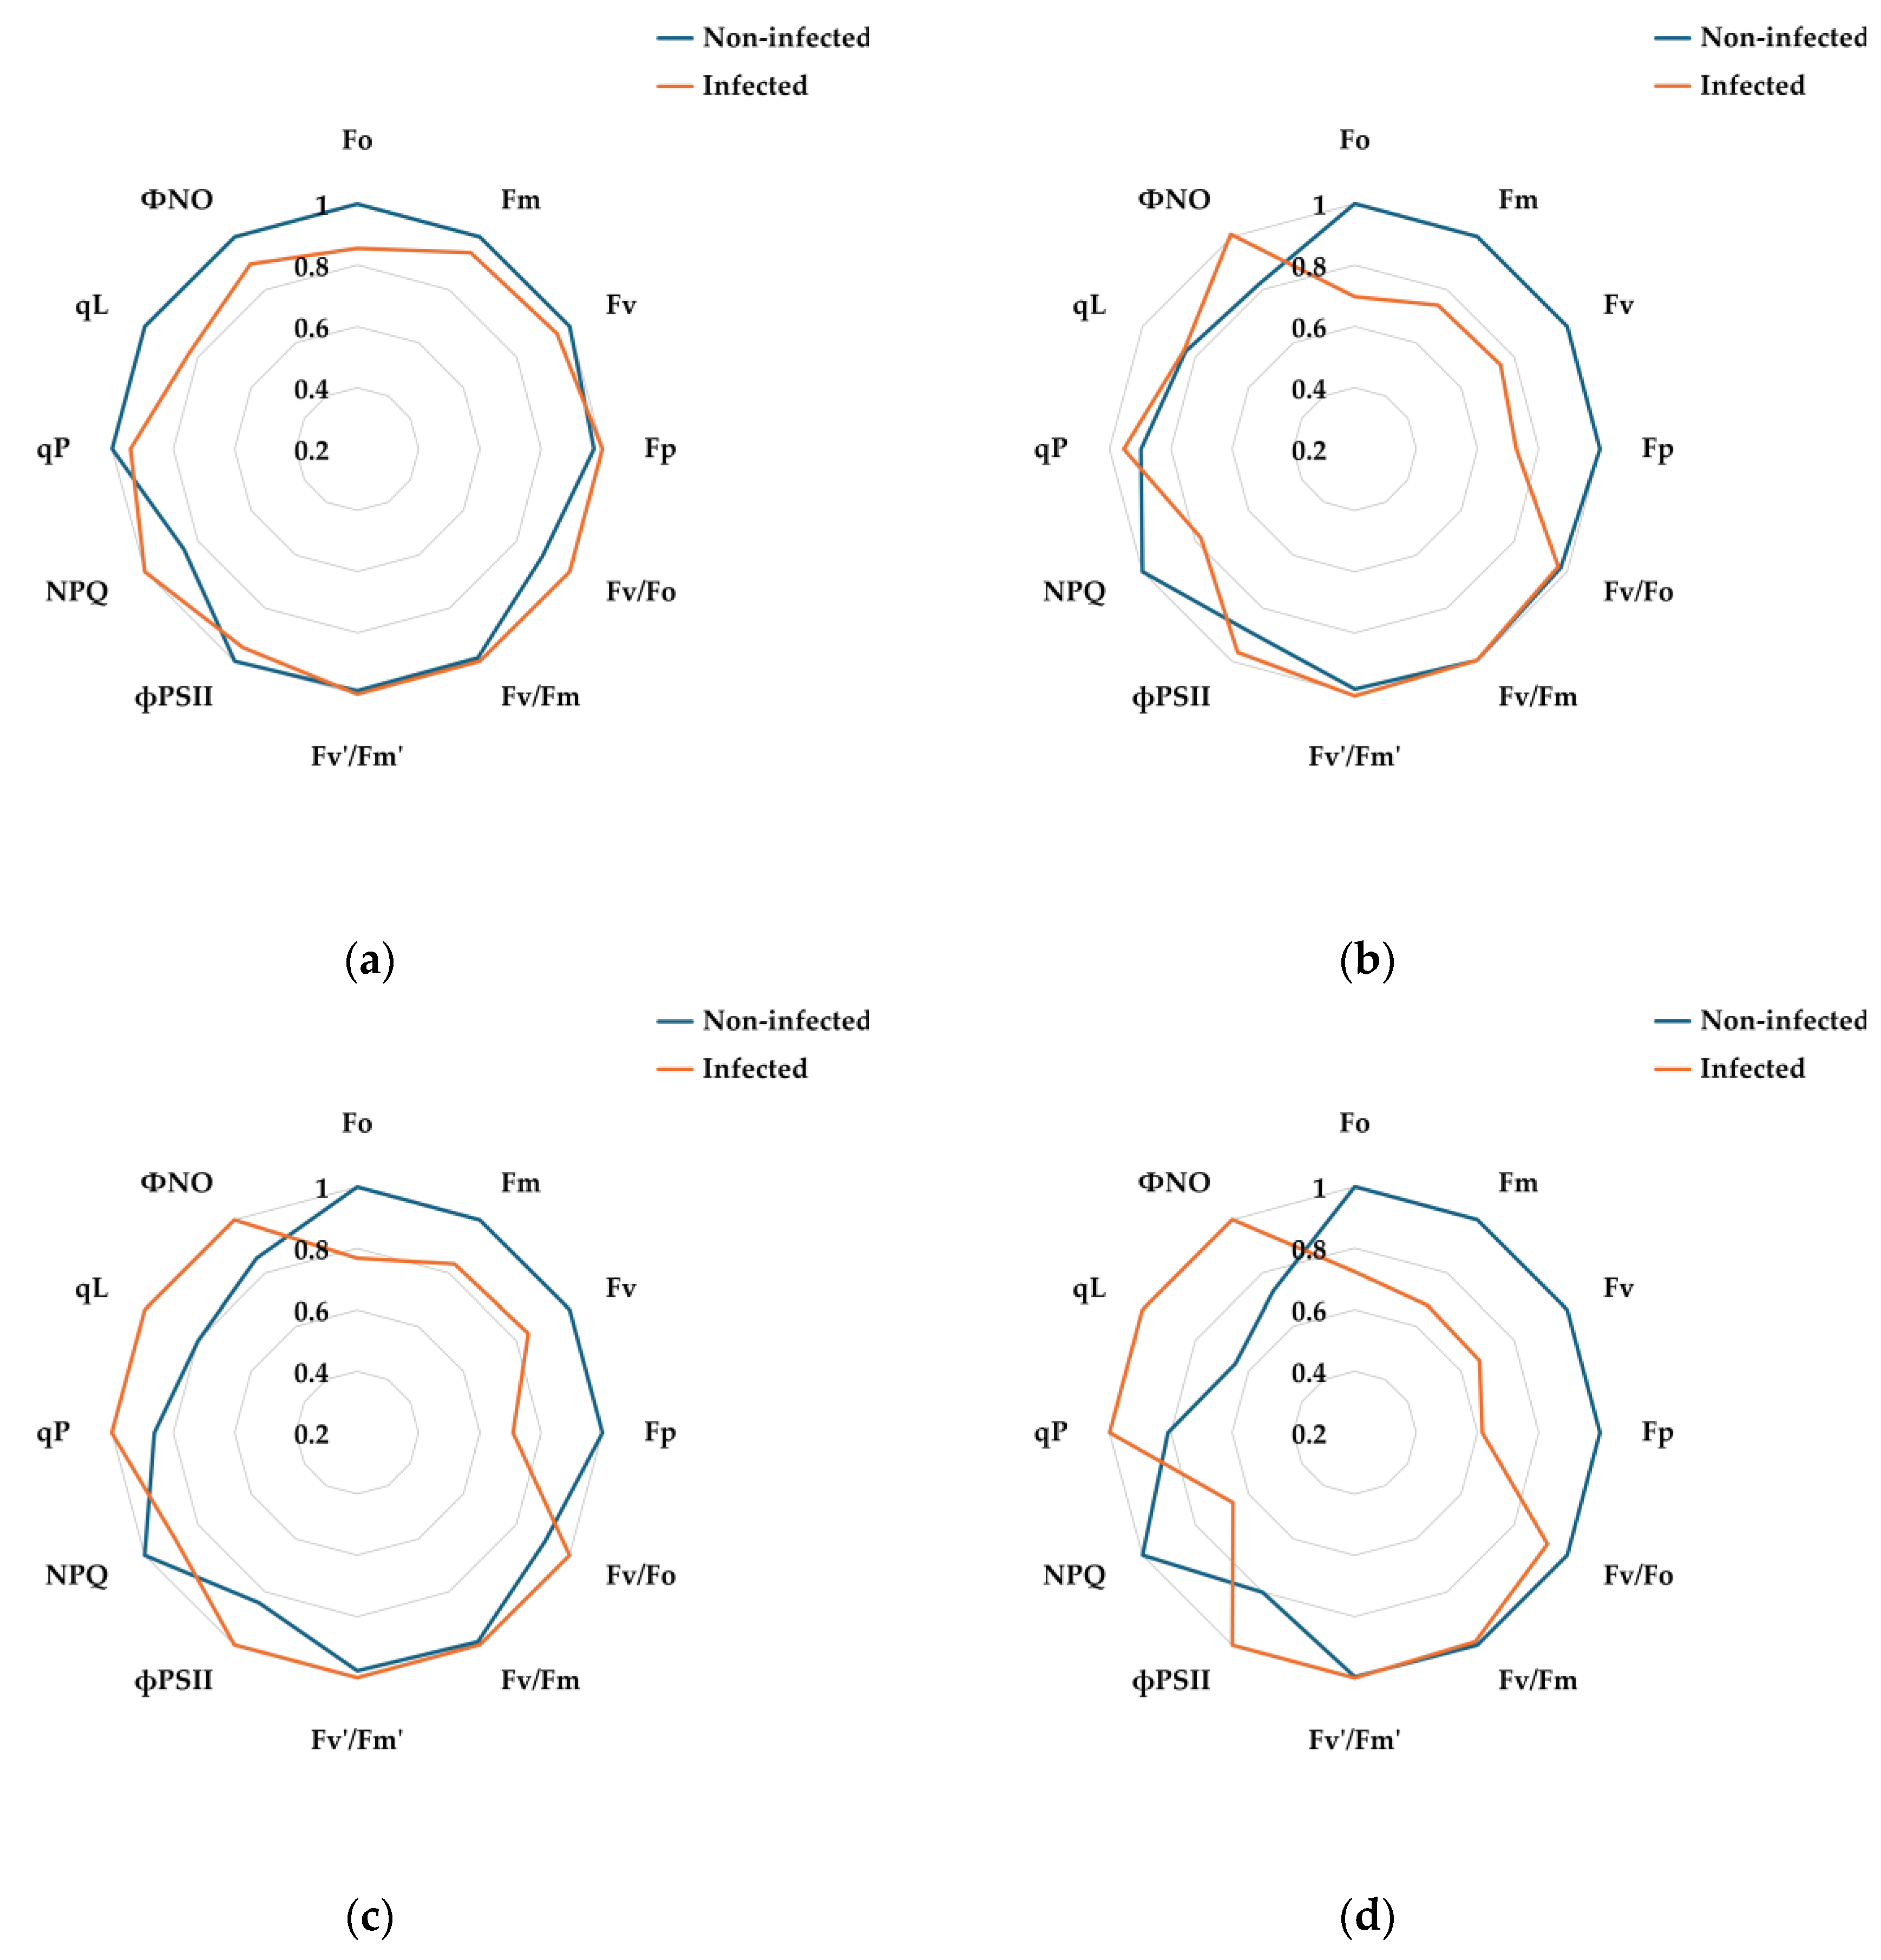
Figure 4.
Representative RGB images of pear leaf discs inoculated with E. amylovora and incubated under five temperature conditions (10, 15, 25, 30, and 35℃) for 7 days. Images were acquired at multiple time points to visualize lesion development (Black necrotic). Lesion areas were quantified using FIELDimageR, and values were subsequently used to calculate AUDPC (see Figure 5).
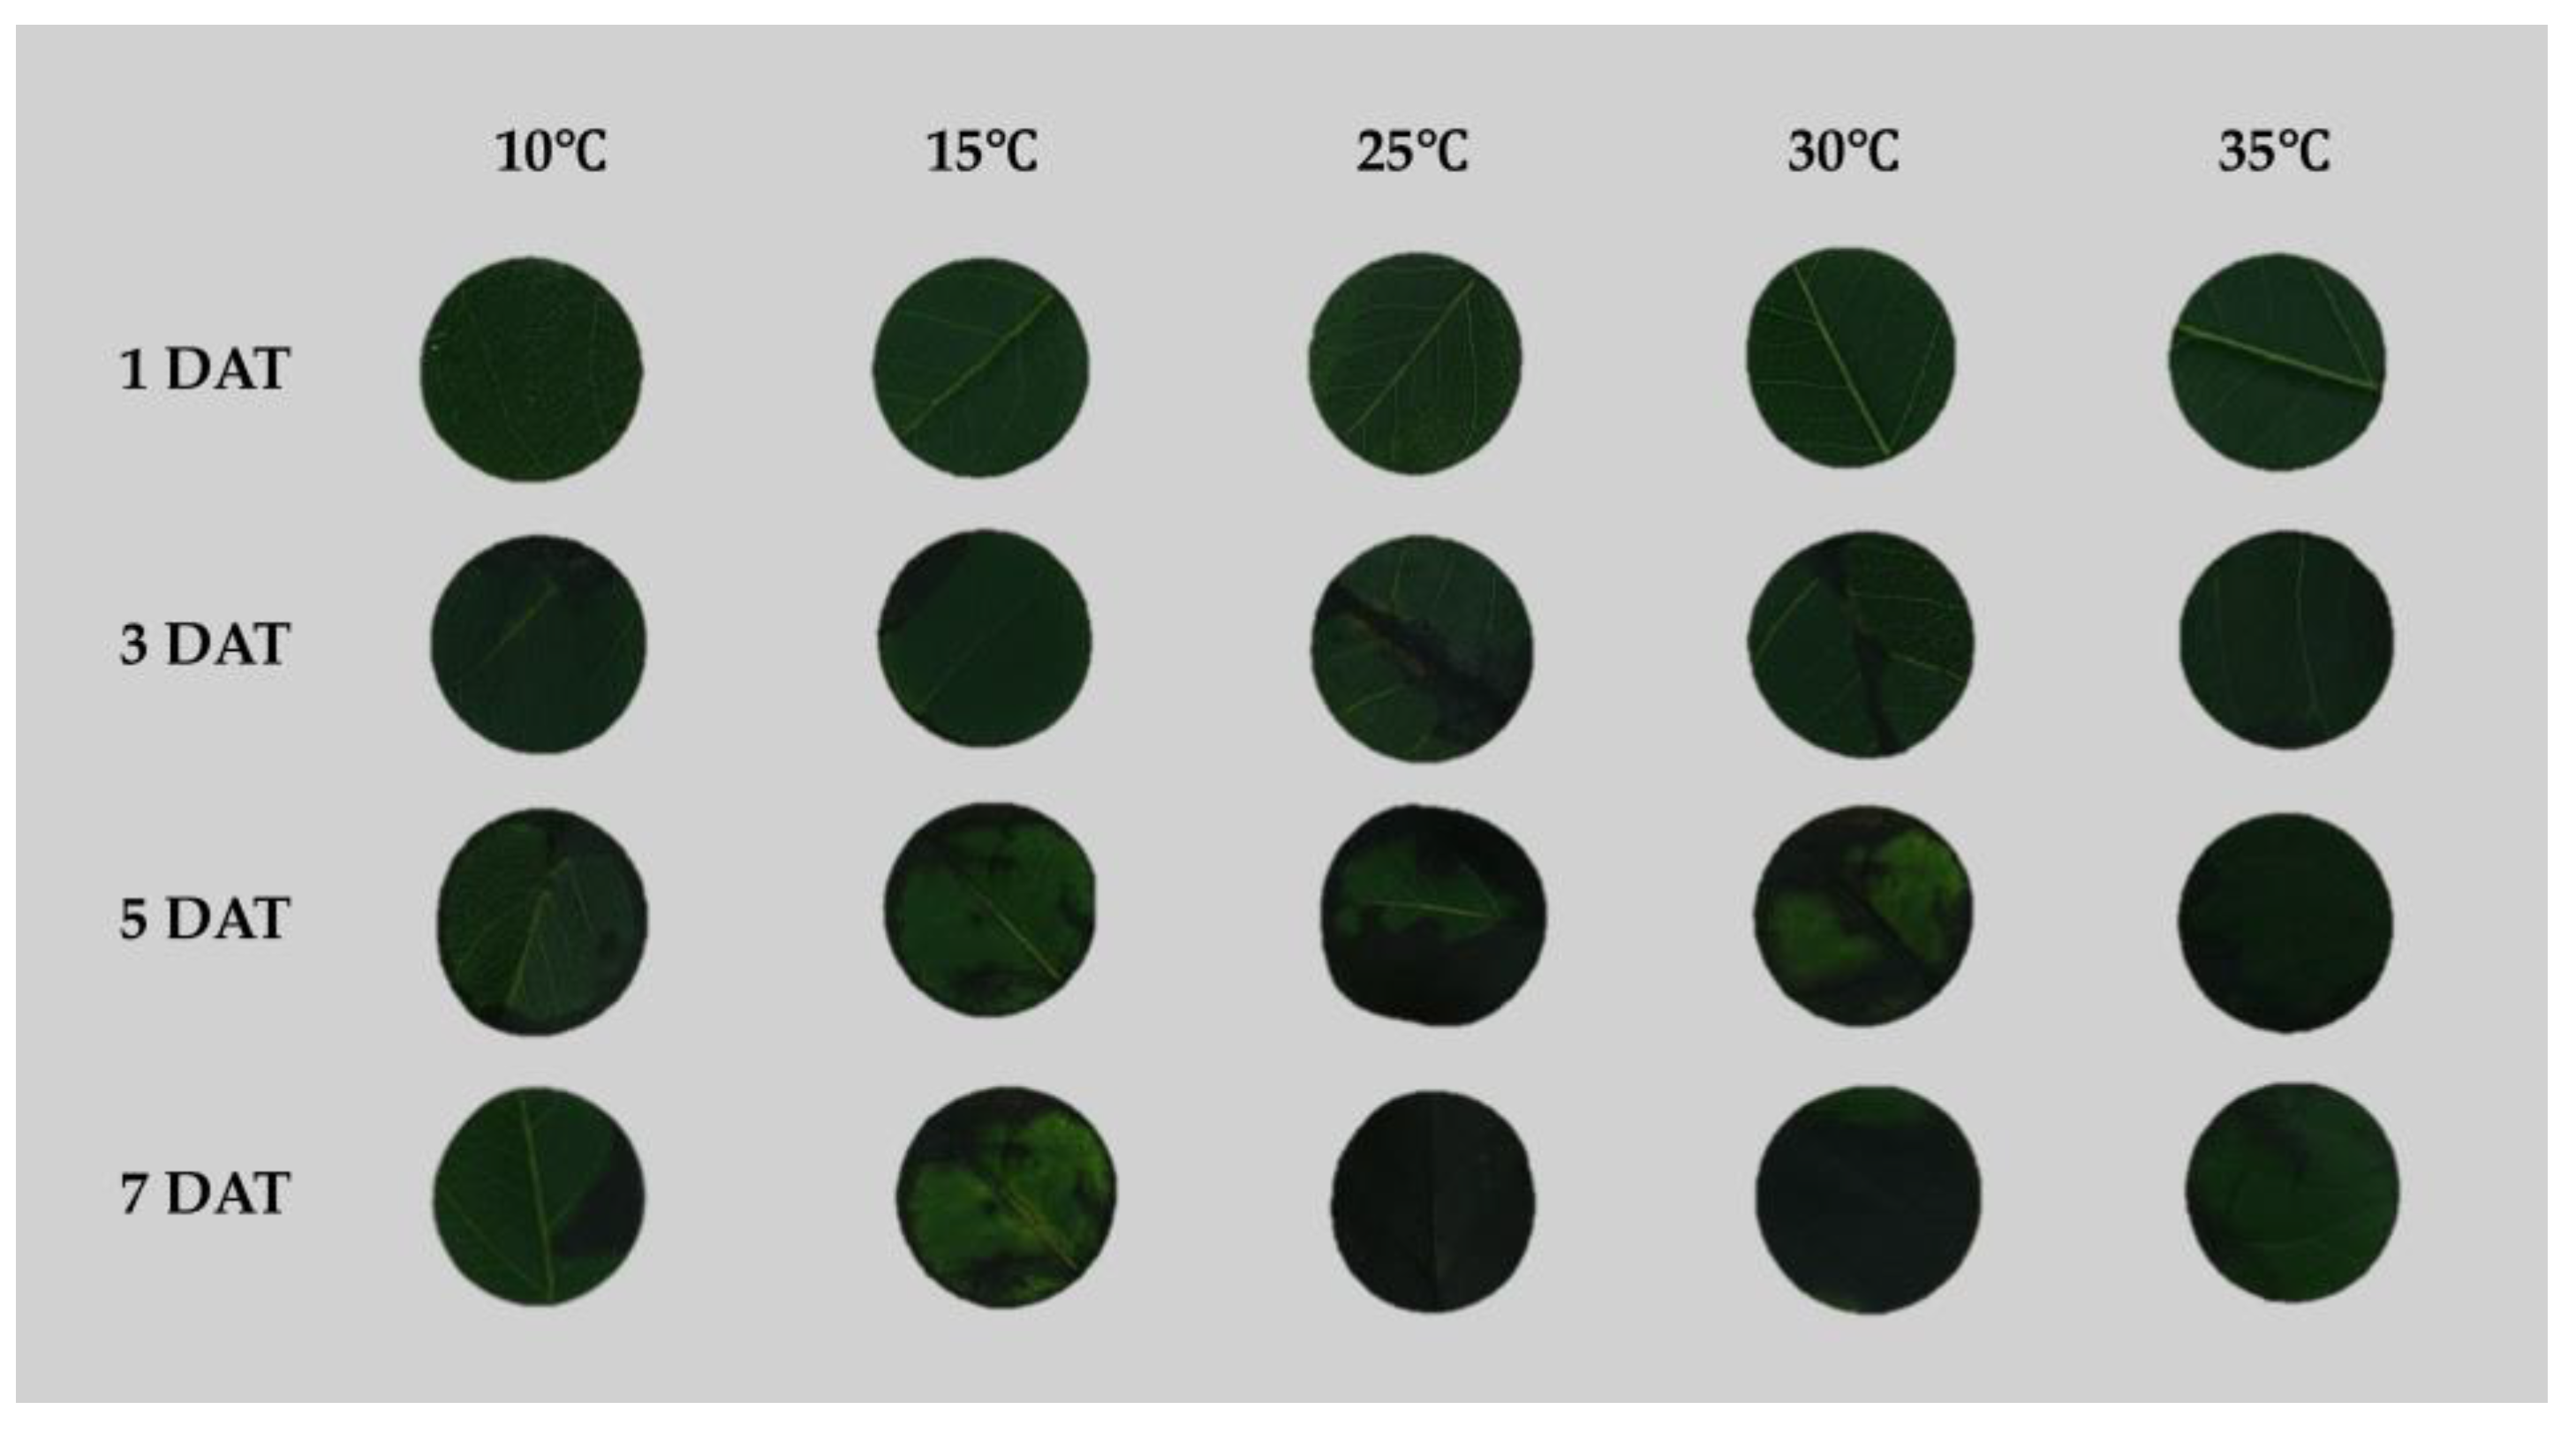
Figure 5.
Fire blight disease progression in pear leaf discs under different temperature conditions. (a) Daily progression of lesion area expressed as mean ± 95% confidence interval (CI); (b) Total AUDPC values calculated for each temperature treatment using the trapezoidal method. Data represent plant-level means derived from replicate discs.
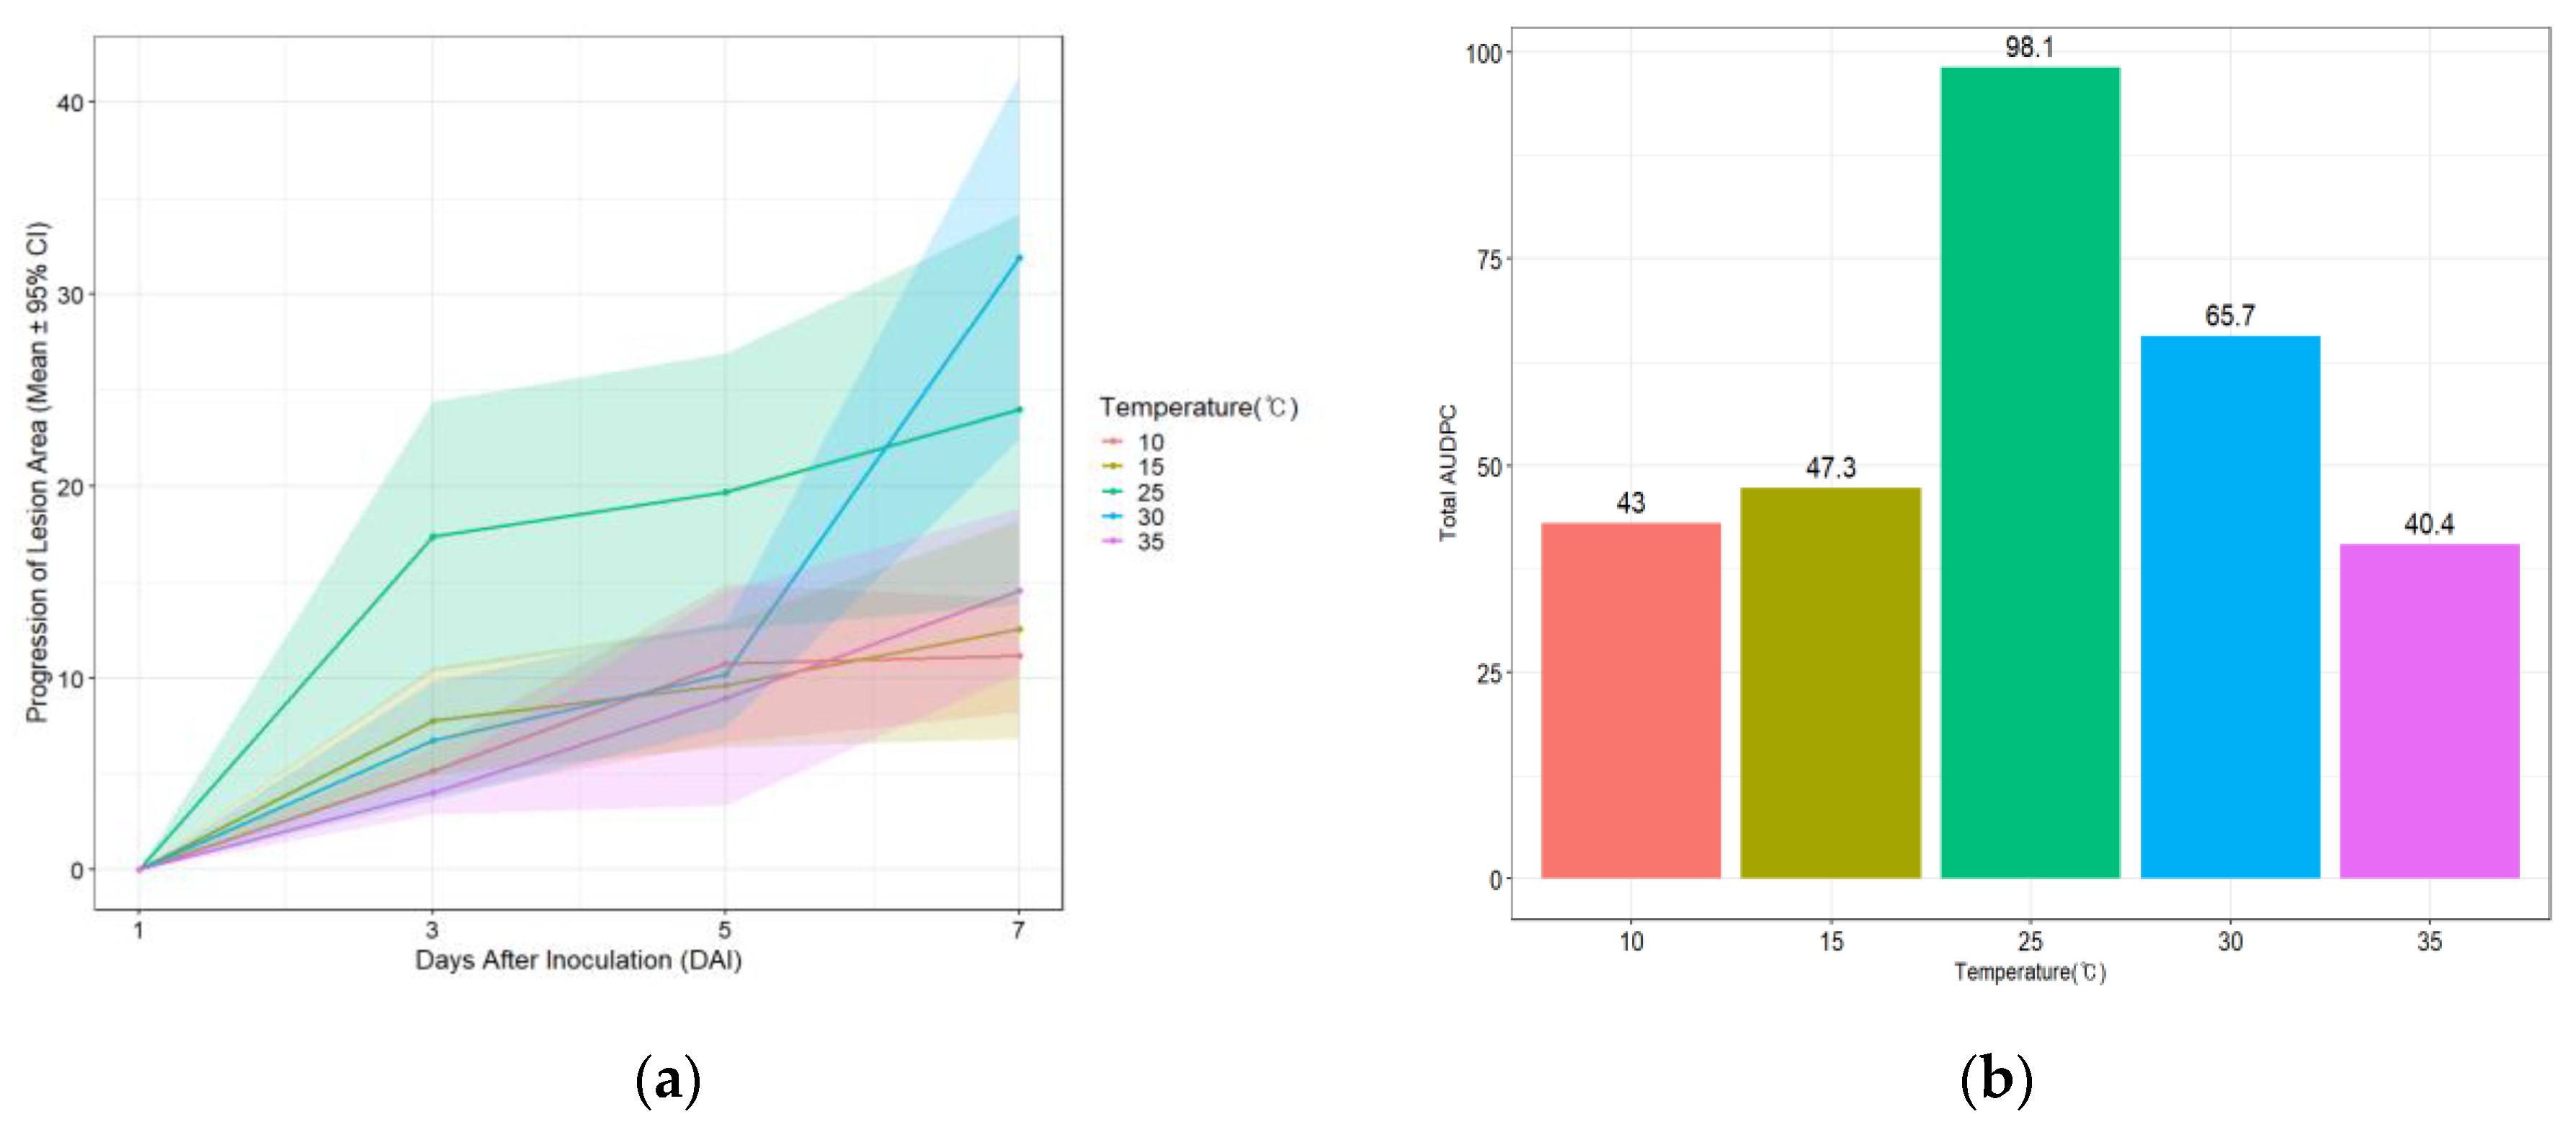
Figure 6.
Relative chlorophyll fluorescence responses of pear leaves exposed to combined stresses (temperature × pathogen). Radar plots show normalized values of chlorophyll fluorescence parameters at (a) 1, (b) 3, (c) 5, and (d) 7 days after treatment. Each parameter was normalized to its maximum value within the treatment (set to 1). Non-normalized data and statistical results are presented in Appendix Table A3.
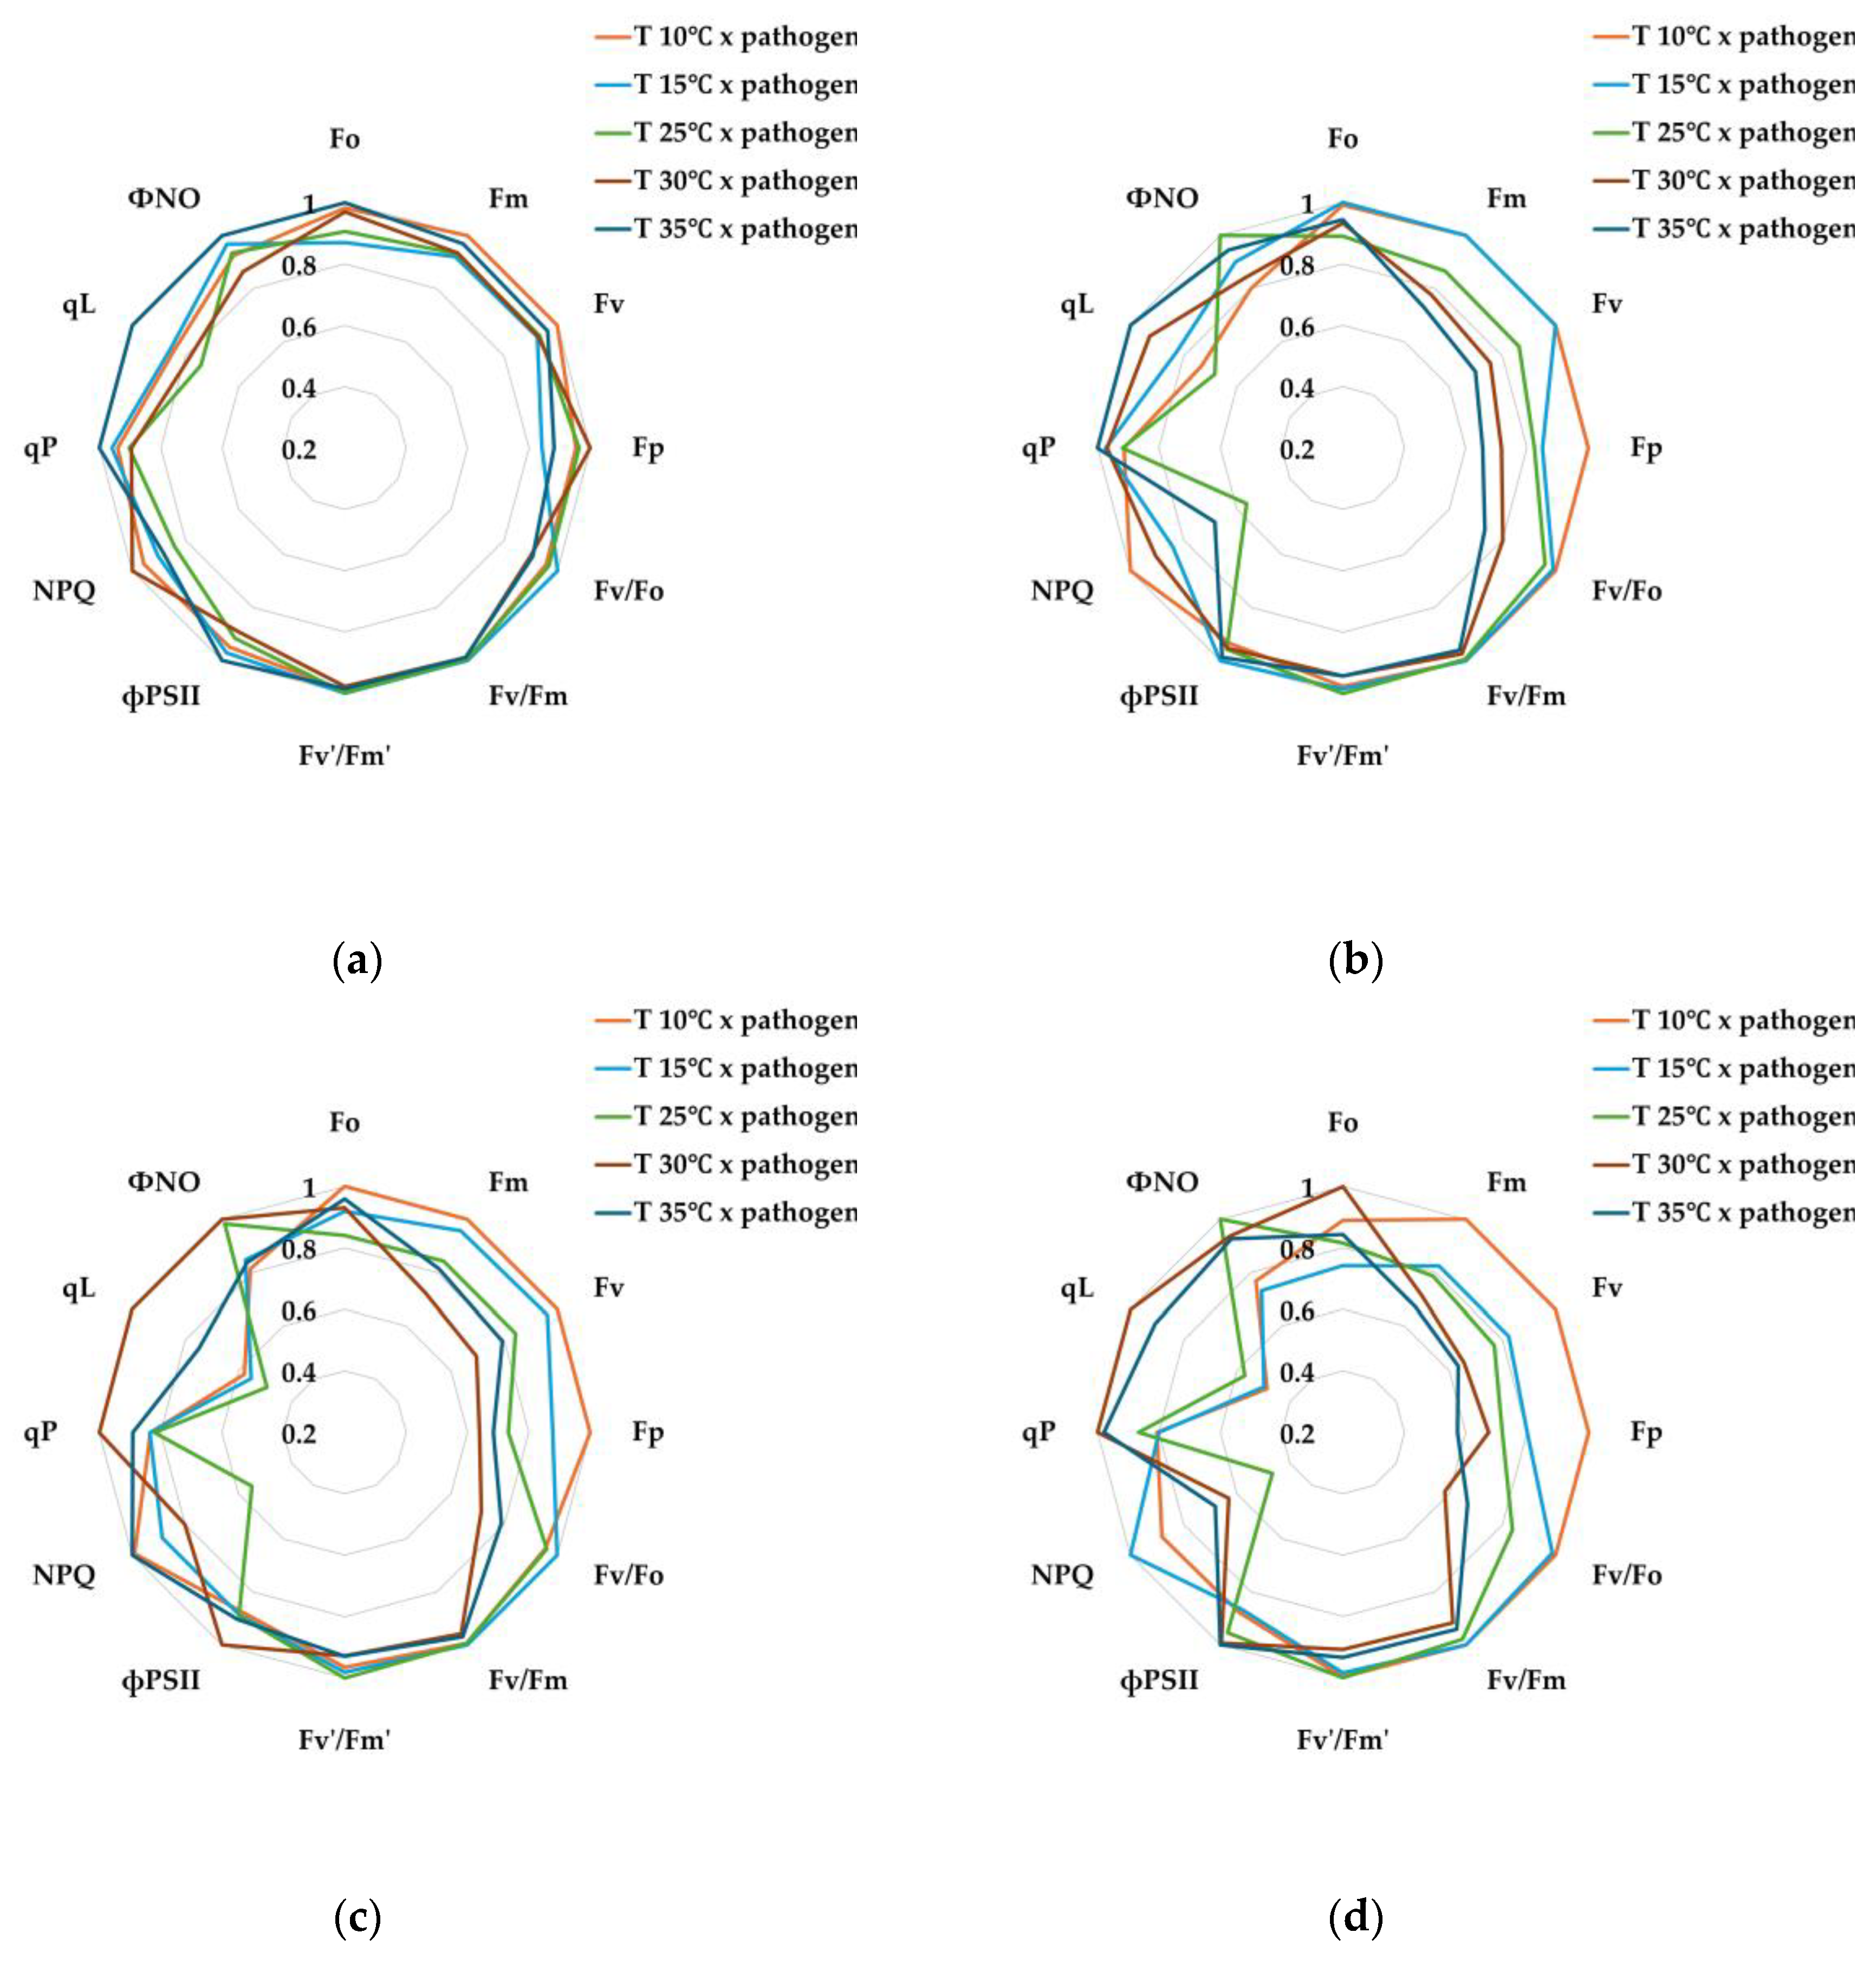
Table 1.
Formulas and descriptions of chlorophyll fluorescence parameters applied in this study.
| Parameter | Description |
|---|---|
| Fo | Minimum fluorescence from dark- adapted leaf, respectively |
| Fm | Maximal fluorescence from dark- adapted leaf, respectively |
| Fv | Variable fluorescence from dark- adapted leaf, respectively |
| Fp | Maximum Chl fluorescence at a non-saturating light pulse in the dark-adapted state |
| Fv/Fo | Maximum quantum yield of PSII photochemistry after dark-adaptation |
| Fv/Fm | Maximum PSII quantum yield(dark-adapted) |
| Fv’/Fm’ | Maximum efficiency of open PSII centers in the light |
| фPSII | PSII operating efficiency: the quantum efficiency of PSII electron transport in the light |
| NPQ | Nonphotochemical quenching: estimates the rate constant for heat loss from PSII |
| qP | Photochemical quenching: relates PSII maximum efficiency to operating efficiency. Non-linearly related to proportion of PSII centers that are open |
| qL | Estimates the fraction of open PSII centers |
| фNO | Quantum yield of non-regulated quenching processes |
Table 2.
Descriptions of fixed-effect coefficients, random effects, and residuals used in the linear mixed-effects model for chlorophyll fluorescence parameters.
Table 2.
Descriptions of fixed-effect coefficients, random effects, and residuals used in the linear mixed-effects model for chlorophyll fluorescence parameters.
| Coefficient | Meaning | Description |
|---|---|---|
| Intercept | The mean value of the CF parameter when all variables (Temperature, Infection, DAT) are set to 0 | |
| Temperature | Main effect of temperature treatment | |
| Infection | Main effect of pathogen treatment | |
| DAT | Main effect of treatment duration (Days after treatment) | |
| Temperature x Infection | Interaction effect between temperature and pathogen treatment | |
| Temperature x DAT | Interaction effect between temperature and treatment duration | |
| Infection x DAT | Interaction effect between pathogen treatment and treatment duration | |
| Temperature x Infection x DAT | Three-way interaction effect, representing the combined effect beyond the sum of individual effects | |
| Random effect | -th plant, accounting for inter-individual variability in repeated measures | |
| Residual | Residual errors, assumed to follow a normal distribution with mean 0 and variance σ² |
Table 3.
Main effects of temperature, infection, and DAT on chlorophyll fluorescence parameters based on linear mixed model (LMM) analysis.
Table 3.
Main effects of temperature, infection, and DAT on chlorophyll fluorescence parameters based on linear mixed model (LMM) analysis.
| Parameter | Temperature (T) | Infection (I) | DAT (D) | |||
|---|---|---|---|---|---|---|
| F - value | Sig. | F - value | Sig. | F - value | Sig. | |
| Fo | 1.5107 | ns | 4.8199 | . | 0.6349 | ns |
| Fm | 2.2131 | ns | 0.0058 | ns | 0.6253 | ns |
| Fv | 2.0897 | ns | 0.0064 | ns | 0.6511 | ns |
| Fp | 0.3626 | ns | 0.3472 | ns | 1.0072 | ns |
| Fv/Fo | 0.8790 | ns | 2.2823 | ns | 0.7895 | ns |
| Fv/Fm | 1.6344 | ns | 0.6639 | ns | 0.2050 | ns |
| Fv’/Fm’ | 2.6528 | ns | 0.0193 | ns | 0.4151 | ns |
| фPSII | 5.1698 | . | 4.5908 | . | 0.8348 | ns |
| NPQ | 2.0343 | ns | 4.7935 | . | 0.6574 | ns |
| qP | 0.8187 | ns | 2.1925 | ns | 0.3059 | ns |
| qL | 0.0649 | ns | 1.7499 | ns | 0.0700 | ns |
| фNO | 8.2345 | * | 10.6712 | * | 1.4003 | ns |
1 Results of the linear mixed model (LMM) analysis showing the main effects of Temperature (T), Infection (I), and DAT (D) on chlorophyll fluorescence parameters. Significance (Sig.) was assessed using Type III ANOVA with Satterthwaite’s approximation (ns: not significant; . : p < 0.1; *: p < 0.05).
Table 4.
Two- and three-way interaction effects of temperature, infection, and DAT on chlorophyll fluorescence parameters based on linear mixed model analysis.
Table 4.
Two- and three-way interaction effects of temperature, infection, and DAT on chlorophyll fluorescence parameters based on linear mixed model analysis.
| Parameter | T : I | T : D | I : D | T : I : D | ||||
|---|---|---|---|---|---|---|---|---|
| F - value | Sig. | F - value | Sig. | F - value | Sig. | F - value | Sig. | |
| Fo | 0.9281 | ns | 1.2043 | ns | 1.2330 | ns | 1.5637 | ns |
| Fm | 0.0109 | ns | 0.4456 | ns | 1.0520 | ns | 4.2121 | ** |
| Fv | 0.0316 | ns | 0.3094 | ns | 0.9459 | ns | 4.4603 | ** |
| Fp | 0.5007 | ns | 1.0212 | ns | 1.6997 | ns | 5.1424 | ** |
| Fv/Fo | 1.0163 | ns | 0.2466 | ns | 1.6073 | ns | 2.7721 | * |
| Fv/Fm | 0.1408 | ns | 1.6991 | ns | 0.5648 | ns | 0.9399 | ns |
| Fv’/Fm’ | 0.0405 | ns | 1.6378 | ns | 0.3550 | ns | 0.4001 | ns |
| фPSII | 5.2121 | . | 0.8562 | ns | 0.7121 | ns | 2.2250 | . |
| NPQ | 3.7960 | . | 0.1148 | ns | 0.8292 | ns | 1.9511 | ns |
| qP | 2.1150 | ns | 0.7460 | ns | 0.8664 | ns | 2.5329 | . |
| qL | 1.3658 | ns | 0.1895 | ns | 1.4246 | ns | 2.8771 | * |
| фNO | 10.5137 | * | 0.2479 | ns | 0.4457 | ns | 1.3761 | ns |
1 Results of the linear mixed model (LMM) analysis showing two-way (T:I, T:D, I:D) and three-way (T:I:D) interaction effects of Temperature (T), Infection (I), and Days After Treatment (D) on chlorophyll fluorescence parameters. Significance(Sig.) was assessed using Type III ANOVA with Satterthwaite’s approximation (ns: not significant; .: p < 0.1; *: p < 0.05; **: p < 0.01).
Disclaimer/Publisher’s Note: The statements, opinions and data contained in all publications are solely those of the individual author(s) and contributor(s) and not of MDPI and/or the editor(s). MDPI and/or the editor(s) disclaim responsibility for any injury to people or property resulting from any ideas, methods, instructions or products referred to in the content. |
© 2025 by the authors. Licensee MDPI, Basel, Switzerland. This article is an open access article distributed under the terms and conditions of the Creative Commons Attribution (CC BY) license (http://creativecommons.org/licenses/by/4.0/).
Copyright: This open access article is published under a Creative Commons CC BY 4.0 license, which permit the free download, distribution, and reuse, provided that the author and preprint are cited in any reuse.


