
Submitted:
22 September 2025
Posted:
23 September 2025
You are already at the latest version
Abstract
Background/Objectives: The aim of the study was to determine whether incomplete follow-up and competing events may be associated with the clinical course in peripheral artery disease (PAD) patients after treatment and with known risk factors, such as chronic limb threatening ischemia (CLTI). Methods: In this retrospective, observatory study patients hospitalized with PAD were included, treated by endovascular or open-surgical means and followed-up. The primary outcome was reintervention free survival (RFS), secondary outcomes and competing events were major amputation and death. The follow-up index (FUI) was determined in each patient. Results: The FUI depended significantly on disease stage (CLTI) and tendentially on age. Independently from disease stage, patients with FUI<0.5 had a shorter RFS. When FUI and competing events were considered using the Fine-Gray regression analysis, CLTI and anterior tibial artery state were associated with the RFS, while FUI, CLTI and common femoral artery state were associated with major amputation free survival. Conclusions: Incomplete follow-up is associated with progressed PAD and itself may mask a worse outcome, such as reintervention, restenosis, major amputation or death. Competing events should also be considered possible bias sources. Therefore, FUI and competing events should be reported and conclusions drawn cautiously in clinical studies, being it observatory or randomized prospective ones.
Keywords:
vascular surgery
; peripheral artery disease
; incomplete follow-up
; competing risk
; Fine-Gray-Model
1. Introduction
Clinical trials investigating peripheral artery disease (PAD) or comparing new treatments methods focus on mid-term and long-term outcomes using overall survival, major amputation free survival or vessel patency as censored response variables. In most clinical trials, the follow-up of patients remained incomplete because patients stopped to take part in the follow-up or other events than the primary outcome took place.
The BEST-CLI trial, a large prospective randomized trial comparing a surgery first approach versus endovascular treatment for femoropopliteal reconstruction, reported that 786 of the 1847 initially randomized patients completed the follow-up, while 553 patients died or were lost to follow-up from other reasons [1].
In the BASIL trial, another comparative investigation focusing on the below-the-knee reconstructions, 241 of 345 enrolled patients reached the 24 months follow-up, all others were lost to follow-up from various reasons with a higher mortality in the venous bypass group [2]. The latter led the authors to the conclusion that the superiority of the endovascular first approach compared to the bypass first approach was mainly due to the excess mortality in the bypass group. That excess mortality was believed to be mainly cardiac, however the reason why the bypass cohort suffered more deaths than the endovascular cohort was not established [3].
Although among other events, death was registered as a secondary outcome in both trials, the further assessment of the primary outcome – primary or secondary vessel patency – was precluded by death, a competing event. Incomplete follow-up and competing risks are not necessarily evenly distributed among the various sub-cohorts, therefore, the analysis of the confounding effects for both were investigated in the present study.
Von Allmen et al. have shown that incomplete follow-up led to a profound underestimation of deaths during follow-up and the authors introduced the follow-up-index (FUI) to quantify the completeness of follow-up:
FUI = (C-A) / (B-A)
Where C-A: follow-up covered by the study, and B-A: potential duration of follow-up until closure of the study [4].
A FUI of 1 indicates complete follow-up. It was supposed that in a follow-up a mean FUI that differed from 1 by 0.1 may correspond to a 10% under-estimation of mortality [4]. Since the various competing risks may be subject to different cause-specific hazards, the Fine-Gray model describes the various effects of co-variates on the sub-distribution hazard function [5]. Other potential bias sources on the outcome analysis in survival analysis are clustering and time-variable hazard.
The aim of the present study was to evaluate the dependencies of incomplete-follow-up and the competing risks from various co-variates in a univariate comparison, followed by regression analysis of potential clinical predictors and determinants on the clinical course after endovascular and/or vascular surgical intervention in PAD patients, whereby death, major amputation, reintervention and restenosis/ re-occlusion were the competing outcomes and the vessel patency as well as clinical co-factors served as predictors. In other words, the anatomical and clinical co-factors were analyzed regarding the contribution to the long-term event-free survival, whereby considering the role of confounding effects on incomplete follow-up and competing risks.
2. Materials and Methods
2.1. Study Design and Inclusion Criteria
The investigation was conducted as a retrospective observational single-center study in a consecutive patient cohort with long-term follow-up. The treatment indications and principles were based on the respective applicable German guidelines of the Association of the Scientific Medical Societies (AWMF) for PAD [6,7,8,9,10,11]. All patients hospitalized and treated between January 2012 and December 2014 were included if they had been admitted for the first time as elective or urgent inpatients suffering from PAD Fontaine stages II b – IV. The patients were followed up until 31st of December 2016. Patients without an event were censored after the last visit. Patients with a history of prior treatment of lower extremities by surgery or intervention (prior revascularizations by bypass or stent implantation in the past, precedent vascular events such as embolisms of cardiogenic and/or aneurysmal origin, acute occlusion/acute Leriche syndrome, aneurysms of the aorta aneurysms of the lower extremities, previous amputations), other than percutaneous angioplasty, were excluded from the study.
2.2. Clinical Data Assessment
Data collection was performed by accessing the electronic patient records of the hospital information system (Medico, CompuGroup Medical SE & Co. KGaA, Koblenz, Germany, 2020). The imaging data (MRA, DSA, Doppler ultrasonography) of the interventions (percutaneous transluminal angioplasty with or without stenting) were recorded in the image archiving and communication system (PACS). In addition to the assessed Doppler parameters, the following data were extracted from the medical records: Fontaine stage and diabetes type I or II, admission and discharge dates, demographic data, treatment methods and dates, reinterventions (occlusion or restenosis of the vessels of the treated lower extremity with reoperation, angiography with or without intervention), major amputations and death. Follow-up was pursued and documented by the clinical dispensary until 31 December 2016 every six months for the first year and yearly afterwards.
Urgent re-admissions in case of clinical deterioration were also recorded. Patients without event occurrence were censored.
2.3. Ethics
According to the legal requirements of the district of Saxony-Anhalt in Germany, for this noninvasive retrospective study that used data from routine diagnostics, approval by the local ethics committee was not necessary; however, the data safety guidelines of Magdeburg University and Saxony-Anhalt were strictly followed. The ethical guidelines of the Helsinki Declaration of 2013 and the STROBE criteria for observational studies were fulfilled [12,13]. All patient records were pseudonymized, and the study’s data security standards complied with the requirements of the Saxony-Anhalt district, the Federal Republic of Germany and the European Union.
2.4. Statistical Analysis
3. Results
3.1. The Completeness of Follow-Up Depended on the Fontaine Stage
One of the aims was to identify confounding factors for incomplete follow-up. The FUI was calculated for each patient, and the histogram is shown in Figure 1A.
It is obvious that there was a large fraction with very low FUI. After deleting all patients with follow-up < 30 days from further analysis, the distribution remains dichotomic, and the mean FUI was 0.61. The further investigation focused on those factors influencing the FUI, because these factors may have contributed to an additional bias. Figure 2 shows the FUI histograms in patients with different stages of PAD (claudication [Fontaine stage 2] vs. chronic limb threatening ischemia [CLTI, Fontaine stages 3 and 4]).
The FUIs were markedly shifted in the 30day cut-off sub-cohort to higher values in the claudication compared to CLTI subcohort, (0,68 vs. 0,51, p: 0.004, Wilcox-test, p: 0.002, t-test, see Figure 2B), whereby this difference was even more pronounced, if all patients were included (Figure 2A, no 30-days cut-off). This points to a possible confounding bias of the PAD stage on the outcome results, since the death and other adverse events rate may have been relevantly underestimated in later stages compared to earlier stages. Obviously, those patients with CLTI were lost to follow-up earlier than those with earlier stages. Other independent co-factors were further identified via multiple regression analysis on the FUI (see Table 1).
Besides the PAD stage (CLTI vs. IC), age contributed also tendentially and negatively to the FUI. This means, the older the patient and the more progressed the disease, the tendentially higher the risk of follow-up loss was. How did incomplete follow-up influence the event-free survival independently from Fontaine stages? Figure 3 shows the different Kaplan-Meyer curves for claudication vs CLTI and FUI > 0.5 vs. <= 0.5.
CLTI patients had a shorter reintervention free survival than claudication patients and FUI>0.5 patients had a tendentially longer reintervention free survival than FUI<=0.5 patients (Cox-regression, p: 0.07; 0.03, logrank test, respectively). Similarly, this is true also for the “restenosis or occlusion” free survival (Cox-regression, p: 0.03; 0.01 respectively). One may argue that the shorter event free survival may be directly caused by the lower FUI, if the follow-up would have been stopped at this point, however, the follow-up continued after these events until death, follow-up loss or the end of the study. Major amputation as a competing event was also analyzed for association with the FUI but, because of few events, did not reveal any significant differences (data not shown).
In summary, the completeness of follow-up was significantly associated with the PAD stage, tendentially with age. Independently from PAD stage, the event-free survival, when assessed for restenosis/ occlusion, was significantly shorter for patients with shorter follow-up and tendentially shorter, when reintervention was assessed. This points to a confounding bias caused by incomplete follow-up.
3.2. Identifying Prognostic Factors for the Mid-Term Outcome After Treatment Considering Competing Risks
Apart from incomplete follow-up, the occurrence of competing events, such as death, which may preclude other outcome events, reintervention or major amputation, has also to be considered for survival analysis. Figure 4 shows the cumulative probabilities of these different events (Stenosis/ Occlusion, Reintervention, Major Amputation, Death) in different PAD stages using the cuminc function of the cmprisk R package.
As can be expected, the probabilities of all events appeared to be higher in patients with CLTI compared to those with claudication. The highest probabilities were observed for the occurrence of stenosis/ occlusion, with up to 50% of CLTI patients suffering from new or re-stenosis within 4-5 years after initial treatment. Other events were observed less common, the most often of these were major amputations in CLTI patients. However, it is known that the cumulative total failure probability (defining all events as adverse or treatment “failure”) may exceed 1 which is not possible from the statistical perspective [18], and the associations of the co-factors with the prognosis have to be calculated using the Fine-Gray subdistribution hazard model.
Therefore, a co-variance matrix was built from potential risk factors including FUI, age and postoperative vascular anatomy, and a competing risk regression on reintervention free survival, based on the Fine-Gray-model, was performed using the cmprsk R package. The results are listed in Table 2.
Only PAD stage (significantly) and anterior tibial artery stenosis (tendentially) contributed to the reintervention event risk. The same regression analysis was done on major amputation free survival with the results listed in Table 3.
Besides FUI and PAD stage, the common femoral artery stenosis/ occlusion and the posterior tibial artery stenosis/ occlusion states contributed significantly to the major amputation risk, whereby FUI revealed a protective effect. Despite these regression analyses considered the competing risk problem, it cannot be undoubtedly stated that one vessel was more important than another one for saving the leg, but it appears plausible that the common femoral artery plays a key role for the further course of the disease. Summarizing the above outlined results, the clinical course after treatment was characterized by time-dependent competing events, which had to be considered for the prognosis of the event-free survival. The reintervention free survival and the major amputation free survival were mainly determined by the PAD stage on admission; however, the latter was also influenced by the FUI and states of the common femoral and the posterior tibial arteries.
4. Discussion
The present investigation revealed a strong association between the FUI and PAD stage (claudication vs. CLTI). The reintervention free survival and the stenosis/ occlusion free survival depended on the PAD stage and the FUI, when competing risks were not explicitly considered. However, even when using the Fine-Gray model to recalculate the sub-distribution hazards of the different co-factors concerning competing events, the PAD stage remained a significant contributor for the reintervention free survival, and PAD and FUI contributed significantly to the major amputation hazard. This means that for this observatory study, both FUI and competing events revealed a considerable confounding bias for the outcome analysis. This bias can be reduced by using the Fine-Gray model and including the FUI as a prognostic factor. Not many clinical investigations considered these bias sources for analysis. When querying the Pubmed database with the keywords: “fine-gray competing risk” and applying the filters: “Clinical Trial, Randomized Controlled Trial”, only 27 studies were found (on 17th of august 2025, 1 am), none of them dealing with vascular diseases. While for observatory studies, the role of the confounding bias is well known and should always be considered, for instance by adhering at least to the STROBE guidelines[12,13] and in addition to the above mentioned aspects, incomplete follow-up and competing risks appeared so far not to be a problem in prospective randomized studies considering that the randomization process seemed to balance also those co-factors which are not randomized. However, as is obvious in the BASIL-2 trial [2], there may be unidentified factors, which may relevantly increase the adverse event risk, for instance the death hazard and contribute to confounding bias. In fact, as was demonstrated in the present investigation, patients with higher age and higher PAD stages could not be sufficiently followed-up, and in this sub-cohort, the number of un-registered adverse events, such as major amputation, stroke, myocardial infarction and cardiovascular death may have been, and probably was, roughly under-estimated. Moreover, there may also be a subgroup of patients suffering from rapid progression of multilocal vascular stenosis and chronic ischemia, and these patients could not have been followed-up sufficiently due to its rapid deterioration. However, this remains speculation until the respective risk factors and causal relationships will be identified. Time variant co-factors, such as disease stage and secondary interventions, cannot be controlled during a randomized trial and may influence the results or may depend on various factors.
Finally – one of the most relevant limitations of prospective randomized trials also contributing to the above-mentioned effects, are the inclusion and exclusion criteria. This leads to the exclusion of older, multimorbid patients with most progressed disease and highest adverse outcome risks [19].
The limitation of the present investigation, besides the lack of randomization, consisted also in the selective inclusion criteria, whereby those patients with history of prior interventions changing the vascular anatomy, such as stent implantation or bypass surgery, have not been included to limit the heterogeneity of the cohort. However, the results shown above demonstrated the most important aspects of the role of the confounding bias while performing a study and analyzing longitudinal data.
Author Contributions
Conceptualization, A.U., S.S. and E.S.; methodology, A.U., S.S.; software, A.U.; validation, J.T., J.H., Z.H.; formal analysis, A.U.; investigation, S.S., E.S.; resources, Z.H.; data curation, S.S., E.S.; writing—original draft preparation, A.U., E.S. U.B.; writing—review and editing, E.S., J.T., J.H. and U.B.; visualization, A.U.; supervision, Z.H.; project administration, A.U. and Z.H.; funding acquisition, no funding. All authors have read and agreed to the published version of the manuscript.
Funding
This research received no external funding.
Informed Consent Statement
Informed consent was obtained from all subjects involved in the study.
Data Availability Statement
Data is not publicly available due to ethical concerns but anonymized data may be provided by the authors for scientific projects or meta-analysis.
Acknowledgments
The authors express their thankfulness to Jana Beyer for data acquisition and patient management.
Conflicts of Interest
The authors declare no conflicts of interest.
Abbreviations
The following abbreviations are used in this manuscript:
| MDPI | Multidisciplinary Digital Publishing Institute |
| DOAJ | Directory of open access journals |
| CLTI | Chronic limb threatening ischemia |
| RFS | Reintervention Free Survival |
| FUI | Follow-up Index |
| PAD | Peripheral Artery Disease |
| MRA | Magnetic Resonance Angiography |
| DSA | Digital Subtraction Angiography |
| KMC | Kaplan-Meier-Curves |
| IC | Intermittent claudication |
| CIHD | Chronic Ischemic Heart Disease |
| Coeff | Coefficient |
References
- Farber, A. , et al., Surgery or Endovascular Therapy for Chronic Limb-Threatening Ischemia. New England Journal of Medicine, 2022. 387(25): p. 2305-2316. [CrossRef]
- Bradbury, A.W. , et al., A vein bypass first versus a best endovascular treatment first revascularisation strategy for patients with chronic limb threatening ischaemia who required an infra-popliteal, with or without an additional more proximal infra-inguinal revascularisation pr. The Lancet, 2023. 401(10390): p. 1798-1809. [CrossRef]
- Bradbury, A.W. , et al., Editor’s Choice – Bypass versus Angioplasty in Severe Ischaemia of the Leg (BASIL)-2 Trial: Analysis of the Timing and Causes of Death in Participants Randomised to an Infrapopliteal Vein Bypass or Best Endovascular Treatment First Revascularisation Strat. European Journal of Vascular and Endovascular Surgery, 2025. 69(1): p. 102-107. [CrossRef]
- Von Allmen, R.S. , et al., Randomized controlled comparison of cross-sectional survey approaches to optimize follow-up completeness in clinical studies. PLOS ONE, 2019. 14(3): p. e0213822.
- Austin, P.C. and J.P. Fine, Accounting for competing risks in randomized controlled trials: a review and recommendations for improvement. Statistics in Medicine, 2017. 36(8): p. 1203-1209. [CrossRef]
- Becker, F. , et al., Chapter I: Definitions, epidemiology, clinical presentation and prognosis. Eur J Vasc Endovasc Surg, 2011. 42 Suppl 2: p. S4-12. [CrossRef]
- Cao, P. , et al., Chapter II: Diagnostic methods. Eur J Vasc Endovasc Surg, 2011. 42 Suppl 2: p. S13-32. [CrossRef]
- Dick, F. , et al., Chapter VI: Follow-up after revascularisation. Eur J Vasc Endovasc Surg, 2011. 42 Suppl 2: p. S75-90. [CrossRef]
- Diehm, N. , et al., Chapter III: Management of cardiovascular risk factors and medical therapy. Eur J Vasc Endovasc Surg, 2011. 42 Suppl 2: p. S33-42.
- Lepantalo, M. , et al., Chapter V: Diabetic foot. Eur J Vasc Endovasc Surg, 2011. 42 Suppl 2: p. S60-74. [CrossRef]
- Setacci, C. , et al., Chapter IV: Treatment of critical limb ischaemia. Eur J Vasc Endovasc Surg, 2011. 42 Suppl 2: p. S43-59. [CrossRef]
- Vandenbroucke, J.P. , et al., Strengthening the Reporting of Observational Studies in Epidemiology (STROBE): Explanation and Elaboration. Annals of Internal Medicine, 2007. 147(8): p. W-163-W-194. [CrossRef]
- Von Elm, E. , et al., The Strengthening the Reporting of Observational Studies in Epidemiology (STROBE) statement: guidelines for reporting observational studies. Journal of Clinical Epidemiology, 2008. 61(4): p. 344-349.
- Team, R.D.C. , R: A Language and Environment for Statistical Computing. 2010: Vienna, Austria.
- Therneau, T. and o.S.-R.p.b.T. Lumley, survival: Survival analysis, including penalised likelihood. 2010.
- Sakar, D. , Lattice: Multivariate Data Visualization with R. 2008, Springer: New York.
- Gray, B. , cmprsk: Subdistribution Analysis of Competing Risks. 2024.
- Austin, P.C. E.W. Steyerberg, and H. Putter, Fine-Gray subdistribution hazard models to simultaneously estimate the absolute risk of different event types: Cumulative total failure probability may exceed 1. Stat Med, 2021. 40(19): p. 4200-4212. [CrossRef]
- Czihal, M. , et al., Patient Characteristics in the Recording Courses of Vascular Diseases (Reccord) Registry: Comparison with the Voyager Pad Endovascular Cohort. Journal of Cardiovascular Development and Disease, 2023. 10(3): p. 115. [CrossRef]
Figure 1.
A) Histogram of FUI for all patients, B) Histogram of FUI after deleting all patients with follow-up <30 days.
Figure 1.
A) Histogram of FUI for all patients, B) Histogram of FUI after deleting all patients with follow-up <30 days.
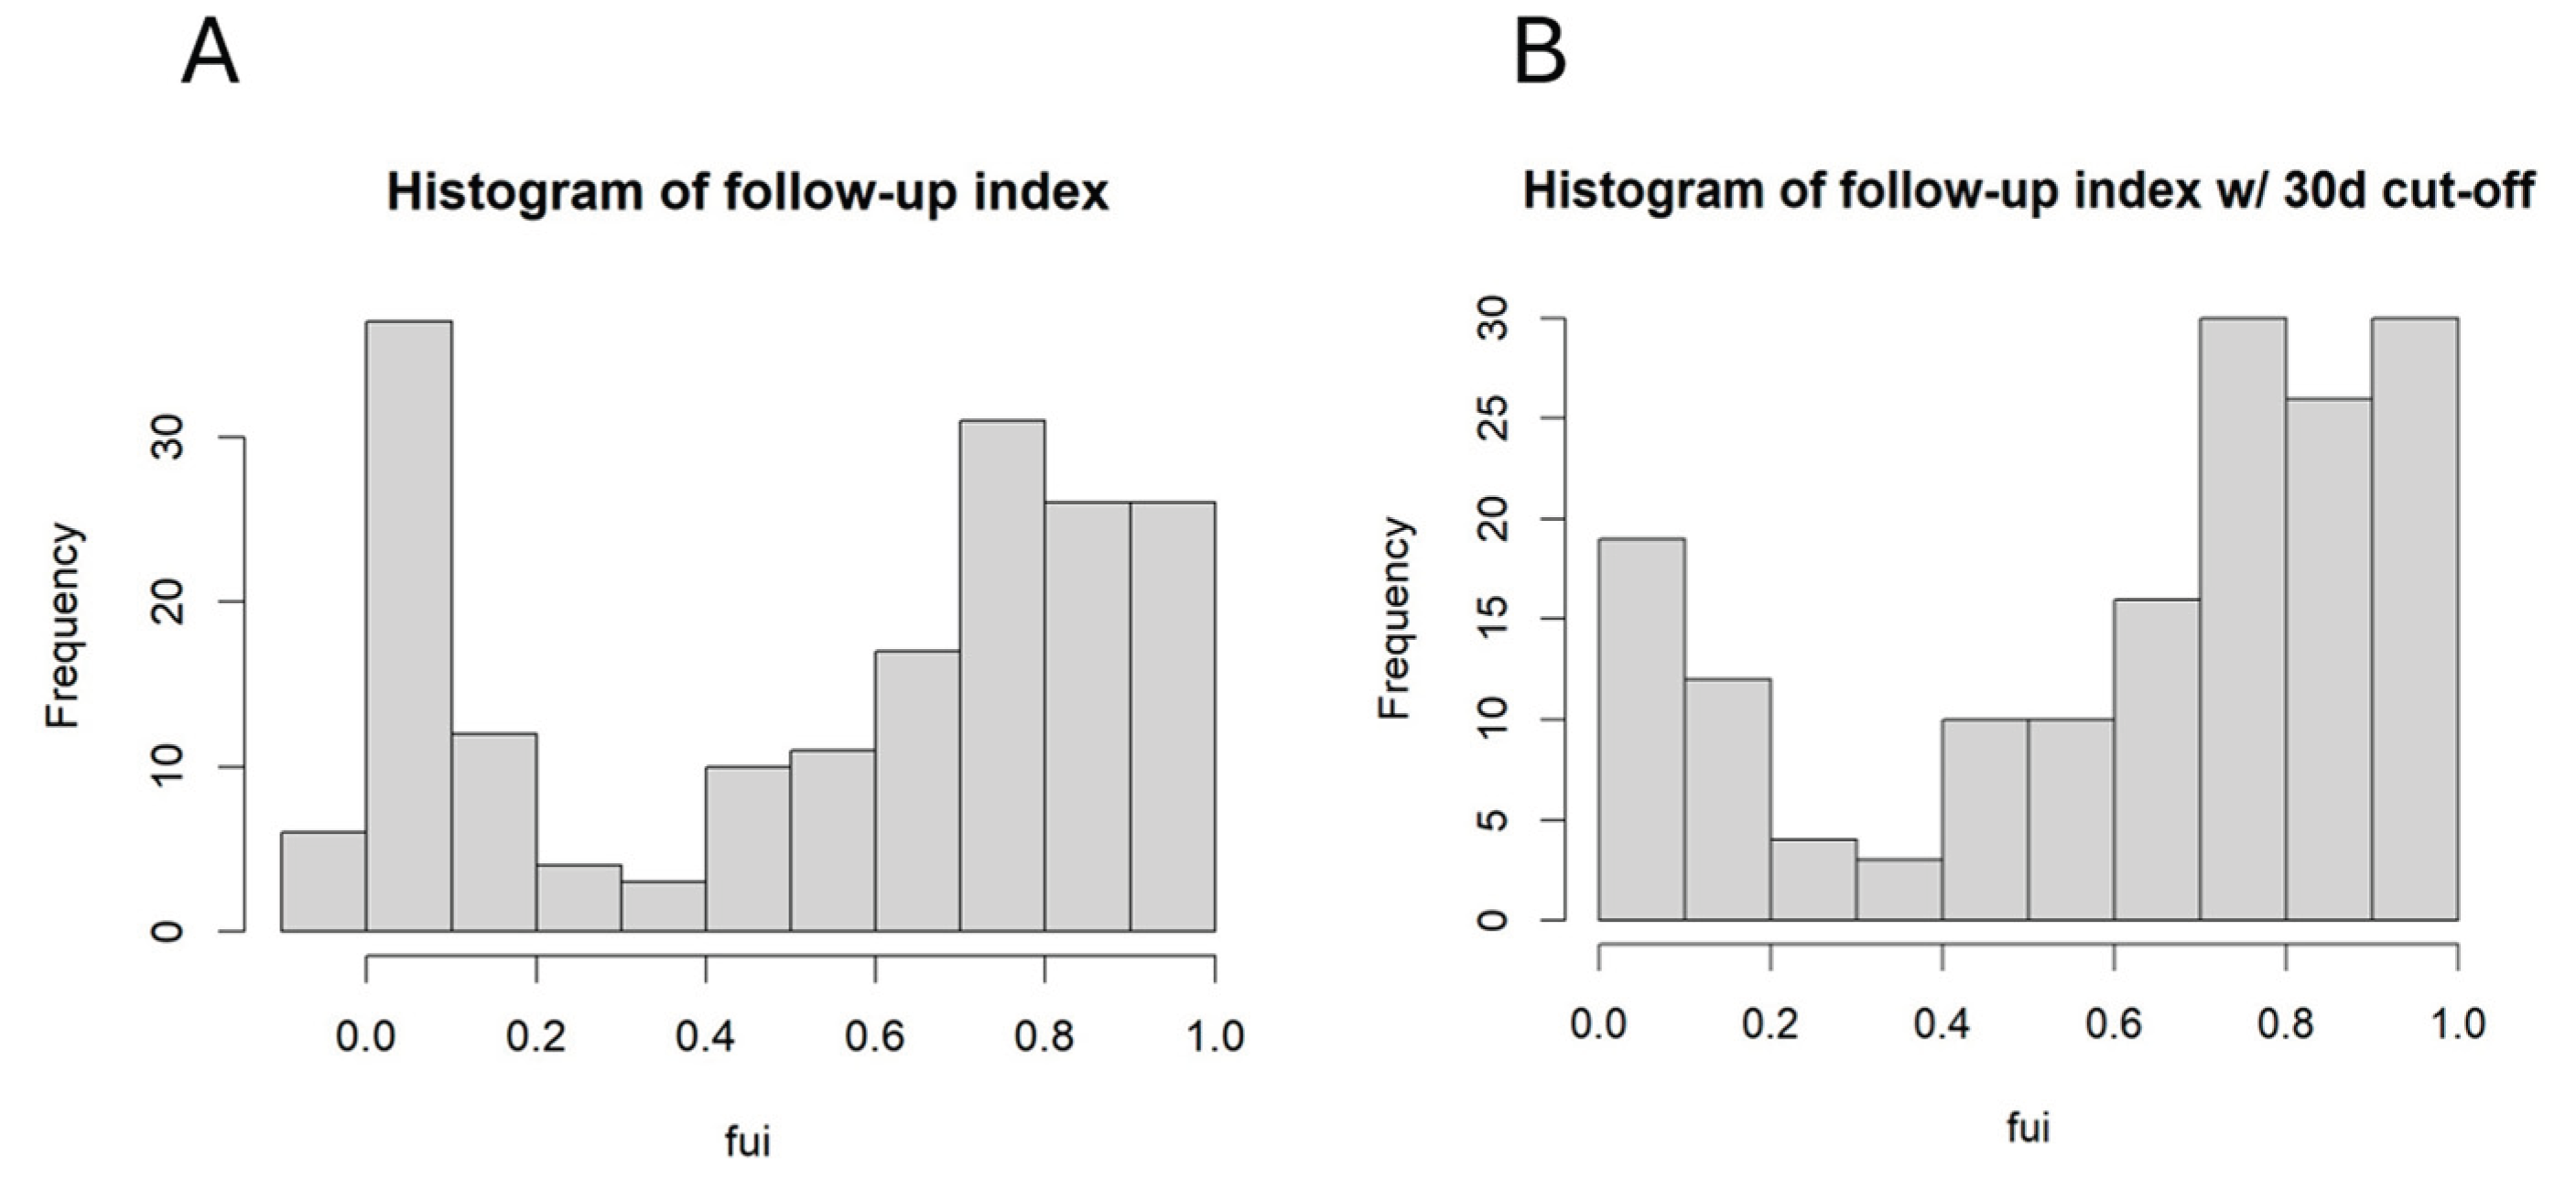
Figure 2.
Histogram of the follow-up-Index in patients with intermittent claudication (left panel) and chronic limb threatening ischemia (CLTI, right panel). A) for all patients, B) with 30day cut-off.
Figure 2.
Histogram of the follow-up-Index in patients with intermittent claudication (left panel) and chronic limb threatening ischemia (CLTI, right panel). A) for all patients, B) with 30day cut-off.
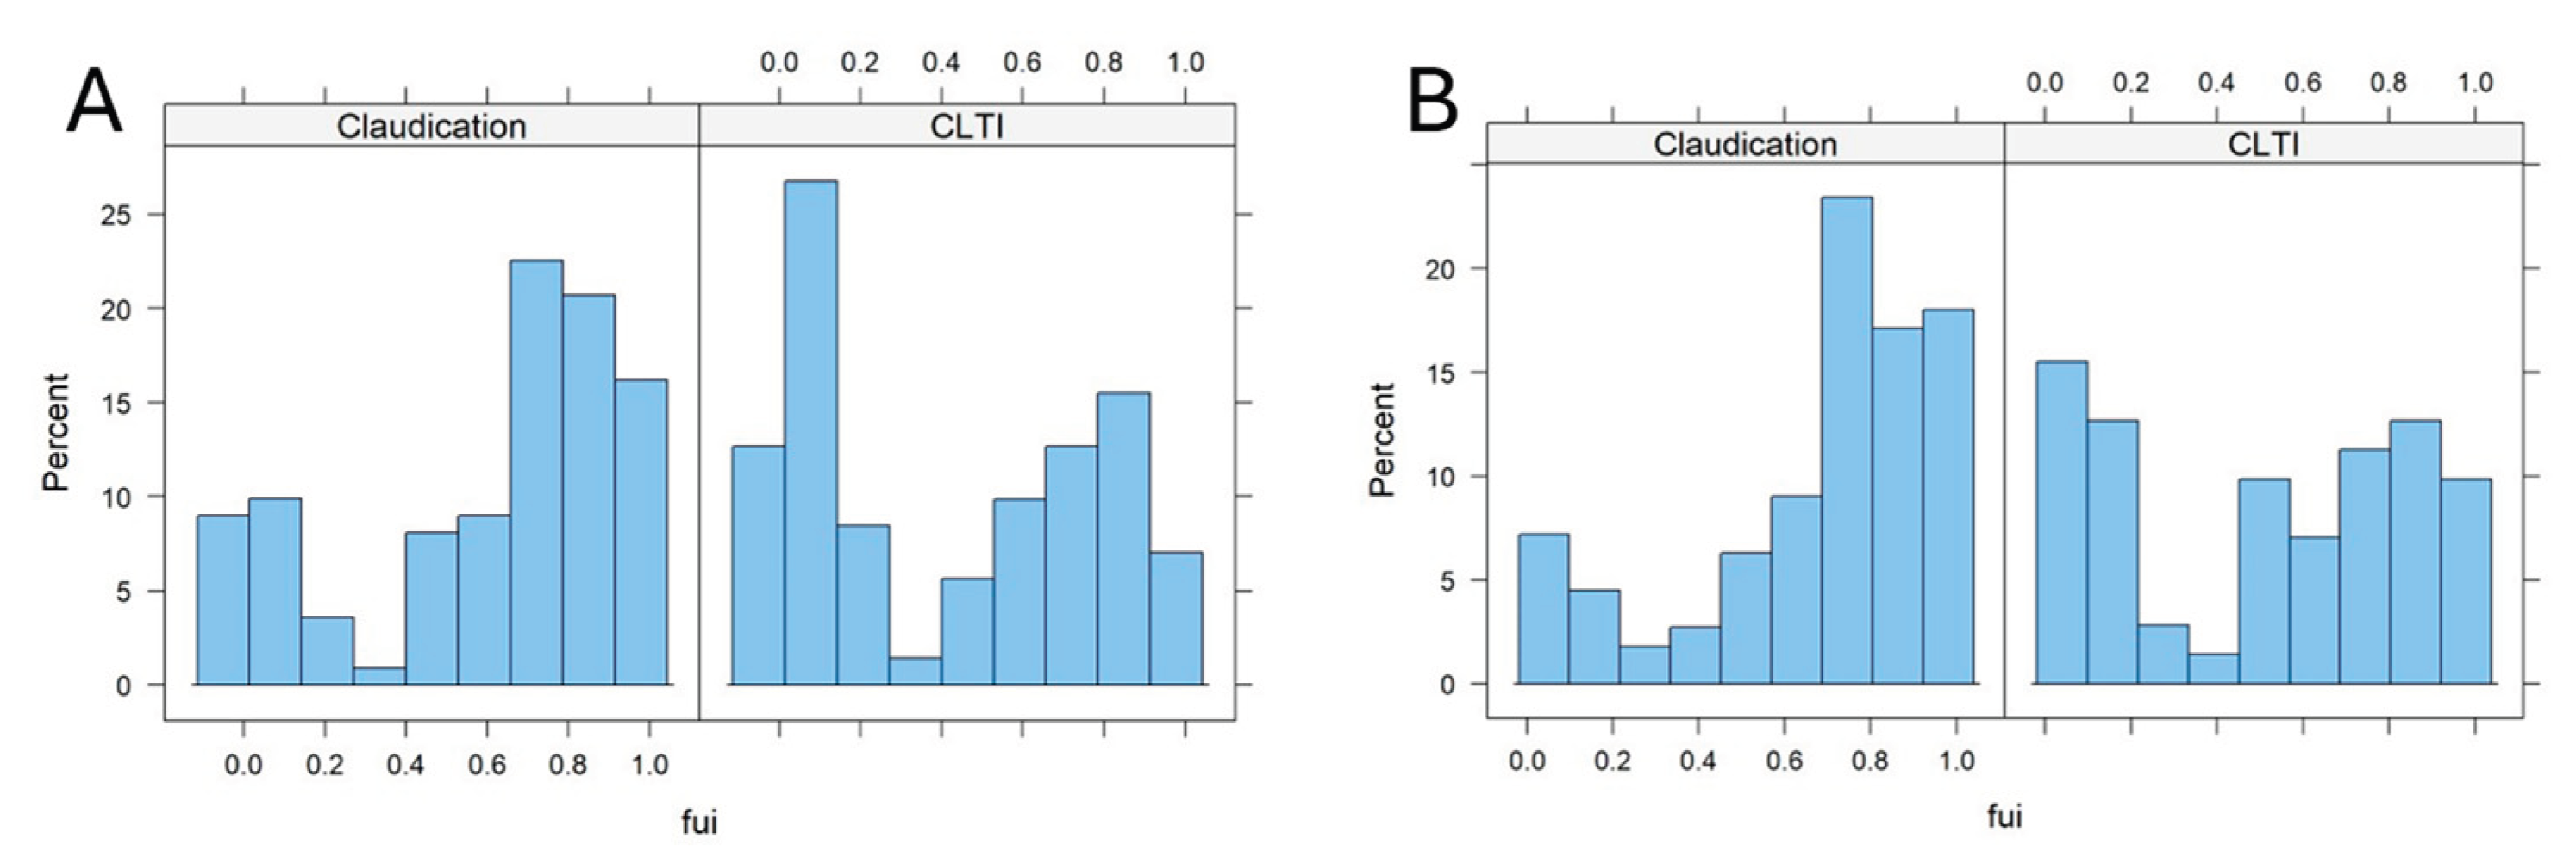
Figure 3.
Kaplan Meyer curves of subcohorts with different PAD stages (claudication vs. CLTI) and different FUI (>0.5 vs. <=0.5) for A) Reintervention free survival and B) Restenosis or occlusion free survival.
Figure 3.
Kaplan Meyer curves of subcohorts with different PAD stages (claudication vs. CLTI) and different FUI (>0.5 vs. <=0.5) for A) Reintervention free survival and B) Restenosis or occlusion free survival.
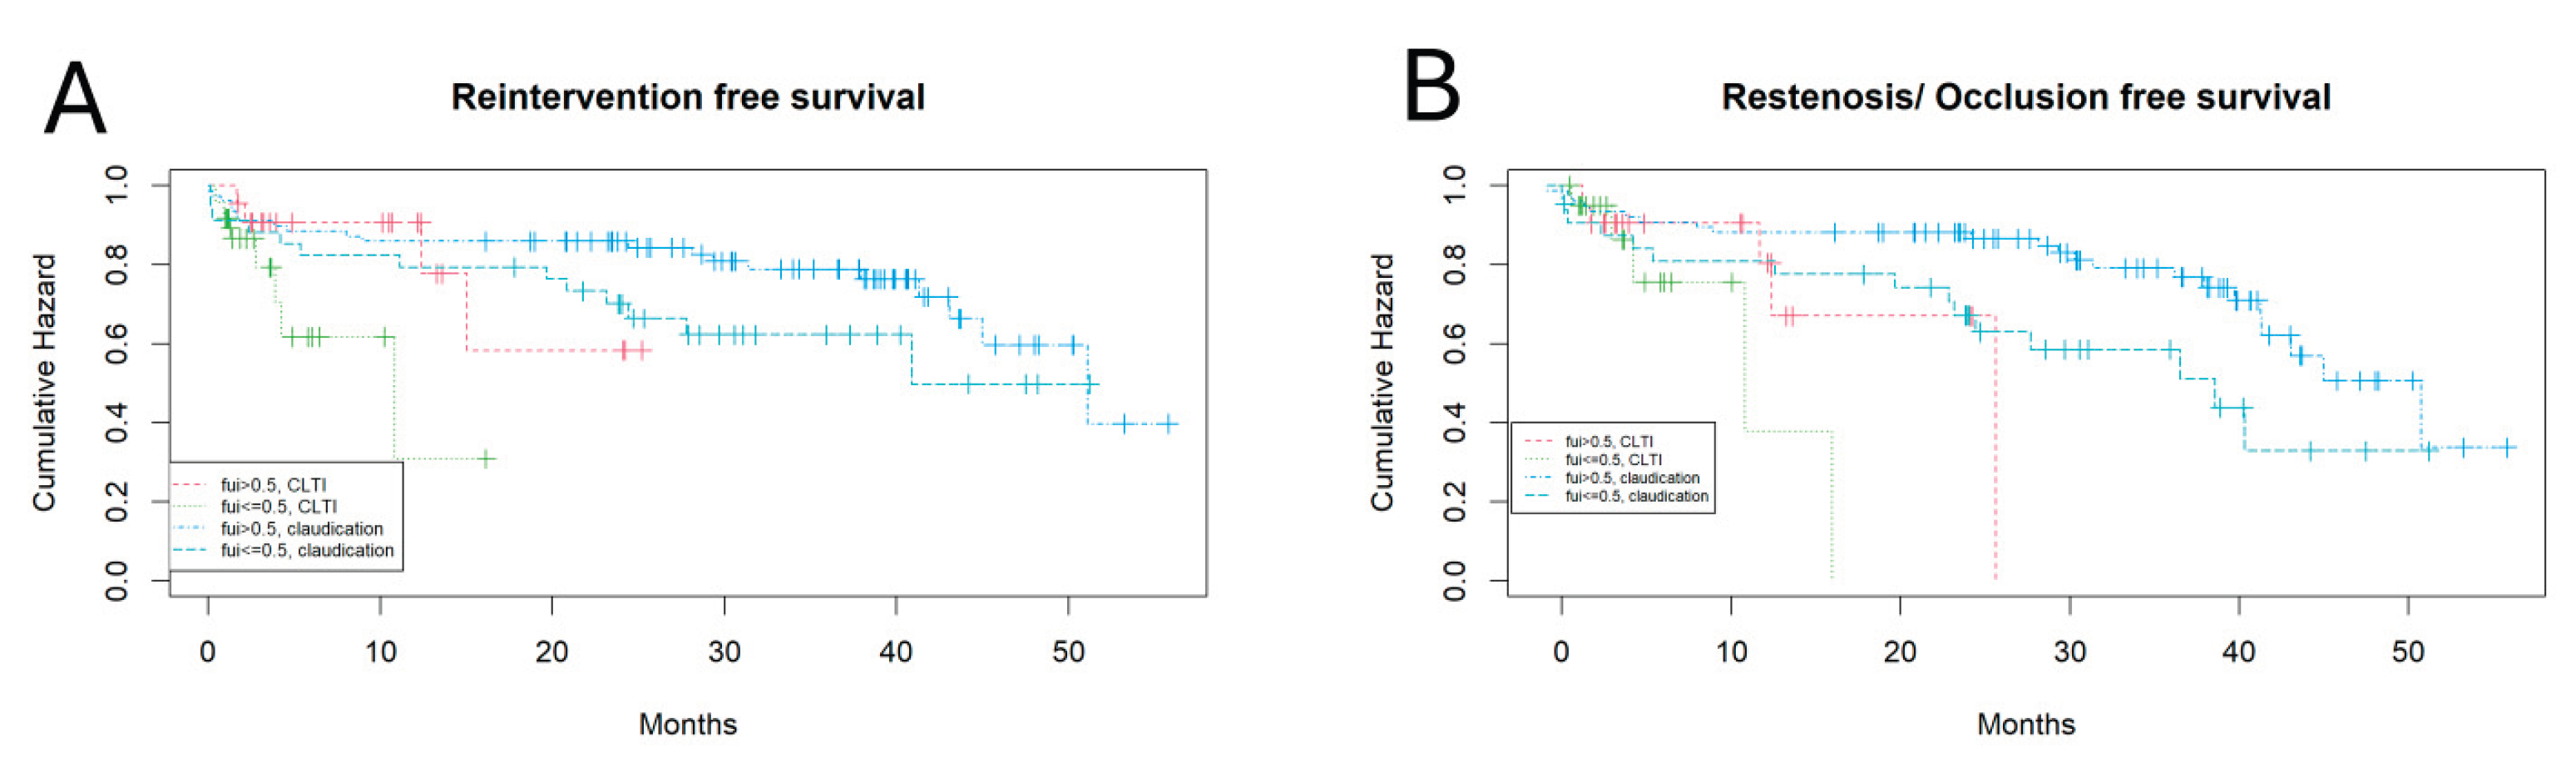
Figure 4.
Kaplan Meyer curves for the cumulative probabilities for competing events. Some curves are not visible because of lacking events within the subcohorts.
Figure 4.
Kaplan Meyer curves for the cumulative probabilities for competing events. Some curves are not visible because of lacking events within the subcohorts.
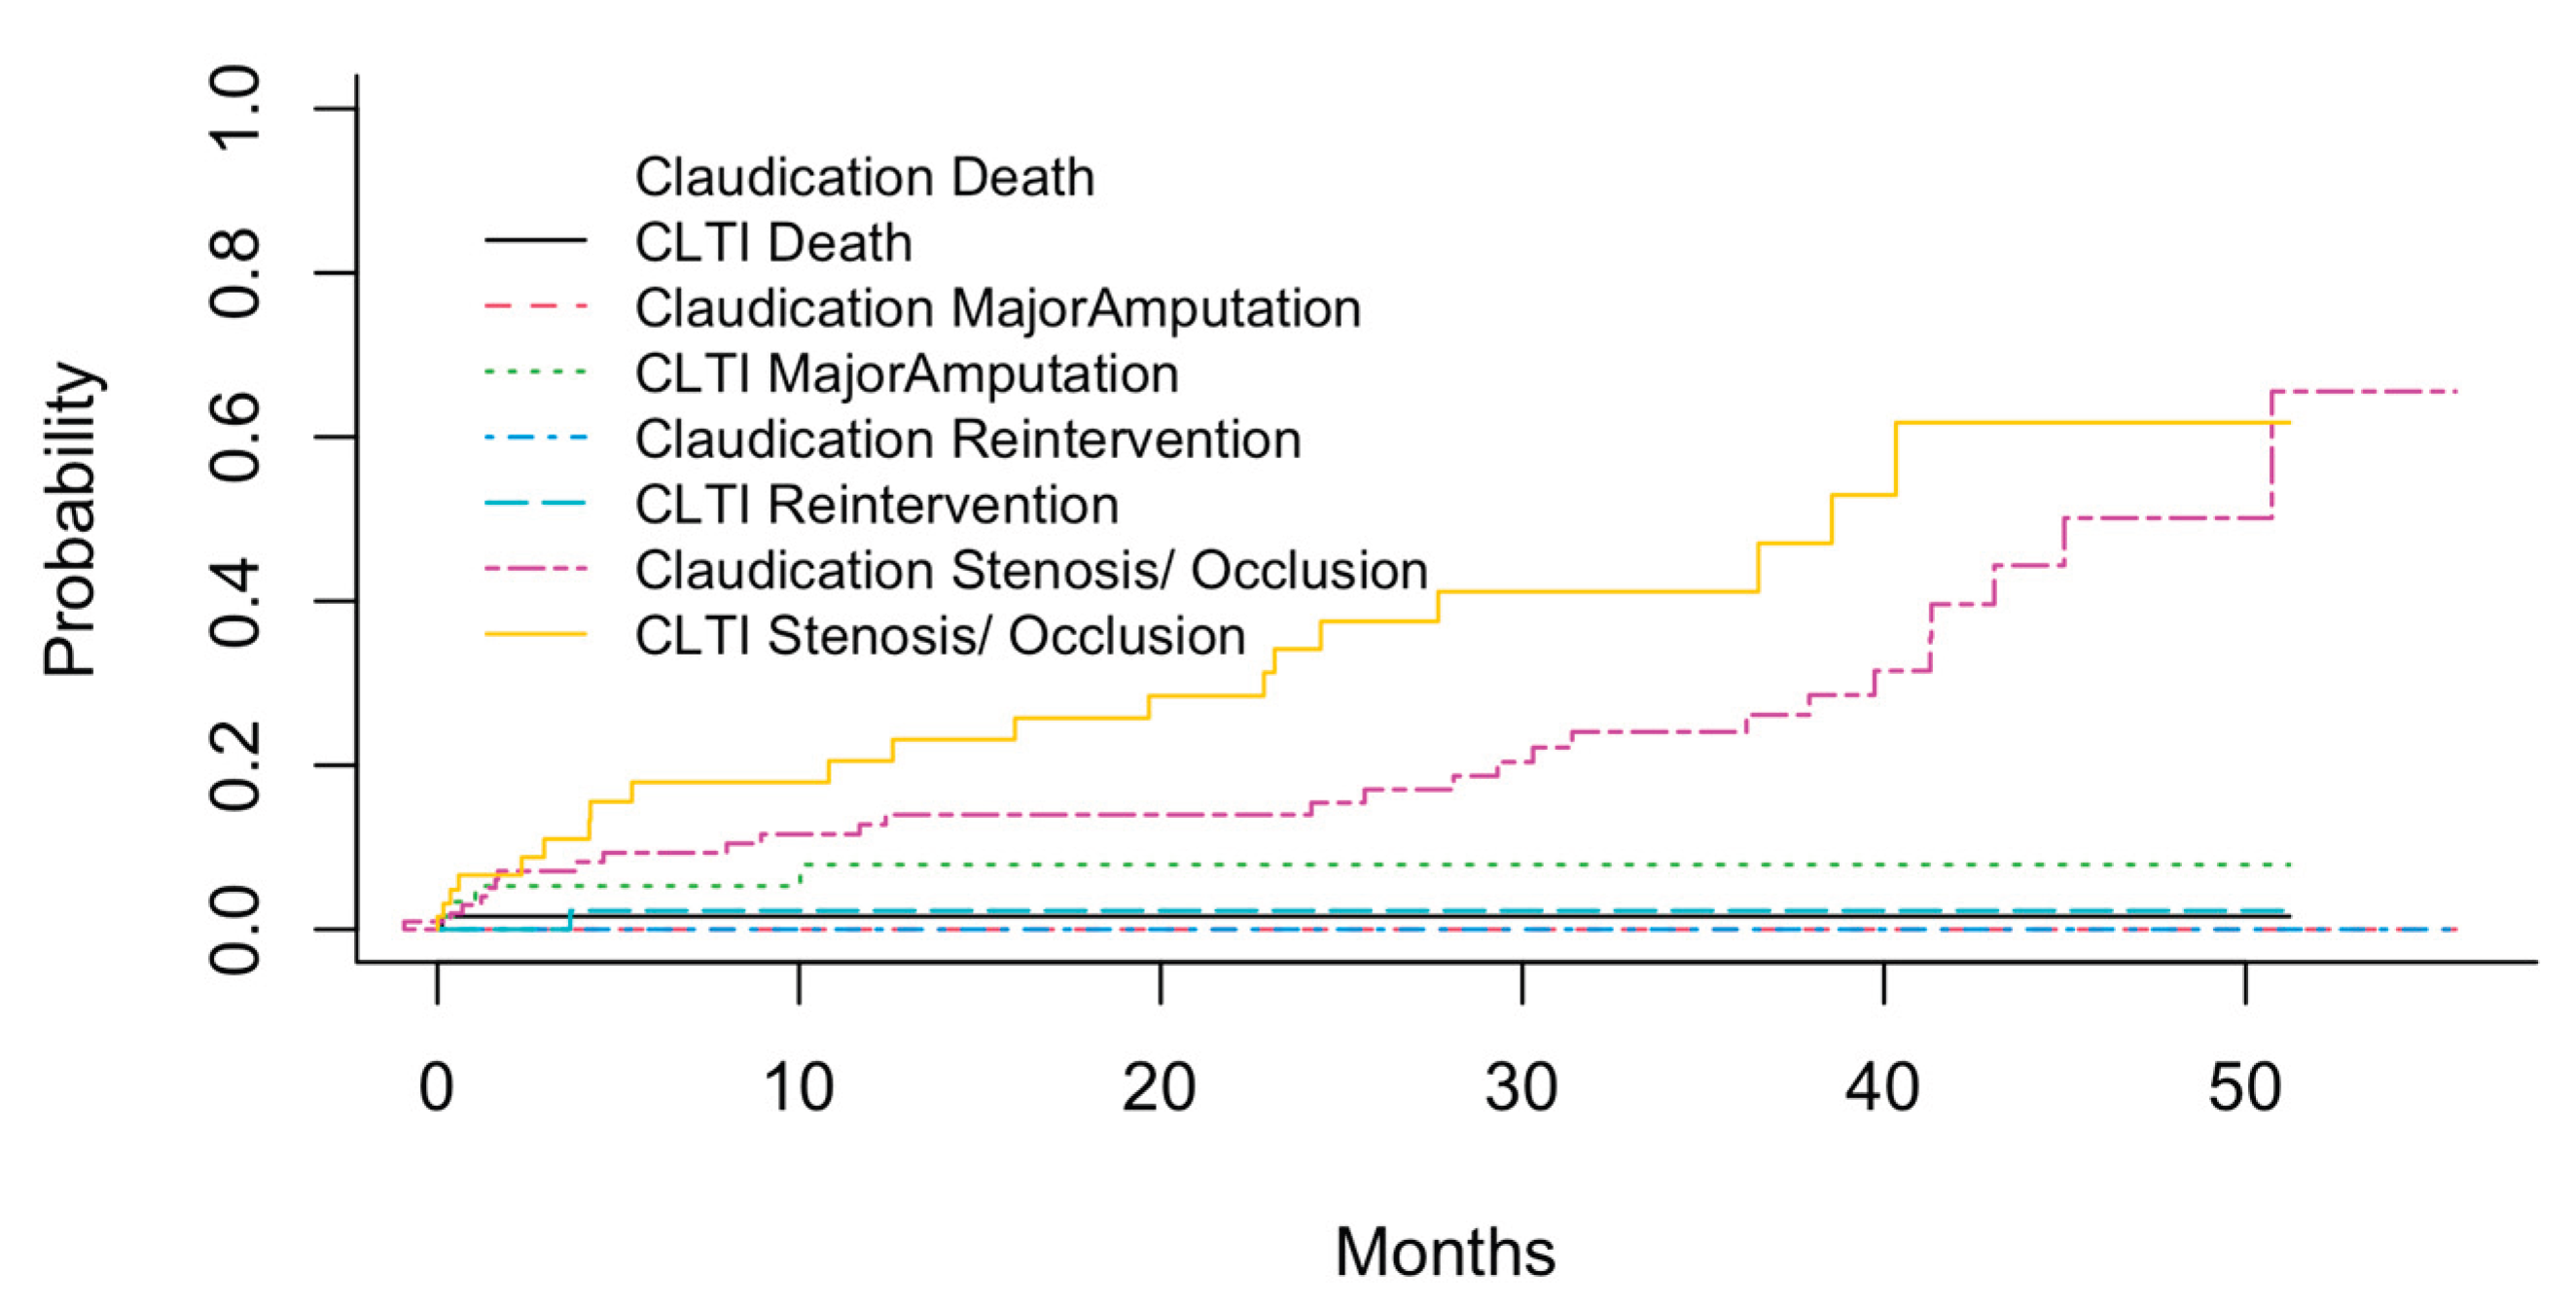

Table 1.
Results of the multiple regression analysis on FUI, listing the initial and the final model. Signif. codes: 0 ‘***’ 0.001 ‘**’ 0.01 ‘*’ 0.05 ‘.’ 0.1 ‘ ’ 1.
Table 1.
Results of the multiple regression analysis on FUI, listing the initial and the final model. Signif. codes: 0 ‘***’ 0.001 ‘**’ 0.01 ‘*’ 0.05 ‘.’ 0.1 ‘ ’ 1.
| Co-factor | Initial model | Final model | ||
| Estimate | P | Estimate | P | |
| (Intercept) | 0.99 | 0.008** | 0.88 | <0.001** |
| Age | -0.006 | 0.27 | -0.004 | 0.07. |
| Female Sex | 0.06 | 0.66 | ||
| CIHD | -0.007 | 0.97 | ||
| Atrial fibrillation | 0.46 | 0.28 | ||
| Diabetes mellitus | -0.043 | 0.76 | ||
| Emergency admission | 0.11 | 0.64 | ||
| CLTI | -0.20 | 0.11 | -0.16 | 0.0034** |
Table 2.
Results of the competing risk regression analysis on reintervention free survival. The co-factors defining vessel states are meant as being high-grade stenosed or occluded. Abbreviations: CI..confidence interval, Coeff.. coefficient.
Table 2.
Results of the competing risk regression analysis on reintervention free survival. The co-factors defining vessel states are meant as being high-grade stenosed or occluded. Abbreviations: CI..confidence interval, Coeff.. coefficient.
| Co-factor | Exp (Coeff) | 2.5 % CI | 97.5% CI | p |
| Age | 0.983 | 0.95 | 1.02 | 0.31 |
| FUI | 0.47 | 0.15 | 1.53 | 0.21 |
| CLTI | 2.32 | 1.18 | 4.55 | 0.015* |
| Intervention | 1.20 | 0.56 | 2.56 | 0.64 |
| Profound femoral artery | 0.78 | 0.25 | 2.49 | 0.68 |
| Common femoral artery | 0.48 | 0.17 | 1.34 | 0.16 |
| Spf. Femoral artery | 0.57 | 0.23 | 1.41 | 0.23 |
| Fibular artery | 1.52 | 0.71 | 3.23 | 0.28 |
| Anterior tibial artery | 0.48 | 0.23 | 0.99 | 0.05. |
| Posterior tibial artery | 1.22 | 0.60 | 2.48 | 0.57 |
Table 3.
Results of the competing risk analysis on the major amputation free survival. Further explanation and abbreviations see table 2.
Table 3.
Results of the competing risk analysis on the major amputation free survival. Further explanation and abbreviations see table 2.
| Co-factor | Exp (Coeff) | 2.5 % CI | 97.5% CI | p |
| Age | 0.94 | 0.85 | 1.04 | 0.24 |
| FUI | 0.015 | 8.28 e-4 | 0.265 | 0.004** |
| CLTI | 5.2 e7 | 8.47 e6 | 3.21 e8 | <0.001** |
| Intervention | 2.44 | 0.63 | 9.45 | 0.2 |
| Profound femoral artery | 0.15 | 0.008 | 2.57 | 0.19 |
| Common femoral artery | 3.74 e7 | 2.72 e6 | 5.14 e8 | <0.001** |
| Spf. Femoral artery | 1.12 | 0.27 | 4.67 | 0.88 |
| Fibular artery | 0.19 | 0.24 | 1.46 | 0.11 |
| Anterior tibial artery | 0.75 | 0.16 | 3.57 | 0.72 |
| Posterior tibial artery | 2.16 e7 | 2.49 e6 | 1.88 e8 | <0.001** |
Disclaimer/Publisher’s Note: The statements, opinions and data contained in all publications are solely those of the individual author(s) and contributor(s) and not of MDPI and/or the editor(s). MDPI and/or the editor(s) disclaim responsibility for any injury to people or property resulting from any ideas, methods, instructions or products referred to in the content. |
© 2025 by the authors. Licensee MDPI, Basel, Switzerland. This article is an open access article distributed under the terms and conditions of the Creative Commons Attribution (CC BY) license (http://creativecommons.org/licenses/by/4.0/).
Copyright: This open access article is published under a Creative Commons CC BY 4.0 license, which permit the free download, distribution, and reuse, provided that the author and preprint are cited in any reuse.


