1. Introduction
Aging is a complex biological process associated with decreased metabolic health and functional abilities of older adults. These declines are influenced by genetic, environmental, and lifestyle factors. Among these, diet plays a critical role in promoting metabolic health and longevity [
1]. A well-balanced diet rich in certain nutrients, including essential micronutrients, antioxidants, soluble fiber, and protein, can mitigate chronic disease risks, promote physical function, and improve overall quality of life [
2,
3]. Furthermore, the adoption of specific dietary patterns, such as the Mediterranean diet, have been associated with successful aging outcomes [
4]. However, some evidence indicates that diet affects cardiometabolic outcomes differently in men and women [
5,
6,
7].
Ample evidence demonstrates that men and women metabolize nutrients differently. For example, following a high-fat meal, pre-menopausal women more efficiently oxidize fat in the liver when compared with age-matched men [
8]. While sex-specific dietary recommendations may support the maintenance of optimal metabolic health in older adults, the health implications of these differences in metabolism and their interaction with diet remain unclear.
Glucose metabolism and insulin sensitivity are key aspects of cardiometabolic health affected by dietary choices. Impaired glucose tolerance and impaired fasting glucose increase the risk of type 2 diabetes and cardiovascular disease, and older adults are often diagnosed with these conditions [
9]. Insulin resistance, hyperinsulinemia, and excess activation of the insulin signaling pathway have been identified as key drivers of aging-related chronic inflammation [
10], which is often called inflammaging [
11]. Moreover, hyperinsulinemia has been directly linked with accelerated aging processes [
12]. Consequently, strategies to enhance insulin sensitivity, such as caloric restriction, intermittent fasting, and pharmacological interventions like metformin, have shown promise for reducing the pace of aging [
13], oxidative stress [
14], and activity of signaling pathways downstream of insulin, for example mTOR [
15]. Dietary interventions that bolster dietary quality and reduce circulating insulin are also a viable approach for mitigating inflammaging and enhancing metabolic health in older adults.
The relationship between diet, nutrients, and glucose metabolism has been extensively studied. However, there is a knowledge gap concerning sex-specific associations, especially in the context of human aging. Therefore, the primary purpose of this secondary analysis is to identify nutrients and food groups that are associated with insulin sensitivity in otherwise healthy older adults. We hypothesized that the nutrients and food groups associated with insulin sensitivity would differ between men and women, supporting the need for clinical trials to define sex-specific dietary guidelines for successful aging and metabolic health.
2. Materials and Methods
2.1. Participants and Parent Study
This study is a secondary analysis of the Metformin to Augment Strength Training Effective Response in Seniors (MASTERS) [
16,
17], which was a clinical trial in generally healthy older adults aimed at examining muscle mass and function in response to progressive resistance exercise training with and without the use of metformin [
16,
17]. Participants (n= 96) were recruited from the community at the University of Kentucky (UK) and the University of Alabama at Birmingham (UAB). The MASTERS study included older adults (median age approximately 69 years) and had equal enrollment of males and females. BMI ranged from approximately 19 to 34 kg/m², and participants exhibited moderate to high levels of physical function as assessed by the Short Physical Performance Battery (SPPB). From this parent study, we utilized data from all participants who had both
baseline dietary data, as well as baseline data from the oral glucose tolerance test (OGTT; n=89), dual-energy x-ray absorptiometry (DXA; n=96), or computed tomography (CT; n=96). The dietary and OGTT data have not been published previously, excepting broad summary statistics included in the article reporting the original clinical trial [
16,
17]. All participants provided informed consent, and the study was approved by the University of Kentucky Institutional Review Board (#47128).
2.2. Diet and Dietary Supplement Data Collection
Participants’ diet was evaluated with a 4-day food record, which included three weekdays and one weekend day. Participants received written and verbal instructions on how to record all foods, beverages, and dietary supplements consumed, including portion sizes, preparation methods, and brand names when applicable. Participants were encouraged to use household measuring tools (e.g., measuring cups, spoons, food scales) and were provided with a portion size estimation guide.
2.3. Dietary Analysis
Data from the MASTERS study baseline food and dietary supplement record collection were analyzed using the Nutrition Data System for Research (NDSR) 2019 software (Nutrition Coordinating Center, University of Minnesota). NDSR provides a comprehensive database for nutrient and food group analysis, including detailed breakdowns of macronutrient, micronutrient, and phytonutrient intake. Entries from food records were manually entered into NDSR by trained research staff and reviewed by a registered dietitian. NDSR was used to generate estimates of energy intake (kcal), macronutrients (carbohydrates, protein, fat), fiber, vitamins, minerals, and specific bioactive compounds (e.g., phytoestrogens, fatty acids, and inositol compounds). All individual nutrients reported by NDSR were included in our univariate analyses, and dietary and supplemental sources of nutrients were merged prior to analysis. To account for variations in energy intake, energy-yielding components were analyzed as both absolute quantities and normalized per 1000 kcal and body weight. Additional variables were also created for nutrients that have recommendations in the US differing from the units in the output, for example percentage of overall energy intake for added sugar.
Additionally, food group intake data (e.g., whole grains, refined grains, dairy, nuts, and seeds, processed and fresh meats) were calculated based on predefined categories in the NDSR system, which were merged to 25 combined food groups to reduce the number of variables in the multiple regression data analysis.
2.4. Insulin Sensitivity and Insulin Resistance Calculations
Participants completed a 75-g oral glucose tolerance test (OGTT) following an overnight fast of at least 8 hours. At the beginning of the test (0 minutes), a baseline blood sample was collected to measure fasting glucose and insulin levels as previously described [
16,
17]. Participants then consumed a standardized 75-g glucose solution within 5 minutes, followed by blood sample collection at 30-, 60-, 90-, and 120-minutes post-ingestion. The Matsuda Insulin Sensitivity Index (MAT-ISI) [
18] and Homeostatic Model of Insulin Resistance (HOMA-IR) [
19] were used to estimate whole-body insulin sensitivity and hepatic insulin resistance, respectively.
2.5. Dual-Energy X-Ray Absorptiometry (DXA)
Body composition was assessed via DXA using a GE Lunar iDXA scanner (GE Healthcare, Chicago, IL). Scans were performed with participants in a supine position using standard imaging protocols [
17]. All scans were analyzed using GE Lunar software version 10.0. The specific outcome variable of interest was the percentage of android region fat, defined as the ratio of android region fat (grams) to overall total mass in the android region (both lean and fat grams).
2.6. Computed Tomography (CT) Scans
Intermuscular fat (IMF) was assessed using a single-slice computed tomography (CT) scan at the mid-thigh, defined as the midpoint between the inguinal crease and the proximal border of the patella with the hip and knee flexed at approximately 90°. CT scans were performed on either a GE Discovery CT750 HD (UAB) or a Siemens Somatom Definition (UK) scanner. A 5-mm-thick cross-sectional image of the right thigh was obtained using 100 mA with a scanning time of 3 seconds and a 512 × 512 matrix resolution. The scan was aligned to the predefined midpoint mark on each participant’s thigh as previously described [
17]. Fat area was quantified using attenuation values from the CT scan images, analyzed with NIH ImageJ software (
http://rsbweb.nih.gov/ij/). We used IMF area standardized to total fat area in the CT scan as a secondary outcome variable in our analyses.
2.7. Statistical Analyses
To assess which of the 201 nutrient and 13 other health-related measures (e.g., BMI) significantly associated with the outcome measures, univariate regression models were run for each nutrient measure stratified by sex. Up to 10 nutrients with the smallest p-value were reported here for each metabolic or anthropometric outcome. To account for multiple comparisons in these univariate analyses, we set the significance threshold at p < 0.01. Where an absolute nutrient value and a normalized value both showed a p<0.01, only the variable with the lowest p-value is reported. To assess the food group variables (absolute portions), a model was developed using the feasible solutions algorithm (FSA) [
20], which was implemented for males and females separately. The FSA searches through a random selection process to find the two variables (and their two-way interaction) that maximizes the R
2 of the regression line predicting the outcome. Using the two-way covariate interaction with the largest R
2 for each outcome variable, four analysis of variance models were then contrasted to demonstrate robustness. These models included the significant interaction, a model adding just baseline BMI, a model adding only minutes of weekly exercise, and a model including both covariates. The FSA analyses were run using the rFSA package in R, version 4.1.3 (R Foundation for Statistical Computing, Vienna, Austria) and model comparisons were run using SAS 9.4 (SAS Institute Inc., Cary, North Carolina). Descriptive statistics and t-tests comparing baseline demographic and health indicators and intakes of nutrients of interest between men and women were completed using IBM SPSS Statistics v.29.
3. Results
3.1. Participant Characteristics
Participants were older, generally healthy American adults. Women tended to be metabolically healthier than the men with higher Mat-ISI, higher fasting glucose, and lower HOMA-IR, on average (
Table 1).
Table 1.
Anthropometric and Metabolic Health Indicators.
Table 1.
Anthropometric and Metabolic Health Indicators.
| Variables (n=96) |
Men (n=47)
Mean ± SD |
Women (n=49)
Mean ± SD |
p-value1
|
| Age (years) |
71.5 ± 5.6 |
69.2 ± 3.2 |
0.016 |
| Weight (kg) |
85.3 ± 10.8 |
68.6 ± 9.9 |
<0.001 |
| Body Mass Index |
27.3 ± 2.7 |
25.6 ± 3.4 |
0.006 |
| Systolic BP2 (mmHg) |
129.7 ± 15.8 |
123.1 ± 14.4 |
0.036 |
| Diastolic BP (mmHg) |
75.0 ± 9.9 |
71.1 ± 10.1 |
0.060 |
| Fasting glucose (mg/dL)*
|
99.4 ± 8.3 |
92.0 ± 12.3 |
0.002 |
| Mat-ISI3*
|
4.0 ± 2.0 |
6.0 ± 3.3 |
<0.001 |
| HOMA-IR4*
|
2.5 ± 1.5 |
1.6 ± 1.0 |
0.002 |
| Android Region % Fat5
|
40.0 ± 8.7 |
41.6 ± 10.4 |
0.382 |
| Intermuscular Fat Ratio6
|
0.24 ± 0.17 |
0.12 ± 0.04 |
<0.001 |
3.2. Dietary Intake in Older Men and Women
Dietary intake was evaluated among 47 males and 49 females. Significant sex differences were observed for energy intake, as males consumed more daily kilocalories in comparison to females, while females consumed more total fiber, which was driven by higher insoluble fiber intake (
Table 2). Dietary intake among females and males is reported in
Table 2 below.
Table 2.
Nutrient intake in males and females .
Table 2.
Nutrient intake in males and females .
| Nutrient |
Men (n=47)
Mean ± S.D. |
Women (n=49)
Mean ± S.D. |
p-value
|
| Total Energy (kcal) |
1960 ± 471 |
1610 ± 421 |
<0.001 |
| Energy (kcal/kg) |
23.7 ± 5.6 |
23.9 ± 6.4 |
0.876 |
| Total Fat (g/kg) |
0.98 ± 0.29 |
0.98 ± 0.32 |
0.919 |
| Saturated Fat (g/kg) |
0.31 ± 0.09 |
0.31 ± 0.16 |
0.851 |
| Total Omega-3 (g) |
2.2 ± 1.1 |
2.0 ± 1.2 |
0.417 |
| Total Protein (g/kg) |
0.98 ± 0.19 |
0.98 ± 0.27 |
0.935 |
| Animal Protein (g/kg) |
0.63 ± 0.17 |
0.62 ± 0.25 |
0.866 |
| Vegetable Protein (g/kg) |
0.35 ± 0.12 |
0.35 ± 0.10 |
0.760 |
| Total Carbohydrate (g/kg) |
2.69 ± 0.84 |
2.74 ± 0.77 |
0.751 |
| Total Dietary Fiber (g/1000kcal) |
11.2 ± 3.2 |
13.9 ± 3.6 |
<0.001 |
| Soluble Dietary Fiber (g/1000kcal) |
4.3 ± 1.7 |
4.7 ± 1.7 |
0.174 |
| Insoluble Fiber (g/1000kcal) |
6.8 ± 2.1 |
9.0 ± 2.4 |
<0.001 |
| Whole Grains (oz/1000 kcal) |
0.79 ± 0.62 |
0.92 ± 0.75 |
0.38 |
| Refined Grains (oz/1000 kcal) |
2.5 ± 1.0 |
2.1 ± 1.0 |
0.063 |
| Total Alcohol (g) |
7.2 ± 10.1 |
7.8 ± 10.9 |
0.787 |
| Alcohol (g/1000kcal) |
3.9 ± 5.4 |
4.8 ± 6.6 |
0.477 |
| Conjugated Linoleic Acid (g) |
0.11 ± 0.04 |
0.09 ± 0.05 |
0.021 |
| Vitamin E (α-Tocopherol) (mg) |
11.6 ± 6.1 |
11.1 ± 5.5 |
0.660 |
| Xylitol (g) |
0.02 ± 0.01 |
0.02 ± 0.01 |
0.477 |
| Inositol (g) |
0.40 ± 0.27 |
0.37 ± 0.16 |
0.622 |
| Phytic Acid (mg) |
684 ± 326 |
677 ± 298 |
0.912 |
| Oxalic Acid (mg) |
247 ± 152 |
209 ± 113 |
0.167 |
| Genistein (mg) |
0.70 ± 1.63 |
0.95 ± 1.78 |
0.461 |
| Glycitein (mg) |
0.10 ± 0.25 |
0.14 ± 0.28 |
0.482 |
| Eating Window (hours) |
11.1 ± 1.1 |
11.1 ± 1.6 |
0.870 |
3.3. Sexual Dimorphism in Nutrient Association with Metabolic Health
3.3.1. Insulin Sensitivity Assessed with Mat-ISI
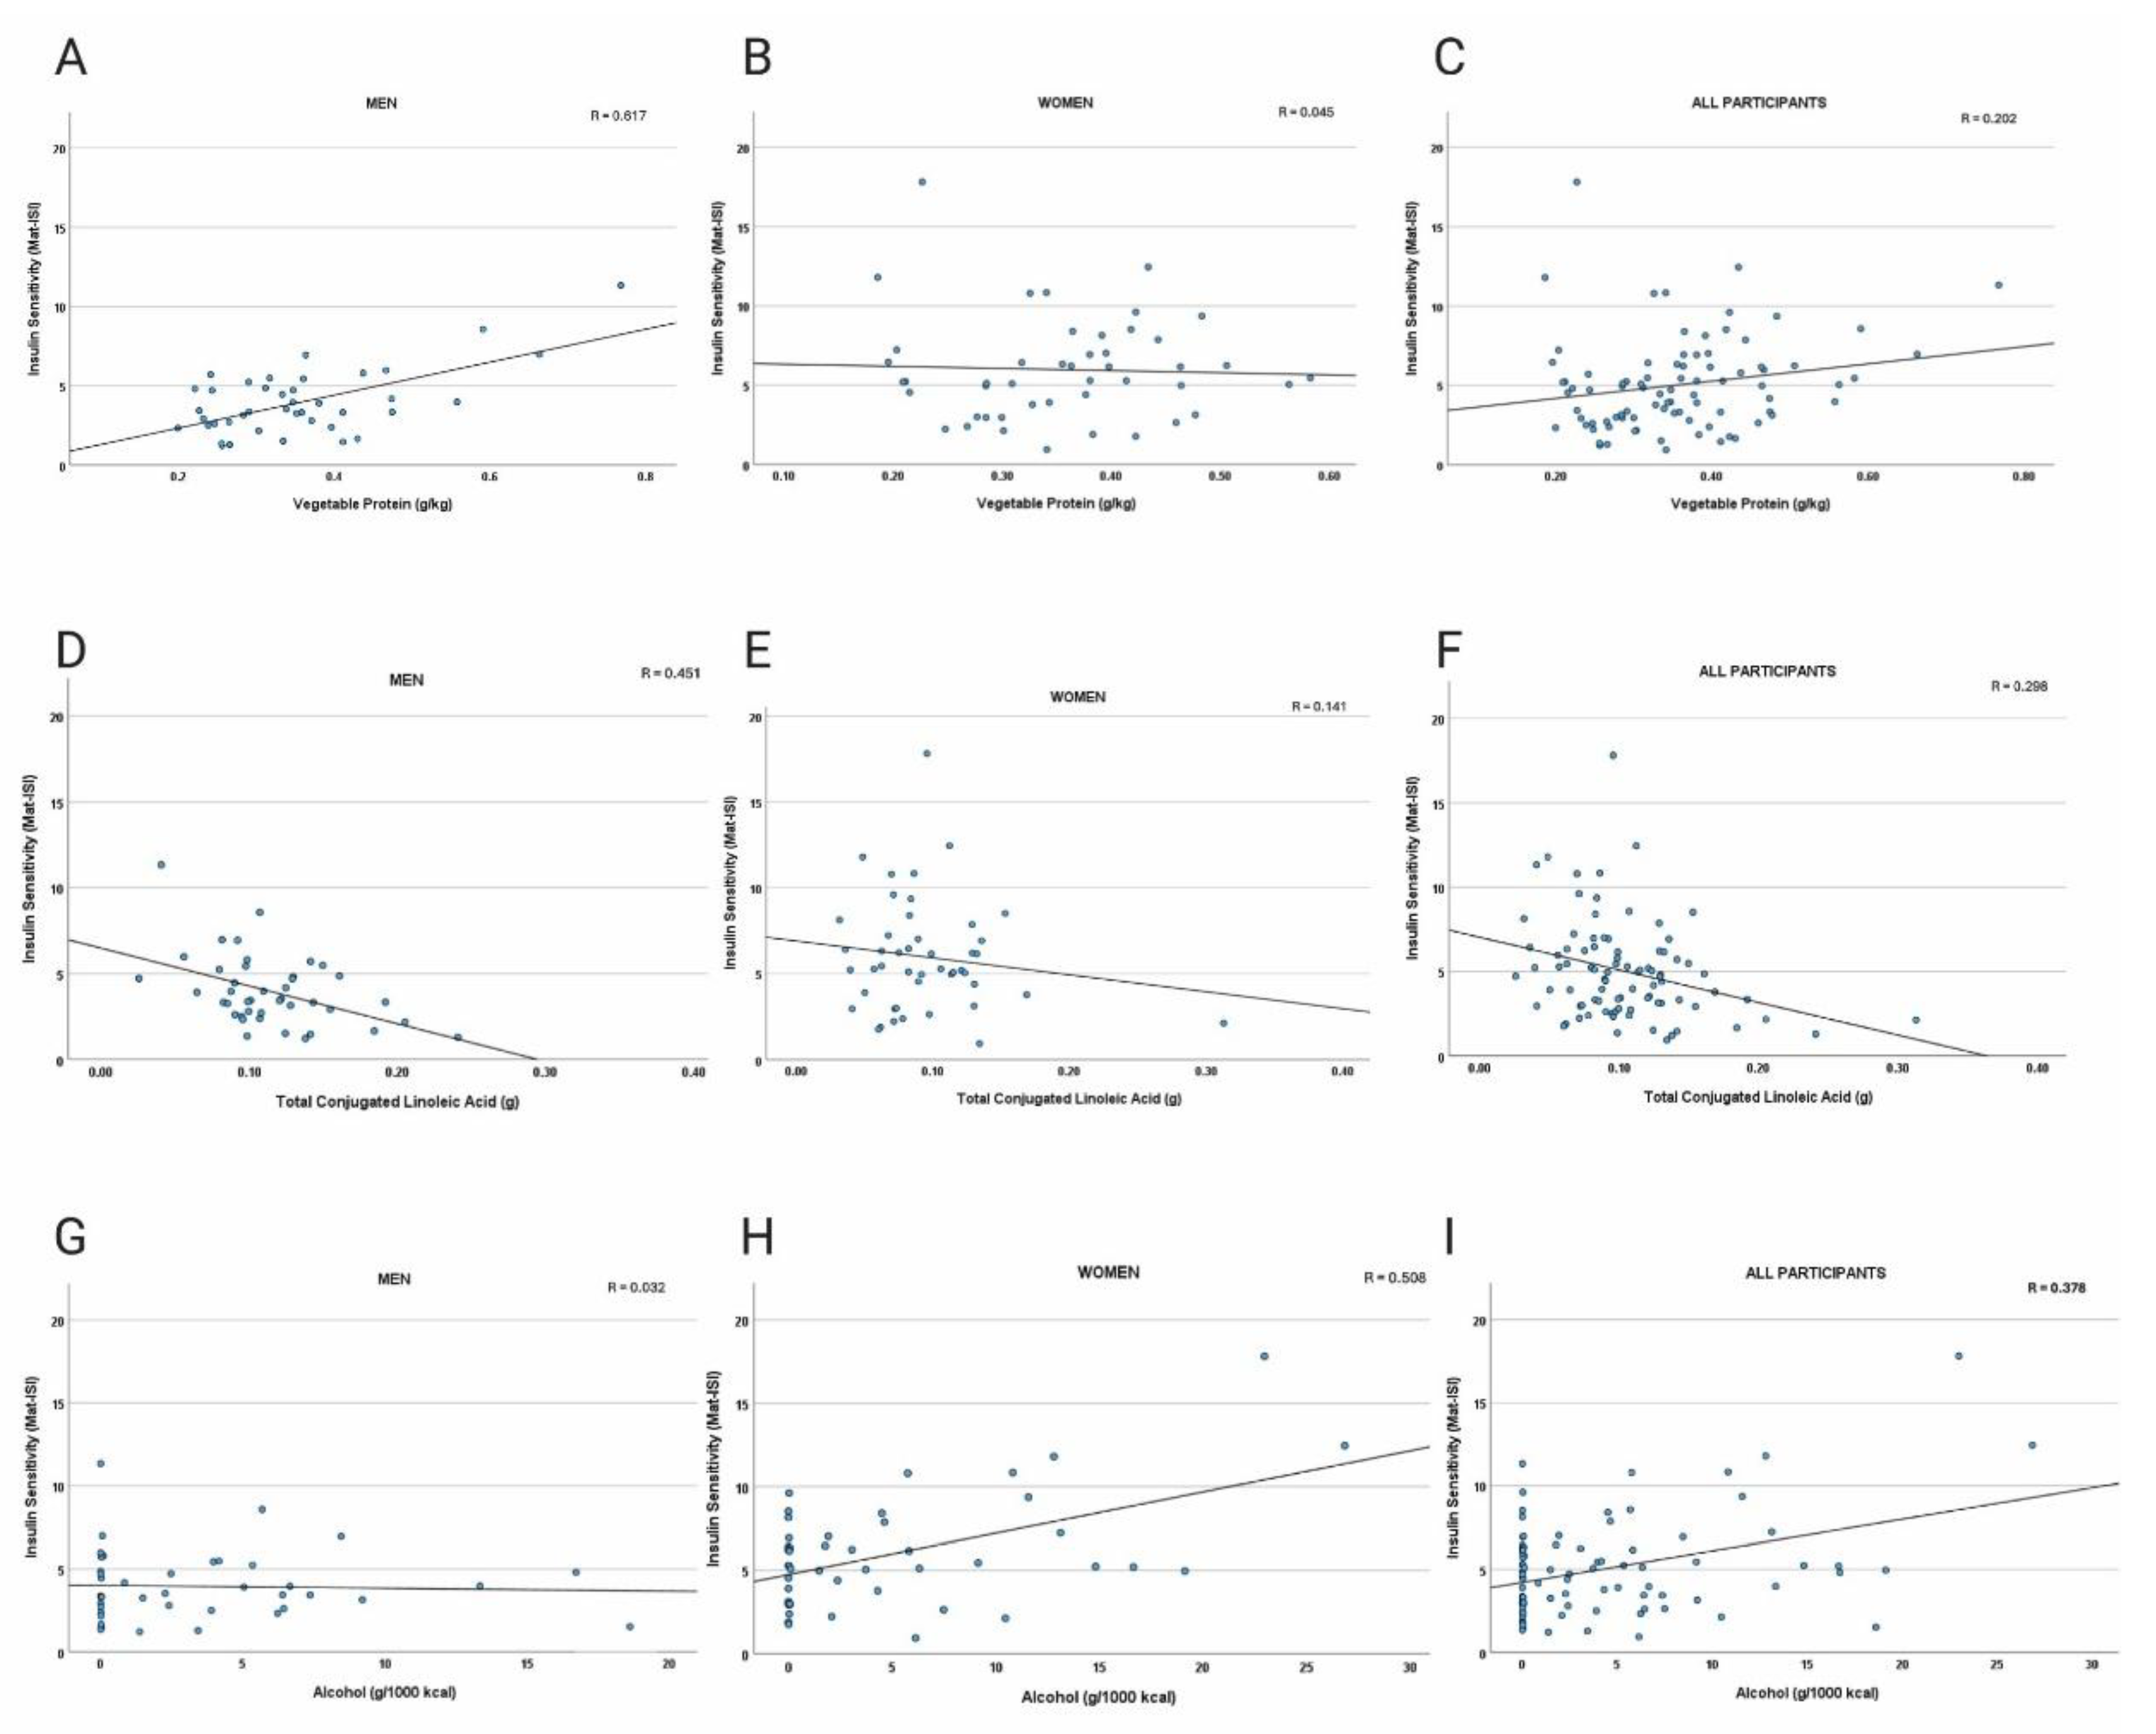
In women, Mat-ISI was positively associated with intake of alcohol (g/1000kcal; p<0.001 total grams, p= 0.005) and xylitol (p = 0.007;
Table 3), whereas BMI and body weight were inversely associated with insulin sensitivity (p < 0.001). In men, vegetable protein (p<0.0001), whole grains (p=0.001), inositol (p=0.002), phytic acid (p=0.002), vitamin E (p=0.003), and oxalic acid (p=0.003) were dietary variables most positively associated with Mat-ISI (
Table 4). In addition to BMI and total body weight (p<0.0001 and p=0.0002, respectively), refined grain (p=0.003) and conjugated linoleic acids (p=0.003) were most negatively associated with Mat-ISI in men. There were no differences in intake of these food components and nutrients between the sexes (
Table 2). Scatter plots of a subset of the data points are presented in
Figure 1A-I.
Table 3.
Dietary Factors Associated with Insulin Sensitivity in Women. .
Table 3.
Dietary Factors Associated with Insulin Sensitivity in Women. .
| Variables (n=46) |
Estimated Coefficient |
p-value1
|
Alcohol (g/1000kcal)
Xylitol (g) |
0.25
108.7164 |
<0.0001
0.006530
|
Table 4.
Dietary Factors Associated with Insulin Sensitivity in Men. .
Table 4.
Dietary Factors Associated with Insulin Sensitivity in Men. .
| Variables (n=432) |
Estimated Coefficient |
p-value1
|
Vegetable Protein (g/kg)
Whole Grains (oz/1000kcal)
Inositol (g)
Phytic Acid (mg)
Refined Grains (oz/1000kcal)
Total CLA2 (g)
Vitamin E (α-Tocopherol) (mg)
CLA2 cis-9, trans-11 (g)
Oxalic Acid (mg)
Total Omega-3 Fatty Acids (g) |
10.4011
0.7872
3.4844
0.0030
-1.0181
-22.0141
0.2031
-26.7475
0.0059
0.8110 |
0.000017
0.001179
0.001619
0.001657
0.002691
0.002749
0.002813
0.002914
0.003470
0.003544
|
Figure 1.
A-I. Scatter plots of dietary factors versus Matsuda Insulin Sensitivity Index (Mat-ISI). Panels depict vegetable protein intake in men (a), women (b), and all participants (c), with positive associations in men; total conjugated linolenic acid intake in men (d), women (e), and all participants (f), with negative correlations strongest in men; and alcohol intake in men (g), women (h), and all participants (i), with no relationship in men and positive correlations in women. Univariate analyses indicating significant associations are reported in
Table 3 and
Table 4).
3.3.2. Insulin Resistance Assessed with HOMA-IR
Univariate analyses showed significant sex-specific associations between dietary intake and insulin resistance (HOMA-IR). In females, higher BMI and weight were positively associated with HOMA-IR (p < 0.0001), reinforcing the strong role of adiposity in insulin resistance. Analyses showed no significant associations between HOMA-IR and dietary components in women. In males, higher energy-adjusted trans-fat intake (p<0.001), total solid fatty acids (p=0.003) , and trans-18:1 (trans-octadecenoic acid; p=0.006) were positively associated with insulin resistance (p < 0.01), while vegetable protein was inversely associated (p< 0.003649) suggesting that processed and solid fats associate with fasted insulin resistance in men (
Table 5).
Table 5.
Dietary Factors Associated with Insulin Resistance in Men.
Table 5.
Dietary Factors Associated with Insulin Resistance in Men.
| Variables (n=43) |
Estimated Coefficient |
p-value1
|
Trans Fat (g/1000kcal)
Solid Fat (g/1000kcal)
Vegetable Protein (g/1000kcal)
Trans-octadecenoic acid (g)
Total Trans Fatty Acids
|
1.4864
0.1245
-13.276
0.5952
0.5401
|
0.000654
0.002973
0.003649
0.005853
0.006235
|
3.3.3. Android Fat
In women, total protein (<.000001), calcium (p = 0.008) and self-reported number of alcoholic beverages per week (p=0.008) were associated with a lower proportion of body fat from android depots (
Table 6).For android fat percentage (android region fat adjusted for total android region mass), men consuming more vegetable protein (both weight- and energy-adjusted p < 0.001), phytic acid (p < 0.001), whole grains (p < 0.001), weight-adjusted total carbohydrate (p < 0.001), dietary fiber (p= 0.001), d-alpha tocopherol (i.e., natural vitamin E), and insoluble fiber (p = 0.002), showed lower relative abdominal fat, whereas intake of cis-9, trans-11 CLA and total CLA were associated with higher android fat percentage (p < = 0.004;
Table 7).
Table 6.
Associations between dietary factors and android region fat percentage in women .
Table 6.
Associations between dietary factors and android region fat percentage in women .
| Diet Component (n=49) |
Estimated Coefficient |
p-value1
|
| Total Protein (g/kg) |
-20.5690 |
<.000001 |
| Alcoholic drinks per week |
-1.2946 |
0.008008 |
| Calcium (mg) |
-0.0067 |
0.008276 |
Table 7.
Associations between dietary factors and android region fat percentage in men .
Table 7.
Associations between dietary factors and android region fat percentage in men .
| Diet Component (n=47) |
Estimated Coefficient |
p-value1
|
| Vegetable Protein (g/kg) |
-40.6456 |
0.000028 |
| Carbohydrate (g/kg) |
-5.4602 |
0.000140 |
| Phytic Acid (mg) |
-0.0137 |
0.000316 |
| Whole grains (oz/1000 kcal) |
-3.2931 |
0.000660 |
| Total Dietary Fiber (g) |
-0.5228 |
0.001071 |
| RRR(D)-α-Tocopherol (mg) |
-0.9990 |
0.002194 |
| Insoluble Dietary Fiber |
-0.7243 |
0.002255 |
| cis-9, trans-11 CLA (g) |
108.2694 |
0.003059 |
| Total CLA (g) |
86.6468 |
0.003729 |
| Animal Protein (g) |
0.3465 |
0.006371 |
Table 7.
Associations between dietary factors and android region fat percentage in women .
Table 7.
Associations between dietary factors and android region fat percentage in women .
| Diet Component (n=49) |
Estimated Coefficient |
p-value1
|
| Total Protein (g/kg) |
-20.5690 |
<.000001 |
| Alcoholic drinks per week |
-1.2946 |
0.008008 |
| Calcium (mg) |
-0.0067 |
0.008276 |
3.2.4. Intermuscular Leg Fat
Finally, intermuscular leg fat was inversely associated with soy isoflavones (glycitein and genistein) in women (p < 0.01), but no relationships were observed in men.
3.4. Modeling the Association of Food Groups with Metabolic Health
After identifying individual nutrients that are associated with metabolic health in each sex, we used multiple linear regression to model how intake of food groups is associated with the primary outcome of insulin sensitivity in both men and women while considering the potential impact of BMI and exercise on the outcome.
3.4.1. Alcohol Intake Positively Associates with Insulin Sensitivity in Women
For females, Model 1 showed that consideration of food group intake explained significant variability in the Mat-ISI (F(3, 47) = 9.68, p<0.0001, R
2 =0.382;
Table 8). Significant predictors included alcohol intake (β=3.12, p<0.001), which retained a similar effect in all models, and an interaction between alcohol and salty condiments (β=−2.58, p=0.004). When BMI was added (Model 2), the model fit improved (F(4,46) = 12.66, p<0.0001, R
2=0.524). Adding only exercise (Model 3) weakened the overall model (F(4,46) = 7.11, p = .0002, R
2 = 0.382), while the combined BMI and exercise model (Model 4) resulted in the best fit (F(5,45)= 9.91, p<0.0001, R
2 =0.524). In Model 4, higher BMI was associated with lower insulin sensitivity (β=−0.42, p<0.001), while exercise was not significantly predictive (p=0.933). The results from all models indicate that alcohol intake is associated with higher insulin sensitivity in women, but salty condiments in the diet weaken the association. We speculate that overall dietary patterns that include foods where salty condiments are often used (e.g., fast foods) may diminish the positive association between alcohol and insulin sensitivity in women.
Table 8.
Alcohol Intake is Associated1 with Higher Insulin Sensitivity in Women.
Table 8.
Alcohol Intake is Associated1 with Higher Insulin Sensitivity in Women.
| Parameter |
Model 1 β
(p-value) |
Model 2 β
(p-value) |
Model 3 β
(p-value) |
Model 4 β
(p-value) |
Intercept
Alcohol
Salty Condiments
Alcohol x Salty Condiments
Baseline BMI
Total Exercise (min/week) |
5.997 (<0.001)
3.125 (<0.001)
-1.037 (0.140)
-2.581 (0.004)
--
-- |
16.950 (<0.001)
2.113 (0.003)
-1.249 (0.048)
-1.676 (0.040)
-0.417 (<0.001)
-- |
5.973 (<0.001)
3.092 (<0.001)
-1.037 (0.144)
-2.571 (0.005)
--
0.0003 (0.921) |
16.981 (<0.001)
2.137 (0.006)
-1.250 (0.051)
-1.682 (0.042)
-0.418 (<0.001)
-0.0002 (0.933) |
3.4.1. Plant Foods Posivitively Associate with Insulin Sensitivity in Men
For males, the food group-only model (Model 1) for Mat-ISI was significant (F(3,38) = 10.22, p<0.0001, R
2 = 0.446;
Table 9) and showed an interaction effect for intake of the nut and seed and whole grain groups, which were positively associated with Mat-ISI (β=0.26, p=0.002). Adding BMI alone (Model 2) retained the positive interaction effect between seed and nut and whole grain intake (β= 0.247, p = 0.002) and improved the model (F(4,37) = 12.72, p<0.0001 R
2= 0.579). Exercise alone (Model 3) was also significant (F(4,37) = 9.19, p<0.0001, R
2 = 0.498), while the combined BMI and exercise model (Model 4) explained the most variance (F(5,36) = 11.06, p<0.0001 R
2 =0.606). Combined, the data suggest that an overall dietary pattern including seeds and nuts, in combination with whole grains, is associated with higher insulin sensitivity in men. Seeds, nuts, and whole grains accounted for less than 50% of total vegetable protein in men, so the results of the food group modeling support that healthful sources of vegetable protein are associated with higher insulin sensitivity in men.
Table 9.
Whole Plant Food Groups are Associated with Higher Insulin Sensitivity in Men.
Table 9.
Whole Plant Food Groups are Associated with Higher Insulin Sensitivity in Men.
| Parameter |
Model 1 β
(p-value)
|
Model 2 β
(p-value)
|
Model 3 β
(p-value)
|
Model 4 β
(p-value)
|
Intercept
Whole Grains
Baseline Nuts and Seeds
Whole Grains x Nuts and Seeds
Baseline BMI
Total Exercise (min/week)
|
3.492 (<0.001)
0.146 (0.577)
-0.466 (0.079)
0.261 (0.002)
--
--
|
11.691 (<0.001)
0.037 (0.872)
-0.445 (0.059)
0.239 (0.002)
-0.294 (0.002)
--
|
3.156 (<0.001)
0.140 (0.579)
-0.546 (0.037)
0.259 (0.002)
--
0.0004 (0.058)
|
10.754 (<0.001)
0.042 (0.853)
-0.0506 (0.032)
0.240 (0.002)
-0.269 (0.003)
0.003 (0.127)
|
3.5. Figures, Tables and Schemes
All figures and tables will be moved to this section in the final manuscript.
4. Discussion
This study examined sex-specific associations between dietary intake and markers of metabolic health in older adults. Key findings point to overall stronger associations between diet and metabolic health in men, as well as a tendency for men to show higher insulin sensitivity when consuming a healthy plant-based diet. Men consuming higher amounts of vegetable protein, whole grains, and certain plant micronutrients and phytochemicals demonstrated lower levels of android fat and greater insulin sensitivity. Women tended to show higher insulin sensitivity with moderate alcohol consumption, while greater total protein from any source and calcium associated with less android fat.
4.1. Plant-Based Diets and Insulin Sensitivity
The positive association between plant-based dietary components and insulin sensitivity in men builds on existing evidence supporting the metabolic benefits of plant-based diets [
6,
21]. Previous studies have demonstrated that higher intakes of whole grains, legumes, and plant-derived bioactive compounds are associated with improved glucose metabolism and lower risk of type 2 diabetes in men [
22,
23]. Multiple regression modeling confirmed that legumes and whole grains, the food groups providing the most plant protein to the diet, were predictors of insulin sensitivity in men, whereas animal protein did not show a significant relationship with metabolic outcomes. These findings align with limited previous research indicating that plant-based protein sources reduce risk of developing type 2 diabetes and CVD in men [
5,
24], whereas diets rich in overall protein, even from animal sources, are associated with lower risk of developing type 2 diabetes in women [
5]. Previously reported sex differences in protein metabolism further underscore the need for individualized dietary recommendations based on biological sex [
25,
26,
27,
28].
These findings suggest that combined intake of food groups can have synergistic benefits, highlighting the potential for dietary patterns emphasizing whole plant-based foods to improve metabolic health in aged men.
4.2. Plant Phytochemicals
Our findings also reinforce a positive relationship between inositol and phytic acid, a storage form of inositol, in metabolic health. Inositol is a group of bioactive compounds abundant in whole grains, legumes, and nuts. Myoinositol (MI) plays a critical role in insulin signaling as a precursor in the synthesis of phosphatidylinositol 3,4,5-trisphosphate (PIP3), a key component of the insulin signal transduction pathway. Within skeletal muscle, MI is enzymatically converted into D-chiro-inositol (DCI), which enhances insulin signaling through mechanisms distinct from MI. Some evidence supports that supplementation with MI and DCI improves insulin sensitivity [
29], particularly in men [
30], suggesting that dietary inositol could be a promising adjuvant therapy in men with insulin resistance.
4.3. Animal-Derived Fats
Here CLA, particularly cis-9, trans-11, was negatively associated with insulin sensitivity in men. This isomer of CLA, which is found in the diet in the meat and milk products of ruminant animals, has previously been shown to increase GLUT4 expression and decreased macrophage infiltration of white fat in male ob/ob C57BL-6 mice [
31]; however, the other common CLA isomer, synthetic trans-10, cis-12, caused increases in insulin concentrations and insulin resistance in C57Bl/6J male mice [
32] and decreases in insulin sensitivity in men [
33]. In our study, nine of the top 20 foods contributing cis-9, trans-11 were types of sausage. Since men in this study did not supplement with CLA, their intake of the trans-10, cis-12 was low. Therefore, it is likely that the inverse relationship between CLA intake and insulin sensitivity in men is due to its presence in highly processed, high-fat animal foods rather than the effects of the cis-9, trans-11 CLA isomer itself. Given the complexity of human nutrition, it is overly reductive to classify a single nutrient as “beneficial” or “harmful” without consideration of overall diet and other behaviors that affect health.
4.4. Alcohol in Women
Unlike men, insulin sensitivity in women was positively associated with alcohol and xylitol intake. Men and women consumed comparable amount of alcohol in this study, averaging approximately 4 g per 1000 kcal each day, which is considered low, given that a standard alcohol “serving” like one typical 12-oz beer has approximately 14g of ethanol. Previous research has suggested that low levels of alcohol consumption may have cardiometabolic benefits, especially reduced risk of hypertension, particularly in women when compared with men [
34,
35,
36,
37]. While human studies directly and prospectively investigating sexual dimorphism in metabolic responses to alcohol intake are limited, there is evidence that chronic alcohol intake results in lower glucose concentrations in female rats, but not male rats, even in the absence of acute alcohol ingestion [
37]. Additionally, a meta-analysis in adults without diabetes showed a relationship between moderate alcohol intake and reduced HbA
1c and fasting insulin among all participants but lower insulin sensitivity in women only [
37].
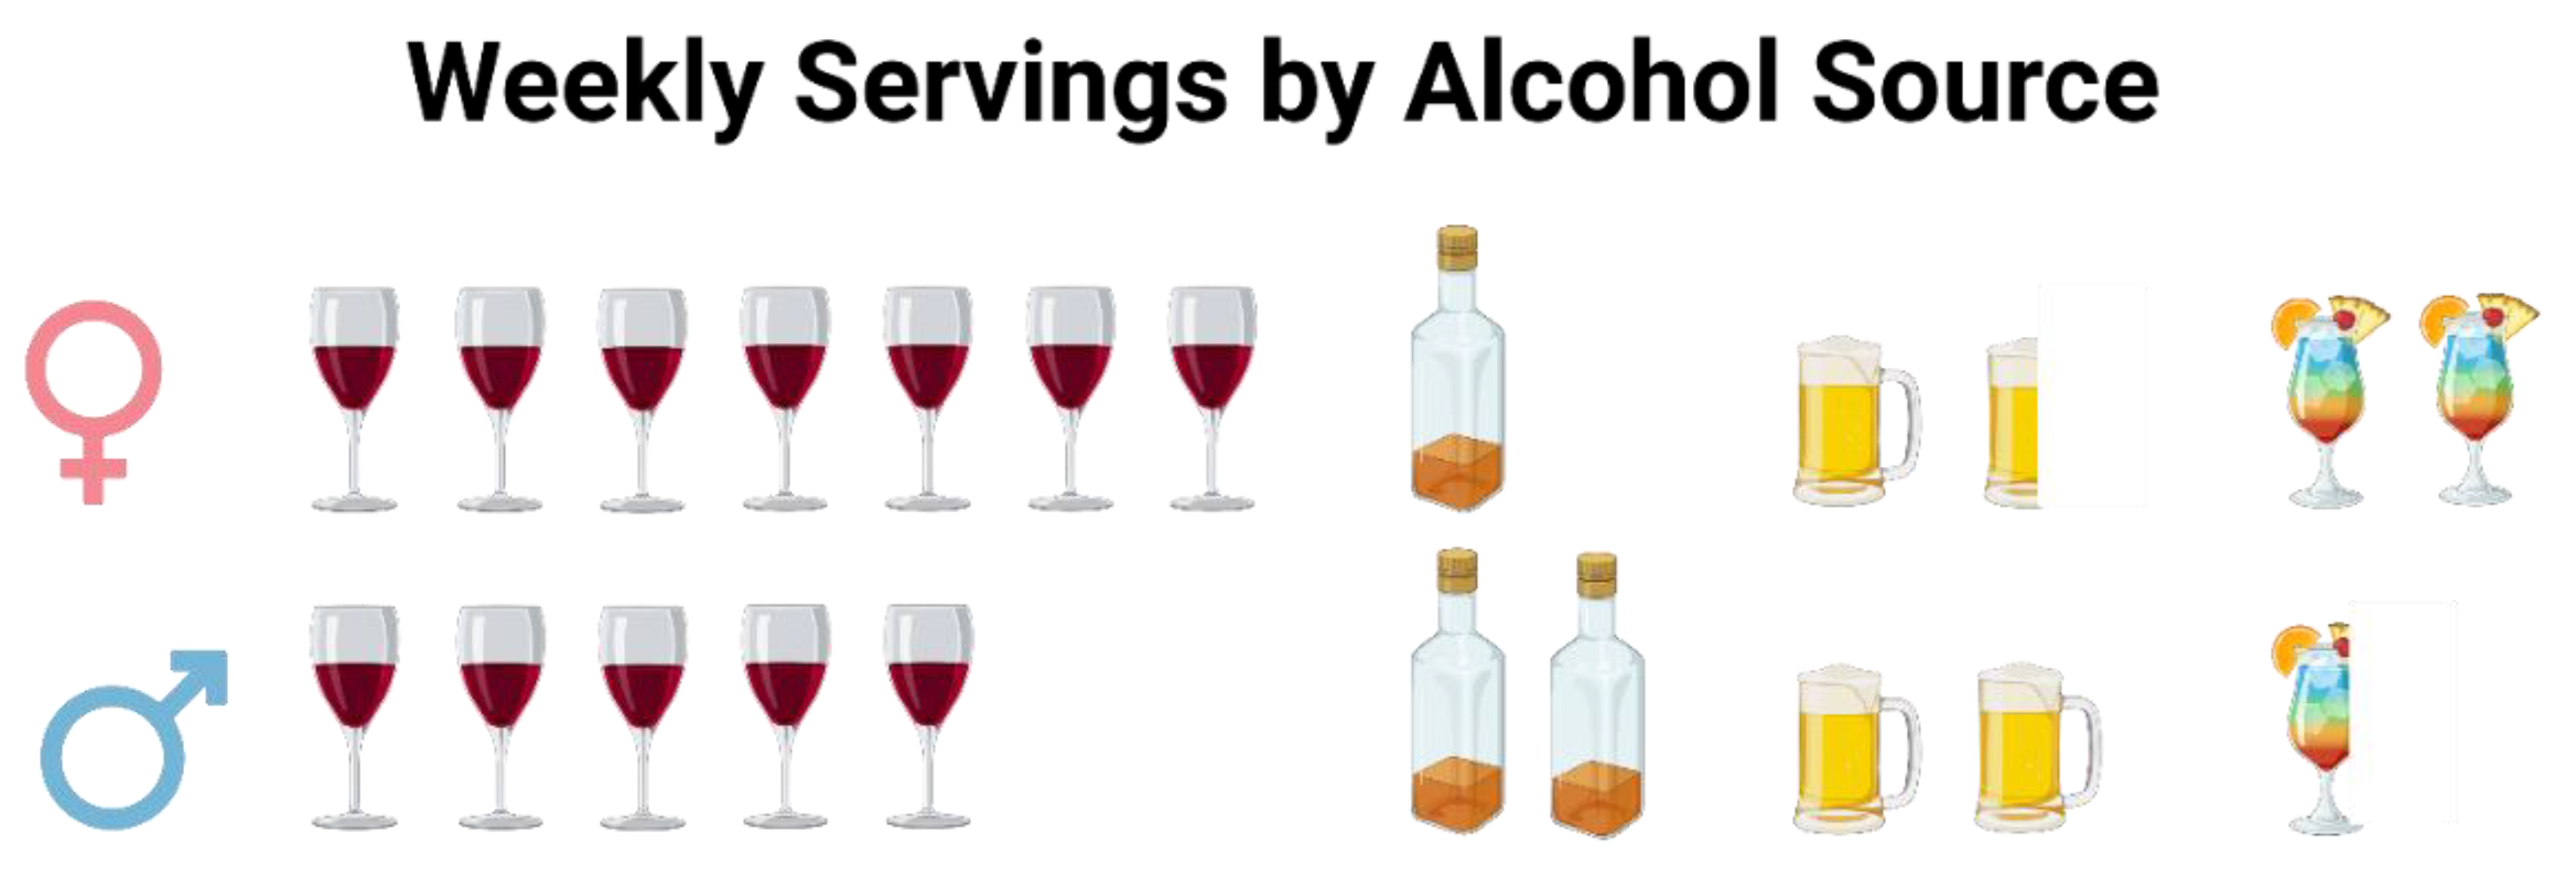
Given that alcohol consumption had one of the strongest associations with insulin sensitivity in women, our findings support that there is potentially sexual dimorphism in response to low-moderate chronic alcohol ingestion. On the other hand, average alcohol intake was similar between the sexes, but the alcohol source varied (
Figure 2). While both sexes drank more wine than any other alcoholic beverage, women consumed it to a greater extent. Similarly, xylitol, which came primarily from wine and whole dark red and purple fruits in female participants’ diets, was positively associated with insulin sensitivity in our analyses. Since total xylitol intake was under a gram each day, even for the heaviest consumers, the association between these alcohols and insulin sensitivity may be more linked to the intake of dark fruits in various forms.
Figure 2.
Weekly servings by alcohol source in women and men. Women (top) tended to consume more wine and cocktails, while men (bottom) tended to consume fewer cocktails and more liquor and beer.
Figure 2.
Weekly servings by alcohol source in women and men. Women (top) tended to consume more wine and cocktails, while men (bottom) tended to consume fewer cocktails and more liquor and beer.
4.5. Limitations
Several limitations should be considered when interpreting our findings. First, the study utilized a secondary analysis of baseline data from a clinical trial, limiting causal inferences. Additionally, all self-reported dietary intake may be subject to measurement error and recall bias. Future research should aim to validate these findings in larger populations and explore potential mechanisms underlying the observed sex differences in metabolic responses to diet.
5. Conclusions
Our analysis highlights significant sex-specific associations between diet and metabolic health in older adults. Our findings suggest that plant-based dietary patterns, particularly those rich in vegetable protein, whole grains, and inositol, may have greater metabolic benefits for men, whereas alcohol and xylitol intake associate with better insulin sensitivity in women. These results contribute to the growing body of evidence supporting the need for sex-specific dietary recommendations to promote metabolic health. Further research is needed to elucidate the mechanisms underlying these associations and to inform personalized nutrition strategies for older adults.
Author Contributions
Conceptualization, Philip Kern, Stacey Slone and Jean Fry; Data curation, Stacey Slone, Douglas Long and Jean Fry; Formal analysis, Stacey Slone and Jean Fry; Funding acquisition, Philip Kern; Investigation, Philip Kern, Brooke Lancaster, Madison Bee, Alyaa Zagzoog, Douglas Long and Jean Fry; Methodology, Kayla Anderson, Philip Kern, Stacey Slone, Douglas Long and Jean Fry; Project administration, Philip Kern and Douglas Long; Software, Jean Fry; Supervision, Jean Fry; Writing – original draft, Kayla Anderson, Allison Steele, Madison Bee, Stacey Slone and Jean Fry; Writing – review & editing, Kayla Anderson, Philip Kern, Allison Steele, Brooke Lancaster, Madison Bee, Alyaa Zagzoog, Stacey Slone and Jean Fry.
Funding
This parent study for this research was funded by the National Institutes of Health, grant number R01AG046920.
Institutional Review Board Statement
The study was approved by the University of Kentucky Institutional Review Board (#47128).
Informed Consent Statement
Informed consent was obtained from all participants involved in the study.
Data Availability Statement
Study data is available from the corresponding author upon reasonable request.
Acknowledgments
We thank Charlotte Peterson for her mentorship and for making data available as co-PI of the parent study.
Conflicts of Interest
The authors declare no conflicts of interest.
Abbreviations
The following abbreviations are used in this manuscript:
| mTOR |
Mammalian/Mechanistic Target of Rapamycin |
| Mat-ISI |
Matsuda Insulin Sensitivity Index |
| HOMA-IR |
Homeostatic Model Assessment of Insulin Resistance |
| DXA |
Dual-Energy X-ray Absorptiometry |
| CT |
Computed Tomography |
References
- Ferrucci, L.; Fabbri, E. Inflammageing: Chronic inflammation in ageing, cardiovascular disease, and frailty. Nat Rev Cardiol 2018, 15, 505–522. [Google Scholar] [CrossRef]
- Vega-Cabello, V.; et al. Dietary Micronutrient Adequacy and Risk of Multimorbidity in Community-dwelling Older Adults. Am J Clin Nutr 2023. [Google Scholar] [CrossRef]
- Hanach, N.I.; McCullough, F.; Avery, A. The Impact of Dairy Protein Intake on Muscle Mass, Muscle Strength, and Physical Performance in Middle-Aged to Older Adults with or without Existing Sarcopenia: A Systematic Review and Meta-Analysis. Adv Nutr 2019, 10, 59–69. [Google Scholar] [CrossRef] [PubMed]
- Valls-Pedret, C.; et al. Mediterranean Diet and Age-Related Cognitive Decline: A Randomized Clinical Trial. JAMA Intern Med 2015, 175, 1094–1103. [Google Scholar] [CrossRef] [PubMed]
- Adams, M.; Sabaté, J. Sexual Dimorphism in Cardiovascular Disease Risk and Risk Factors Among Vegetarians: An Exploration of the Potential Mechanisms. Curr Atheroscler Rep 2019, 21, 35. [Google Scholar] [CrossRef] [PubMed]
- Bedard, A.; et al. Sex differences in the impact of the Mediterranean diet on cardiovascular risk profile. Br J Nutr 2012, 108, 1428–1434. [Google Scholar] [CrossRef]
- Brennan, L.; Gibbons, H. Sex matters: A focus on the impact of biological sex on metabolomic profiles and dietary interventions. Proc Nutr Soc 2020, 79, 205–209. [Google Scholar] [CrossRef]
- Pramfalk, C.; et al. Sex-Specific Differences in Hepatic Fat Oxidation and Synthesis May Explain the Higher Propensity for NAFLD in Men. J Clin Endocrinol Metab 2015, 100, 4425–4433. [Google Scholar] [CrossRef]
- Meneilly, G.S.; Tessier, D. Diabetes in elderly adults. J Gerontol A Biol Sci Med Sci 2001, 56, M5–M13. [Google Scholar] [CrossRef]
- López-Otín, C.; et al. The hallmarks of aging. Cell 2013, 153, 1194–1217. [Google Scholar] [CrossRef]
- Franceschi, C.; et al. Inflammaging: A new immune-metabolic viewpoint for age-related diseases. Nat Rev Endocrinol 2018, 14, 576–590. [Google Scholar] [CrossRef]
- Baboota, R.K.; et al. Chronic hyperinsulinemia promotes human hepatocyte senescence. Mol Metab 2022, 64, 101558. [Google Scholar] [CrossRef]
- Waziry, R.; et al. Effect of long-term caloric restriction on DNA methylation measures of biological aging in healthy adults from the CALERIE trial. Nat Aging 2023, 3, 248–257. [Google Scholar] [CrossRef]
- Milan, M.; et al. Time-restricted feeding improves aortic endothelial relaxation by enhancing mitochondrial function and attenuating oxidative stress in aged mice. Redox Biol 2024, 73, 103189. [Google Scholar] [CrossRef] [PubMed]
- Kulkarni AS, Gubbi, S; Barzilai, N. Benefits of Metformin in Attenuating the Hallmarks of Aging. Cell Metab 2020, 32, 15–30. [CrossRef] [PubMed]
- Long, D.E.; et al. Metformin to Augment Strength Training Effective Response in Seniors (MASTERS): Study protocol for a randomized controlled trial. Trials 2017, 18, 192. [Google Scholar] [CrossRef] [PubMed]
- Walton, R.G.; et al. Metformin blunts muscle hypertrophy in response to progressive resistance exercise training in older adults: A randomized, double-blind, placebo-controlled, multicenter trial: The MASTERS trial. Aging Cell 2019, 18, e13039. [Google Scholar] [CrossRef]
- Matsuda, M.; DeFronzo, R.A. Insulin sensitivity indices obtained from oral glucose tolerance testing: Comparison with the euglycemic insulin clamp. Diabetes Care 1999, 22, 1462–1470. [Google Scholar] [CrossRef]
- Matthews, D.R.; et al. Homeostasis model assessment: Insulin resistance and beta-cell function from fasting plasma glucose and insulin concentrations in man. Diabetologia 1985, 28, 412–419. [Google Scholar] [CrossRef]
- Lambert, J.G.L.; Elliott, C.F.; Thompson, K.; Stromberg, A. rFSA: An R Package for Finding Best Subsets and Interactions. R J. 2019, 10. [Google Scholar] [CrossRef]
- Leblanc, V.; et al. Gender differences in the long-term effects of a nutritional intervention program promoting the Mediterranean diet: Changes in dietary intakes, eating behaviors, anthropometric and metabolic variables. Nutr J 2014, 13, 107. [Google Scholar] [CrossRef]
- Chen, Z.; et al. Plant versus animal based diets and insulin resistance, prediabetes and type 2 diabetes: The Rotterdam Study. Eur J Epidemiol 2018, 33, 883–893. [Google Scholar] [CrossRef] [PubMed]
- Satija, A.; et al. Plant-Based Dietary Patterns and Incidence of Type 2 Diabetes in US Men and Women: Results from Three Prospective Cohort Studies. PLoS Med 2016, 13, e1002039. [Google Scholar] [CrossRef] [PubMed]
- Zhan, S.; Ho, S.C. Meta-analysis of the effects of soy protein containing isoflavones on the lipid profile. Am J Clin Nutr 2005, 81, 397–408. [Google Scholar] [CrossRef] [PubMed]
- Green, C.L.; et al. Sex and genetic background define the metabolic, physiologic, and molecular response to protein restriction. Cell Metab 2022, 34, 209–226.e5. [Google Scholar] [CrossRef]
- Green, C.L.; et al. Dietary restriction of isoleucine increases healthspan and lifespan of genetically heterogeneous mice. Cell Metab 2023, 35, 1976–1995.e6. [Google Scholar] [CrossRef]
- Larson, K.R.; et al. Sex Differences in the Hormonal and Metabolic Response to Dietary Protein Dilution. Endocrinology 2017, 158, 3477–3487. [Google Scholar] [CrossRef]
- Westerterp-Plantenga, M.S.; et al. Sex differences in energy homeostatis following a diet relatively high in protein exchanged with carbohydrate, assessed in a respiration chamber in humans. Physiol Behav 2009, 2009. 97, 414–419. [Google Scholar] [CrossRef]
- Minambres, I.; et al. Effects of inositol on glucose homeostasis: Systematic review and meta-analysis of randomized controlled trials. Clin Nutr 2019, 38, 1146–1152. [Google Scholar] [CrossRef]
- Monastra, G.; et al. D-chiro-inositol, an aromatase down-modulator, increases androgens and reduces estrogens in male volunteers: A pilot study. Basic Clin Androl 2021, 31, 13. [Google Scholar] [CrossRef]
- Moloney, F.; et al. Antidiabetic effects of cis-9, trans-11-conjugated linoleic acid may be mediated via anti-inflammatory effects in white adipose tissue. Diabetes 2007, 56, 574–582. [Google Scholar] [CrossRef]
- Cordoba-Chacon, J.; et al. Tissue-dependent effects of cis-9,trans-11- and trans-10,cis-12-CLA isomers on glucose and lipid metabolism in adult male mice. J Nutr Biochem 2019, 67, 90–100. [Google Scholar] [CrossRef]
- Risérus, U.; et al. Treatment with dietary trans10cis12 conjugated linoleic acid causes isomer-specific insulin resistance in obese men with the metabolic syndrome. Diabetes Care 2002, 25, 1516–1521. [Google Scholar] [CrossRef]
- Wang, C.N.; et al. Women and Alcohol: Limitations in the Cardiovascular Guidelines. Curr Probl Cardiol 2023, 48, 101200. [Google Scholar] [CrossRef]
- Roerecke, M.; et al. Sex-Specific Associations Between Alcohol Consumption and Incidence of Hypertension: A Systematic Review and Meta-Analysis of Cohort Studies. J Am Heart Assoc 2018, 7. [Google Scholar] [CrossRef] [PubMed]
- Cecchini, M.; et al. Alcohol Intake and Risk of Hypertension: A Systematic Review and Dose-Response Meta-Analysis of Nonexperimental Cohort Studies. Hypertension 2024, 81, 1701–1715. [Google Scholar] [CrossRef] [PubMed]
- Sumida, K.D.; et al. Chronic alcohol consumption yields sex differences in whole-body glucose production in rats. Alcohol Alcohol 2004, 39, 418–426. [Google Scholar] [CrossRef] [PubMed]
|
Disclaimer/Publisher’s Note: The statements, opinions and data contained in all publications are solely those of the individual author(s) and contributor(s) and not of MDPI and/or the editor(s). MDPI and/or the editor(s) disclaim responsibility for any injury to people or property resulting from any ideas, methods, instructions or products referred to in the content. |
© 2025 by the authors. Licensee MDPI, Basel, Switzerland. This article is an open access article distributed under the terms and conditions of the Creative Commons Attribution (CC BY) license (https://creativecommons.org/licenses/by/4.0/).