Submitted:
23 September 2025
Posted:
23 September 2025
You are already at the latest version
Abstract
Roof accidents, as typical accidents in mine safety production, occur frequently and are highly harmful, posing a significant threat to the life safety of miners. Through the causal analysis of the occurrence process of roof accidents, this study creatively constructs an accident causation matrix to realize the characteristic description of accident causes, which serves as the data support for the Bayesian network built based on fault tree modeling. Ultimately, a new analysis framework integrating the accident causation matrix and the Bayesian network model is established. In the process of accident analysis, first, based on the 2-4 causation model theory and combined with the association rule algorithm, the key factors of the accident and their internal correlations are obtained, and the accident causation matrix is constructed. Second, the fault tree is transformed into a Bayesian network model, and the accident causation matrix is used for parameter learning and optimization. Finally, two methods-model comparative analysis and real case verification are adopted to prove the advancement and effectiveness of this study. Researching results indicate that the accident causation matrix can effectively characterize accident causation factors, providing precise input data for Bayesian network models and significantly enhancing their reliability. Through the reverse reasoning function of Bayesian networks, dynamic diagnosis of accident causes and identification of key risk factors are achieved, enabling a more dynamic and detailed analysis of accident causes. This offers a scientific basis for coal mining enterprises to formulate preventive measures.
Keywords:
cause of the accident
; Bayesian network
; accident tree
; association rule
1. Introduction
Coal, as one of the world's most important energy sources, holds a significant position in China's energy structure. Data from the International Energy Agency (IEA) in 2023 shows that China has become the world's largest coal consumer [1]. According to the statistical analysis data on China's coal mine accidents from 2008 to 2021 by Zhang Peisen et al [2]., roof accidents are the most frequent type in coal mine production, with an occurrence frequency of 32.93%, causing the second-highest number of deaths after gas explosions among various types of coal mine accidents. Such accidents directly threaten miners’ lives and may trigger secondary disasters like gas leakage. For example, the "March 28" accident [3] at Tashan Coal Mine, the roof collapse caused the roadway to connect with the upper goaf, which in turn led to the abnormal gas accumulation and explosion risks. These compound disasters highlight the urgency of roof accident research.
The causal factors of roof accidents are relatively complex. According to existing investigation reports, such accidents are the result of the interaction and combined effect of multiple factors including humans, objects, environment, and management. However, traditional accident analysis methods, such as fault tree analysis, struggle to capture the characteristics of dynamic interactions among multiple factors. This leads to lag and one-sidedness in existing preventive measures, which fail to meet the needs of precise prevention and control in modern coal mine safety production. To address this, this study proposes a new analytical framework integrating an accident causation matrix with a Bayesian network. This framework aims to break through the limitations of static analysis. By quantitatively evaluating factor correlations and dynamic changes, the framework provides scientific decision support for roof accident prevention, realizes the organic combination of qualitative characteristic description and quantitative probability reasoning, and thus promotes the transformation of roof accident prevention from passive response to active prevention.
"Accident-Causing Theory" is a cornerstone of safety science, whose core lies in explaining the mechanism of accident occurrence and providing relevant theoretical support for risk assessment and accident analysis [4]. Early accident causation theories were relatively simplistic. For example, Heinrich's Domino Theory [5], which was the first to put forward the concepts of "human unsafe acts" and "material unsafe conditions", laid the foundation for the subsequent development of accident causation theories . Gordon's epidemiological model [6] established a three-dimensional framework [7] for accident causation analysis, covering host, agent, and environment, but lacked quantitative methods for causal relationships. With the development of system safety engineering, accident analysis methods have shifted toward systematic and risk-oriented analysis. Fault Tree Analysis (FTA) can systematically identify potential influencing factors but struggles to handle dynamic interactions. System-theoretic models such as AcciMap [8], the System-Theoretic Accident Modeling and Processes (STAMP) [9], and the Functional Resonance Analysis Method (FRAM) [10] have deepened the understanding of complexity through hierarchical control, functional network interactions, and cross-level causal mapping. However, there remain challenges in comprehensively predicting potential interactions. In recent years, risk analysis methods have demonstrated unique advantages through multi-dimensional integration. For example, Carmela [11] et al. integrated climate disaster types, exposure samples, and vulnerability factors via a matrix, providing an effective tool for airport climate risk assessment. It can be seen that factors at multiple levels and dimensions can be compared in the form of a matrix by assigning different weights according to their importance and influence, thereby highlighting the key factors contributing to accidents. In complex system risk modeling, traditional methods struggle to quantify the dynamic interactions and dependencies among causation factors. Multi-criteria decision-making methods address this gap by representing multi-factor, multi-level complex relationships in a matrix format, effectively compensating for the limitations of qualitative models in supporting quantitative decision-making. As exemplified by the study of Mohammad [12] et al., the hybrid model integrating DEMATEL and ANP can analyze causal relationships between factors and compute dependency weights. This methodology can be widely applied to refined quantitative assessments in fields such as flood risk evaluation.Therefore,this study integrates causation factors into a matrix framework for comprehensive characterization.
Bayesian network (BN) is a network model based on probabilistic reasoning [13], which mainly consists of two parts: directed acyclic graph (DAG) and conditional probability table (CPT). A complete Bayesian network can be obtained after structure learning and parameter learning. There are three commonly used methods for learning BN structures from data: constraint-based algorithms, score-based algorithms, and hybrid search algorithms [14]. The hybrid search algorithm integrates the above two algorithms to find the optimal Bayesian network structure in a large search space. A commonly used strategy is to adopt a constraint-based algorithm to construct the skeleton of the graph, and then use a score-based algorithm to search for the optimal DAG [15]. In 2020, He Yongchang et al. [16] adopted the mainstream method of directly constructing Bayesian network model structures based on expert experience, which is the Fault Tree-Bayesian Network (FT-BN) conversion method. Traditional fault tree analysis involves large computational effort and lacks the ability to perform reverse probability inference [17]. Traditional fault tree analysis involves large computational effort and lacks the ability to perform reverse probability inference; in contrast, BN have bidirectional reasoning capabilities, which can not only calculate failure probabilities through forward reasoning but also analyze key events through reverse reasoning [18]. Subsequently, considering the relative simplicity of fault tree construction, researchers attempted to convert fault tree structures into BN models by integrating the advantages of both methods.
Parameter learning is crucial in Bayesian Network (BN) learning. Its core lies in estimating the conditional probability tables of nodes through training samples under the premise of a known network structure. This process aims to maximize the log-likelihood function, which is essentially a global optimality problem. Traditional methods such as Maximum Likelihood Estimation (MLE) and Maximum A Posteriori Probability Estimation (MAP) perform well with complete data but suffer from overfitting, underfitting, and prior sensitivity. The Expectation-Maximization (EM) algorithm handles incomplete data, however, its results are easily affected by initial weights [19]. In practical applications, inference algorithms fall into two categories based on computational characteristics: exact and approximate inference algorithms [20]. Exact inference obtains accurate probability distributions through rigorous calculations, ensuring rigor; approximate inference quickly acquires approximate solutions at the cost of partial accuracy in large-scale networks or complex computations, thereby improving efficiency.
2. Materials and Methods
2.1. Construction of the Accident Causation Matrix
In accident risk analysis, the accident causation matrix enables accident characterization through risk level assessment and multi-dimensional visualization, thereby assisting in screening observable key factors. Finally, the causation matrix is input into the Bayesian network model. Below, the construction method of the accident causation matrix and the selection of key observable factors will be elaborated in detail.
2.1.1. Definition of the Accident Causation Matrix
When selecting matrix elements, causal factors across five dimensions (human, material, management, individual capabilities, and safety culture) were extracted from 100 accident reports, ensuring the matrix comprehensively reflects the multifaceted factors contributing to accidents. However, given the complexity of accident prediction (e.g., difficulty in predicting unexpected events like rule violations), it is necessary to screen observable factors as matrix elements. this study employed association rule algorithms to mine high-frequency representative factors, while referencing the Coal Mine Safety Regulations [21] to ensure the rationality of selecting human factors. Nevertheless, this method has limitations: on one hand, association rule analysis may miss important factors due to subjective setting of minimum support and confidence levels; on the other, the regulations may have a certain degree of lag. Based on this, relevant factors will be gradually revised and improved through model training and iterative feedback.
Next, the accident causation matrix defined in this study is presented as ,which is a 5-tuple matrix constructed based on the 2-4 Model causation theory. The human factor is defined as the impact of an individual's own attributes on accidents, which can be expressed as ; the object factor refers to the impact of unsafe object states on accidents, expressed as ; the individual ability is defined as the influence of an individual's multi-dimensional capabilities on accidents, denoted as ; the management system represents the impact of safety management factors on accidents, expressed as; and the safety culture is defined as the impact of an enterprise's guiding principles on accidents, denoted as . The causation matrix composed of these five dimensional vectors systematically covers various relevant factors from the level of individual actions to the levels of macro management and safety culture, laying a foundation for the in-depth analysis of accident causes in the follow-up.
2.1.2. Modeling Process of the Accident Causation Matrix
In Figure 1, the construction of the accident causation matrix is centered on the 2-4 model as its theoretical core, combined with investigation reports on the causes of coal mine roof accidents. It follows a three-step process: "stage decomposition to clarify causal chains—hierarchical sorting to determine dimensional logic—defining tuples and vectors to form the matrix." This approach ultimately achieves a systematic and characteristic representation of accident causes. The specific process is as follows.
➀Using the 2-4 model as the theoretical framework and incorporating collected investigation reports on coal mine roof accident causes, the logic of accident occurrence is deconstructed layer by layer to delineate five causal dimensional vectors of the matrix. First, starting from Stage 1—one-time behaviors and physical conditions—the direct causes of the accident are identified, including specific unsafe actions and unsafe physical conditions. Next, moving to Stage 2—individual factors—the indirect causes of the accident are analyzed, covering deficiencies in safety habits, safety awareness, and safety knowledge. Then, from the perspective of Stage 3—operational behaviors—systemic gaps in the coal mine enterprise's safety management system are identified, constituting the root causes of the accident. Finally, ascending to Stage 4—guiding behaviors—the presence or absence of a safety culture that guides coal mine safety production is examined, representing the fundamental cause of the accident. These four stages form a progressive causal chain from "direct—indirect—root—fundamental," achieving a comprehensive and systematic explanation of accident causes.
➁Using the above five dimensions as the theoretical framework, accident reports are systematically analyzed to clarify the causal logic across levels, decomposing the causes from both organizational and individual perspectives. The organizational level includes the fundamental cause (lack of safety culture) and the root cause (deficiencies in the safety management system). Due to the practical and systemic nature of coal mine safety culture, factors such as whether safety is prioritized and whether prevention is emphasized are treated as specific characteristics of safety culture and are not further subdivided. Deficiencies in the safety management system are categorized into two types: inadequate responsibility of relevant departments and issues with rules and regulations, covering typical causes such as lack of training and insufficient supervision. The individual level includes indirect causes (insufficient individual capabilities) and direct causes (unsafe actions and physical conditions). Individual capabilities are divided into safety habits, safety awareness, and safety knowledge, manifesting as delayed support, poor self-protection awareness, etc. Unsafe actions are categorized into violations and errors, while unsafe physical conditions involve factors such as the environment, support materials, and arch lining. Through causal analysis of accident reports and association rule mining, frequent itemsets and strong association rules are extracted to identify key causal factors, thereby achieving a logical connection from the decomposition of accident causes to the determination of matrix factors.
➂In the process of constructing the accident causation matrix, the first step is based on the causation theory of the 2-4 model.T is defined as a 5-tuple and the items within the tuple are determined, where . Second, each item is treated as a column vector. Taking P (human factors) as an example, , and the meanings of the elements in this column vector are as follows: p1 = age, p2 = length of service, p3= training status (trained or not), p4= health status, p5 = skill score. The remaining items are defined in the same manner. The final accident causation matrix obtained is:
How to determine the sub-elements in the above five column vectors to realize the characteristic description of accidents? The association rule algorithm Apriori was used to analyze the accident-causing factors, with the minimum support set to 0.2. (During our experiments, it was found that when the minimum support is greater than 0.2, some valuable information such as support materials and delayed support, which are not common but meaningful, will be lost; when the minimum support is less than 0.2, many item sets with little practical significance will be included. Therefore, setting the minimum support to 0.2 balances the universality and rarity of the occurrence of item sets in the data.) All frequent item sets were obtained.
In accordance with the Coal Mine Safety Regulations, the frequent item sets are analyzed to obtain the specific elements of the column vectors. The meanings of each element in P are as follows: is age, is length of service, is whether trained, is health status, and is skill score; the meanings of each element in O are: is whether the supporting materials are sufficient, is the quality of supporting materials, is the condition of the roadway section, is the quality of the canopy frame, and is the masonry insulation measures; the meanings of each element in A are: is whether there is a scientific supporting design, is whether the support is comprehensive and standardized,is whether the support is timely, is whether there is a dedicated person in command, and is the level of safety awareness; the meanings of each element in M are: is whether the training work is in place, is whether the supervision and inspection by the mine business department and safety supervision department are in place, is whether the work safety responsibility system is implemented, is whether the safety technical measures are in place, and is whether the number of professional management personnel is sufficient; the meanings of each element in C are: is whether "safety first" is emphasized, is whether "prevention first" is focused on, is whether there is a sound safety management system, is whether safety education and training are valued, and is whether regular safety inspections and evaluations are conducted.
After determining each element of the matrix, since the state value of each element in the matrix is the input value for the parameter learning of the Bayesian Network structure, this study needs to determine the state division of each element. The text in this paper uses discrete state values of "YES" and "NO" to represent its state. Notably, for variables such as the quality of canopy frames under material factors and safety awareness under individual capabilities, which involve measurement issues, the discrete values "YES" and "NO" alone cannot achieve precise positioning. Therefore, a scoring system is adopted to determine their values, with these three continuous variables discretized such that different scores correspond to different states. For the basic factors under human factors, including age, length of service, training status, health condition, and technical proficiency, these are inherent attributes of humans, and accident reports only provide brief descriptions. However, according to the Coal Mine Safety Regulations, these factors cannot be ignored. Thus, this paper classifies age, length of service, and technical proficiency, discretizing these continuous variables to determine their state values. In addition, the factor of "training status" can be directly set as a discrete variable with values "YES" and "NO". The state of each factor is shown in the indicators of Appendix A.
The above is the construction process of the accident-causing matrix, which provides input preparation for the construction of the Bayesian Network model and offers a data model for accident-causing analysis.
2.2. Construction and Optimization of Bayesian Network Model
Mine safety accidents are a type of uncertain accidents. Structural learning can reflect the causal relationships between accident factors in a graphical manner, while parameter learning can handle uncertain reasoning problems through data. Below, the construction and optimization process of the Bayesian network model will be elaborated from two aspects: structural learning and parameter learning
2.2.1. Structural Learning of Bayesian Network Model
To accurately analyze the causes of accidents and improve prediction capabilities, this section constructs a network structure reflecting causal relationships between variables based on fault tree-to-Bayesian network conversion rules, thereby enhancing the reliability and effectiveness of Bayesian networks in analysis and prediction.

Table 1.
Numbering and meanings of each event.
| Number | Basic event | Number | Basic event |
| X1 | Age | X16 | Sufficient management personal |
| X2 | Physical factors | X17 | Adequate training work |
| X3 | Whether trained | X18 | Safety inspection status |
| X4 | Health condition | X19 | Implementation of production responsibility system |
| X5 | Skill proficiency | X20 | Technical measures are in place |
| X6 | Sufficient support materials | X21 | Focus on prevention |
| X7 | Quality of support materials | X22 | Emphasize safety |
| X8 | Condition of roadway cross | X23 | Improve the system |
| X9 | Quality of support frame | X24 | Focus on safety education |
| X10 | Masonry insulation measures | X25 | Regular inspection and evaluation |
| X11 | Scientific support design | M1 | Human factors |
| X12 | Comprehensive and standardized support | M2 | Physical factors |
| X13 | Timeless of support | M3 | Individual ability |
| X14 | Whether there is unmanned command | M4 | Management system |
| X15 | Scientific support design | M5 | Safety culture |
A fault tree takes the undesired system event (top event) as the analysis target and traces all possible causes layer by layer, presenting the logical relationships among bottom events, intermediate events, and the top event. Therefore, after defining the accident causation matrix, an extended fault tree is constructed by applying the logical method of deriving "causes" from "results" to each causation factor. This fault tree contains logical relationships between events, thereby forming the structure of a Bayesian network. As shown in Figure 2, the top event "roof accident" is caused by the combined action of multiple intermediate events, and these intermediate events are respectively associated with corresponding bottom events. For example, the "human factor" includes specific elements such as age, length of service, and whether training has been received; the "object factor" covers a series of observable indicators like the sufficiency of support materials, the quality of support materials, and the condition of roadway cross-sections. Bottom events can indirectly affect the top event by influencing intermediate events, thus forming a transmission path of "bottom factors → intermediate events → top event". This structure intuitively demonstrates the systematic connection of causation factors from the specific to the comprehensive, providing a clear structured analysis perspective for studying the interaction mechanism of multiple factors in roof accidents.
According to the conversion rules of the fault tree-Bayesian network model, the causal factors and logical relationships in the fault tree are converted into nodes and connections in the Bayesian network, so as to obtain the structure of the Bayesian network model, which can be referred to in Figure 2.
2.2.2. Parameter Learning of Bayesian Network Model
After obtaining the Bayesian network structure for roof accidents, it is necessary to estimate the conditional probability distributions between nodes through parameter learning. Considering data collection constraints and completeness requirements, this study adopts the Expectation-Maximization algorithm (EM) for Bayesian network parameter learning.
The EM algorithm is an iterative optimization method for parameter estimation in probabilistic models. It performs optimization by alternately executing the Expectation step (E-step) and the Maximization step (M-step) until it converges to a local maximum. The algorithm first randomly initializes the value of the model parameter as, and then enters the iterative process:
- E-step: Based on the current parameters and observed data, calculate the posterior probability distribution of the latent variable . Wherein , represents the sample index, which is used to distinguish different accident case samples; denotes the latent variable of the -th sample; stands for the observed variable of the -th sample; represents the model parameter at the -th iteration. The formula is as follows:
Further calculate the expectation of the log-likelihood function with respect to the latent variable , where indicates the number of iterations, and the optimal parameters are gradually approximated through continuous iterations.
- M-step: Maximize ) and update parameter through iteration to maximize the expectation of the log-likelihood. In the formula, represents the parameter after the -th iterative update.
This paper uses the GeNIe tool and the EM algorithm for parameter learning of the Bayesian network. Upon completion, the system outputs the model's goodness-of-fit metric , which ranges from ( and is used to judge the degree of fit between the model and the data. The finally trained model is shown in Figure 3.
Through network parameter learning, each node has obtained a corresponding conditional probability table. Changing the probability of one node will result in changes in the probabilities of related nodes. In daily coal mine operations, the aforementioned model can be used to predict the probability of potential accidents.
Sensitivity analysis can effectively identify key factors that have a significant impact on the target node and quantitatively assess the degree of influence of each factor on the target node. By comparing the magnitudes of these influences, targeted preventive measures can be taken against roof accidents. Taking node L "roof accident does not occur" as the target node for sensitivity analysis, the sensitivity distribution as shown in Figure 4 can be obtained. The color depth in the figure is proportional to the degree of sensitivity; a darker color indicates a higher degree of influence of the factor on roof accidents.
From the analysis results in the figure, factors such as short length of service, poor quality support materials, non-standard support, weak safety awareness, and lack of a dedicated supervisor are identified as the most sensitive causal factors. Then, by sorting these causal factors in the figure in descending order of sensitivity, the sensitivity levels of each node can be quantified, as shown in Table 2.
Through in-depth analysis of roof accident sensitivity results, poor quality support materials, short length of service, and insufficient support materials are identified as the key factors influencing accidents. Therefore, daily operation must be attached to the selection and quality control of support materials to ensure that the support equipment can meet the bearing requirements under geological conditions. In addition, a sound support operation regulation should be established, and the support operation standards should be strictly implemented. The implementation of such targeted prevention and control strategies can effectively reduce the risk of roof accidents.
3. Results
3.1. Experimental Analysis and Evaluation
3.1.1. Comparative Analysis of Model
To further evaluate the performance of the model, this study employs the leave-one-out cross-validation method to test the effectiveness of the Bayesian network model. Additionally, two commonly used machine learning models, namely Random Forest and Binary Logistic Regression, are selected as comparison benchmarks to further verify the superiority of the proposed model.
In the validation process, all models are experimented on the same dataset. This dataset is derived from 100 investigation reports of roof accidents. After feature processing, it forms an accident-causing matrix with five dimensions, and is divided into a training set and a test set in an 8:2 ratio. The training set is used for parameter learning of the model, and the test set is used for the final model evaluation. In the model validation stage, the GeNIe software is used to implement cross-validation of the Bayesian network. By loading the trained network structure, the test set is imported into the model to complete node matching, and the "Leave One Out" method is adopted to calculate the prediction accuracy of each node. For the Random Forest and Logistic Regression models, the leave-one-out cross-validation method is also used, and model training and accuracy evaluation are implemented based on the Scikit-learn library in Python. Among them, the number of decision trees in the Random Forest is set to 100, and the Logistic Regression adopts L2 regularization (C=1.0). The comparison results of each node are shown in Figure 5.
From the cross-validation results, it can be seen that the average prediction accuracy of the Bayesian network model constructed in this study for all nodes reaches 0.792, while the average prediction accuracies of the random forest model and the logistic regression model are 0.706 and 0.717 respectively, both of which are lower than that of the Bayesian network model. Therefore, it can be indicated that this accident causation model has good prediction performance.
It is precisely this structural characteristic that enables the model to exhibit more excellent modeling and reasoning capabilities when dealing with problems involving complex causal relationships such as roof accident causes.
3.1.2. Validation with Real Cases
To further test the effectiveness of the model in practical applications, the study selected 10 roof accident cases that did not participate in model training as validation cases to conduct an in-depth research on the model's validity. The specific experimental steps are as follows: after obtaining these 10 roof accident cases, the causes of the accidents are characterized, that is, constructed into an accident cause matrix, and the observed states of the root nodes are input. Taking the "11.10" major roof accident in Houzitian Coal Mine, Liuzhi Special Zone, Liupanshui, Guizhou as an example, the causes of the accident are roughly as follows: failure to formulate safety technical measures for maintenance, weak risk prediction awareness, inadequate safety management, failure to strictly implement the system of tapping the roof and ribs to check for loose rocks, working under an unsupported roof, inadequate safety technical measures, chaotic management and blind command, poor quality of shed supports, inadequate supervision and inspection by the mine's operational departments and safety supervision department, and failure to strengthen roof management. Taking the "management system" dimension in the accident cause matrix as an example for characterization: since no maintenance safety technical measures were formulated for the accident, the probability of the "NO" state of the corresponding node A2 was set to 100%; due to problems such as chaotic management, it was determined that no professional management personnel were allocated, so the probability of the "NO" state of node A3 was set to 100%. For the remaining nodes in the management system dimension, their state input was completed based on the above cause analysis, and the probability distribution of this dimension could be obtained. Subsequently, following the same method, the characterization results of the other four dimensions—human factors, material factors, individual capabilities, and safety culture—were input into the model, generating the corresponding dimension probability distribution diagram as shown in Figure 6. After the model calculation, the occurrence probability of this accident was finally determined to be 94.3%.
The corresponding accident occurrence rates for the remaining 9 accidents can be obtained using the above method, as shown in Table 4: Verification Results of Roof Accident Data.
| Case name | Occurrence probability of accident node |
| "11·1" Roof Accident at Hanjiashan Coal Mine | 90.8% |
| "8·8" Roof Accident at Suitan'yan Coal Mine | 92.5% |
| "8·24" Roof Accident at Shichating Well | 95.2% |
| "4·7" Roof Accident at Baiping Coal Mine | 96.4% |
| "9·16" Roof Accident at Cizhulin Coal Mine | 94.6% |
| "4·27" General Roof Accident at Fugu Guoneng Coal Mine | 96.8% |
| "3·26" Roof Accident at Guojiawan Coal Mine | 87.9% |
| "10·15" Major Roof Accident at Fusheng Coal Mine | 96.1% |
| "7·4" General Roof Accident at Xingcheng Mine | 88.4% |
In the above model verification results, by inputting the observed values of the root nodes, the obtained occurrence probabilities of roof accidents are all above 85%. Therefore, the Bayesian network model for roof accidents constructed in this project is relatively effective.
4. Discussion
This study proposes a novel framework for analyzing the causes of roof accidents by integrating an accident causation matrix with a Bayesian network model. This framework effectively combines qualitative feature description with quantitative probabilistic reasoning, providing a systematic and dynamic analytical method for the prevention of coal mine roof accidents. The primary value of this research lies in overcoming the limitations of traditional static analysis methods, enabling a more comprehensive capture of the complex interactions among multidimensional factors such as human, material, management, individual capability, and safety culture. Through association rule mining and matrix construction, the study not only identifies key causal factors but also standardizes and visualizes accident characteristics, providing high-quality data input for parameter learning in the Bayesian network. The final Bayesian network model possesses bidirectional reasoning capabilities, enabling both forward reasoning to predict accident probabilities and backward reasoning to diagnose key causes, offering a scientific basis for coal mine enterprises to implement precise and proactive risk prevention and control.
From an empirical perspective, the model achieves an average prediction accuracy of 0.792, outperforming random forest and logistic regression models, indicating its superior modeling and reasoning capabilities when dealing with complex causal relationships. Sensitivity analysis further reveals that "poor support material quality," "short work experience," and "insufficient support materials" are the most sensitive factors affecting roof accidents, demonstrating the model's strong practical interpretability. Through back-testing with 10 real accident cases, the model calculated accident probabilities all exceeding 85%, further proving its effectiveness in practical applications.
Nevertheless, this study has certain limitations. First, the construction of the accident causation matrix relies on the analysis of historical accident report texts. Due to limitations in the completeness and standardization of report records, some potential factors may not be fully explored. Second, the setting of the minimum support threshold in the association rule algorithm involves a degree of subjectivity. Although it was experimentally adjusted to 0.2 to balance generality and rarity, it may still affect the extraction of key factors. Additionally, the EM algorithm used for Bayesian network parameter learning is sensitive to initial values, which may pose a risk of converging to local optima.
Future research can be expanded in the following directions: First, incorporating more real-time monitoring data (e.g., sensor data, underground video images) to enhance the model's real-time perception and early warning capabilities. Second, integrating deep learning techniques to improve the automatic analysis and feature extraction capabilities for unstructured text data. Third, extending the model's application scenarios to other types of coal mine accidents, such as gas outbursts and water hazards, to verify its generalizability and adaptability. Finally, developing a visualized decision support system integrated with this model could provide enterprises with an intuitive and user-friendly intelligent tool for safety management.
5. Conclusions
This study focuses on mine safety accidents and conducts research on methods for constructing accident matrices and Bayesian network models. Based on the data from 80 accident investigation reports, an accident causation matrix is innovatively constructed. Then, according to the conversion rules of the fault tree-Bayesian network model, it is transformed into a roof accident model with a Bayesian network structure, and parameter learning of the Bayesian network model is carried out through the accident causation matrix. Finally, real data are used to verify the effectiveness, advantages, and disadvantages of the Bayesian network model of the new causation analysis framework, and the following conclusions are drawn:
(1) The accident causation matrix effectively characterizes complex accident causes and enables their visualization. This matrix format not only clarifies the relationships among various factors but also provides precise input data for the construction of the Bayesian network model, thereby achieving seamless integration from accident feature description to model construction. Furthermore, by quantifying and standardizing key information from accident reports, the accident causation matrix offers a scientific basis for coal mine enterprises to identify potential risk factors in advance and formulate preventive measures. This significantly enhances the efficiency and accuracy of accident analysis.
(2) Leveraging the reverse reasoning capability of the Bayesian network, dynamic diagnosis of accident causation has been achieved. By inputting observed evidence to update the model, key factors contributing to accidents can be systematically identified. This method can be further enhanced by integrating additional scenario data and expert knowledge, optimizing the model's accuracy and adaptability. This enables dynamic and refined analysis of accident causation, providing enterprises with more efficient and precise accident prevention and decision-making support.
Author Contributions
The specific contributions of each author are as follows: methodology, Qingxin Xia, Yiyang Tan and Minghang Yu; software tools, Yiyang Tan; validation, Qingxin Xia and Yiyang Tan; investigation, Yunlei Zhang and Hui Wang; resources, Gang Cheng; data curation, Hui Wang and Minghang Yu; writ-ing—original draft preparation, Qingxin Xia and Yiyang Tan; writing—review and editing, Gang Cheng and Liqin Tian; All authors have read and agreed to the published version of the manuscript.
Funding
This research was funded by the National Natural Science Foundation of China (42377200); the Natural Science Foundation of Hebei Province, China (D2025508013); the National Key Research and Development Program of China (2024YFC3016801); the basic science and technology business of central institutions of higher learning (NCIST funding) (3142020018, 3142023032) and the Hebei IoT Monitoring Engineering Technology Innovation Center (21567693H).
Data Availability Statement
Not applicable.
Acknowledgments
The authors would like to thank Yuyang Wang, Guanghui Wang and Yue Qu for their assistance in de-signing the research plan and data preparation.
Conflicts of Interest
The authors declare no conflicts of interest.
Abbreviations
The following abbreviations are used in this manuscript:
| BN | Bayesian network |
| DAG | Directed Acyclic Graph |
| CPT | Conditional Probability Table |
| FT-BN | Fault Tree - Bayesian Network Conversion |
Appendix A
This appendix provides definitions and value descriptions for the states of each factor in the accident causation matrix constructed in the paper. The table systematically outlines the discretized state classification criteria for specific factors across five dimensions (human factors, physical factors, individual capability, management system, and safety culture), including key indicators such as age, work experience, quality of support materials, safety awareness status, and completeness of management systems. The state values of each factor serve as standardized input data for parameter learning in the Bayesian network, forming a critical foundation for transitioning from qualitative causation analysis to quantitative probabilistic reasoning.
Table A1.
Indicators of each factor.
| P (Human factors) | p1 (Age) | Young Adult (18-35) | O (Physical factors) |
o1 (Whether support materials are sufficient) |
YES |
| Adult (36-45) | NO | ||||
| Middle Adult (46-55) | o2(Quality of support materials) |
YES | |||
| p2(Work seniority / year) | Junior(0-5) | NO | |||
| Intermediate (6-15) | o3 (Condition of roadway cross-section) | YES | |||
| Senior(16 and above) | NO | ||||
| p3 (Training) | YES | o4 (Quality of canopy frame) | Excellent | ||
| NO | Good | ||||
| p4 (Health condition) | Excellent | Poor | |||
| Poor | o5(Insulation measures for masonry arch) | YES | |||
| P5 (Skill proficiency) | Excellent | NO | |||
| Good | |||||
| Poor | |||||
| A (Individual ability) |
a1 Whether there is a scientific support design | YES | M (Management system) | m1 Whether management personnel are sufficient | Yes |
| NO | No | ||||
| a2 Whether the support is comprehensive &standardized |
YES | m2 Whether training is in place | Yes | ||
| NO | No | ||||
| a3 Whether the support is timely | YES | m3 Whether safety inspections are in good condition | Yes | ||
| NO | No | ||||
| a4 Whether there is a designated person in command | YES | m4 Whether the production responsibility system is implemented | Yes | ||
| NO | No | ||||
| a5 Safety awareness status | Excellent | m5 Whether safety technical measures are in place | Yes | ||
| Good | No | ||||
| Poor | |||||
| C(Safety culture) | c1 Whether prevention is emphasized |
Yes | C(Safety culture) |
c4 Whether safety education is emphasized | Yes |
| No | No | ||||
| c2 Whether safety is emphasized | Yes | c5 Whether regular inspections &evaluations are conducted | Yes | ||
| No | No | ||||
| c3 Whether the safety system is sound | Yes | ||||
| No | |||||
References
- Li F, Duan B, Sun Y, et al. Quantitative risk assessment model of working positions for roof accidents in coal mine[J]. Safety Science 2024, 178, 106628. [Google Scholar] [CrossRef]
- Zhang Peisen, Zhang Xiaole, Dong Yuhang, et al. Analysis and prediction of coal mine accident laws in China from 2008 to 2021[J]. Mining Safety & Environmental Protection 2023, 50, 136–140. [Google Scholar]
- Baidu Wenku. Reflection on the "3.28" Roof Accident in Datong Coal Tashan Coal Mine. [EB/OL]. (2016-07-18) [2025-06-11]. https://wenku.baidu.com/view/f5eb90d8b90d6c85ed3ac6e1.html?wkts=1755610435938.
- Qiu Z, Liu Q, Li X, et al. Construction and analysis of a coal mine accident causation network based on text mining [J]. Process Safety and Environmental Protection 2021, 153, 320–328. [Google Scholar] [CrossRef]
- Heinrich H, W. Industrial Accident Prevention. A Scientific Approach [J]. 1941.
- Gordon J E. The epidemiology of accidents[J]. American journal of public health 1949, 39, 504–515. [Google Scholar] [CrossRef] [PubMed]
- Lehto M, Salvendy G. Models of accident causation and their application: Review and reappraisal[J]. Journal of Engineering and Technology Management 1991, 8, 173–205. [Google Scholar]
- Rasmussen, J. Risk management in a dynamic society: a modelling problem [J]. Safety science 1997, 27, 183–213. [Google Scholar] [CrossRef]
- Leveson, N. A new accident model for engineering safer systems [J]. Safety science 2004, 42, 237–270. [Google Scholar] [CrossRef]
- Hollnagel, E. FRAM: the functional resonance analysis method: modelling complex socio-technical systems [M]. Crc Press, 2017.
- De Vivo C, Ellena M, Barbato G, et al. A co-design matrix-based approach to evaluate the climate risks for airports: A case study of Bologna airport[J]. Climate Services 2025, 37, 100536. [Google Scholar] [CrossRef]
- Khalilzadeh, M.; Banihashemi, S.A.; Heidari, A.; Božanić, D.; Milić, A. Risk Analysis and Assessment of Water Supply Projects Using the Fuzzy DEMATEL-ANP and Artificial Neural Network Methods. Water 2025, 17, 1995. [Google Scholar] [CrossRef]
- Chen T T, Wang C H. Fall risk assessment of bridge construction using Bayesian network transferring from fault tree analysis[J]. Journal of Civil Engineering and Management 2017, 23, 273–282. [Google Scholar]
- Gheisari S, Meybodi M R. Bnc-pso: structure learning of bayesian networks by particle swarm optimization[J]. Information Sciences 2016, 348, 272–289. [Google Scholar] [CrossRef]
- Fang W, Zhang W, Ma L, et al. An efficient Bayesian network structure learning algorithm based on structural information[J]. Swarm and Evolutionary Computation 2023, 76, 101224. [Google Scholar] [CrossRef]
- He Yongchang, Chen Zhiguang, Wang Haifeng, et al. Research on Bayesian network model for missile fault diagnosis based on Netica[J]. Aero Weaponry 2020, 27, 89–95. [Google Scholar]
- Ibrahim H, Rao P. Fire risk analysis in FLNG processing facility using Bayesian network[J]. Journal of Engineering Science and Technology 2019, 14, 1497–1519. [Google Scholar]
- Zong S, Wang Z L, Liu K, et al. Risk assessment of general FPSO supply system based on hybrid fuzzy fault tree and Bayesian network[J]. Ocean Engineering 2024, 311, 118767. [Google Scholar] [CrossRef]
- Fan Z, Zhou L, Komolafe T E, et al. Learning bayesian network parameters from limited data by integrating entropy and monotonicity[J]. Knowledge-Based Systems 2024, 291, 111568. [Google Scholar] [CrossRef]
- Li Haitao, Jin Guang, Zhou Jinglun, et al. A review of Bayesian network inference algorithms[J]. Systems Engineering and Electronic 2008, 935–935.
- State Administration of Work Safety. <i>Coal Mine Safety Regulations</i>[J]. <i>Labour Protection</i> <b>2005</b>, 8. State Administration of Work Safety. Coal Mine Safety Regulations[J]. Labour Protection.
- Coal Mine Safety Network. Investigation Report on the "11·1" Roof Accident in Hanjiashan Coal Mine, Xinhua County[EB/OL].(2024-12-27)[2025-06-11].https://www.mkaq.org/html/2024/12/27/696971.shtml.
- Hunan Bureau of the National Mine Safety Administration. Investigation Report on the "8·8" Roof Accident in Suitanyan Coal Mine of Zhuzhou Fenglong Mining Co., Ltd.[EB/OL]. (2024-10-15)[2025-06-11].https://hun.chinamine-safety.gov.cn/zwgk/jczfxxgk/sgdcbb/202410/t20241015_504003.html.
- Hunan Bureau of the National Mine Safety Administration. Investigation Report on the "8·24" Roof Accident in Shichating Shaft of Hunan Zijiang Coal Industry Group Co., Ltd.[EB/OL].(2024-10-15)[2025-06-11].https://hun.chinamine-safety.gov.cn/zwgk/jczfxxgk/sgdcbb/202410/t20241015_504004.html.
- Guizhou Bureau of the National Mine Safety Administration. Investigation Report on the "4·7" Roof Accident in Baiping Mining Co., Ltd., Jinsha County, Bijie[EB/OL].(2023-08-04)[2025-06-11].https://gz.chinamine-safety.gov.cn/detail.html?id=1687455662059192321.
- Guizhou Bureau of the National Mine Safety Administration. "9·16" Roof Accident at Cizhulin Coal Mine, Maoba Town, Renhuai City, Guizhou Jinyongtai Mining Investment Co., Ltd.[EB/OL].(2023-04-12)[2025-06-11]. https://gz.chinamine-safety.gov.cn/detail.html?type=headlines&id=1646107722376183810.
- Shaanxi Bureau of the National Mine Safety Administration. "4·27" General Roof Accident in Shaanxi Fugu Guoneng Mining Co., Ltd.[EB/OL].(2023-08-07)[2025-06-11].https://shaanxi.chinamine-safety.gov.cn/main/397789491780862656.
- Coal Mine Safety Network. "3·26" Roof Accident in Guojiawan Coal Mine Branch of Guoneng Yulin Energy Co., Ltd.[EB/OL].(2023-6-27)[2025-06-11]. https://www.mkaq.org/html/2023/06/27/663535.shtml.
- National Mine Safety Administration. "10·15" Major Roof Accident in Mohong Fusheng Coal Mine Co., Ltd., Fuyuan County, Qujing City, Yunnan Province[EB/OL]. (2023-09-28)[2025-06-11]. https://www.chinamine-safety.gov.cn/zfxxgk/fdzdgknr/sgcc/sgalks/202309/t20230928_464574.shtml.
- Hebei Bureau of the National Mine Safety Administration. "7·4" General Roof Accident in Chengde County Xingcheng Mining Co., Ltd.[EB/OL].(2024-12-26)[2025-06-11].https://hb.chinamine-safety.gov.cn/system/2024/12/26/030323620.shtml.
Figure 1.
Modeling process of the accident causation matrix.
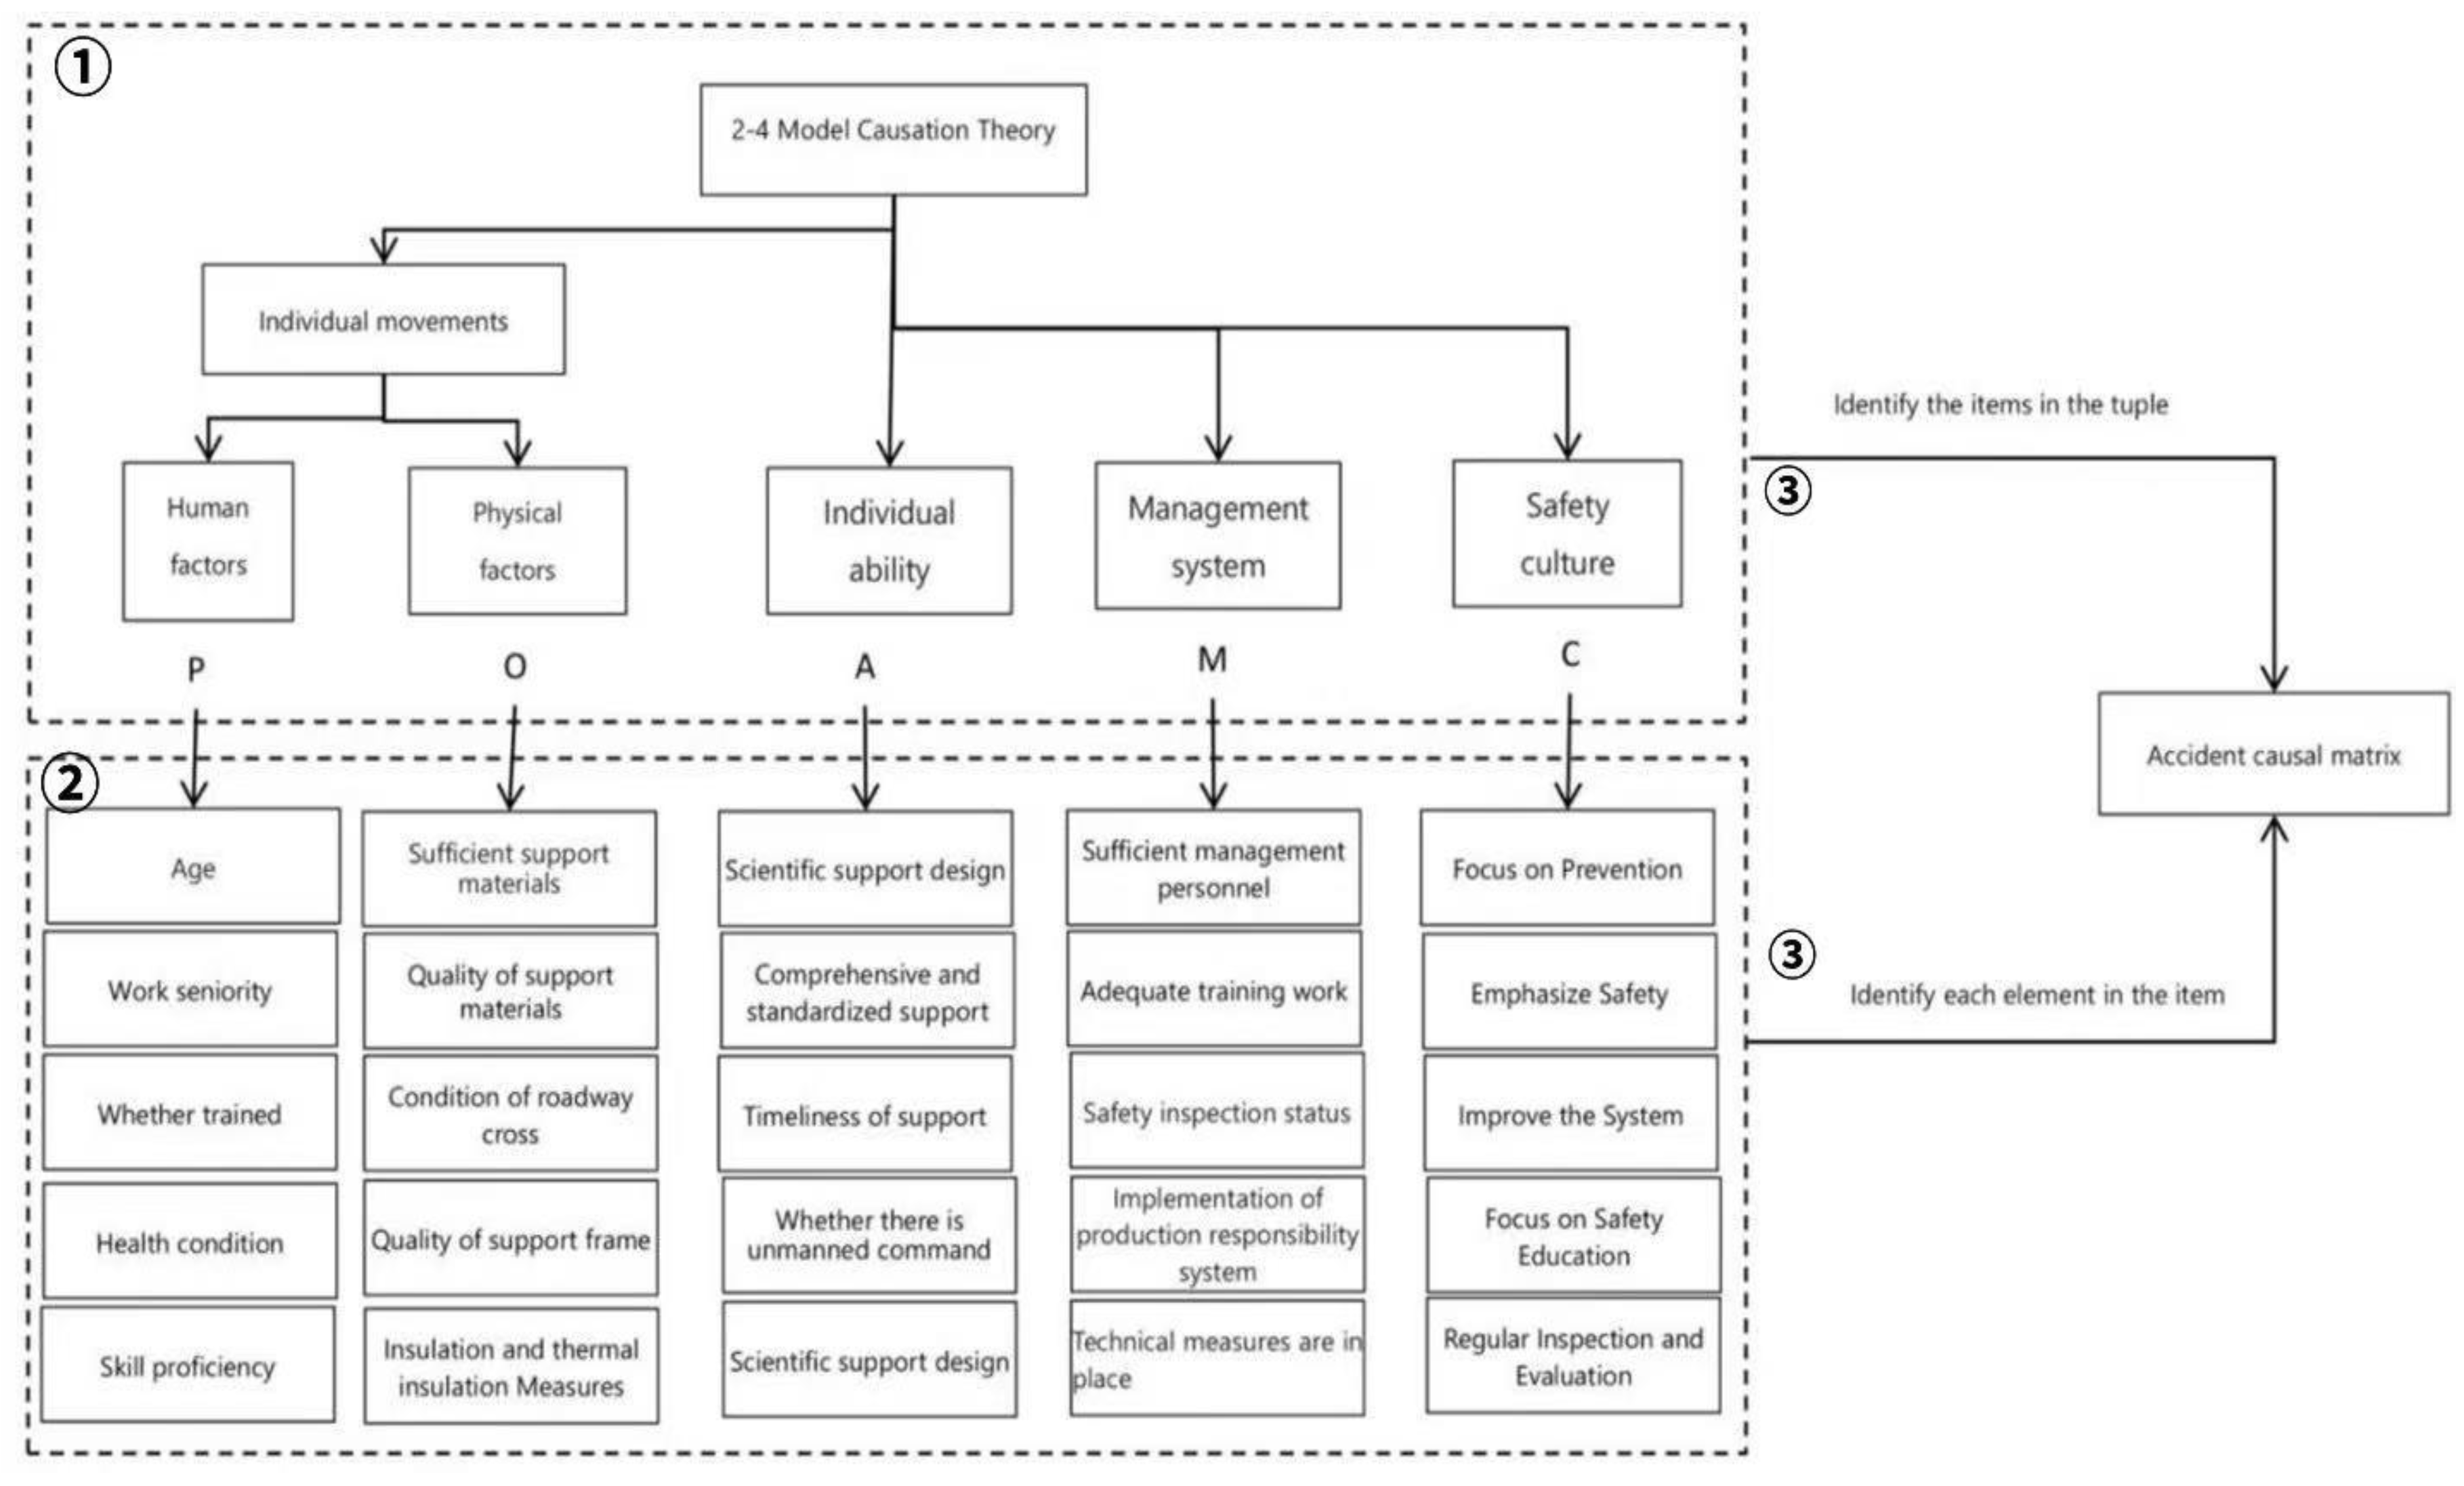
Figure 2.
Fault tree of each factor level for roof accidents.
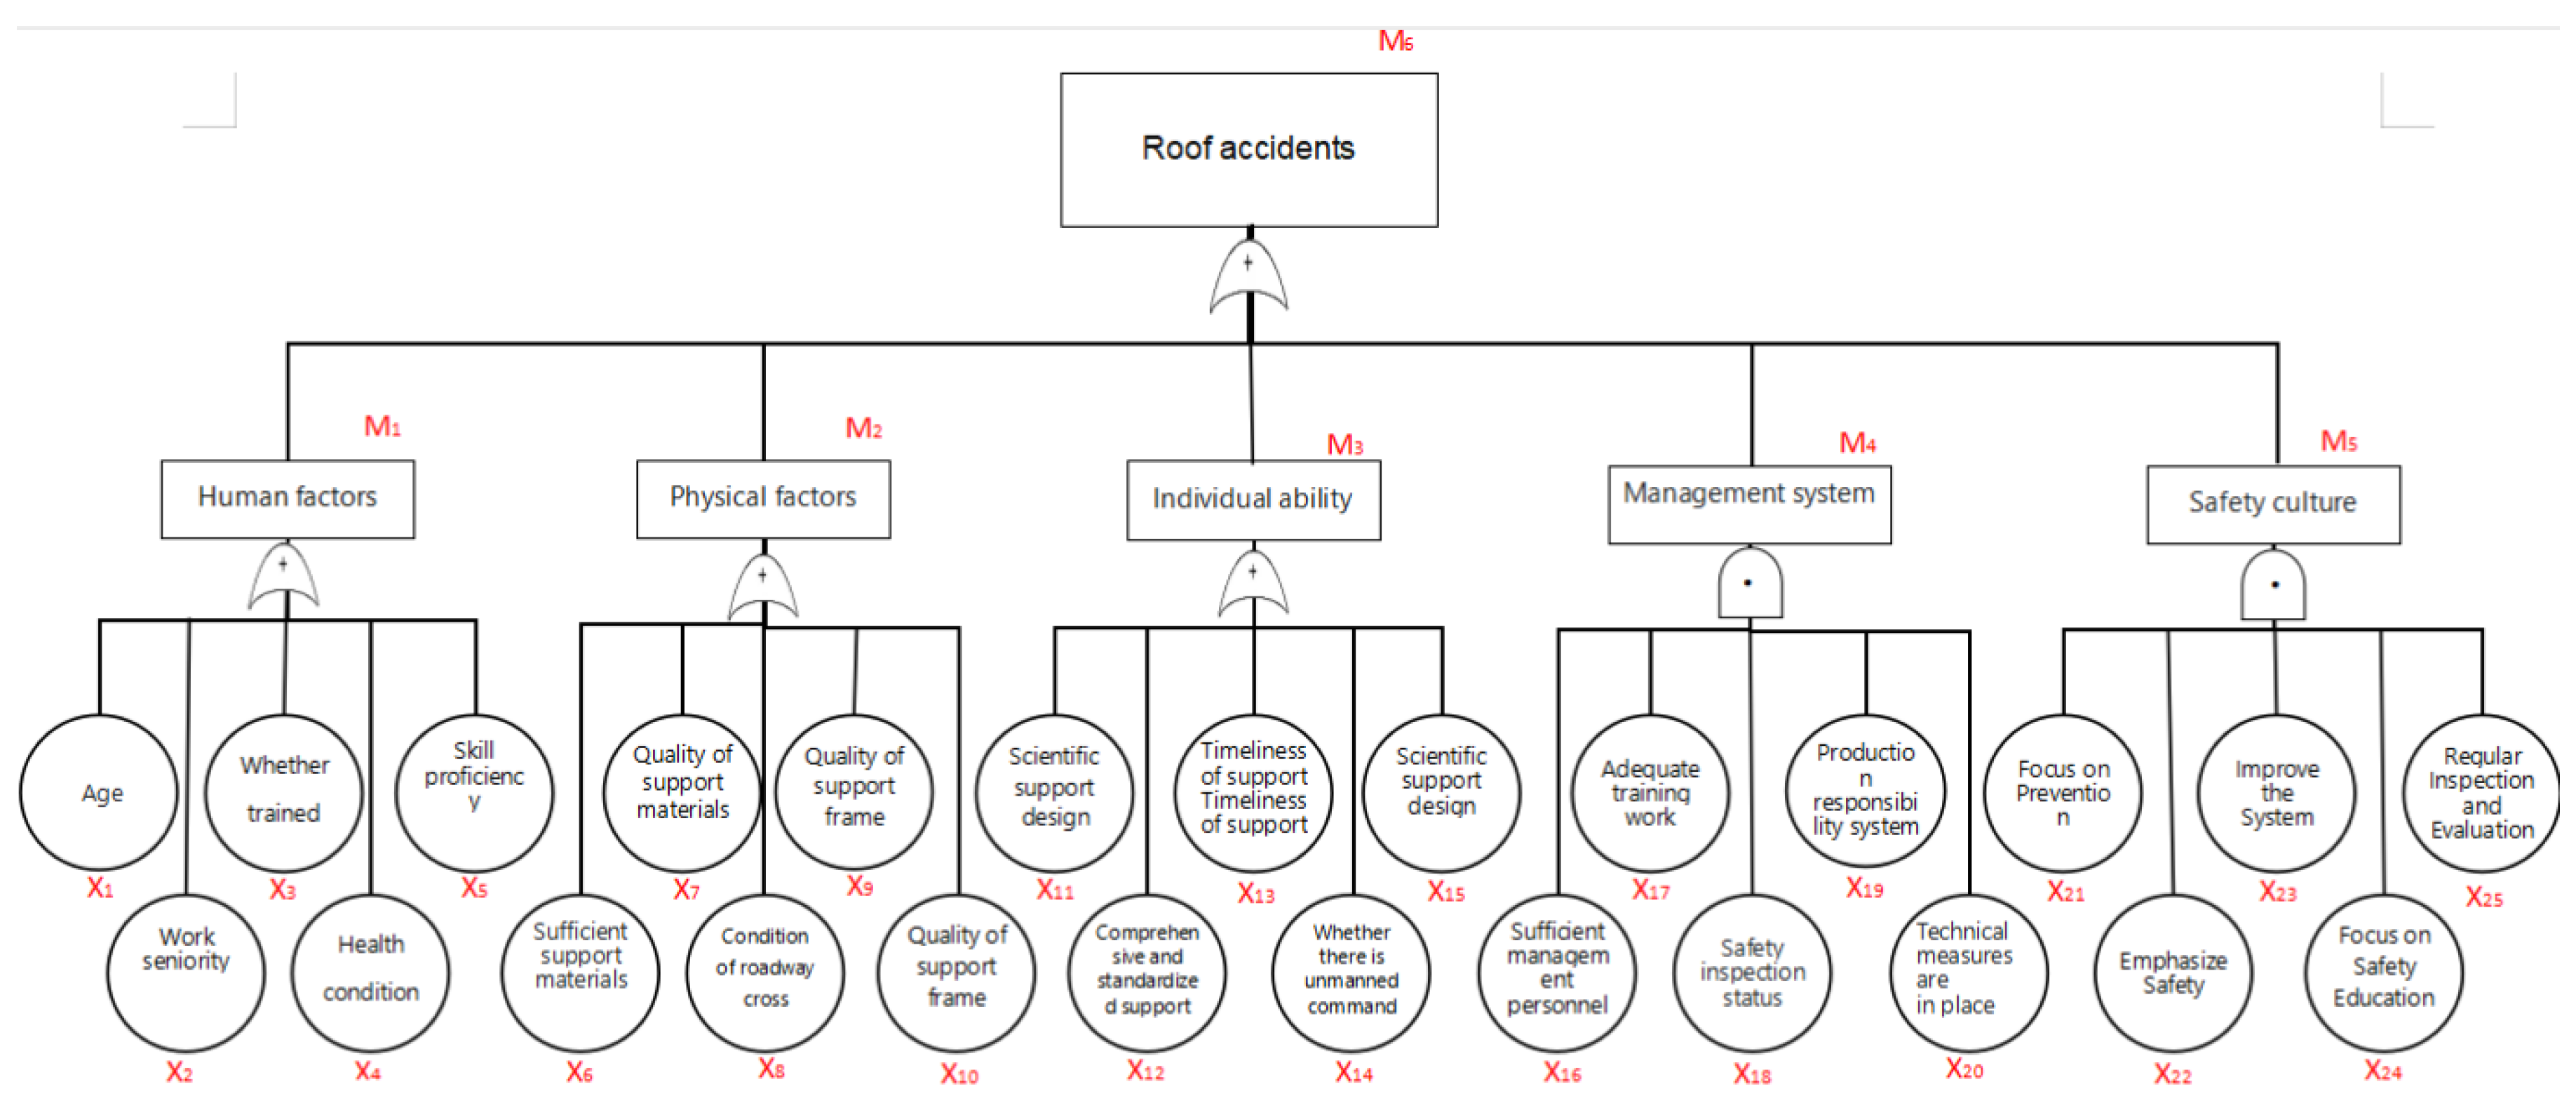
Figure 3.
Bayesian network model after sample training.
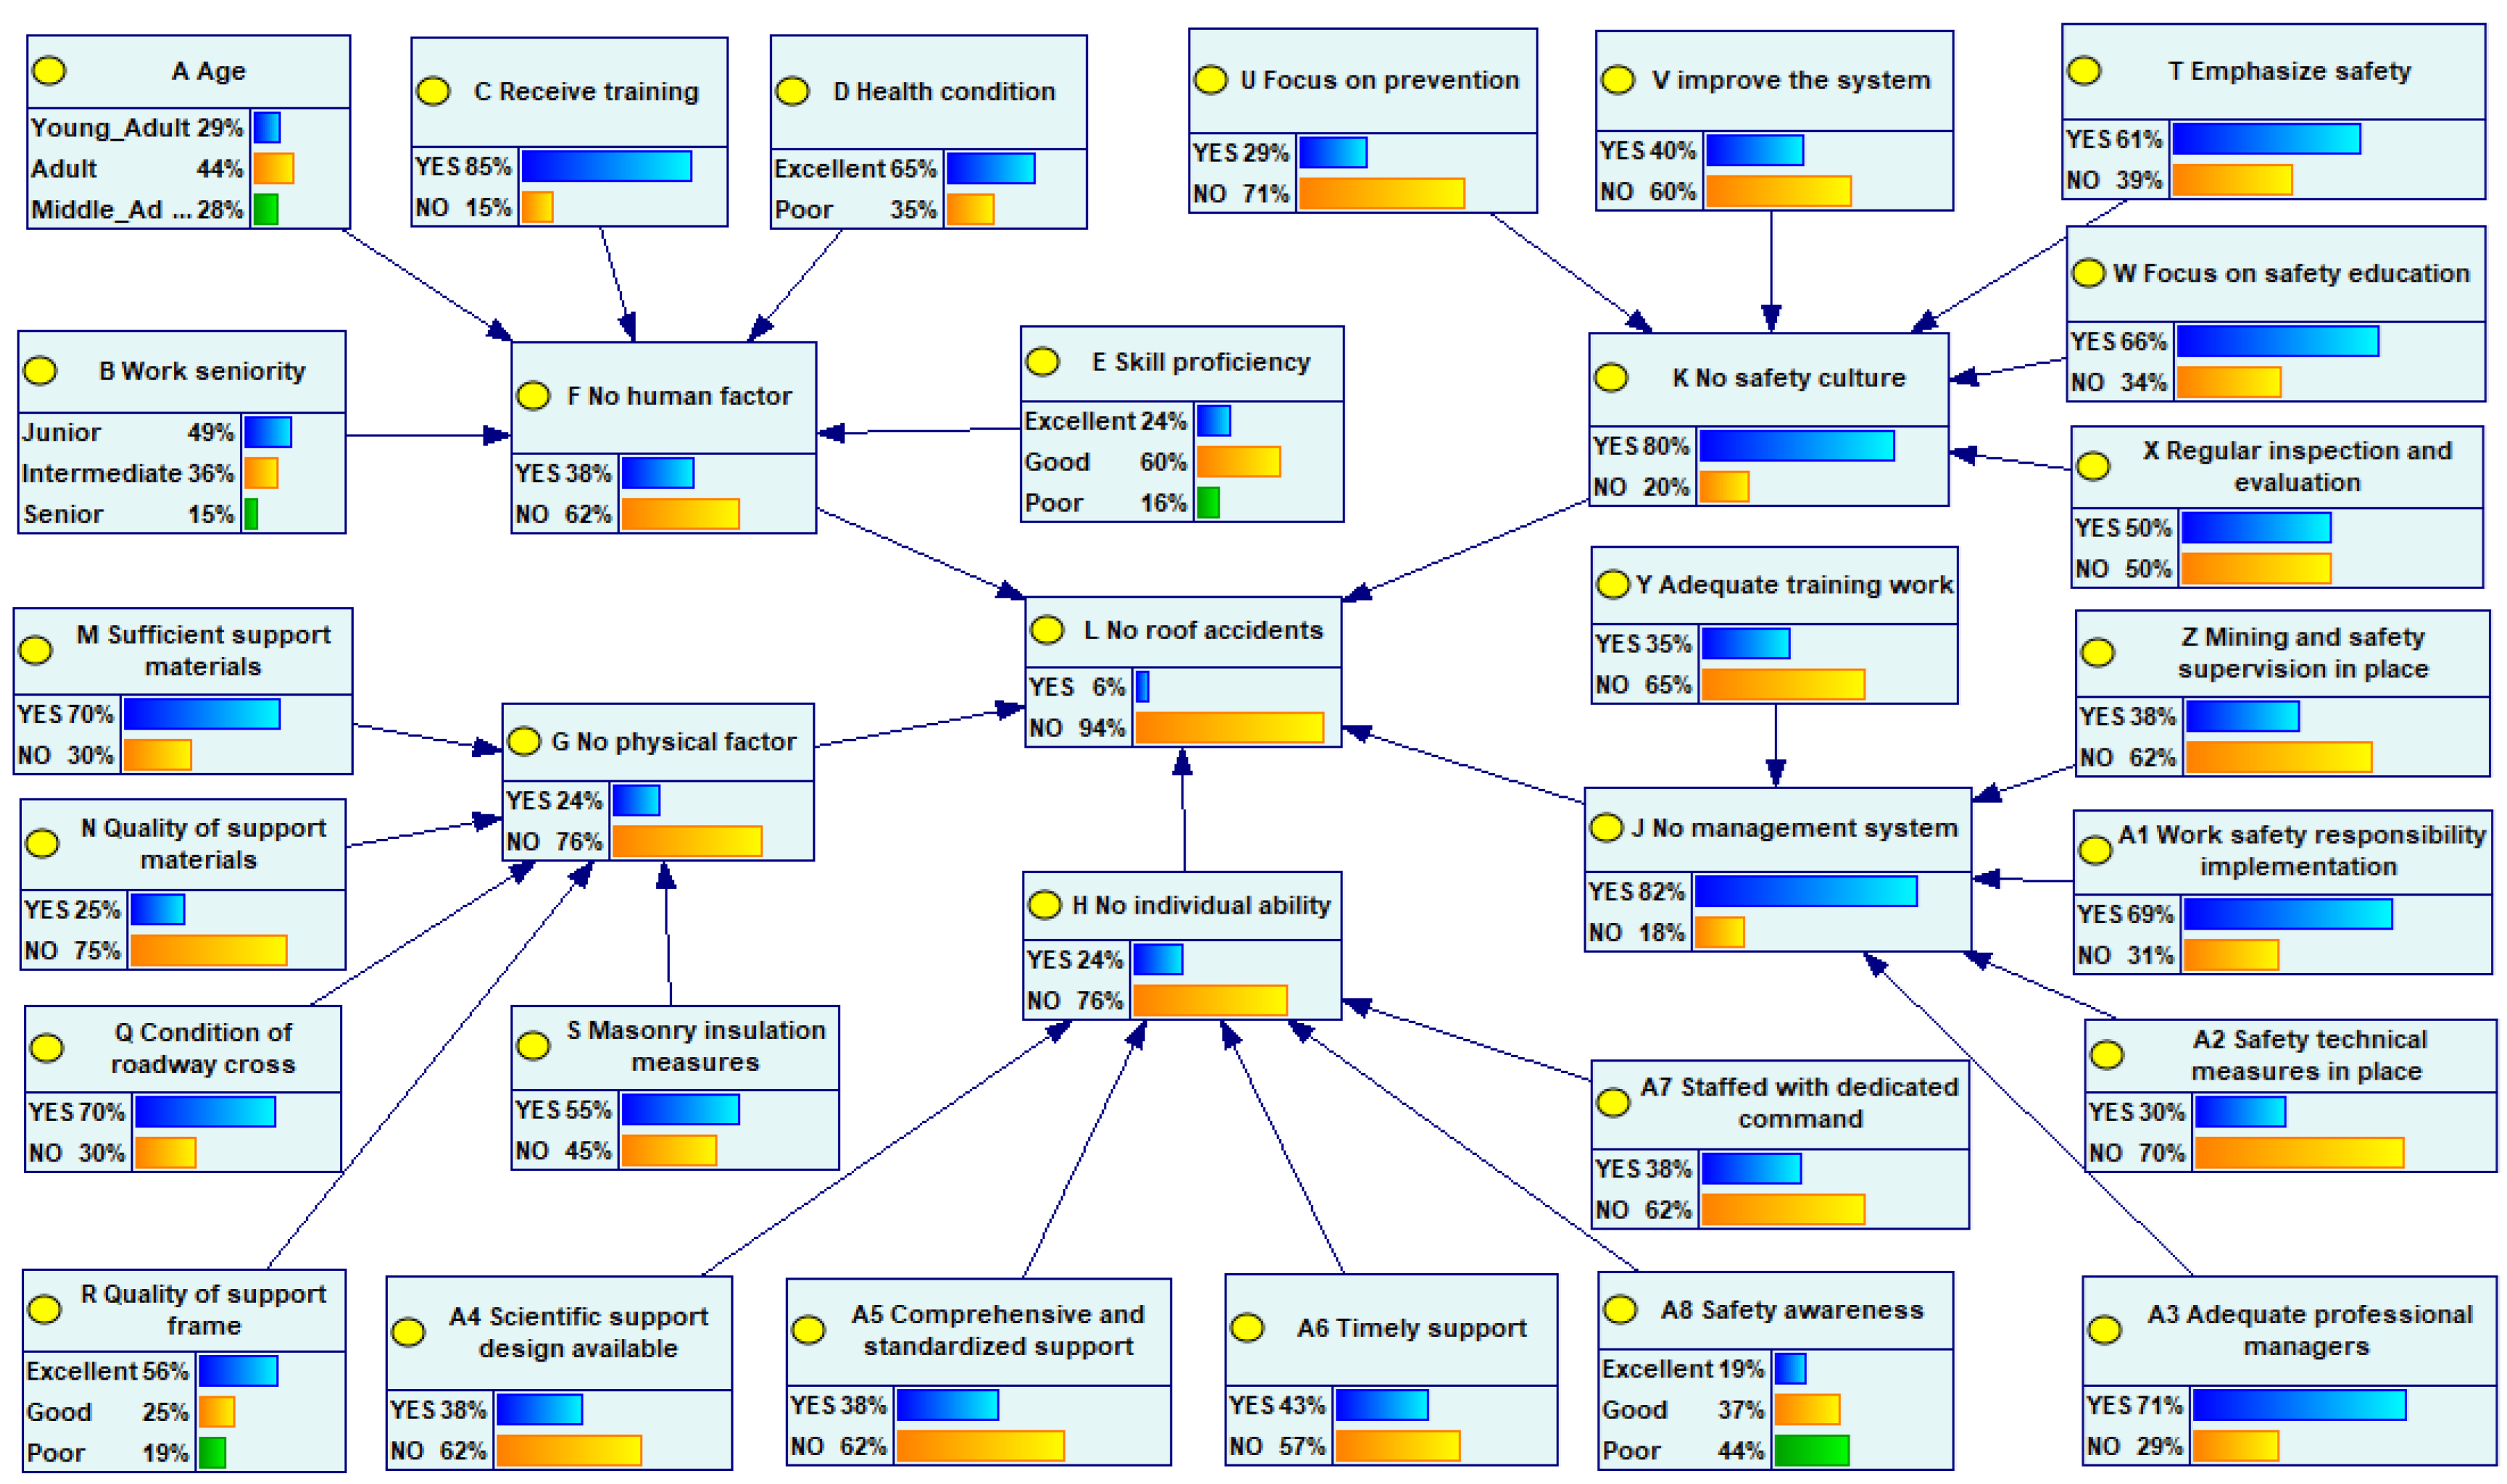
Figure 4.
Sensitivity analysis of node L.
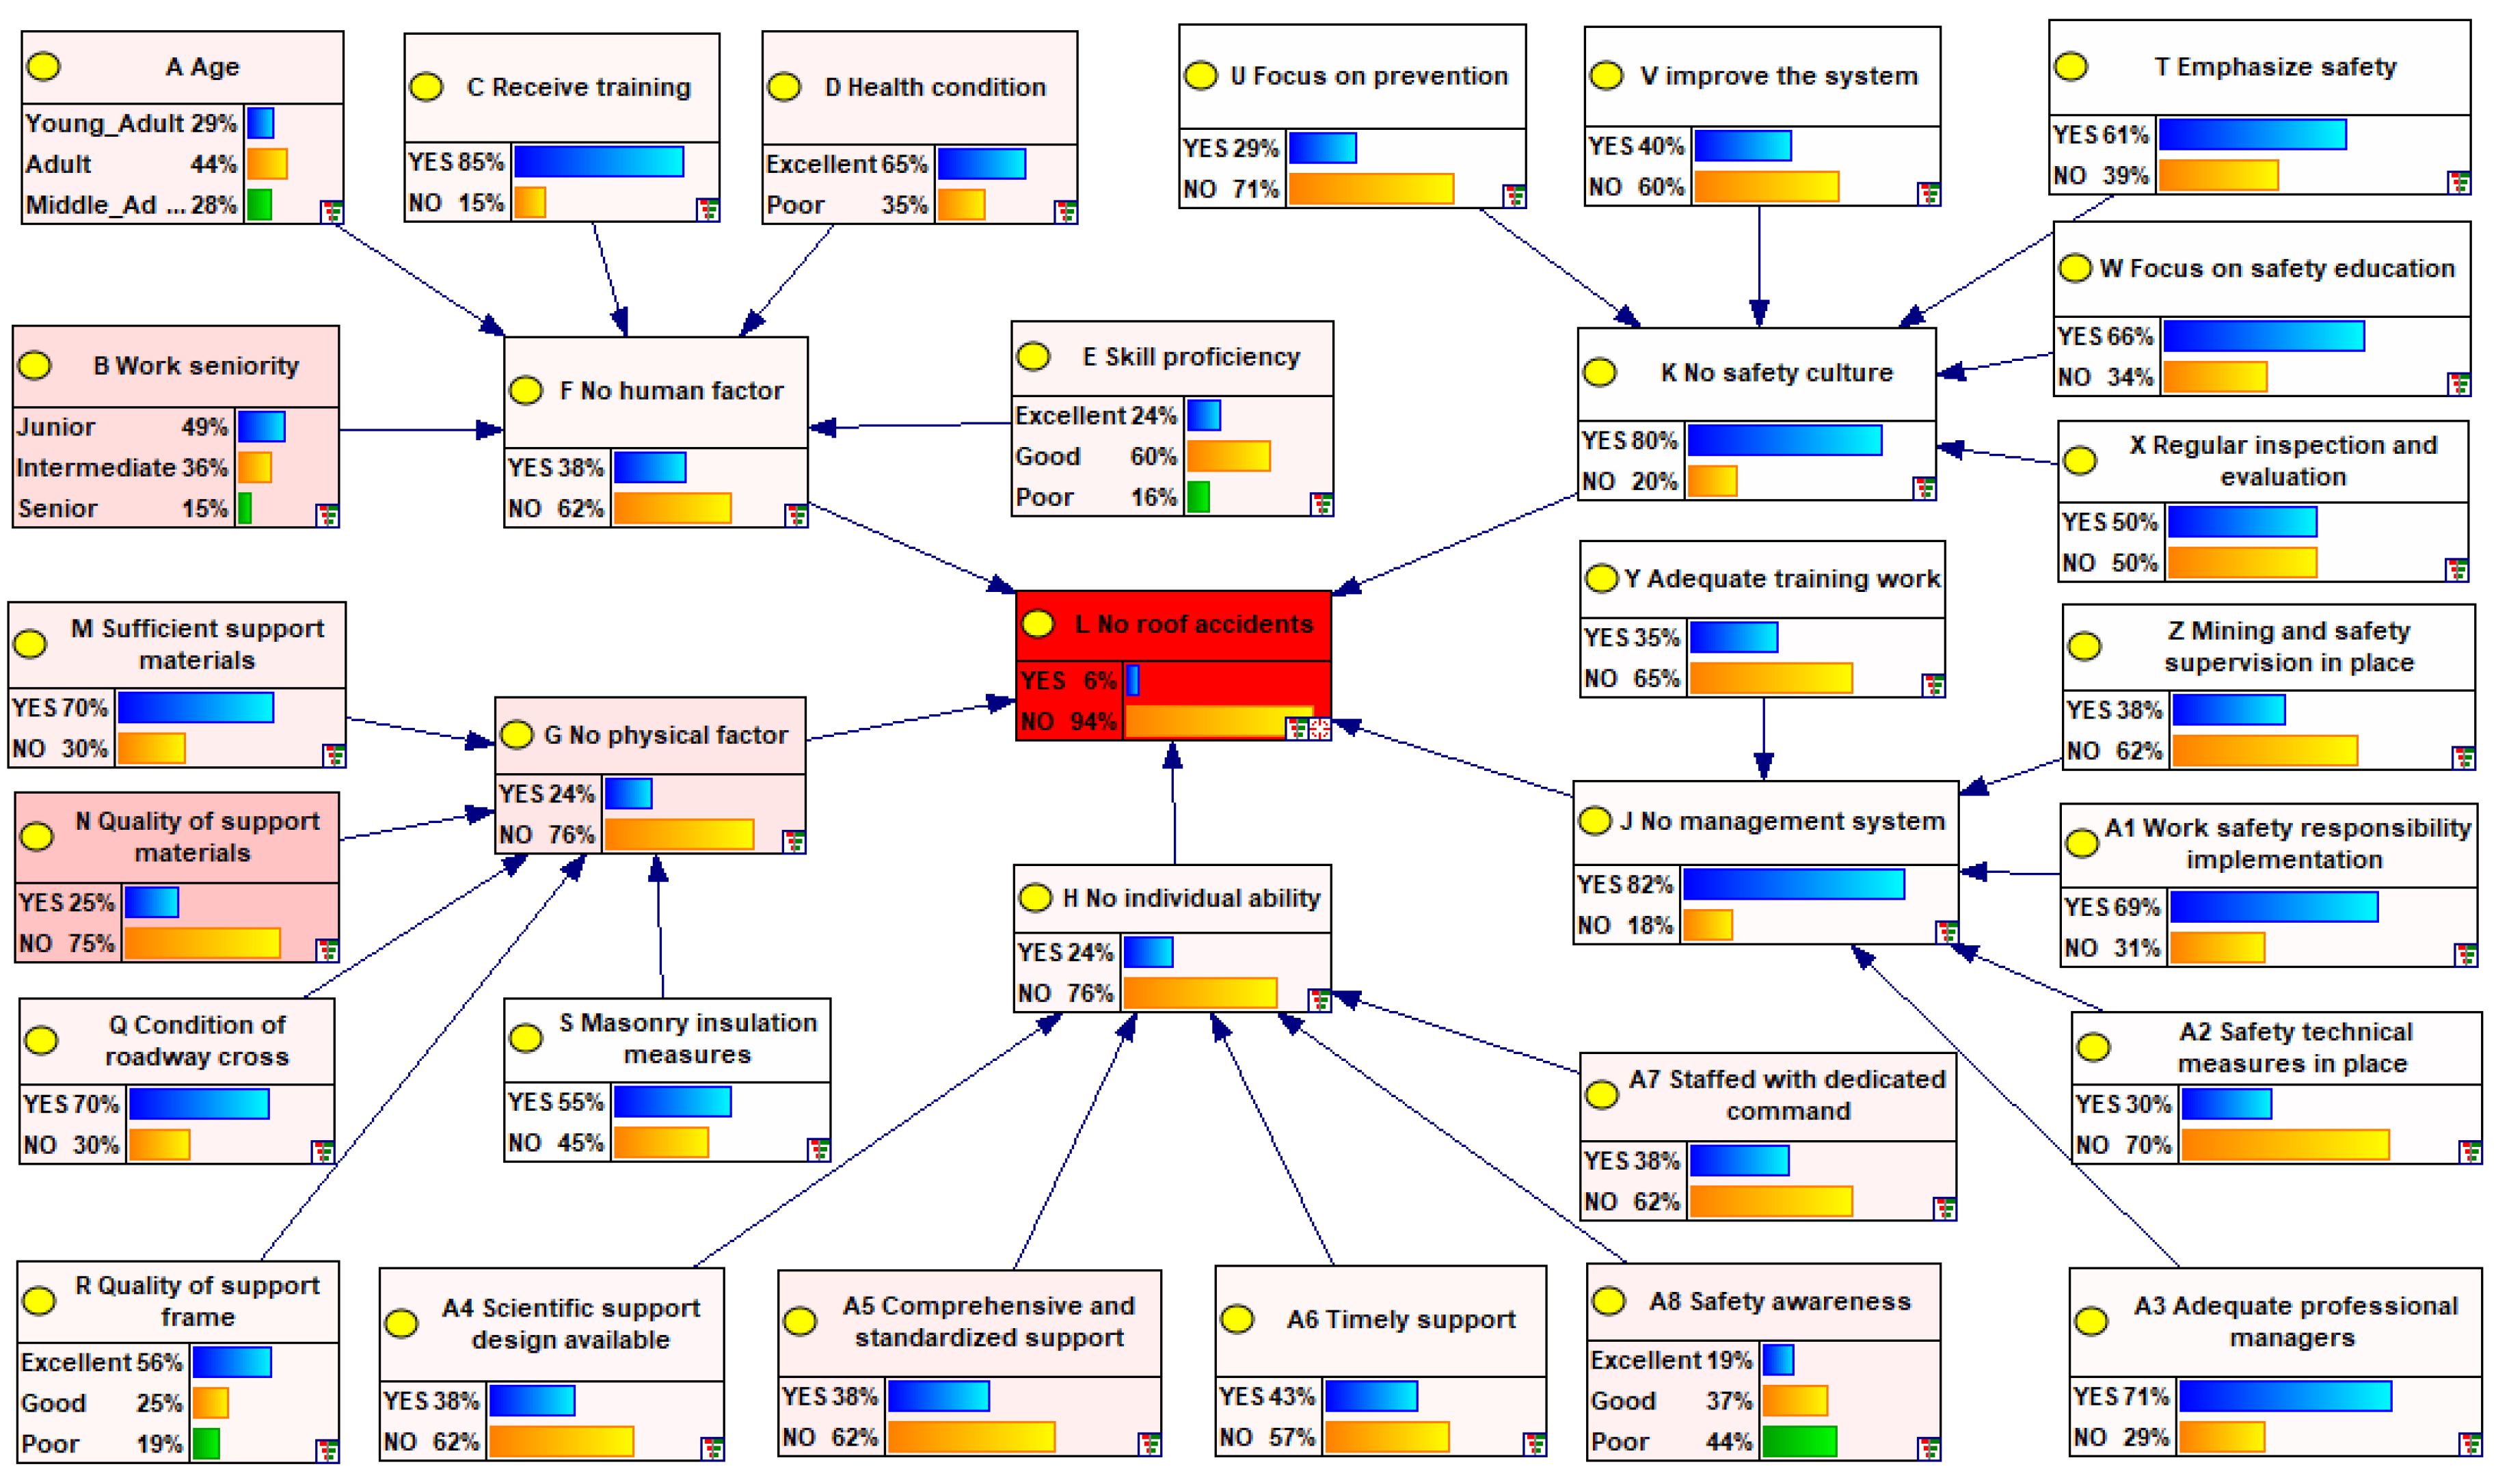
Figure 5.
Comparison of model prediction accuracy.
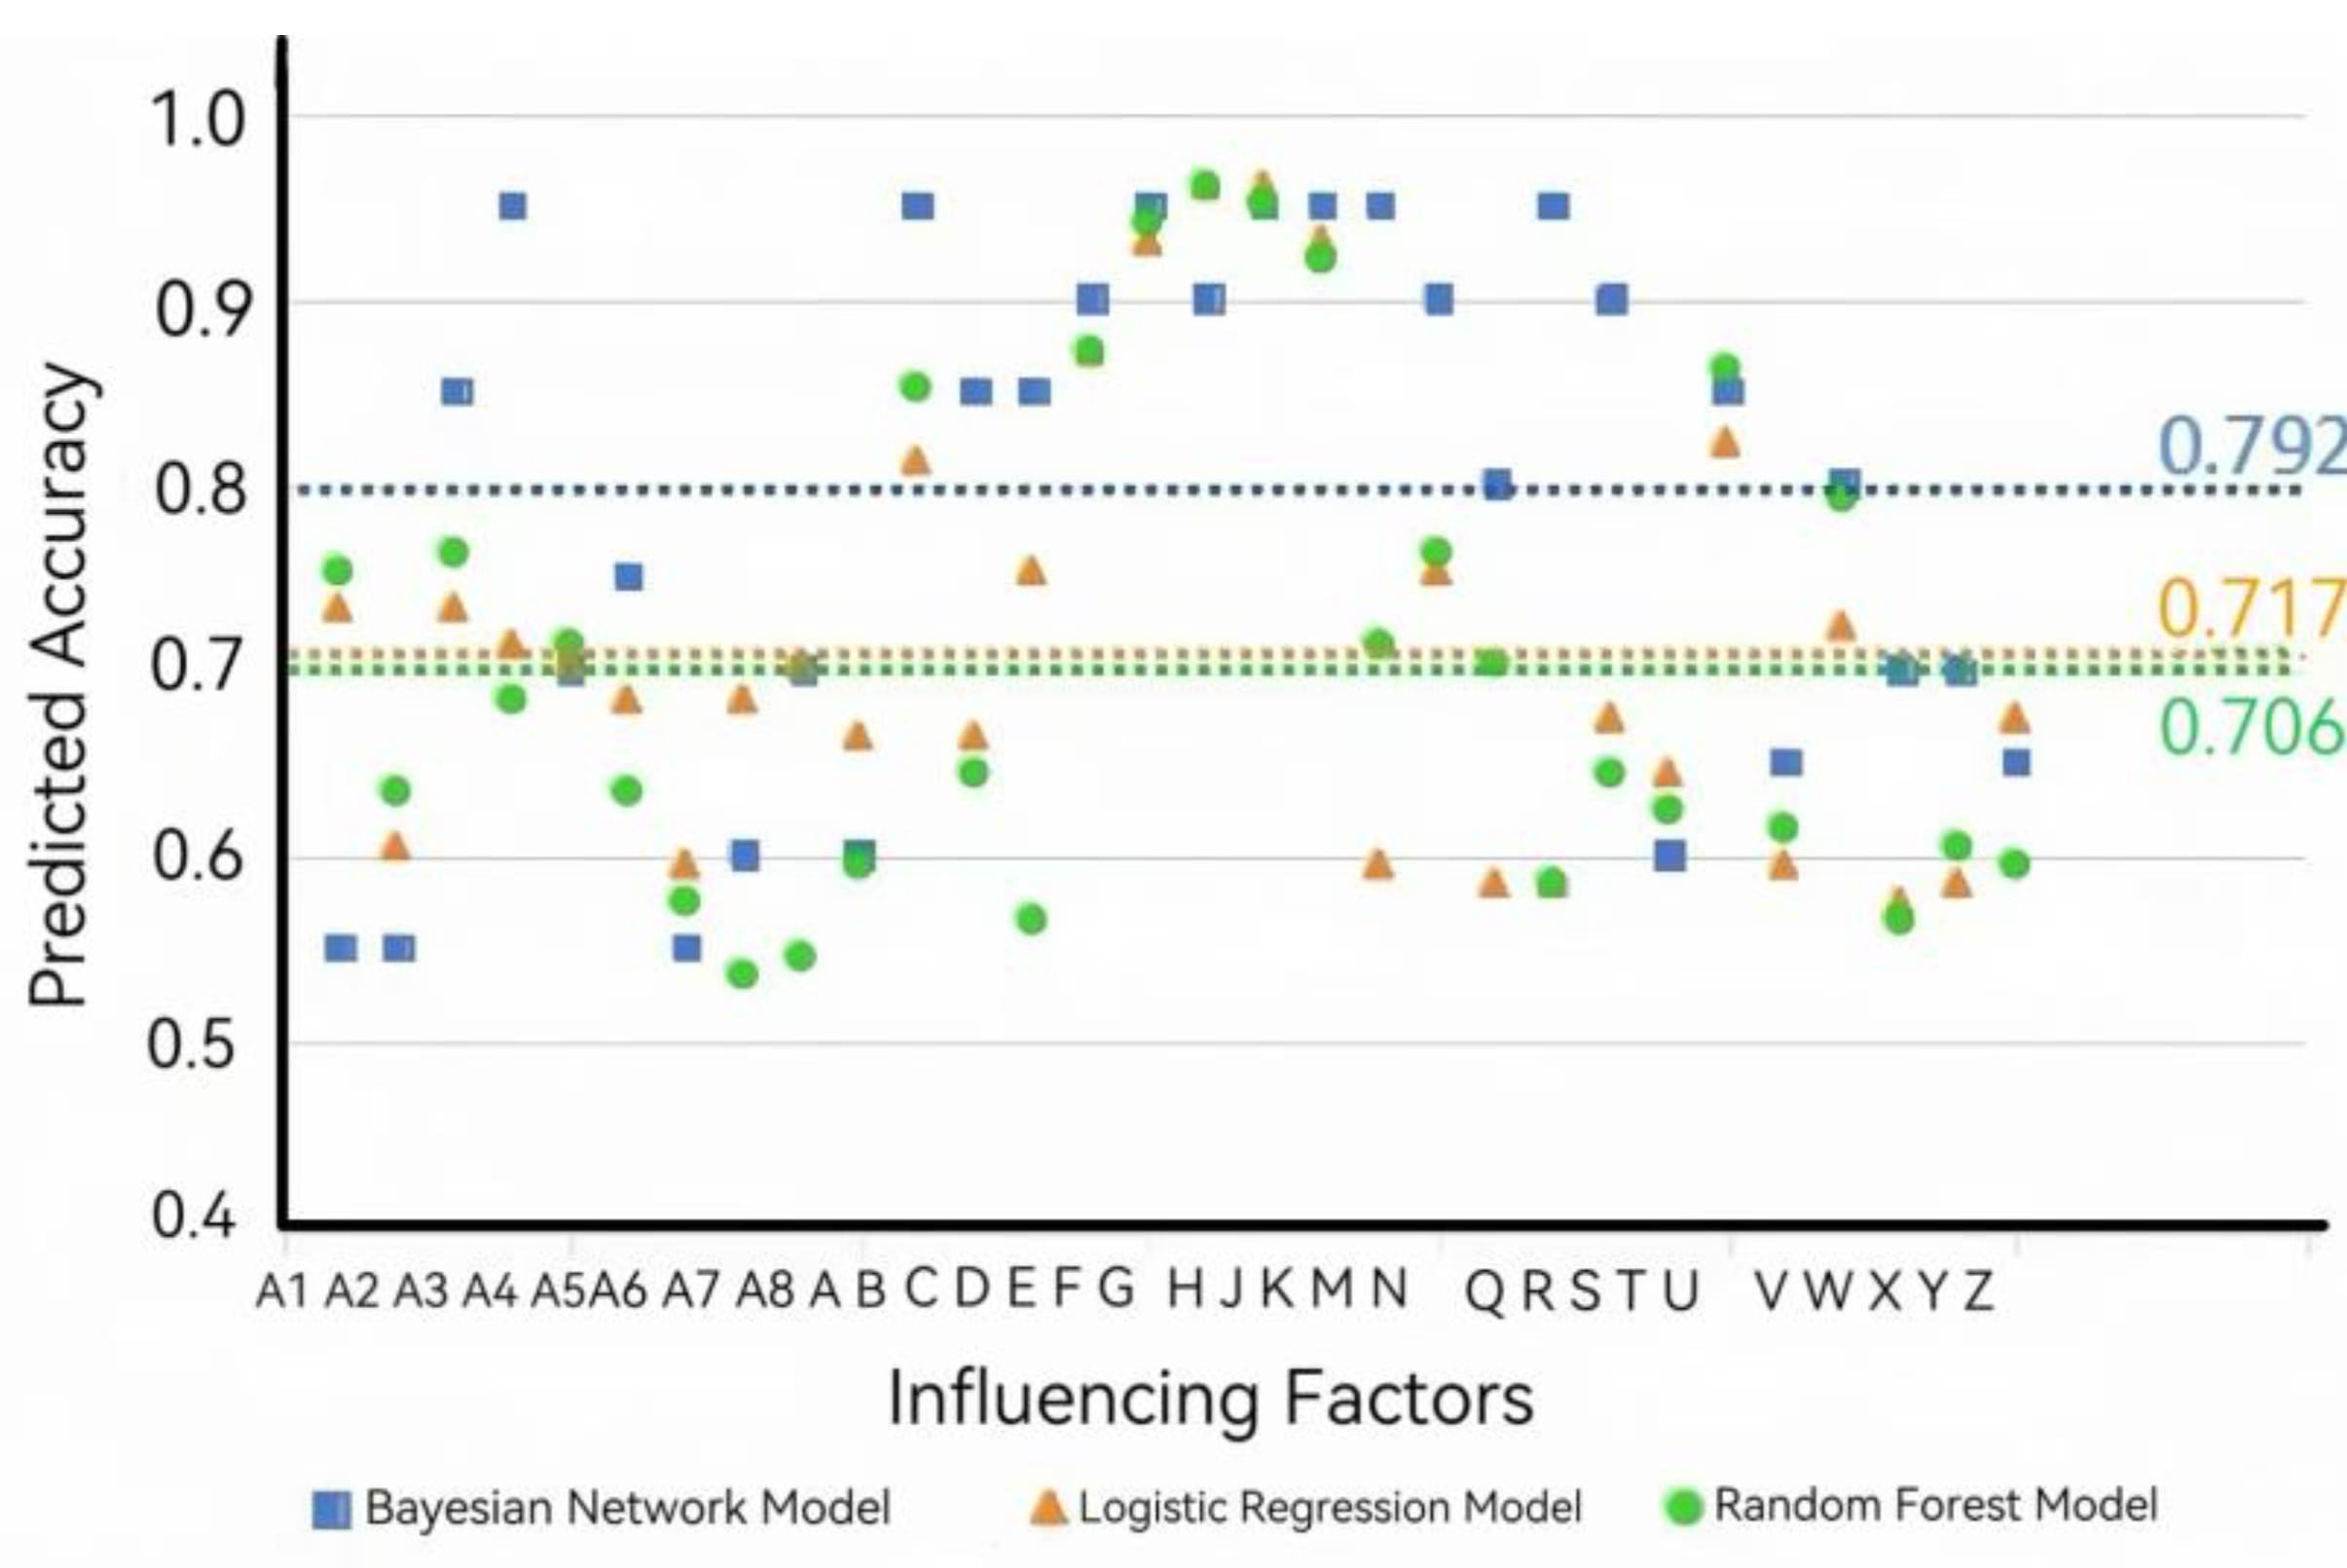
Figure 6.
Probability distribution of partial variables in the "11·10" roof accident: (a) Description of the probability distribution of each variable in the human factors dimension; (b)Description of the probability distribution of each variable in the safety culture dimension; (c)Description of the probability distribution of each variable in the material factors dimension; (d)Description of the probability distribution of each variable in the individual capability dimension.
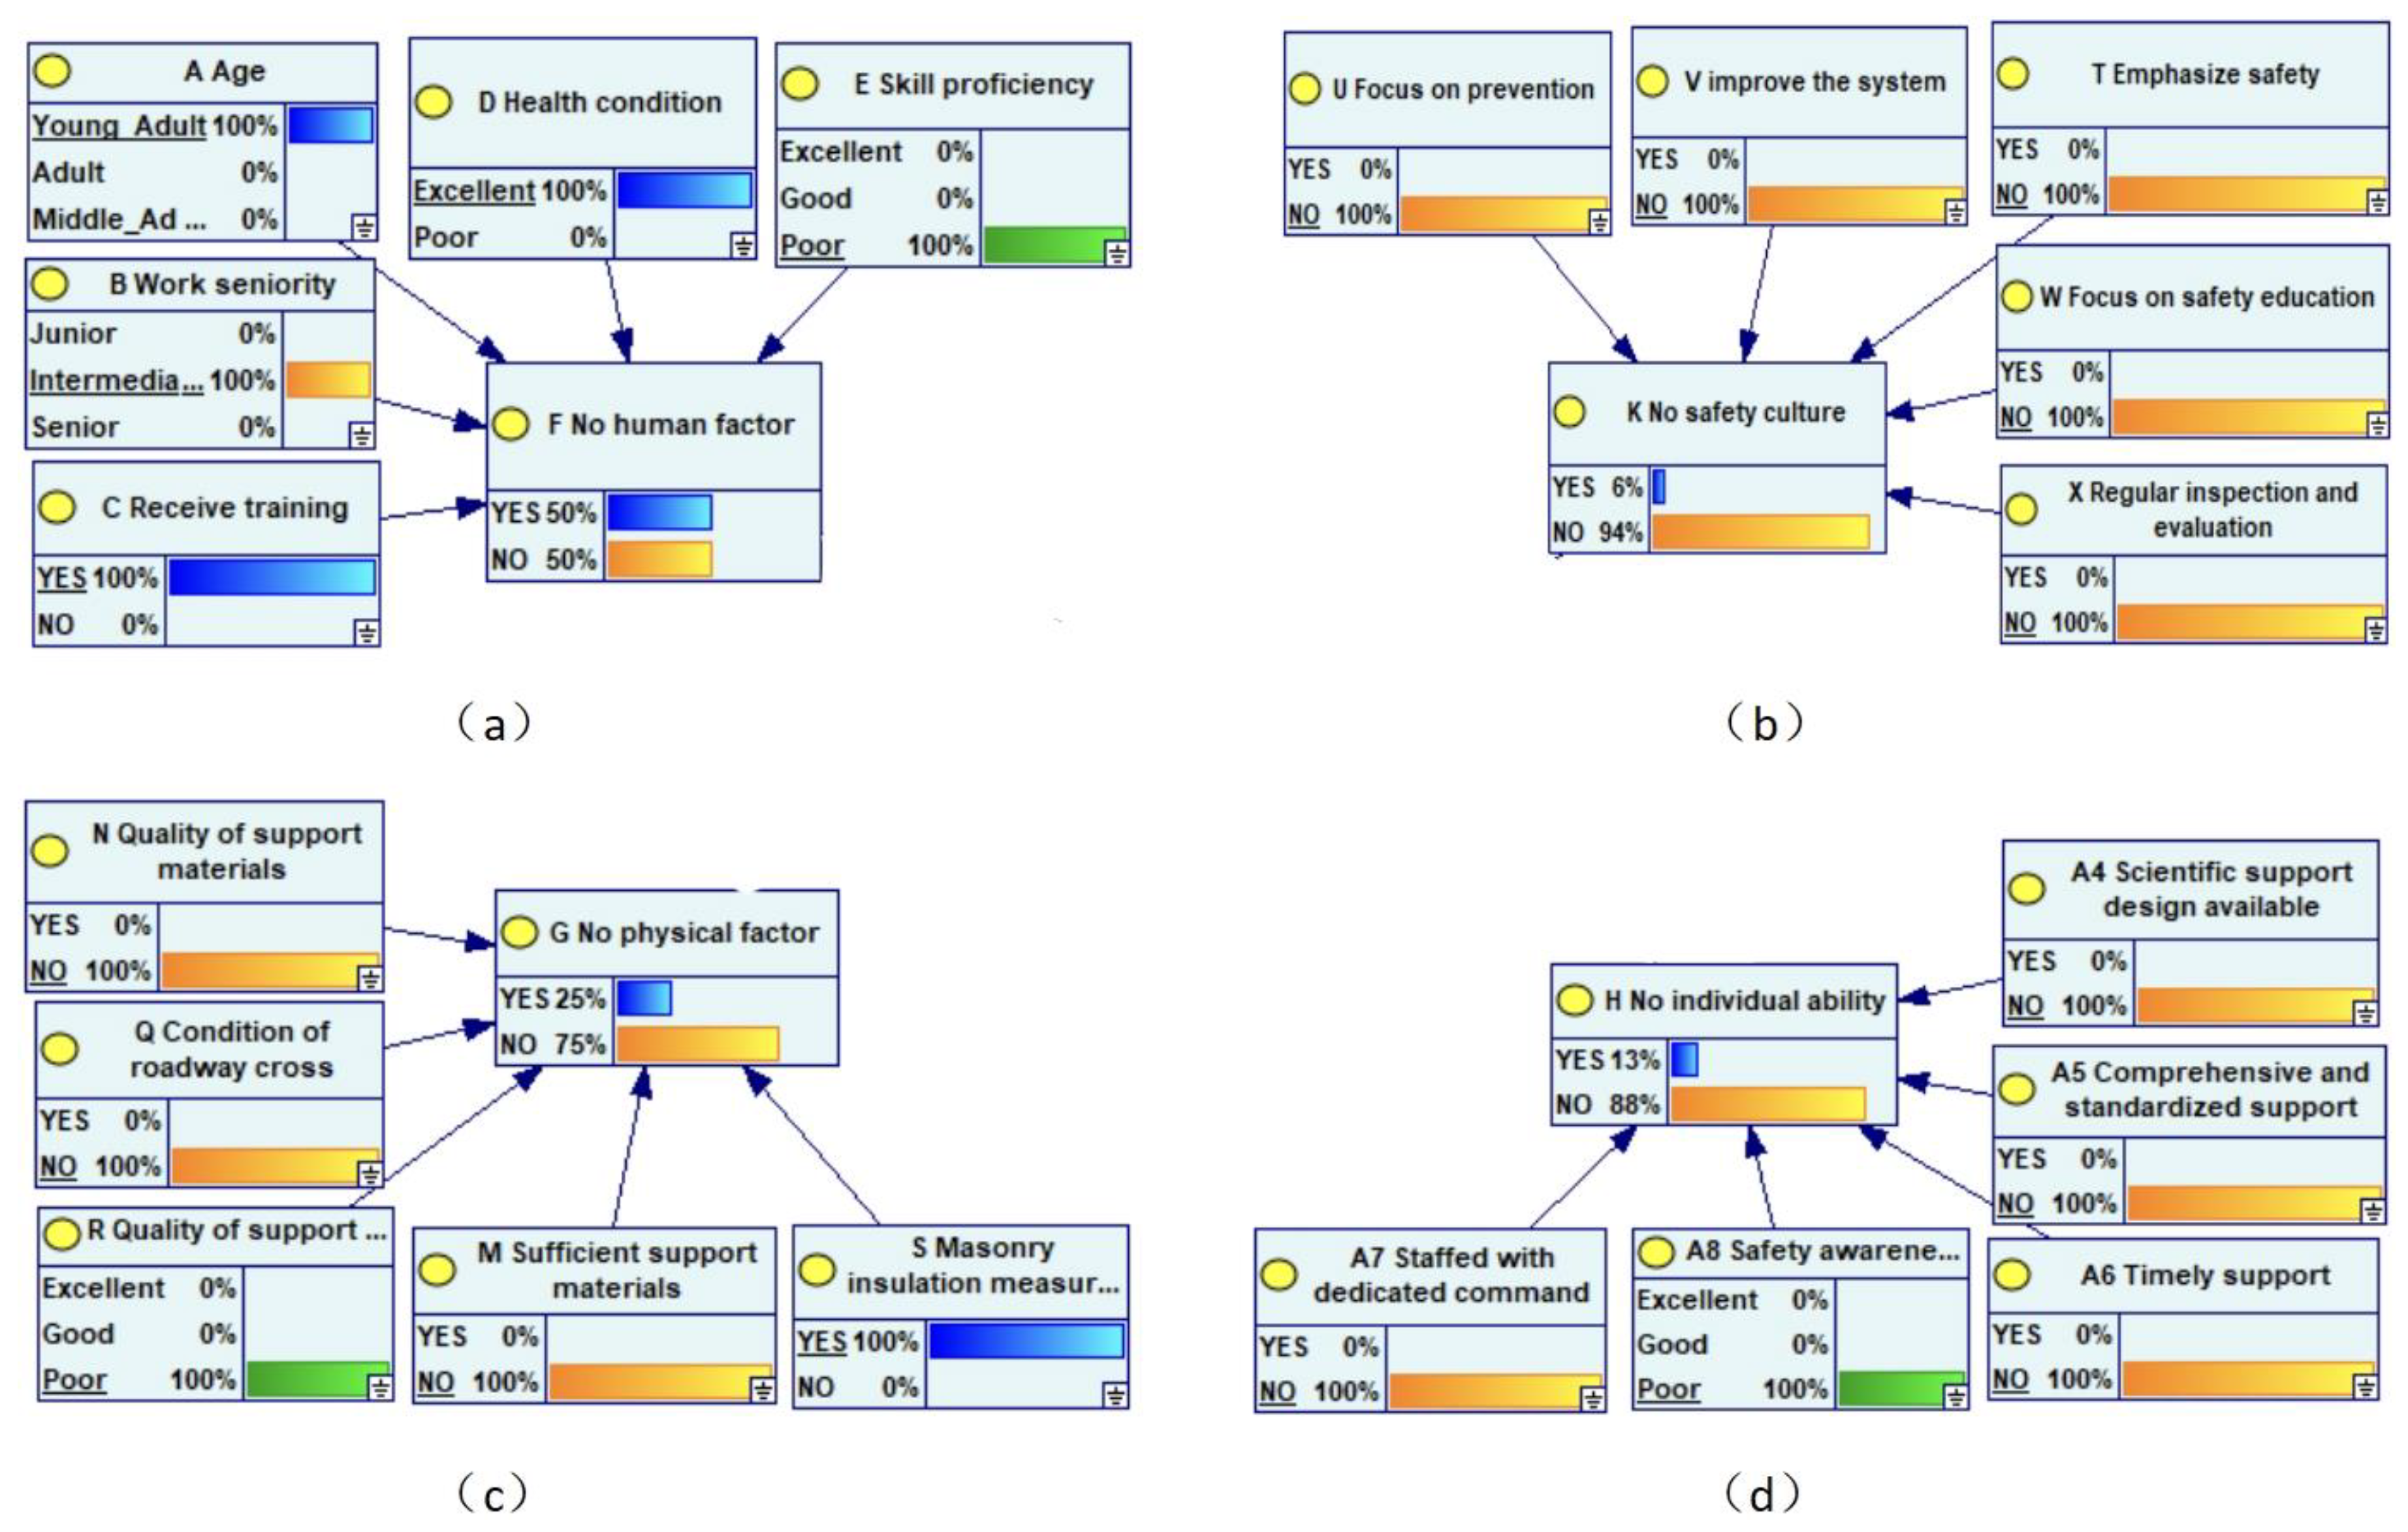
Table 2.
Sensitivity coefficients of node L.
| Node | Sensitivity coefficient | Node | Sensitivity coefficient |
| N Quality of support materials | 0.02886 | A4 Scientific support design available | 0.00331 |
| B Work seniority | 0.01599 | A3 Adequate professional managers | 0.00213 |
| M Sufficient support materials | 0.00764 | A1 Work safety responsibility implementation | 0.00165 |
| A5Comprehensive & standardized support | 0.00735 | Y Adequate training work | 0.00074 |
| A8 Safety awareness | 0.00637 | A2 Safety technical measures in place | 0.00073 |
| A Age | 0.00626 | W Focus on safety education | 0.00042 |
| D Health condition | 0.00538 | S Masonry insulation measures | 0.00042 |
| A7 Staffed with dedicated command | 0.00537 | U Focus on prevention | 0.00033 |
| Q Condition of roadway cross | 0.00520 | T Emphasize safety | 0.00026 |
| E Skill proficiency | 0.00471 | Z Mining & safety supervision in place | 0.00023 |
| R Quality of support frame | 0.00397 | X Regular inspection and evaluation | 0.00017 |
| C Receive training | 0.00385 | V improve the system | 0.00000 |
| A6 Timely support | 0.00378 |
Disclaimer/Publisher’s Note: The statements, opinions and data contained in all publications are solely those of the individual author(s) and contributor(s) and not of MDPI and/or the editor(s). MDPI and/or the editor(s) disclaim responsibility for any injury to people or property resulting from any ideas, methods, instructions or products referred to in the content. |
© 2025 by the authors. Licensee MDPI, Basel, Switzerland. This article is an open access article distributed under the terms and conditions of the Creative Commons Attribution (CC BY) license (http://creativecommons.org/licenses/by/4.0/).
Copyright: This open access article is published under a Creative Commons CC BY 4.0 license, which permit the free download, distribution, and reuse, provided that the author and preprint are cited in any reuse.


