Submitted:
22 September 2025
Posted:
22 September 2025
You are already at the latest version
Abstract
This study investigated the proinflammatory and prooxidative effects of popular electronic cigarette (EC) aerosols compared with conventional cigarette smoke (CS) in cultured human alveolar epithelial cell line (A549). Using cytotoxicity assays and four EC extracts, substantial differences in biological impact were observed. CS exposure led to significant declines in cell viability and pronounced morphological changes, consistent with the presence of toxic combustion byproducts. Most EC extracts caused negligible cytotoxicity except for the tobacco-flavoured variant, which demonstrated marked toxicity. DNA damage and altered cell cycle profiles were minor. Oxidative stress analysis revealed stable superoxide dismutase activity but notable glutathione depletion, especially with watermelon and strawberry-flavoured ECs, indicating the importance of individual flavour additives in cellular antioxidant defence. Inflammatory markers such as TNF-α, NF-κB, and IL-6 were differentially elevated across CS and EC groups, with IL-6 consistently increased, underscoring its role in epithelial cell regulation. Advanced double fluorescence analysis highlighted increased cellular heterogeneity and inflammation, distinct for all EC flavours. Overall, the findings demonstrate considerable heterogeneity in biological effects among EC flavourings and propose a simple biomonitoring model. The results emphasise the necessity for individualised toxicity assessments, especially regarding potential long-term health outcomes.
Keywords:
e-cigarette smoke
; cancer
; DNA damage
; oxidative stress
; subclinical inflammation
; TNF-alpha
1. Introduction
Over the past two decades, e-cigarettes, also known as electronic nicotine delivery systems (ENDS), have become a popular alternative to traditional cigarettes. Advertised as less harmful than conventional cigarettes, these devices have gained popularity among young adults and people trying to reduce or quit smoking [1,2]. However, e-cigarette aerosols (ECA) contain several potentially toxic compounds, including propylene glycol, vegetable glycerin, nicotine, carbonyl aldehydes, heavy metals, as well as various flavouring compounds, which cause adverse effects on the respiratory system, particularly in pulmonology patients [3-5]. Clinical research has evidenced that ENDS use brings significant risks, extending beyond the effects of nicotine [6]. Experimental studies have shown that e-cigarette aerosol condensates induce metabolic changes in lung alveolar epithelial cells, provoke oxidative stress, decrease mitochondrial activity, and mitochondrial transmembrane potential [7, 8]. This leads to disruptions in cellular energy homeostasis, increased production of reactive oxygen species (ROS), disruption of the antioxidant balance and activation of oxidative stress [9,10]. Comparative studies indicate that, under conditions of acute exposure, e-cigarette aerosol has lower cytotoxicity than traditional cigarette smoke (CS), but it can still lead to DNA damage in the form of double-strand breaks and DNA adducts [11-13]. The observed effects of ECA on A549 cells are largely dependent on the presence of nicotine [14, 15]. An interesting toxicological aspect of e-liquids is the presence of flavouring substances like cinnamaldehyde, menthol, vanillin, and ethyl maltol. These compounds are safe when ingested but were not tested in inhalation exposure and demonstrated significant cytotoxic effects in cell cultures, including A549, by increasing oxidative stress and intensifying inflammatory processes [16-18]. Furthermore, some flavours induce epithelial-mesenchymal transition that promotes migratory and invasive cell features. Studies on the common effects of ECA and tobacco smoke are few and often limited to single markers [19, 20]. On the other hand, the involvement of smoking, ROS, and inflammation in cancer initiation is greatly recognised and widely discussed [21], but the precise role of chronic subclinical inflammation due to EC smoking is still not recognised.
This study aimed to assess the proinflammatory and prooxidative effects of popular EC aerosols in cultured human epithelial cells, compare those effects to classical tobacco smoke, point to the most hostile EC and define subsets of affected cells for a possible diagnostic algorithm of subclinical inflammation. By analysing oxidative stress and IL-6 expression, this research seeks to identify the flavour variants with the highest biological impact and to propose cellular endpoints for potential subclinical diagnostic use. These results provide essential insights into the differential safety profiles of EC products and support the need for comprehensive toxicological scrutiny and bespoke public health guidelines.
2. Materials and Methods
2.1. Reagents
All chemicals used in this study were obtained from Sigma Chemical (Poznan, Poland) unless otherwise noted, while culture media and cell culture reagents were purchased from GIBCO (Thermo Fisher Scientific, Waltham, USA). Fluorescent antibodies were from Abcam (Cambridgeshire, UK) or SantaCruz ( Dallas, Texas, USA).
2.2. Cell Culture
A549 cells, obtained from the American Type Culture Collection (ATCC; Manassas, USA), were maintained in Ham's F-12K Nutrient Mixture (Sigma Chem. Co., Poznań, Poland) supplemented with 10% fetal bovine serum, 100 U/mL penicillin, 100 μg/mL streptomycin, and 2 mM L-glutamine (GIBCO/BRL; Grand Island, USA). Cultures were performed in Falcon flasks (Fisher, Poznan, Poland) at 37°C in an atmosphere containing 95% air and 5% CO₂. Cells were grown as monolayers and were regularly trypsinised and replated before reaching full confluence. After the third passage, cells were allowed to adhere, then maintained overnight in serum-free medium, and then subjected to further procedures. In some experiments, A549 cells were seeded into 6-, 24-, or 96-well plates and cultured for 24 hours in control medium, cigarette smoke-conditioned medium, or e-cigarette aerosol-conditioned medium (flavours: 1-classic tobacco, 2-menthol, 3-watermelon, 4-strawberry) according to the procedure described in section 2.3. All experiments were conducted under serum-free conditions for 24 hours after replacing the standard culture medium with the appropriate conditioned medium.
2.3. Preparation of ECA and CS-Conditioned Media
The ECA-conditioned media were prepared based on previously established procedures [22]. The aerosol was generated from P1 brand liquids with a nicotine concentration of 12 mg/ml in four flavours, 1-4 as described in section 2.2. These flavours were selected as representative of the various flavour categories and compositions of e-cigarette liquids. The aerosol was passed through 100 ml of the culture medium using a low-pressure vacuum pump, maintaining parameters that allowed for comparable aerosol generation times to those used for traditional cigarettes. CS smoke-conditioned medium was prepared using two Marlboro Red cigarettes (full strength, with filters removed). Smoke was passed through 100 ml of culture medium using a low-pressure vacuum pump set to approximately 1 minute per cigarette and sterilised by filtration using 0.22 μm filters.
2.4. Cell Exposure
All conditioned media were sterilised using 0.22 μm filters and immediately used for cell culture experiments. In each experiment, cells were seeded into 6-, 24-, or 96-well plates and cultured for 24 hours in control or conditioned media.
2.5. Microscopy and Cell Morphology
After 24 hours of incubation in the appropriate conditioned media, Giemsa-Wright staining was performed. Cells were observed under a light microscope, assessing both morphology and cell growth under each experimental condition.
2.6. Cell Viability Test
Cell viability was assessed using a mitochondrial activity-dependent reduction of MTT (3-(4,5-dimethylthiazol-2-yl)-2,5-diphenyltetrazolium bromide) to violet formazan. The assay was performed according to standard procedures after a 24-hour incubation [23].
2.7. Flow Cytometry - Cell Cycle Analysis
Cell proliferation and cytotoxicity were assessed by flow cytometry using propidium iodide DNA staining and cell cycle analysis [24]. Representative flow cytometric histograms of propidium iodide fluorescence distributions (MultiCycle transformation) are presented. Cells were classified based on their relative distribution in the individual cell cycle phases: damaged, subdiploid G0/G1 zone (early G0/G1 cells) – cytotoxicity, diploid zone (G0/G1 - before DNA synthesis/ resting), S phase (DNA synthesis) – proliferation, G2/M phase (after DNA synthesis/mitosis) – proliferation. Each histogram was generated from the analysis of 5,000 cells, with six samples analysed in each group. Proliferation was defined as the sum of cells in S + G2/M phases, while cytotoxicity was defined as cells in the early G0/G1 phase.
2.8. Assessment of Oxidative Stress
Intracellular oxidative stress was assessed using fluorescent DCFDA (2',7'-dichlorodihydrofluorescein diacetate) staining [25]. DCF fluorescence histograms reflected the level of oxidative stress. Increased oxidative stress was characterised by a rightward shift of the fluorescence peak.
2.9. Glutathione Level
Intracellular glutathione levels were determined using fluorescent glutathione-specific antibodies (Abcam, Glutathione Assay Kit, Fluorometric). Measurements were performed by Beckman Coulter CytoFlex flow gl cytometer (Beckman Coulter, Warsaw, Poland), Kaluza Software (version 2.1.2).
2.10. Superoxide Dismutase Activity
Superoxide dismutase (SOD) activity was assessed using the Superoxide Dismutase Activity Assay Kit (Sigma Aldrich CS0009, Merck Life Science Sp., Poznan, Poland) according to the manufacturer's instructions.
2.11. Intracellular IL-6, TNF-α and NF-κB
Intracellular IL-6, TNF-α and NF-B levels were measured to evaluate EC-specific pro-inflammatory immune responses. After culturing, the cells were fixed for 10 minutes in 4% methanol-free formaldehyde at room temperature and stained by direct labelling with anti IL-6, TNF-α or NF-B bound to different fluorochromes. Antibodies were diluted in permeabilisation/wash buffer with 0.1% Triton-X-100 (Sigma Chemical Company, Poznan, Poland) in phosphate-buffered saline with 1% bovine serum albumin. Samples were incubated for 20 minutes at room temperature in the dark, washed, filtered via a 100 m cell strainer (Fisher Sci, Poznan, Poland) to remove aggregates and analysed by Coulter CytoFlex flow cytometer (Beckman Coulter, Warsaw, Poland). Doublet discrimination was performed manually by plotting FSC signal area versus FSC signal height on a linear scale. Positive controls were obtained with 2.5 μg/mL cisplatin (DNA damage), 50 μM tert-butyl hydroperoxide (TBH; oxidative stress), or (100 ng/mL) lipopolysaccharide (LPS; from E coli. O111:B4, Sigma-Aldrich L2630) applied to the cells for 24 hours. Evaluation of IL-6, TNF-α and NF-B was based on the percentage of positive control cells, after subtracting the percentage of cells in the negative control staining above the threshold and fluorescence intensity.
2.12. Binary Fluorescence Scatterplots of IL-6 vs TNF-α
Changes in IL-6 and TNF-α expressions were assessed in double fluorescence experiments to delineate the relationship between both parameters and assess the response of particular cells. We addressed the issue by single and double staining the cells using epitope-specific rabbit monoclonal antibodies conjugated to FITC and peridinin chlorophyll protein-cyanine 5.5 (PC5.5), respectively, both from Cell Signalling (Danvers, MA, USA), as described earlier. Samples were analysed in flow cytometry (Beckman Coulter CytoFlex flow cytometer). Experimental data were plotted as histograms, bivariate cytograms and fluorescence density plots, and were analysed for the spread, central tendency, and vectors using the FlowJo (V10.8.1, Ashland, OR, USA) and Flowing Software (v.2.5.1. freeware, Turku University, Finland)
2.13. Statistical Analysis
Statistical comparisons between groups were made using the one-sample Student's t test, while multi-group comparisons were made using a one-way analysis of variance (ANOVA) with Bonferroni's multiple comparisons. Differences between groups were considered statistically significant at a significance level of P< 0.05. All tests were performed as two-sided.
3. Results
Our results are organised in four panels. Panel 1 (Figure 1 and Figure 2) show data related to cell morphology, growth, cytotoxicity and DNA damage, panel 2 contains oxidative stress-related parameters (Figure 3), panel 3 encloses inflammation-related parameters (Figure 4), panel 4 (Figure 5, and Table 1) integrates data from comparison of the effects of ECE 1-4 on oxidative stress vs IL-6 on binary scatter plots.
3.1. Panel 1: Cell Morphology, Growth, Cytotoxicity and DNA Damage
3.1.1. Morphology of A549 Cells
Figure 1 shows the morphology of control A549 cells (A), cells exposed for 24 hours to cigarette smoke (B) and cells exposed for 24 hours to ECE 1 (C). Magnification 200X, Giemsa-Wright staining.
Control cells (Figure 1A) have typical lung epithelial cell morphology with a characteristic polygonal shape, clearly defined cell boundaries, and uniform distribution on the culture surface. Cell nuclei presented a normal structure with evenly distributed chromatin. Significant morphological changes are observed in cultures grown in CS-conditioned medium (Figure 1B). Reduced cell density, irregular shape, and the presence of numerous cells with degenerative features. An increased number of cells detached from the bottom of petri dishes was also observed. Cells exposed to ECE 1 (Figure 1C) had reduced cell confluence and the presence of single, rounded cells. Similar, but less pronounced, changes were observed with ECE 4, while ECE 2 and ECE 3 showed the least deviation from the control morphology.
3.1.2. Cell Viability (MTT Test)
Figure 2A shows cell viability by MTT assay after 24-hour exposure to CS or ECE 1-4. The MTT reduction assay was performed to reflect post-exposure cell numbers. The control cell values were expressed as 100% viability, and other results are presented as a percentage of the control. Exposure to CS significantly reduced cell viability by about 80% (P<0.01), and ECE 1 decreased viable cell numbers by about 19% (P<0.05). A Bonferroni post-hoc test revealed no significant differences between the ECE 1-4.
3.1.3. Cytotoxicity/Analysis of Cell Cycle
Figure 2B-E shows flow cytometry analysis of A549 cell cytotoxicity/ proliferation.
Cytotoxicity was assessed by flow cytometry analysis of histograms of propidium iodide-stained cells, determining the percentage of damaged cells (C) in the subdiploid G0/G1 phase (early G0/G1) as an indicator of cell damage, resting cells (G0/G1; D), and S-phase cells + G2/M cells (E). CS produced 42% toxicity (P<0.01), and ECE 2 reached about 8% of DNA-damaged cells (P<0.05). No toxicity was detected with other ECE. CS and much less ECE 4 reduced the number of resting cells (P<0.01 and P<0.05, respectively).
3.1.4. Cell Proliferation
Figure 2D,E show the number of resting cells (2D) and the fraction of proliferating cells. In the control group, the percentage of resting cells was more than 63% and CS decreased the number of resting cells to approximately 48% (P<0.01). A significant decrease (P<0.05) was also observed with ECE 4 but not with other ECEs. Both CS and ECE 4 decreased cell proliferation by about 65% (P<0.01) and 18% (P<0.05), respectively. In contrast to CS, other ECEs again had no significant effect on proliferating cell fractions.
3.2. Panel 2: Oxidative Stress
3.2.1. Intracellular Oxidative Stress
Figure 3A shows intracellular oxidative stress produced by 24-hour CS or ECE 1-4 exposure. Increased prooxidative effects were observed in each group. CS elevated DDCF fluorescence approximately 3.5 times (P<0.01) while ECE exposure resulted in smaller, but highly significant values, reaching about 2-2.5 times higher (P<0.01) fluorescence.
3.2.2. SOD Activity
There was no significant difference between ECE 1-4. SOD activity was not affected by CS nor by ECE (Figure 3B)
3.2.3. Intracellular GSH
Intracellular GSH levels significantly decreased (Figure 3C) in cells exposed to CS (by about 26%; P<0.01) or ECE 3 and ECE 4 (both by about 17-18%; P<0.05).
3.3. Panel 3: Inflammation
3.3.1. Intracellular IL-6
Figure 4A shows intracellular IL-6 in A549 cells exposed for 24 hours to VCS or ECE 1-4. IL-6 was measured in fixed and permeabilised cells using specific monoclonal antibodies and flow cytometry detection as described in Materials and Methods. IL-6 was increased in all groups to a similar extent (by 45-74%; P<0.01), and there was no difference between EC groups and CS.
3.3.2. Intracellular TNF-
TNF- was elevated (Figure 4B) in cells exposed to CS (P<0.01) and in cells treated with ECE 3 (P<0.05). The results of ECE 1 (P<0.05) and ECE 4 (P<0.01) were significantly different from CS.
3.3.3. Intracellular NF-B
NF-B was significantly increased (Figure 4C) in almost all groups to a similar extent (by 20-45%; P<0.01) except for ECE 2, where the increase was not significant, probably due to higher standard deviation in this group. There was no difference between the median values of the ECE 1-4 groups and CS.
3.4. Panel 4: Double Fluorescence Scatterplots
Figure 5 and Table 1 show representative double fluorescence scatter plots of A549 cells grown with ECE 1-4 or CS-conditioned media for 24 hours. Then, the cells were fixed, permeabilised, stained with a green fluorescent DCFDA for oxidative stress and with red peridinin chlorophyll protein-cyanine 5.5 (PC5.5) for IL-6 and analysed with flow cytometry in scatterplot mode. Scatter area, vector size (distance between the central density point of control cells, Figure 5A, and the corresponding central density points of ECE 1-4 exposed cells (Figure 5B), slopes of central tendency lines (symmetry line from central density point to the highest plot values) are shown in Table 1.
3.4.1. Scatter Area
Only ECE 4 significantly increased cell scatter area by about 15% and the area of cell scatter in the ECE 4 group was different from those in ECE 1 (P<0.05) and ECE 2 (P<0.05) but not ECE 3.
3.4.2. Vector Size
Considering vector size (Figure 5B), the highest value was found in the ECE 3 group, significantly higher than ECE 1 (P<0.01), ECE 2 (P<0.01), and also higher than ECE 4 (P<0.01).
3.4.3. Slopes of the Central Tendency Line
There was no significant difference between the slopes of the central tendency lines.
3.4.4. Cell Distribution
Considering cell distribution: in zone I (high inflammation, low oxidative stress), there were more cells after ECE 2 (P<0.05) and ECE 4 (P<0.01) exposure compared to ECE 1 or ECE 3. In zone II (very high inflammation, lower but high oxidative stress), ECE 2, ECE 3 and ECE 4 produced significant cell accumulation with the highest increase compared to ECE 1 in ECE 4 (P<0.01; by more than 100%). In zone III (low inflammation, low oxidative stress), there was an accumulation of cells treated with ECE 4 (P<0.01; compared to all other ECE treatments). In zone IV (lower inflammation, higher oxidative stress), only ECE 4 significantly decreased (P<0.05) cell numbers.
II/IV ratio for highly fluorescent cells evidenced that ECE 4-exposed cells had relatively more inflammation than ECE 1 or ECE 2 (P<0.01). Similar, but less expressed changes were noticed with ECE 3 (P<0.05 for ECE 1 and ECE 2)
4. Discussion
The association between smoking, ROS, and inflammation in cancer initiation is well established and extensively discussed in the scientific literature [26, 27]; however, the potential role of chronic subclinical inflammation resulting from EC use remains inadequately characterised [26,28]. This study aimed to assess the proinflammatory and prooxidative effects of widely used EC aerosols in cultured human epithelial cells, compared with conventional CS, and to develop a diagnostic framework for identifying the most deleterious EC formulations and defining cell subsets for prospective diagnostic algorithms. We began with classical cytotoxicity tests using a human alveolar epithelial cell line, CS-conditioned medium and four EC extracts. Our results showed significant differences in the cytotoxic effects of conventional CS and ECEs on A549 cells. The drastic decrease in cell viability after exposure to CS confirmed the strong cytotoxicity of tobacco smoke, well documented in the literature [29]. This effect can be attributed to numerous toxic compounds produced during tobacco combustion, including aldehydes, polycyclic aromatic hydrocarbons, and carbon monoxide [30]. Unlike traditional cigarettes, ECEs did not significantly affect A549 cells, except for ECE 1 (tobacco flavour), which reduced cell viability. This may be related to the specific chemical composition of tobacco-flavoured liquids containing compounds intended to mimic natural tobacco flavour. Published data on ECE effects in A549 cells, including cytotoxicity and inflammation, are inconsistent [31, 32]. Our results indicate significant cell damage after CS exposure. ECE 2 caused some DNA damage, but no toxicity was detected with the other ECEs. Regarding cell proliferation, CS and, to a lesser extent, ECE 4 reduced the number of proliferating and resting cells. It should be stressed that the proliferative nature of A549 cells affects the MTT assay. Microscopic observations confirmed the cytotoxicity results, showing distinct morphological changes in CS-exposed cells and more subtle changes in those exposed to ECE variants.
Cell cycle analysis revealed only slight changes in ECE-exposed groups, and a significant alteration in CS-treated cells. This pattern is often observed in response to genotoxic stress and may indicate activation of DNA repair mechanisms or initiation of neoplastic processes if repair fails [33]. CS also decreased the number of resting cells, with ECE 4 also showing a significant decrease, unlike other ECEs.
Oxidative stress is implicated in cigarette smoke mechanisms and inflammatory lung diseases [34]. Prooxidants and inflammatory mediators such as TNF-α activate transcription factors like NF-κB and IL-6, leading to expression of pro-inflammatory genes and activation of pro-inflammatory cells [35]. ROS can also be generated intracellularly in mitochondria and via enzymatic systems such as xanthine/xanthine oxidase [36]. Analyses of oxidative stress yielded unexpected results. Despite significant differences in cytotoxicity and proliferation, SOD activity remained unaffected and similar across experimental groups. This might suggest that tested substances do not directly generate reactive oxygen species or that A549 cells possess efficient antioxidant defence systems maintaining SOD homeostasis. Glutathione levels, particularly the significant reduction observed with watermelon and strawberry-flavoured e-cigarettes, indicated a specific effect of flavouring ingredients on cellular thiol systems. Glutathione is crucial for antioxidant defence and xenobiotic detoxification, and its depletion may increase cellular sensitivity to oxidative damage [37].
Oxidative stress and inflammatory responses are tightly linked [38]. In our experiments, TNF-α was elevated in cells exposed to CS and those treated with ECE 3 and ECE 4. Results for ECE 1 and ECE 4 significantly differed from CS. Another pro-inflammatory molecule, NF-κB, significantly increased in almost all groups except ECE 2, where the increase was not significant. Only IL-6 increased similarly across all groups, with no difference between EC groups and CS. IL-6 modulates epithelial cell proliferation, barrier function, and differentiation [39]. It promotes repair and proliferation after injury but can increase tight junction permeability during chronic inflammation, disrupting the epithelial barrier [40]. IL-6 also regulates proteins critical to epithelial cell structure [41]. The observed differences between e-cigarette flavour variants are important, as each exhibited a mildly different biological action likely related to their chemical compositions. ECE 1 showed the highest cytotoxicity, possibly due to tobacco-mimicking compounds. The watermelon flavour showed a unique profile; despite lacking significant cytotoxicity in the MTT assay, it caused noticeable morphological changes and increased cell proliferation, possibly due to fruit-derived flavouring effects on cellular metabolism. Menthol, despite lacking significant cytotoxicity, caused significant glutathione level changes, potentially linked to its chemical properties impacting membranes and intracellular transport. Literature suggests menthol affects membrane permeability and detox enzyme activities [42].
Oxidative stress and IL-6 were consistently elevated in A549 cells cultured with ECEs, so both were analysed via double fluorescence scatterplot experiments. Cell polarisation between oxidative stress and inflammation produced unique cell clouds with differing features, like scatter area and vector size. Only ECE 4 significantly increased the scatter area compared to ECE 1 and 2. The highest vector size value was found in ECE 3, suggesting its utility in routine ECE analyses. Cell distribution analysis highlighted zones II and IV as most important (higher inflammation/oxidative stress ratio and lower inflammation to oxidative stress, respectively). ECEs 2, 3, and 4 produced significant cell accumulations, with ECE 4 showing the highest increase. In zone IV, only ECE 4 significantly decreased cell numbers. The II/IV ratio for highly fluorescent cells indicated ECE 4-exposed cells had stronger inflammation than oxidative stress, more than ECE 1 or 2. Similar but less pronounced changes occurred with ECE 3.
Study Limitations and Future Directions
This study has limitations. Primarily, the use of a single cell line (A549) may not capture the diversity of lung cell responses. Future work should include broader cell panels and primary lung epithelial cultures. Also, exposure time was limited to 24 hours, potentially insufficient to simulate long-term effects typical of real-world EC and cigarette use. Long-term studies should investigate cumulative effects and cellular adaptation mechanisms. Oxidative stress provides a broad signal compared to the narrow molecular signal of IL-6. More biomarkers could be considered. Interpreting in vitro effects, particularly translating subclinical to clinical meaning, remains challenging. Future studies should explore broader biomarker standardisation.
Our findings have public health implications for e-cigarette regulation. Although ECs showed less direct cytotoxicity than conventional cigarettes, their effects on proliferation and potential epigenetic changes may pose long-term health risks. Different flavour ingredients show varying toxicity profiles, complicating safety assessments [40]. There is a need for caution in promoting ECs as safer alternatives, and regulation should address both direct toxicity and proliferative/epigenetic effects.
5. Conclusions
This study demonstrated significant biological differences between conventional cigarette smoke and EC extracts on A549 cells, highlighting EC heterogeneity. Conventional cigarettes caused greater direct cytotoxicity, but both smoke and most EC variants affected proliferation, relevant to long-term cancer risk. EC flavouring ingredients exhibited diverse biological profiles, with tobacco flavour showing the highest cytotoxicity and fruit flavours (watermelon, strawberry) showing primarily proliferative effects. The study provides tools to monitor diverse EC effects and emphasises individualised assessment.
References
- Cullen, K.A.; Gentzke, A.S.; Sawdey, M.D.; Chang, J.T.; Anic, G.M.; Wang, T.W.; Creamer, M.R.; Jamal, A.; Ambrose, B.K.; King, B.A. e-Cigarette Use Among Youth in the United States, 2019. JAMA 2019, 322, 2095–2103. [Google Scholar] [CrossRef] [PubMed]
- Lindson, N.; Butler, A.R.; McRobbie, H.; Bullen, C.; Hajek, P.; Begh, R.; Theodoulou, A.; Notley, C.; Rigotti, N.A.; Turner, T.; Livingstone-Banks, J.; Morris, T.; Hartmann-Boyce, J. Electronic cigarettes for smoking cessation. Cochrane Database Syst Rev 2024, 1, CD010216. [Google Scholar] [PubMed]
- Goniewicz, M.L.; Gawron, M.; Smith, D.M.; Peng, M.; Jacob P3rd Benowitz, N.L. Exposure to Nicotine and Selected Toxicants in Cigarette Smokers Who Switched to Electronic Cigarettes: A Longitudinal Within-Subjects Observational Study. Nicotine Tob Res 2017, 19, 160–167. [Google Scholar] [CrossRef]
- Williams, M.; Villarreal, A.; Bozhilov, K.; Lin, S.; Talbot, P. Metal and silicate particles including nanoparticles are present in electronic cigarette cartomizer fluid and aerosol. PLoS One 2013, 8, e57987. [Google Scholar] [CrossRef]
- Sleiman, M.; Logue, J.M.; Montesinos, V.N.; Russell, M.L.; Litter, M.I.; Gundel, L.A.; Destaillats, H. Emissions from Electronic Cigarettes: Key Parameters Affecting the Release of Harmful Chemicals. Environ Sci Technol 2016, 50, 9644–9651. [Google Scholar] [CrossRef]
- Talih, S.; Balhas, Z.; Eissenberg, T.; Salman, R.; Karaoghlanian, N.; El Hellani, A.; Baalbaki, R.; Saliba, N.; Shihadeh, A. Effects of user puff topography, device voltage, and liquid nicotine concentration on electronic cigarette nicotine yield: measurements and model predictions. Nicotine Tob Res 2015, 17, 150–157. [Google Scholar] [CrossRef]
- Lieber, M.; Smith, B.; Szakal, A.; Nelson-Rees, W.; Todaro, G. A continuous tumor-cell line from a human lung carcinoma with properties of type II alveolar epithelial cells. Int J Cancer 1976, 17, 62–70. [Google Scholar] [CrossRef]
- Foster, K.A.; Oster, C.G.; Mayer, M.M.; Avery, M.L.; Audus, K.L. Characterization of the A549 cell line as a type II pulmonary epithelial cell model for drug metabolism. Exp Cell Res 1998, 243, 359–366. [Google Scholar] [CrossRef] [PubMed]
- Jabba, S.V.; Diaz, A.N.; Erythropel, H.C.; Zimmerman, J.B.; Jordt, S.E. Chemical Adducts of Reactive Flavor Aldehydes Formed in E-Cigarette Liquids Are Cytotoxic and Inhibit Mitochondrial Function in Respiratory Epithelial Cells. Nicotine Tob Res 2020, 22 (Suppl 1), S25–S34. [Google Scholar] [CrossRef]
- Findlay-Greene, F.; Donnellan, S.; Vass, S. Analysing the acute toxicity of e-cigarette liquids and their vapour on human lung epithelial (A549) cells in vitro. Toxicol Rep. 2025, 15, 102092. [Google Scholar] [CrossRef]
- Yu, V.; Rahimy, M.; Korrapati, A.; Xuan, Y.; Zou, A.E.; Krishnan, A.R.; Tsui, T.; Aguilera, J.A.; Advani, S.; Crotty Alexander, L.E.; Brumund, K.T.; Wang-Rodriguez, J.; Ongkeko, W.M. Electronic cigarettes induce DNA strand breaks and cell death independently of nicotine in cell lines. Oral Oncol 2016, 52, 58–65. [Google Scholar] [CrossRef]
- Effah, F.; Elzein, A.; Taiwo, B.; Baines, D.; Bailey, A.; Marczylo, T. In Vitro high-throughput toxicological assessment of E-cigarette flavors on human bronchial epithelial cells and the potential involvement of TRPA1 in cinnamon flavor-induced toxicity. Toxicology 2023, 496, 153617. [Google Scholar] [CrossRef]
- Ganapathy, V.; Manyanga, J.; Brame, L.; McGuire, D.; Sadhasivam, B.; Floyd, E.; Rubenstein, D.A.; Ramachandran, I.; Wagener, T.; Queimado, L. Electronic cigarette aerosols suppress cellular antioxidant defenses and induce significant oxidative DNA damage. PLoS One 2017, 12, e0177780. [Google Scholar] [CrossRef]
- Heeschen, C.; Jang, J.J.; Weis, M.; Pathak, A.; Kaji, S.; Hu, R.S.; Tsao, P.S.; Johnson, F.L.; Cooke, J.P. Nicotine stimulates angiogenesis and promotes tumor growth and atherosclerosis. Nat Med 2001, 7, 833–839. [Google Scholar] [CrossRef]
- Davis, R.; Rizwani, W.; Banerjee, S.; Kovacs, M.; Haura, E.; Coppola, D.; Chellappan, S. Nicotine promotes tumor growth and metastasis in mouse models of lung cancer. PLoS One 2009, 4, e7524. [Google Scholar] [CrossRef] [PubMed]
- Behar, R.Z.; Davis, B.; Wang, Y.; Bahl, V.; Lin, S.; Talbot, P. Identification of toxicants in cinnamon-flavored electronic cigarette refill fluids. Toxicol In Vitro 2014, 28, 198–08. [Google Scholar]
- Omaiye, E.E.; Luo, W.; McWhirter, K.J.; Pankow, J.F.; Talbot, P. Disposable Puff Bar Electronic Cigarettes: Chemical Composition and Toxicity of E-liquids and a Synthetic Coolant. Chem Res Toxicol 2022, 35, 1344–1358. [Google Scholar] [PubMed]
- Caruso, M.; Distefano, A.; Emma, R.; Zuccarello, P.; Copat, C.; Ferrante, M.; Carota, G.; Pulvirenti, R.; Polosa, R.; Missale, G.A.; Rust, S.; Raciti, G.; Li Volti, G. In vitro cytoxicity profile of e-cigarette liquid samples on primary human bronchial epithelial cells. Drug Test Anal 2023, 15, 1145–1155. [Google Scholar] [CrossRef] [PubMed]
- Tang, M.S.; Wu, X.R.; Lee, H.W.; Xia, Y.; Deng, F.M.; Moreira, A.L.; Chen, L.C.; Huang, W.C.; Lepor, H. Electronic-cigarette smoke induces lung adenocarcinoma and bladder urothelial hyperplasia in mice. Proc Natl Acad Sci USA 2019, 116, 21727–21731. [Google Scholar] [CrossRef]
- Miyashita, L.; Foley, G. E-cigarettes and respiratory health: the latest evidence. J Physiol 2020, 598, 5027–5038. [Google Scholar] [CrossRef]
- Foster, K.A.; Oster, C.G.; Mayer, M.M.; Avery, M.L.; Audus, K.L. Characterization of the A549 cell line as a type II pulmonary epithelial cell model for drug metabolism. Exp Cell Res 1998, 243, 359–366. [Google Scholar] [CrossRef] [PubMed]
- Szoka, P.; Lachowicz, J.; Cwiklińska, M.; Lukaszewicz, A.; Rybak, A.; Baranowska, U.; Holownia, A. Cigarette Smoke-Induced Oxidative Stress and Autophagy in Human Alveolar Epithelial Cell Line (A549 Cells). Adv Exp Med Biol 2019, 1176, 63–69. [Google Scholar] [PubMed]
- Mosmann, T. Rapid colorimetric assay for cellular growth and survival: application to proliferation and cytotoxicity assays. Journal of Immunological Methods 1983, 65, 55–63. [Google Scholar] [CrossRef]
- Vindeløv, L.L.; Christensen, I.J.; Nissen, N.I. A detergent-trypsin method for the preparation of nuclei for flow cytometric DNA analysis. Cytometry 1983, 3, 323–327. [Google Scholar] [CrossRef]
- Wang, H.; Joseph, J.A. Quantifying cellular oxidative stress by dichlorofluorescein assay using microplate reader. Free Radical Biology and Medicine 1999, 27, 612–616. [Google Scholar] [CrossRef]
- Ganapathy, V.; Jaganathan, R.; Chinnaiyan, M.; Chengizkhan, G.; Sadhasivam, B.; Manyanga, J.; Ramachandran, I.; Queimado, L. E-Cigarette effects on oral health: A molecular perspective. Food Chem Toxicol 2025, 196, 115216. [Google Scholar]
- Cha, S.R.; Jang, J.; Park, S.M.; Ryu, S.M.; Cho, S.J.; Yang, S.R. Cigarette Smoke-Induced Respiratory Response: Insights into Cellular Processes and Biomarkers. Antioxidants (Basel) 2023, 12, 1210. [Google Scholar] [CrossRef]
- Muthumalage, T.; Lamb, T.; Friedman, M.R.; Rahman, I. E-cigarette flavored pods induce inflammation, epithelial barrier dysfunction, and DNA damage in lung epithelial cells and monocytes. Sci Rep 2019, 9, 19035. [Google Scholar] [CrossRef]
- Zhang, Q.; Wen, C. The risk profile of electronic nicotine delivery systems, compared to traditional cigarettes, on oral disease: a review. Front Public Health 2023, 11, 1146949. [Google Scholar] [CrossRef]
- Petruzzelli, S.; De Flora, S.; Bagnasco, M.; Hietanen, E.; Camus, A.M.; Saracci, R.; Izzotti, A.; Bartsch, H.; Giuntini, C. Carcinogen metabolism studies in human bronchial and lung parenchymal tissues. Am Rev Respir Dis 1989, 140, 417–422. [Google Scholar] [CrossRef]
- Rankin, G.D.; Wingfors, H.; Uski, O.; Hedman, L.; Ekstrand-Hammarström, B.; Bosson, J.; Lundbäck, M. The toxic potential of a fourth-generation E-cigarette on human lung cell lines and tissue explants. J Appl Toxicol 2019, 39, 1143–1154. [Google Scholar]
- Bedford, R.; Smith, G.; Rothwell, E.; Martin, S.; Medhane, R.; Casentieri, D.; Daunt, A.; Freiberg, G.; Hollings, M. A multi-organ, lung-derived inflammatory response following in vitro airway exposure to cigarette smoke and next-generation nicotine delivery products. Toxicol Lett 2023, 387, 35–49. [Google Scholar]
- Chen, J.; Potlapalli, R.; Quan, H.; Chen, L.; Xie, Y.; Pouriyeh, S.; Sakib, N.; Liu, L.; Xie, Y. Exploring DNA Damage and Repair Mechanisms: A Review with Computational Insights. BioTech (Basel) 2024, 13, 3. [Google Scholar]
- Milara, J.; Cortijo, J. Tobacco, inflammation, and respiratory tract cancer. Curr Pharm Des. 2012, 18, 3901–3938. [Google Scholar] [CrossRef]
- Pascoal, C.; Granjo, P.; Mexia, P.; Gallego, D.; Adubeiro Lourenço, R.; Sharma, S.; Pérez, B.; Castro-Caldas, M.; Grosso, A.R.; Dos Reis Ferreira, V.; Videira, P.A. Unraveling the biological potential of skin fibroblast: responses to TNF-α, highlighting intracellular signaling pathways and secretome. Immunol Lett 2025, 276, 107057. [Google Scholar] [CrossRef]
- Kovac, S.; Domijan, A.M.; Walker, M.C.; Abramov, A.Y. Seizure activity results in calcium- and mitochondria-independent ROS production via NADPH and xanthine oxidase activation. Cell Death Dis 2014, 5, e1442. [Google Scholar] [CrossRef] [PubMed]
- Čapek, J.; Roušar, T. Detection of Oxidative Stress Induced by Nanomaterials in Cells-The Roles of Reactive Oxygen Species and Glutathione. Molecules 2021, 26, 4710. [Google Scholar] [PubMed]
- Güler, M.C.; Tanyeli, A.; Ekinci Akdemir, F.N.; Eraslan, E.; Özbek Şebin, S.; Güzel Erdoğan, D.; Nacar, T. An Overview of Ischemia-Reperfusion Injury: Review on Oxidative Stress and Inflammatory Response. Eurasian J Med 2022, 54 (Suppl1), 62–65. [Google Scholar]
- Marzoog, B.A. Cytokines and Regulating Epithelial Cell Division. Curr Drug Targets 2024, 25, 190–200. [Google Scholar] [CrossRef] [PubMed]
- Voirin, A.C.; Perek, N.; Roche, F. Inflammatory stress induced by a combination of cytokines (IL-6, IL-17, TNF-α) leads to a loss of integrity on bEnd.3 endothelial cells in vitro BBB model. Brain Res 2020, 1730, 146647. [Google Scholar] [CrossRef]
- Zhang, J.Y.; Nie, X.K.; Chen, Z.C.; Zhou, S.J.; Lin, X.H.; Zhang, L.; Zhong, D.; Xiao, B.Y.; Jiang, S.Q.; Huang, W.Y.; Lin, M.H.; Wang, Y.J. Mechanism Study on Inhibition of EPHA2 Expression Impaired Skin Barrier Function by Gefitinib. Exp Dermatol 2025, 34, e70145. [Google Scholar] [CrossRef] [PubMed]
- Ramalingam, A.R.; Kucera, C.; Srivastava, S.; Paily, R.; Stephens, D.; Lorkiewicz, P.; Wilkey, D.W.; Merchant, M.; Bhatnagar, A.; Carll, A.P. Acute and Persistent Cardiovascular Effects of Menthol E-Cigarettes in Mice. J Am Heart Assoc 2025, 14, e037420. [Google Scholar] [CrossRef] [PubMed]
Figure 1.
Morphology of control A549 cells (A), cells exposed for 24 hours to cigarette smoke (B) and cells exposed for 24 hours to ECE 1 (C). Magnification 200X, Giemsa-Wright staining.
Figure 1.
Morphology of control A549 cells (A), cells exposed for 24 hours to cigarette smoke (B) and cells exposed for 24 hours to ECE 1 (C). Magnification 200X, Giemsa-Wright staining.
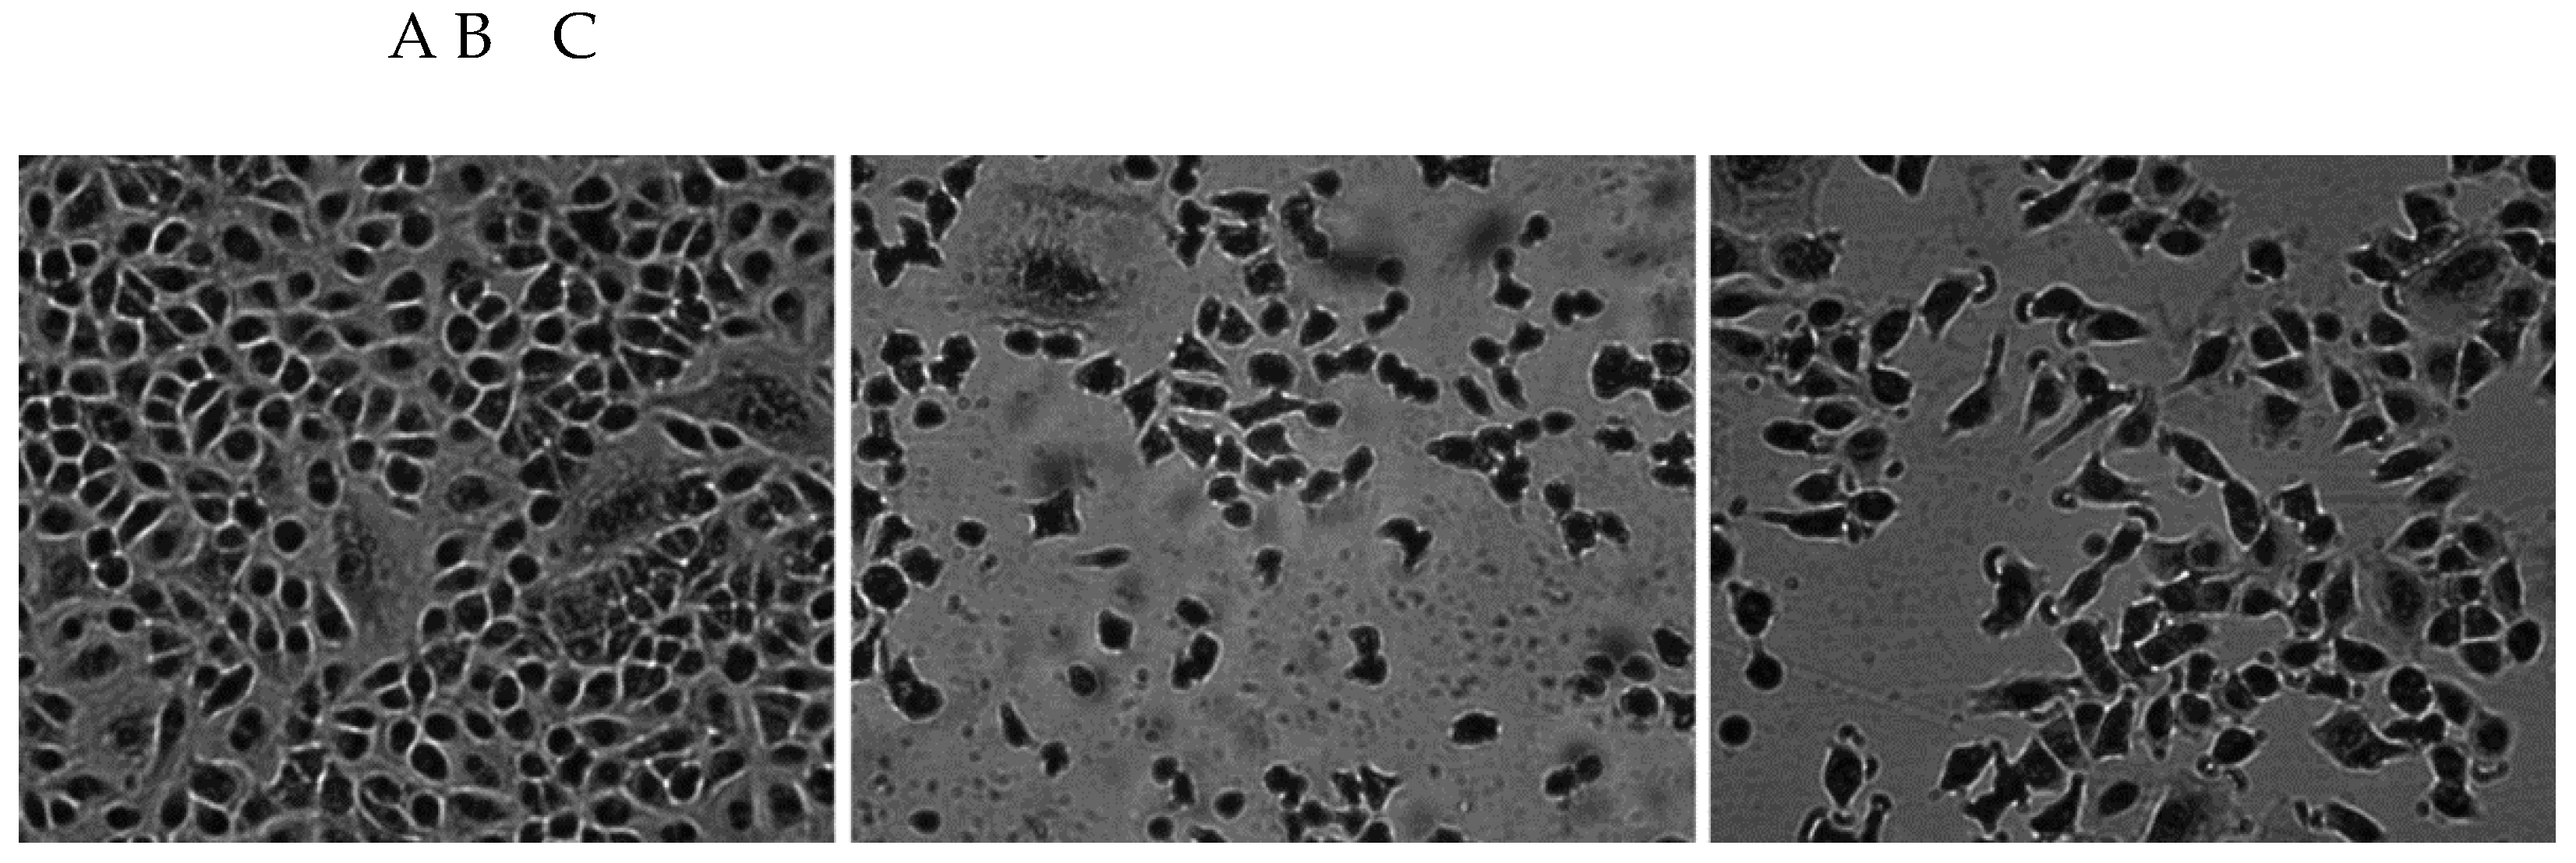
Figure 2.
Cell viability-A (MTT test), DNA histograms of control cells and CS exposed cells (B) (propidium iodide staining), with low molecular, damaged-“early” G0/G1 fraction (C), resting cells (D) and proliferating cells at S and G2/M phases (E). Data are means ± SD of 5-6 assays. *P<0.05; **P<0.01 for comparisons with the corresponding control cells, #P<0.05; ##P<0.01 for comparisons with the CS-treated cells.
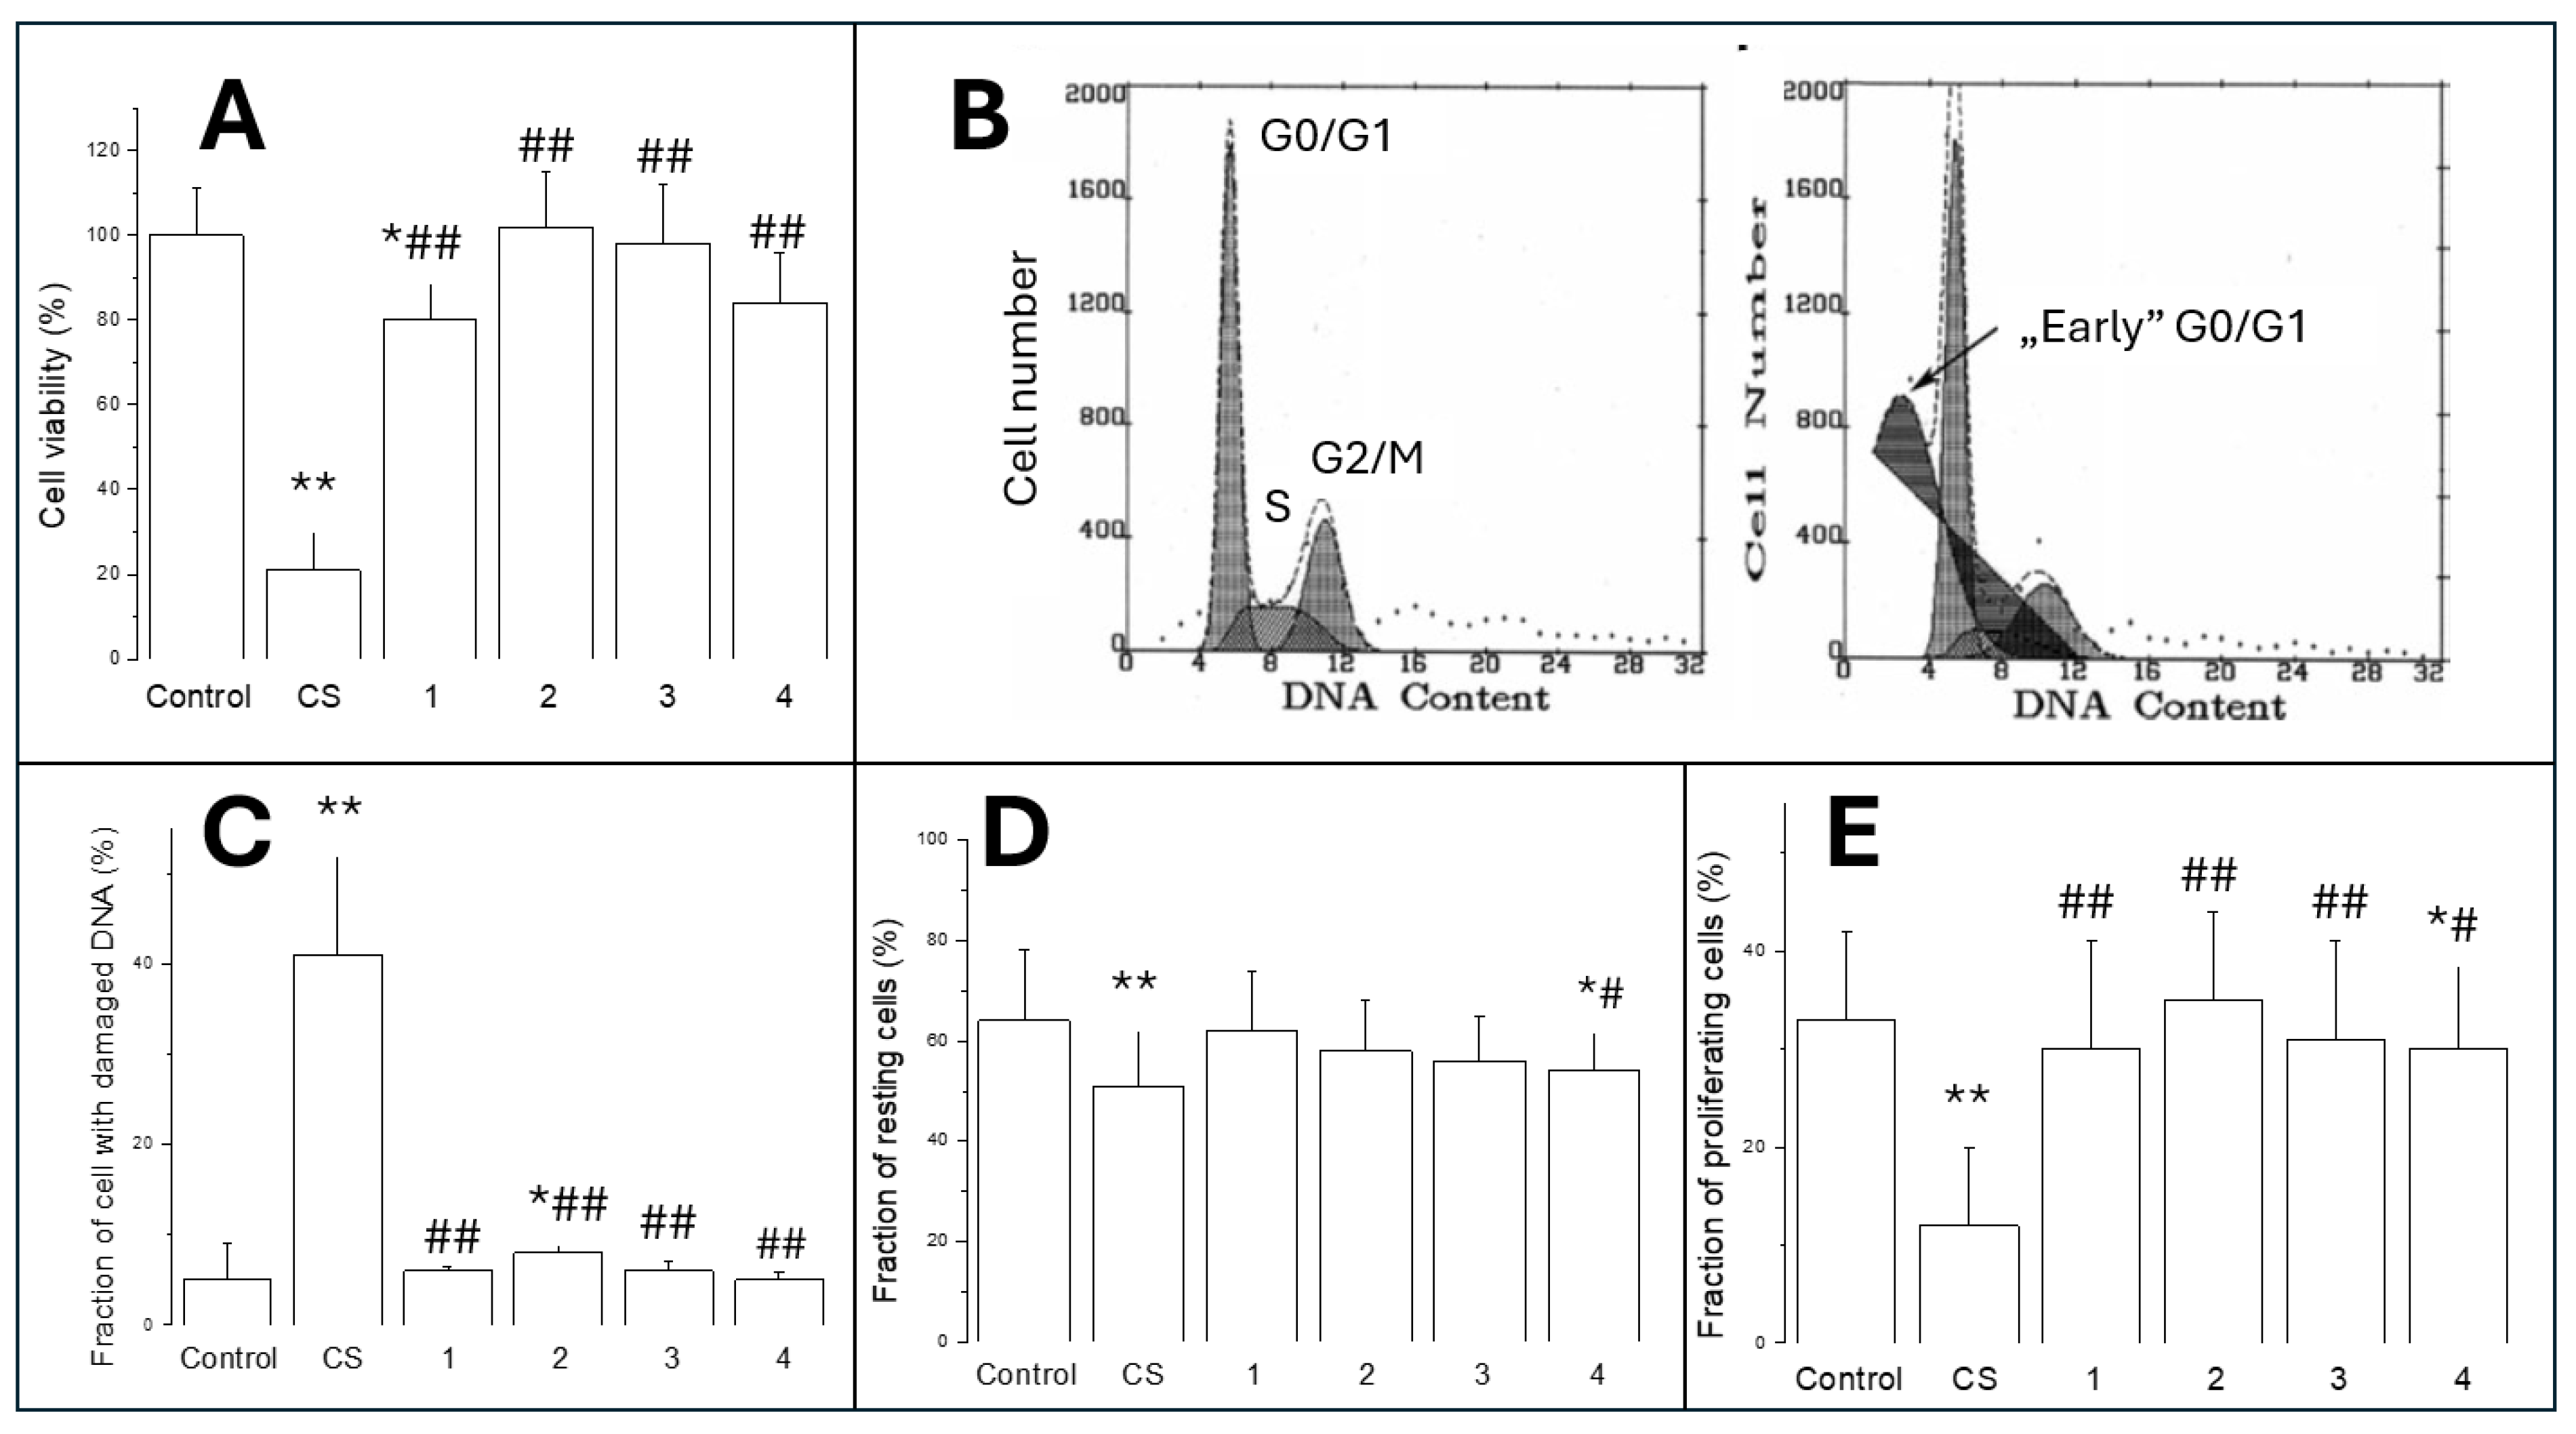
Figure 3.
Oxidative stress in A549 cells exposed for 24 hours to CS or ECE 1-4 as described in Materials and Methods. Panel A represents DCF fluorescence, panel B is specific SOD activity, and panel C shows C-intracellular GSH content. Data are means ± SD of 5-6 assays. *P<0.05; **P<0.01 for comparisons with the corresponding control cells; #P<0.05; ##P<0.01 for comparisons with the CS-treated cells.
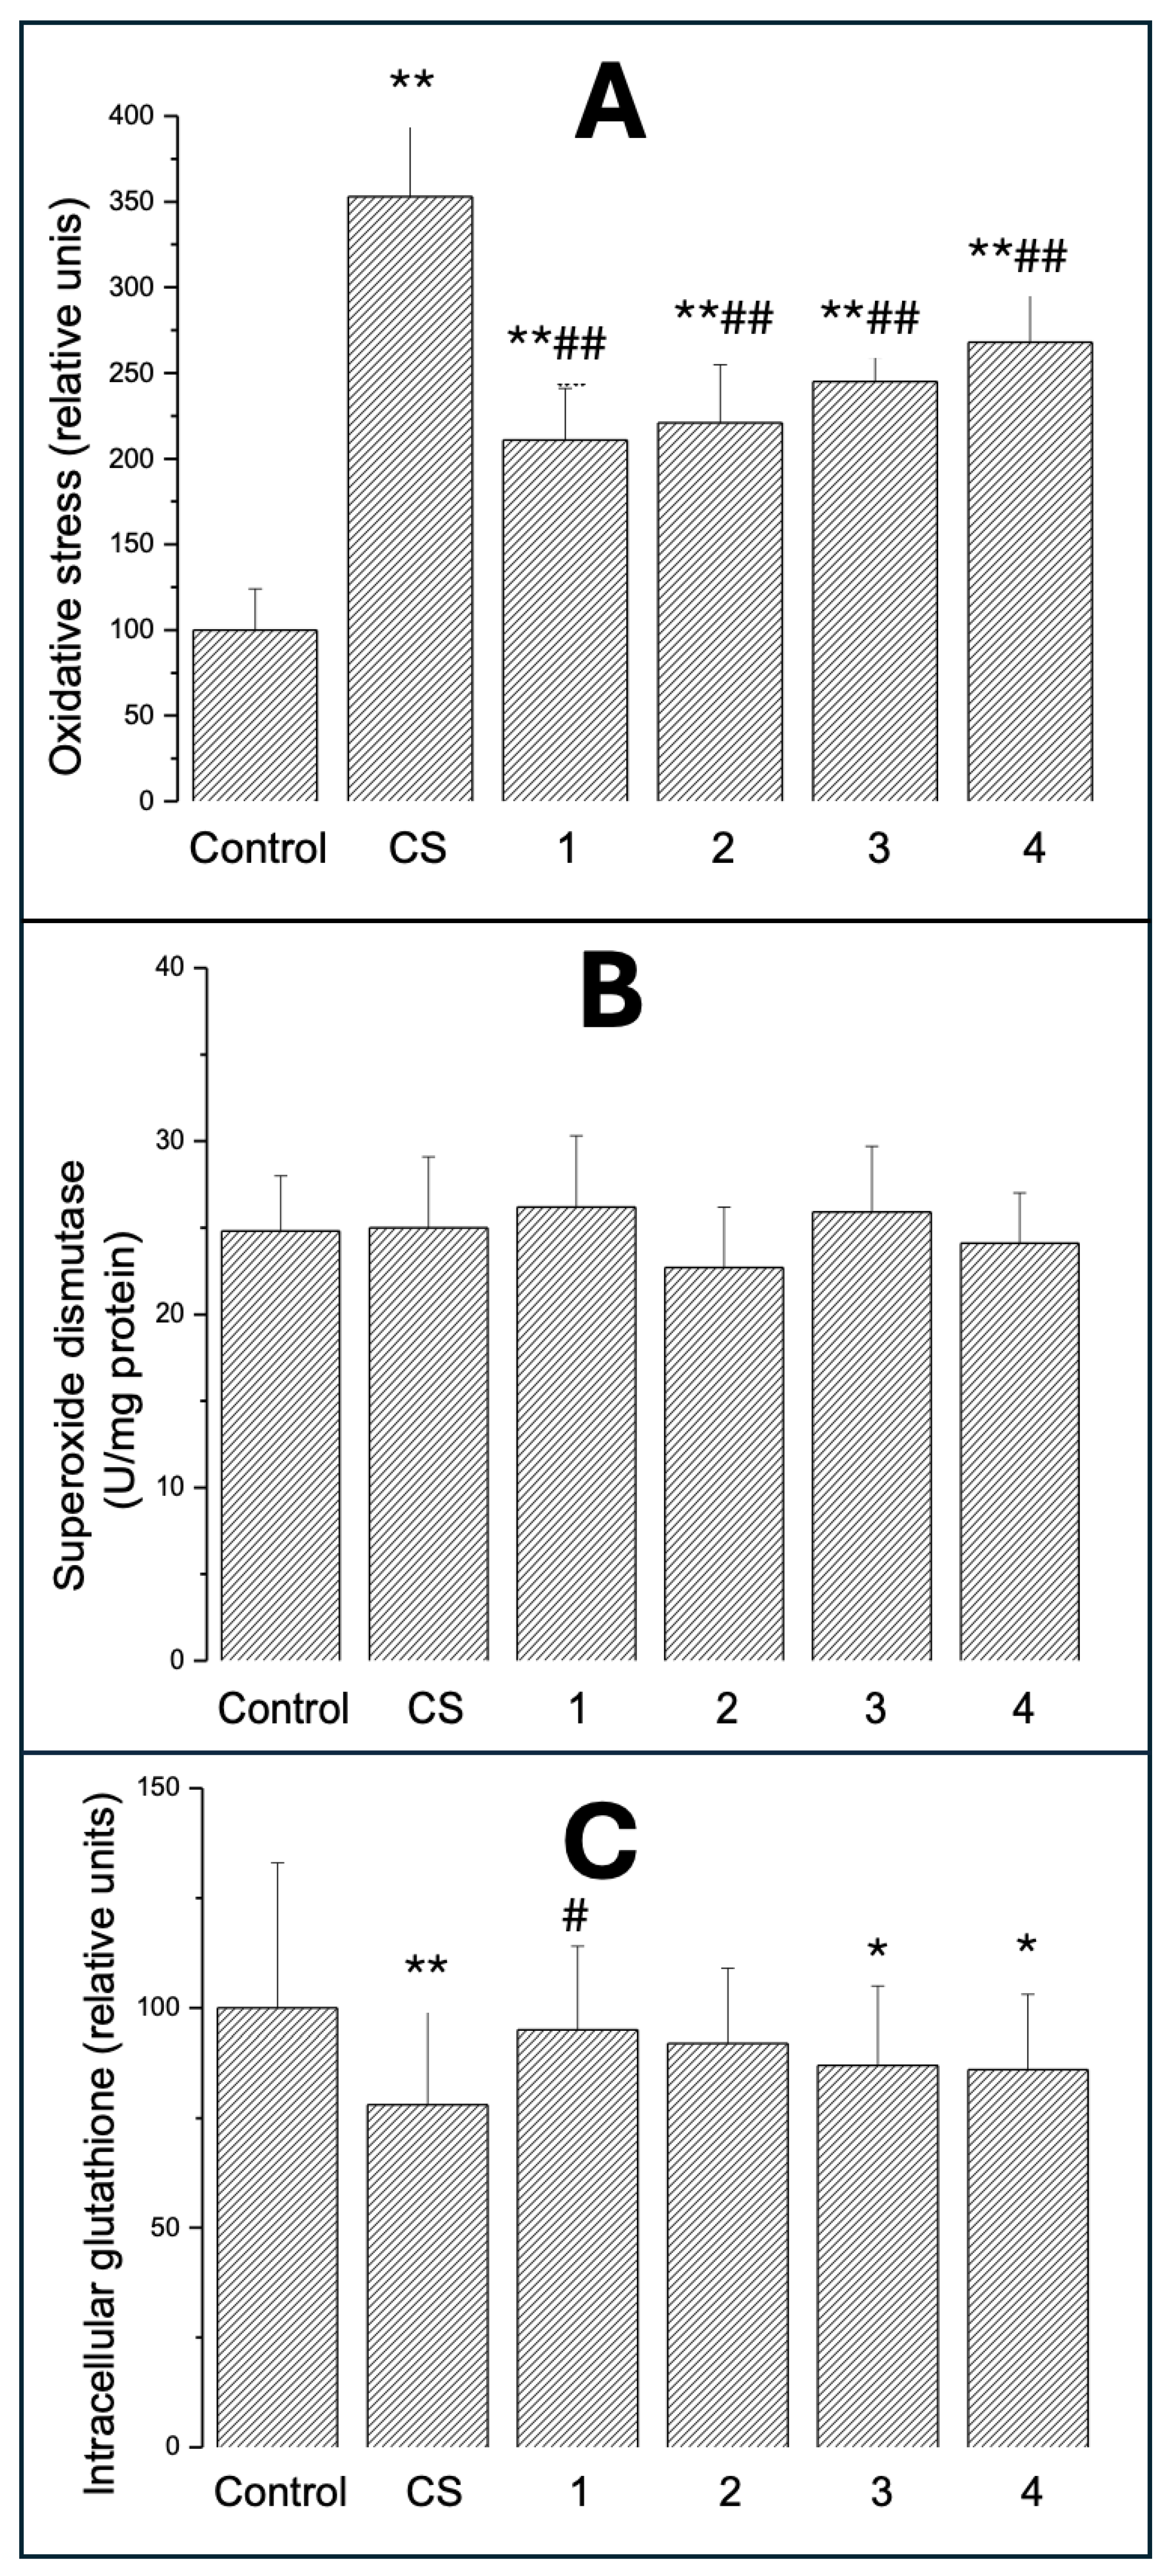
Figure 4.
Intracellular IL-6 (A), TNF- (B) and NF-B (C) in A549 cells exposed for 24 hours to CS and ECE 1-4. All epitopes were measured in fixed and permeabilised cells using specific monoclonal antibodies and flow cytometry detection as described in Materials and Methods. Data are means ± SD of 5-6 assays. *P<0.05; **P<0.01 for comparisons with the corresponding control cells; #P<0.05 for comparisons with the CS-exposed cells.
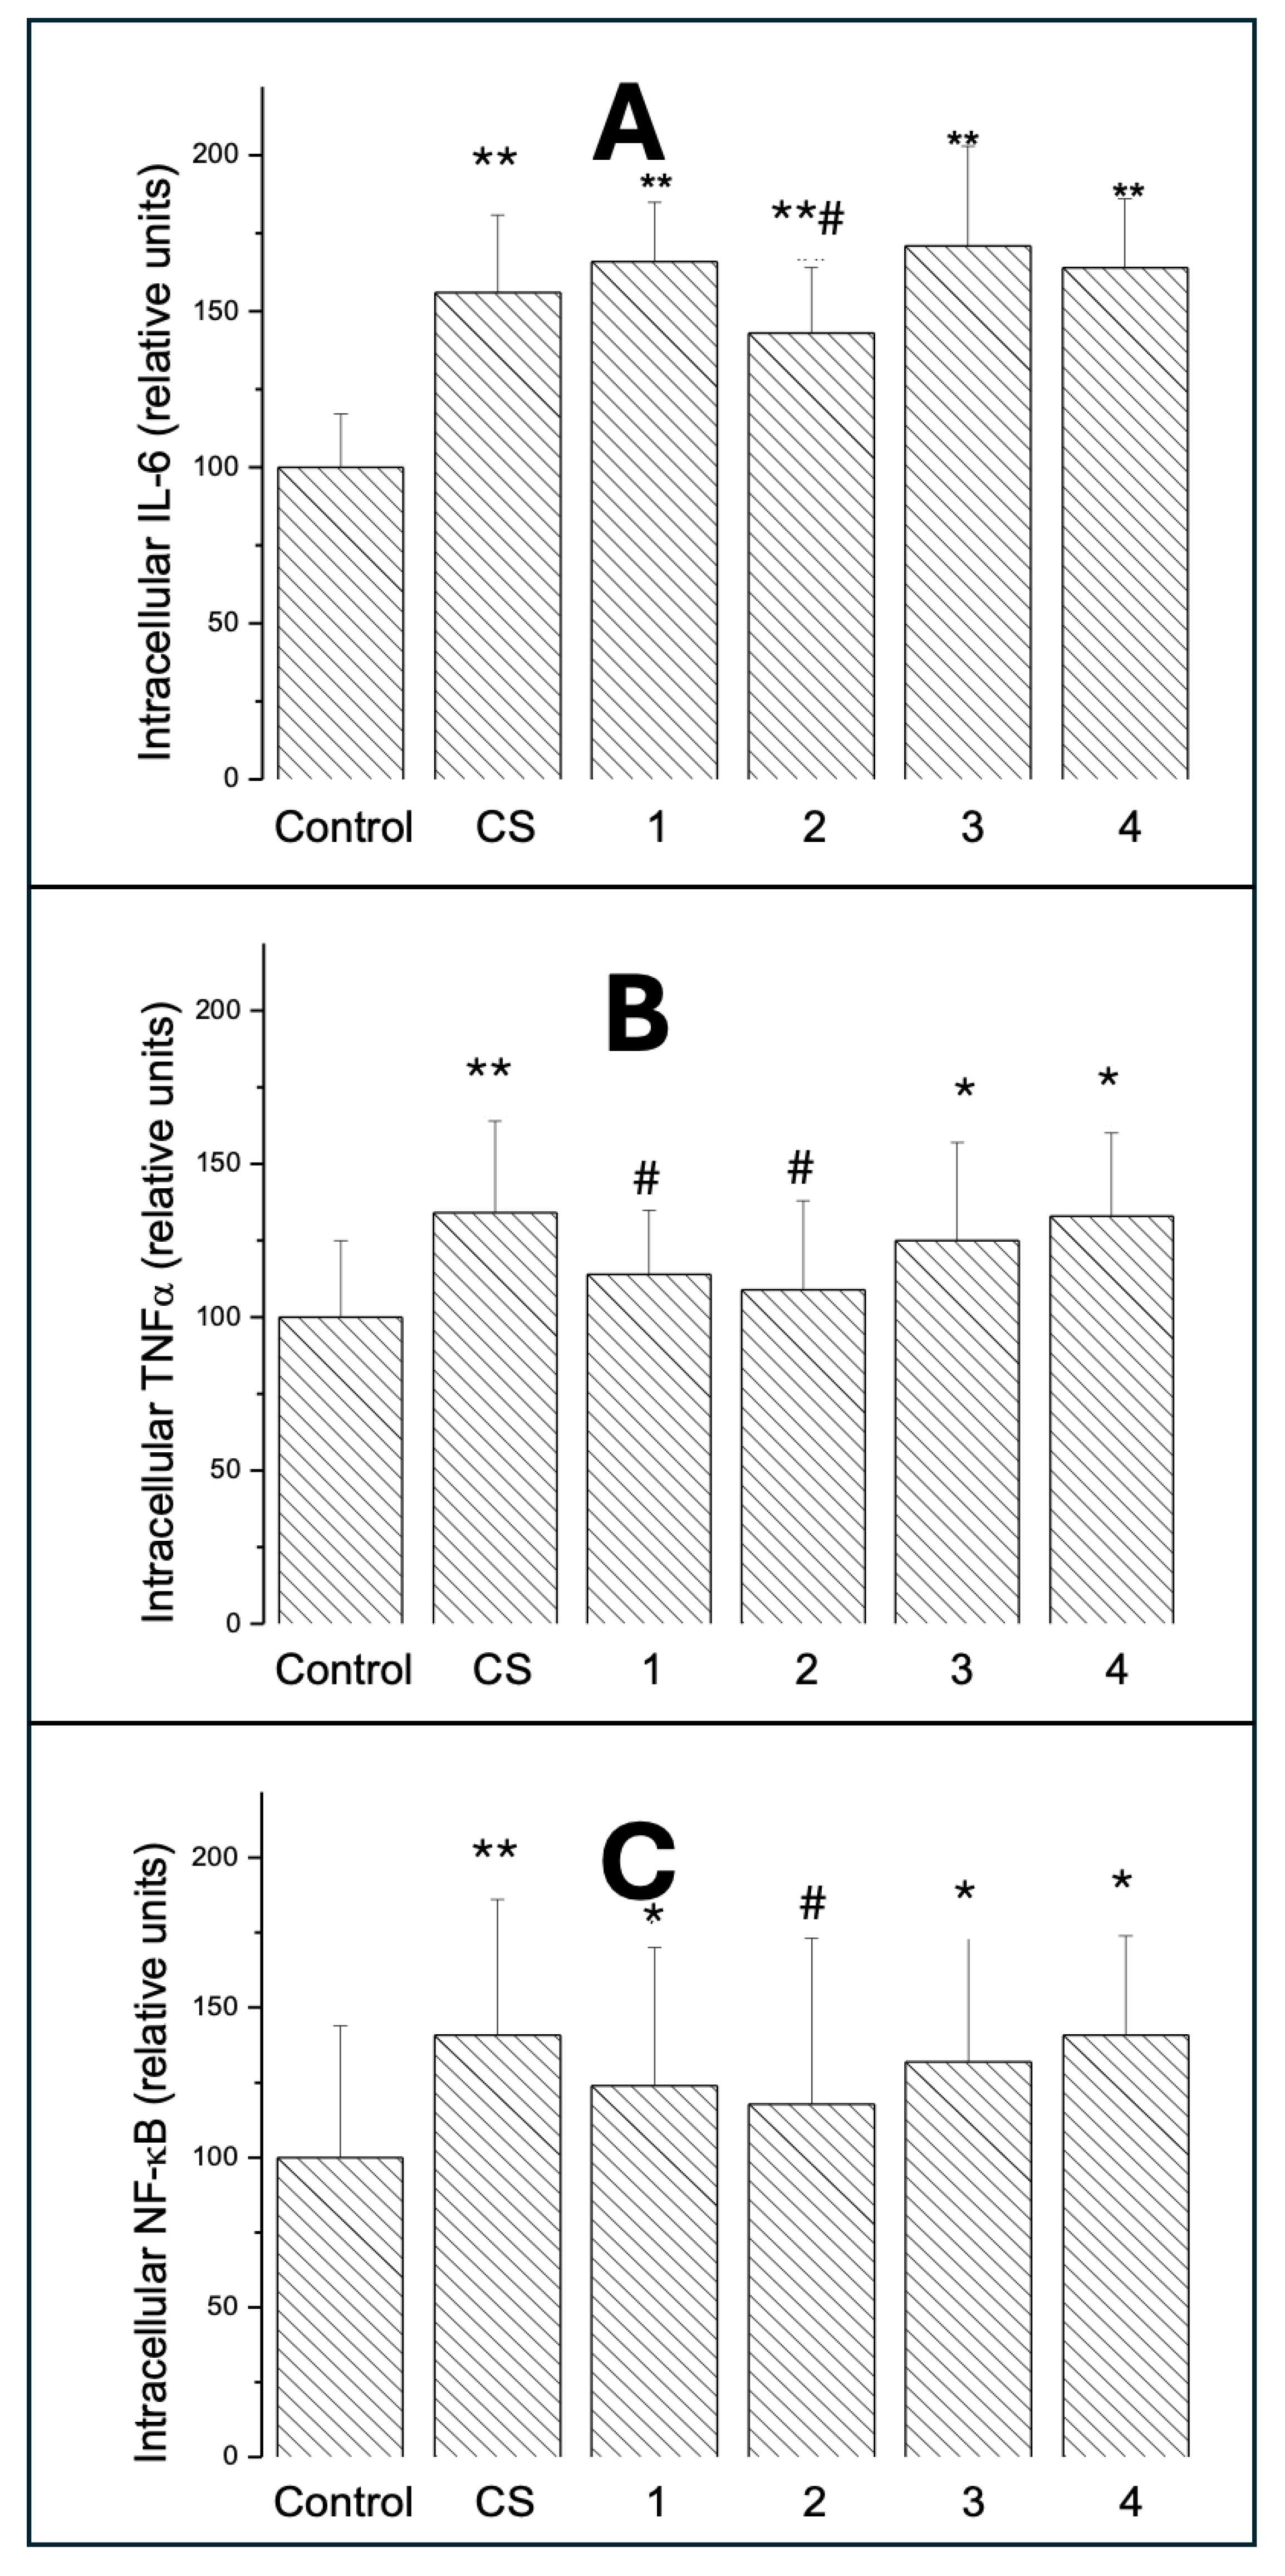
Figure 5.
Representative double fluorescence scatter plots of A549 cells grown with ECE 1-4 or CS-conditioned media for 24 hours. The cells were fixed, permeabilised, stained with a green fluorescent DCFDA for oxidative stress and with red peridinin chlorophyll protein-cyanine 5.5 (PC5.5) for IL-6 and analysed with flow cytometry in scatterplot mode. Scatter area, vector size (distance between the central density point of control cells (A), and the corresponding central density points of ECE 1-4 of cells exposed to ECE 1-4 (B), slopes of central tendency lines (symmetry line from central density point to the highest plot values (C-F are shown.
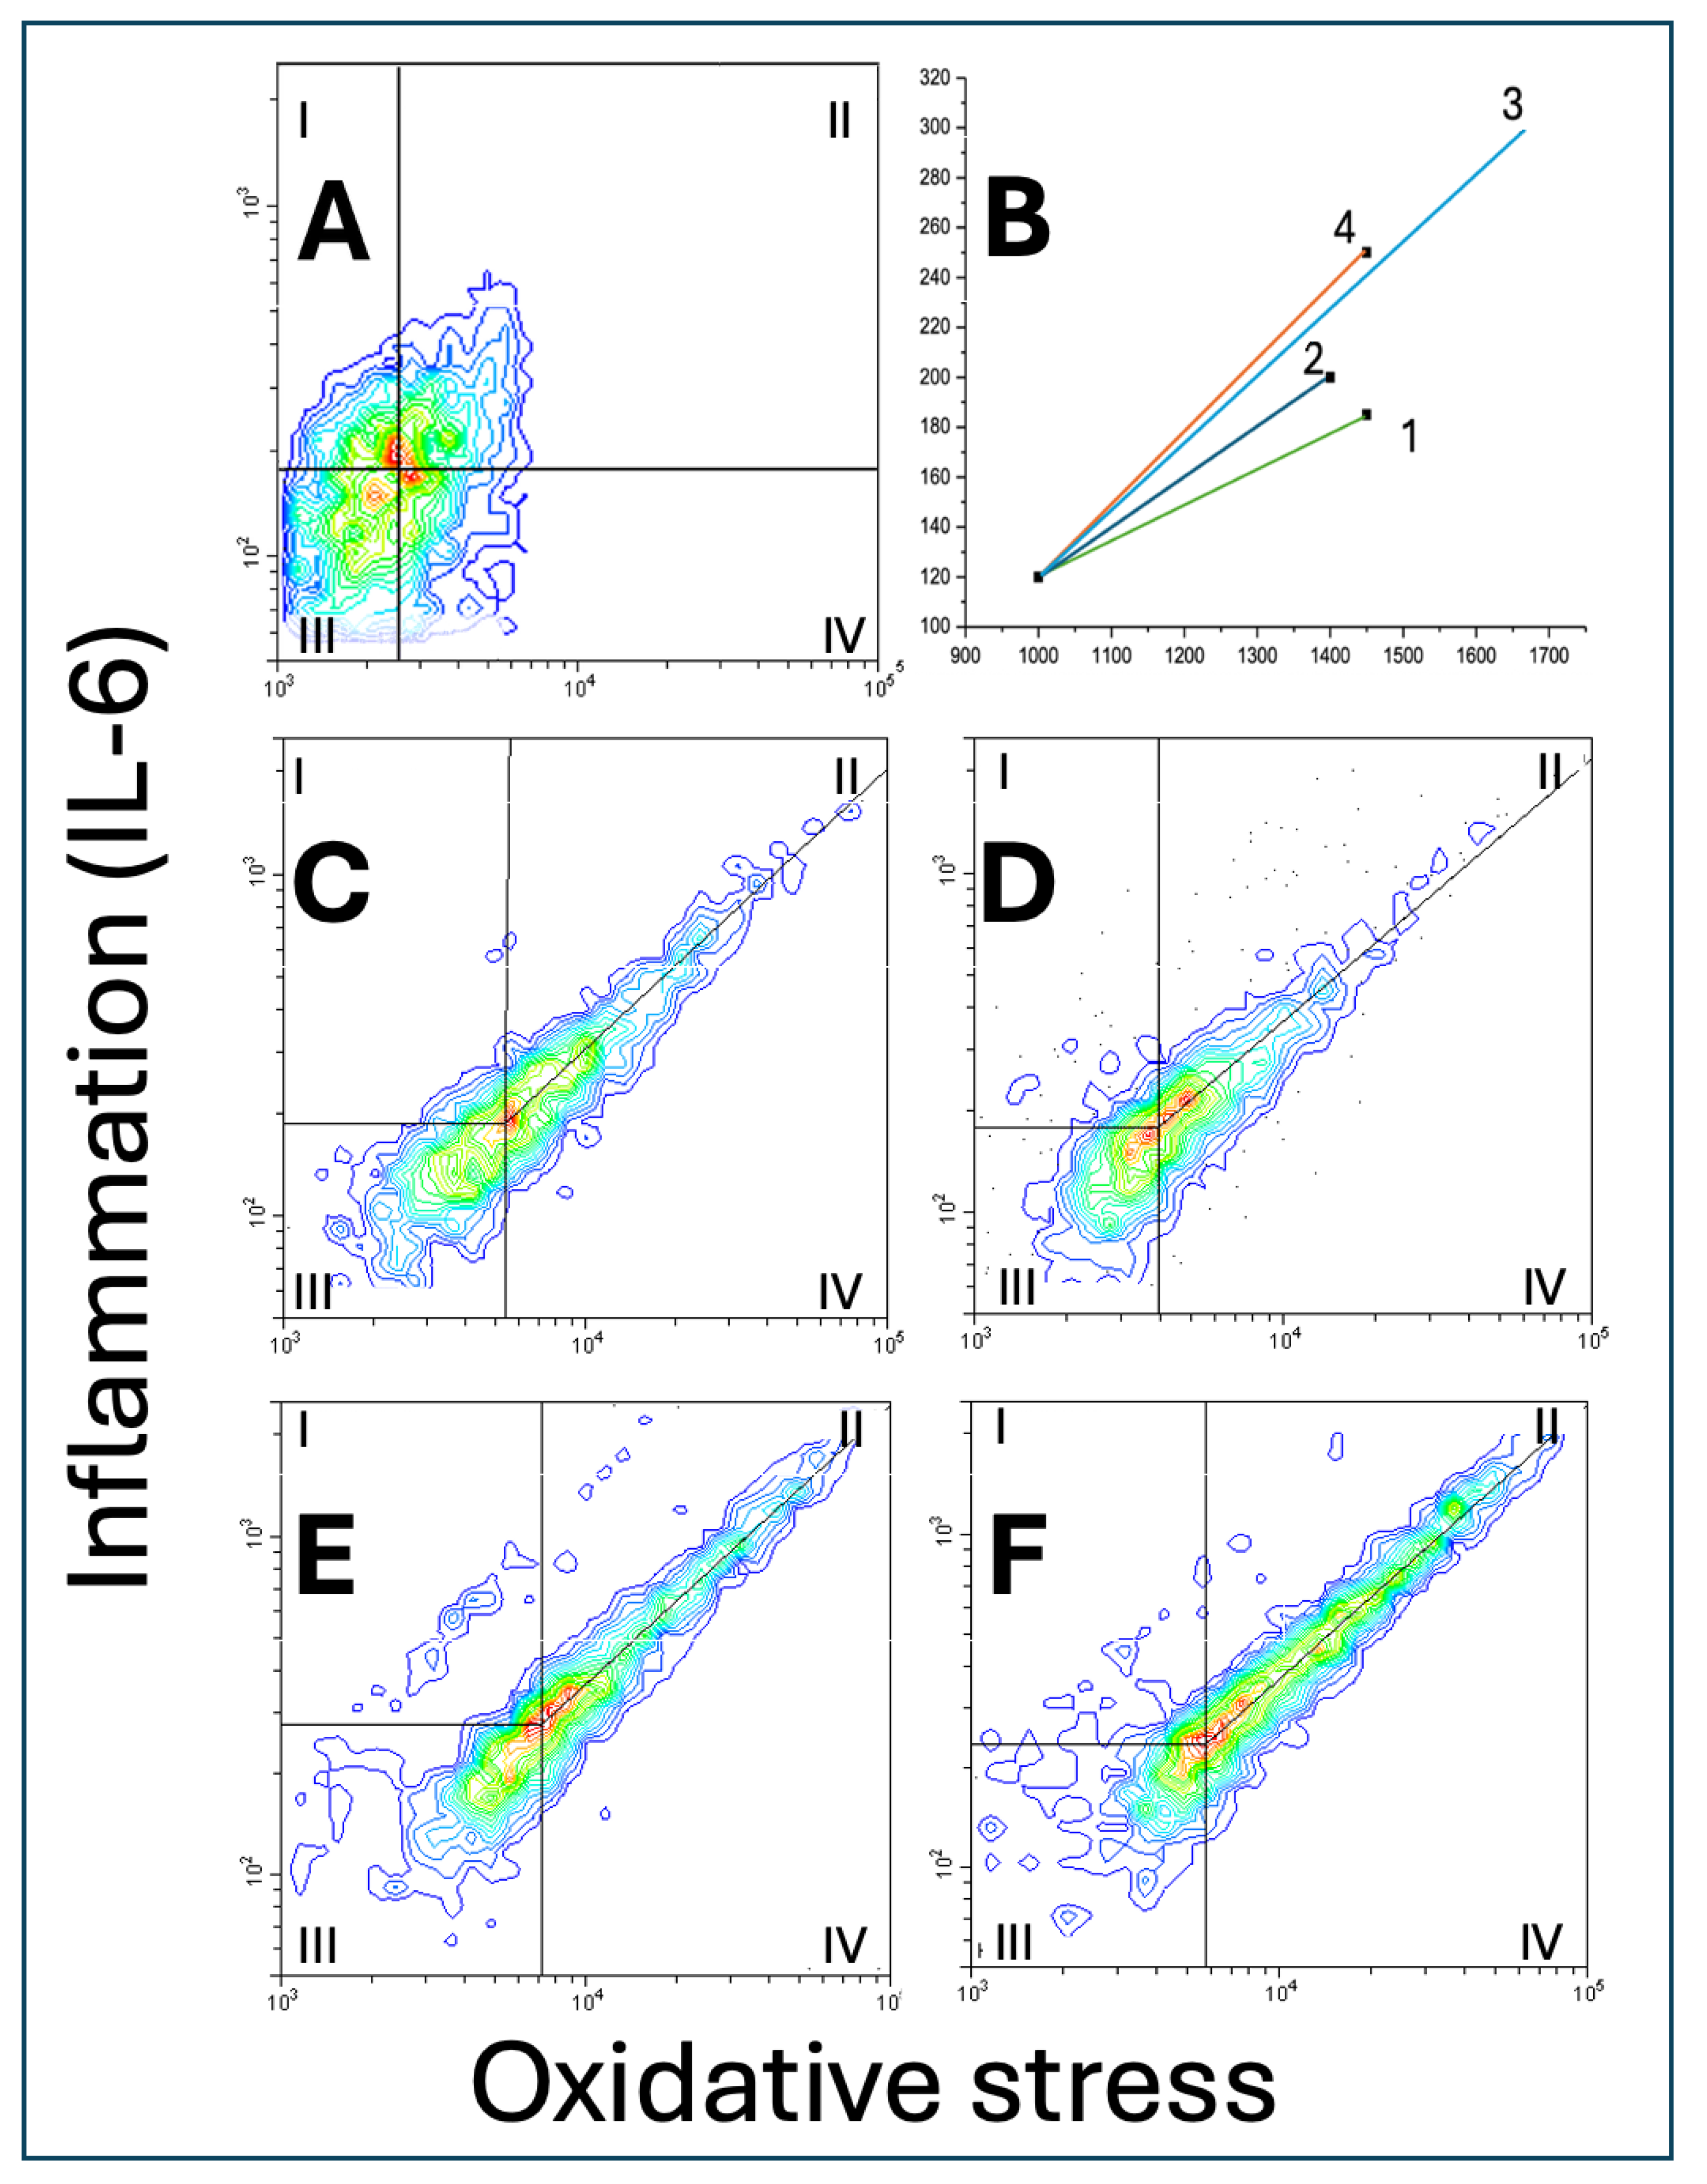

Table 1.
Data from analysis of double fluorescence scatter plots of A549 cells grown with ECE 1-4 or CS-conditioned media for 24 hours and double-stained with a green fluorescent DCFDA for oxidative stress and with red PC5.5 for IL-6 and analysed with flow cytometry in scatterplot mode. .
Table 1.
Data from analysis of double fluorescence scatter plots of A549 cells grown with ECE 1-4 or CS-conditioned media for 24 hours and double-stained with a green fluorescent DCFDA for oxidative stress and with red PC5.5 for IL-6 and analysed with flow cytometry in scatterplot mode. .
| Scatter area, vector size, slope of the central tendency line and distribution of A549 cells on scatterplots of oxidative stress vs. IL-6 | ||||
| (relative units) | ECE 1 | ECE 2 | ECE 3 | ECE 4 |
| Scatter area | 101.1 ± 13.7 | 100.0 ± 9.1 | 110.2 ± 16.4 | 115.4 ± 10.2*^ |
| Vector size | 1.0 ± 0.21 | 1.0 ± 0.19 | 1.83 ± 0.22**^^ | 1.29 ± 0.17*^^## |
| Slope of the central tendency line | 0.90 ± 0.10 | 0.83 ± 0.11 | 0.97 ± 0.12 | 0.90 ± 0.15 |
| Zone I cells | 2.9 ± 0.31 | 3.7 ± 0.35* | 3.5 ± 0.40 | 4.0 ± 0.51** |
| Zone II cells | 8.9 ± 0.43 | 10.3 ± 0.97** | 12.6 ± 0.77**^^ | 17.7 ± 0.61**^^## |
| Zone III cell | 11.2 ± 1.04 | 12.5 ± 0.98 | 12.3 ± 0.87 | 15.4 ± 1.45**^^## |
| Zone IV cells | 77.0 ± 9.4 | 73.5 ± 10.2 | 71.6 ± 9.1 | 62.9 ± 9.7* |
| II/IV ratio | 0.11 ± 0.05 | 0.14 ± 0.04 | 0.18 ± 0.03*^ | 0.28 ± 0.06**^^# |
*P<0.05; **P<0.01 for comparison with the ECE 1. ^P<0.05; ^^ P<0.01 for comparison with the ECE 2 #P<0.05; ##P<0.01 for comparison with the ECE 3.
Disclaimer/Publisher’s Note: The statements, opinions and data contained in all publications are solely those of the individual author(s) and contributor(s) and not of MDPI and/or the editor(s). MDPI and/or the editor(s) disclaim responsibility for any injury to people or property resulting from any ideas, methods, instructions or products referred to in the content. |
© 2025 by the authors. Licensee MDPI, Basel, Switzerland. This article is an open access article distributed under the terms and conditions of the Creative Commons Attribution (CC BY) license (http://creativecommons.org/licenses/by/4.0/).
Copyright: This open access article is published under a Creative Commons CC BY 4.0 license, which permit the free download, distribution, and reuse, provided that the author and preprint are cited in any reuse.


