
Submitted:
20 September 2025
Posted:
23 September 2025
You are already at the latest version
Abstract
Here, we show that the aureolic acid-class antibiotic, olivomycin A, exerts potent anticancer activity in renal cell carcinoma (RCC) by disrupting both cell survival and metastatic programs. In A-498 (wild-type p53) and 786-O (loss-of-function in p53 and PTEN) cells, olivomycin A markedly inhibited migratory capacity and reversed epithelial–mesenchymal transition (EMT), as shown by downregulation of nuclear Snail and the mesenchymal marker N-cadherin, restoration of the epithelial markers, E-cadherin and ZO-1. In parallel, olivomycin A induced apoptosis through distinct p53-dependent mechanisms: In A-498 cells, apoptosis was primarily mediated via the intrinsic pathway, characterized by upregulation of Puma, and Bak, activated caspase-9. In 786-O cells, in contrast, both intrinsic and extrinsic cascades were engaged, as evidenced by caspase-8 activation, Bid truncation, and concurrent mitochondrial involvement. Notably, in p53-mutant 786-O cells, treatment with olivomycin A elicited severe genotoxic stress accompanied by robust DNA damage signaling, excessive reactive oxygen species (ROS) accumulation, and lysosomal activation, culminating in extensive mitochondrial clearance through mitophagy. Such changes were weaker in p53-wild-type A-498 cells, suggesting that the altered p53 context sensitizes RCC cells to olivomycin A-mediated mitochondrial quality control mechanisms. Collectively, our findings delineate a multifaceted mechanism whereby olivomycin A coordinates EMT suppression, apoptotic induction, and mitophagy. Thus, olivomycin A has potential as a therapeutic candidate that can target both survival and metastatic pathways in heterogeneous genetic backgrounds.
Keywords:
apoptosis
; DNA damage
; epithelial–mesenchymal transition (EMT)
; mitophagy
; mitochondrial clearance
; olivomycin A
; renal cell carcinoma (RCC)
1. Introduction
The aureolic acid class of antibiotics includes mithramycin, chromomycin A3, and olivomycin A, and was recognized back in the 1960s as having significant antitumor properties [1,2]. Studies in primary cultures derived from human brain tumors revealed that more than 50% of tumor cells were susceptible to these antibodies [3]. Among the aureolic-class antibiotics, olivomycin A (also known as olivomycin I), produced by Streptomyces olivoreticuli, has attracted particular interest due to its intricate aglycone structure, which includes both a disaccharide and a trisaccharide branch. The primary intracellular target of olivomycin A is DNA, specifically GC-rich regions within the minor groove, where it binds through hydrogen interactions between the chromophore of the antibiotic and the 2-amino group of guanine (G4) in the DNA structure [4,5,6]. The consensus 5’-GG-3’ or 5’-GC-3’ binding sequences for olivomycin A are commonly found in the regulatory segments of genes, which also act as potential recognition sites for transcription factors and are associated with many essential biological pathways [7,8,9,10,11,12]. Given the ability of olivomycin A to bind to DNA in these regions, it is unsurprising that this antibiotic can obstruct polymerase function and block subsequent replication and transcription.
Beyond its ability to bind DNA, olivomycin A may also embody its anticancer properties by directly and/or indirectly acting on cellular protein targets. It has been shown to significantly affect a variety of cellular proteins, including heat shock proteins and transcription factors [11,12,13]. Olivomycin A may interfere with the DNA-dependent enzyme topoisomerase I, and can induce cytotoxicity in murine leukemia and human T lymphoblastic cells at nanomolar concentrations [14,15]. A relatively recent study showed that olivomycin A and its derivative, olivamide, inhibit DNA methyltransferase activity to hinder DNA methylation, which is an essential process in epigenetic regulation [16]. In addition, olivomycin A suppresses p53-dependent transcription and promotes apoptosis in human tumor cells [17]. While the tumor suppressor p53 is well-known for its involvement in cell cycle regulation, apoptosis, and DNA repair, knowledge remains limited beyond the context of olivomycin A-inhibited, p53-dependent apoptosis. The ability of olivomycin A to modulate p53 could be crucial for its anticancer effects. However, the detailed molecular mechanisms underlying these effects, particularly the impact of olivomycin A on p53 modulation and downstream signaling, remain inadequately explored. Here, we aimed to address this research gap.
To this end, we employed two human renal cell carcinoma cell lines, A-498 cells expressing wild-type p53 and 786-O cells carrying loss-of-function mutant p53 and the phosphatase and tensin homolog (PTEN) genes [18]. We aimed to investigate the mechanism underlying the anticancer activity of olivomycin A in these genetically distinct backgrounds. Our results revealed that the antibiotic triggered apoptosis through p53-dependent mechanisms, activating the intrinsic pathway in A-498 cells and engaging both intrinsic and extrinsic cascades in 786-O cells. Notably, olivomycin A induced more pronounced DNA damage and promoted extensive mitochondrial loss via mitophagy in the p53-mutated background. Together, our findings identify olivomycin A as a promising therapeutic candidate that suppresses EMT and enforces mitochondrial quality control to inhibit the growth of renal cancer cells.
2. Materials and Methods
2.1. Chemistry
Olivomycin A was produced by Streptoverticillum cinnamoneum at the pilot facility of Gause Institute of New Antibiotics (Moscow, Russia). The compound was purified to 95% purity, as confirmed by reverse-phase HPLC [15].
2.2. Cell Culture and Reagents
Anti-Snail, anti-N-cadherin, anti-ZO-1, anti-VCAM-1, anti-FLIP, anti-caspase 8, anti-Bid, anti-Puma, anti-Bak, anti-Bcl-2, anti-caspase 9, anti-PARP, anti-phospho-p53, anti-phospho-Histone H2A.X, anti-PINK1, and anti-Parkin were from Cell Signaling Technology, Inc. (Beverly, MA, USA). The anti-E-cadherin antibody was from Servicebio (Hubei, China). Anti-cytochrome c antibody was purchased from Santa Cruz Biotechnology, Inc. (Santa Cruz, CA, USA). Other chemicals were from Sigma-Aldrich Corporation (St. Louis, MO, USA). Anti-β-actin antibody was from Millipore Corp. (Temecula, CA, USA). Other chemicals were from Sigma-Aldrich Corporation (St. Louis, MO, USA).
A-498 human kidney carcinoma cells (derived from kidney tissues) were cultured in Minimum Essential Medium (MEM) supplemented with 0.1 mM non-essential amino acids and 1.0 mM sodium pyruvate. 786-O human primary renal cell adenocarcinoma cells were cultured in Roswell Park Memorial Institute (RPMI) medium containing 4.5 g/L glucose, 10 mM HEPES, and 1.0 mM sodium pyruvate. All media were supplemented with 10% fetal bovine serum (FBS), 100U/ml penicillin, and 50 µg/ml streptomycin. Cells were maintained at 37°C in a humidified incubator with 5% CO2 and 95% air.
2.3. Wound Healing Assays
Cell migration was evaluated using a two-well culture insert. Inserts were placed in six-well plates, and 100 µl of cell suspension was added to each well at densities of 7.5 × 10⁴ A498 cells or 5.5 × 10⁴ 786-O cells. After incubation at 37 °C with 5% CO2 for 16 h to allow attachment, 1 ml of fresh medium was added to the surrounding well area, and inserts were carefully removed to create a cell-free gap. Images of the initial wound area (0 h) were acquired immediately after the insert removal. Cells were then treated with olivomycin A and incubated for 8 h under the same culture conditions, followed by image acquisition to document cell migration into the wound area. Wound closure was quantified using ImageJ software, with the wound area at 0 h defined as 100%. The remaining wound area after 8 h was expressed as a percentage, with smaller residual wound areas indicating greater migratory activity.
2.4. Transwell Assay
The integrity of the transwell inserts was verified by adding 300 µl PBS the day before the experiment to check for leakage. After 24 h of Olivomycin A treatment, 2 × 10⁴ cells suspended in 200 µl serum-free medium were seeded into the upper chamber and allowed to adhere to the membrane for 20 min at 37 °C in 5% CO2. The lower chamber was then filled with 600 µl medium containing 10% FBS as a chemoattractant, and cells were incubated for an additional 24 h. Following incubation, the medium was removed from both chambers, and cells were washed twice with PBS and fixed with 100% methanol (200 µl in the upper chamber, 600 µl in the lower chamber) for 10 min. After two washes with PBS, cells were stained overnight at room temperature with Giemsa solution diluted 1:10 in ddH2O (200 µl upper chamber, 600 µl lower chamber). The next day, the stain was removed, membranes were washed with ddH2O and soaked for ~2 h, air-dried, and imaged under a light microscope. Migrated cells were quantified using ImageJ software.
2.5. Cell Impedance Measurements
Cell proliferation was monitored using the xCELLigence Real-Time Cell Analysis (RTCA) (Roche, Mannheim, Germany) according to the manufacturer’s instructions. Experimental parameters, including E-Plate identification, cell line, seeding density, and drug treatment conditions, were first configured in the RTCA software. Each well of the E-Plate was filled with 75 µl of fresh culture medium, avoiding bubble formation, and the plate was placed in the instrument for background impedance measurement. Subsequently, 75 µl of culture medium containing 4,000 786-O cells was added to each well (final volume, 150 µl), taking care to prevent bubbles and to avoid disturbing the microelectrode surface. After gentle mixing, the E-Plate was inserted into the RTCA instrument and incubated at 37 °C with 5% CO2 for 16 h to allow cell attachment. Drug treatment was carried out by pausing the RTCA software and carefully aspirating 75 µl of supernatant from each well without disturbing adherent cells. An equal volume (75 µl) of fresh medium containing olivomycin A at the indicated concentrations was then added. Plates were gently mixed, returned to the RTCA instrument, and continuously monitored for impedance-based cell index measurements.
2.6. Colony-Forming Assay
Cells were seeded into six-well plates at a density of 1,200 A498 cells or 500 786-O cells per well in 2 ml of fresh culture medium and incubated at 37 °C in 5% CO2 for 48 h to allow attachment. Afterward, the medium was replaced with 3 ml of fresh culture medium containing olivomycin A at the indicated concentrations, and cells were cultured for an additional 9 days with medium changes every 3 days. At the end of treatment, colonies were washed twice with PBS, fixed with 100% methanol for 10 min, and stained with 0.05% crystal violet for 1–3 min. Excess dye was removed by rinsing with ddH2O until the background was clear, and plates were air-dried before scanning. Colony formation was quantified using ImageJ software, and results were expressed as the relative colony area per well.
2.7. Apoptosis Determination
Cells were seeded in six-well plates at a density of 3 × 10⁵ A498 cells or 2.5 × 10⁵ 786-O cells per well in 2 ml of fresh culture medium and incubated at 37 °C in 5% CO2 for 16 h to allow attachment. Cells were then treated with olivomycin A at the indicated concentrations, while 0.03% H2O2 was used as a positive control (PC), and incubated for 24 h. After treatment, culture supernatants were collected, cells were washed once with 1 ml PBS, detached with trypsin, and harvested by centrifugation (1,000 rpm, 1 min). Pellets were washed with PBS, transferred to 1.5 ml tubes, and centrifuged again (2,000 rpm, 3 min). PC samples were divided into three groups for Annexin V single staining, PI single staining, or Annexin V/PI double staining, while all other groups were subjected to double staining. For staining, 10× Annexin V binding buffer was diluted to 1×, and dyes were diluted 1:1000 in 1× buffer. Cells were resuspended in 500 µl staining solution and incubated for 20 min at room temperature in the dark. After gentle resuspension and filtration through a cell strainer to avoid clogging, samples were analyzed on a flow cytometer using Annexin V-FITC and PI channels. Unstained cells served as negative controls to define gating, followed by compensation using single-stained samples. Apoptosis was quantified as the percentage of Annexin V-positive and/or PI-positive cells using a Beckman Coulter CytoFLEX LX flow cytometer (Brea, CA, USA).
2.8. Measurement of Senescence-Associated β-Galactosidase Activity
Cells were seeded on sterilized coverslips placed in 6-well plates at a density of 2 × 10⁵ A-498 cells or 1 × 10⁵ 786-O cells per well and cultured overnight at 37 °C in a humidified incubator with 5% CO2 to allow attachment. Cells were then treated with olivomycin A at the indicated concentrations for 72 h. After treatment, cells were washed with PBS and fixed with 1× Fixative Solution (prepared in ddH2O) for 15 min at room temperature. For senescence detection, cells were incubated with freshly prepared β-galactosidase staining solution (1× Staining Solution supplemented with 100× Solution A, 100× Solution B, and 1 mg/ml X-gal solution) and placed in a dry incubator at 37°C overnight without CO2. Stained cells were examined and imaged under a light microscope.
2.9. Measurement of Cellular Reactive Oxygen Species (ROS)
Oxidative stress was assessed by detecting intracellular hydrogen peroxide using 5-(and-6)-carboxy-2’,7’-dichlorodihydrofluorescein diacetate (carboxy-H2DCFDA). This nonpolar, cell-permeable dye is hydrolyzed by intracellular esterases to form the nonfluorescent H2-DCF, which is subsequently oxidized by peroxides to yield the highly fluorescent DCF. For staining, sterilized coverslips were placed into 24-well plates containing 1 ml of fresh medium, and cells were seeded at a density of 2.5 × 10⁴ cells per well. After overnight incubation at 37 °C with 5% CO2 to allow attachment, cells were washed once with 1 ml of PBS and once with 0.5 ml of 1× buffer (diluted in ddH2O), followed by incubation with 0.5 ml of 1× buffer containing the indicated concentrations of olivomycin A. After 15 min of drug exposure, cells were stained with 4 µM DCFDA for 45 min at 37 °C in 5% CO2 under light-protected conditions. Cells were washed twice with 1× buffer before imaging, and coverslips were inverted onto glass slides for fluorescence microscopy. Fluorescence images were acquired using an excitation/emission setting of 488/535 nm.
2.10. Immunofluorescence Staining
Cells were seeded on sterilized coverslips placed in 24-well plates (2.2 × 10⁴ A498 cells or 2.0 × 10⁴ 786-O cells per well) and cultured overnight at 37 °C with 5% CO2 to allow attachment, followed by treatment with olivomycin A at the indicated concentrations. For live-cell staining, cells were incubated with 20 nM MitoTracker Green for 30 min or 50 nM LysoTracker Red for 5 min at 37 °C in the dark. After washing with PBS, cells were fixed with 4% paraformaldehyde for 15 min, permeabilized with 0.1% Triton X-100 for 10 min, and blocked with buffer containing 10% FBS and 3% BSA for 1 h at room temperature. Primary antibodies, diluted in blocking buffer according to manufacturer recommendations, were applied for 1 h, followed by fluorophore-conjugated secondary antibodies (1:500) for an additional 1 h. Nuclei were counterstained with 1 µg/ml DAPI for 5 min. Coverslips were mounted on glass slides with mounting medium, edges sealed with nail polish, and stored at 4 °C in the dark until confocal fluorescence microscopy.
2.11. Western Blot Analysis
Cell extracts were prepared in lysis buffer containing 20 mM Tris-HCl (pH 7.4), 100 mM NaCl, 5mM EDTA, 2 mM phenylmethylsulfonyl fluoride (PMSF), 10 ng/ml leupeptin, and 10 μg/ml aprotinin. Protein concentrations were determined, and equal amounts of protein (40 µg per sample) were separated by SDS-PAGE and transferred onto nitrocellulose membranes (Schleicher & Schuell, Keene, NH, USA). Membranes were blocked with nonfat milk solution for 30 min, washed, and incubated with primary antibody. After washing with Tris-buffered saline containing 0.1% Tween 20 (TBS) to remove unbound antibody, membranes were incubated with horseradish peroxidase (HRP)-conjugated secondary antibody for 2 h. Bound antibodies were visualized using enhanced chemiluminescence (ECL) detection reagents (Amersham Biosciences, Piscataway, NJ, USA).
2.12. Statistics
All data are presented as the mean ± standard deviation (SD) from at least three independent experiments. Comparisons between groups were performed using one-way analysis of variance (ANOVA) followed by an appropriate post hoc test. Differences were considered statistically significant at p < 0.05.
3. Results
3.1. Olivomycin A Induces Antiproliferative Effects and Cellular Senescence in Renal Cancer Cells
The utilized olivomycin A was produced by Streptoverticillum cinnamomeum at the pilot production line of the Gause Institute of New Antibiotics in Moscow (Figure 1).
To explore whether olivomycin A exhibits anticancer activities against kidney cancer cells and the potential impact of p53 in the system, we employed two human renal cell carcinoma cell lines: A-498 cells, which carry wild-type p53, and 786-O cells, which harbor mutant p53 and PTEN genes. First, we assessed the long-term effect of olivomycin A on renal cancer cell proliferation using a colony-forming assay. The results showed that the antibiotic markedly reduced the colony numbers in both cell lines, with a significant inhibitory effect observed starting at 10 nM for A-498 cells (Figure 2A) and 1 nM for 786-O cells (Figure 2B). The apparent antiproliferative effect was further validated by performing real-time cell impedance measurements with an xCELLigence system, which continuously tracks cell growth based on electronic impedance. Consistent with the results of our colony formation assays, the cell impedance measurements showed that olivomycin A markedly attenuated the proliferation of 786-O cells. At 10 nM, a transient proliferative effect was observed, but this was overridden at higher concentrations, with robust growth inhibition evident at 50 and 100 nM in these p53-mutated cells (Figure 2C). In contrast, due to the irregular growth pattern of p53-wild-type A-498 cells, we were unable to establish a reproducible olivomycin A-responsive proliferation profile in this cell line. Moreover, our data indicated that olivomycin A exposure induced cellular senescence in both cell lines, as demonstrated by increased senescence-associated β-galactosidase (SA-β-gal) staining, reflecting a permanent state of growth arrest (Figure 2D).
3.2. Olivomycin A Suppresses Renal Cancer Cell Migration by Modulating EMT Markers
Having established that olivomycin A exerts an antiproliferative effect on renal cancer cells, we next investigated whether it also impacts their migratory capacity. Wound healing assays revealed that 100 nM olivomycin A significantly suppressed migration in both A-498 cells (Figure 3A) and 786-O cells (Figure 3B). This inhibitory effect was further validated using Boyden transwell assays, which showed pronounced migration suppression at concentrations as low as 10 nM for A-498 cells (Figure 3C) and 50 nM for 786-O cells (Figure 3D).
Mechanistically, this reduction in migratory ability was associated with decreases in the nuclear localization (Figure 4A) and total protein levels of the transcription factor Snail (Figure 4B), which is a key driver of EMT. In A498 cells, olivomycin A significantly downregulated the mesenchymal marker, N-cadherin, while upregulating the epithelial markers, E-cadherin, and ZO-1 (Figure 4C). 786-O cells showed more modest induction of E-cadherin and ZO-1, but a notable suppression of N-cadherin similar to that seen in A-498 cells (Figure 4D). Because EMT not only enhances motility but also facilitates tumor-endothelial interactions critical for intravasation, we next examined the adhesion molecule vascular cell adhesion molecule-1 (VCAM-1). The expression of VCAM-1 was notably decreased in both cell lines following treatment with 50 nM olivomycin A (Figure 4E), suggesting that olivomycin A-treated cells may exhibit impaired adhesion capacity during intravasation. Collectively, these results demonstrate that olivomycin A suppresses renal cancer cell migration by modulating EMT-related proteins—downregulating Snail and N-cadherin while enhancing E-cadherin and ZO-1—thereby reinforcing epithelial characteristics and limiting invasive potential.
3.3. Olivomycin A Induces Cell Line-Specific Apoptotic Pathways in Renal Cancer Cells
To further elucidate the molecular events underlying olivomycin A-induced cell proliferation inhibition, we explored the cell death pathway and related signaling mechanisms. Since olivomycin A has been reported to induce apoptosis in cancer cells [13,15,17], we employed Annexin V staining and flow cytometry to analyze the apoptotic populations in our experimental system. Our results showed that olivomycin A effectively induced apoptosis at 1 μM in A-498 and at 50 nM in 786-O cells (Figure 5A). To clarify the apoptotic pathways contributing to this olivomycin A-mediated growth inhibition, we conducted protein expression analysis. In A498 cells, both isoforms of the antiapoptotic protein, FLIP, were significantly downregulated by olivomycin A; however, this was not accompanied by caspase-8 activation or Bid truncation. Instead, we observed upregulation of Puma, Bak, and activated caspase-9 (Figure 5B top panel). These results indicate that olivomycin A activated the intrinsic apoptotic pathway in A-498 cells. By contrast, both extrinsic and intrinsic pathways were activated in 786-O cells, as evidenced by: downregulation of FLIP, upregulation of activated caspase-8, truncated Bid, Puma, and Bak; and downregulation of the antiapoptotic protein, Bcl-2, leading to caspase-9 activation and PARP cleavage (Figure 5B bottom panel). We further examined cytochrome c localization and found that, consistent with the flow cytometry data (Figure 5A), olivomycin A promoted its release from mitochondria into cytoplasm, with a more pronounced effect in 786-O than that in A498 cells, consistent with the flow cytometry data (Figure 5C). Collectively, these findings indicate that olivomycin A triggers apoptosis in renal cancer cells through distinct mechanisms—predominantly via intrinsic pathways with possible non-apoptotic contributions in A498 cells, versus combined intrinsic and extrinsic cascades in 786-O cells—thereby contributing to its cancer cell growth inhibiting effects.
3.4. Olivomycin A Induces Mitochondrial Stress and Mitophagy Through PINK1 Signaling in Renal Cancer Cells with Mutant p53
Given the significant mitochondrial loss observed in 786-O cells exposed to 100 nM olivomycin A?which harbor mutated p53?but not A-498 cells carrying wild-type p53 (Figure 5C), we sought to determine whether p53 functionality contributes to these differential responses. Although the levels of phosphorylated p53 was increased by olivomycin A exposure in both cell lines (Figure 6A), phosphorylated H2AX was markedly upregulated only in 786-O cells (Figure 6B).
This indicated that 50 nM olivomycin A treatment triggered severe DNA damage in the mutant, but not wild-type, p53 background. This extensive DNA damage was also accompanied by a more pronounced elevation of reactive oxygen species (ROS) following treatment with 10 nM olivomycin A in 786-O cells compared with A-498 cells (Figure 7A). Consistently, Lysotracker staining revealed that olivomycin A treatment substantially increased lysosomal activity in 786-O cells, whereas the effect was comparatively modest in A-498 cells (Figure 7B). This suggests activation of the autophagic-lysosomal pathway, which could underlie the reduced in mitochondrial content of olivomycin A-treated p53-mutant cells, that was evidenced by a marked reduction in green fluorescence intensity (Figure 7B). To further clarify the contribution of ROS to this mitochondria depletion, we employed the antioxidant N-acetylcysteine (NAC). Our results revealed that NAC pretreatment effectively reversed olivomycin A-induced lysosomal activation in both A-498 and 786-O cells (Figure 7C). Importantly, inhibition of ROS markedly prevented olivomycin A-induced mitochondrial clearance in 786-O cells, indicating that ROS critically drives the removal of mitochondria in the p53-mutant background. The decline in mitochondrial content, which is a hallmark of mitochondrial dysfunction, supports the notion that olivomycin A induces mitochondrial stress preferentially in p53-mutant cells.
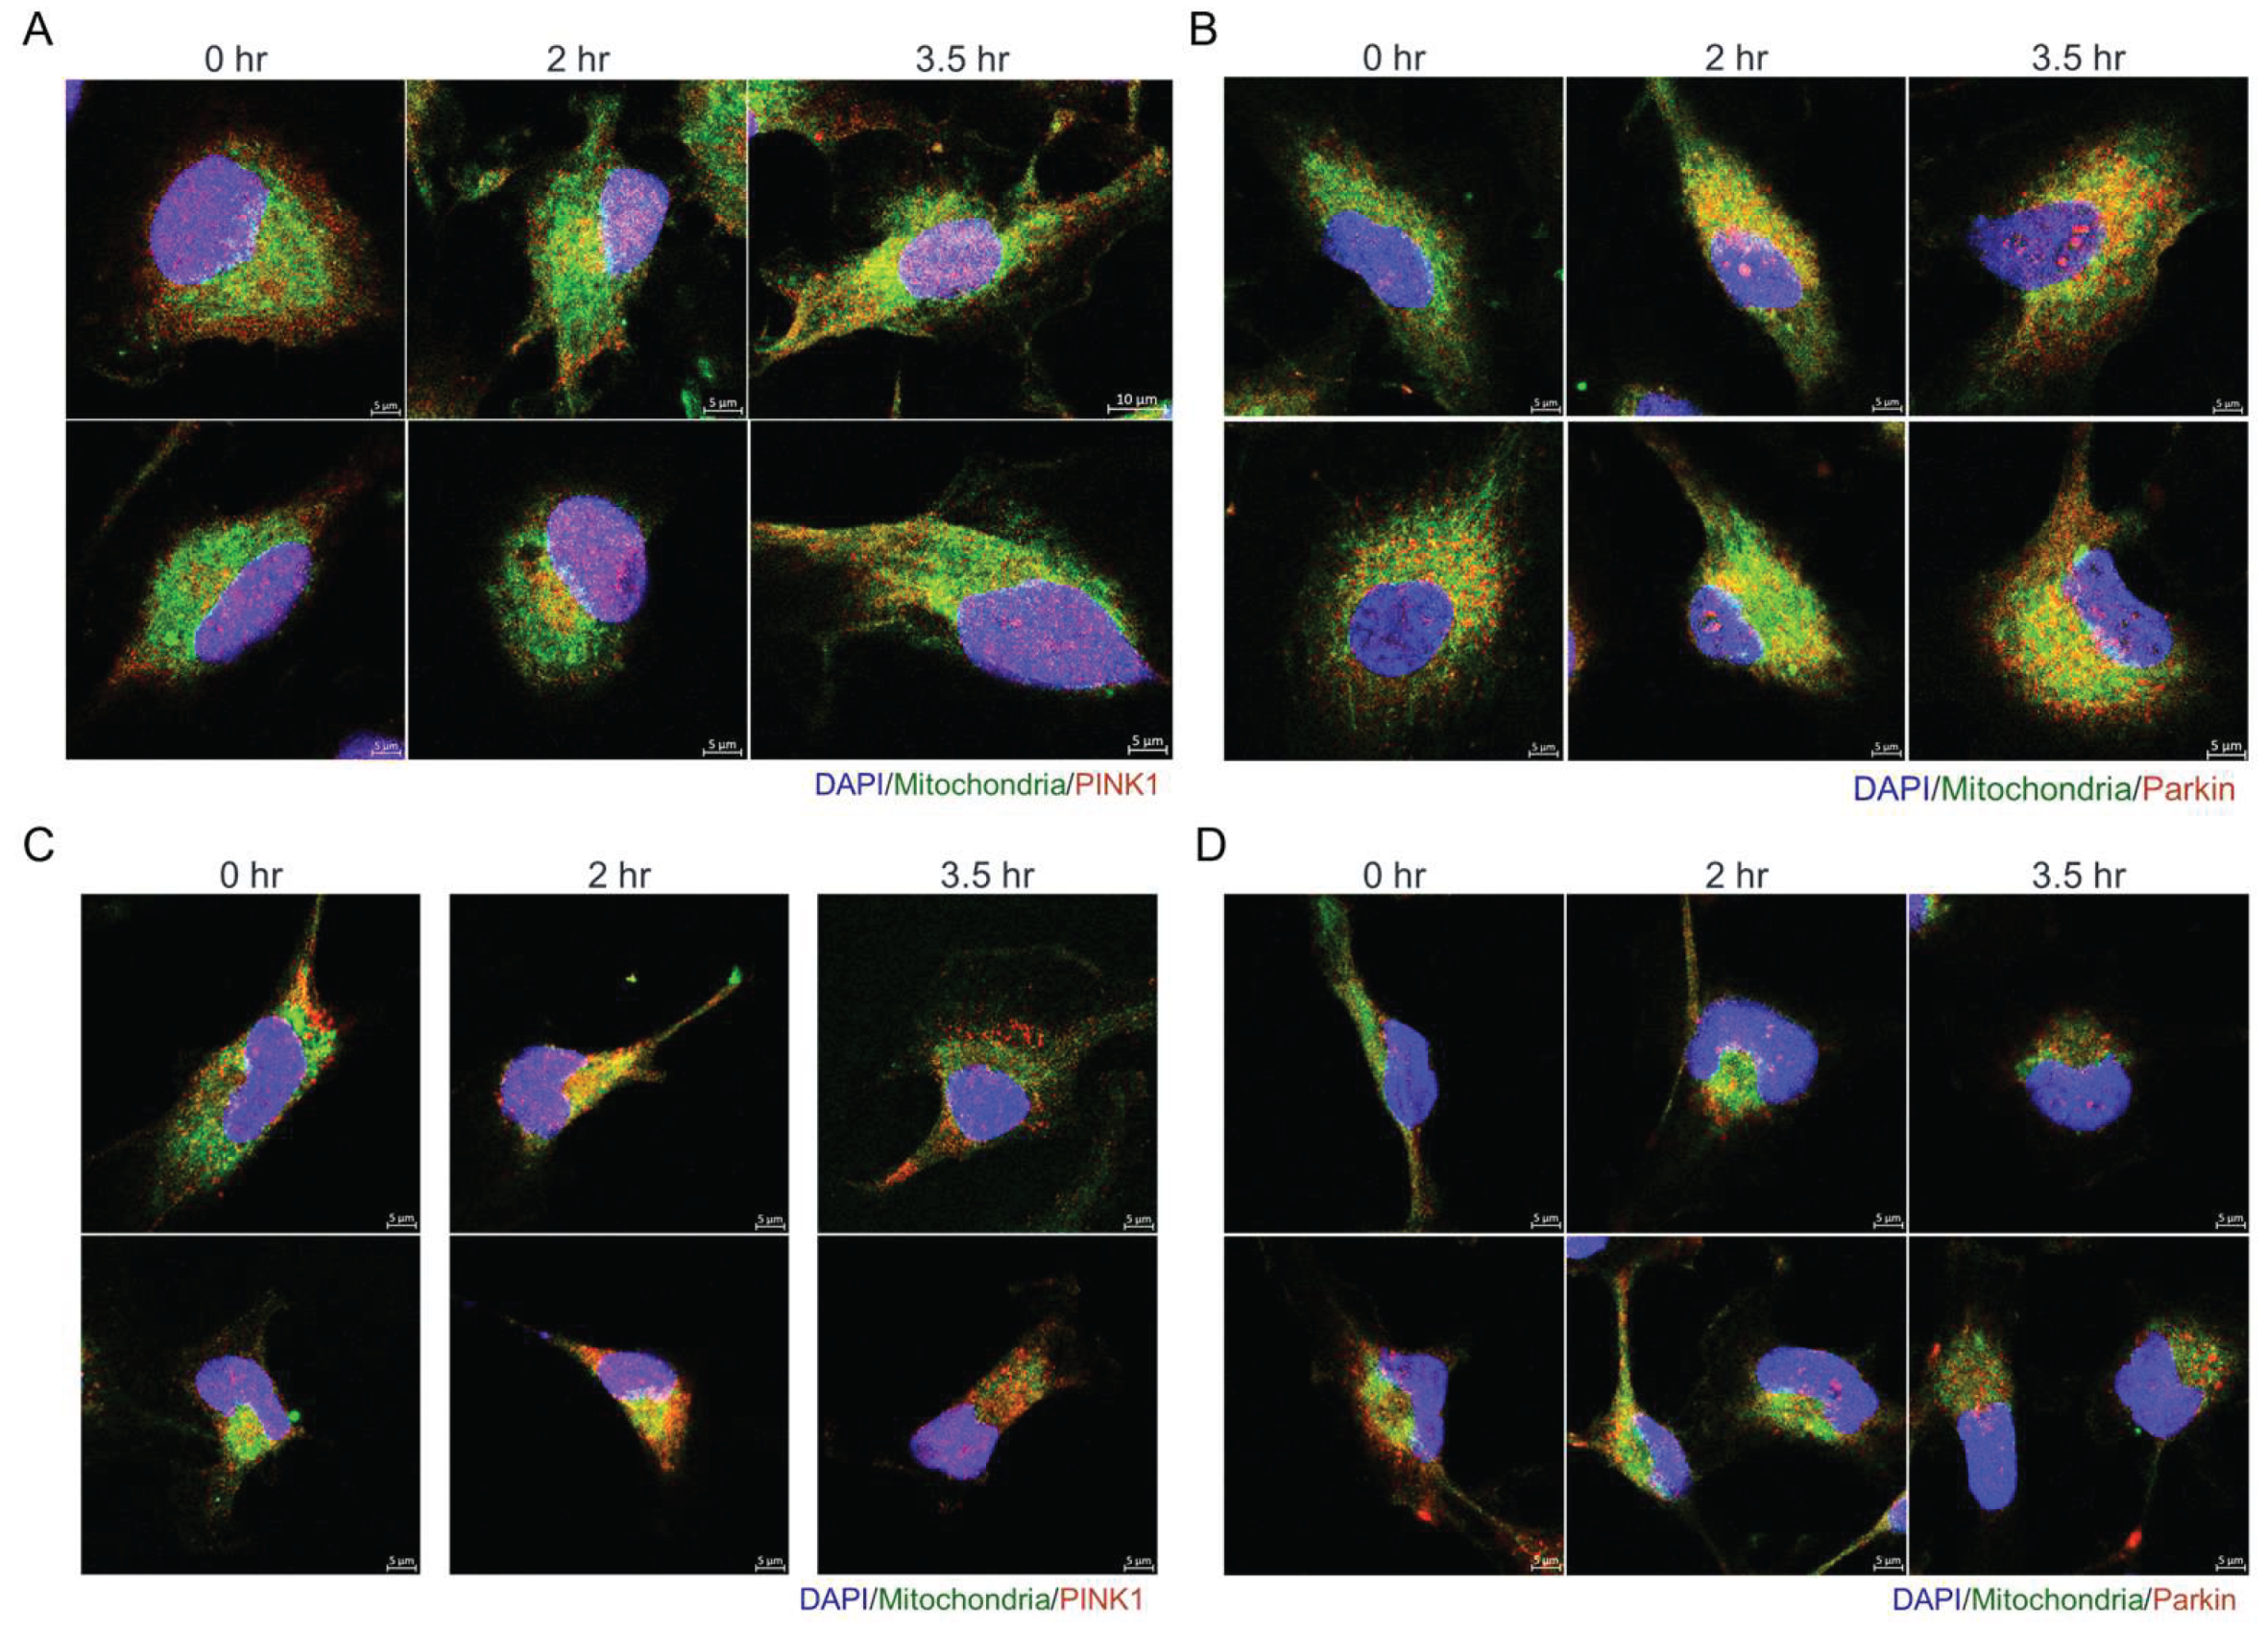
These observations prompted us to speculate that, in olivomycin A-treated renal cancer cells, particularly in the p53-mutant background, selective autophagic removal of damaged mitochondria (mitophagy) plays a critical role in maintaining mitochondrial quality control under stress conditions. Given that the PTEN-induced kinase 1 (PINK1)-Parkin pathway plays an essential role in ROS-mediated mitophagy [19], we examined the subcellular localizations of PINK1 and Parkin by immunofluorescence staining of olivomycin A-treated cells. In A-498 cells, exposure to 100 nM olivomycin A resulted in modest colocalization of mitochondria with PINK1 at 3.5 h post-treatment (Figure 8A) and with Parkin at 2 h post-treatment (Figure 8B). In contrast, in 786-O cells, which harbor mutations in p53, PTEN, and PINK1, PINK1 accumulation on mitochondria was evident at early as 2 h, followed by a marked reduction in mitochondrial content at 3.5 hours (Figure 8C). However, Parkin recruitment to mitochondria was less pronounced in 786-O cells (Figure 8D), possibly reflecting impairing signaling due to mutant PINK1 in this background. Together, these results indicate that while olivomycin A triggers modest, regulated mitophagy in A-498 cells with wild-type p53, it provokes accelerated, ROS-driven mitochondrial clearance in 786-O cells through a mechanism that is at least partly PINK1-dependent but Parkin-limited, and may involve alternative PINK1-independent pathways. Our results, therefore, suggest that the coexistence of mutant p53 and mutant PINK1 exerts a combined influence on mitochondrial quality control.
4. Discussion
Kidney cancer encompasses several histologically and molecularly distinct subtypes and ranks as the 14th most common malignancy worldwide, with approximately 180,000 deaths reported in 2020 [20,21,22]. Among the subtypes of kidney cancer, renal cell carcinoma (RCC) is the predominant form, accounting for nearly 90% of all renal malignancies. Genomic studies have identified at least 11 recurrent mutated genes implicated in RCC pathogenesis, including those encoding Von Hippel-Lindau (VHL) tumor suppressor and PTEN [23,24]. Despite advances in surgical resection, targeted therapies, and immune checkpoint inhibitors, the current treatment options for RCC remain limited by both intrinsic and acquired resistance, and durable responses are achieved in only a fraction of patients. This therapeutic challenge underscores the need for agents with novel action mechanisms.
Using two representative RCC cell lines, we herein show that olivomycin A, an aureolic acid-class antibiotic, exerts multifaceted anticancer effects by simultaneously impairing migration capacity and inducing both apoptosis and mitophagy. These multiple actions are clinically significant, given that RCC cells are notoriously resistant to apoptosis and prone to metastasis, both of which contribute to the poor prognosis of this disease [25,26]. By targeting both survival and metastatic programs, olivomycin A may offer a therapeutic advantage over agents that act on a single-pathway, particularly in tumors harboring p53, VHL, and PTEN mutations, which constitute a subset of aggressive RCCs [27,28,29,30]. Interestingly, we observed that the cellular response to olivomycin A is strongly influenced by the p53 status. In p53-wild-type A-498 cells, the intrinsic apoptotic pathway predominated, as reflected by upregulation of Puma, Bak, and active caspase-9. In contrast, 786-O cells harboring concurrent mutations in p53 and PTEN engaged both intrinsic and extrinsic pathways, under olivomycin A treatment, as evidenced by caspase-8 activation, Bid truncation, and FLIP suppression. Beyond its role in restraining oncogenic signaling, PTEN also modulates p53 stability and activity through phosphorylation-dependent mechanisms [31]. Meanwhile, p53 itself can enhance PTEN expression at the transcriptional level [32,33,34]. This reciprocal regulation forms a critical tumor-suppressive axis that directly governs apoptotic sensitivity. Disruption of this axis, as exemplified in 786-O cells, activates diverse apoptotic signaling cascades and may render cells particularly vulnerable to agents that impose both DNA damage and oxidative stress.
A further striking observation was the preferential induction of mitochondrial damage and mitophagy in 786-O cells with dual p53 and PTEN mutations. Increasing evidence suggests that PTEN and p53 are closely linked to the regulation of mitophagy. Under genotoxic stress, mitophagy normally functions as a compensatory quality-control mechanism to eliminate damaged mitochondria, thereby preserving mitochondrial integrity and facilitating DNA repair [35,36]. However, p53 exerts dual and context-dependent effects: Nuclear p53 can repress the transcription of stress-response genes, such as that encoding BNIP3 [37], which mediates receptor-driven mitophagy, whereas cytosolic p53 directly binds Parkin and prevents its mitochondrial translocation, to inhibit canonical PINK1/Parkin-mediated mitophagy [38,39]. In parallel, PTEN, particularly its PTENα isoform, facilitates Parkin recruitment to damaged mitochondria, thereby promoting PINK1/Parkin-dependent mitophagy and maintaining mitochondrial integrity [40,41]. Loss of PTEN disrupts this process, leading to defective mitophagy, mitochondrial dysfunction, and exacerbated ROS accumulation. Likewise, gain-of-function mutations in p53 can further dysregulate the cellular redox balance and amplify oxidative stress [42]. Consistent with these mechanisms, we observed that severe DNA damage and ROS accumulation in p53/PTEN-deficient 786-O cells coincided with mitochondrial collapse and elevated lysosomal activity, which are hallmarks of mitochondrial stress-induced clearance. Importantly, this convergence of excessive ROS burden, defective apoptotic control, and impaired mitophagy suggests a therapeutically exploitable vulnerability, through which compounds such as olivomycin A may selectively overwhelm mitochondrial quality-control mechanisms in aggressive RCC.
5. Conclusions
Collectively, our findings show that the aureolic acid-class antibiotic olivomycin A exerts multifaceted anticancer activity in RCC cells in vitro by suppressing cell migration, triggering apoptosis, and disrupting mitochondrial quality control through mitophagy. These effects are strongly influenced by the mutational status of p53 and PTEN, two pivotal tumor suppressors that together govern apoptotic signaling and mitochondrial homeostasis. In RCC cells harboring mutant versions of p53 and PTEN, the interplay of excessive ROS generation, impaired mitophagy, and deregulated apoptosis creates a unique vulnerability that can be exploited by agents such as olivomycin A. Thus, targeting the p53/PTEN–mitophagy axis may represent a promising therapeutic strategy for addressing aggressive RCC subtypes that are refractory to current treatments.
Author Contributions
For Conceptualization was carried out by Y.F.L. and P.J.C.; methodology was developed by C.Y.H. and A.S.T.; validation was performed by Y.F.L., Y.T.S., A.S.T., and P.J.C.; investigation was undertaken by C.Y.H. and Y.F.L.; resources were provided by Y.F.L., Y.T.S., A.E.S., and P.J.C.; data curation was handled by C.Y.H. and Y.T.S.; the original draft was prepared by A.S.T., A.E.S., and P.J.C.; review and editing were performed by C.Y.H., A.E.S., and P.J.C.; visualization was carried out by C.Y.H. and P.J.C.; supervision was provided by A.E.S. and P.J.C.; project administration was managed by P.J.C.; and funding acquisition was secured by Y.F.L., A.E.S., and P.J.C.. All authors have read and agreed to the published version of the manuscript.
Funding
This study was supported in part by the National Science and Technology Council, ROC (Grant numbers MOST-106-2320-B-005-008-MY3 and MOST-108-2923-B-005-001-MY3), by the Ministry of Science and Higher Education of the Russian Federation, and by the Ministry of Health and Welfare and the Feng Yuan Hospital (Grant numbers 112-03 and 113-06).
Institutional Review Board Statement
Not applicable.
Informed Consent Statement
Not applicable.
Data Availability Statement
The original contributions presented in this study are included in the article/supplementary material. Further inquiries can be directed to the corresponding author(s).
Acknowledgments
This study was supported in part by the National Science and Technology Council, ROC (Grant numbers MOST-106-2320-B-005-008-MY3 and MOST-108-2923-B-005-001-MY3), by the Ministry of Science and Higher Education of the Russian Federation, and by the Ministry of Health and Welfare and the Feng Yuan Hospital (Grant numbers 112-03 and 113-06).
Conflicts of Interest
The authors declare no conflicts of interest.
Abbreviations
The following abbreviations are used in this manuscript:
| EMT | Epithelial–mesenchymal transition |
| NAC PINK1 PTEN ROS |
N-acetylcysteine PTEN-induced kinase 1 Phosphatase and tensin homolog Reactive oxygen species |
| RCC | Renal cell carcinoma |
| VHL | Von Hippel-Lindau tumor suppressor |
References
- Berlin, Y.A.; Kiseleva, O.A.; Kolosov, M.N.; Shemyakin, M.M.; Soifer, V.S.; Vasina, I.V.; Yartseva, I.V. Aureolic Acid Group of Anti-Tumour Antibiotics. Nature 1968, 218, 193. [Google Scholar] [CrossRef]
- Kumar, V.; Remers, W.A.; Bradner, W.T. Preparation and antitumor activity of olivomycin A analogues. Journal of medicinal chemistry 1980, 23, 376–379. [Google Scholar] [CrossRef] [PubMed]
- Radzievskaia, V.V.; Terent’eva, T.G.; Sokolov, A.B. [Action of aureolic acid and dactinomycin group antibiotics on human brain tumors in culture]. Antibiotiki 1978, 23, 103–109. [Google Scholar] [PubMed]
- Brikenshtein, V.; Pitina, L.R.; Barenboim, G.M.; Gurskii, G.V. [Stereochemistry and kinetics of interaction with DNA of the antineoplastic antibiotic olivomycin]. Mol Biol (Mosk) 1984, 18, 1606–1616. [Google Scholar]
- Fox, K.R.; Howarth, N.R. Investigations into the sequence-selective binding of mithramycin and related ligands to DNA. Nucleic Acids Res 1985, 13, 8695–8714. [Google Scholar] [CrossRef]
- Chen, K.X.; Gresh, N.; Hui, X.; Pullman, B.; Zakrzewska, K. Modelling basic features of specificity in DNA-aureolic acid-derived antibiotic interactions. FEBS Lett 1989, 245, 145–149. [Google Scholar] [CrossRef]
- Beniaminov, A.D.; Chashchina, G.V.; Livshits, M.A.; Kechko, O.I.; Mitkevich, V.A.; Mamaeva, O.K.; Tevyashova, A.N.; Shtil, A.A.; Shchyolkina, A.K.; Kaluzhny, D.N. Discrimination between G/C Binding Sites by Olivomycin A Is Determined by Kinetics of the Drug-DNA Interaction. International Journal of Molecular Sciences 2020, 21. [Google Scholar] [CrossRef]
- Kudla, G.; Lipinski, L.; Caffin, F.; Helwak, A.; Zylicz, M. High guanine and cytosine content increases mRNA levels in mammalian cells. PLoS Biol 2006, 4, e180. [Google Scholar] [CrossRef] [PubMed]
- Nanjunda, R.; Wilson, W.D. Binding to the DNA minor groove by heterocyclic dications: from AT-specific monomers to GC recognition with dimers. Curr Protoc Nucleic Acid Chem, 8. [CrossRef]
- Versteeg, R.; van Schaik, B.D.; van Batenburg, M.F.; Roos, M.; Monajemi, R.; Caron, H.; Bussemaker, H.J.; van Kampen, A.H. The human transcriptome map reveals extremes in gene density, intron length, GC content, and repeat pattern for domains of highly and weakly expressed genes. Genome Res 2003, 13, 1998–2004. [Google Scholar] [CrossRef]
- Isagulieva, A.K.; Kaluzhny, D.N.; Beniaminov, A.D.; Soshnikova, N.V.; Shtil, A.A. Differential Impact of Random GC Tetrad Binding and Chromatin Events on Transcriptional Inhibition by Olivomycin A. Int J Mol Sci 2022, 23. [Google Scholar] [CrossRef]
- Isagulieva, A.K.; Soshnikova, N.V.; Shtil, A.A. Inhibition of the c-Myc Oncogene by the Aureolic Acid Group Antibiotics. Dokl Biochem Biophys 2021, 500, 308–311. [Google Scholar] [CrossRef]
- Cheglakov, I.B.; Tevyashova, A.N.; Kurbatov, L.K.; Tatarsky, V.V., Jr.; Samusenko, A.V.; Preobrazhenskaya, M.N.; Shtil, A.A. Altered transcription and replication are the mechanisms of cytotoxicity of antitumor antibiotic olivomycin A. Dokl Biochem Biophys 2010, 435, 320–322. [Google Scholar] [CrossRef]
- Tevyashova, A.N.; Shtil, A.A.; Olsufyeva, E.N.; Luzikov, Y.N.; Reznikova, M.I.; Dezhenkova, L.G.; Isakova, E.B.; Bukhman, V.M.; Durandin, N.A.; Vinogradov, A.M. , et al. Modification of olivomycin A at the side chain of the aglycon yields the derivative with perspective antitumor characteristics. Bioorganic & medicinal chemistry 2011, 19, 7387–7393. [Google Scholar] [CrossRef]
- Tevyashova, A.N.; Durandin, N.A.; Vinogradov, A.M.; Zbarsky, V.B.; Reznikova, M.I.; Dezhenkova, L.G.; Bykov, E.E.; Olsufyeva, E.N.; Kuzmin, V.A.; Shtil, A.A. , et al. Role of the acyl groups in carbohydrate chains in cytotoxic properties of olivomycin A. J Antibiot (Tokyo) 2013, 66, 523–530. [Google Scholar] [CrossRef] [PubMed]
- Sergeev, A.V.; Tevyashova, A.N.; Vorobyov, A.P.; Gromova, E.S. The Effect of Antitumor Antibiotic Olivomycin A and Its New Semi-synthetic Derivative Olivamide on the Activity of Murine DNA Methyltransferase Dnmt3a. Biochemistry (Mosc) 2019, 84, 62–70. [Google Scholar] [CrossRef]
- Simonova, V.S.; Samusenko, A.V.; Filippova, N.A.; Tevyashova, A.N.; Lyniv, L.S.; Kulik, G.I.; Chekhun, V.F.; Shtil, A.A. Olivomycin induces tumor cell apoptosis and suppresses p53-induced transcription. Bull Exp Biol Med 2005, 139, 455–459. [Google Scholar] [CrossRef]
- Leroy, B.; Girard, L.; Hollestelle, A.; Minna, J.D.; Gazdar, A.F.; Soussi, T. Analysis of TP53 mutation status in human cancer cell lines: a reassessment. Hum Mutat 2014, 35, 756–765. [Google Scholar] [CrossRef] [PubMed]
- Wang, M.; Luan, S.; Fan, X.; Wang, J.; Huang, J.; Gao, X.; Han, D. The emerging multifaceted role of PINK1 in cancer biology. Cancer science 2022, 113, 4037–4047. [Google Scholar] [CrossRef]
- Linehan, W.M.; Schmidt, L.S.; Crooks, D.R.; Wei, D.; Srinivasan, R.; Lang, M.; Ricketts, C.J. The Metabolic Basis of Kidney Cancer. Cancer Discov 2019, 9, 1006–1021. [Google Scholar] [CrossRef]
- Sung, H.; Ferlay, J.; Siegel, R.L.; Laversanne, M.; Soerjomataram, I.; Jemal, A.; Bray, F. Global cancer statistics 2020: GLOBOCAN estimates of incidence and mortality worldwide for 36 cancers in 185 countries. Ca-Cancer J Clin 2021, 71, 209–249. [Google Scholar] [CrossRef]
- Powles, T.; Albiges, L.; Bex, A.; Comperat, E.; Grunwald, V.; Kanesvaran, R.; Kitamura, H.; McKay, R.; Porta, C.; Procopio, G. , et al. Renal cell carcinoma: ESMO Clinical Practice Guideline for diagnosis, treatment and follow-up. Ann Oncol 2024, 35, 692–706. [Google Scholar] [CrossRef]
- Haas, N.B.; Nathanson, K.L. Hereditary kidney cancer syndromes. Adv Chronic Kidney Dis 2014, 21, 81–90. [Google Scholar] [CrossRef]
- Jin, J.; Xie, Y.; Zhang, J.S.; Wang, J.Q.; Dai, S.J.; He, W.F.; Li, S.Y.; Ashby, C.R., Jr.; Chen, Z.S.; He, Q. Sunitinib resistance in renal cell carcinoma: From molecular mechanisms to predictive biomarkers. Drug Resist Updat 2023, 67, 100929. [Google Scholar] [CrossRef]
- Li, X.; Xiong, W.; Xiong, Z.; Zhang, X. Molecular mechanisms of renal cell carcinoma metastasis and potential targets for therapy. Front Cell Dev Biol 2025, 13, 1521151. [Google Scholar] [CrossRef]
- Fei, C.; Zhen, X.; Shiqiang, Z.; Jun, P. Frontier knowledge and future directions of programmed cell death in clear cell renal cell carcinoma. Cell Death Discov 2024, 10, 113. [Google Scholar] [CrossRef]
- Amendolare, A.; Marzano, F.; Petruzzella, V.; Vacca, R.A.; Guerrini, L.; Pesole, G.; Sbisa, E.; Tullo, A. The Underestimated Role of the p53 Pathway in Renal Cancer. Cancers (Basel) 2022, 14. [Google Scholar] [CrossRef]
- Swiatkowska, A. p53 and Its Isoforms in Renal Cell Carcinoma-Do They Matter? Biomedicines 2022, 10. [Google Scholar] [CrossRef]
- Xu, Z.; Liu, L.; Jiang, W.; Qiu, Y.; Zhang, B.; Cheng, J.; Luo, J.; Guo, J.; Xu, J. VHL missense mutation delineate aggressive clear cell renal cell carcinoma subtype with favorable immunotherapeutic response. J Immunother Cancer 2024, 12. [Google Scholar] [CrossRef] [PubMed]
- Xu, X.; Tang, Y.Y.; Liang, X.; Luo, W.; Jiang, D.M.; Chen, J. PTEN suppresses renal cell carcinoma proliferation and migration via inhibition of the PI3K/AKT pathway. World J Surg Oncol 2025, 23, 42. [Google Scholar] [CrossRef] [PubMed]
- Huang, X.; Zhang, D.; Zhang, D.; Guo, J.; Gu, G.; Wang, Y.; Wu, G.; Wang, C.; Fu, B.; Li, K. Decoding PTEN: from biological functions to signaling pathways in tumors. Mol Biol Rep 2024, 51, 1089. [Google Scholar] [CrossRef] [PubMed]
- Nakanishi, A.; Kitagishi, Y.; Ogura, Y.; Matsuda, S. The tumor suppressor PTEN interacts with p53 in hereditary cancer (Review). Int J Oncol 2014, 44, 1813–1819. [Google Scholar] [CrossRef]
- Lee, Y.R.; Chen, M.; Pandolfi, P.P. The functions and regulation of the PTEN tumour suppressor: new modes and prospects. Nature reviews. Molecular cell biology 2018, 19, 547–562. [Google Scholar] [CrossRef]
- Song, M.S.; Salmena, L.; Pandolfi, P.P. The functions and regulation of the PTEN tumour suppressor. Nature reviews. Molecular cell biology 2012, 13, 283–296. [Google Scholar] [CrossRef]
- Roberts, R.F.; Tang, M.Y.; Fon, E.A.; Durcan, T.M. Defending the mitochondria: The pathways of mitophagy and mitochondrial-derived vesicles. The international journal of biochemistry & cell biology 2016, 79, 427–436. [Google Scholar] [CrossRef]
- Dan, X.L.; Babbar, M.; Moore, A.; Wechter, N.; Tian, J.Y.; Mohanty, J.G.; Croteau, D.L.; Bohr, V.A. DNA damage invokes mitophagy through a pathway involving Spata18. Nucleic Acids Research 2020, 48, 6611–6623. [Google Scholar] [CrossRef]
- Feng, X.; Liu, X.; Zhang, W.; Xiao, W. p53 directly suppresses BNIP3 expression to protect against hypoxia-induced cell death. EMBO J 2011, 30, 3397–3415. [Google Scholar] [CrossRef] [PubMed]
- Hoshino, A.; Ariyoshi, M.; Okawa, Y.; Kaimoto, S.; Uchihashi, M.; Fukai, K.; Iwai-Kanai, E.; Ikeda, K.; Ueyama, T.; Ogata, T. , et al. Inhibition of p53 preserves Parkin-mediated mitophagy and pancreatic beta-cell function in diabetes. Proc Natl Acad Sci U S A 2014, 111, 3116–3121. [Google Scholar] [CrossRef] [PubMed]
- Palikaras, K.; Lionaki, E.; Tavernarakis, N. Mechanisms of mitophagy in cellular homeostasis, physiology and pathology. Nat Cell Biol 2018, 20, 1013–1022. [Google Scholar] [CrossRef]
- Li, G.; Yang, J.; Yang, C.; Zhu, M.; Jin, Y.; McNutt, M.A.; Yin, Y. PTENalpha regulates mitophagy and maintains mitochondrial quality control. Autophagy 2018, 14, 1742–1760. [Google Scholar] [CrossRef] [PubMed]
- Wang, L.; Lu, G.; Shen, H.M. The Long and the Short of PTEN in the Regulation of Mitophagy. Front Cell Dev Biol 2020, 8, 299. [Google Scholar] [CrossRef]
- Eriksson, S.E.; Ceder, S.; Bykov, V.J.N.; Wiman, K.G. p53 as a hub in cellular redox regulation and therapeutic target in cancer. J Mol Cell Biol 2019, 11, 330–341. [Google Scholar] [CrossRef] [PubMed]
Figure 1.
Structure of olivomycin A.
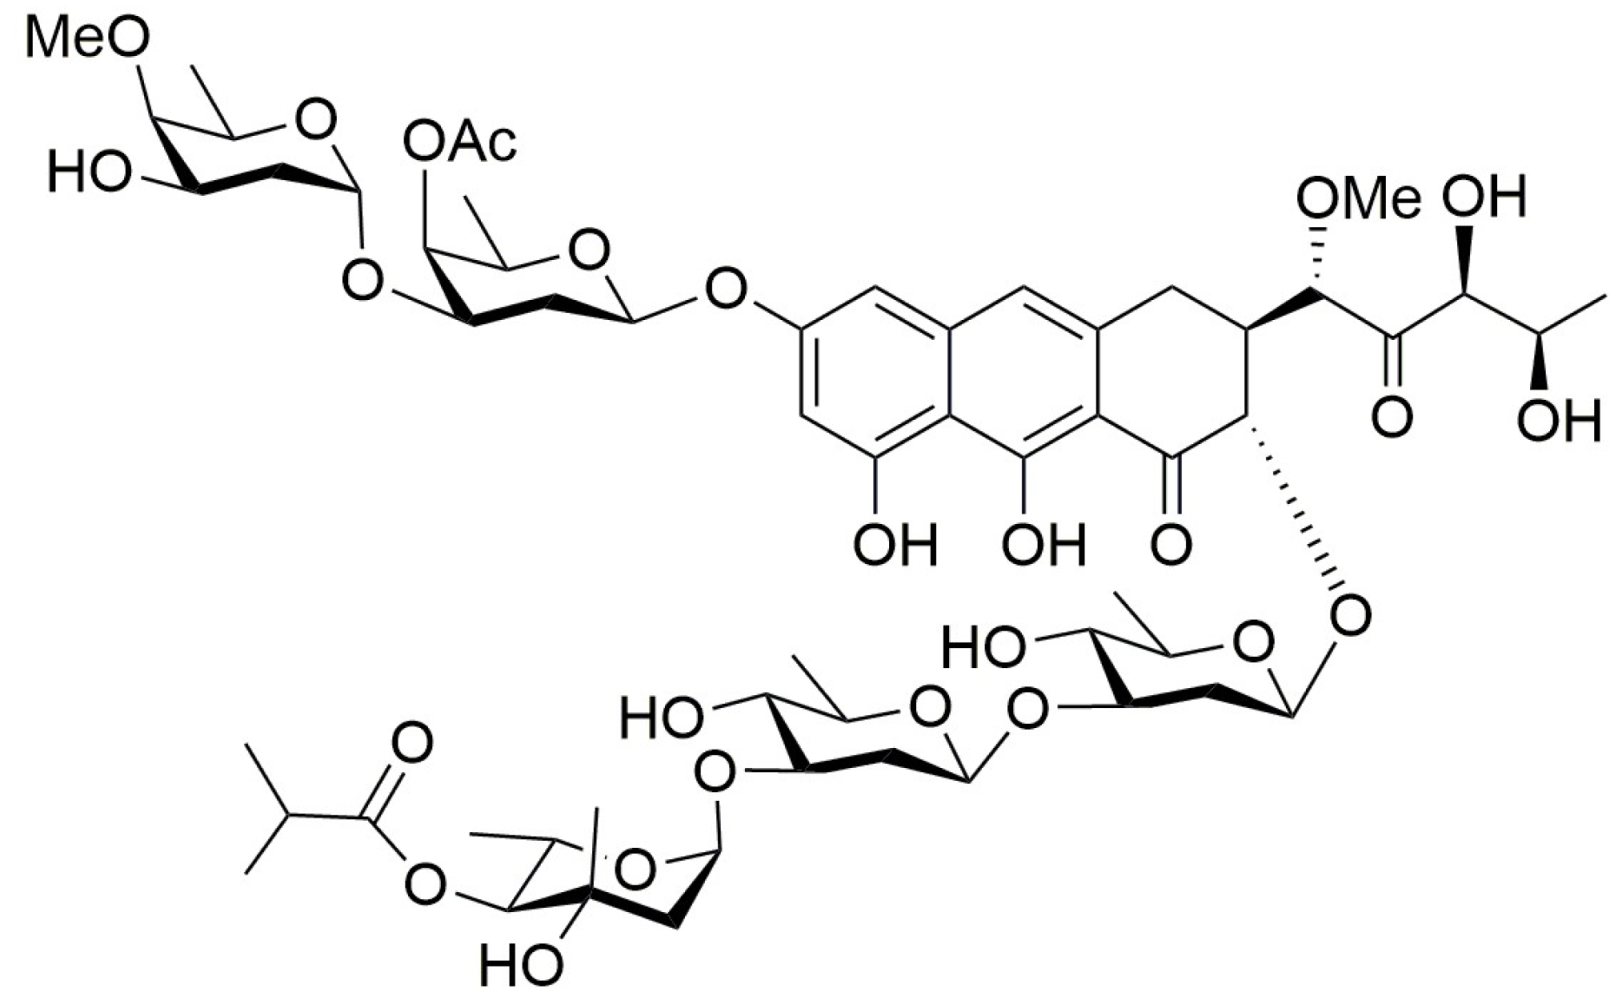
Figure 2.
Effects of olivomycin A on colony formation, proliferation, and senescence in renal cancer cells. (A, B) Representative images and quantification of colony formation assays showing reduced clonogenic survival in A-498 (A) and 786-O (B) cells following treatment with olivomycin A. Colony numbers were determined and documented. Data are presented as mean ± SD from at least three independent experiments. There was a significant reduction in colony numbers in olivomycin A-treated cells compared with untreated controls (*p <0.05, *** p <0.001). (C) Cell proliferation was dynamically monitored using the xCELLigence system in 786-O cells, demonstrating concentration-dependent growth inhibition. (D) Representative images of senescence-associated β-galactosidase staining showing induction of cellular senescence upon olivomycin A treatments. Doxorubicin was used as a positive control.
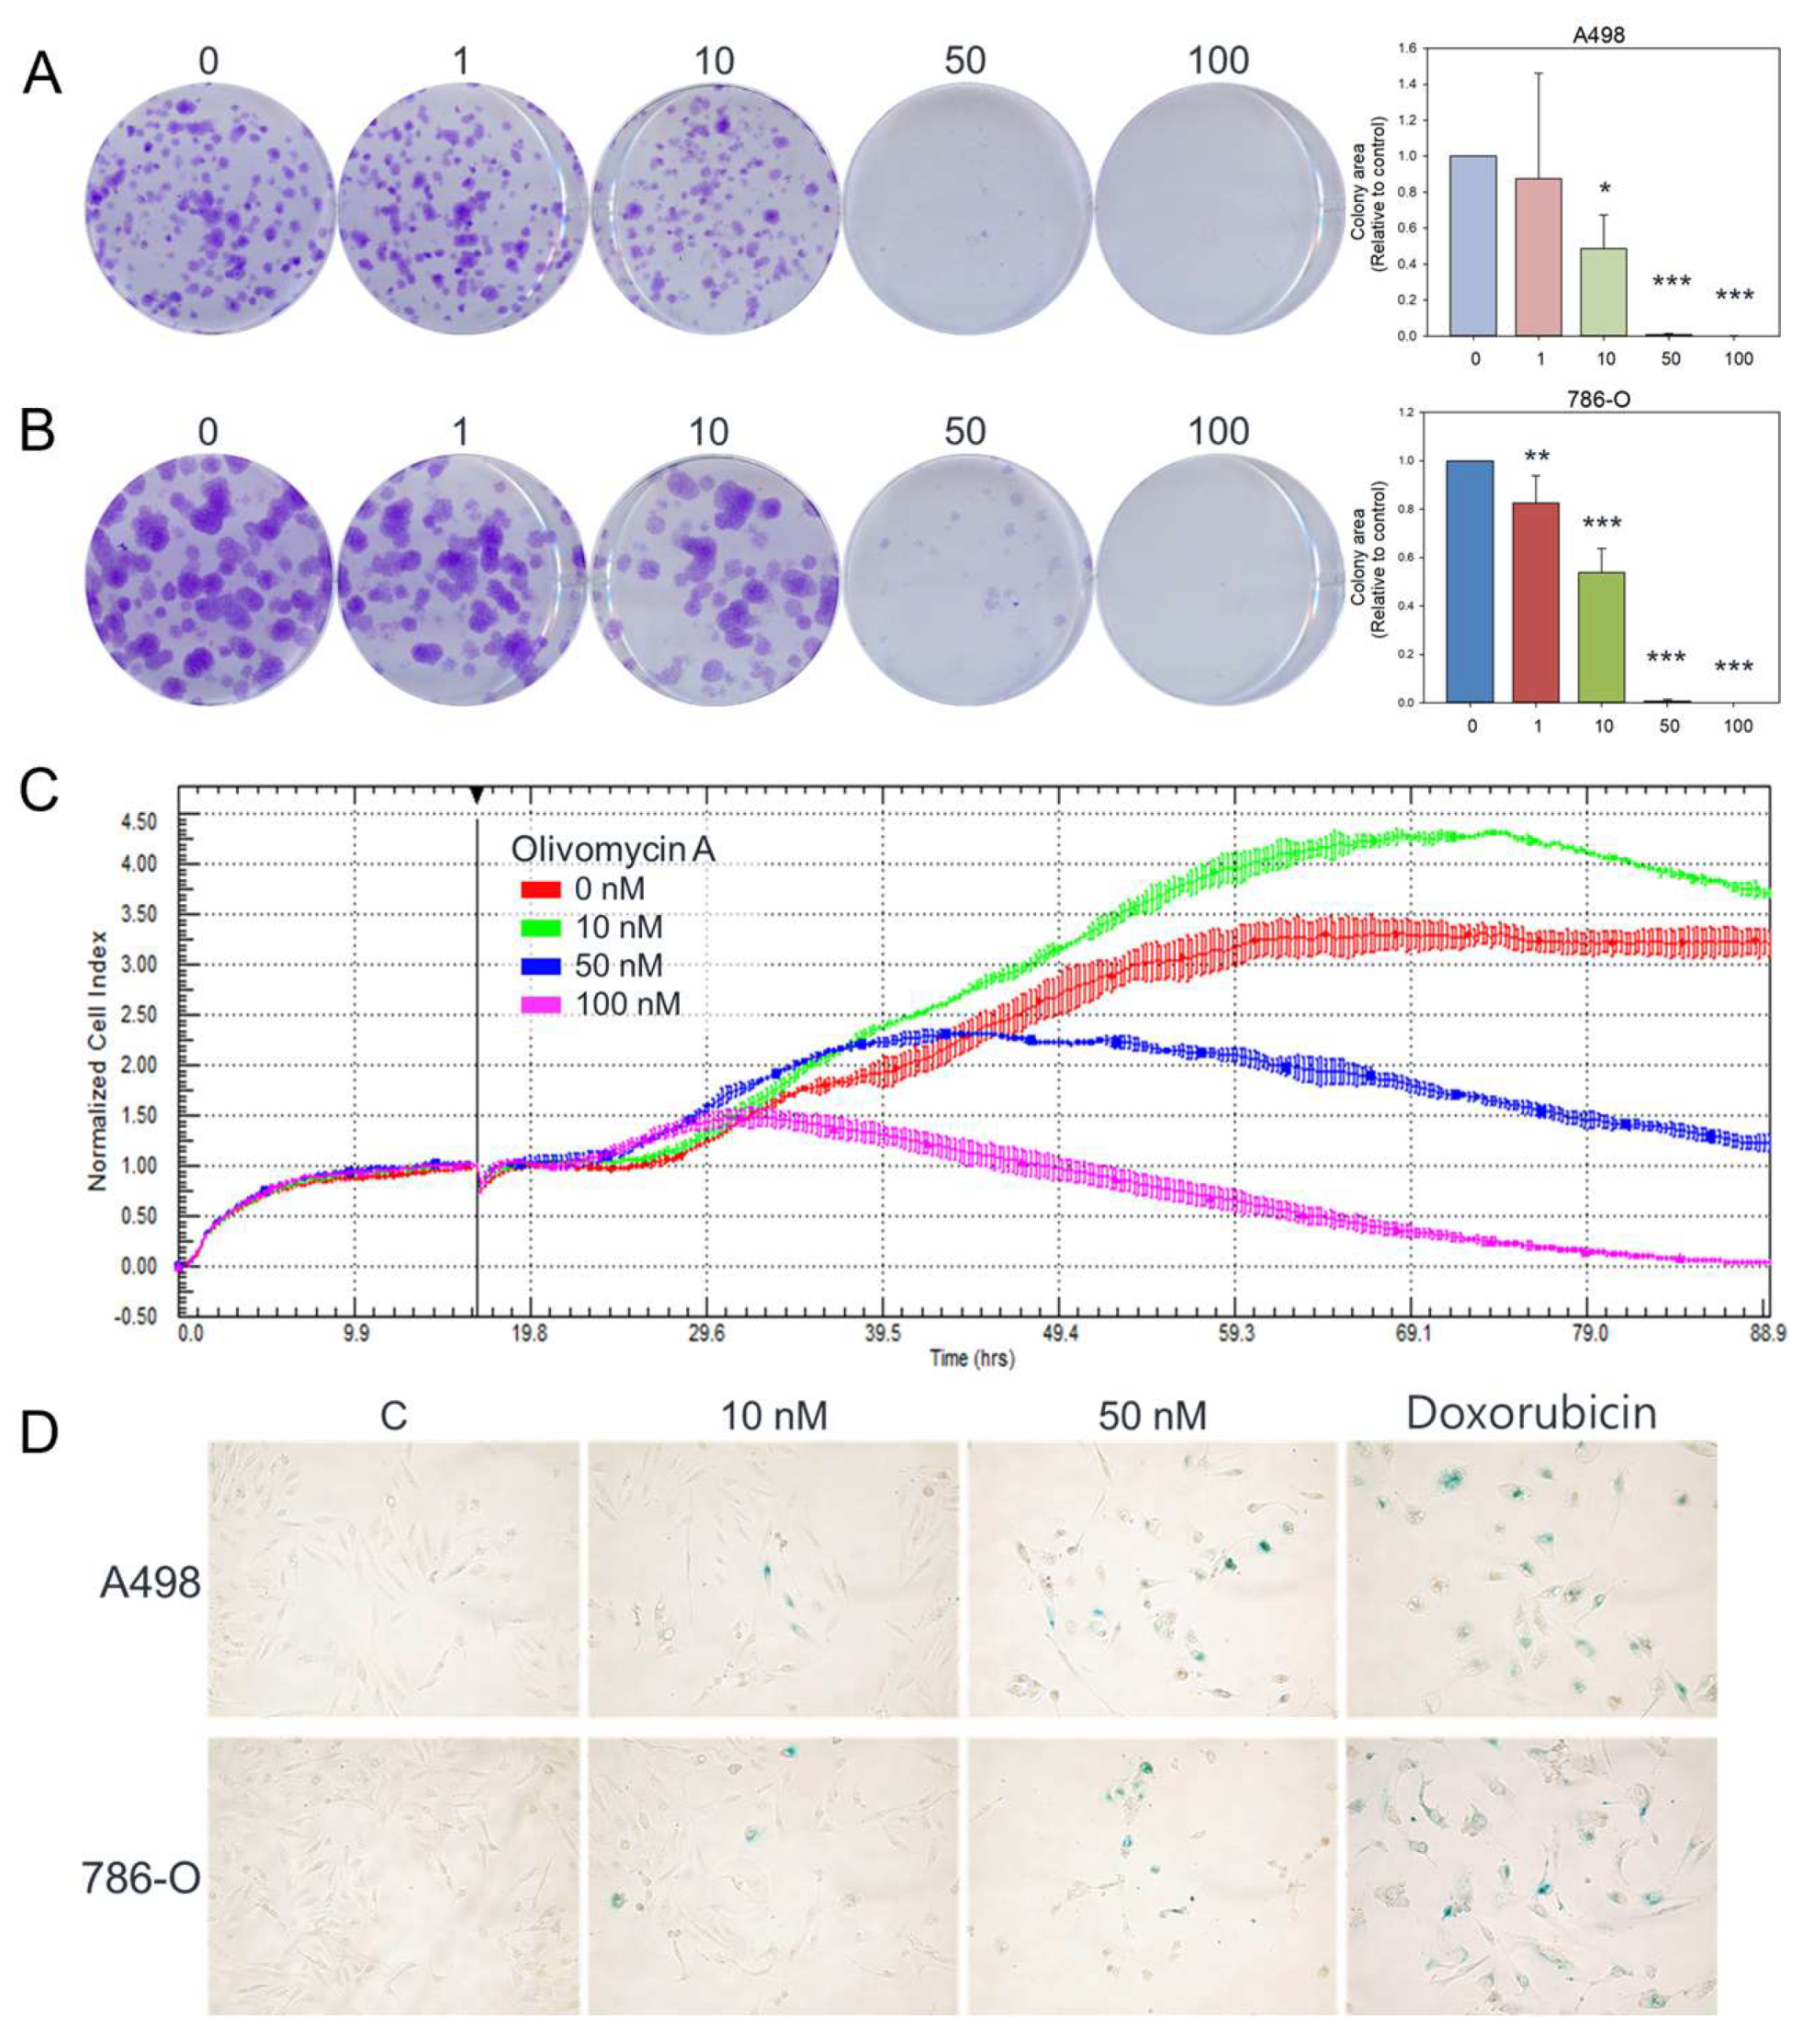
Figure 3.
Inhibitory effects of olivomycin A on cell migration assessed by wound healing assays and transwell chamber assays. (A, B) The cell monolayer was scratched with a pipette tip and treated with different concentrations of olivomycin A or vesicles as a control in A-498 (A) and 786-O (B) cells. Wound closure was examined at 0 and 8 h after scratching using inverted light microscopy. Representative images from three independent experiments are shown. Quantitative analysis of wound closures is presented in the histogram. Values represent means ± SE from three independent experiments performed in triplicate (*p <0.05, ***p <0.001 vs. control). (C, D) Cell migration was further assessed by transwell chamber assays. Migrated cells were fixed, stained, and counted in A-498 (C) and 786-O (D) cells. Quantitative analysis of migrated cells is shown in the histogram. Values represent means ± SE from three independent experiments performed in triplicate (*p <0.05, ***p <0.001 vs. control).
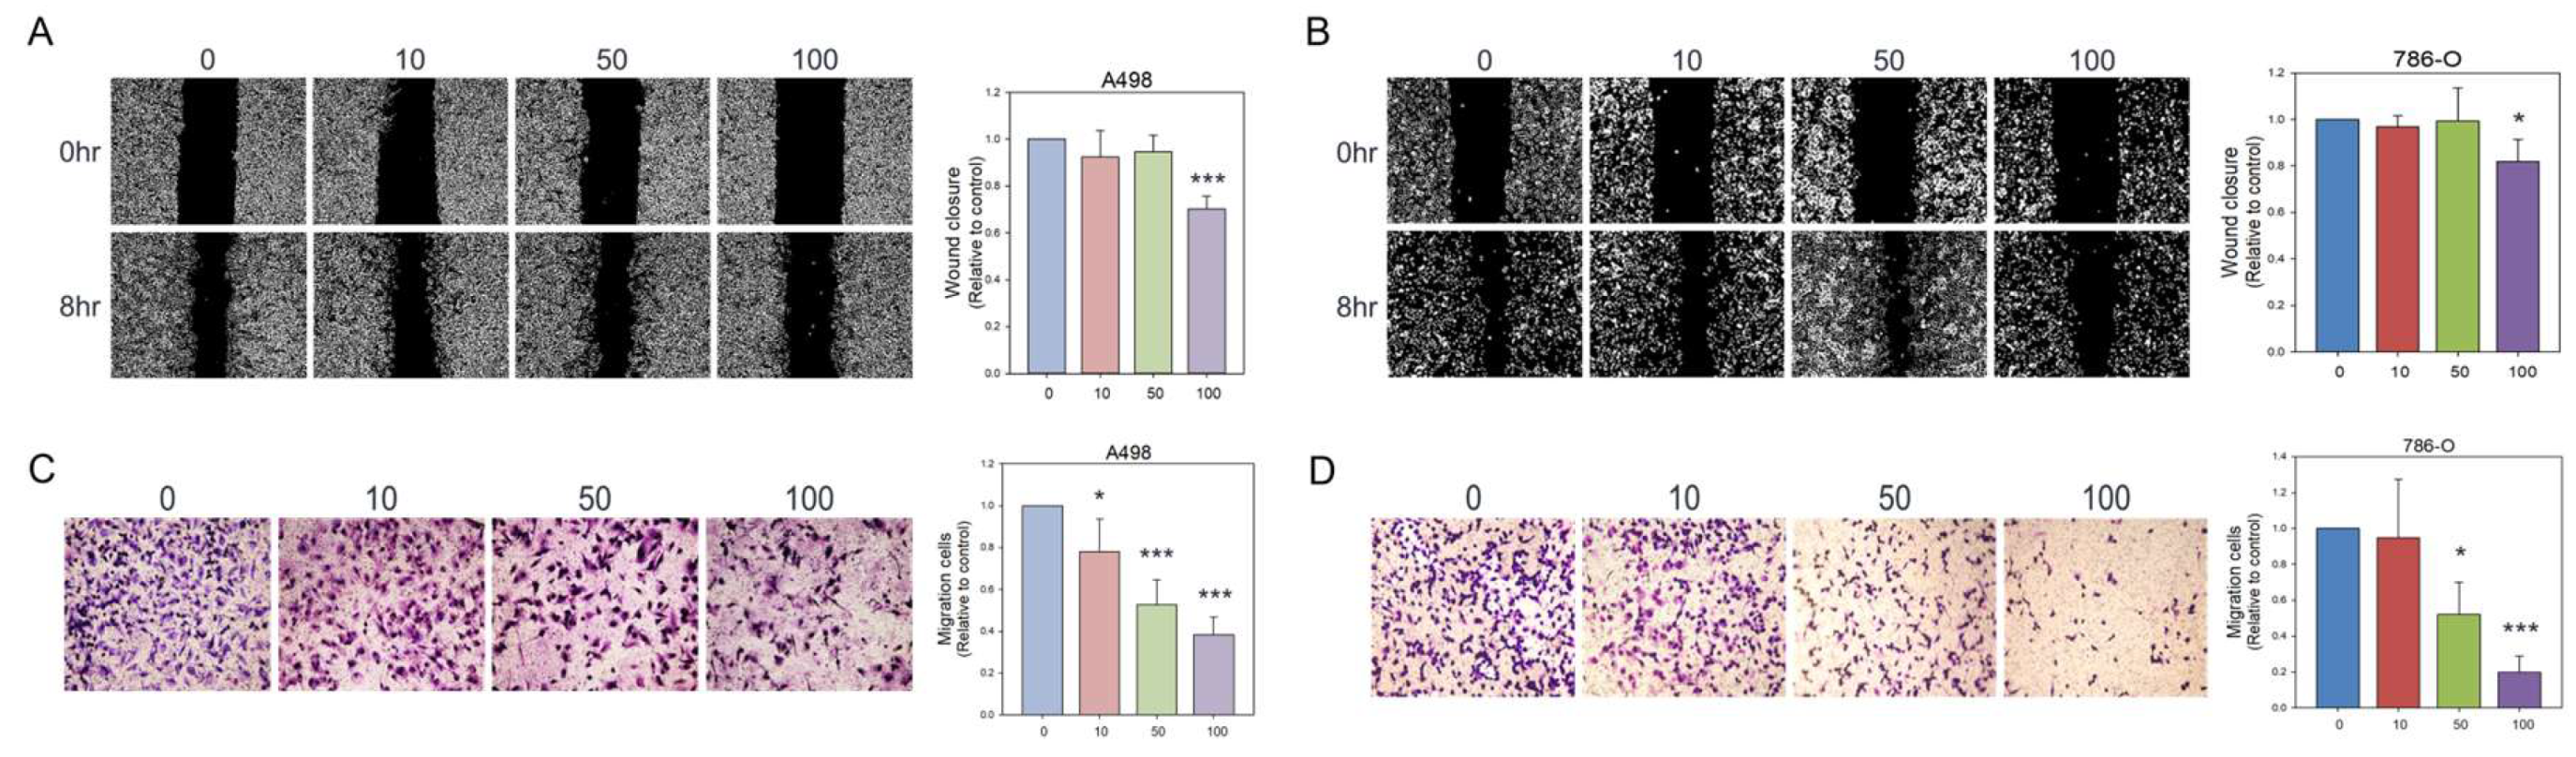
Figure 4.
Attenuated effects of olivomycin A on Snail, epithelial-mesenchymal transition markers, and VCAM-1 in renal cancer cells. (A) Confocal microscopy of nuclear Snail (green) and DAPI (blue) staining. Cells were treated with olivomycin A and a vehicle control and subjected to immunofluorescence analysis. Representative confocal images demonstrate reduced nuclear localization of Snail in olivomycin A–treated cells compared with controls. (B) Western blot analysis showing that olivomycin A markedly attenuated Snail protein expression in both A-498 and 786-O cells. (C) In A-498 cells, olivomycin A significantly reduced N-cadherin while upregulating E-cadherin and ZO-1 expression. (D) In 789-O cells, olivomycin A significantly downregulated N-cadherin and modestly increased E-cadherin and ZO-1 expression. (E) Olivomycin A also significantly reduced VCAM-1 expression in both A-498 and 798-O cells. Cell lysates were resolved by SDS-PAGE and analyzed by Western blotting, with β-actin used as a loading control. Representative blots are shown. Quantitative data represent means ± SE from three independent experiments performed in triplicate (*p < 0.05, **p < 0.01, *** p < 0.001 vs. control).
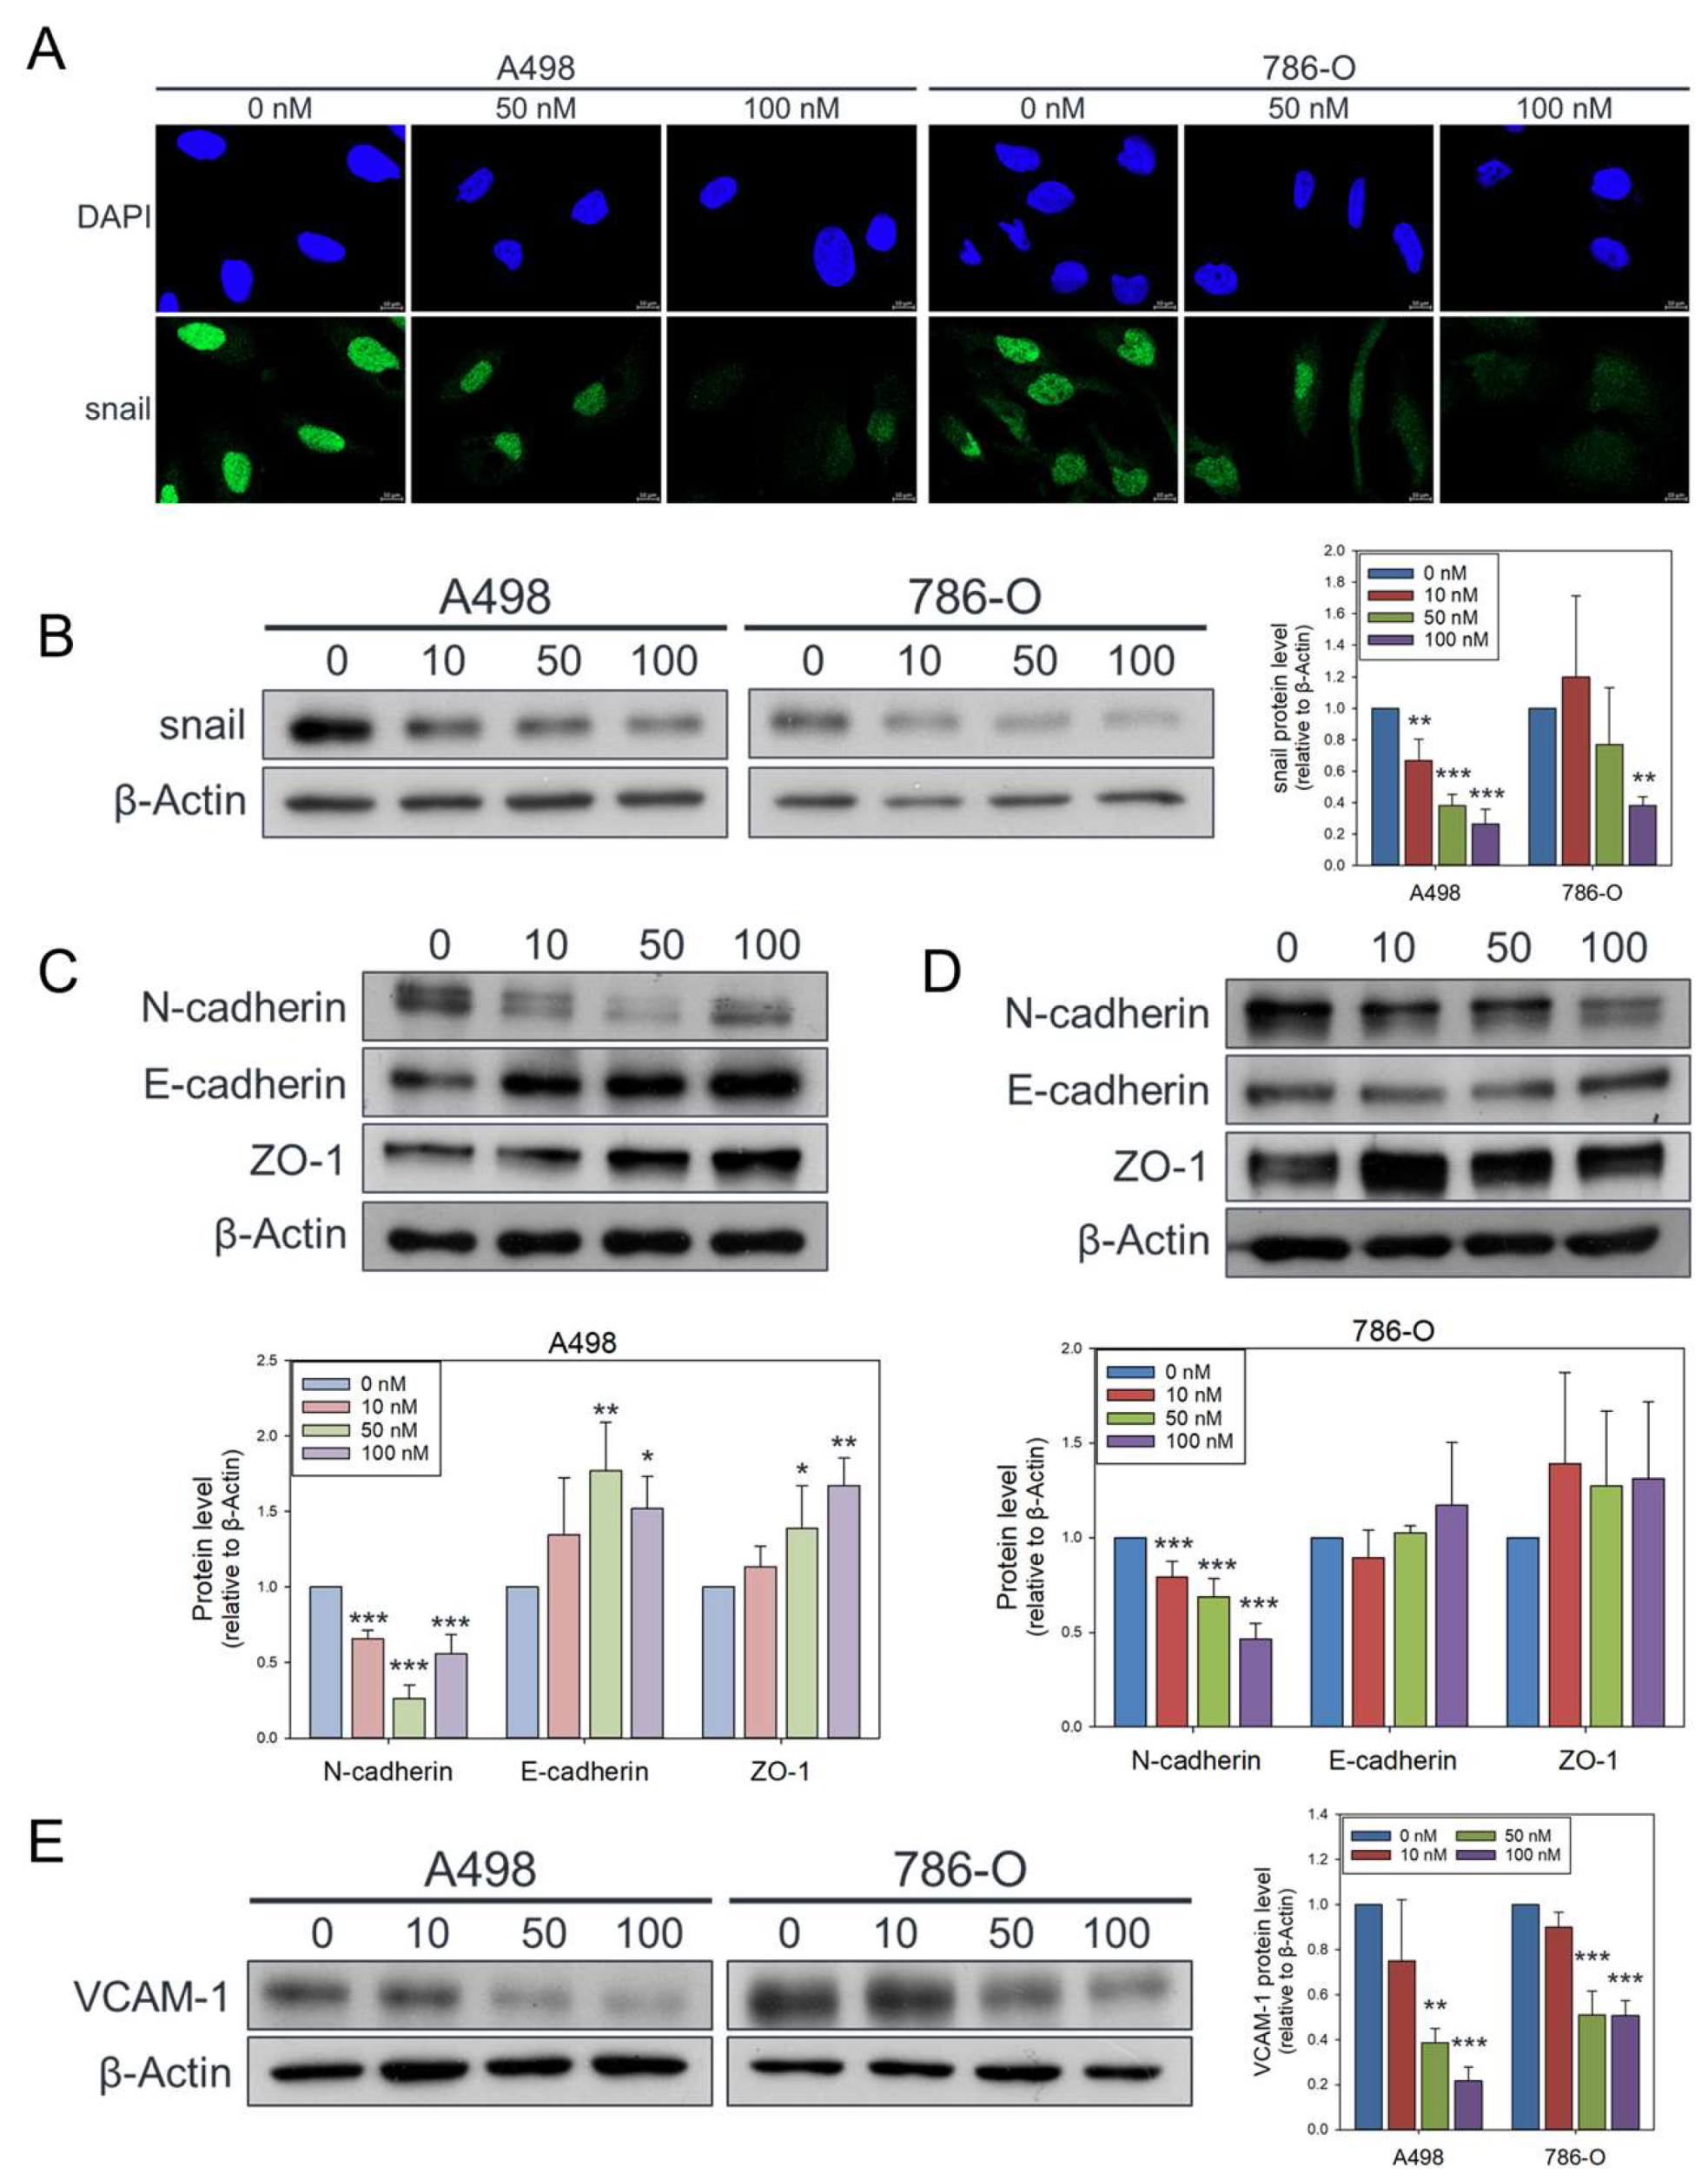
Figure 5.
Olivomycin A induces apoptosis in renal cancer cells. (A) Cells were treated with olivomycin A or vesicle control for 24 hours, and the percentage of apoptotic cells was determined by flow cytometry. Results are presented as the percentage of apoptotic cells; values represented mean ± SE from three independent experiments performed in triplicate (*p <0.05, **p <0.01, ***p <0.001 vs. controls). (B) Western blot analysis showing that olivomycin A markedly increased pro-apoptotic markers while reducing anti-apoptotic proteins in A-498 (top) and 786-O (bottom) cells. Cell lysates were resolved by SDS-PAGE and analyzed by Western blotting, with β-actin used as a loading control. Representative blots are shown. Quantitative data represent means ± SE from three independent experiments performed in triplicate (*p < 0.05, **p < 0.01, *** p < 0.001 vs. control). (C) Confocal microscopy of DAPI (blue), mitochondria (green), and cytochrome c (red) staining. Cells were treated with olivomycin A and a vehicle control and subjected to immunofluorescence analysis. Representative images show increased cytochrome c release from mitochondria into the cytoplasm in olivomycin A-treated cells compared with controls.
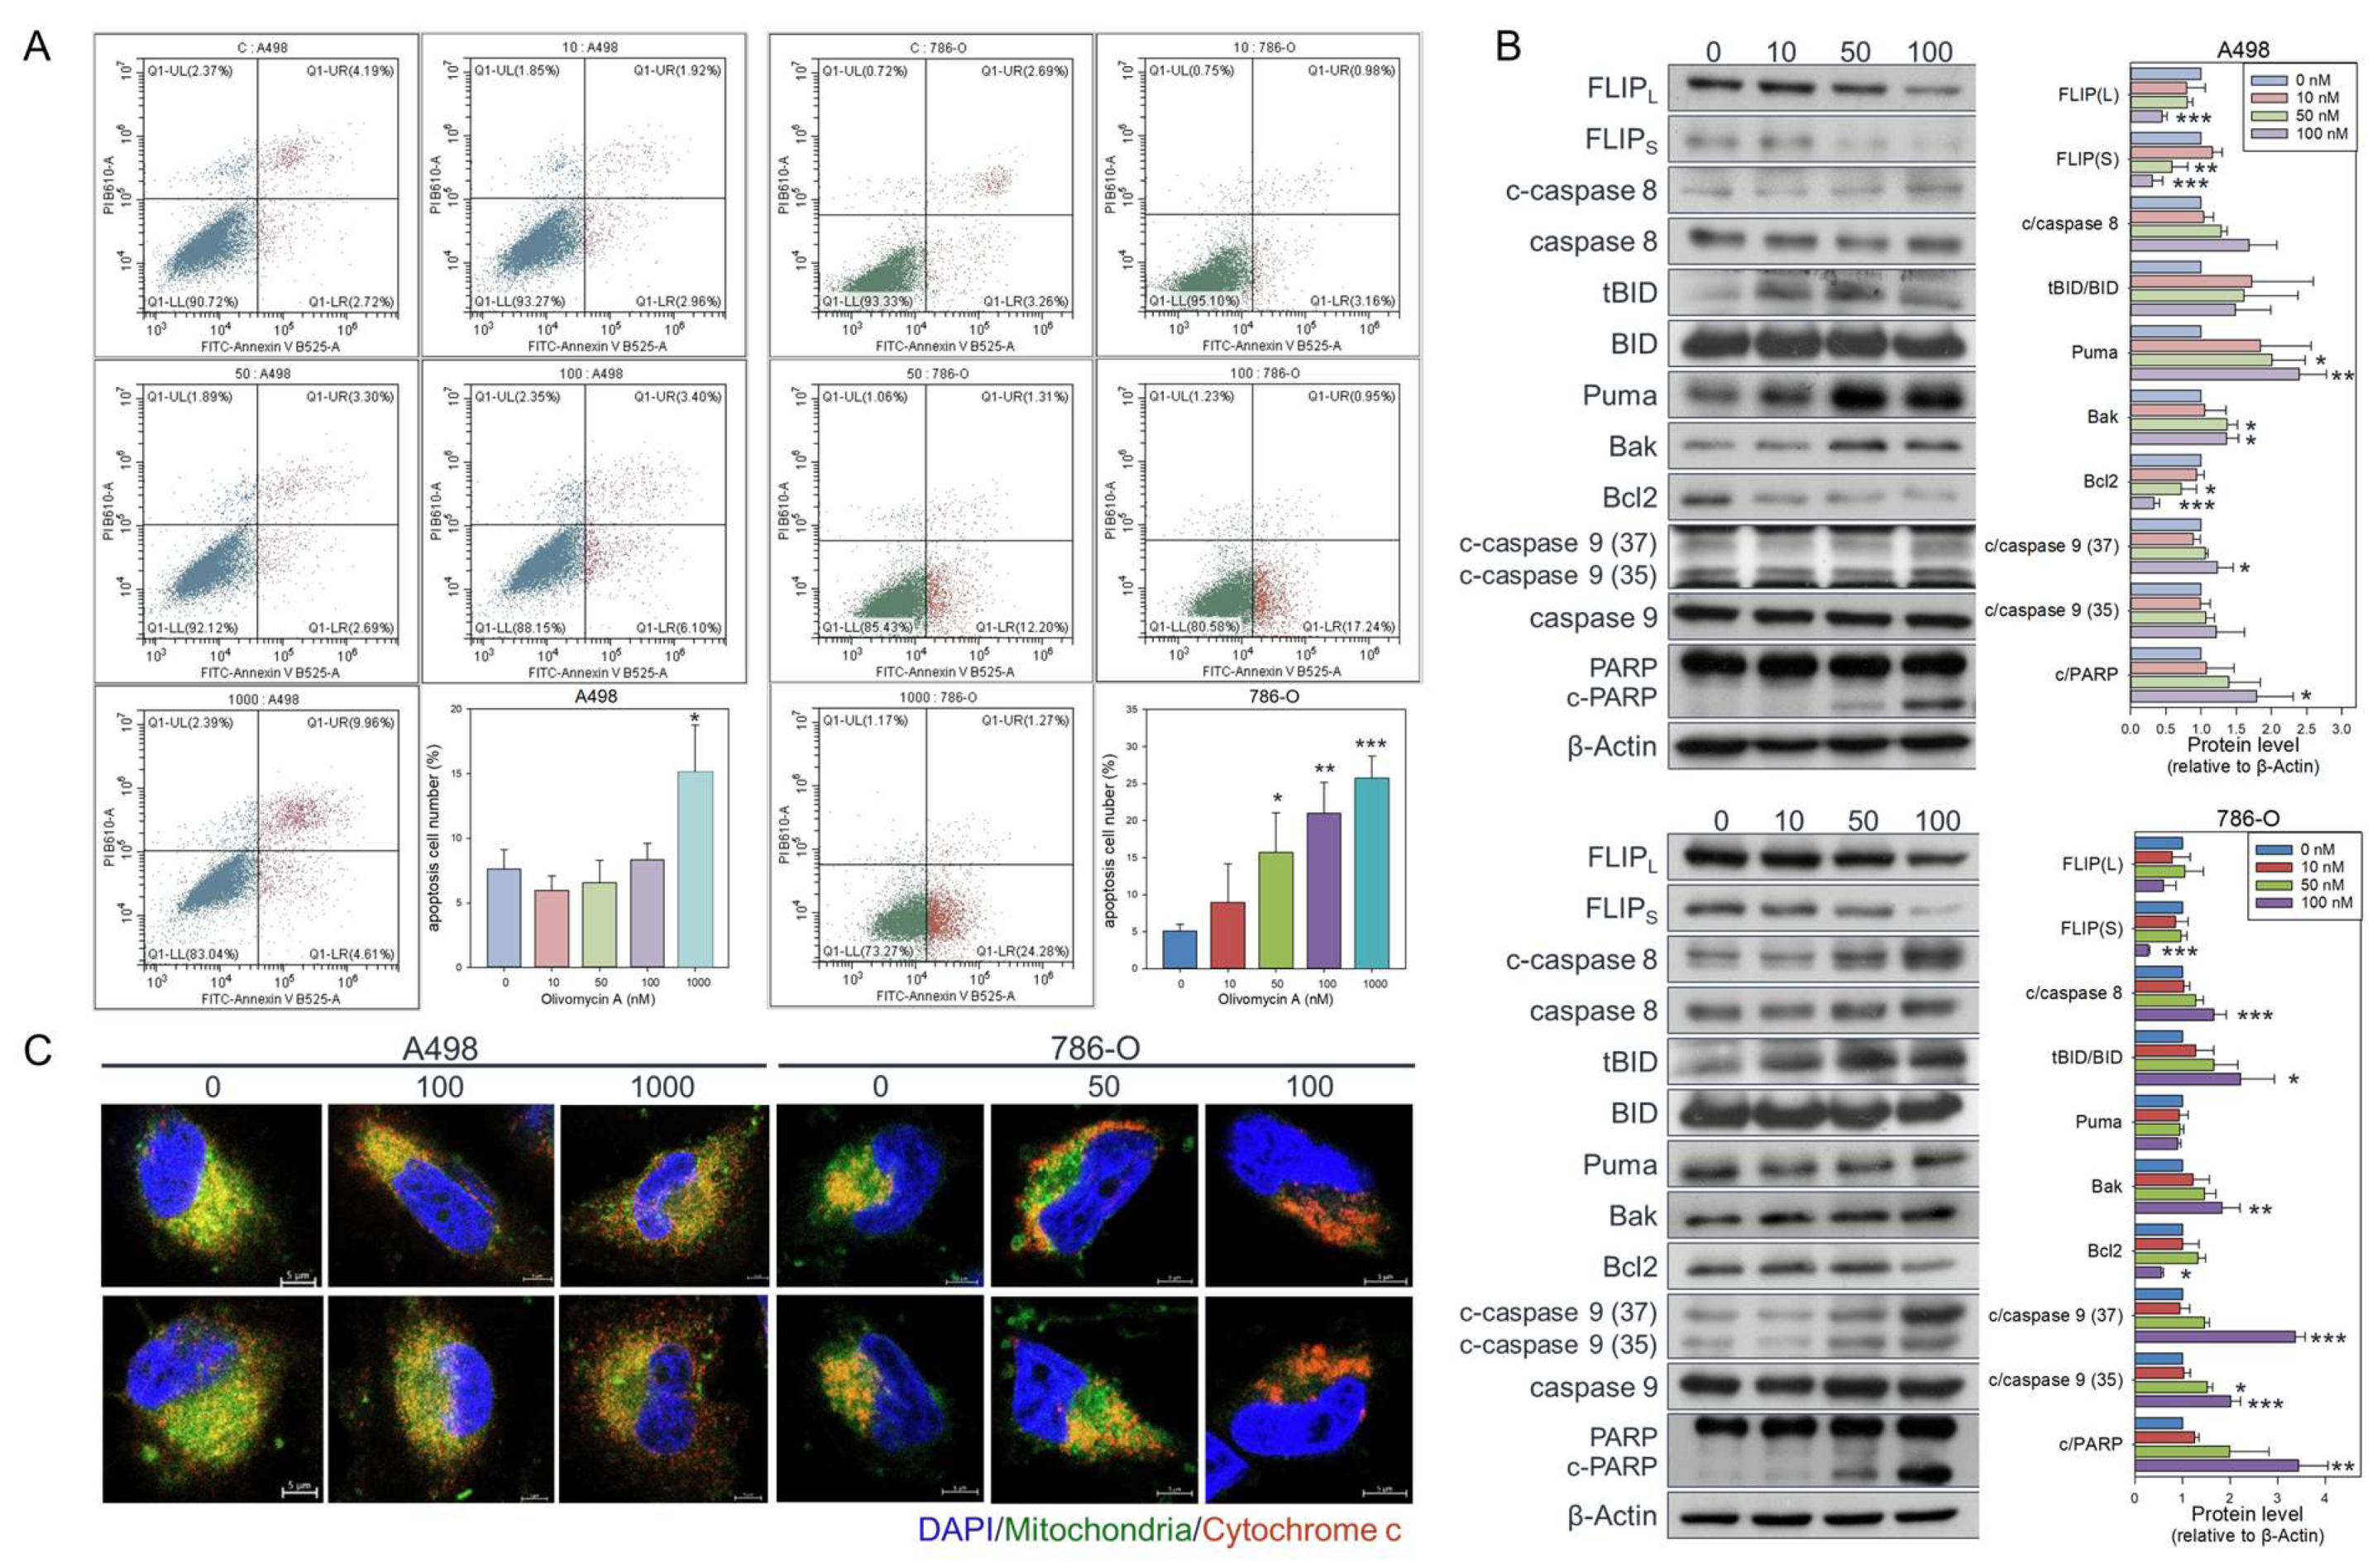
Figure 6.
Olivomycin A induces DNA damage signaling in renal cancer cells. (A, B) Western blot analysis showing that olivomycin A provoked expression of phosphorylated p53 (A) and H2AX (B). Cell lysates were resolved by SDS-PAGE and probed by the indicated antibodies, with β-actin used as a loading control. Representative blots are shown. Quantitative data represent means ± SE from three independent experiments performed in triplicate (*p < 0.05, **p < 0.01, *** p < 0.001 vs. control).
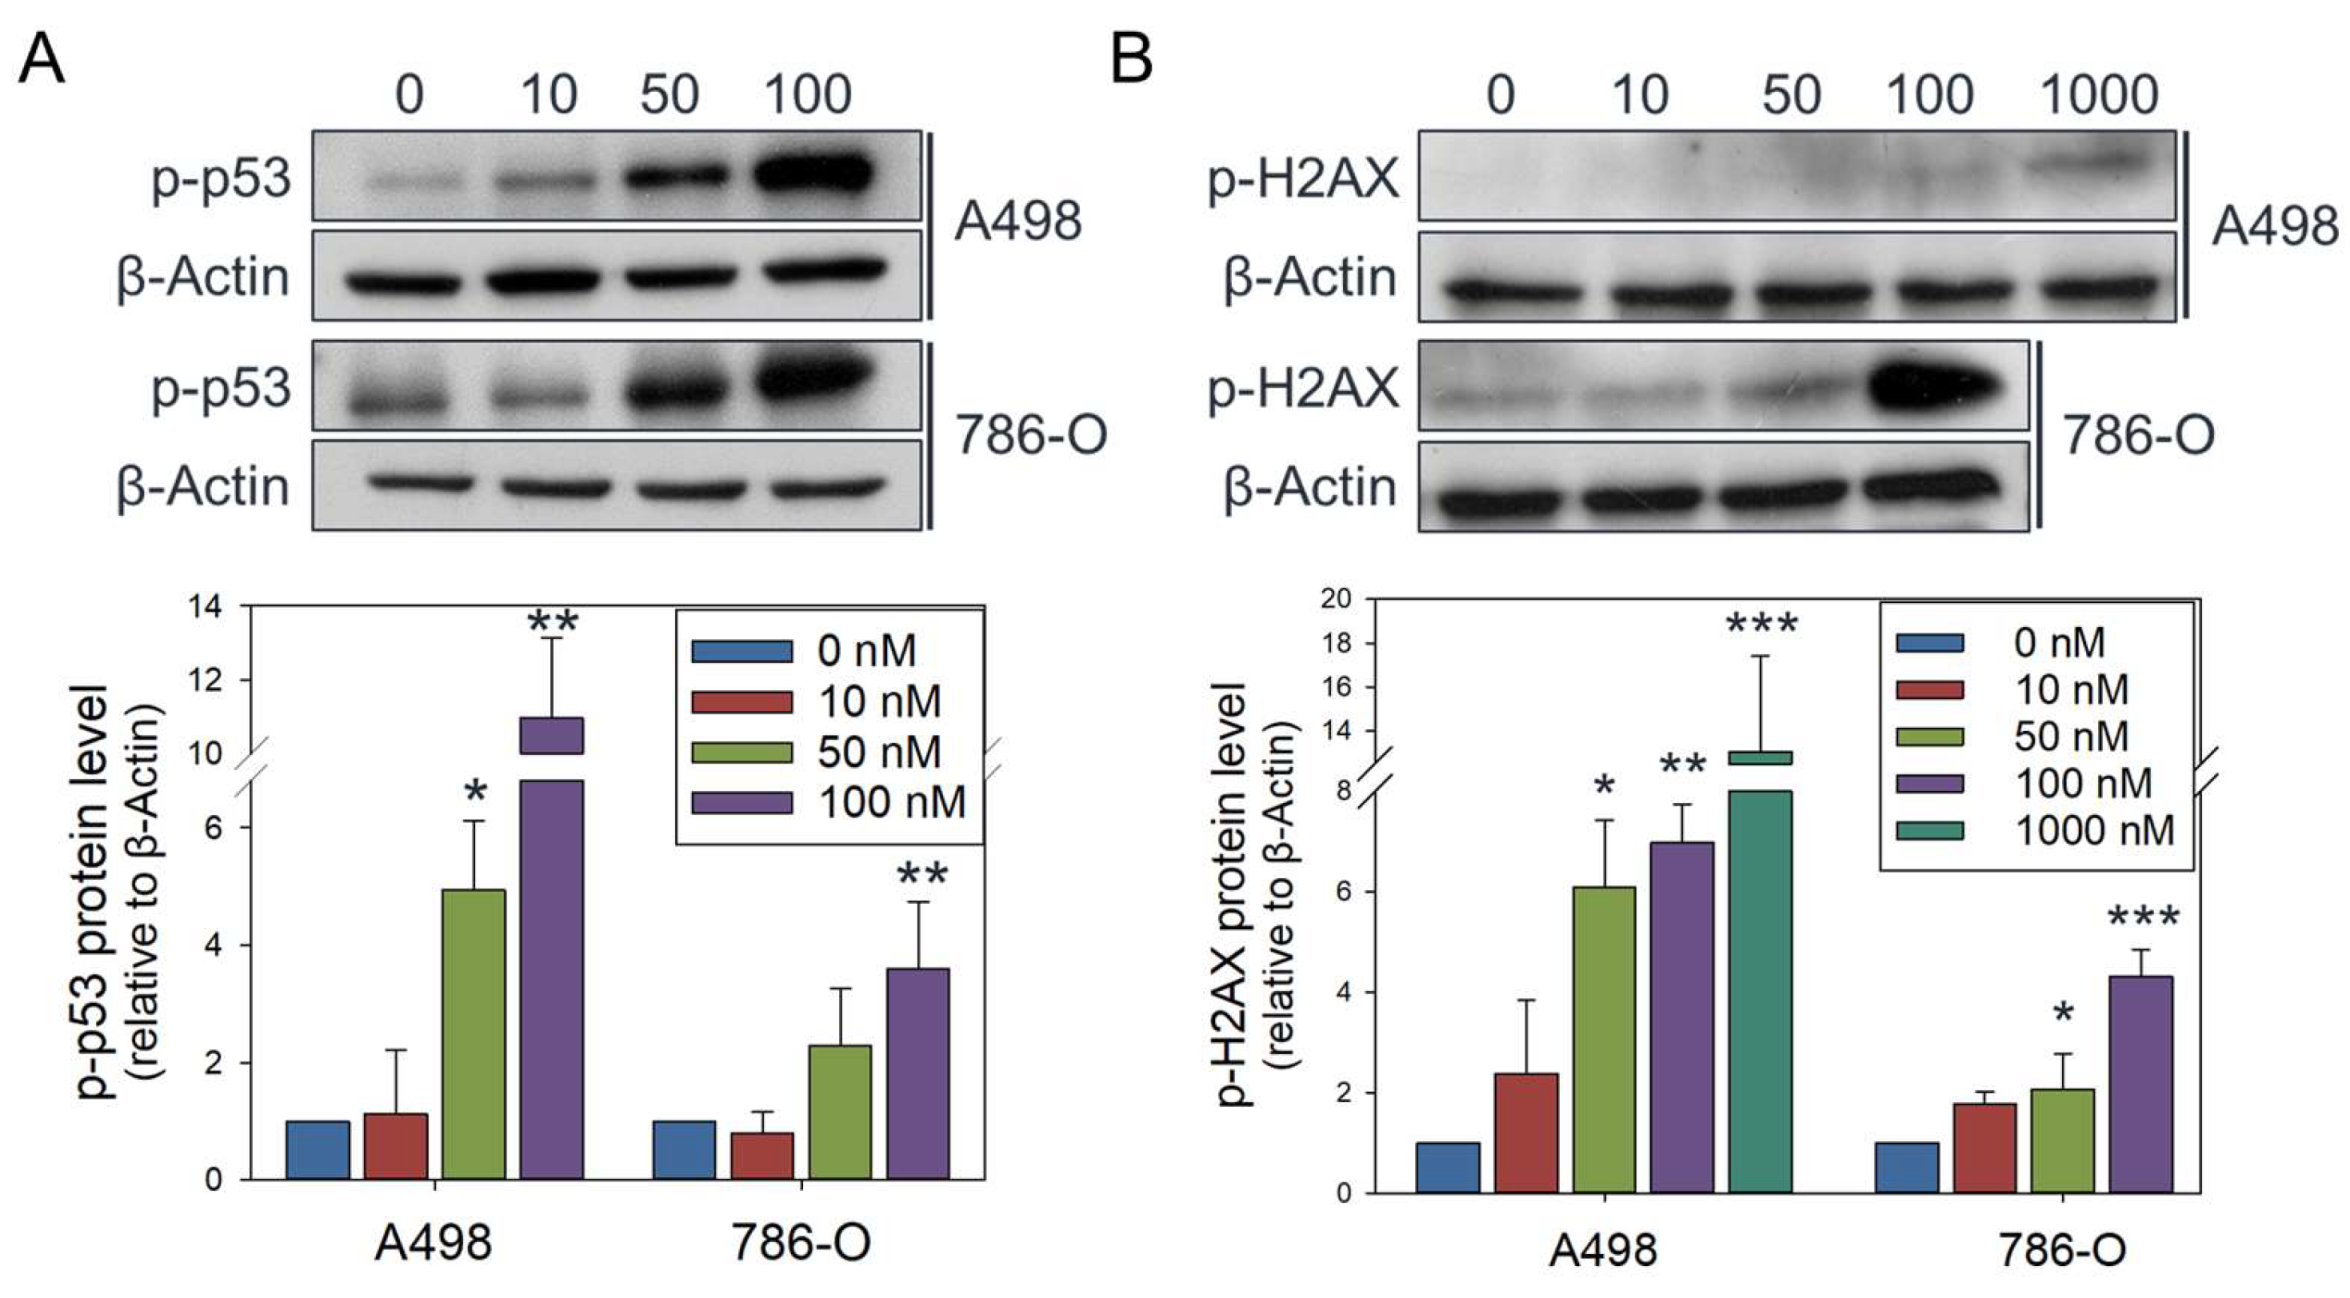
Figure 7.
Olivomycin A induces oxidative stress and lysosomal activity in renal cancer cells, effects reversed by NAC. (A) Fluorescent microscopy of DCFDA staining showing elevated ROS levels in cells treated with olivomycin A compared with vehicle control. (B) Confocal microscopy of DAPI (blue), MitoTracker (green), and LysoTracker (red) staining showing that olivomycin A treatment increased lysosomal activity and mitochondrial stress in 786-O cells, but not in A486 cells, relative to controls. (C) Confocal microscopy of DAPI (blue), MitoTracker (green), and LysoTracker (red) staining showing that NAC co-treatment attenuated olivomycin A-induced lysosomal activity and mitochondrial stress. Representative images are shown.
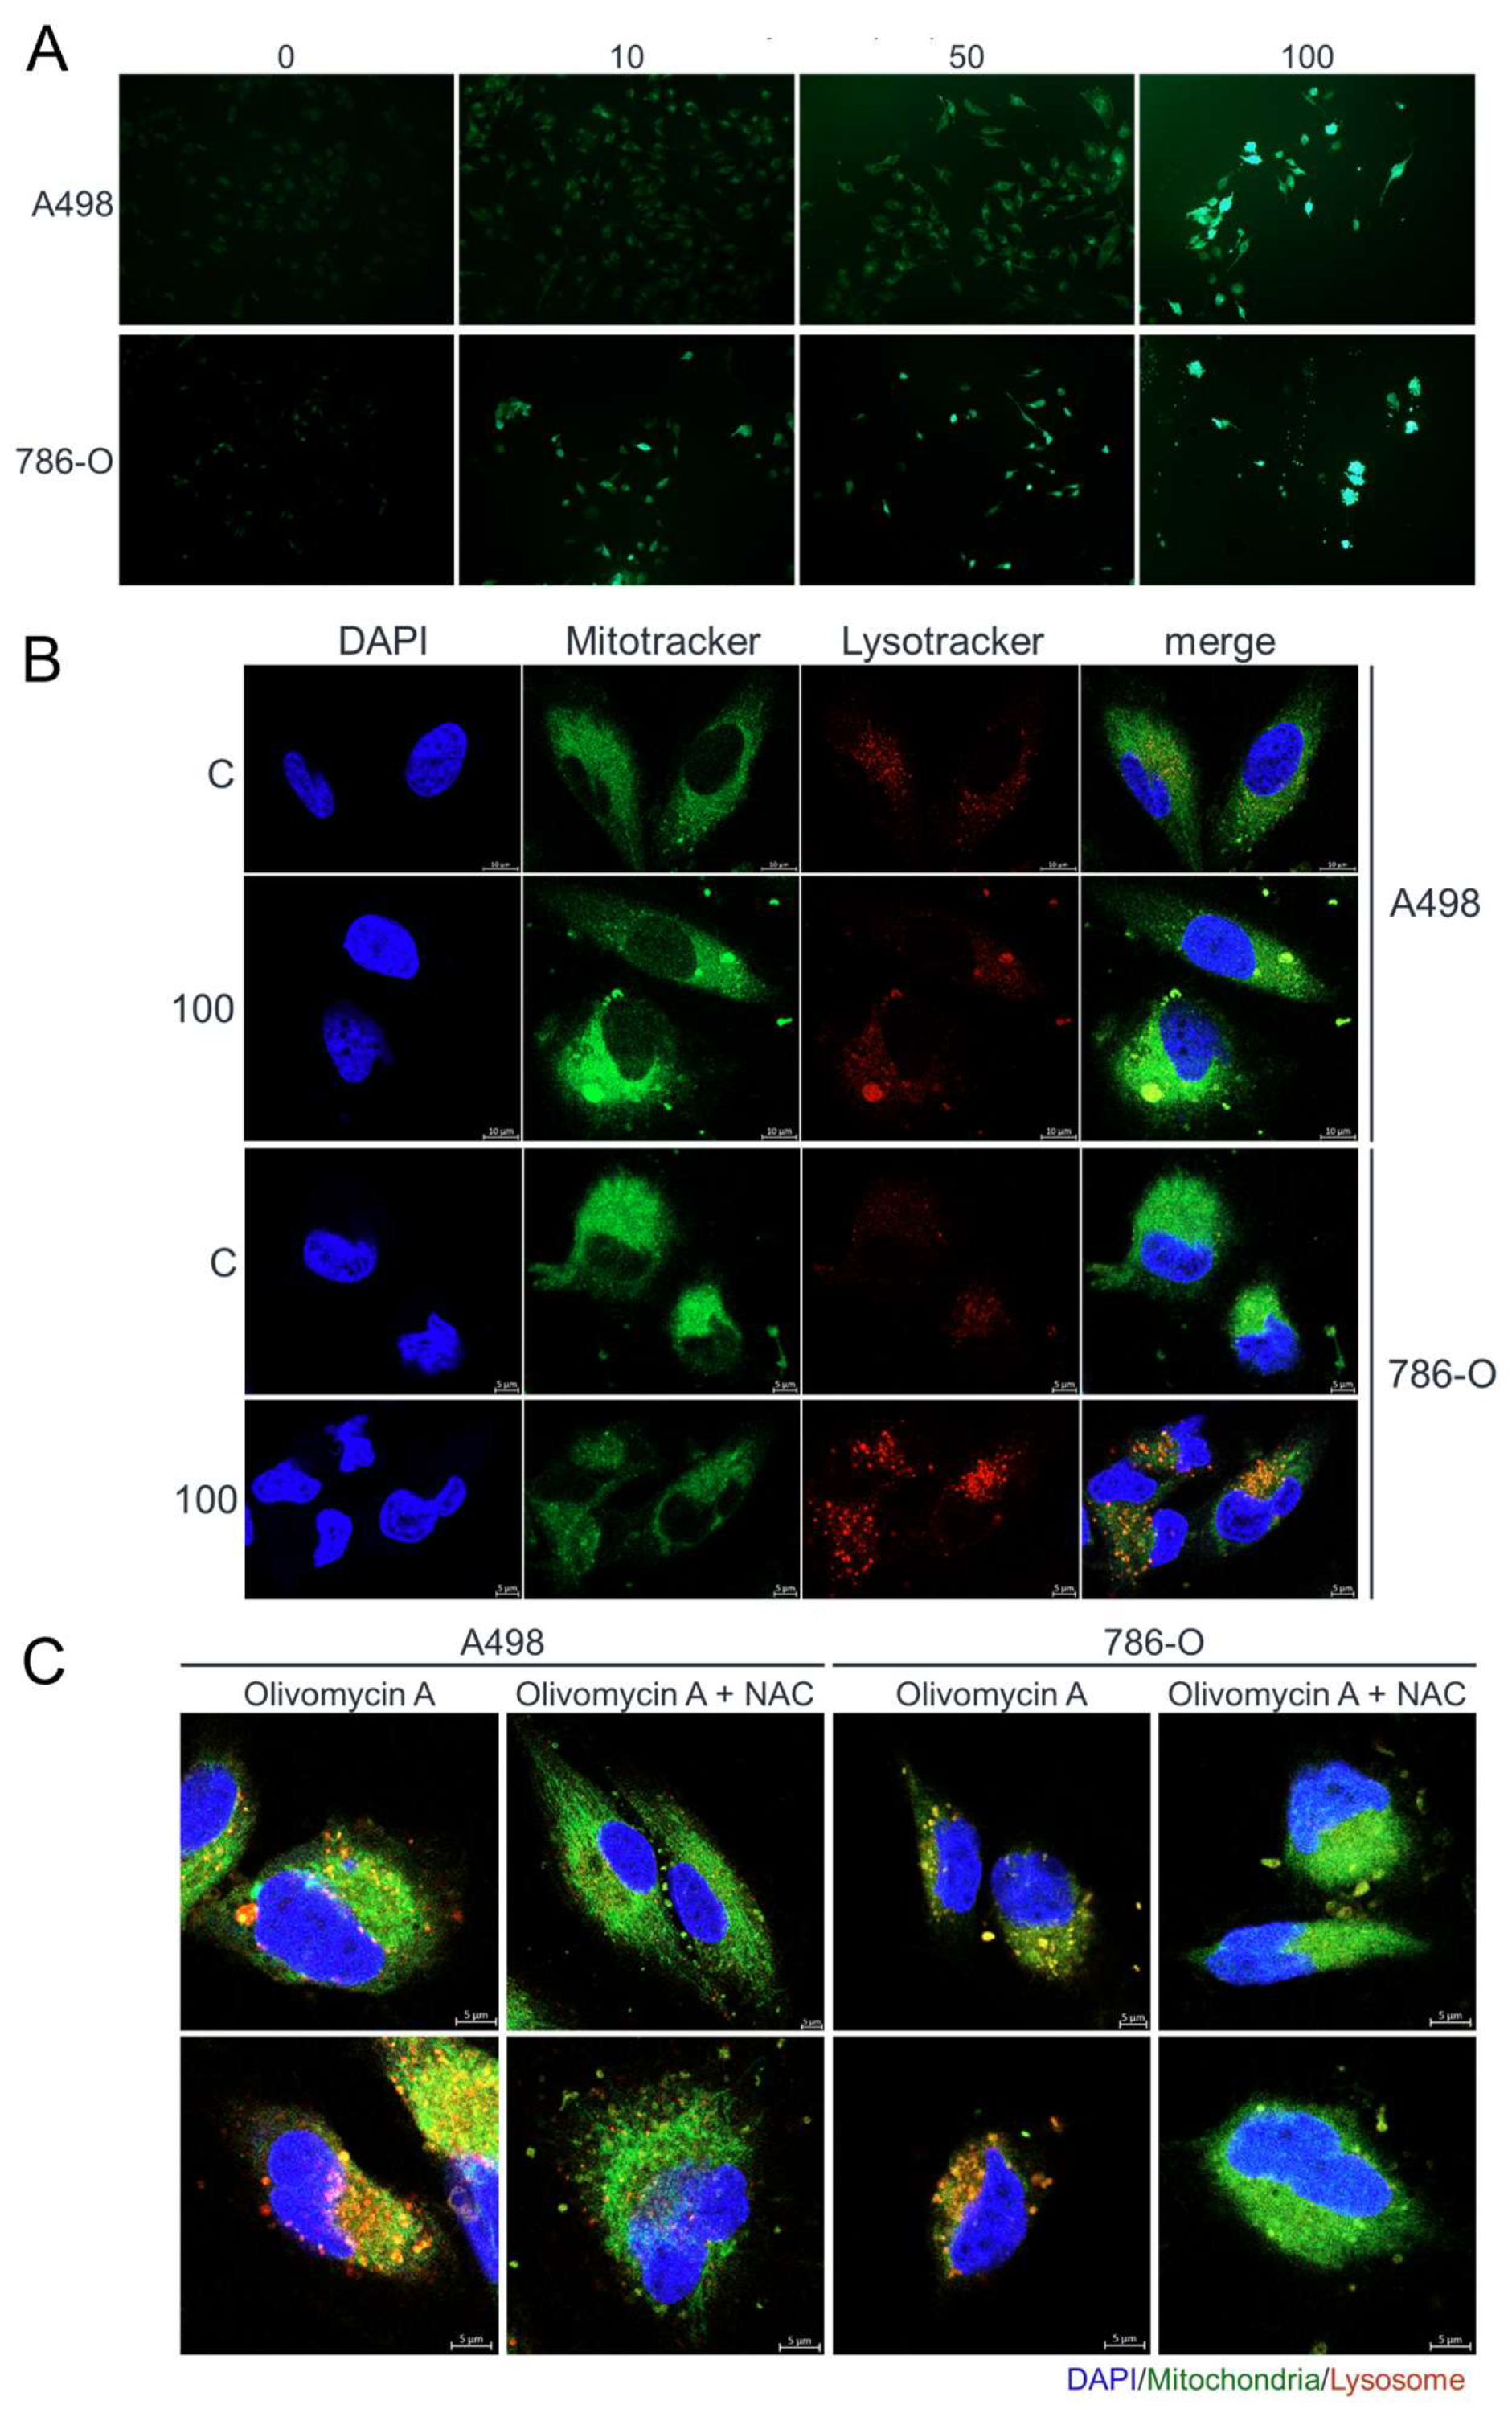
Figure 8.
Olivomycin A induces colocalization of mitochondria with PINK1 and Parkin in renal cancer cells. (A, C) Confocal microscopy of DAPI (blue), MitoTracker (green), and PINK1 (red) staining showing that olivomycin A treatment increases the localization of PINK1 to mitochondria modestly in A-498 cells (A), and prominently in 786-O cells (C), relative to controls. (B, D) Confocal microscopy of DAPI (blue), MitoTracker (green), and Parkin (red) staining showing that olivomycin A treatment increases the localization of Parkin to mitochondria in A-498 cells (B) but not in 786-O cells (D), relative to controls. Representative images are shown.
Disclaimer/Publisher’s Note: The statements, opinions and data contained in all publications are solely those of the individual author(s) and contributor(s) and not of MDPI and/or the editor(s). MDPI and/or the editor(s) disclaim responsibility for any injury to people or property resulting from any ideas, methods, instructions or products referred to in the content. |
© 2025 by the authors. Licensee MDPI, Basel, Switzerland. This article is an open access article distributed under the terms and conditions of the Creative Commons Attribution (CC BY) license (http://creativecommons.org/licenses/by/4.0/).
Copyright: This open access article is published under a Creative Commons CC BY 4.0 license, which permit the free download, distribution, and reuse, provided that the author and preprint are cited in any reuse.


