
Submitted:
21 September 2025
Posted:
22 September 2025
You are already at the latest version
Abstract
To improve the MWD technology and explore the relationship between rock parameters and drilling parameters, this paper carried out physical and mechanical experiments, built a small drilling platform ( including magnetic suction drilling, data monitoring system, rock confining pressure system ), and carried out 330 r/min, 360 r/min, 390 r/min three different specifications of the initial speed of the drilling experiment, and added 330 r/min initial speed drilling different strength rock drilling experiments. The experimental results show that rock drilling is divided into three stages: the initial stage of drilling, the crack propagation stage, and the bit retreating stage. The rotation speed has a great influence on the drilling speed, torque, weight on bit, and drilling time. According to the Pearson fitting relationship of drilling parameters, the correlation between F and PR is -0.783, indicating a strong positive correlation, and the correlation between RPM and PR is 0.827, indicating a strong negative correlation. The power function y=axb is used to fit the drilling parameters and rock parameters. The fitting effect is good, and the torque and uniaxial tensile strength R2 is as high as 0.9966. The experimental conclusion provides a theoretical basis for lithology identification in intelligent drilling and discusses the feasibility of a dynamic monitoring scheme for the drilling rig.
Keywords:
drilling parameters
; rock mechanics parameters
; monitoring while drilling
; intelligent identification
1. Introduction
Underground storage resources are abundant. In order to develop oil, natural gas, coal mines, and other energy sources safely and efficiently, countries continue to improve drilling technology. Drilling while drilling ( MWD ) technology was first used in the oil mining industry, and now MWD technology is widely used in the mining industry [1]. MWD provides various types of drilling parameters in the process of coal mining [2], and the drilling parameters that can be captured include drilling depth, drilling pressure, rotational speed, torque, and thrust [3]. In field application, drilling parameters are associated with rock parameters, which can provide a data basis for rock quality evaluation and stability evaluation [4] to estimate rock mass conditions [5]. During drilling, the measurement while drilling system captures complex data and generates a large number of data sets that are not easy to process [6]. How to effectively use data is an important prerequisite for improving the efficiency of measurement while drilling [7], so as to achieve the purpose of accurate dynamic monitoring [8].
Monitoring while drilling is a key task in mining engineering. Mehrbod Khoshouei [9] combined vibration acoustic signals with drilling rig parameters to monitor drilling-specific energy ( SE ). Chunhua Lu [10] proposed a system to receive signals from adjacent wells, which effectively improves the signal strength and reduces the occurrence of faults. The above research realizes signal reception by transmitting the cutting rock breaking parameters of the drill bit during the drilling process of the drilling rig [11], and then carries out prediction while drilling. Therefore, some scholars have studied the rock breaking mechanism of the drill bit from the root and revealed the basic theory of MWD technology [12]. Weiji Liu [13] analyzed the rock-breaking mechanism of the PDC bit and studied the mechanical interaction between the PDC bit and rock. Bei Jiang [14] deduced the relationship between digital borehole parameters ( DDP ) and c-φ parameters ( c is cohesion, φ is internal friction angle ) according to the principle of rock cutting limit equilibrium. Haoteng Wang [15] established a cutting energy model to describe the relationship between rock cutting energy characteristics and mechanical parameters. Mingming He [16] studied the anisotropy of drilling mechanical properties during rock cutting to better evaluate the mechanical properties of rocks in storage environments. At present, the research focus of the cutting mechanism is on bit-rock interaction [17,18], but the basic theoretical relationship between bit drilling parameters and rock parameters in the drilling process needs to be clarified.
Most scholars have used laboratory tests [19] and numerical simulations [20] to construct the relationship between rock parameters and drilling parameters for LWD monitoring technology. Guanghui Wang [21] constructed a drilling model to reveal the correlation between cuttings weight and rock mass stress during drilling. Yanlong Li [22] improved the drilling process monitoring ( DPM ) system and established the mathematical relationship between drilling efficiency and drilling parameters. Sajjad Kalantari [23] proposed a model for estimating rock parameters using drilling data. Feng Shangxin [24] conducted drilling tests using a rotary non-percussive drilling rig to study the effects of drilling parameters, contrast energy ( SE ), and drilling rate ( ROP ), and rock properties. Yi-Ming Li [25] extracted the three-dimensional parameter field of rock based on the numerical control drilling parameters by establishing the damage model. It is worth noting that the above research only explores the relationship between drilling parameters and rock parameters on the surface layer [26], and does not deeply analyze and monitor the changes of original data during drilling [27].
With the development of machine learning technology, more and more scholars combine machine learning theory with rock strength prediction while drilling [28]. Artificial neural networks have been widely used [29]. Osama Siddig [30] used more than 2200 data points to develop and test artificial neural networks and build related models. RBF neural network shows strong generalization ability [31]. Mingqiang Wei [32] established the optimal RBF model and proposed a new data-driven rock mechanics parameter ( RMP ) prediction method. Mingming He [33] applied the deep convolutional neural network ( DCNN ) technology to the estimation of rock mechanics parameters during continuous drilling. Most of the previous work has focused on using machine learning models to express the relationship between rotational speed and uniaxial compressive strength [34,35], and less attention has been paid to other drilling parameters and rock parameters.
In this paper, uniaxial compression, uniaxial tensile, and triaxial compression tests of rock are carried out to accurately obtain various parameters of rock. Various types of sensors were developed, a small drilling rig platform was built, and different speeds were used to drill the same kind of rock-gneiss under the same confining pressure conditions, and various parameters in the drilling process were collected at the same time. By observing the variation of drilling parameters during drilling, the influence of rotation speed on drilling efficiency and various parameters is analyzed. The coupling relationship of drilling parameters is analyzed by the Pearson method, and the experiment of drilling different strength rocks under the same drilling speed is supplemented. The correlation between rock mechanics parameters and drilling parameters is studied, and the feasibility of a dynamic monitoring scheme of the drilling rig is discussed.
2. Equipment and Methods
2.1. Drilling Platform Construction
Large drilling rigs are often used in the mining of underground work in coal mines [27].In order to make the experiment more accurate, a small drilling rig has been developed to explore the relationship between drilling parameters and rock parameters. The experimental platform is shown in Figure 1. The small drilling platform is mainly based on the D8860RE magnetic drill, and the data monitoring system is added, which is equipped with the rock confining pressure system. The drilling rig mainly includes a power system, a control system, a guide rail drilling system, and an ultra-strong suction magnetic seat device. The technical parameters are shown in Table 1. The rotation speed of the drilling rig is generated by the power system, and the speed control button of the adjustment control system realizes the stepless speed regulation. The drill bit is controlled to move on the guide rail by rotating the tripod handle, and the test piece is drilled. It should be noted that this drilling platform belongs to semi-automatic control. The data monitoring system is manually opened before the drilling starts, and the drilling pressure is manually controlled during the experimental drilling process. After the drilling is completed, press the stop button, close the data monitoring system, and control the drill bit to rise up along the guide rail.
The dynamic digital characterization of drilling rig data is very important in the study of the relationship between drilling parameters and rock parameters [36]. The data monitoring system includes a cable displacement sensor, a dynamic torque-speed sensor, a three-axis vibration sensor, a pressure sensor, and its corresponding data collection software. The experimental platform is equipped with multiple types of sensors, which can dynamically monitor drilling parameters during drilling and realize multi-parameter precision monitoring. The sensor is easy to install and disassemble, and the data transmission is rapid and accurate. The technical parameters are shown in Table 2.
The displacement sensor is installed on the main body of the drilling rig. The photoelectric coding technology is used to convert the mechanical displacement into electrical signals. During the drilling process, the change of the drill pipe drives the change of the rope of the displacement sensor. The sensor outputs electrical signals, which are collected and recorded by the acquisition system. The dynamic torque-speed sensor is installed on the drill pipe to monitor the rotational torque exerted by the drill bit on the rock and the rotational speed of the drill bit during the rotation process. [37] The sensor is equipped with an instrument to directly display the rotational speed. When the drill pipe is hindered, the strain gauge resistance changes, and the sensor outputs a frequency signal; when the drill bit rotates, the sensor converts the speed signal into a pulse signal, and the device outputs 60 pulses per rotation cycle. The sensor monitoring software records dynamic data with high precision. The three-axis vibration sensor is magnetized on the rock confining pressure system. The sensor converts the vibration mechanical quantity of the rock during the drilling process into an electric quantity [38], and the acquisition system monitors the dynamic displacement change of the rock confining pressure system. Three pressure sensors are placed at the bottom of the rock to prevent the instability of the center of gravity. The uniform placement of pressure sensors can effectively measure the force exerted by the drill bit on the rock. The system is equipped with instruments to display the value directly, which is convenient for manual rotation of the tripod handle to control the drilling pressure during the experiment.
The drilling rig adopts a double-wing PDC bit with a diameter of 28 mm. The PDC tooth is composed of a cemented carbide matrix and a polycrystalline diamond layer, as shown in Figure 2. It has high wear resistance and stability [39,40]. The drill bit drills and cuts the original rock mass. The rock cracks at any point around the PDC tooth, and the crack expands to the surrounding area to form debris.
The rock confining pressure system consists of a hollow steel cylinder with a detachable end and its supporting equipment. A polyurethane rubber sleeve is installed in the device, which contains a U-shaped seal to form a pressurized chamber for the hydraulic fluid. The tensile strength of the rubber film is more than 38 MN/m2, and the hardness is 95. An inlet with a 9.525 mm quick connection and an outlet with a plug are installed for the saturation of the pressurized chamber, as shown in Figure 3. Before the experiment, the cylindrical rock sample was inserted into the chamber through the closed membrane. Using a manual pump, the cylinder is immersed in hydraulic oil, which is retained in the annular space formed between the rubber film and the cylinder. Observe the dashboard and stop after applying 2 MPa confining pressure. Each end of the rubber film is integrated with a ‘U’ -shaped seal and is equipped with a rebar cylinder. This operation makes it possible to fix the rock during the drilling process.
2.2. Materials and Rock Mechanics Parameter Experiment
In practical engineering, underground rock is often in a triaxial stress state. In order to accurately obtain rock mechanical parameters, uniaxial compression test, uniaxial tensile test, and triaxial compression test are carried out. In this experiment, the surrounding rock of the Calchaer fluorite mine was selected as the experimental material. The surrounding rock of the ore body belongs to gneiss, which exists in a large number of underground mines and is typical. The collected rock was made into a φ50×100 mm sample to carry out uniaxial compression test and triaxial compression test, and the φ50×25 mm sample was subjected to uniaxial tensile test.
The uniaxial compression test adopts the mine rock mechanical property test system. The rock uniaxial compression test data are shown in the summary Table 3, and the uniaxial compressive strength calculation formula is shown in formula 2-1 :
where: Rc - Uniaxial compressive strength, MPa ;
Pmax - Maximum failure load of rock specimen, N ;
A - Compression area of specimen, mm2.

Table 3.
Summary table of rock uniaxial compression test data.
| Specimen number | Peak load Pmax(KN) | Elastic modulus E(GPa) | Poisson ratio μ | UCS (MPa) |
Average compressive strength(MPa) |
| I-1 | 161.80 | 8.15 | 0.26 | 78.13 | 76.3 |
| I-2 | 146.08 | 8.20 | 0.23 | 74.40 | |
| I-3 | 150.19 | 8.02 | 0.24 | 76.50 |
The uniaxial tensile test adopts the Brazilian splitting method. The uniaxial compression test data of the rock are shown in Table 4. The uniaxial tensile strength calculation formula is shown in formula 2-2 :
where: σt - Uniaxial tensile strength of rock specimen, MPa ;
Pmax - Failure load, N ;
D、H - The diameter and height of the specimen are respectively, mm.
Table 4.
Data sheet of rock uniaxial tensile test.
| Specimen number | Height h (mm) |
Diameter d(mm) | Peak load Pmax(KN) | Tensile strength(MPa) | Average tensile strength(MPa) |
| Ⅱ-1 | 26.4 | 48.4 | 8.62 | 4.29 | 4.45 |
| Ⅱ-2 | 26.2 | 48.7 | 12.32 | 6.15 | |
| Ⅱ-3 | 26.4 | 49.4 | 5.93 | 2.90 |
The triaxial compression test adopts the American GCTS RTR-1000 high temperature and high pressure rock mechanics test system, as shown in Figure 4. The GCTS RTR-1000 rock triaxial test system is a high-performance rock mechanics test equipment developed and manufactured by the American GCTS company, which is specially designed for the conventional triaxial test of rock. The high-strength stainless steel pressure chamber equipped with the system is designed with O-ring and hydraulic double seals to ensure reliable sealing in high-pressure environments. The system is especially suitable for testing standard rock samples with a diameter of 50 mm and a height of 100 mm. The instrument operation steps are shown in Figure 5. The Mohr-Coulomb strength criterion is a classical theory to describe the shear failure of rock and soil mass. The core of the Mohr-Coulomb strength criterion is to establish the linear relationship between shear strength and normal stress [41], and then the internal friction angle ( φ ) and cohesion ( c ) are obtained by fitting the experimental data. The triaxial compression test data of rock are shown in Table 5, and the calculation formula is shown in formula 2-3 :
where: τ - shear strength of rock when shear failure occurs, MPa ;
σₙ - normal stress on shear plane, MPa ;
c - rock cohesion, MPa ;
φ - the internal friction angle of rock, °.
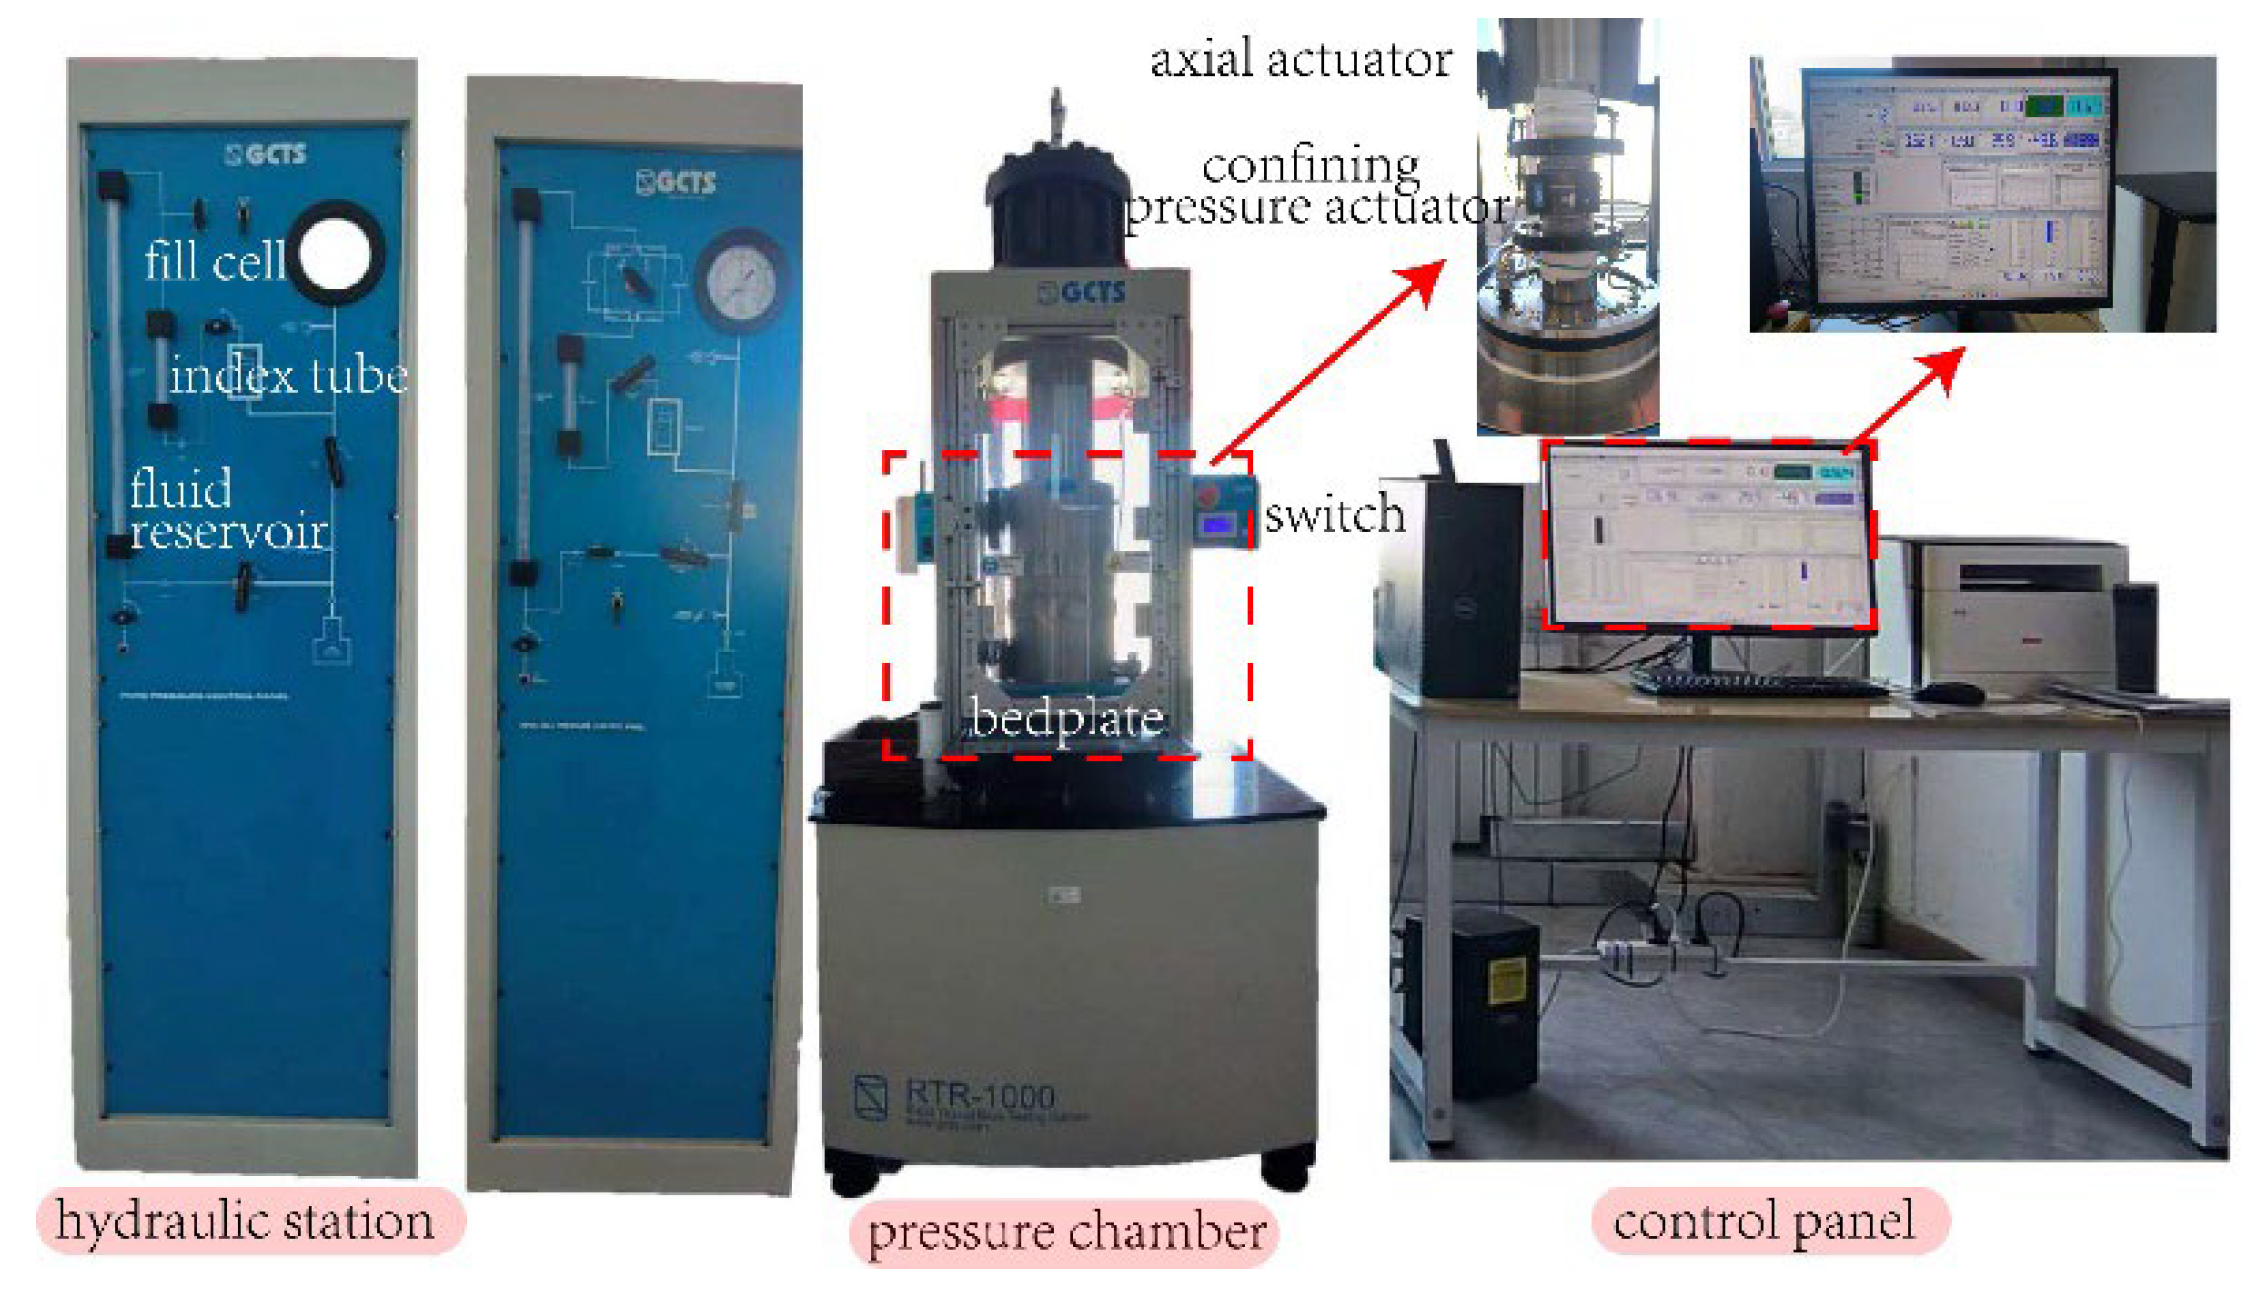
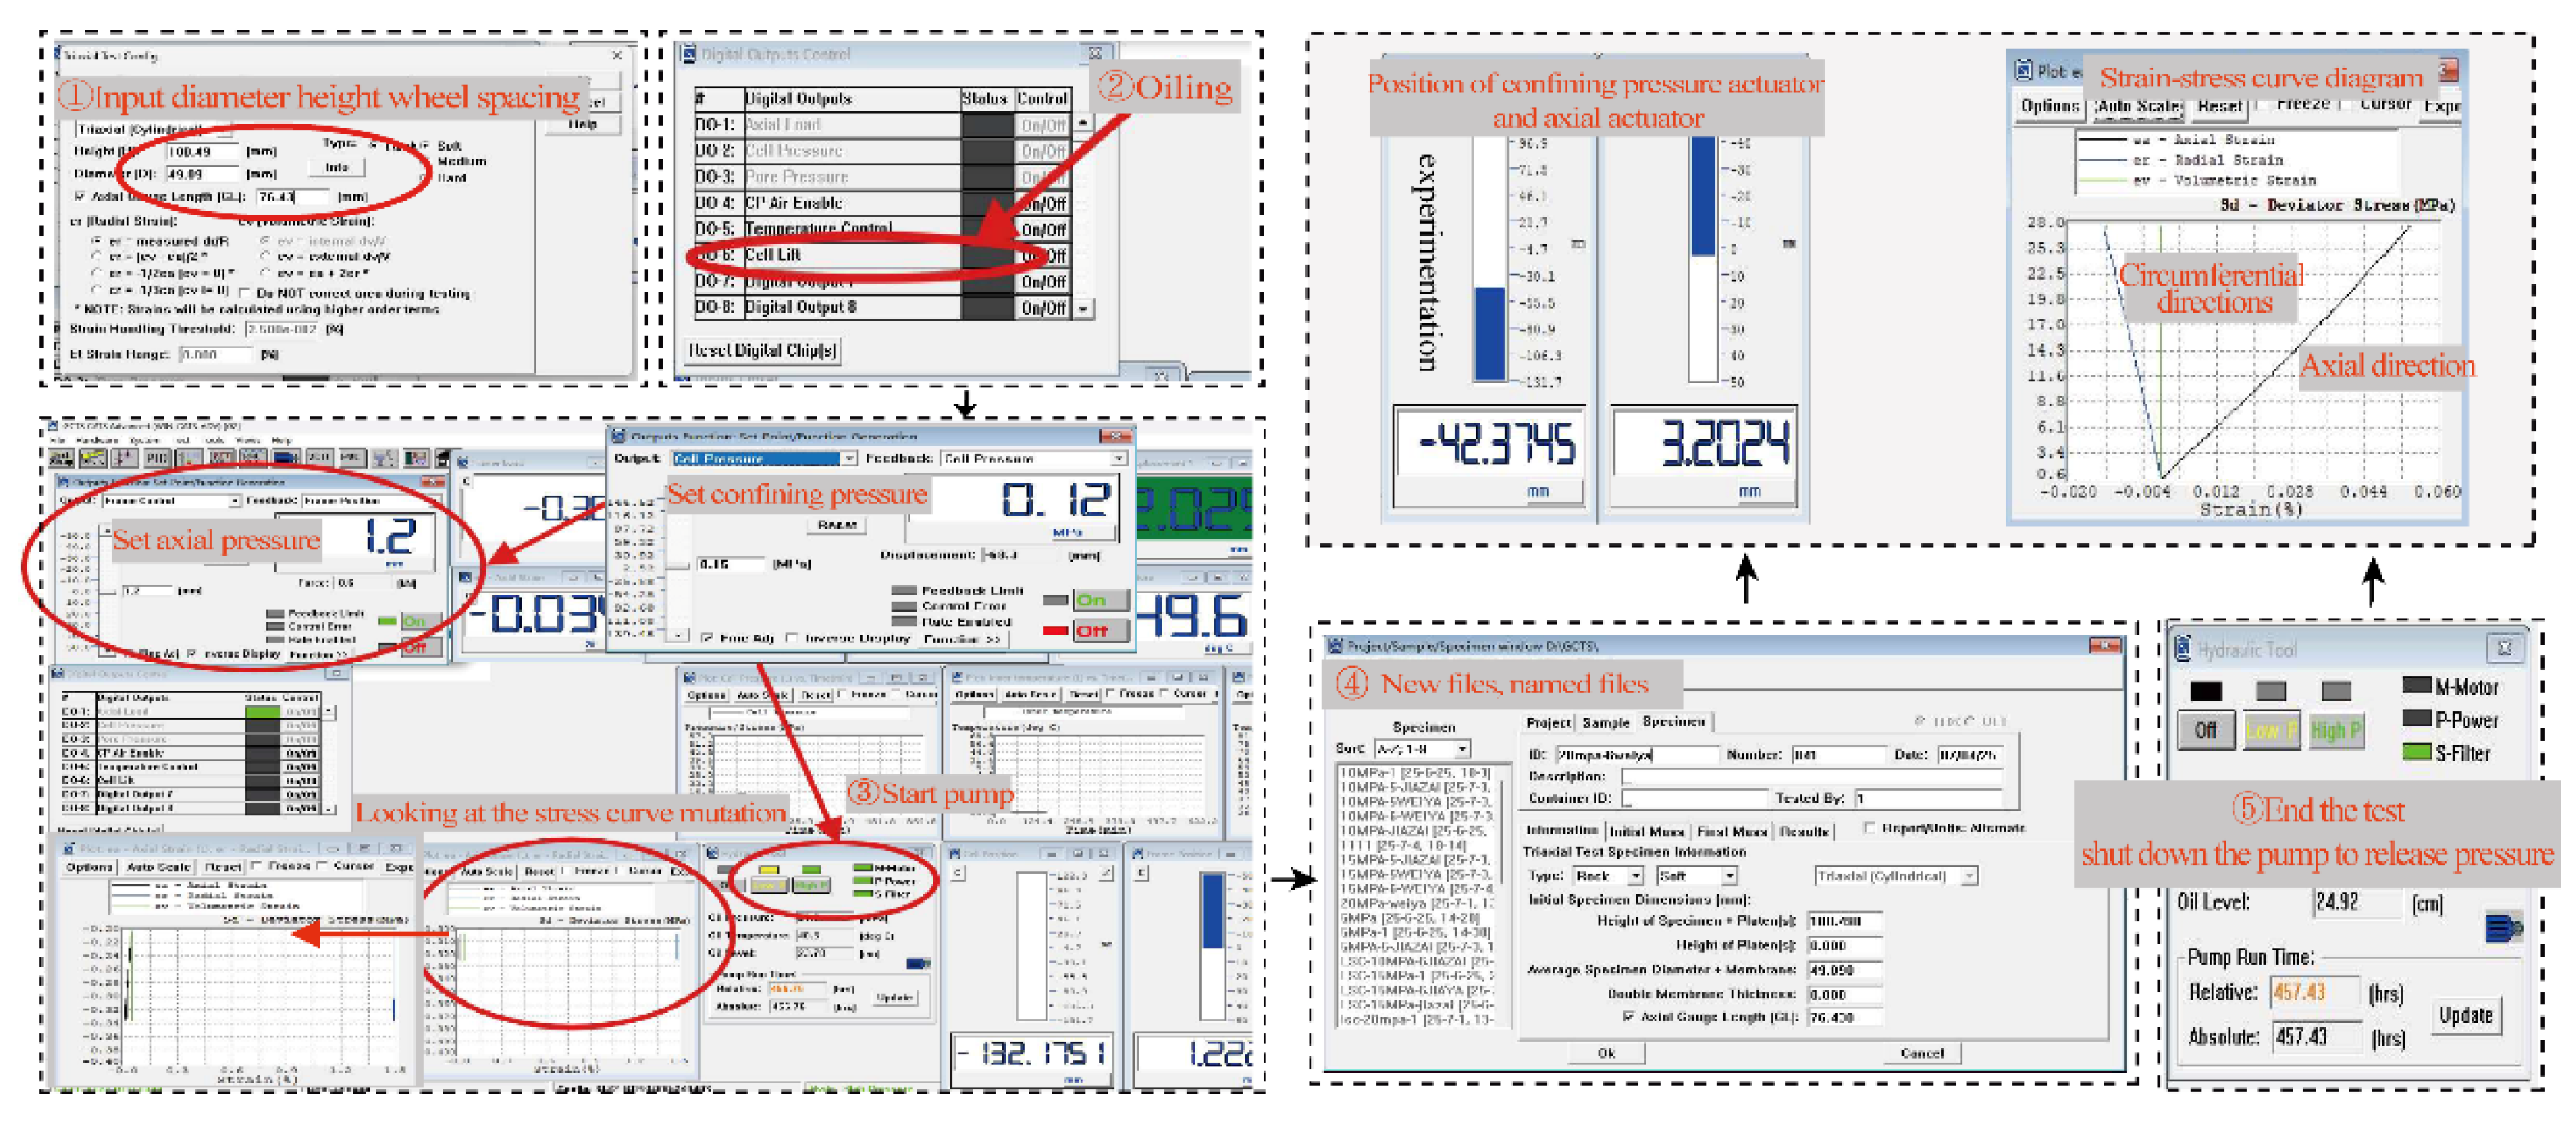
Figure 4.
Triaxial compression experimental device.
Figure 5.
Instrument operation steps.
Table 5.
Rock triaxial compression test data table.
| Specimen number | Confining pressure σ3(MPa) | Axial failure stress σ1(MPa) | Force of cohesion c (MPa) | Angle of internal friction φ (°) | Triaxial strength mean (MPa) |
| Ⅲ-1 | 5 | 148.53 | 4.12 | 40.03 | 187.72 |
| Ⅲ-2 | 10 | 233.18 | |||
| Ⅲ-3 | 15 | 209.06 | |||
| Ⅲ-4 | 20 | 160.11 |
2.3. Drilling Process
This paper mainly studies the relationship between drilling parameters and rock parameters. The self-built drilling platform is used to carry out rock drilling experiments at different speeds. The variation law of drilling parameters during the drilling process is analyzed, and the feasibility of studying rock parameters through drilling parameters is explored, which lays a foundation for dynamic monitoring of the drilling process [42].
In this experiment, the rock is placed in the rock confining pressure system. The specimen is φ110 × 145 mm, as shown in Figure 6. The manual pump is used to keep the hydraulic oil in the annular space formed between the rubber film and the cylinder. The confining pressure is applied to 2 MPa to ensure that the specimen is fixed during drilling. Before the experiment, multiple sensors are installed in the main body of the drilling rig, the data monitoring software is opened, each sensor is debugged to the best state, and the rotation speed is adjusted to the specified target by rotating the knob. Adjust the position of the magnetic suction drilling rig on the test bench so that the drill bit is aligned with the center of the test piece, and the drill bit is slightly offset during the drilling process. We do not discuss this situation. In the preliminary experiment, the phenomenon of sticking is easy to occur when the rotation speed is too slow, and it is not easy to observe the effective experimental phenomenon when the rotation speed is too fast. After several attempts, this experiment sets three initial rotation speeds of 330 r/min, 360 r/min, and 390 r/min, and the drilling depth is 120 mm. Three parallel drilling experiments were carried out for each rotation speed, and a total of 9 rock samples were drilled. After the end of the experiment, stop drilling and close the data monitoring software to store the drilling parameters, and then open the drilling rig to take the drill bit out of the rock. The drilling results of the test piece are shown in Figure 7.
Based on the dynamic response characteristics of drilling parameters obtained by the drilling monitoring system, this study divides rock drilling into three stages: initial drilling stage, crack propagation stage, and drill bit retreating stage. Figure 8 shows the change in 1-1 measurement data of a 330 r/min specimen. In the initial stage of drilling (the yellow part of Figure 8 ), the drill bit is in a strong constraint environment, and it is subjected to large friction resistance and cutting resistance when contacting rock. The rotation speed decreases sharply, the torque and drilling pressure rise rapidly, and the parameters fluctuate greatly. In the crack propagation stage ( the green part of Figure 8 ), the friction between the drill bit and the rock reaches a dynamic balance, fluctuates around a certain value, and the rotation speed tends to be stable. With the deepening of drilling, the drill bit moves into the loose small test block after penetrating the large test block. At this time, the drill bit is in a weak constraint environment, and the drilling depth increases sharply. Due to the internal heterogeneity and local fragmentation of the specimen, the WOB shows a large fluctuation. When drilling into a large test block, the WOB is large, and the WOB decreases rapidly at the moment of penetration. In the backward stage of the drill bit ( blue part of Figure 8), the drill bit stops drilling, the resistance decreases, the rotational speed, torque, and WOB decrease significantly, and the parameters change sharply, indicating that the drilling is completed. The results show that the monitoring system is set up reasonably and the data collected is effective. The dynamic response of the parameters in each stage provides a theoretical basis for revealing the relationship between drilling parameters and rock parameters.
3. Results and Discussion
3.1. The Effect of Rotation Speed
In order to study the influence of rotation speed on drilling efficiency and various parameters, this study carried out drilling experiments with three different specifications of initial rotation speed on gneiss under fixed confining pressure. Figure 9 shows the dynamic response of drilling parameters during drilling, including rotation speed, torque, drilling depth, drilling speed, and weight on bit. Figure 9 (a) The change of drilling parameters at 330 r/min, Figure 9 (b) The change of drilling parameters at 360 r/min, and Figure 9 (c) The change of drilling parameters at 390 r/min. All data before drilling are in the initial value; in the initial stage of drilling, the rotational speed of the bit and the rock began to decrease at the moment of contact, and the torque and pressure increased rapidly. In the crack propagation stage, the parameters are basically stable, and the drilling pressure fluctuates greatly. In the bit retreating stage, all drilling parameters returned to normal. According to Figure 9, it can be seen that the variation of parameters is similar. Due to the difference in rock mechanics parameters and internal heterogeneity, the fluctuation range of drilling parameters is different.
From the experimental results, with the increase of rotational speed, the drilling speed increased significantly. At 330 r/min, the average drilling speed is about 0.19 mm/s; when the rotation speed increases to 360 r/min and 390 r/min, the average drilling speed increases to 0.34 mm/s and 0.44 mm/s, respectively. This phenomenon is mainly due to the increase in the number of times of drilling teeth cutting rock per unit time with the increase of rotational speed, so as to improve the frequency of rock breaking and the efficiency of cuttings generation. It can be found that at the same initial rotation speed, the drilling torque rises sharply first, and the friction force and cutting force between rock and drill bit are gradually stable after drilling, and the torque is relatively stable. The torque fluctuation of 2-2 and 3-1 rocks is large because of the heterogeneity inside the rock. At the same time, the torque also shows a significant increasing trend with the increase of rotational speed. The torque fluctuation range is 0-27 N·m at 330 r/min, and increases to 0-40.9 N·m at 390 r/min. The reason can be attributed to two aspects: one is that the friction heat effect between the drill bit and the rock interface is intensified at high rotation speed, which leads to the change of local rock strength and the increase of cutting resistance; second, the cuttings are not discharged in time, resulting in repeated grinding, which further increases the torque load. In addition, the experimental platform is operated by the experimental personnel to operate the rotating rod drilled by the drilling rig, and the semi-automatic control is implemented. The force exerted by the operator is as uniform as possible, so the drilling pressure does not change significantly at different speeds, but at 330 r/min The speed is low, the rock drilling is difficult, and the drilling pressure is slightly larger; when the rotary speed is higher at 390 r/min, the bit is easier to cut into the rock, thus reducing the drilling pressure, and the drilling pressure decreases slightly with the increase of the rotary speed. In addition, the average cutting time at 330 r/min is 494 s, the average cutting time at 330 r/min is 321.67 s, and the average cutting time at 390 r/min is 232.67 s. With the increase of rotation speed, the more times the drill bit cuts rock per unit time, the shorter the rock cutting time. 390 r/min is 261.33 s shorter than 330 r/min.
In short, in the experiment of drilling the same lithology specimen under the same confining pressure, the rotational speed is the key operating parameter, and the rotational speed has a great influence on the drilling speed, torque, weight on bit and drilling time. It should be noted that the fluctuation of drilling parameters is related to the vibration of the drilling rig. The vibration parameters of 1-1, 2-1 and 3-1 are shown in Figure 10. It can be observed that the vibration amplitude of the drilling rig is small, and the fluctuation law of the experimental parameters is reasonable.
3.2. Research on Coupling Relationship of Drilling Parameters
Although this study focuses on the relationship between drilling parameters and rock parameters, the internal coupling relationship between drilling response parameters is also worthy of in-depth analysis to reveal the energy distribution and rock breaking mechanism during drilling. The Pearson method was used to calculate the correlation degree of torque (T), weight on bit (F), drilling speed (PR), and rotational speed (RPM) to identify the degree of interaction between the parameters. The scatter matrix diagram of the above experimental data is shown in Figure 11, which illustrates the pairwise correlation of variables and the differences between different groups.
Pearson correlation method is suitable for two continuous variables to detect whether there is a correlation between two continuous variables [43]. The Pearson correlation coefficient r tends to 1 or-1, which indicates strong positive correlation or strong negative correlation respectively ; the value of Sig.P is less than 0.05 indicates that the correlation is significant, and greater than 0.05 indicates that the correlation is not significant. The upper triangle of the figure shows the Pearson correlation coefficient between variables, which is marked when the significance level is P < 0.05. The scatter plot below the diagonal line reveals the correlation trend between variables. Points of different colors represent different groups, green represents 330 r/min group, red 360 r/min group, purple 390 r/min group. The analysis results show that the correlation between F and PR is-0.783, P < 0.05, indicating a strong negative correlation. When the drilling speed is increased, the friction resistance and cutting resistance of the cutting process change, which reduces the drilling pressure. RPM and PR show a high correlation, P = 0.006, the correlation coefficient is 0.827, increase the speed, the number of times per unit time bit cutting rock increases, rock breaking frequency increases, can effectively improve the rate of penetration.
In summary, there is a significant coupling effect between drilling parameters, and the drilling speed has a strong driving relationship with WOB and rotational speed. The r value of torque and WOB is close to 0, indicating that there is no obvious correlation. The r values of torque, rotational speed, and drilling speed are 0.306 and 0.423, respectively, indicating that rotational speed and drilling speed have little influence on torque. This result shows that in the actual drilling parameter optimization process, it is necessary to comprehensively consider the balance between multiple parameters, so as to avoid the energy loss and drilling rig wear caused by a single increase of rotational speed and neglect of other parameter changes.
3.3. Correlation Analysis of Rock Mechanics Parameters and Drilling Characteristics
There is an inseparable relationship between drilling parameters and rock parameters. In this study, the correlation analysis between rock mechanical properties and drilling response parameters is further carried out, which provides a theoretical basis for identifying lithologic parameters according to drilling parameters. To study the coupling relationship between drilling parameters and lithologic parameters at 330 r/min, based on the above experiments, the 330 r/min speed drilling rock drilling experiments with different strengths are supplemented to obtain more drilling parameter data and rock parameter data to ensure that the conclusion is reasonable and feasible. The tensile strength and compressive strength of rock reflect the mechanical index of rock resistance to failure. The shear strength characteristics of rock are determined by cohesion (c) and internal friction angle (φ), which are the core mechanical properties that control its resistance to drilling tooth cutting failure. The data obtained from the test are fitted, and the fitting curve is shown in Figure 12. Figure 12 (a) shows the relationship between drilling speed and compressive strength and tensile strength. With the increase in rock strength, the drilling speed obviously decreases. Higher rock strength means that the cementation between particles in rock is stronger, and it is more difficult to shear. PDC drill teeth need to consume more energy and longer action time to produce and expand cracks, thus reducing rock-breaking efficiency. Figure 12 (b) shows the relationship between torque and rock strength, and rock strength is positively correlated with torque. Figure 12 (c) shows the relationship between WOB and rock strength. The WOB increases with the increase in rock strength. The main function of WOB is to provide sufficient normal force for the drilling teeth to press into the rock and put it in a critical failure state. The higher the rock strength, the greater the critical normal stress required to cause damage, so greater drilling pressure is required.
The power function is used to fit, and the quantitative relationship between drilling parameters and rock strength parameters is established. The fitting results are shown in Table 6. For the above fitting function, the goodness-of-fit R² is used to represent the degree of fitting. The drilling parameters and uniaxial compressive strength R2 are 0.98166, 0.93314, and 0.99056, respectively, and the overall fitting effect is good. The drilling parameters and tensile strength R2 are 0.91765, 0.9966, and 0.99122, respectively, showing a strong correlation between the tensile strength of the drilling parameters, and the fitting relationship is stable. On the whole, the fitting result of torque and uniaxial tensile strength is the best, up to 0.9966, indicating that tensile strength has a great influence on torque. This is because the cutting action of the drill bit is essentially a process of applying shear force to make the rock tensile and shear failure. The higher the tensile strength of the rock, the stronger the ability to resist the stripping of the cuttings, resulting in a significant increase in cutting resistance ( torque ).
The strong correlation between the above drilling parameters and rock strength parameters is derived from the deep mechanical roots of the shear strength parameters-cohesion c and internal friction angle φ determined by triaxial tests. The high cohesion value means that the cementation between rock mineral particles is strong, and the drilling teeth must consume enough energy ( reflected in higher torque ) to destroy the rock skeleton structure to produce effective cuttings. This sets a higher ‘energy threshold’ for the rock breaking process, which is one of the main reasons for the decrease in drilling speed and the increase in torque. The internal friction angle indicates the sensitivity of the shear strength of the rock to the normal stress. During the drilling process, the normal stress provided by the drilling pressure greatly strengthens the local shear strength of the rock while crushing the rock. This means that the drill bit needs to overcome a rock that has been ‘strengthened’ by its own weight on the bit. In order to destroy it, a greater rotational force ( torque ) must be applied.
These three drilling response parameters can reflect the rock strength parameters to a certain extent. Therefore, in order to realize the prediction of rock strength, the drilling speed can be used as a macro index to identify the rock strength, and the torque is particularly sensitive to the tensile failure characteristics of the rock. It is the optimal parameter for inversion of rock strength, and the drilling pressure can also be used as an input parameter for rock strength prediction.
4. Conclusions
In this paper, rock mechanics experiments are carried out, and a small drilling platform is built to dynamically collect the changes of drilling parameters during rock drilling, and the influence of rotation speed on drilling efficiency and various parameters is analyzed. The fitting relationship between rock mechanics parameters and drilling parameters is established, and the feasibility of dynamic monitoring scheme of drilling rig is discussed, which provides a theoretical basis for intelligent identification of rock.
(1) In order to explore the relationship between drilling parameters and rock parameters, a drilling platform was built to carry out rock drilling experiments at different speeds. The specimens were placed in the rock confining pressure system, and the dynamic response characteristics of drilling parameters were obtained by the drilling monitoring system. Rock drilling experiments with initial speeds of 330 r/min, 360 r/min and 390 r/min were carried out. The rock drilling was divided into three stages : initial drilling stage, crack propagation stage and bit retreat stage.
(2) All data before drilling are in the initial value ; in the initial stage of drilling, the rotational speed of the bit begins to decrease at the moment of contact with the rock, and the torque and pressure increase rapidly. In the crack propagation stage, the parameters are basically stable, and the drilling pressure fluctuates greatly. In the bit retreating stage, all drilling parameters returned to normal. In short, in the experiment of drilling the same lithology specimen under the same confining pressure, the rotational speed is the key operating parameter, and the rotational speed has a great influence on the drilling speed, torque, weight on bit and drilling time.
(3) The internal coupling relationship between drilling response parameters can reveal the energy distribution and rock breaking mechanism during drilling. Pearson method was used to calculate the correlation degree of torque (T), drilling pressure (F), drilling speed (PR) and rotational speed (RPM). The correlation between F and PR was-0.783, P < 0.05, indicating a strong negative correlation. The correlation between RPM and PR was 0.827, P < 0.05, indicating a strong positive correlation. There is a significant coupling effect between drilling parameters, in which the drilling speed has a strong driving relationship with WOB and rotational speed.
(4) In order to further explore the relationship between drilling parameters and rock parameters, the drilling experiments of drilling different strength rocks at 330 r/min initial speed were supplemented, and the power function type was used for fitting. The fitting effect of rock strength parameters and drilling speed, torque and WOB is better as a whole, among which the fitting result of torque and uniaxial tensile strength is the best, R2 is as high as 0.9966, indicating that tensile strength has a great influence on torque. The high cohesion value means that the cementation between rock and mineral particles is strong, and the internal friction angle indicates that the shear strength of rock is sensitive to normal stress. The above research provides a theoretical basis for rock strength identification.
References
- Perrin, C.; Pointer, C.; Al-Mohannadi, G.; Sen, S.; Buraimoh, M.A. Lithocodium mound identification using logging-while-drilling image log and quantified cutting analysis — Validation with analogues. Interpretation 2024, 12, SB51–SB67. [Google Scholar] [CrossRef]
- Isheyskiy, V.; Sanchidrián, J.A. Prospects of Applying MWD Technology for Quality Management of Drilling and Blasting Operations at Mining Enterprises. MINERALS 2020, 10. [Google Scholar] [CrossRef]
- Silversides, K.L.; Melkumyan, A. Boundary Identification and Surface Updates Using MWD. Mathematical Geosciences 2021, 53, 1047–1071. [Google Scholar]
- Cao, R.; Wang, Y.; Zhao, Y.; Wang, X.; He, S.; Peng, L. In-situ tests on quantitative evaluation of rock mass integrity based on drilling process index. Chinese Journal of Geotechnical Engineering 2021, 43, 679–687. [Google Scholar]
- van Eldert, J.; Schunnesson, H.; Johansson, D.; Saiang, D. Application of Measurement While Drilling Technology to Predict Rock Mass Quality and Rock Support for Tunnelling. Rock Mechanics and Rock Engineering 2020, 53, 1349–1358. [Google Scholar]
- Silversides, K.L.; Melkumyan, A. Machine learning for classification of stratified geology from MWD data. Ore Geology Reviews 2022, 142, 104737. [Google Scholar] [CrossRef]
- Abbaszadeh Shahri, A.; Shan, C.; Larsson, S.; Johansson, F. Normalizing Large Scale Sensor-Based MWD Data: An Automated Method toward A Unified Database. Sensors 2024, 24. [Google Scholar] [CrossRef]
- van Eldert, J.; Schunnesson, H.; Saiang, D.; Funehag, J. Improved filtering and normalizing of Measurement-While-Drilling (MWD) data in tunnel excavation. Tunnelling and Underground Space Technology 2020, 103, 103467. [Google Scholar] [CrossRef]
- Khoshouei, M.; Bagherpour, R.; Yari, M. A smart look at monitoring while drilling (MWD) and optimizing using acoustic emission technique (AET). Scientific Reports 2024, 14, 19766. [Google Scholar] [CrossRef] [PubMed]
- Lu, C.; Zhang, T.; Zhao, H. Improving the application depth of electromagnetic measurement while drilling (EM-MWD) systems by receiving signals from adjacent wells. Journal of Applied Geophysics 2021, 195, 104468. [Google Scholar] [CrossRef]
- Wu, S.; Victor Yue, W.; Qiu, M.; Quentin Yue, Z. Profiling of weathered argillaceous limestone rock with MWD data from advanced drilling for tunnelling along Wu-Kai expressway in Chongqing, China. Tunnelling and Underground Space Technology 2024, 147, 105719. [Google Scholar] [CrossRef]
- Gao, H.; Wang, Q.; Jiang, B.; Zhang, P.; Jiang, Z.; Wang, Y. Relationship between rock uniaxial compressive strength and digital core drilling parameters and its forecast method. International Journal of Coal Science & Technology 2021, 8, 605–613. [Google Scholar] [CrossRef]
- Liu, W.; Deng, H.; Zhu, X.; Deng, K. The PDC cutter-rock interaction behavior in rock cutting: A review. Geoenergy Science and Engineering 2023, 229, 212168. [Google Scholar] [CrossRef]
- Jiang, B.; Ma, F.; Wang, Q.; Gao, H.; Zhai, D.; Deng, Y.; Xu, C.; Yao, L. Drilling-based measuring method for the c-φ parameter of rock and its field application. International Journal of Mining Science and Technology 2024, 34, 65–76. [Google Scholar] [CrossRef]
- Wang, H.; He, M.; Zhao, J.; Zhang, Y.; Yang, B. Cutting energy characteristics for brittleness evaluation of rock using digital drilling method. Engineering Geology 2023, 319, 107099. [Google Scholar] [CrossRef]
- He, M.; Wang, H.; Ma, C.; Zhang, Z.; Li, N. Evaluating the Anisotropy of Drilling Mechanical Characteristics of Rock in the Process of Digital Drilling. Rock Mechanics and Rock Engineering 2023, 56, 3659–3677. [Google Scholar] [CrossRef]
- Kadyrov, R.; Nurgaliev, D.; Saenger, E.H.; Balcewicz, M.; Minebaev, R.; Statsenko, E.; Glukhov, M.; Nizamova, A.; Galiullin, B. Digital rock physics: Defining the reservoir properties on drill cuttings. Journal of Petroleum Science and Engineering 2022, 210, 110063. [Google Scholar] [CrossRef]
- Xi, Y.; Wang, W.; Zha, C.; Li, J.; Liu, G. Numerical investigations on rock breaking mechanism and parameter influence of torsional percussive drilling with a single PDC cutter. Journal of Petroleum Science and Engineering 2022, 210, 110077. [Google Scholar] [CrossRef]
- Piri, M.; Mikaeil, R.; Hashemolhosseini, H.; Baghbanan, A.; Ataei, M. Study of the effect of drill bits hardness, drilling machine operating parameters and rock mechanical parameters on noise level in hard rock drilling process. Measurement 2021, 167, 108447. [Google Scholar] [CrossRef]
- Wang, Q.; Gao, H.; Yu, H.; Jiang, B.; Liu, B. Method for Measuring Rock Mass Characteristics and Evaluating the Grouting-Reinforced Effect Based on Digital Drilling. Rock Mechanics and Rock Engineering 2019, 52, 841–851. [Google Scholar] [CrossRef]
- Wang, G.; Wang, X.; Zhao, J.; Zhang, F.; Wei, H.; Bai, J. Research on inversion method for stress characteristics of roadway surrounding rock based on real-time weight measurement of drill cuttings. Simulation Modelling Practice and Theory 2025, 139, 103064. [Google Scholar] [CrossRef]
- Li, Y.; She, L.; Wen, L.; Zhang, Q. Sensitivity analysis of drilling parameters in rock rotary drilling process based on orthogonal test method. Engineering Geology 2020, 270, 105576. [Google Scholar] [CrossRef]
- Kalantari, S.; Hashemolhosseini, H.; Baghbanan, A. Estimating rock strength parameters using drilling data. International Journal of Rock Mechanics and Mining Sciences 2018, 104, 45–52. [Google Scholar] [CrossRef]
- Shangxin, F.; Yujie, W.; Guolai, Z.; Yufei, Z.; Shanyong, W.; Ruilang, C.; Enshang, X. Estimation of optimal drilling efficiency and rock strength by using controllable drilling parameters in rotary non-percussive drilling. Journal of Petroleum Science and Engineering 2020, 193, 107376. [Google Scholar] [CrossRef]
- Li, Y.-M.; Li, J.-L.; Wu, Y.-h.; Zhao, G.-F. Extracting Rock Parameters Through Digital Drilling Test. Rock Mechanics and Rock Engineering 2024, 57, 8215–8241. [Google Scholar] [CrossRef]
- Lakshminarayana, C.R.; Tripathi, A.K.; Pal, S.K. Experimental investigation on potential use of drilling parameters to quantify rock strength. International Journal of Geo-Engineering 2021, 12, 23. [Google Scholar] [CrossRef]
- Kalantari, S.; Baghbanan, A.; Hashemalhosseini, H. An analytical model for estimating rock strength parameters from small-scale drilling data. Journal of Rock Mechanics and Geotechnical Engineering 2019, 11, 135–145. [Google Scholar] [CrossRef]
- Khan, A.; Li, Y.; Shoaib, M.; Sajjad, U.; Rui, F. Utilizing Machine Learning and Digital Twin Technology for Rock Parameter Estimation from Drilling Data. Journal of Intelligent Construction 2025, 3, 1–23. [Google Scholar] [CrossRef]
- Anand, G.; Alagumurthi, N.; Elansezhian, R.; Palanikumar, K.; Venkateshwaran, N. Investigation of drilling parameters on hybrid polymer composites using grey relational analysis, regression, fuzzy logic, and ANN models. Journal of the Brazilian Society of Mechanical Sciences and Engineering 2018, 40, 214. [Google Scholar] [CrossRef]
- Siddig, O.; Ibrahim, A.F.; Elkatatny, S. Estimation of rocks’ failure parameters from drilling data by using artificial neural network. Scientific Reports 2023, 13, 3146. [Google Scholar] [CrossRef]
- Riazi, M.; Mehrjoo, H.; Nakhaei, R.; Jalalifar, H.; Shateri, M.; Riazi, M.; Ostadhassan, M.; Hemmati-Sarapardeh, A. Modelling rate of penetration in drilling operations using RBF, MLP, LSSVM, and DT models. Scientific Reports 2022, 12, 11650. [Google Scholar] [CrossRef] [PubMed]
- Wei, M.; Qiu, D.; Yue, T.; Duan, Y.; Wang, H. New method prediction of rock mechanics parameters in drilling process based on machine learning. Petroleum Science and Technology 2025, 43, 360–383. [Google Scholar] [CrossRef]
- He, M.; Zhang, Z.; Ren, J.; Huan, J.; Li, G.; Chen, Y.; Li, N. Deep convolutional neural network for fast determination of the rock strength parameters using drilling data. International Journal of Rock Mechanics and Mining Sciences 2019, 123, 104084. [Google Scholar] [CrossRef]
- Fernández, A.; Segarra, P.; Sanchidrián, J.A.; Navarro, R. Ore/waste identification in underground mining through geochemical calibration of drilling data using machine learning techniques. Ore Geology Reviews 2024, 168, 106045. [Google Scholar] [CrossRef]
- Hassaan, S.; Mohamed, A.; Ibrahim, A.F.; Elkatatny, S. Real-Time Prediction of Petrophysical Properties Using Machine Learning Based on Drilling Parameters. ACS Omega 2024, 9, 17066–17075. [Google Scholar] [CrossRef] [PubMed]
- Li, H.; Liu, S.; Chang, H. Experimental research on the influence of working parameters on the drilling efficiency. Tunnelling and Underground Space Technology 2020, 95, 103174. [Google Scholar] [CrossRef]
- Noabahar Sadeghi, A.; Arıkan, K.B.; Özbek, M.E. Modelling and controlling of drill string stick slip vibrations in an oil well drilling rig. Journal of Petroleum Science and Engineering 2022, 216, 110759. [Google Scholar] [CrossRef]
- Al Shekaili, A.; Afebu, K.O.; Liu, Y.; Papatheou, E. Experimental analysis of drillstring vibrations using a small-scale drilling rig. Nonlinear Dynamics 2025, 113, 17491–17518. [Google Scholar] [CrossRef]
- Capik, M.; Yilmaz, A.O. Development models for the drill bit lifetime prediction and bit wear types. International Journal of Rock Mechanics and Mining Sciences 2021, 139, 104633. [Google Scholar] [CrossRef]
- Xie, H.; Lin, P.; Xu, Z.; Kang, J.; Zhang, Q. Drilling Response Law for PDC Bit Cutting and Breaking Rock: Governing Equation and Experiment Validation. Rock Mechanics and Rock Engineering 2025, 58, 7671–7690. [Google Scholar] [CrossRef]
- Li, J.; Duan, K.; Meng, H.; Wang, J.; Zhang, Q.; Wang, L. On the Mechanical Properties and Failure Mechanism of Conglomerate Specimens Subjected to Triaxial Compression Tests. Rock Mechanics and Rock Engineering 2023, 56, 973–995. [Google Scholar] [CrossRef]
- You, M.; Hong, Z.; Tan, F.; Wen, H.; Zhang, Z.; Lv, J. Stratigraphic identification using real-time drilling data. Journal of Rock Mechanics and Geotechnical Engineering 2024, 16, 3452–3464. [Google Scholar] [CrossRef]
- Chen, X.; Cao, W.; Gan, C.; Wu, M. A hybrid partial least squares regression-based real time pore pressure estimation method for complex geological drilling process. Journal of Petroleum Science and Engineering 2022, 210, 109771. [Google Scholar] [CrossRef]
Figure 1.
Drilling platform.
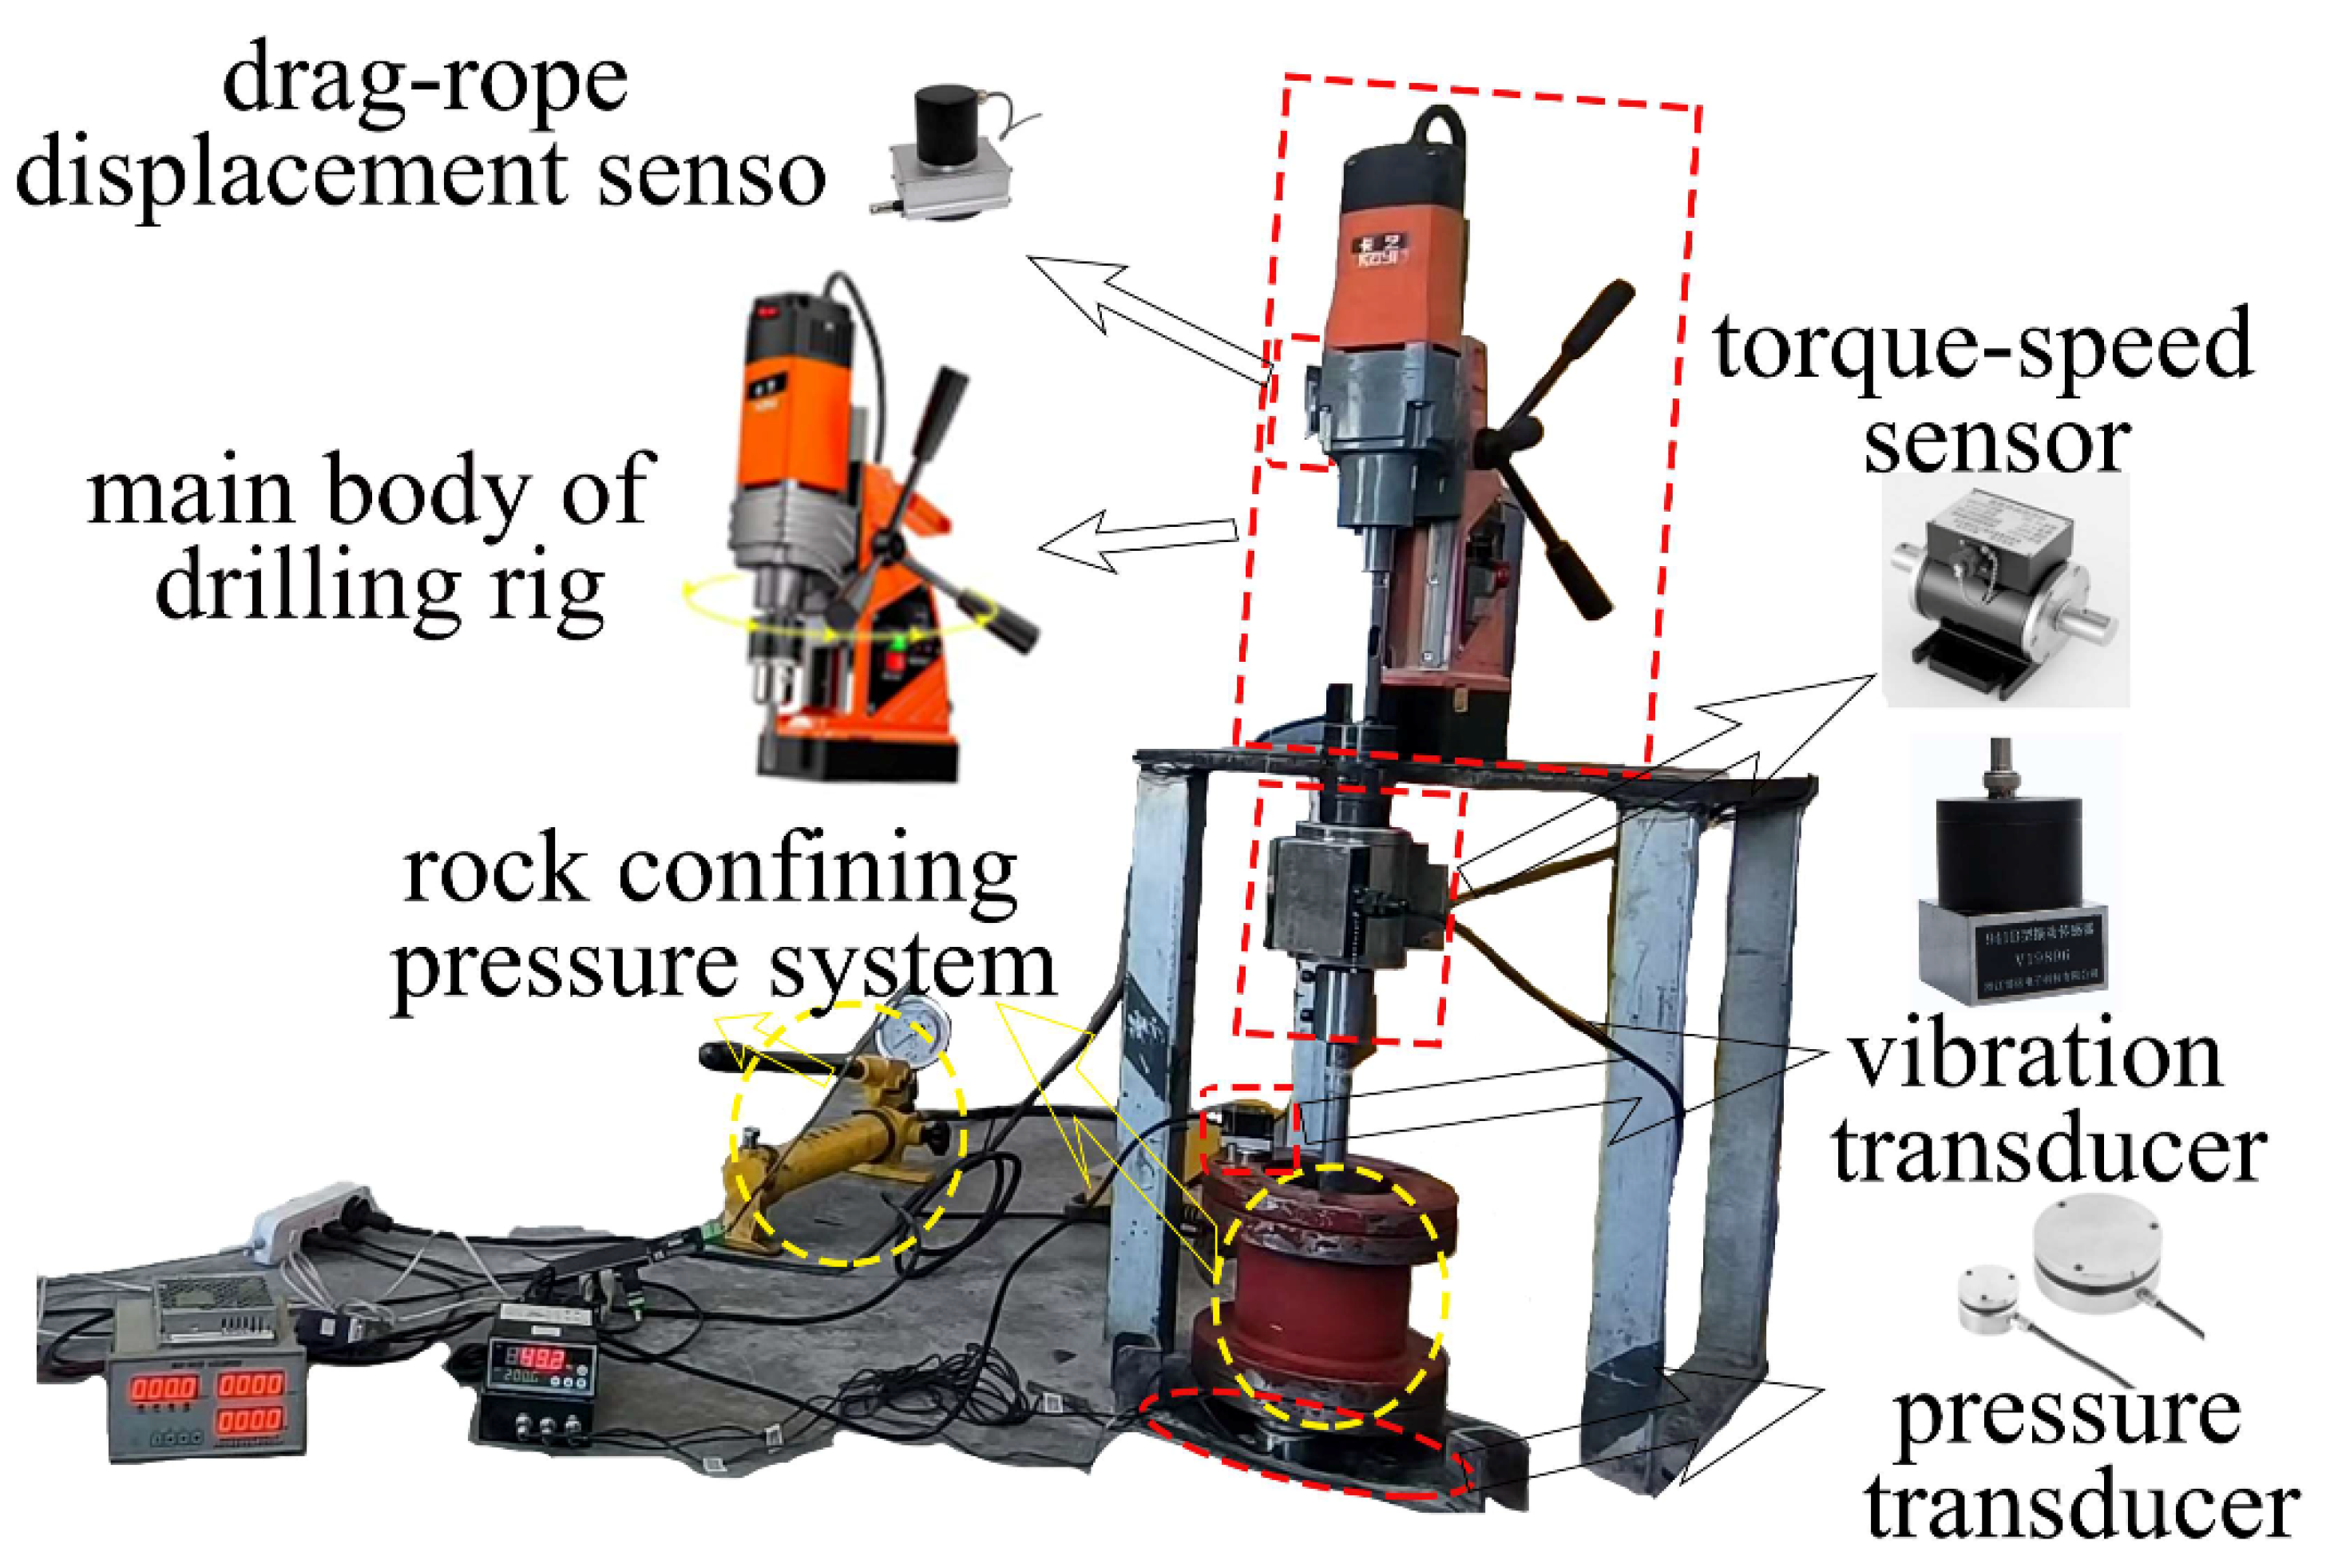
Figure 2.
Double-wing PDC bit.
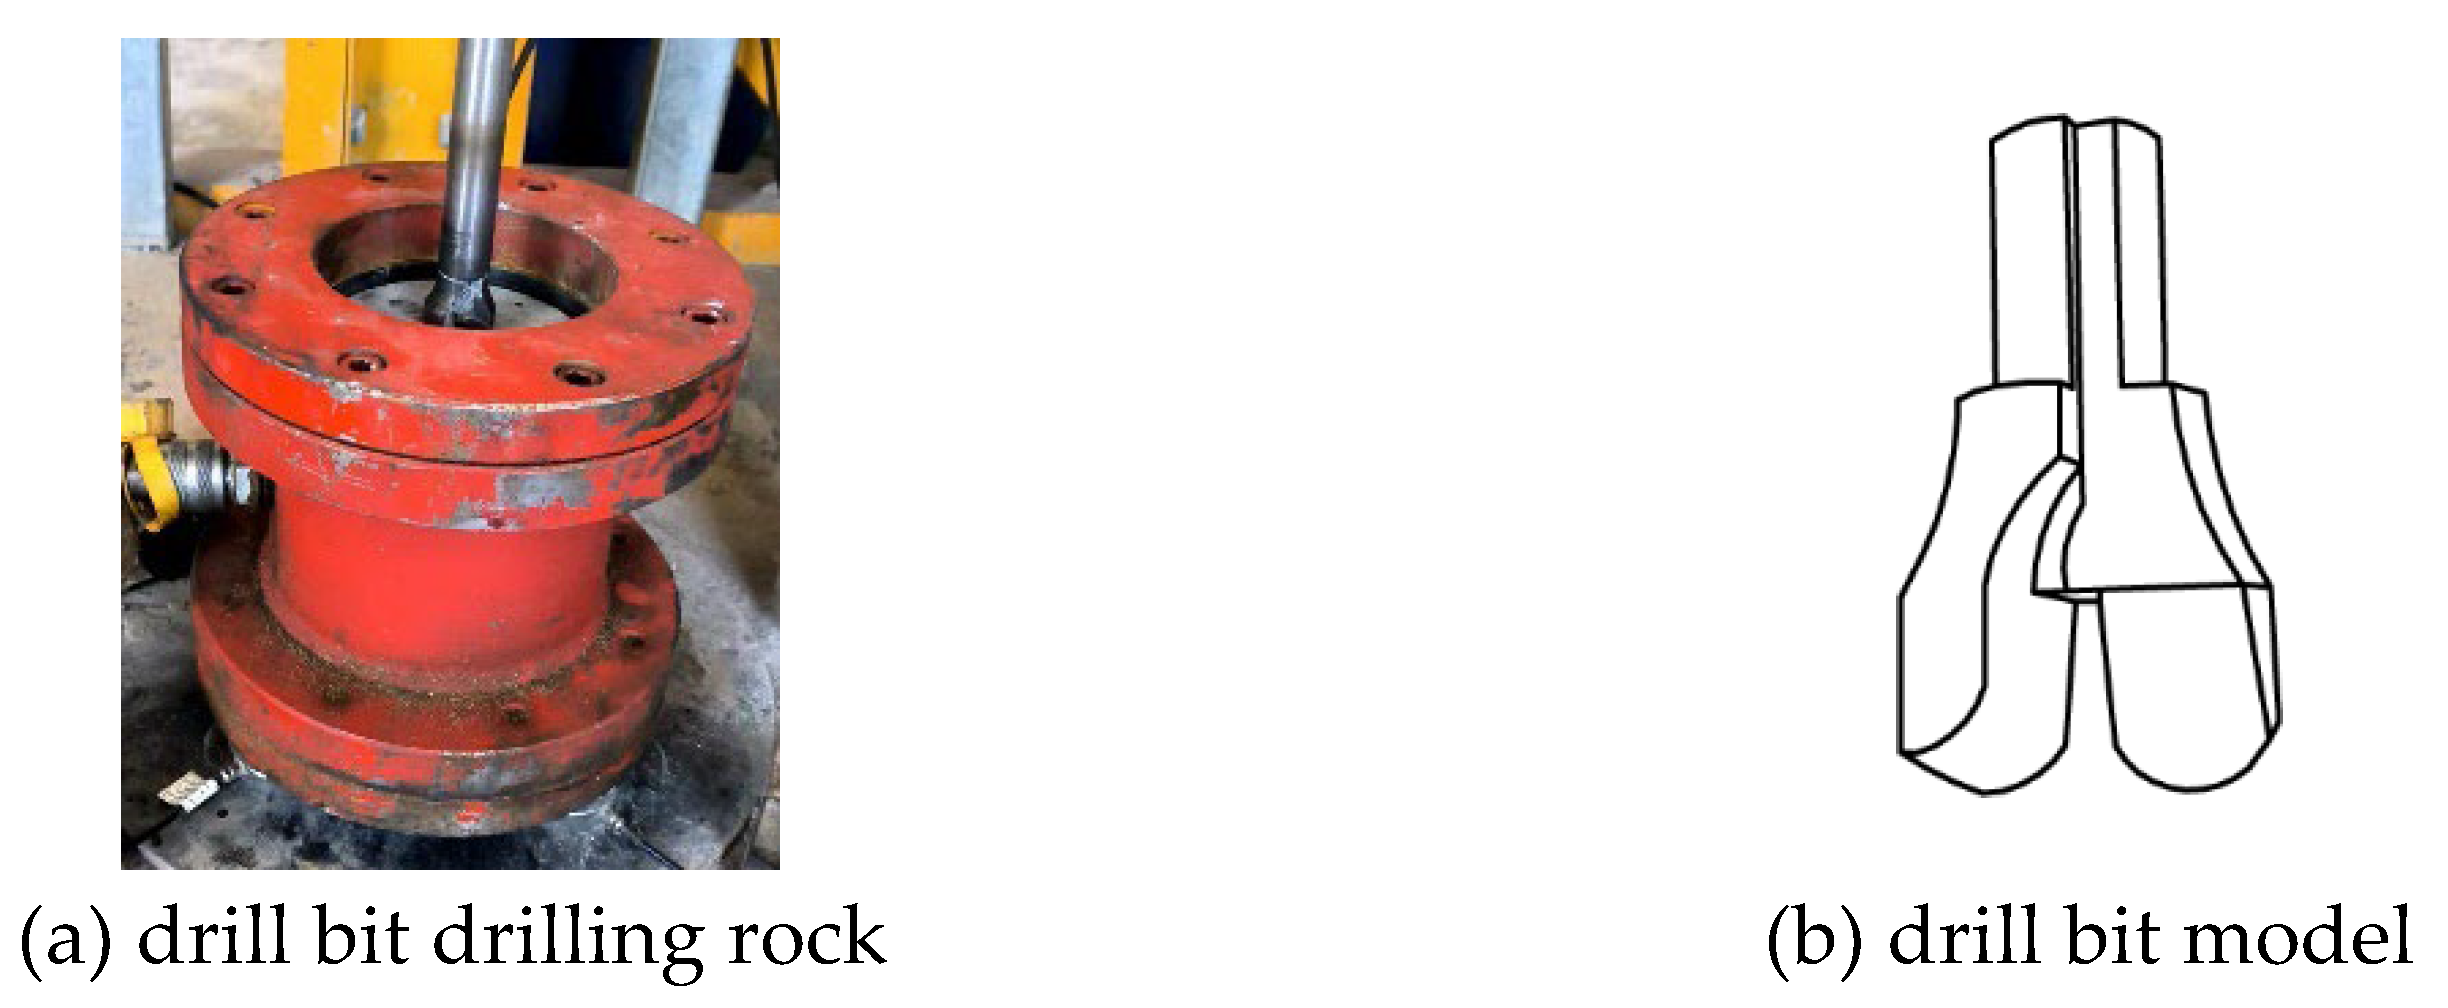
Figure 3.
Rock confining pressure system.
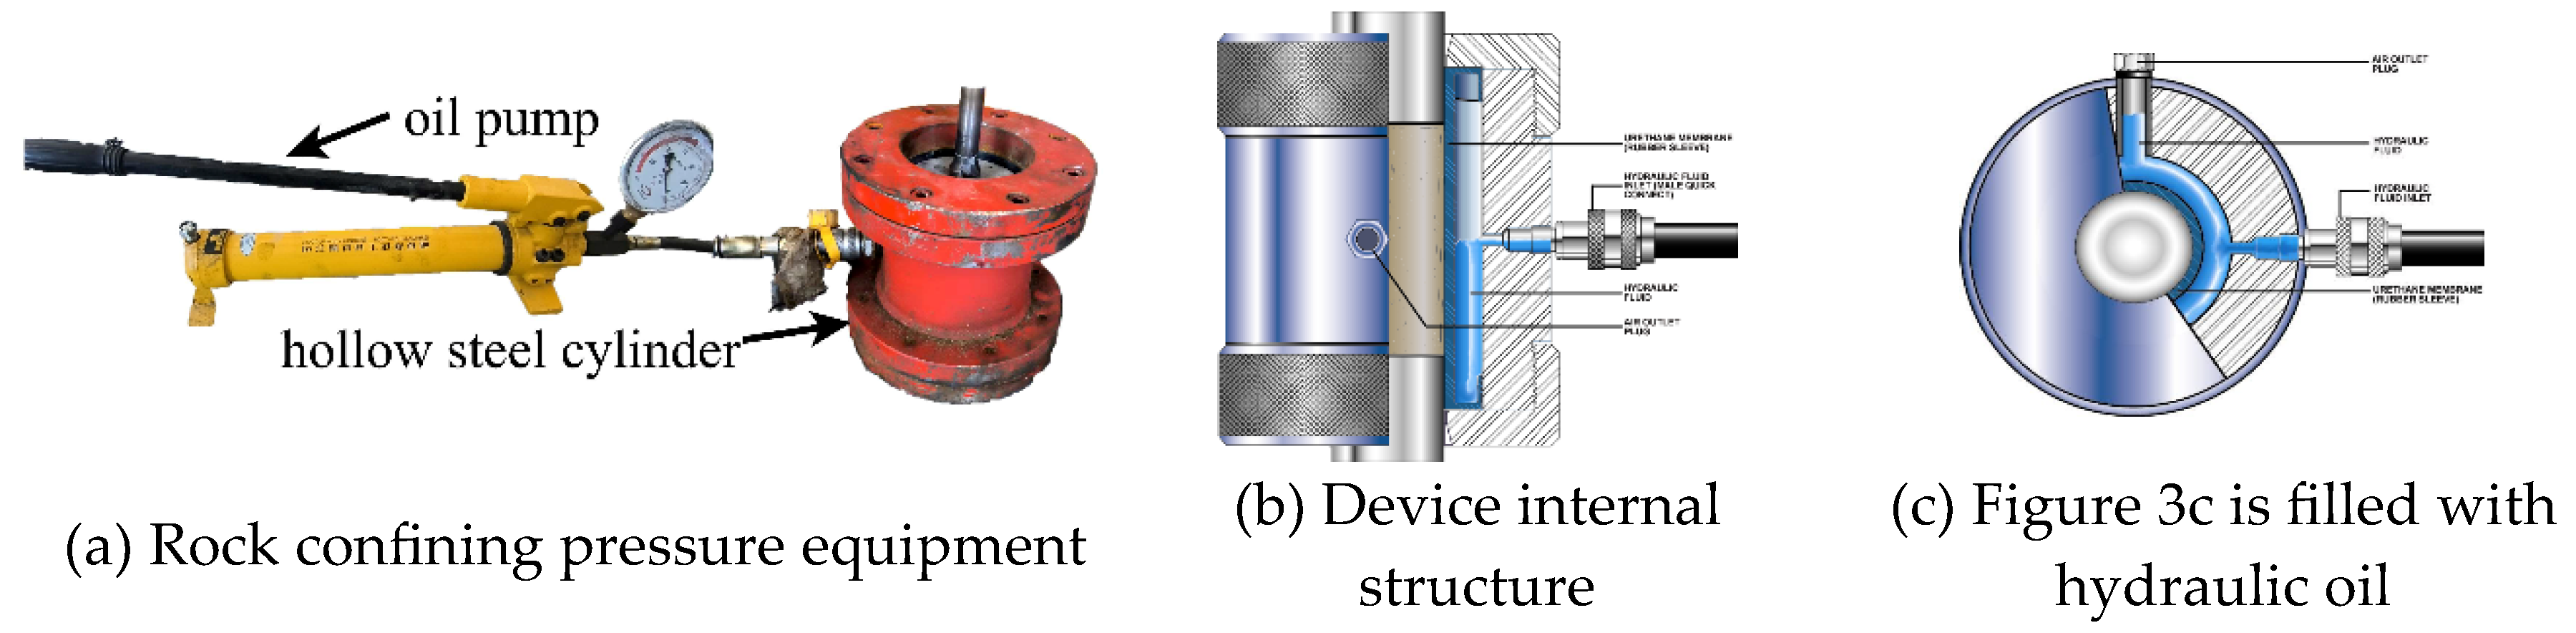
Figure 6.
Specimen.
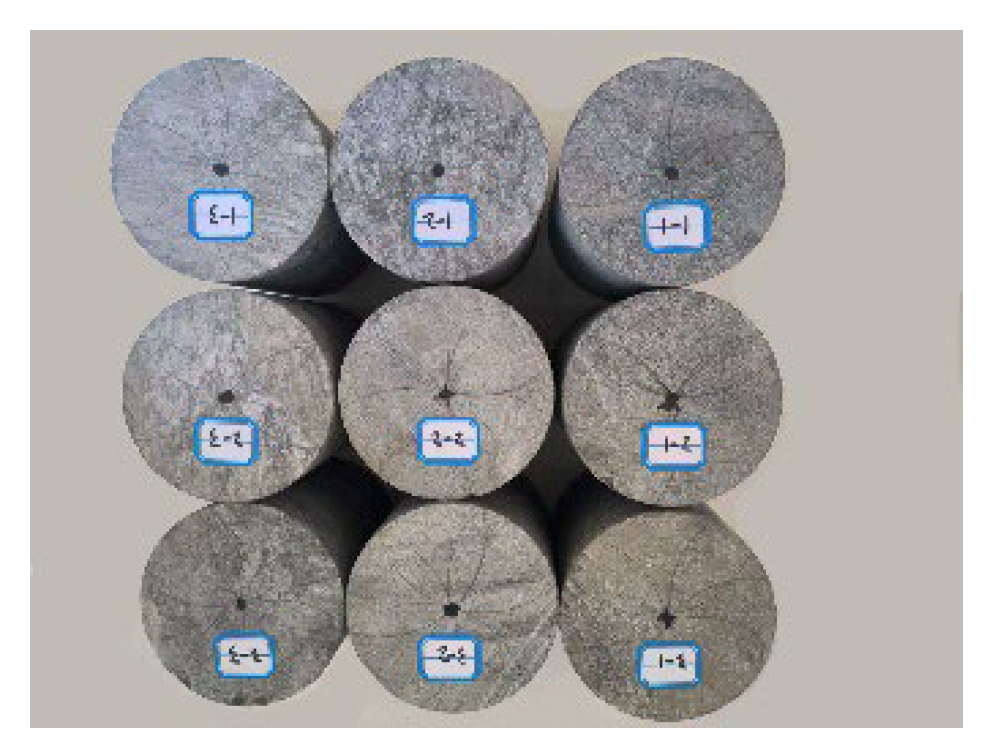
Figure 7.
Drilling results.
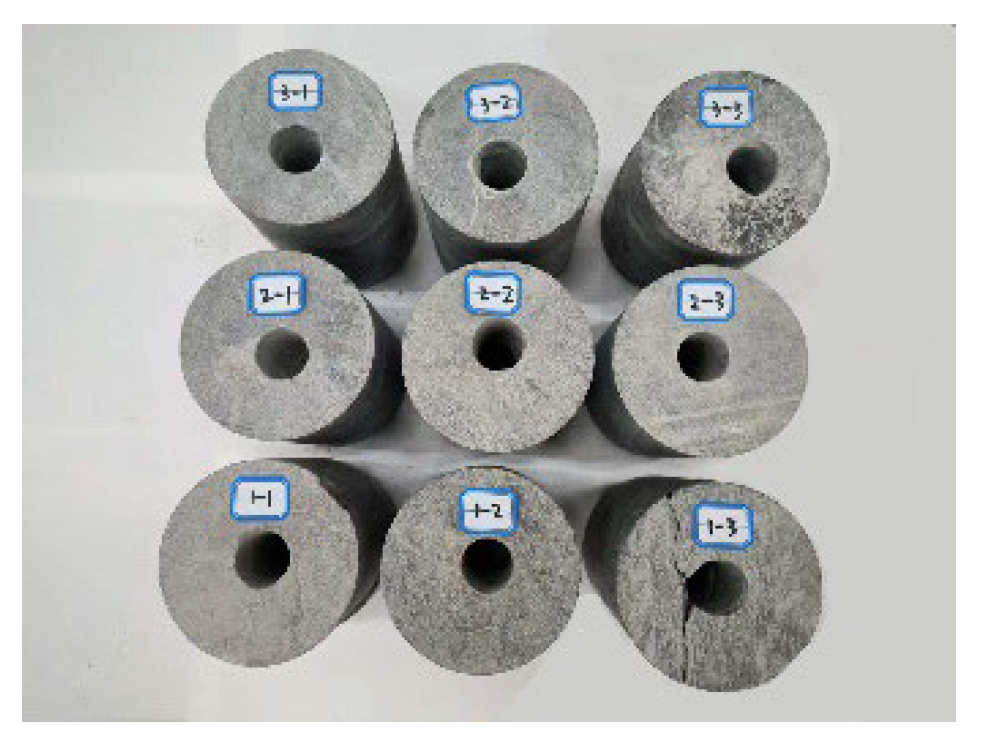
Figure 8.
Variation curve of drilling parameters.
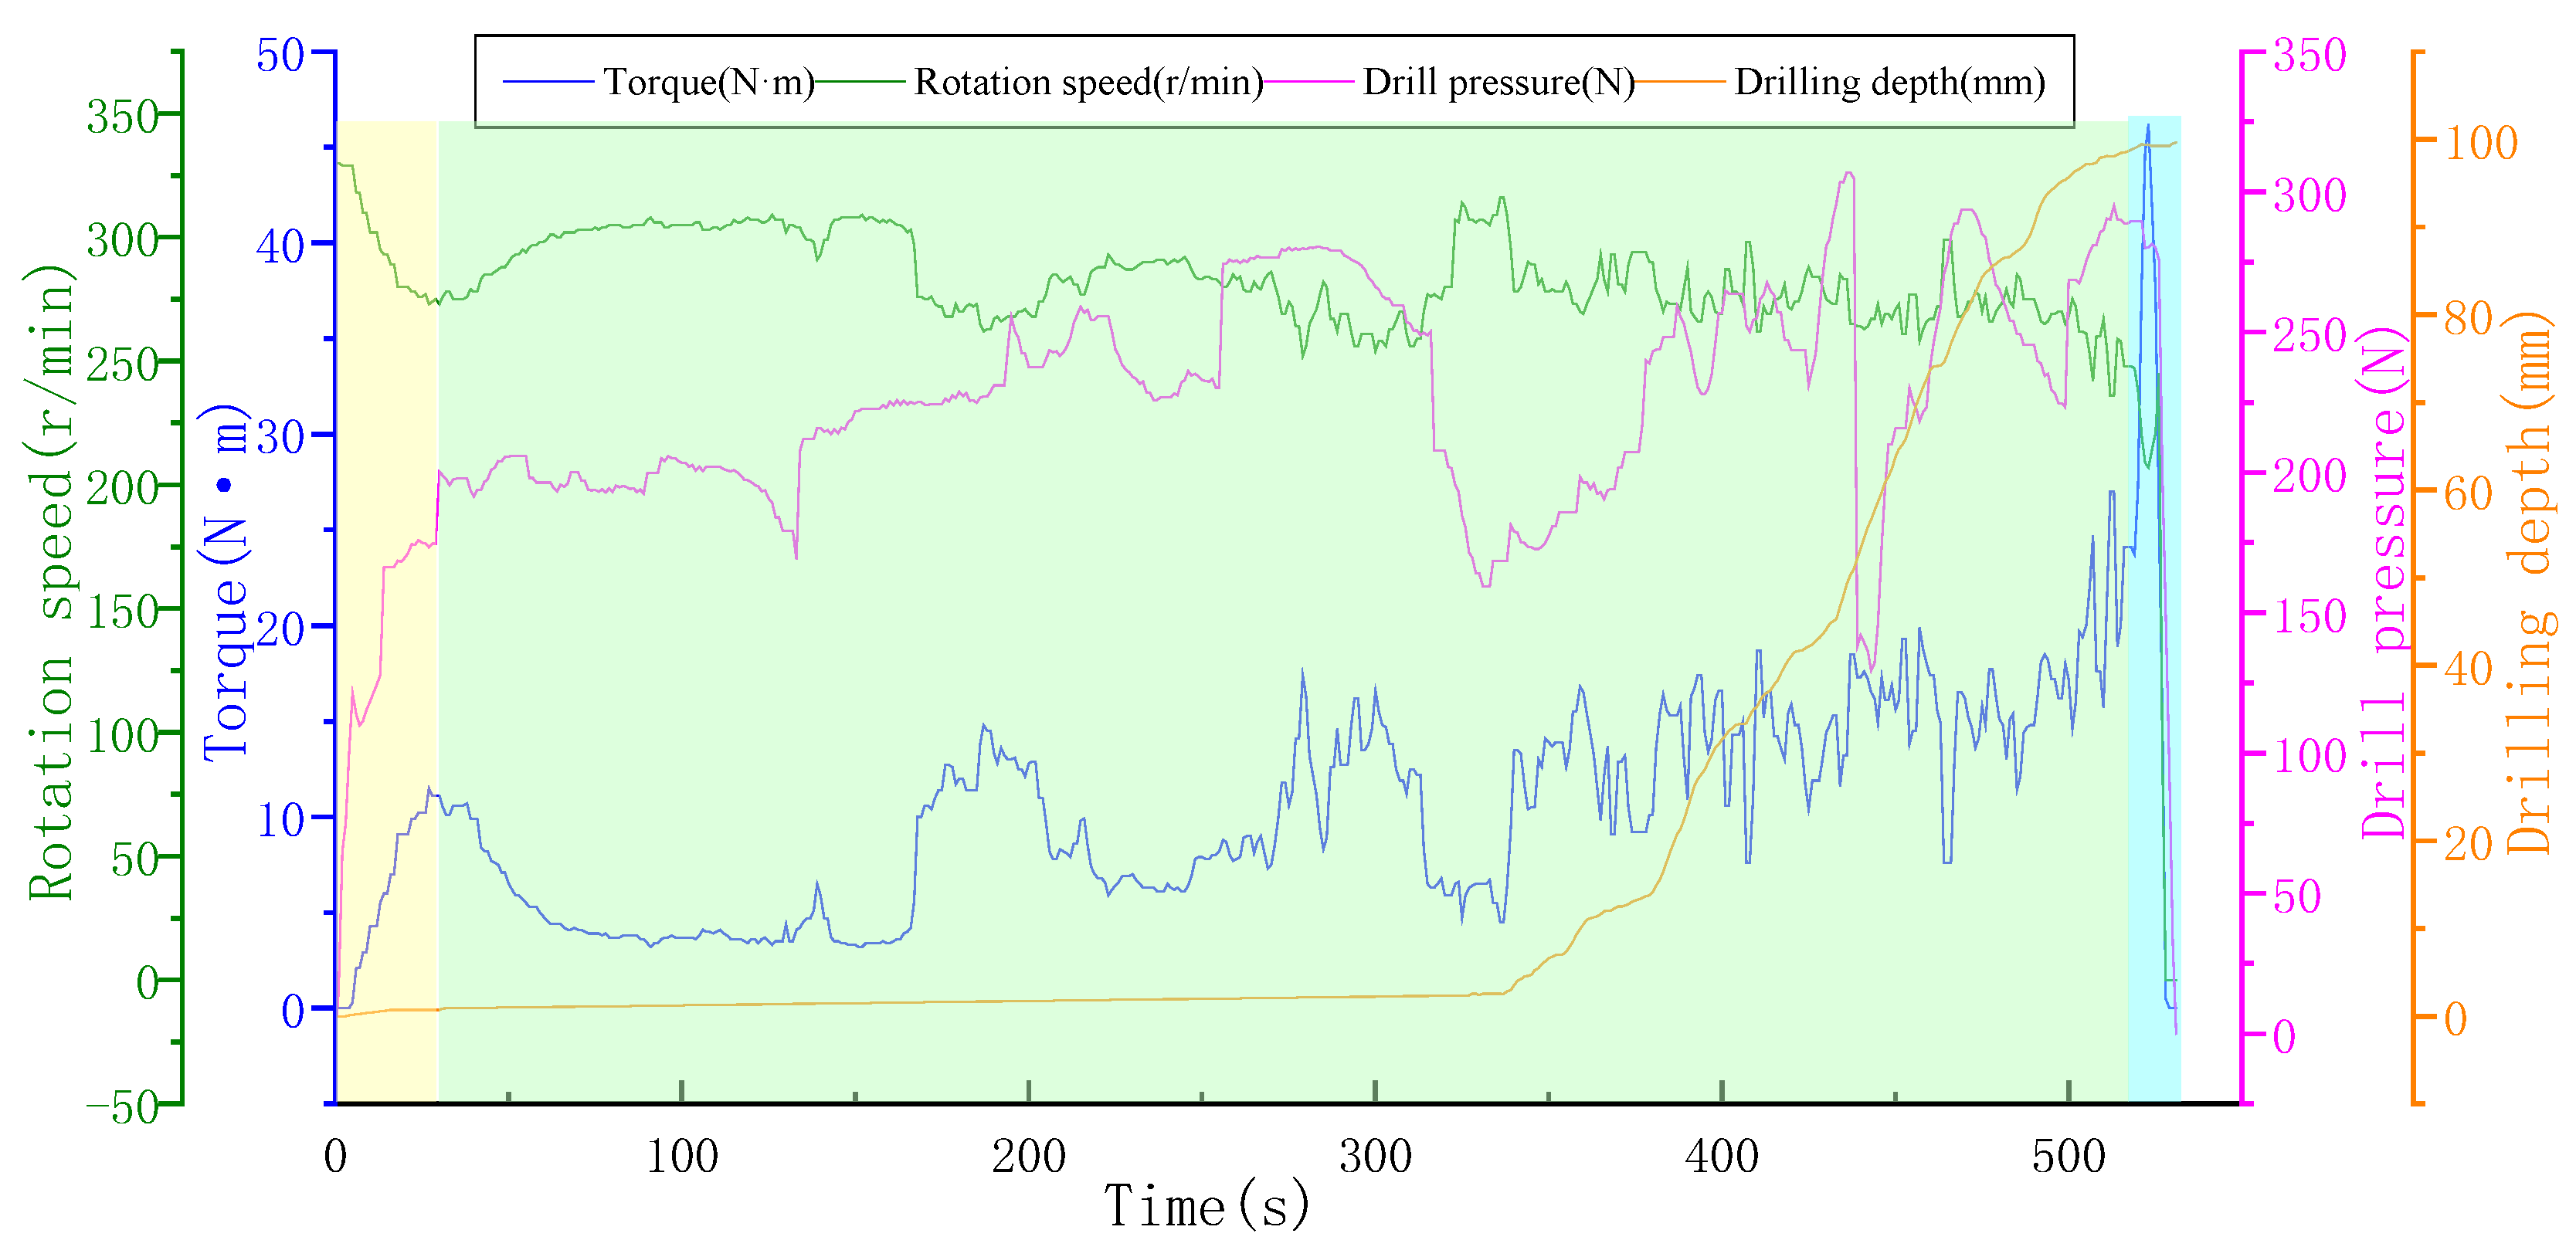
Figure 9.
Changes of drilling parameters at different initial speeds.
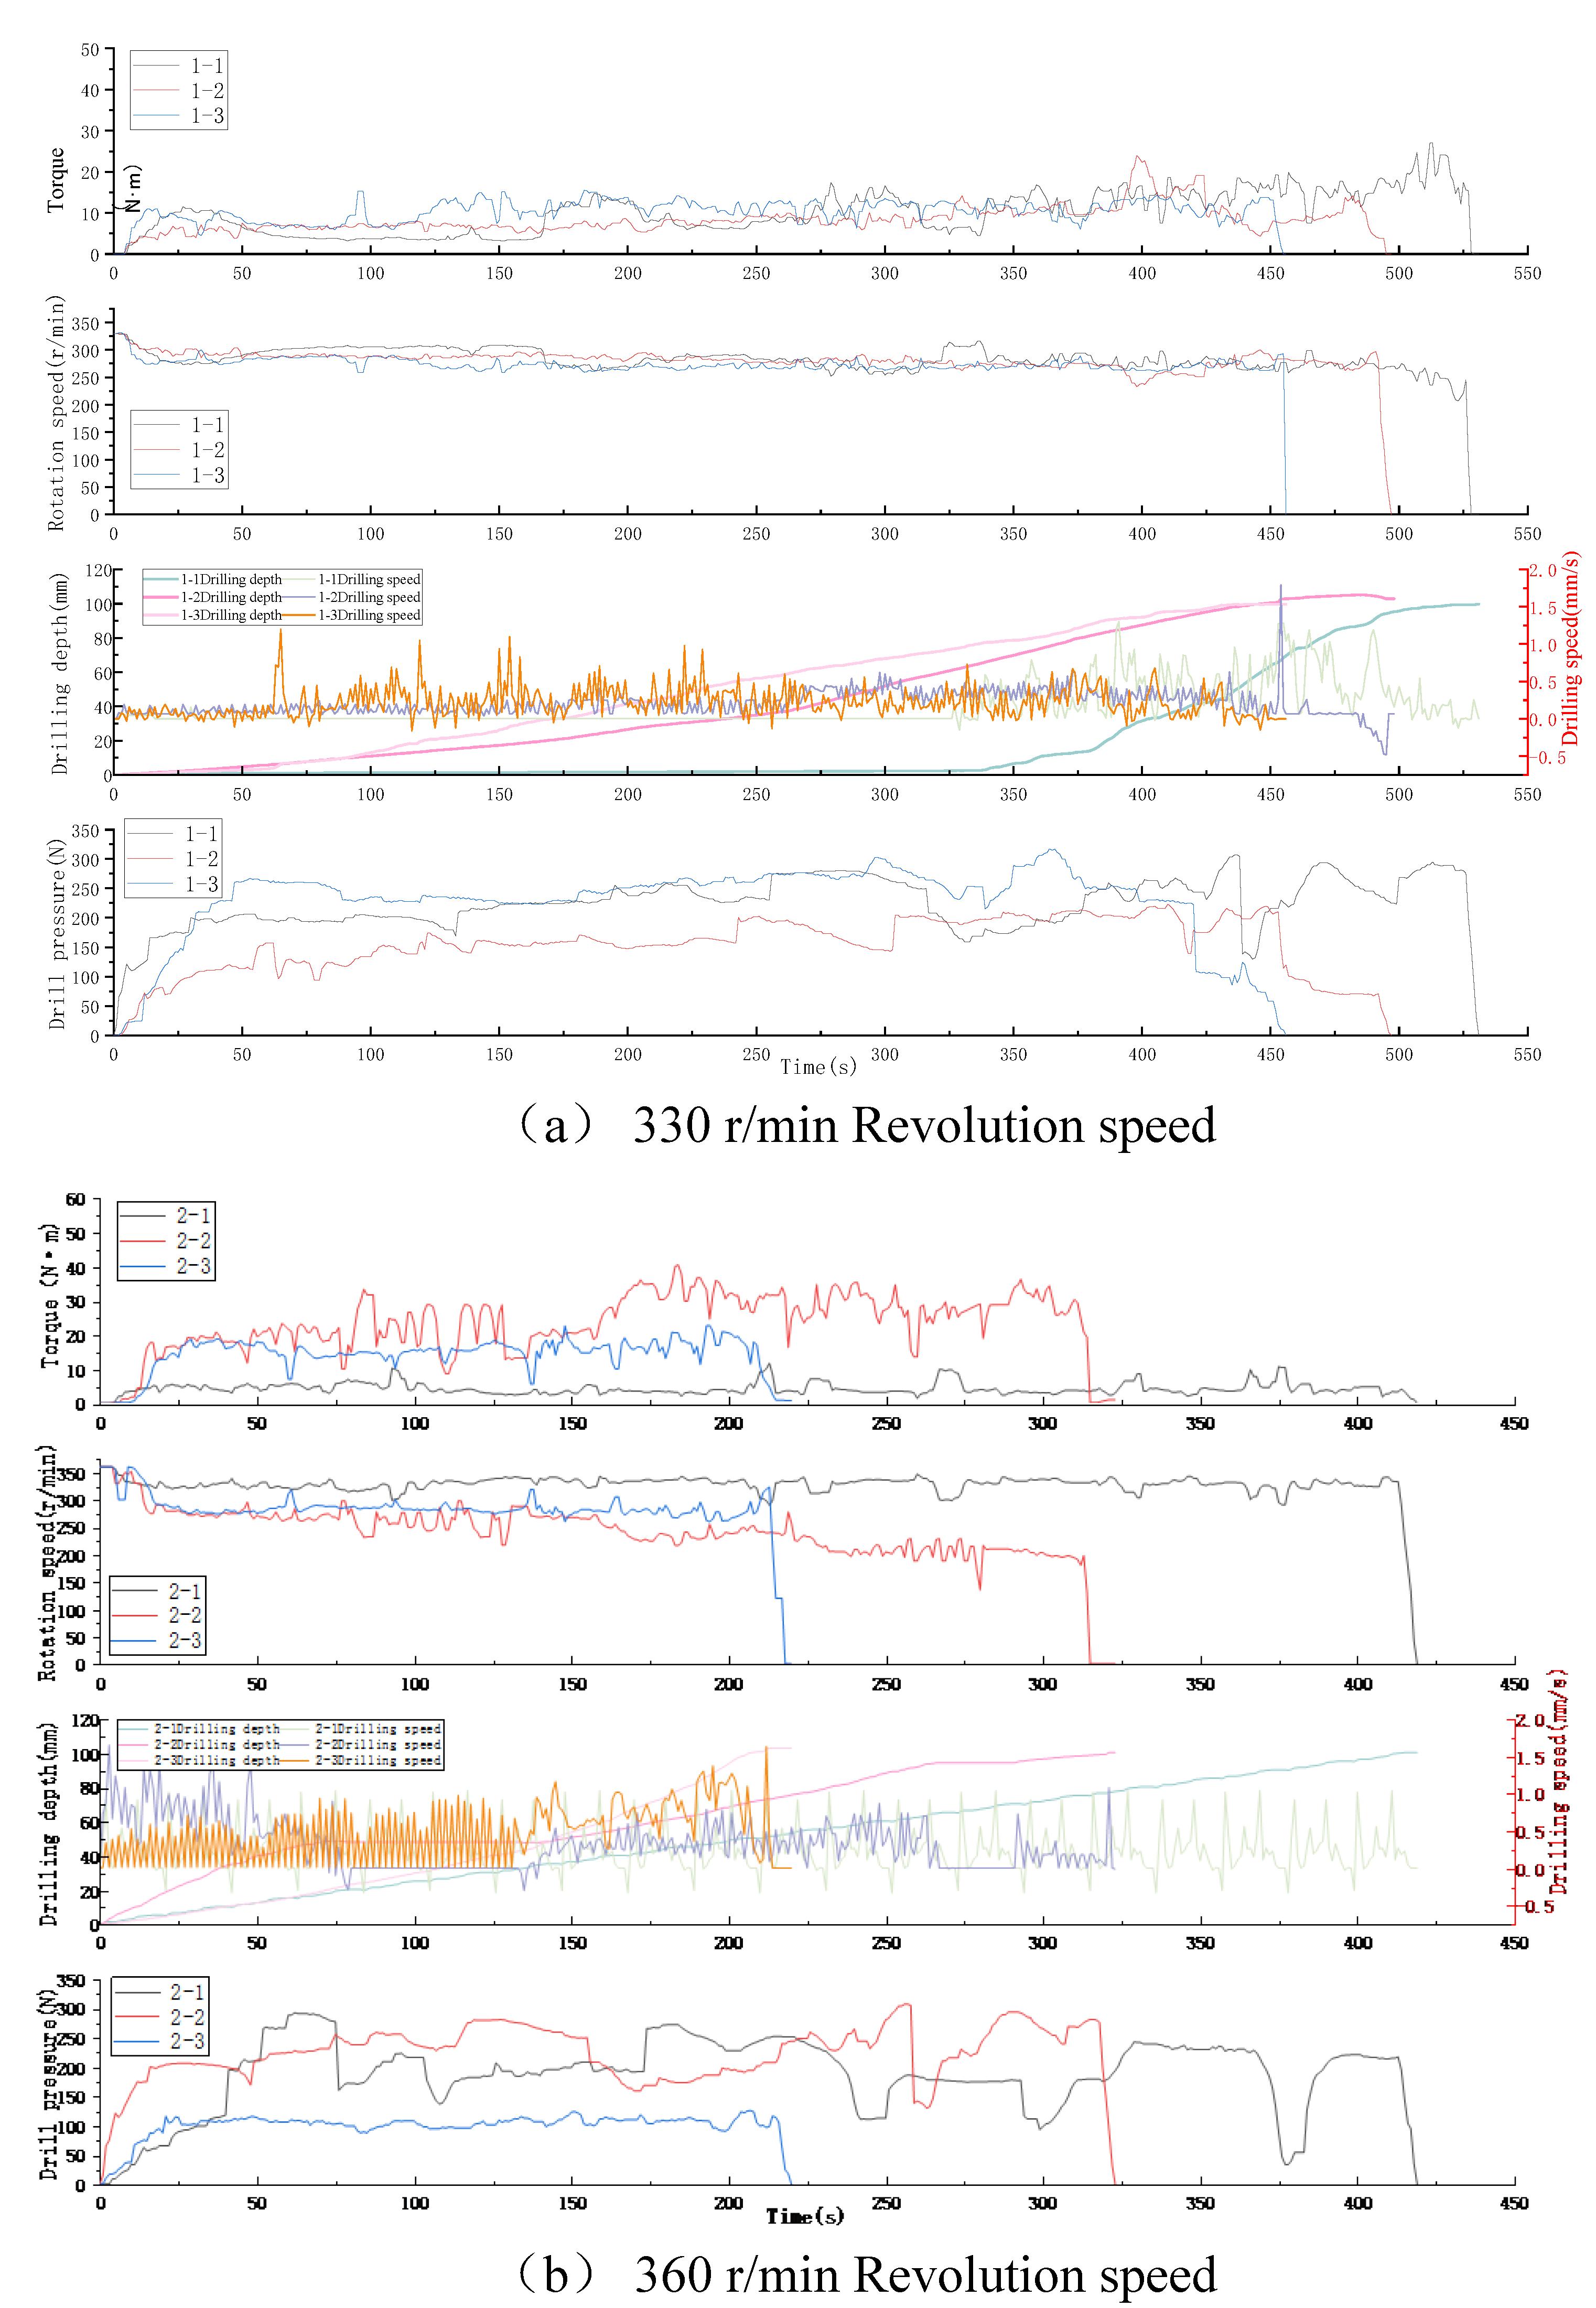
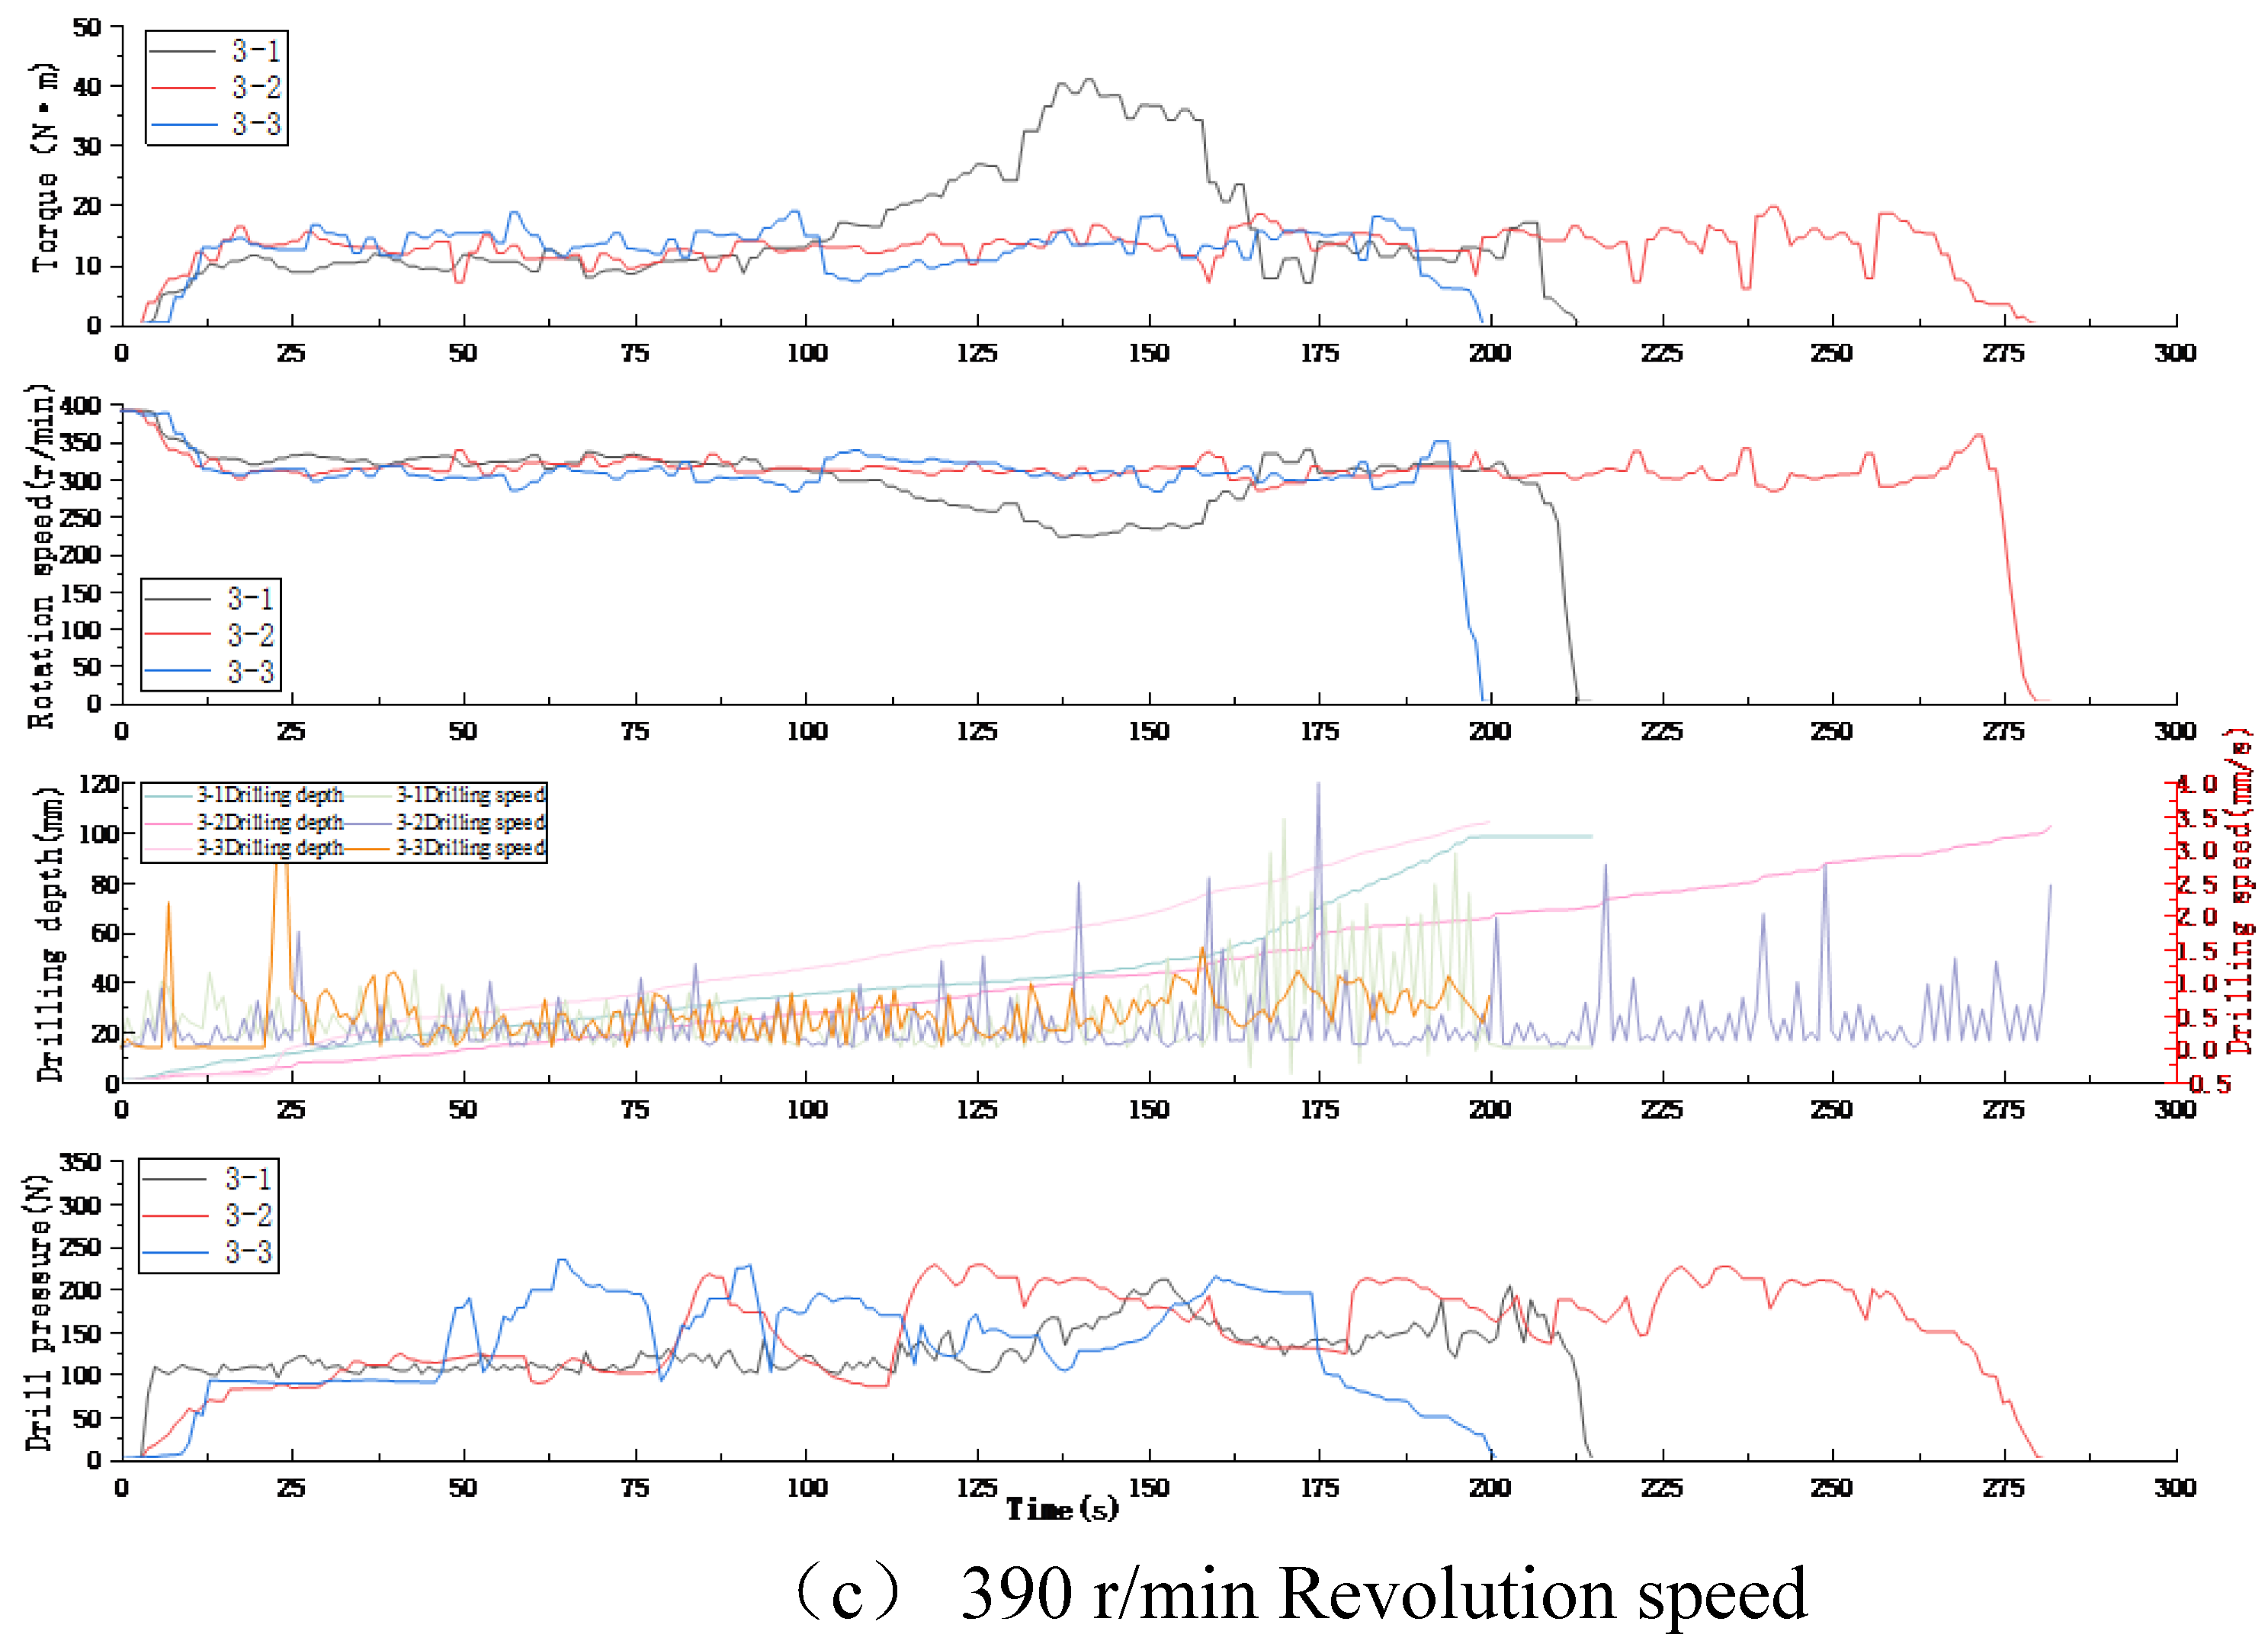
Figure 10.
Vibration parameters.
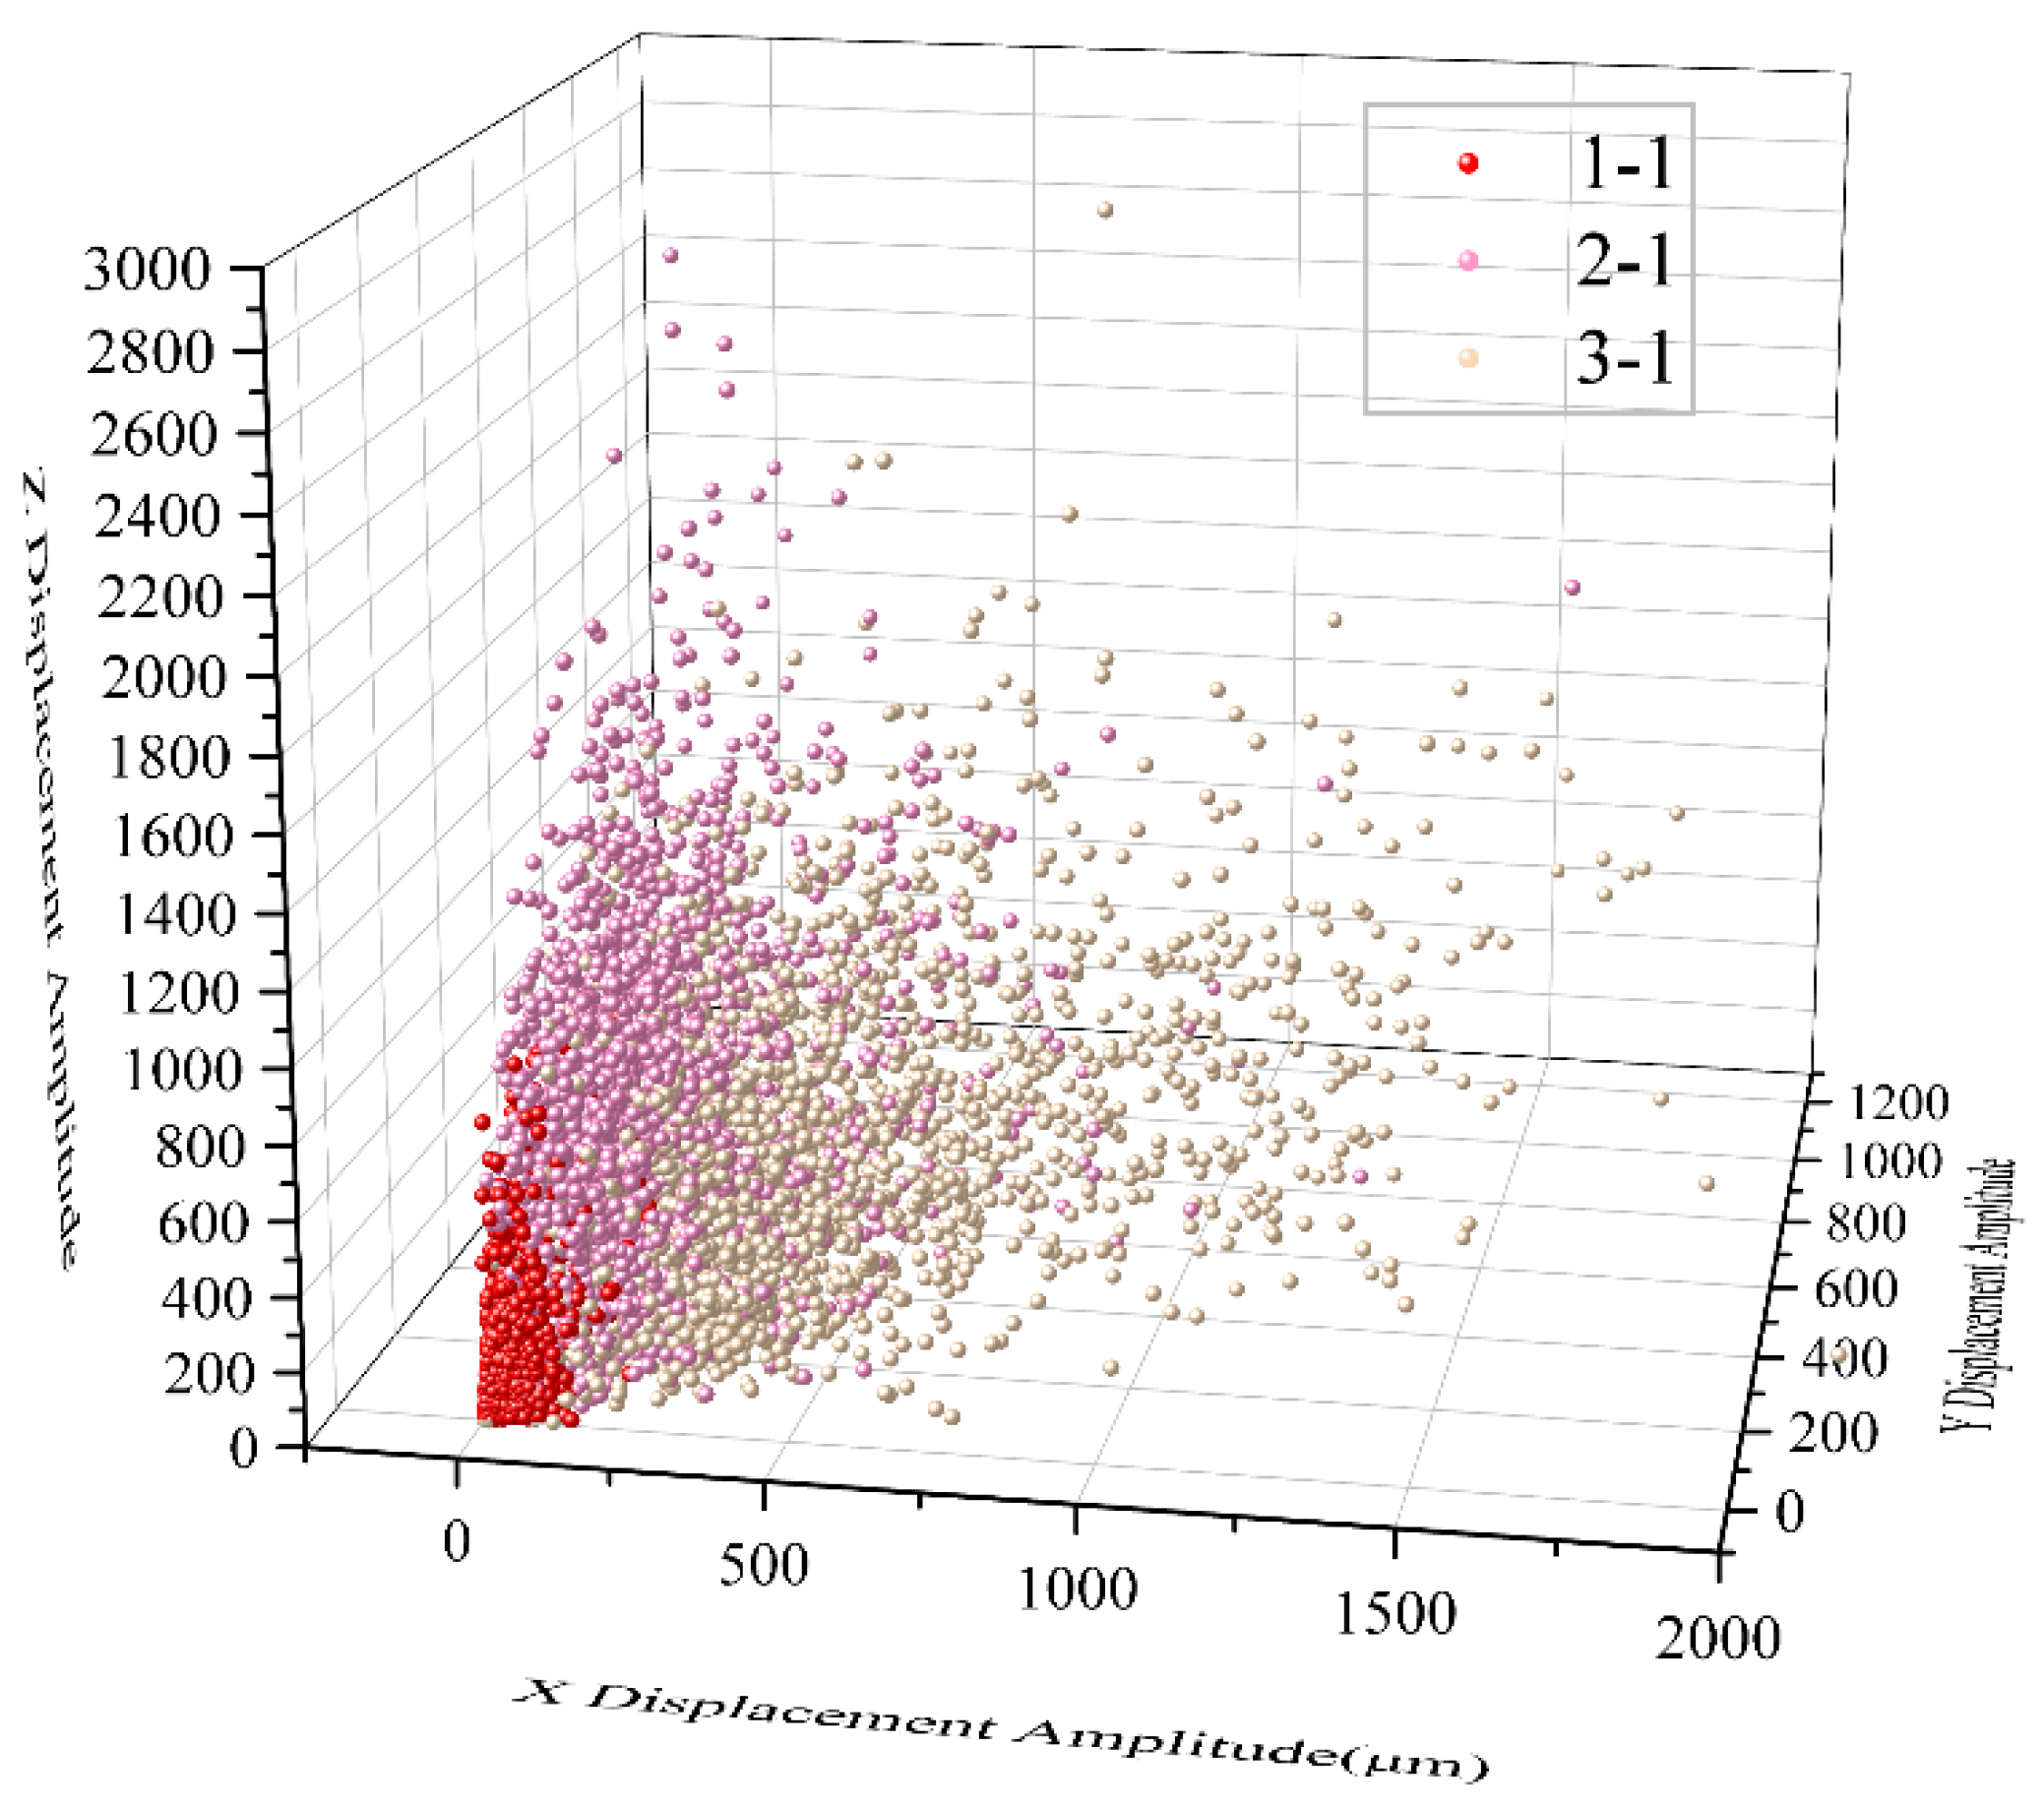
Figure 11.
Correlation diagram of parameters.
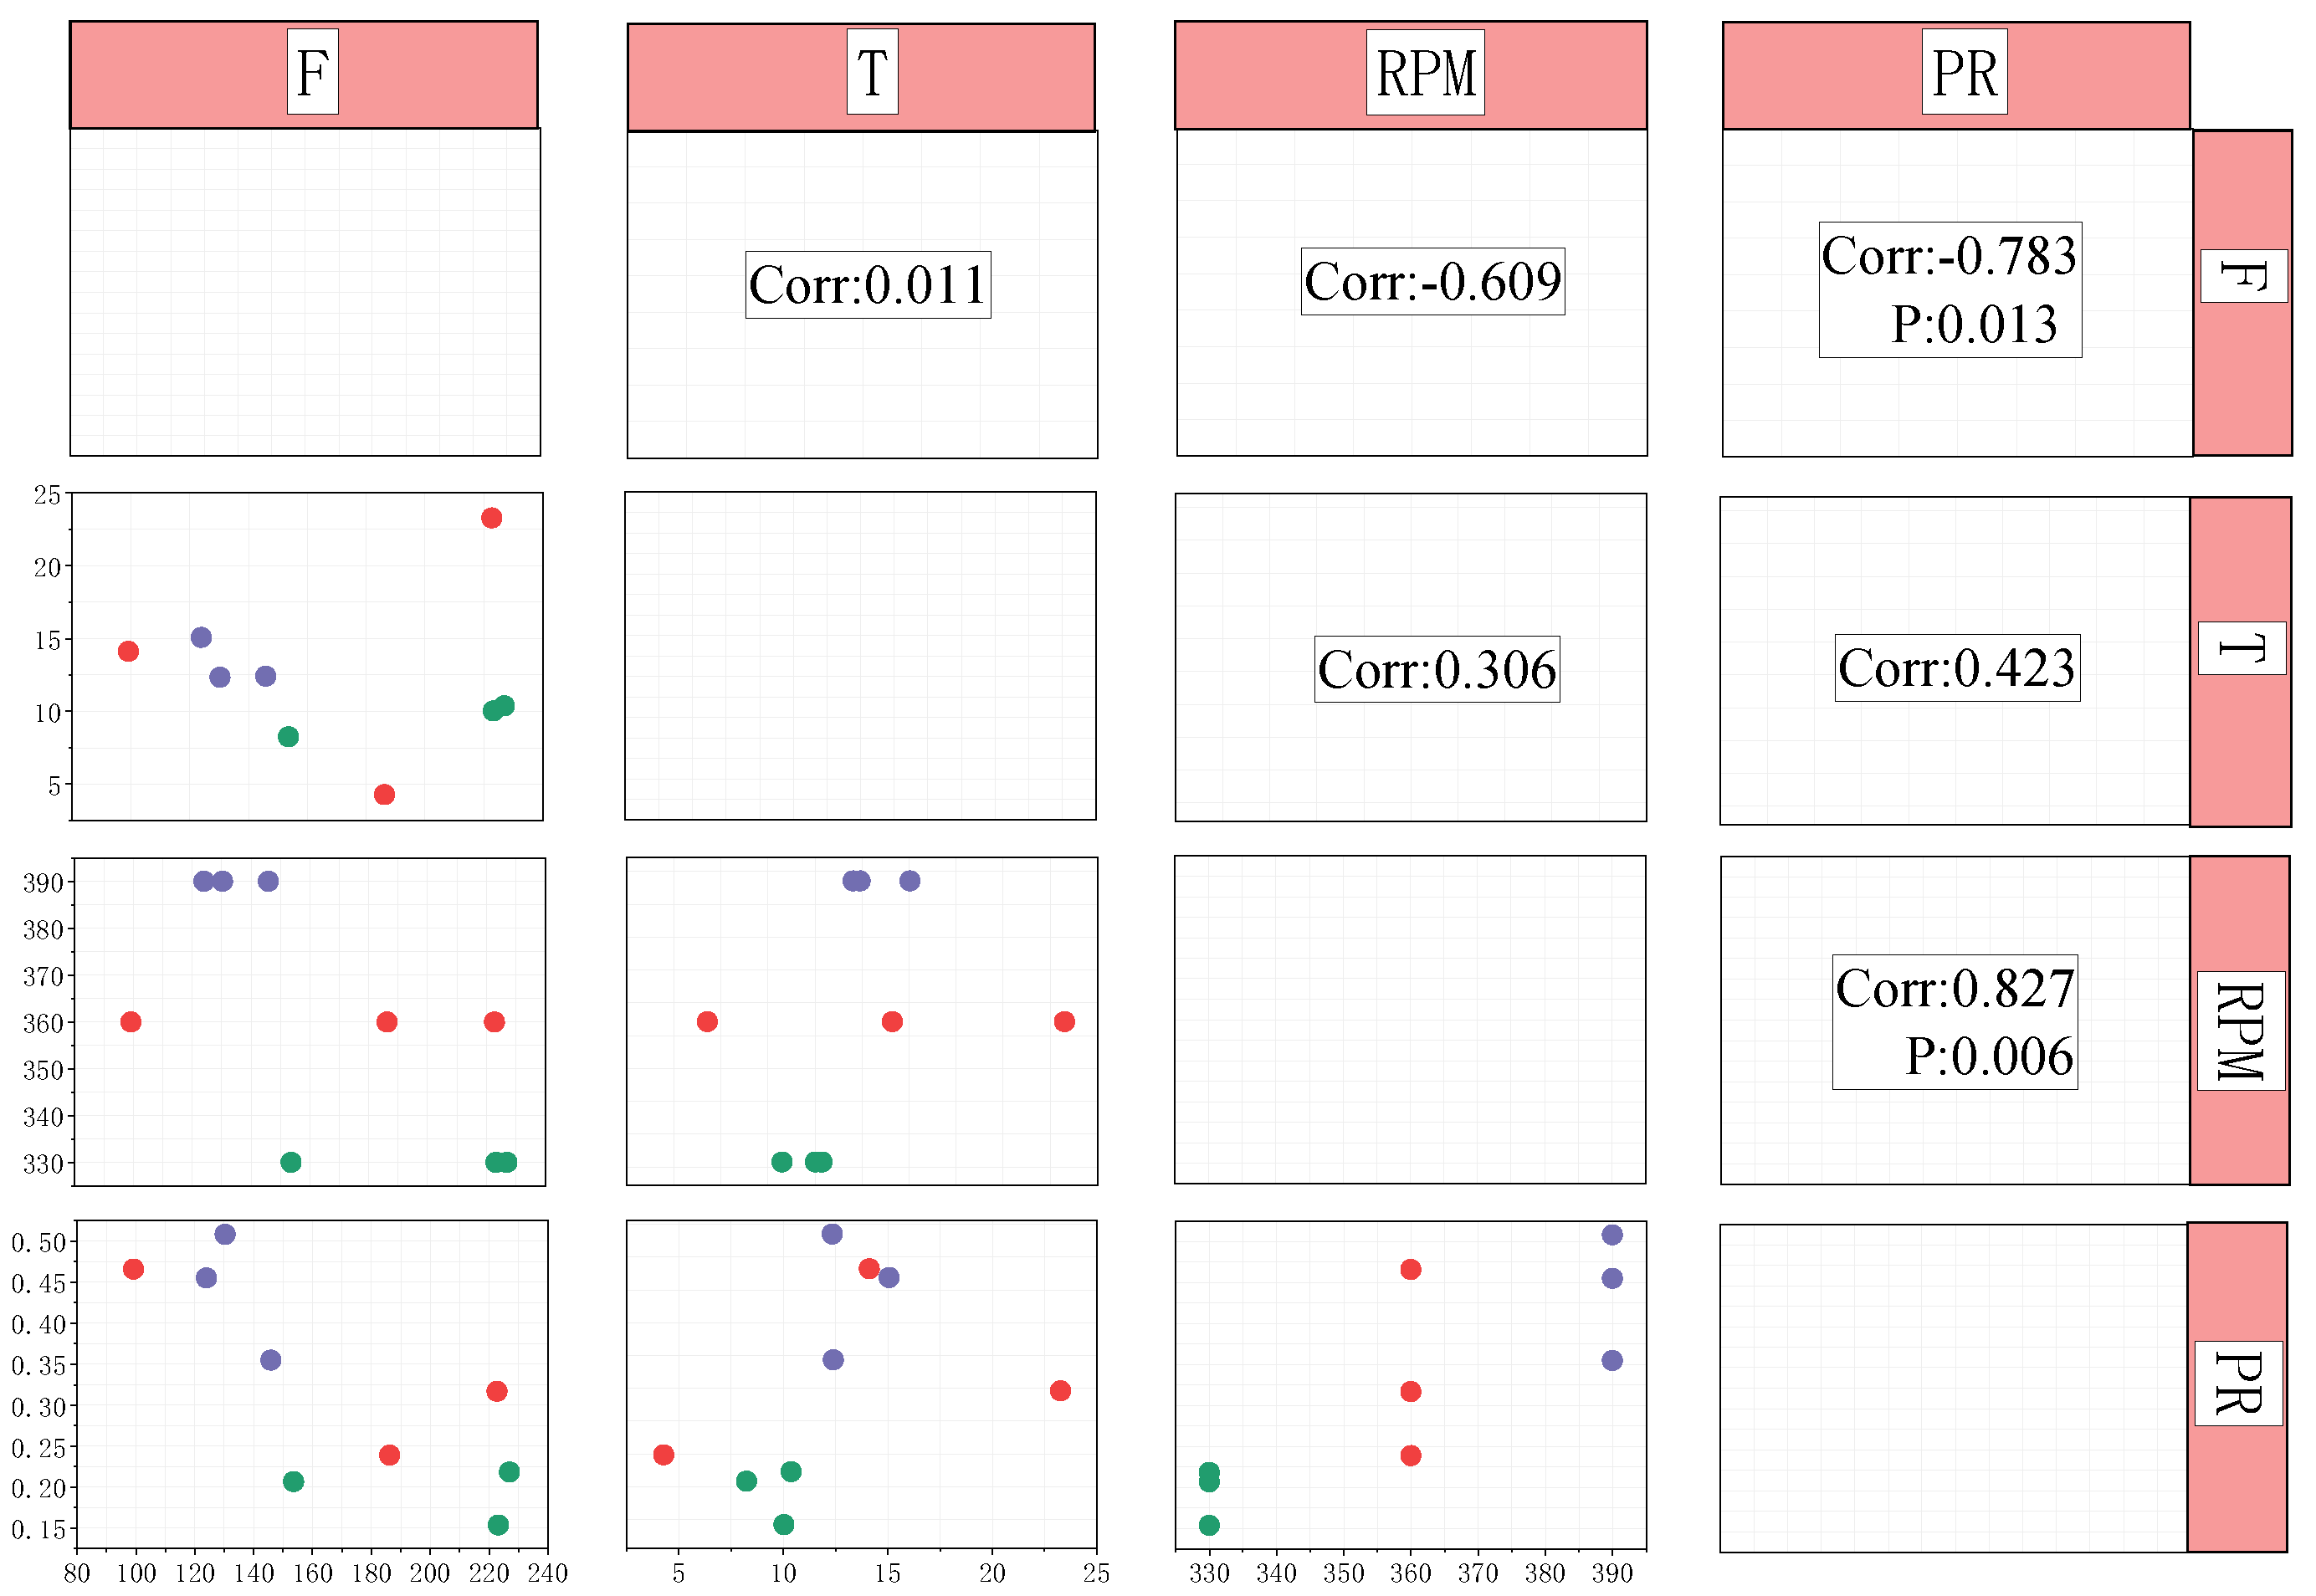
Figure 12.
Fitting curve of drilling parameters and rock mechanics parameters.
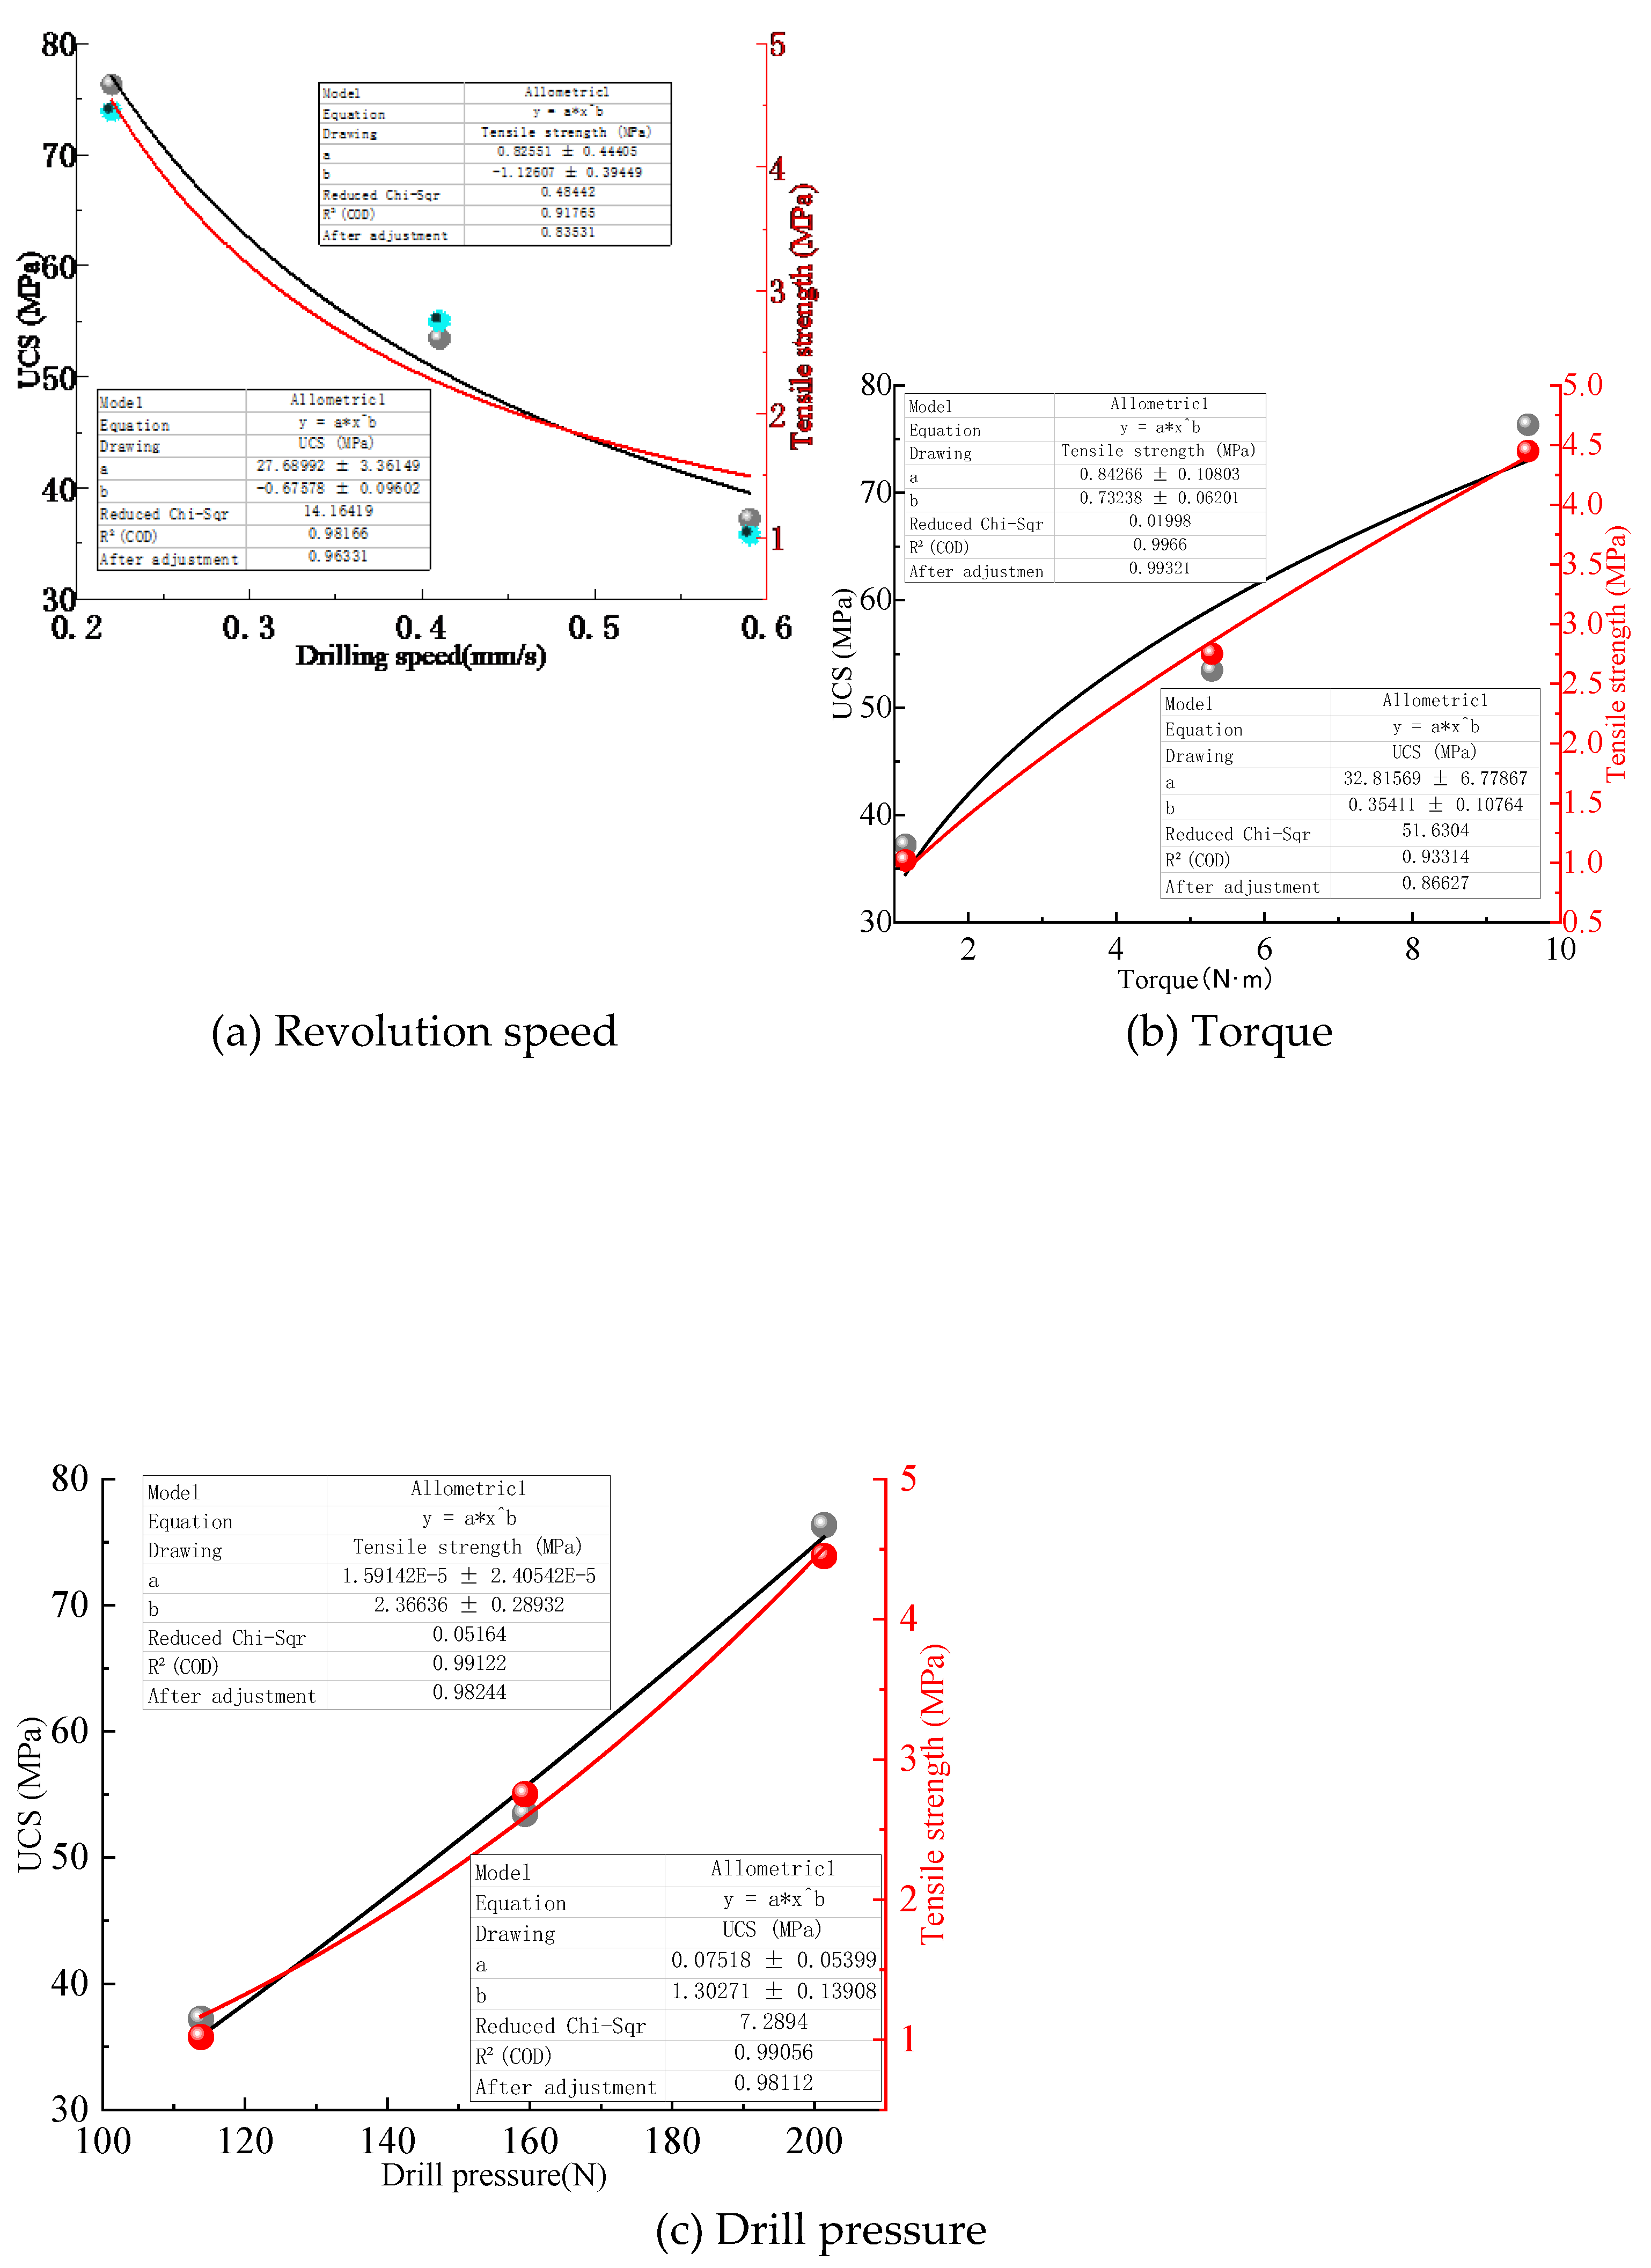
Table 1.
Technical parameters of small drilling platform.
| Index | Rated voltage | Nominal power | Racing speed | Magnetic seat suction | Guide rail stroke |
| Parameter | 220V | 1880W | 0~550r/min | 18800N | 0~170 mm |
Table 2.
Sensor technical parameters.
| Unit | Indicators | 参数 |
| Displacement transducer | range | 0-1000mm |
| Precision | 0.03mm | |
| Output signal | RS485 | |
| Overload capacity | 120% | |
| Dynamic torque - speed sensor | Torque range | 0-100N.m |
| Speed range | 0-500r/min | |
| Precision | 0.5% | |
| Overload capacity | 150% | |
| Triaxial vibration sensor | Vibration displacement | 0-30000μm |
| Vibration velocity | 0~50mm/s | |
| Precision | <F.S±5% | |
| Baud rate | 4800bps-230400bps | |
| Pressure transducer | range | 0-100kg |
| Precision | 0.1%F.S | |
| Sensitivity | 1.0-2.0±0.1mv/V |
Table 6.
fitting results of drilling parameters and rock mechanics parameters.
| Drilling parameters | UCS (MPa) | Tensile strength (MPa) |
| Drilling speed (mm/s) | ||
| R2=0.98166 | R2=0.91765 | |
| Torque (N·m) | ||
| R2=0.93314 | R2=0.9966 | |
| drilling pressure(N) | ||
| R2=0.99056 | R2=0.99122 |
Disclaimer/Publisher’s Note: The statements, opinions and data contained in all publications are solely those of the individual author(s) and contributor(s) and not of MDPI and/or the editor(s). MDPI and/or the editor(s) disclaim responsibility for any injury to people or property resulting from any ideas, methods, instructions or products referred to in the content. |
© 2025 by the authors. Licensee MDPI, Basel, Switzerland. This article is an open access article distributed under the terms and conditions of the Creative Commons Attribution (CC BY) license (http://creativecommons.org/licenses/by/4.0/).
Copyright: This open access article is published under a Creative Commons CC BY 4.0 license, which permit the free download, distribution, and reuse, provided that the author and preprint are cited in any reuse.


