Submitted:
21 September 2025
Posted:
22 September 2025
You are already at the latest version
Abstract
The accurate and timely diagnosis of neurodegenerative disorders such as Parkinson’s disease, Alzheimer’s disease and major depressive disorder, critically depends on the real-time monitoring and precise interpretation of authentic neurotransmitter (NT) signal dynamics in complex biological fluids (CBFs) of the body, including cerebrospinal fluids. NT dynamic patterns are determined by both the types and concentrations of NTs at any given time in CBFs. However, current biosensors face significant limitations in sensitivity and selectivity, thereby hindering reliable estimation (detection and quantification) of NTs. To overcome these limitations, nanomaterials and bioenzymes have been employed to modify biosensor interfaces, often through immobilization on biopolymer-functionalized surfaces. Despite these advancements, challenges such as signal convolution and interferences from complex NT interactions, electrode fouling, and inter-NT crosstalk remain unresolved. Recent developments in Artificial Intelligence (AI), particularly in machine learning (ML), pattern recognition (PR) and deep learning (DL), have demonstrated substantial promise in deconvoluting multiplexed NT signals to reveal accurate NT detection and quantification. This review synthesizes findings from 33 peer-reviewed studies, providing a comprehensive overview of the application of AI-based approaches for automated NT estimation. It first surveys the most frequently investigated NTs, associated estimation modalities and data acquisition techniques. Subsequently, it evaluates a range of AI methodologies employed for NT estimation. The review concludes by discussing the prevailing challenges in NT estimation and highlights prospective applications of AI-enhanced NT monitoring, including Closed-Loop Deep Brain Stimulation (CLDBS), which holds promises for advancing therapeutic treatments for neurodegenerative conditions.
Keywords:
artificial intelligence
; deep learning
; machine learning
; pattern recognition
; biosensors
; voltammetry
; neurotransmitters
1. Introduction
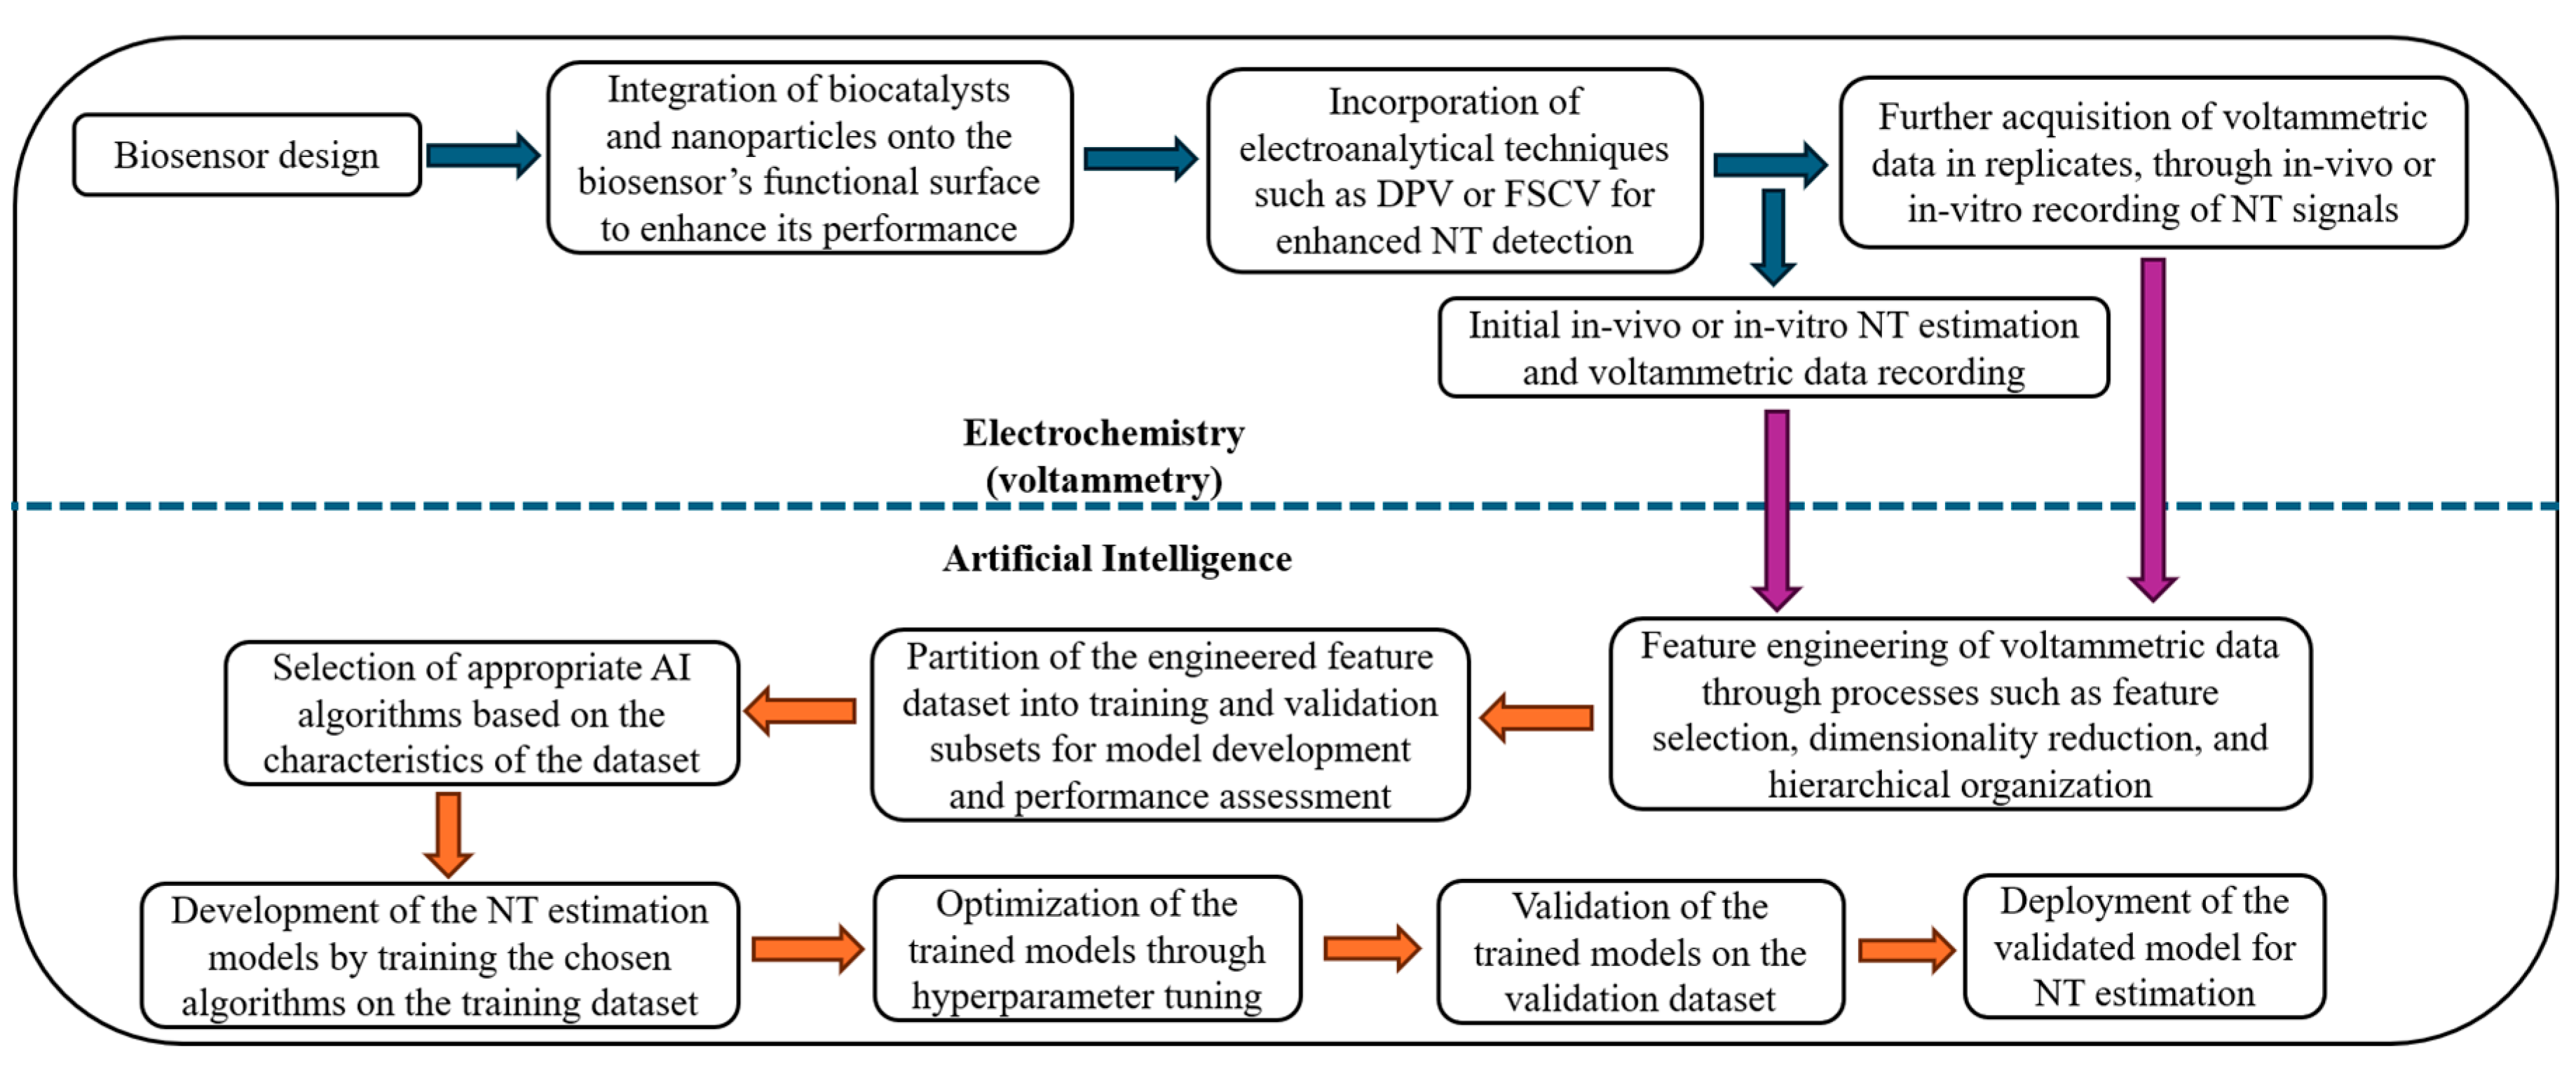
Neurotransmitters (NTs) serve as crucial biomarkers for neurodegenerative diseases such as Parkinson’s disease, Alzheimer’s disease and major depressive disorder [1,2,3,4,5]. Understanding their neurological roles, accurately monitoring their levels in biological fluids like cerebrospinal fluids are essential for characterizing the onset and progression of these neurodegenerative diseases [1,2,3,4,5,7,8,9,10,11,12,14,15,16]. NT monitoring involves their detection, quantification or estimation. Detection of NTs refers to their classification into specific categories, quantification involves predicting their concentration levels and estimation refers to their simultaneous detection and quantification [1]. Traditional methods for monitoring NT dynamics include biosensors integrated with electrochemical techniques such as differential pulse voltammetry (DPV) and fast scan cyclic voltammetry (FSCV). These integrations have advanced the ability to study NT behaviors in both in-vivo and in-vitro settings, deciphering the understanding of NT dynamics in biological fluids. However, these integrations typically lack real-time capabilities and suffer from low spatial and temporal resolution, impairing their effectiveness in analyzing NT dynamics within complex biological environments [5,7]. Additionally, most biosensors are limited by poor selectivity and sensitivity, as they often struggle to differentiate and accurately quantify specific NTs [1,2,3]. Attempts have been made to improve biosensors’ selectivity and sensitivity by integrating nanomaterials and bioenzymes onto their functional surfaces, often through immobilization using biopolymers such as chitosan. Despite these advancements, challenges such as signal convolution and interferences from complex NT interactions, electrode fouling, and inter-NT crosstalk remain unresolved. To address these limitations, recent advancements have focused on integrating artificial intelligence (AI), particularly machine learning (ML), deep learning (DL) and pattern recognition (PR) with biosensors and electrochemical sensing techniques. These integrations have significantly enhanced real-time, in vivo detection and quantification of NTs, outperforming conventional methods used in isolation. AI models are effective at extracting meaningful features from complex and multidimensional data like voltammetric data, improving estimation accuracy and enabling adaptive, closed-loop systems for real-time NT monitoring [1]. Prospective applications of AI-enhanced NT monitoring include 1) closed-loop deep brain stimulation (CLDBS), which holds promise for advancing therapeutic interventions for neurodegenerative conditions including Parkinson’s by monitoring dopamine (DA) levels in cerebrospinal fluids, 2) diagnosis of conditions like pheochromocytoma and neuroblastoma by estimating urinary metabolites, such as vanillylmandelic acid (VMA) for norepinephrine (NE) and homovanillic acid (HVA) for dopamine (DA) from urine samples, 3) detection of the onset or progression of carcinoid syndrome by monitoring serotonin (SE) levels in blood samples. This review critically evaluates current research at the intersection of AI, biosensors, and voltammetry for NT detection and quantification. It explores the methodologies employed, the types of biosensors and AI models utilized, key performance outcomes, and ongoing challenges in the field. Through this review, we aim to identify major trends, existing technological gaps, and future directions for the development of intelligent neurochemical sensing systems. The following introductory subsections provide an overview of key NTs, identify current knowledge gaps, outline estimation challenges, and examine how AI-driven approaches can address these issues. Figure 1 summarizes the integration of AI with biosensing and voltammetric methods for accurate NT estimation in biological fluids.
1.1. Synopsis of Neurotransmitters (NTs)
NTs are important biochemical messengers, synthesized and secreted in low and temporally varying physiological concentrations within the complex in-vivo environments of the human body. These environments are mostly the intestines and various regions of the central nervous system (CNS) including the cerebrospinal fluids of the brain and spinal cord [1,2,3]. NTs coexist at equilibrium concentrations in the CNS where they take part in synaptic transmission processes. During these processes, they act very fast, before being instantaneously oxidized or recycled back into the nervous system after fulfilling their physiological, psychological or behavioral roles [4,5,6,7]. Abrupt or undesired changes in NT concentrations can disrupt normal brain function and lead to severe or irreversible mental disorders such as Parkinson’s disease, Alzheimer’s disease, depression, and schizophrenia [1,2,3,4,5,7,8,9,10,12,14,15,16]. As NTs play vital roles in maintaining mental and physical health, they are therefore valuable biomarkers for these diseases, necessitating their real-time monitoring [1,2,3,4,5,7,9,10,12,14,15,16]. Dopamine (DA) is particularly well-studied due to its significant role in neuromodulation and as a biomarker for diseases like Parkinson’s. It also influences various motivated behaviors [10,11,14,15,16]. Acetylcholine (ACH), Serotonin (SE), Epinephrine (EP), Norepinephrine (NE) and Glutamate (GT) are also under active investigation for their roles in mental and physical health [1,4,6,7,12,13,17,18,19]. However, a knowledge gap on in-vivo functions of these NTs persists, as they interact with each other, producing complex signals and crosstalk [1]. When NTs are detected and quantified using electrochemical methods, their signals are often multiplexed due to their complex mutual interactions, electrode “fouling” and crosstalk, alongside interference from other neurochemicals and background noise present in the complex biological fluids [8]. This complexity makes accurate, real-time, in-situ monitoring of NTs with conventional electrochemical biosensors very challenging [1,9]. To address these challenges, various neurochemical methods utilizing implantable biosensors (IBSs) have been proposed [10,11,12,13]. More than a hundred NT species have been identified, and research continues to discover more
1.2. Knowledge Gap on Neurotransmitters and Their Estimation Using Biosensors
Our understanding of the intricate interactions between NTs and their impact on mental and physical health is still limited. This gap in knowledge is largely due to the absence of suitable sensors that can perform real-time, in-vivo monitoring of NTs, particularly in the brain [18,19]. Currently, monitoring NT concentrations in real-time, comprehending their complex functions in the brain, and assessing how their interactions affect health pose significant challenges for biomedical, bioinformatic and chemometric research. To address these challenges, various biosensors have been developed, with more in the pipeline, to track the dynamic activities of NTs and measure the complex signal patterns they produce in-vivo [4,20]. Biosensors are electrochemical transducers capable of converting physiological parameters like NT concentrations into measurable signals, typically electrical or optical in nature. They can be categorized based on their materials as metal nanoparticles based, including carbon, polymers, aptamers or by the biocatalysts used for their fabrication, such as antibodies, DNA, microbes, or enzymes, which are applied to their functional surface for NT estimation [21,22,23,25]. Nanoparticles and biocatalysts are often immobilized on biosensors’ functional surfaces using biopolymers to improve the sensitivity and selectivity for NT estimation. Chitosan, a widely used biopolymer, is favored for its biocompatibility [26,27,28,29,30,31]. The application of biosensors and electrochemistry for in-vivo NT estimation benefits from the distinct oxidation potentials of NTs, allowing their sensing through neurochemical processes [21,22,23,25]. When estimating NTs in-vivo, it is crucial to consider factors related to the biosensors such as limit of detection (LOD), chemical selectivity, sensitivity, spatial resolution, temporal resolution, stability, reproducibility and cost [22,23]. Traditional neurochemical methods for NT estimation include microdialysis, constant-potential amperometry, fast scan cyclic voltammetry (FSCV), differential pulse voltammetry (DPV), and high-speed chronoamperometry. Among these, FSCV and DPV have demonstrated good chemical selectivity and sensitivity, with moderate temporal and spatial resolution when used with carbon fiber microelectrodes [32]. However, persistent challenges remain in the in-vivo detection of NTs by electrochemical techniques.
1.3. Challenges in Neurotransmitter Estimation by Electrochemical Techniques and Their Mitigation
The challenges in employing electrochemical methods for the biorecognition of NTs arise from the fact that some electrochemically active NTs and other neurochemicals have similar chemical structures and oxidation potentials. These similarities lead to similar or comparable interactive chemical effects on biosensors, resulting in interferences among the recorded sensor signals. Such interference produces multiplexed signal patterns, crosstalk, and electrode "fouling" [1,2,3,33,34,35,36,37,38]. These issues compromise the sensitivity and selectivity of biosensors, making it difficult to accurately identify and quantify NTs within complex biological fluids [22,23]. The problem of low selectivity or insufficient qualitative detection of NTs by biosensors is addressed by incorporating NT-specific biocatalysts, such as antibodies, enzymes, or DNA to the biosensors’ functional surfaces. These biocatalysts enhance the biosensors' performances by catalyzing the oxidation of targeted NTs, which accelerates the detection process [21,22,23,25]. The catalytic oxidation of NTs lowers their detection potential and generates byproducts that can be detected electrochemically. For example, tyrosinase catalyzes the conversion of electrically inert DA into electroactive dopaquinone, which can be easily detected electrochemically [18,23]. Catecholamine NTs like glutamate, histamine, and acetylcholine are also electrochemically inert, complicating their selective detection with biosensors. To overcome this, NT-specific enzymes, such as glutamate oxidase for glutamate and acetylcholinesterase for acetylcholine, are used to catalyze their oxidation, enhancing their detection [10,18,19,20,21,22,23]. These enzymes lower the oxidation potential of NTs, improving detection speed and selectivity in complex biological fluids [10,23]. However, practical in-vivo implementation, particularly in the brain, is challenging because some enzymes require substantial amounts of oxygen for their catalytic activity [10,18,22,23]. This oxygen is often scarce in the confined regions of brain tissue where biosensors are implanted. To address this issue, nanoparticles have been proposed to enhance the enzyme-catalyzed reactions in these confined areas [4,25,34,39]. These nanoparticles are functionalized on the surfaces of implantable biosensors along with NT-specific enzymes, all immobilized by a biocompatible matrix such as chitosan biopolymer. Chitosan is particularly suitable for in-vivo applications due to its non-toxic, biodegradable, biocompatible nature, and FDA approval [26,27,28,29,30,31]. The biocompatible matrix ensures that the nanoparticles and NT-specific enzymes remain in place on the biosensor’s functional surface within the intended region of implantation. The problem of low sensitivity or insufficient quantification of NTs by biosensors is addressed by reducing the size of the biosensors' functional surfaces [12]. Miniaturizing these surfaces improves the spatial resolution of the biosensors, through the enhancement of their effective functional surface area and detection limits. These moves improve the quantitative measurement of NTs. Additionally, incorporating nanoparticles onto the functional surfaces of the biosensors further boosts their spatial resolution, increasing the surface-area-to-volume ratio of the sensors. This amplifies the NT-signal transduction with higher sensitivity [23]. However, unresolved issues remain in the in-vivo estimation of NTs using electrochemical techniques.
1.4. Unresolved Issues in NT Estimation by Electrochemical Techniques and Potential AI-Driven Solutions
Despite efforts to enhance the selectivity and sensitivity of biosensors, multiplexed signals from NT solutions still arise due to crosstalk between the NTs and other neurochemicals. To address this problem, various AI algorithms, statistical methods, and electrochemical techniques have been proposed to deconvolve these multiplexed signals to reveal the “true” NT patterns [1,9,24,33,34,35,36,37,38,40,41,42,43,44,45,46,47,48,49,50,51,52,53,54,55,56,57,58,59,60,61,62]. The deconvolved NT signals have potential applications in future therapies, such as closed-loop deep brain stimulation therapies for neurological disorders like Parkinson’s disease [63,64,65,66,67,68,69,70]. AI algorithms have demonstrated superior accuracy in deconvolving NT patterns from complex in-vitro and in-vivo environments. AI is a broad domain within computer science that includes key areas such as Machine Learning (ML), Deep Learning (DL), Pattern Recognition (PR), and Data Science. Over the past decade, there has been a growing interest in applying AI to biomedical engineering, electrochemistry, bioinformatics and chemometrics, although research in this area remains limited, as highlighted by reviews [71,72,73,74,75,76]. These reviews have primarily examined the use of AI algorithms with biochemical and electrochemical sensors.
Figure 1.
Block diagram summary of the integration of AI with biosensors and voltammetry for the estimation of neurotransmitters.
Figure 1.
Block diagram summary of the integration of AI with biosensors and voltammetry for the estimation of neurotransmitters.
1.5. Related Reviews
Previous surveys have explored various methods for estimating NTs, including in-vivo and in-vitro approaches. However, none have specifically focused on the application of AI for the automatic detection and quantification of NTs. Table 1 provides a summary of previous surveys on neurotransmitter (NT) estimation, with emphasis on four key aspects: (1) NT analysis, indicating the structural and functional properties of NTs; (2) Voltammetric sensing techniques, analyzing the electrochemical methods used in NTs sensing; (3) Simultaneous NT estimation, evaluating the concurrent detection and quantification of multiple NTs and (4) Application of artificial intelligence (AI), assessing the integration of AI techniques into NT estimation.
1.6. Scope of this Review
This systematic review is unique in that it specifically addresses the use of ML, PR and DL algorithms for the automatic detection and quantification of NTs in complex environments. We have explored the most studied NTs, the detection methods employed, the types of signals analyzed, and the ML and DL algorithms utilized. To conduct this review, we selected 33 non-duplicate papers based on established inclusion and exclusion criteria, focusing on the estimation of NTs through ML, PR and DL techniques.
1.7. Organization of the Review
The rest of this review paper is structured as follows: Section 2 outlines the materials and method used for the survey including survey methodology, planning the survey, research questions (RQs), sources of review materials, and the search strategies. Section 3 details major themes used for conducting the survey, providing an overview of the most extensively studied NTs, discussing methods for estimating the NTs in complex environments and techniques for deconvolving their multiplexed signal patterns and exploring cutting-edge applications of AI algorithms in NT pattern recognition. Section 4 presents the survey outcomes focusing on various techniques used for the estimation of NTs. Section 5 offers a general discussion of the review and addresses the challenges associated with applying AI algorithms for in-vivo NT pattern recognition. It also discusses the potential applications of deconvolved multiplexed signal patterns, such as in therapies like Deep Brain Stimulation for treating neurological disorders, including Parkinson’s disease. The paper ends with a conclusion and perspectives in Section 6.
2. Materials and Method
The methodology and study design, summarized in Table 2, were systematically developed for this review based on a critical analysis of 33 peer-reviewed publications in the field, the key findings of which are presented in Table 3 and elaborated in this section.
2.1. Review Methodology
This survey offers a comprehensive overview of cutting-edge ML, PR and DL algorithms developed for the estimation of NTs from multiplexed sensor signals. It includes nearly all high-quality research on this topic. We follow the systematic review methodology outlined by Kitchenham et al. [77,78], which involves three key stages: planning, conducting, and reporting the survey.
2.2. Planning the Survey
We follow the Preferred Reporting Items for Systematic Reviews and Meta-Analyses (PRISMA) guidelines for this survey (Figure 2). PRISMA is commonly used to report systematic reviews because it provides a structured framework for thoroughly describing the review process. In line with PRISMA, we (a) define the research questions (RQ), (b) outline the sources of study materials, (c) establish the inclusion and exclusion criteria for the search strategies and (d) present the results.
2.2.1. Research Questions
The following research questions are addressed in this systematic review:
- RQ1: Which NTs were studied? This question explores the various types of NTs, including their electroactivity, chemical structures, functions, central nervous system locations, and receptor interactions.
- RQ2: How were the multiplexed signal patterns of NTs recorded? This inquiry examines the different biosensors and neurochemical techniques used to capture multiplexed NT signals from complex biological fluids, as well as the experimental settings (in-vitro or in-vivo).
- RQ3: What were the characteristics of the datasets? We will review the datasets based on their size, features, and authenticity.
- RQ4: Which ML, PR or DL algorithms were employed for NT estimation? This question will assess the AI algorithms used, including whether they were supervised or unsupervised, classification or regression, parametric or non-parametric, linear or nonlinear. It will also cover the ML workflows involved, such as feature selection, normalization/regularization, dimensionality reduction, model selection, model training-validation-testing and the quality metrics used to evaluate the performance of the trained models.
2.2.2. Sources of Study
A thorough search for high-quality literature for this review was conducted from 2009 to May 2025 across several key repositories including ACM Digital Library, Google Scholar, MDPI, ScienceDirect, Wiley Online Library, IEEE Xplore, Web of Science, Elsevier, Scopus, and Springer. Additionally, the search was expanded to include prominent conferences such as EMBS, where significant research in the field is actively presented and published.
2.2.3. Search Strategy for the Review
The PRISMA approach was used to collect relevant materials for this review as elaborated on Figure 1. Only English-language papers were included, and the selection was guided by a set of free-text search terms: ‘estimation of neurotransmitters’, ‘pattern recognition of neurotransmitters’, ‘detection and prediction of neurotransmitters’, ‘automatic quantification of neurotransmitters’, and ‘neurotransmitters and chemometrics’. Boolean operators such as “and,” “or,” “-” and “~” were employed to refine these search terms. Papers were selected based on the eligibility criteria outlined in Table 2, which details the standards for inclusion and exclusion according to the PRISMA methodology used in this review.
A search conducted in the specified repositories identified 150 relevant publications for this systematic review. After screening the titles, abstracts, full-text eligibility, scopes, and duplicates, 81 papers were selected. Of these, 49 were excluded for not meeting the established selection criteria. Ultimately, 31 research papers on the application of ML and DL algorithms for pattern recognition of NTs were included in the review. Additionally, 2 relevant studies found in the bibliographies of these papers were incorporated, bringing the total number of reviewed publications to 33 as presented in Figure 2.

Table 2.
Inclusion and exclusion criteria adopted to select the articles for the review.
| Criteria | Inclusion criteria | Exclusion criteria |
|---|---|---|
| Articles quality | Peer reviewed research Articles | Thesis and dissertations |
| Scope of the Articles | Articles with clear elaboration of the end-to-end AI algorithm used for the Pattern Recognition of NTs | Articles that do not meet this criterion |
| Publication Language | The articles must be published in English | Articles published in other languages other than English |
| Research Index Terms | A subset of the following words must be addressed by the articles: pattern recognition, simultaneous detection and prediction, automatic quantification + Neurotransmitters and Machine Learning, Deep Learning + Chemometrics | Any article not falling in these subsets |
| Target neurochemicals | Articles analyzing neurotransmitters | Articles analyzing neurochemicals other than neurotransmitters |
| Detection limits of the NTs | Articles focusing on in-vivo or in-vitro analysis of NTs having concentrations within the physiological ranges | Ranges Falling out the physiological ranges |
| Age of the publication | Articles published not earlier than the year 2009 | Articles published earlier than the year 2009 |
Figure 2.
The PRISMA approach for selecting articles for the review.
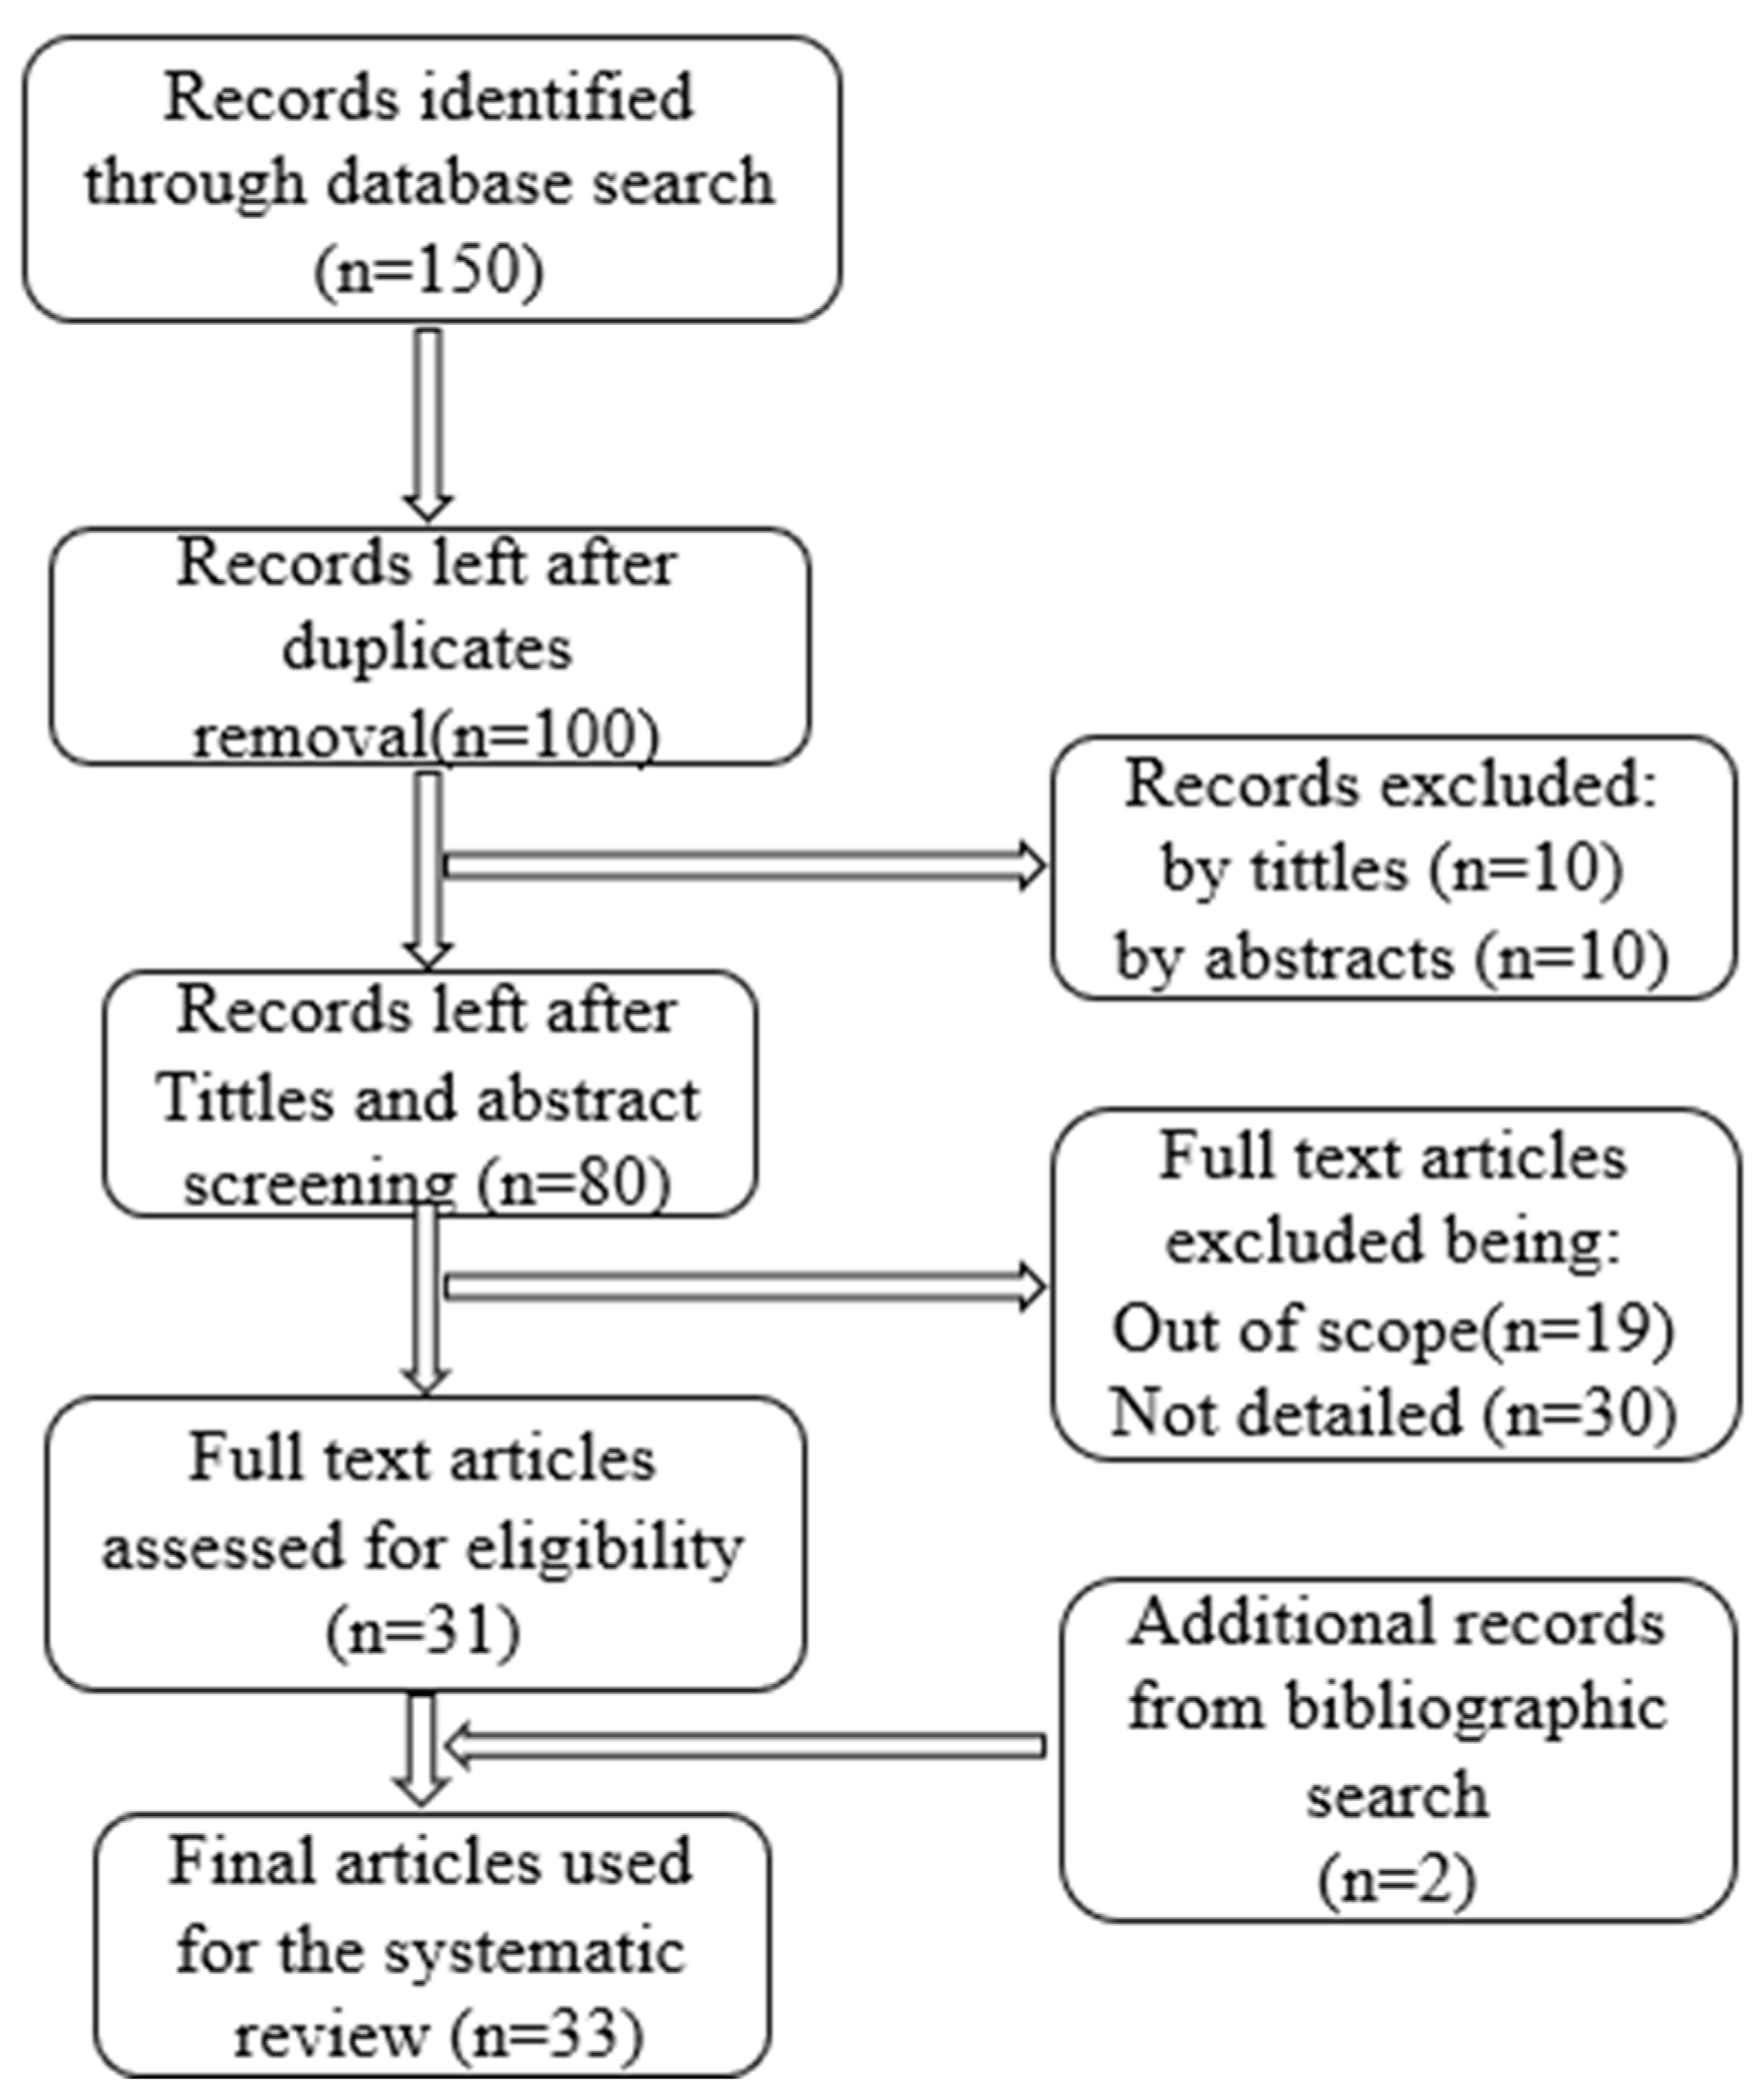
Figure 1 illustrates the process for selecting the 33 final articles included in this systematic review, with Table 3 summarizing the purposes of these articles and years of publication. Figure 3 depicts the publication trends in this field from 2009 to May 2025.
Table 3.
Selected articles for the review.
| Reference | Summary | Outcome | Publication Year |
|---|---|---|---|
| Sazonova et al [1] | Used two pattern recognition techniques: Principal Component Regression (PCR) and Partial Least Squared Regression (PLSR), with voltammetry to simultaneously estimate dopamine and serotonin, addressing signal overlap | Achieved estimation accuracies ranging from 81% to 91% for DA and 91% to 100% for SE | 2009 |
| Abbasi et al [2] | Developed a quantum/carbon dot tricolor fluorescent probe to enable rapid, pattern-recognition-based discrimination of catecholamine NTs from ascorbic acid (AA) in urine with Linear Discriminant Analysis (LDA). | Achieved 98% accuracy in NT discrimination using leave-many-out cross- validation | 2019 |
| Xiaotong et al [3] | Developed a metal nanoparticle-based nanozyme sensor array to enable pattern-recognition-driven discrimination of monoamine NTs in human serum using LDA and a Hierarchical Clustering Algorithm (HCA) | Successfully discriminated monoamine NTs at varying concentrations with 100% accuracy | 2022 |
| Jose et al [9] | Used TinyML embedded in portable biosensors to discriminate NTs from uric acid (UA) and ascorbic acid (AA) interference for real time applications. | Achieved NT-discrimination accuracies of 98.1% using a 32-bit floating-point unit and 96.01% after 8-bit quantization, | 2023 |
| Martens et al [21] | Predicted glutamate (GL) from whole-brain functional connectivity of the pregenual anterior cingulate cortex using elastic net (EN), PLSR and HCA | Achieved an R2 value (regression fit) of 0.143 and p-value (probability value) of less than 0.001 using EN for the prediction of GL | 2020 |
| Nchouwat et al [24] | Used nIRCat data to simultaneously detect and quantify age-dependent DA release in mice brain slices using CatBoost regressor, that was later distillated to kernelized ridge regressor (KRR) for improved performance. | Achieved a performance for the validation Mean Squared Error (MSE) of 0.001 and an R² value of 0.97 in estimating DA release. | 2025 |
| Salimian et al [33] | Used UV–vis spectrophotometry coupled with net analyte system and PCR to simultaneously detect levodopa (LD) and carbidopa (CD) in mixtures, drugs, and breast milk | Achieved mean recovery values of 96.86% for LD and 92.43% for CD using PCR, with corresponding mean squared prediction errors of 1.50 for LD and 7.14 for CD | 2022 |
| Dowek et al [34] | Developed a robust, pharmaceutical-grade method with PLSR to distinguish and quantify norepinephrine (NE) and epinephrine (EP) | Achieved R² values of 0.95 and 0.91 for the quantification of EP and NE respectively, with corresponding root mean square errors (RMSE) of 5.47 for EP and 7.27 for NE | 2022 |
| Jafarinejad et al [35] | Designed an optical sensor array with three fluorescent dyes and pattern recognition to detect DA, EP, and NE by tracking changes in their emission when gold ions are present using LDA, artificial neural networks (ANN) and multilinear regression (MLR) | Achieved an accuracy of 100% in discriminating the NTs and their mixtures using LDA | 2020 |
| Kallabis et al [36] | Applied MLR, KRR and Bayesian Linear regression (BLR) models to quantify dopamine concentrations amidst nonlinear variations induced by magnesium ion interactions. | Achieved a mean absolute percentage error of approximately 6–7% across all models, which is slightly above the experimental error observed in the absence of magnesium ions | 2024 |
| Jafarinejad et al [37] | Proposed a high-performance colorimetric sensor array and pattern recognition (PCA, LDA and HCA) to detect and distinguish catecholamines (DA, EP, NE and their mixtures) by their ability to reduce silver onto gold nanorods | Achieved a discrimination accuracy of 100% for the individual NTs and their mixtures using LDA | 2017 |
| Siamak et al [38] | Utilized nIRCat imaging combined with machine learning models: Support Vector Machine (SVM) and Random Forest (RF), to uncover distinct dopamine release patterns across different regions of mice brains | Achieved average detection accuracies of 55.5% and 83.2% using SVM and RF, respectively, in studies involving mice younger than 12 weeks. | 2023 |
| Komoto et al [40] |
Directly observed a single NT (DA, SE, NE or their mixtures) by Measuring tunneling current flowing through the single NT, using nanogap electrodes and XGBoost classifier. | Identified the spatial distribution patterns of NTs in the brain with high temporal resolution | 2020 |
| Hoseok et al [42] | Compared the performance of deep learning (DL) and principal component regression (PCR) in predicting NT concentrations focussing on DA, SE, EP and NE | Demonstrated that DL slightly outperformed PCR for NT detection, achieving an average accuracy of 96.23% compared to 95.39% with PCR | 2022 |
| Seongtak et al [43] | Used deep learning to simultaneously estimate tonic DA and SE with high temporal resolution in vitro. | Achieved statistically significant accuracy (p < 0.001) for the in vitro estimation of DA and SE | 2023 |
| Rantataro et al [44] | Selectively detected DA and SE at nanomolar concentration from complex in-vitro systems in real-time with electrochemical techniques | Achieved an average R² value of 0.99 for both DA and SE estimation using cyclic voltammetry (CV) and chronoamperometry | 2023 |
| Buchanan et al [45] | Used convolutional neural networks to evaluate SE neurochemistry in vivo | Achieved statistically significant accuracy (p < 0.0001) for the in vivo estimation of SE | 2024 |
| Simon et al [46] | Focused on linear and quadratic regression models to describe an FPGA-based system for measuring NT concentrations on a multi-sensor platform, utilizing a visible-light optical spectrometer | Achieved a mean training precision of 91.22% and a mean validation precision of 90.19% for NT estimation using quadratic regression | 2020 |
| Doyun Kim et al [47] | Automated cell detection method for TH-positive dopaminergic neurons in a mouse model of Parkinson’s disease using convolutional neural networks | Successfully detected TH-positive dopaminergic neurons with a recall of 78.07%, precision of 74.46%, and an F1 score of 76.51% | 2023 |
| Jian Lv et al [48] | Developed a nanopipette method coupled with an XGBoost classifier to detect DA in single exosomes | Achieved a classification accuracy of 99% for DA detection in single exosome | 2023 |
| Credico et al [49] | Applied ML algorithms (LDA, XGBoost and LightGBM) to identify phenotypic profile alterations of human dopaminergic neurons exposed to bisphenols and perfuoroalkyls | Achieved classification accuracies ranging from 88% to 96.5% across the three algorithms | 2023 |
| Arijit Pal Et al [50] | Detected DA using a machine-intelligent web app interface and paper sensor modified with MoS2 | Achieved classification accuracy of 99% | 2023 |
| Kammarchedu et al [52] | Electrochemical Screened NTs (DA, SE, EP and NE) using a customizable machine learning-based multimodal system based on K-nearest neighbors (KNNR) and decision tree regressors (DTR). | Successfully differentiated between the four NTs and selectively detected each when independently present in complex media | 2023 |
| Bang et al [53] | showed that ne tracks emotional modulation of attention in human amygdala and estimated NE, SE and DA in-vivo using deep learning | Achieved statistically significant accuracy (p < 0.001) for the in-vivo estimation of NE, DA and SE | 2023 |
| Sanjeet et al [54] | Simultaneously detected DA and SE in an optimized carbon thread-based miniaturized device using several ML algorithms | Achieved an R² value of 0.99 for both DA and SE estimation using k-nearest neighbors regressor and random forest regressor | 2024 |
| Goyal et al [55] | Applied voltammetry coupled with deep learning (DiscrimNet architecture) to estimate tonic concentrations of highly similar NTs (DA, SE and NE) and their mixtures | DiscrimNet accurately predicted changes in DA and SE levels, even in the presence of interfering substances like cocaine or oxycodone, demonstrating low RMSE across all NTs | 2024 |
| Unger et al [56] | Analyzed the directed evolution of a selective and sensitive SE sensor using ML (Random Forest and generalized linear model) | Used ML to demonstrate the detection of SE release in freely moving mice during fear conditioning, social interactions, and sleep–wake transitions | 2020 |
| Movassaghi1 et al [57] | Simultaneously monitored SE and DA across timescales by rapid pulse voltammetry (RPV) coupled with partial least squares regression (PLSR) | Demonstrated that RPV-PLSR outperforms FSCV-PCR in the simultaneous monitoring of DA and SE. | 2021 |
| Zhang et al [58] | Applied deep learning to automatically classify and predict NTs (GABA, acetylcholine and glutamate) synapses in electron microscopy | Successfully identified NT synapses from EM images to construct a complete neuronal connectivity map, achieving 98% validation accuracy | 2022 |
| Matsushita et al [59] | Automatically Identified phasic dopamine release using SVM | Accurately identified phasic DA using automatically extracted patches, achieving 89.18% accuracy and a best F-measure of 77.23% | 2018 |
| Matsushita et al [60] | Improved the automatic identification of phasic dopamine release from fast-scan cyclic voltammetry data using convolutional neural networks (CNN). | Achieved 97.66% accuracy in phasic DA detection using an end-to-end CNN object detection system based on YOLOv3 | 2019 |
| Xue et al [61] | Introduced a deep learning-voltammetry platform for the selective analysis of three neurochemicals (ascorbate, DA and sodium chloride) in live animal brains | Selectively and simultaneously estimated neurochemicals with high spatial and temporal resolution | 2021 |
| Nchouwat et al [111] | Used PCR and PLSR for the simultaneous estimation of NTs, reducing complexity for SE and DA | Simultaneously estimated DA and SE with 97.6% accuracy, while reducing the number of feature subsets required for the NT estimation | 2025 |
Figure 3 illustrates that the lowest number of publications were in 2009, 2017, and 2018, with only one article published each year, while the highest number was recorded in 2023 with a peak of nine publications.
3. Conducting the Survey
This section provides a detailed explanation of the most studied NTs, their estimation using electrochemical techniques and AI-based approaches, the challenges associated with their accurate estimation and the strategies implemented to address these challenges.
3.1. Neurotransmitters (NTs)
The most extensively studied NTs due to their crucial roles in neurology and medicine include Dopamine (DA), Serotonin (SE), Epinephrine (EP), Norepinephrine (NEP), GABA, Glutamate (GL) and Acetylcholine (ACH). They function as intermediaries in chemical synaptic transmission, facilitating communication within the central nervous system (CNS), between the CNS and the peripheral nervous system and between neurons and other cell types [1,2,3,4,12,18,19,21,22,23,25]. They are released in temporally varying concentrations from presynaptic neurons and travel to postsynaptic receptors on other neurons or cell types, where they mediate neuro-signal conversion, amplification, and transmission [18,19,21,22,23,25].
The specific types and concentrations of NTs produced in the brain influence their regulatory functions, making them important biomarkers for various neurological disorders. For example, DA levels are associated with Parkinson’s disease [79,80,81,82,83,84,85,86,87,88,89,90] and depression [89,90], GL is linked to schizophrenia [24,51], and ACH is related to Alzheimer’s disease [62]. Changes in NT concentrations can affect a range of human cognitive functions, including emotions, thoughts, memories, learning, and movement [14,15,62].To be classified as NTs, these chemicals must meet specific criteria: (1) they must be produced and released by the same neuron and stored at the presynaptic terminal, (2) they should induce specific responses in the postsynaptic neuron, (3) their external administration should replicate these effects; and (4) their action on the postsynaptic cell should be reversible by a specific mechanism [93]. The researched NTs whose patterns have been recognized using various ML, PR and DL algorithms are discussed and summarized in Table 4, their skeletal structures presented on Figure 4 and the frequency of their analysis depicted on Figure 5.
3.1.1. Dopamine (DA)
DA, scientifically known as 4-(2-aminoethyl)-1,2-benzenediol, is a crucial monoamine NT extensively studied in neuroscience [79,80,81,82,83,84,85,86,87,88,89,90]. It acts as an excitatory neuromodulator, produced by dopaminergic neurons in key brain regions such as the substantia nigra, ventral tegmental area, and hypothalamus [81,82,83,84,85]. DA plays a significant role in various physiological functions within the central nervous system (CNS), directly or indirectly influencing pleasure, satisfaction, and motivation. It is essential for muscle coordination and movement control. The balance between DA and ACH is critical for maintaining clinical health [93]. Disruptions in DA levels can lead to several neurological disorders, including Parkinson’s disease, Huntington’s disease, drug addiction, and schizophrenia. Parkinson's disease is often managed with treatments involving dopamine precursors such as Levodopa (LD) and Carbidopa (CD), which mimic dopamine’s effects in the brain.
3.1.2. Serotonin (SE)
SE, scientifically known as 5-hydroxytryptamine, is a key monoamine and excitatory neuromodulator. Approximately 95% of SE production occurs in the enterochromaffin cells of the gut, where the amino acid tryptophan, derived from food, is converted into SE with the assistance of the enzyme tryptophan hydroxylase [94,95,96]. In the brain, SE is synthesized by neurons in the rostral and caudal groups of the raphe nuclei. As an electrochemically active NT, SE inhibits the release of DA and GL and modulates the transmission of GL and GABA [97]. It plays a crucial role in regulating mood, sleep, and appetite. Imbalances in SE levels are linked to mood disorders such as depression and anxiety.
3.1.3. Glutamate (GL)
GL, scientifically known as (2S)-2-Aminopentanedioic acid, is an alpha-amino acid derived from glutamine and is predominantly found in the central nervous system (CNS). As the most abundant NT, it plays a crucial excitatory role in neural signaling. Its primary functions include amplifying neural signals within the CNS, facilitating long-term potentiation, supporting cognitive processes, and influencing motor, sensory, and autonomic activities [98]. GL operates through a complex mechanism. It is released into the synaptic cleft by presynaptic neurons and then activates two key receptors: alpha-amino-3-hydroxy-5-methyl-4-isoxazolepropionic acid and N-methyl-D-aspartate. These receptors mediate the influx of sodium and calcium ions into postsynaptic neurons. However, an imbalance or excess of GL can lead to excessive calcium influx, resulting in heightened neuronal firing and excitotoxicity. This imbalance may be linked to various neurological disorders, including multiple sclerosis, amyotrophic lateral sclerosis and Parkinson’s disease [99]. Astrocytes play a critical role in maintaining glutamate homeostasis by regulating its levels in the CNS.
3.1.4. Acetylcholine (ACH)
ACH, scientifically known as 2-Acetoxy-N, N, N-trimethylethanaminium, is an NT derived from acetic acid and choline, and is crucial for various bodily functions. In the peripheral nervous system, it facilitates muscle contraction and supports autonomic nervous system functions. Within the central nervous system, acetylcholine is vital for cognitive processes such as memory and learning, and it also influences attention, arousal, and the sleep-wake cycle. Disruptions in ACH levels due to dysfunctions in cholinergic pathways are linked to conditions like Alzheimer's disease and hallucinations [62].
3.1.5. Epinephrine (EP) and Norepinephrine (NEP)
EP (adrenaline), scientifically known as 4-[(1R)-1-hydroxy-2-(methylamino) ethylbenzene-1,2-diol and NEP (noradrenaline) scientifically known as (R)-4-(2-Amino-1-hydroxyethyl) benzene-1,2-dio, are two key monoamines that function both as NTs and hormones. NEP serves as an electrochemically active neuromodulator and plays a crucial role in the autonomic nervous system's "fight or flight" response, impacting both the sympathetic and parasympathetic systems [93]. Neurons producing NEP are primarily located in the locus coeruleus and project to various brain regions, including the limbic system. Functionally, NEP is involved in regulating arousal, alertness, sensory signal detection, emotions, memory, learning, and attention [100]. In contrast, EP neurons are found in different brain regions, such as the lateral tegmental system and medulla, and its role as a neurotransmitter is less well understood. However, epinephrine is known to influence the "fight or flight" response by increasing heart rate, promoting vasodilation, dilating pupils, and elevating blood sugar levels [93].
3.1.6. Gamma-Aminobutyric Acid (GABA)
GABA, scientifically known as 4-Aminobutanoic acid is an amino acid NT produced at neural junctions through the conversion of GL to GABA, facilitated by the enzyme glutamate decarboxylase [97,111]. As an electrochemically active NT, GABA primarily functions as the brain's main inhibitory NT. However, in its early developmental stages, GABA can act excitatory due to its role inducing depolarization rather than hyperpolarization. This occurs because of the high chloride concentration in neurons during early development, which causes chloride to exit the cells rather than enter. In mature adults, the chloride concentration changes, leading to an inward flux of chloride and transforming GABA’s role from excitatory to inhibitory [93]. GABA's primary role is to reduce neural excitability and maintain a balance between inhibitory and excitatory signals in the brain. Proper GABA levels are crucial for normal brain function and help prevent central nervous system issues such as behavioral disorders, sleep disturbances, epilepsy, and pain.
Figure 4.
Skeletal structures of the most extensively studied NTs and levodopa included in this review.
Figure 4.
Skeletal structures of the most extensively studied NTs and levodopa included in this review.
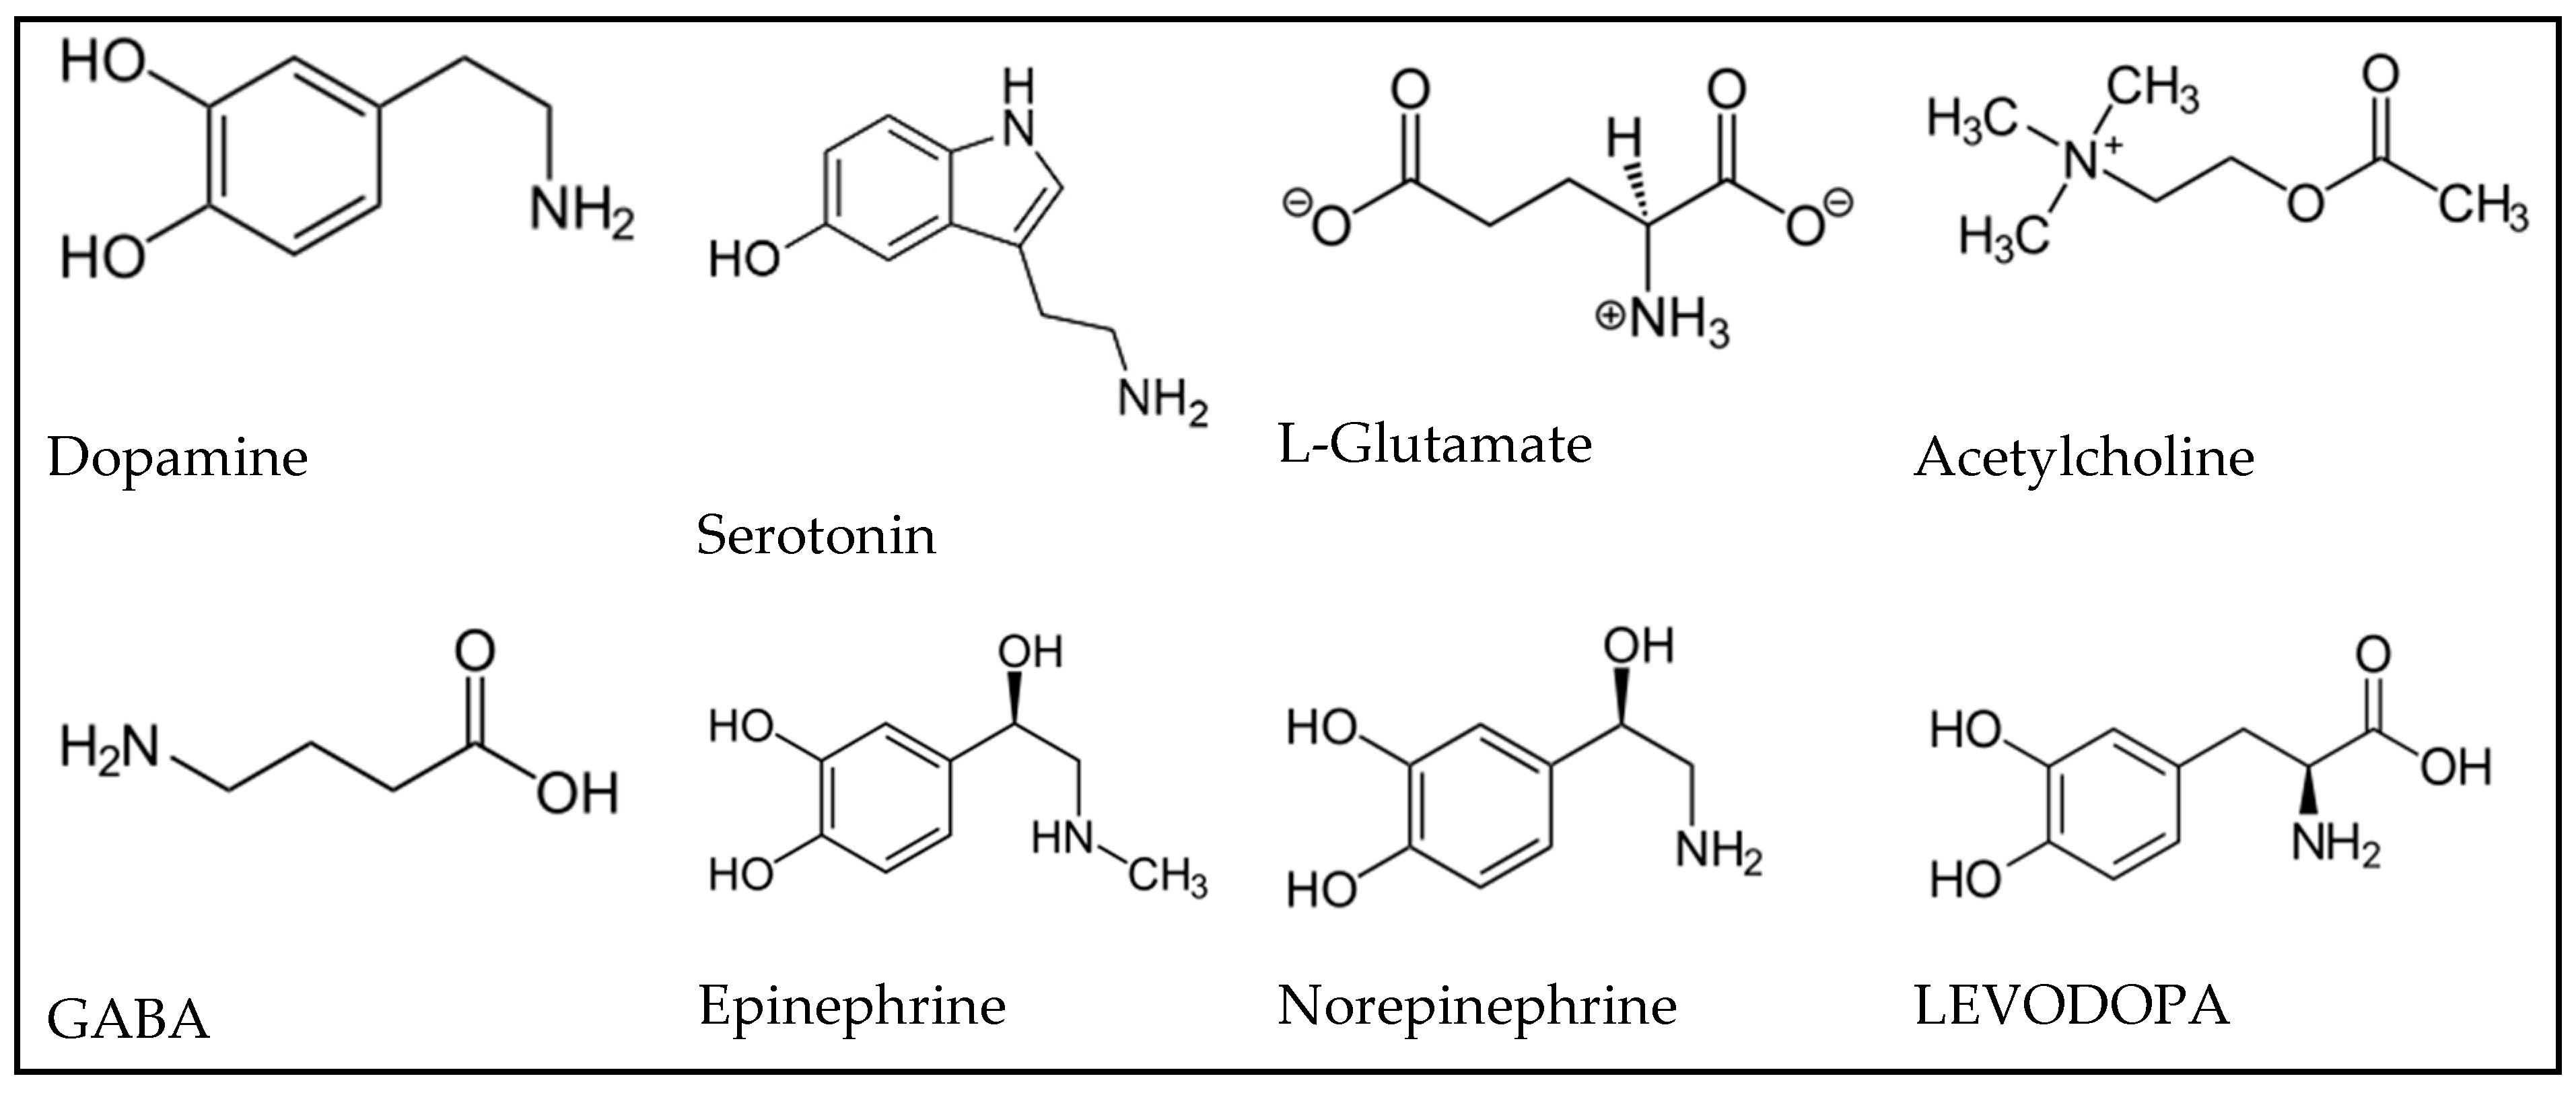
Table 4.
Summary of NTs studied for papers related to AI.
| Category | Neurotransmitter | Chemical formula | localization | Role | Pathology | Reference |
|---|---|---|---|---|---|---|
| Indoleamine | Serotonin (SE) | C₁₀H₁₂N₂O | midbrain, hypothalamus, limbic system, cerebellum, pineal gland, spinal cord. |
excitatory to other NTs, sleep, appetite, memory, cardiovascular regulation, temperature, walking | nausea, headaches, regulation of mood, schizophrenia, anxiety and depression |
[1,3,40], [41,42,43,44,45], [46,52,53,54,55,56,57,58] |
| Catecholamines | Dopamine (DA) | C₈H₁₁NO₂ | Hypothalamus, substantia nigra | excitatory to other NTs, pleasure, satisfaction, motivation, the regulation of emotional, social stress, learning, reward, addictive behavior, motion control |
Parkinson’s disease, Huntington’s disease, drug addiction and schizophrenia |
[1,2,3,24], [9,35,36,37,38], [40,41,42,43], [44,46,47,48], [49,50,51,52], [53,54,55,57], [58,59,60,61] |
| Epinephrine (EP) |
C₉H₁₃NO₃ | Tegmental and medulla | Fight-or-flight response | N/A | [3,34,35], [37], [42,46,52,58] |
|
| Norepinephrine (NE) | C₈H₁₁NO₃ | Locus coeruleus of the midbrain, brain stem, limbic system, cerebral cortex, thalamus. |
Good feeling | depression | [2,3,34,35], [37,40,42,46,52,53,55,58] |
|
| Amino Acids | Glutamate (GL) | C₅H₉NO₄ | central nervous system (Brain and Spinal cord) | excitatory to other NTs, learning, memory, vision, |
epilepsy, schizophrenia, excitotoxicity, multiple sclerosis, amyotrophic lateral sclerosis, and Parkinson’s disease |
[21,46,58,62] |
| GABA | C₄H₉NO₂ | Hypothalamus, spinal cord, cerebellum, retina | excitatory/ inhibitory to other NTs | epilepsy, convulsions, sleep disorders and pain. | [46,58] |
|
| Choline | Acetylcholine (ACH) | C₇H₁₆NO₂⁺ | Basal nuclei and cortex, neuromuscular junctions, brain |
excitatory to other NTs, memory, learning | Alzheimer's disease, hallucination, tetanic muscle spasms |
[46,58] |
| Precursors | LEVODOPA | C₉H₁₁NO₄ | Oral drugs found in blood | Treatment of Parkinson’s disease | N/A | [2,3,33,41,45,46,58] |
Figure 5.
Frequency of NTs analyzed for papers related to AI.
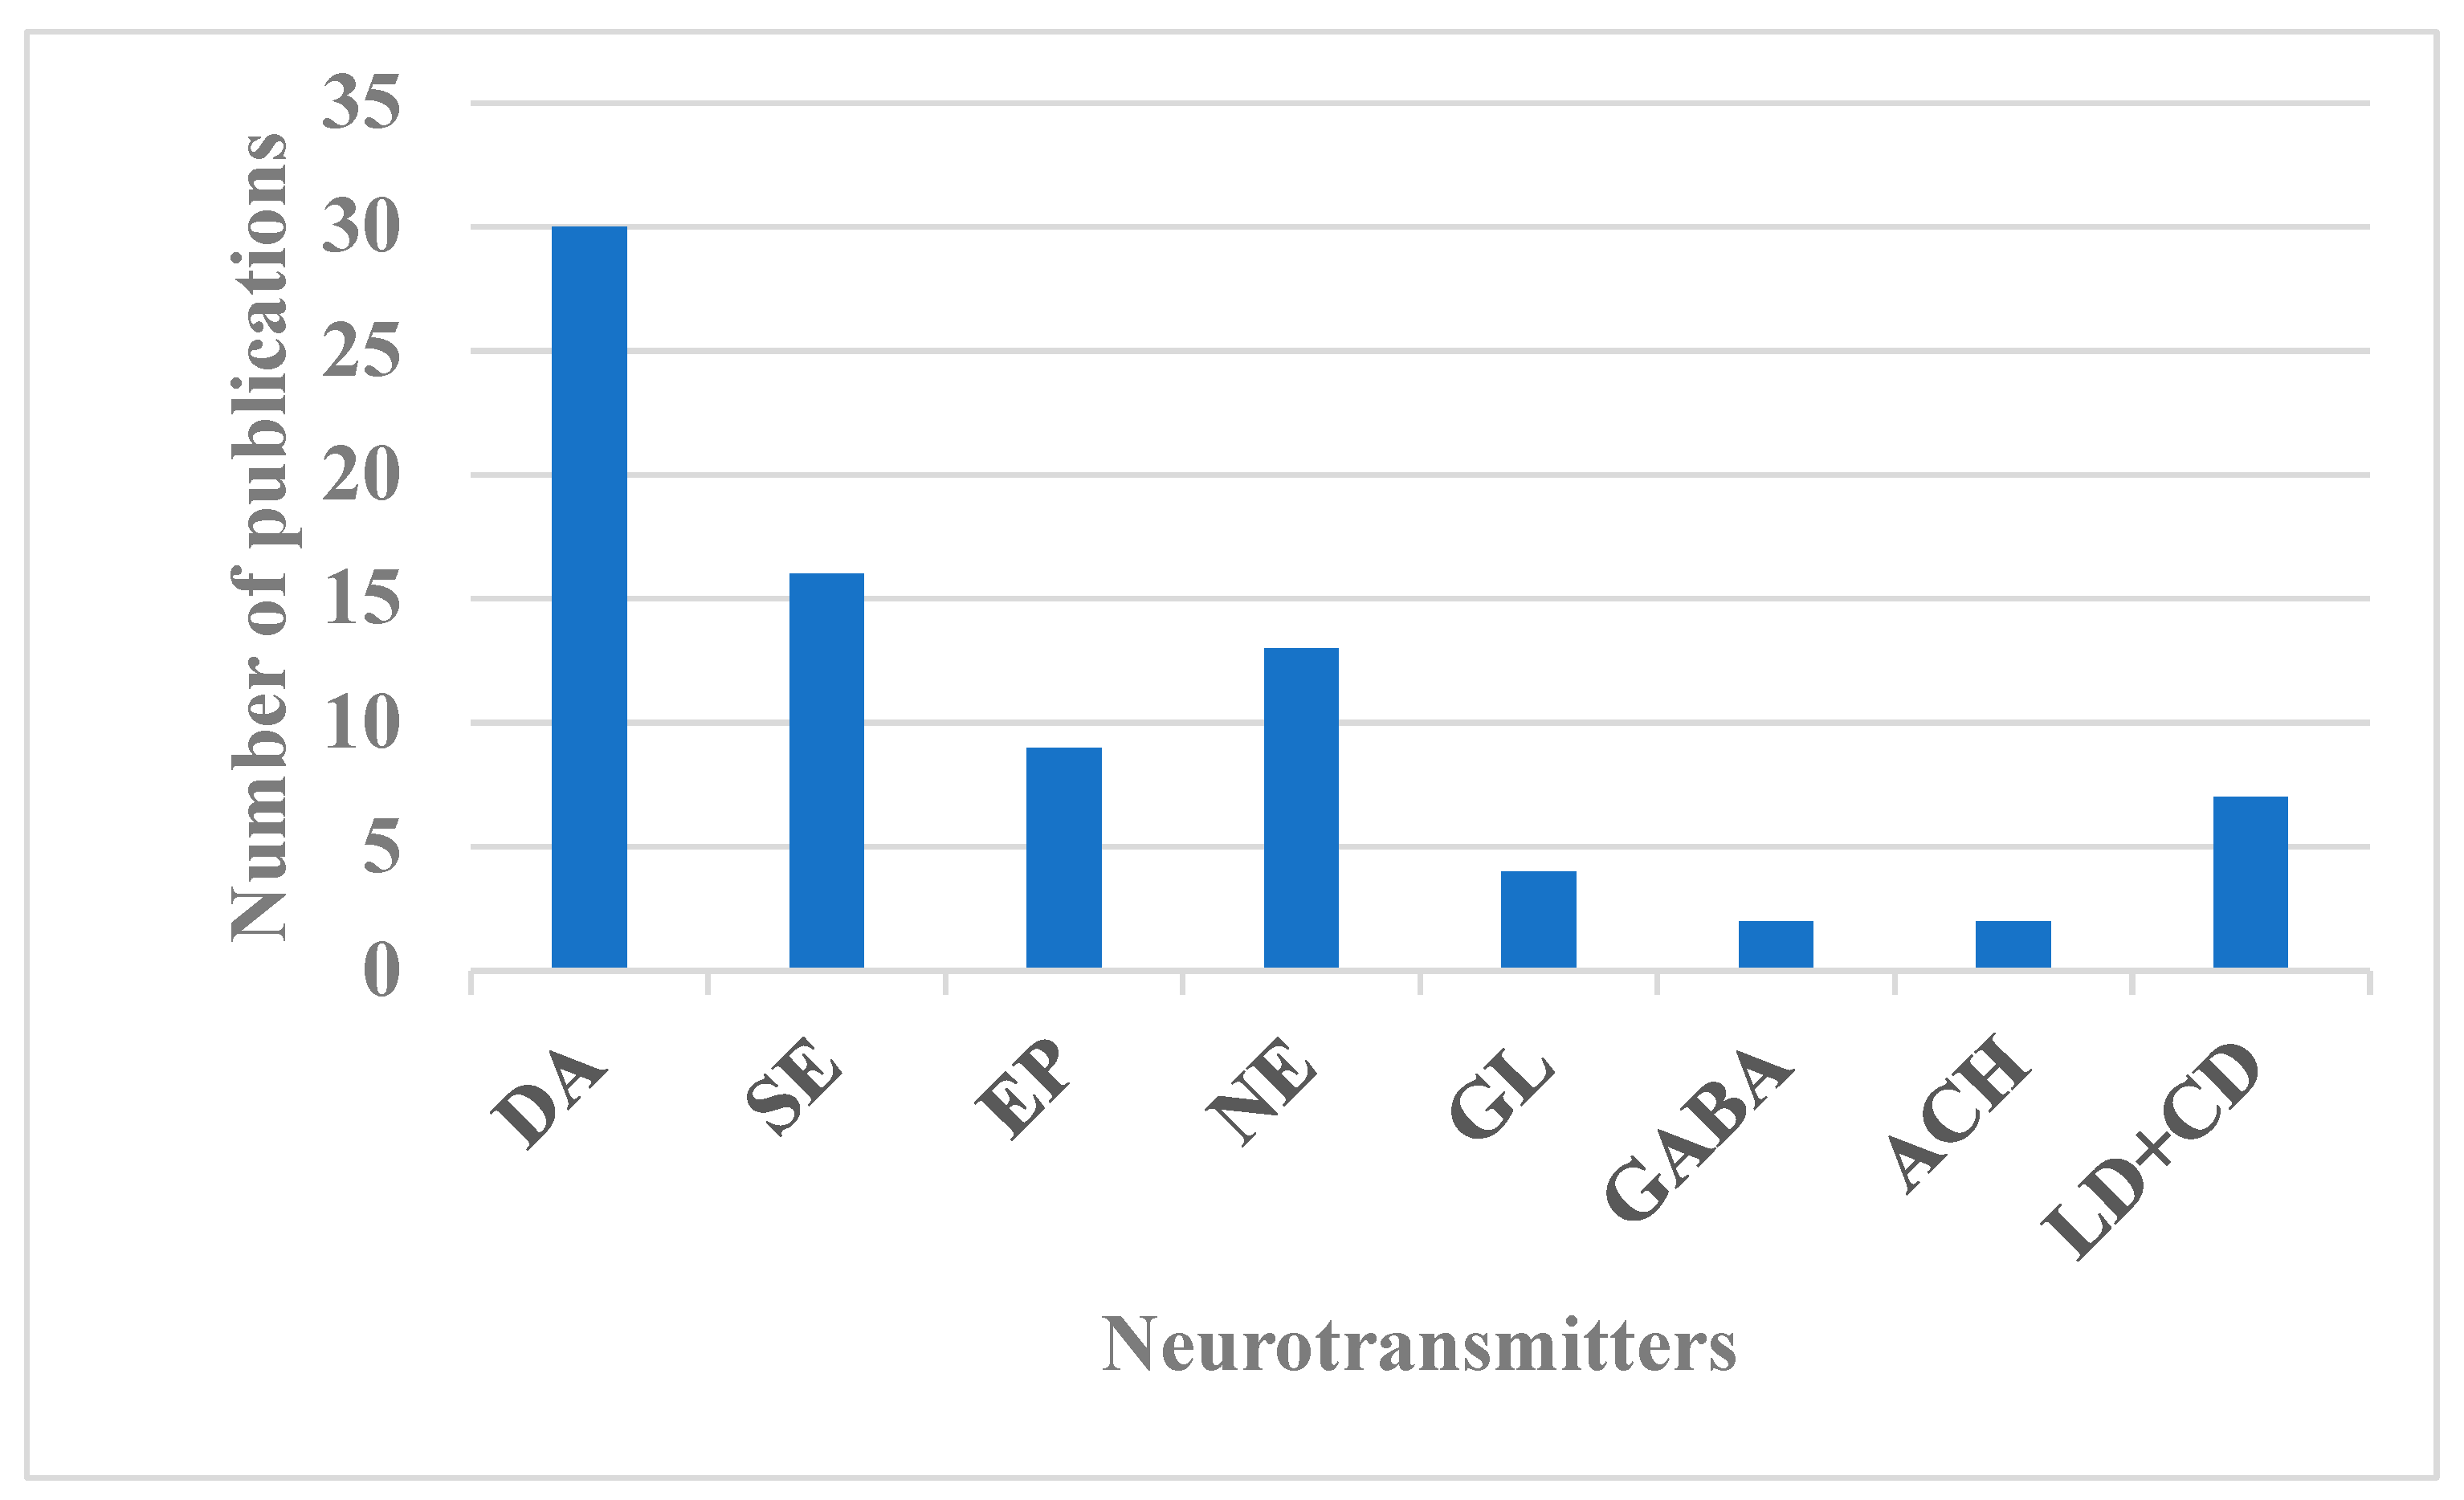
Table 4 provides an overview of the categories, locations, roles, and associated pathologies of the NTs examined in the studies selected for this systematic review. Figure 5 illustrates the frequency of research conducted on these NTs. Most of the publications investigated more than one NT. DA stands out as the most extensively researched NT, with 30 publications, followed by SE with 15, NE with 13, EP with 9, LD+CD with 7, GL with 4, GABA with 2, and ACH with 2 publications, respectively. DA's prominence in research is attributed to its critical roles in the central nervous system and its status as a key biomarker for neurodegenerative disorders such as Parkinson’s disease, Huntington’s disease, depression and schizophrenia [79,80,81,82,83,84,85,86,87,88,89,90]. However, the isolation of pure DA signals in-vivo is challenging due to the multiplexing of its electrochemical signatures with those of other NTs and biomolecules within complex biological fluids.
3.2. Origin of Multiplexed Neurotransmitter Signals and Motivation of the Need for AI
NTs coexist at equilibrium concentrations with other neurochemicals in biological fluids. Some of these NTs have similar chemical structures, while others have comparable sizes to other neurochemicals that are not NTs or exhibit similar chemical properties to metal ions [1,2,3]. These similarities lead to complex interactions among NTs, neurochemicals, and metal ions, causing biosensors to record multiplexed signals that do not correspond to the pure signals of any single NT as demonstrated on Figure 6 for DA and ascorbic acid (AA). Ascorbic acid is a neurochemical that is assimilated as an NT due to its structural similarities, roles in the central nervous system, and its potential to interfere with sensor response-patterns from NTs [2,3].Sazonova et al. [1] explored how similar chemical structures of NTs affect biosensor performance, focusing on NT detection and concentration prediction using voltammetry and pattern recognition. Their study revealed that the patterns of DA and SE interfere with each other. They proposed AI models to differentiate these patterns in in-vitro mixtures. Jose et al. [9] examined the impact of NT sizes like other neurochemicals, in addition to the effects of similar chemical structures. Their research aimed to enhance electrochemical biosensors with AI to improve DA detection in the presence of interfering substances like uric acid (UA) and ascorbic acid (AA). Kallabis et al. [36] investigated the influence of NTs with chemical properties like metal ions, focusing on quantifying DA amidst magnesium ions, with the aid of machine learning tools. Salimian et al. [33] analyzed DA precursors using net analyte signal and principal component regression to quickly determine levodopa and carbidopa in pharmaceutical formulations and breast milk samples through a spectrophotometric method. Dowek et al. [34] studied the interaction between EP and NEP, using surface-enhanced Raman spectroscopy with gold nanoparticle suspensions for discriminative and quantitative analysis. EP and NEP also function as hormones in the body. Several biosensors with modified functional surfaces have been proposed to deconvolve multiplexed neurotransmitter (NT) signals, aiming to extract the true signals of interest from complex biological fluid.
3.3. Electrochemical Biosensors
Biosensors are electrochemical transducers capable of converting physiological parameters like NT concentrations into measurable signals, typically electrical or optical in nature. Challenges such as low selectivity, sensitivity, detection speed, crosstalk, and sensor "fouling" frequently hinder their performance during biorecognition of NTs [1,2,3,33,34,35,36,37,38]. To address the issues of low selectivity and sensitivity of biosensors, specific biocatalysts and nanoparticles are employed respectively as discussed below.
3.3.1. Enhancement of Biosensors’ Selectivity
Specific biocatalysts are used to enhance biosensors’ selectivity and minimize fouling by enabling targeted oxidation of NTs. This process lowers the oxidation potentials of the NTs and converts them into detectable forms. For example, in a mixture of various NTs, the enzyme glutamate-oxidase (GmOx) selectively targets and oxidizes the electrochemically inert GL. This process is summarized by equations 1 and 2.
Glutamate + O₂ + (GmOx) ⟶ α-Ketoglutarate + NH₃ + H₂O₂
H₂O₂ → O₂ + 2H⁺ + 2e⁻
Glutamate biosensors use glutamate oxidase (GmOx), to catalyze the oxidation of electrically inert glutamate NT and the reduction of oxygen to hydrogen peroxide (H₂O₂). GL is not easily detected but the H₂O₂ is easily detected at lower potential as it is converted to 2H⁺.
Biocatalysts commonly used are:
- Enzymes: Enzymes serve as biorecognition elements. They are NT-specific and catalyze a reaction with the target analyte. The resulting product is directly detected by the sensors at lower potentials, which enhances the selectivity for neurotransmitter detection.
- Antibodies or Antigens. They also serve as bio-recognition elements on immunobiosensors. They bind specifically to the target analyte, and the resulting complex byproduct is detected.
- DNA: DNA strands are used to detect complementary DNA sequences or specific genetic material when used on DNA biosensors.
- Microbes: Microbes are functionalized on microbial biosensors where the whole cells or parts of cells are used to detect analytes. These biosensors can be employed for environmental monitoring.
- Light: Optical biosensors use light-based techniques for detection, such as fluorescence, luminescence, or surface plasmon resonance for specific NT detection. Light of different frequencies are used for the selective NT detection.
- Pressure: Piezoelectric Biosensors measure changes in mass on the sensor surface, typically using a quartz crystal microbalance during NT detection. Here, pressure is used as the discriminative parameter for the selective detection of the NTs in a complex mixture.
Njagi et al. [10] investigated amperometric detection of DA in-vivo using an enzyme-based carbon fiber microbiosensor. They developed a novel implantable biosensor with carbon fiber material approximately 100 micromolar in diameter. The biosensor’s functional surface was engineered to be coated with tyrosinase biocatalysts and ceria-based metal oxides to detect DA in-vivo. Chitosan was employed as the biopolymer to immobilize both the tyrosinase and the ceria-based metal oxides on the biosensor’s functional surface.
3.3.2. Enhancement of Biosensors’ Sensitivity
Biosensors’ sensitivities are enhanced using nanoparticles, which facilitate the oxidation of NTs and enhance the activity of biocatalysts. These processes accelerate reactions at the biosensor’s functional surface. Biocatalysts and nanoparticles are immobilized on the electrode's functional surfaces using biopolymers such as chitosan, known for its biocompatibility [26,27,28,29,30,31]. Most nanoparticles used are metals or metal oxides, valued for their unique chemical, catalytic, electrical, and optical properties, making them ideal for functionalizing biosensor surfaces [23]. Notable nanoparticles with small effective sizes include cerium (IV) oxide, gold, Fe₃O₄, ZnO, silver, SnO₂, CuO/Mn₂O₃/silver nanoparticles, and platinum-doped cerium (IV) oxide [4,25,34,39,102,103]. The miniaturization of biosensors and nanoparticles enhances sensor sensitivity by extending their detection limits to nanomolar (nM) ranges [32]. This advancement improves the spatial resolution of implantable biosensors by increasing the surface-area-to-volume ratio, reduces the adsorption of NTs on sensor functional surfaces (a process known as passivation), and minimizes the diffusional delay of NTs at the sensors’ surfaces [23]. Additionally, it boosts the electron transfer capability at the surfaces of the biosensors. Enhancing biosensors' selectivity and sensitivity has greatly improved their performance, but this advancement presents several challenges.
3.3.3. Challenges Faced by Enhancing Biosensors’ Performance
Enhancing biosensors’ performance by using NT-specific enzymes, nanoparticles and chitosan on sensor surfaces presents several challenges. These include: 1) the tendency for sensors to become unstable and degrade over time [23]; 2) the need for efficient enzyme functionalization on the biosensor surface to ensure high selectivity; 3) the requirement for large immobilization matrices, which are unsuitable for delicate applications like in the brain; and 4) the risk of enzyme conformational changes, which can reduce shelf-life, stability, and catalytic activity [22,23]. Addressing these issues is a key concern for researchers. To overcome these challenges, some are exploring noninvasive techniques for NT detection, such as the use of light for in-vivo NT monitoring [46]. Nevertheless, improving the performance of biosensors enhances their transduction properties, enabling the generation of distinct and measurable electrical signals that can be effectively processed to estimate NT in-vivo.
3.4. Transduced Signal Output from Biosensors and Voltammetric Measurement Techniques
In the biorecognition of NTs, biosensors convert NT concentration into measurable signals. These signals, which reflect the NT patterns, include variations in current, potential, resistance (or combinations of these), as well as light, color, and pressure. The signals are derived from electrochemical techniques and correspond to Amperometry, Voltammetry, Impedimetry, Potentiometry, Photometry, Colorimetry, and Piezometry respectively. Electrochemical techniques are preferred because most NTs are either electrochemically active or can be converted into electrochemically active forms by biocatalysts, making them easily detectable. Among the electrochemical methods, voltammetry is the most prevalent due to its speed and capability to provide qualitative, quantitative, and real-time measurements of NTs [104]. The primary voltammetric techniques include Cyclic Voltammetry (CV), Fast Scan Cyclic Voltammetry (FSCV), Differential Pulse Voltammetry (DPV), and Square Wave Voltammetry (SWV). The choice of technique depends on parameters such as response time, waveform, and detection limit. DPV is the slowest, with response times in seconds, whereas CV, FSCV, and SWV have response times in the sub second range. The waveforms produced by DPV, FSCV, and SWV are staircase, triangular/sawtooth, and square respectively. For in-vitro detection of dopamine, SWV provides the lowest detection limit, with a value of 0.17 nanomolar [4,104]. Table 5 summarizes the voltammetric techniques used in the reviewed research papers, and Figure 7 displays the frequency of their use over time. FSCV is noted as the most frequently used technique, appearing in 9 publications, while Amperometry (AM), Photometry (PH), Raman Spectroscopy (RS), and Magnetic Resonance Spectroscopy (MRS) are nondestructive techniques used for NT estimation. Each appears in only one publication. This trend is largely attributed to FSCV’s ability to generate 2-D or image data suitable for convolutional neural networks and deep learning analysis.
3.5. Artificial Intelligence (AI)
AI is a broad field of science that integrates various computer science disciplines, including cognitive computing, natural language processing, computer vision, machine learning, neural networks, deep learning, and data analytics [72,73,105,106,107,108]. Figure 8 presents the proportions of the constitutive parts of AI with some examples. AI leverages advanced hardware, software, and data to replicate and simulate human intelligence, judgment, and cognitive abilities. This allows AI systems to efficiently handle complex tasks such as decision-making, perception, and reasoning without human intervention [73]. AI algorithms can be classified into four categories namely supervised learning, semi-supervised learning, unsupervised learning, and reinforcement learning [103,104,105,106]. AI encompasses subfields like machine learning, pattern recognition and deep learning.
3.5.1. Supervised Learning
Supervised Learning algorithms involve training AI models on a labeled dataset, where each input is paired with a correct output. The objective is to learn the relationship between inputs and outputs so the model can make accurate predictions on new, unseen data. Supervised learning tasks typically fall into two categories: classification, which involves predicting categorical labels (e.g., elephant, cows, camels), and regression, which focuses on predicting continuous values (e.g., estimating house prices)
3.5.2. Unsupervised Learning
Unsupervised learning algorithms identify patterns or structures in unlabeled datasets. Unlike supervised learning, where models learn from input-output pairs, unsupervised learning works with input data alone to uncover hidden relationships, groupings, or features. Common unsupervised techniques include clustering algorithms like K-means and hierarchical clustering, which group similar data points, and dimensionality reduction methods like Principal Component Analysis (PCA), which simplify data by reducing its features while retaining key information. These algorithms are widely used in applications such as customer segmentation, anomaly detection, and data visualization. In 32 of the reviewed papers, the target or response of the model was clearly defined, as these studies employed supervised learning algorithms. None of the papers used semi-supervised learning algorithms, while 3 utilized unsupervised learning algorithms as summarized in Table 6.
3.5.3. Semi Supervised Learning
Semi-Supervised Learning algorithms combine elements of both supervised and unsupervised learning. They utilize a small amount of labeled data alongside a larger portion of unlabeled data to enhance learning accuracy. This approach is particularly useful when large datasets are available but labeling them is costly or time-consuming. The algorithm first learns from the labeled data to identify patterns, then applies this knowledge to interpret the unlabeled data. Notable semi-supervised learning methods include self-training, co-training, and graph-based models. These techniques are widely used in real-world applications such as speech recognition, medical diagnosis, and image classification.
3.5.4. Reinforcement Learning
Reinforcement Learning algorithms are algorithms where an agent learns to make decisions by interacting with an environment. Instead of being explicitly taught, the agent learns through trial and error, receiving feedback in the form of rewards or penalties. The goal is to maximize cumulative reward over time by choosing the best actions based on its experiences. In these algorithms, the agent observes the state of the environment, takes an action, and receives a reward and a new state in response. Over time, it learns which actions lead to better outcomes. This approach is particularly useful in scenarios where it's difficult to define the correct answer for every situation in advance. Common applications of reinforcement learning include robotics, game playing, autonomous driving, and dynamic pricing systems. Table 6 summarizes the learning algorithms, Figure 9 illustrates them and Figure 10 connects these algorithms to different data types, highlighting their functions and sample applications. For this review, 3 ([3,35,37]) publications focused on unsupervised learning, while the remaining 30 concentrated on supervised learning techniques in estimating NTs.
Figure 9.
AI learning algorithms: a) Supervised learning algorithm, b) unsupervised learning algorithm, c) semi-supervised learning algorithm and d) reinforcement learning algorithm. Differences present in the learning algorithms are bolded in orange boxes.
Figure 9.
AI learning algorithms: a) Supervised learning algorithm, b) unsupervised learning algorithm, c) semi-supervised learning algorithm and d) reinforcement learning algorithm. Differences present in the learning algorithms are bolded in orange boxes.
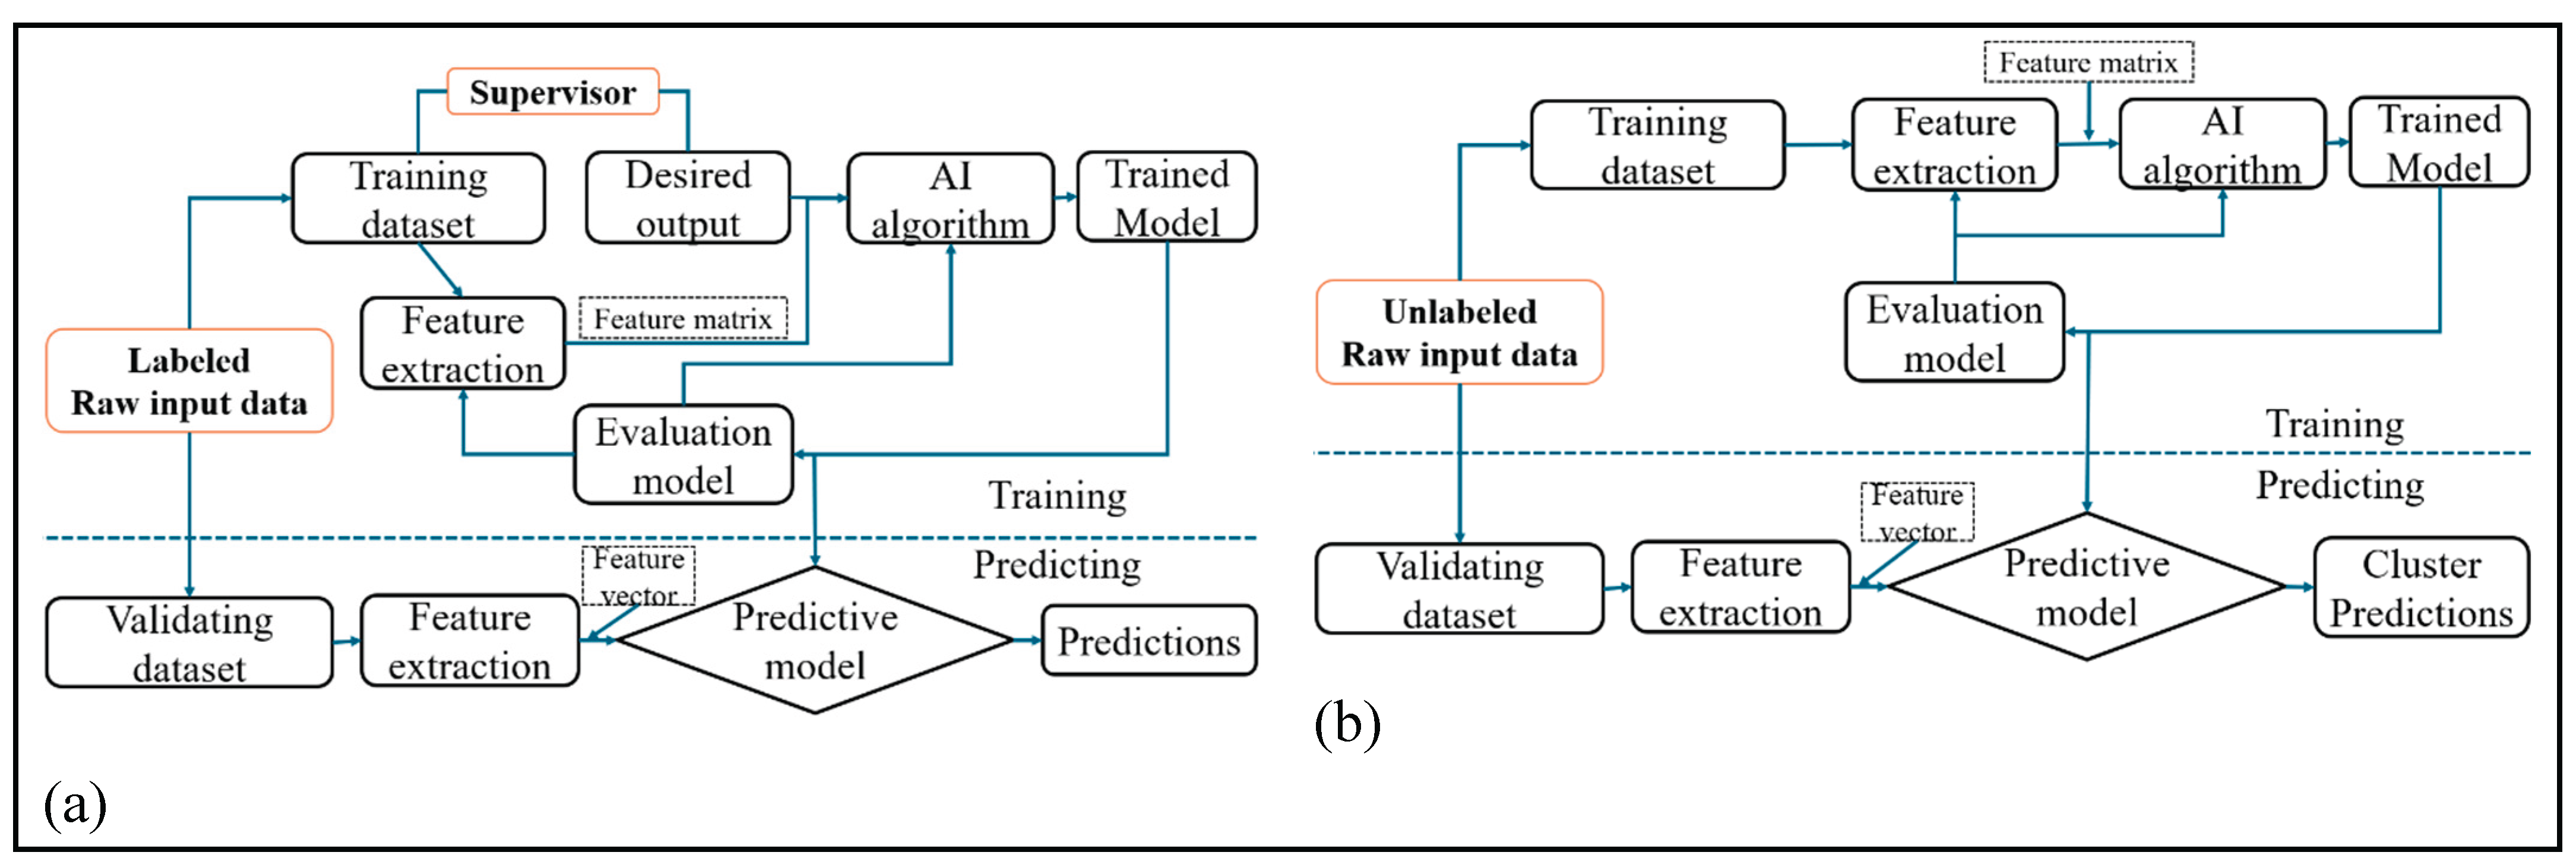
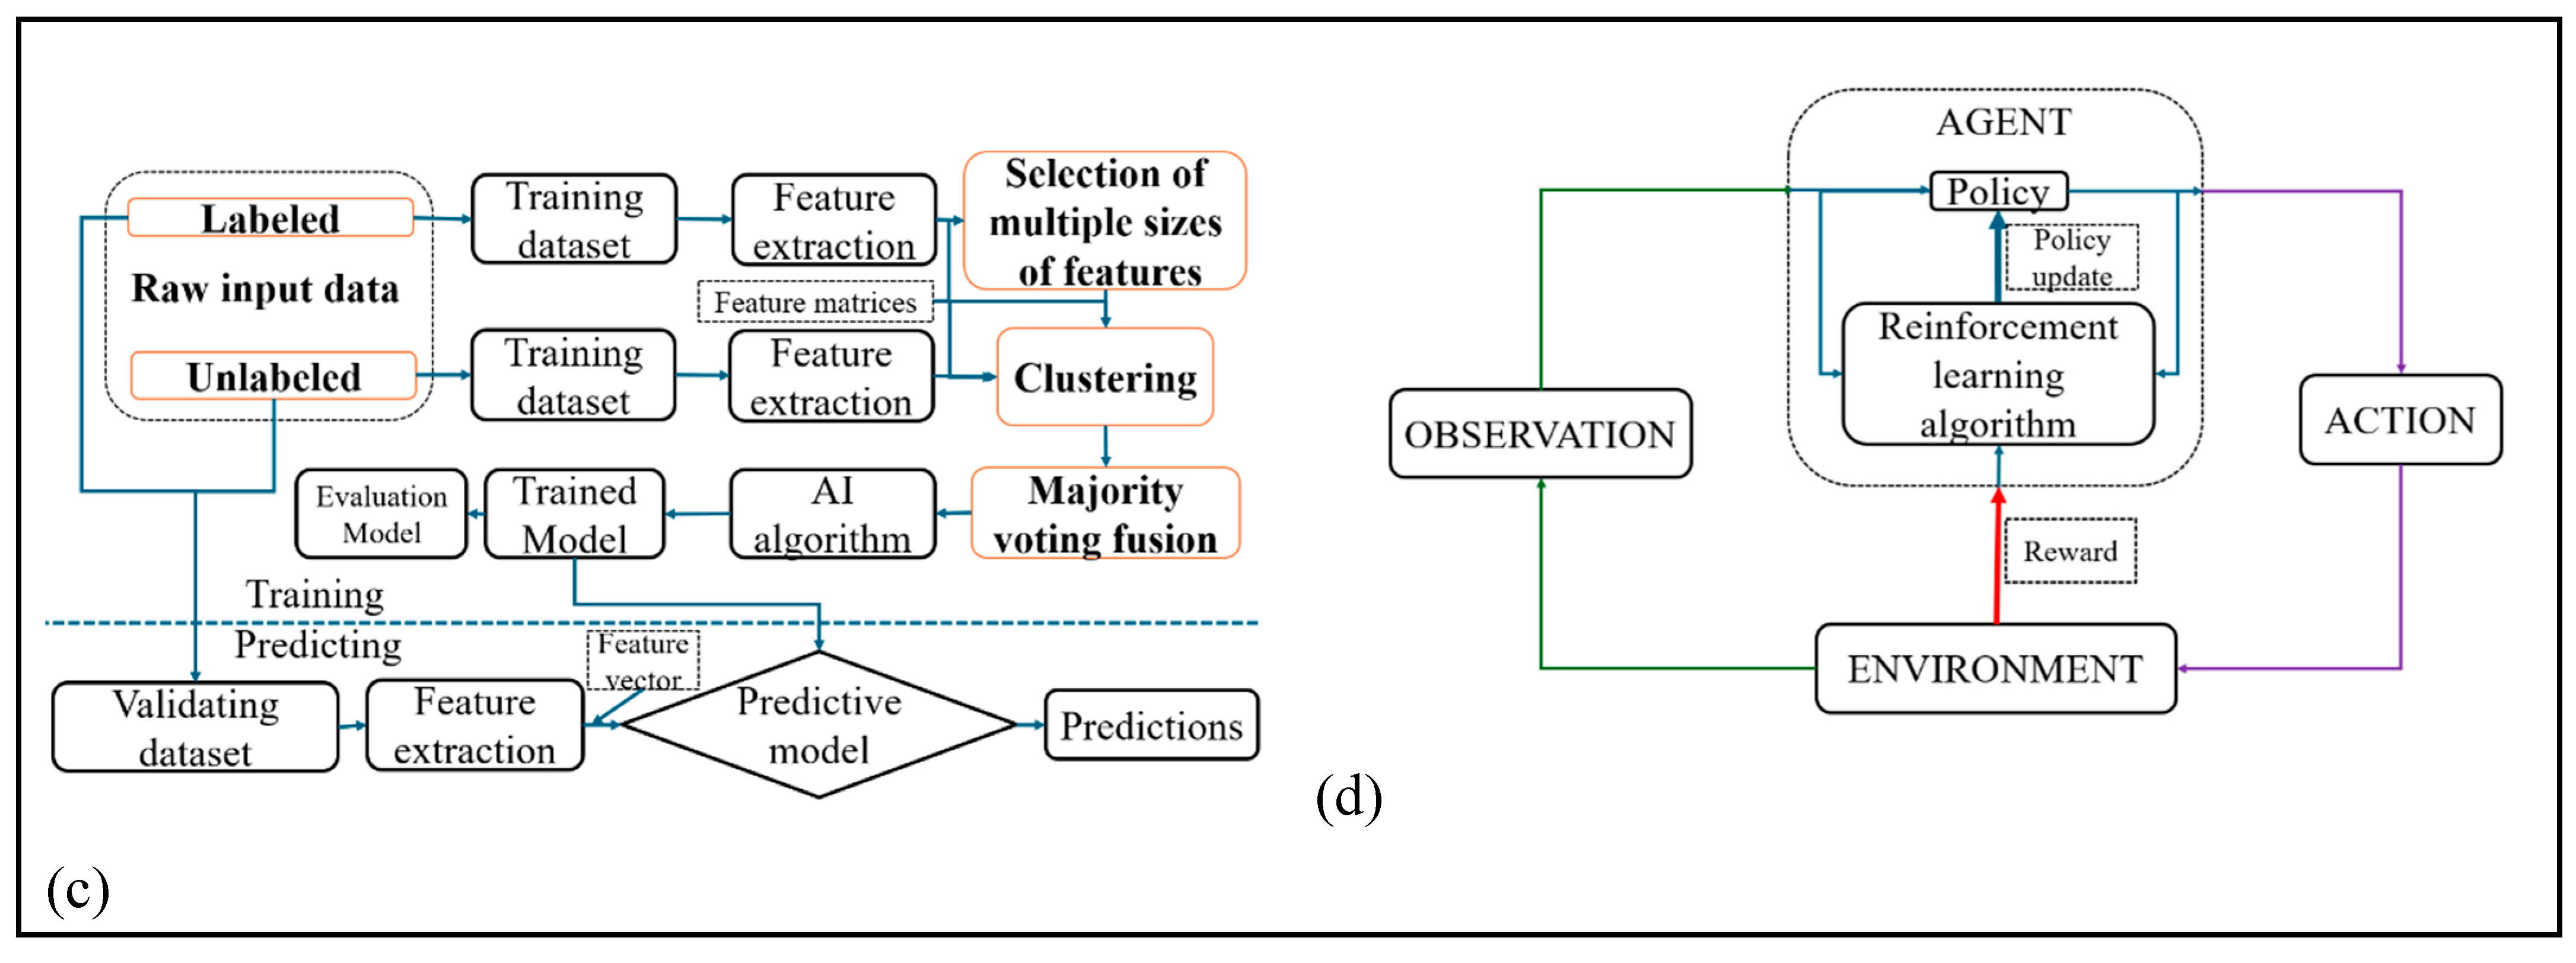
Table 6.
Summary of the different AI learning algorithms in papers related to AI.
| Learning type | definition | Type of dada | Goal | Example of tasks | Learning signal | Common algorithm | Human effort for labeling | Challenges | References |
|---|---|---|---|---|---|---|---|---|---|
| Supervised | Learning from fully labeled data | Labeled data | Predict outcomes (classification, regression) | Image classification, spam detection, price prediction | Direct supervision (ground-truth labels) | Linear regression, decision trees, SVM, neural nets | High | Requires large, labeled datasets | All 30 except [3,35,37] |
| Semi supervised | Learning from a small amount of labeled and unlabeled data | Mostly unlabeled data with some labeled examples | Improve learning using a few labeled data points | Text classification with limited labels | Weak supervision (partial labels) | Self-training, co-training, label propagation | Moderate | Making good use of limited labeled data | N/A |
| Unsupervised | Learning from completely unlabeled data | Unlabeled data | Discover hidden patterns or structure | Clustering, dimensionality reduction | No supervision (structure learning) | K-means, PCA, DBSCAN, autoencoders | None | Interpreting unsupervised results | [3,35,37] |
| Reinforcement | Learning through interaction with an environment | States, actions, rewards | Maximize cumulative reward over time | Game playing, robotics, recommendation systems | Reward signal (positive/negative feedback) | Q-learning, SARSA, Deep Q-Networks (DQN), policy gradients | None (but requires environmental simulation) | Balancing exploration vs. exploitation | N/A |
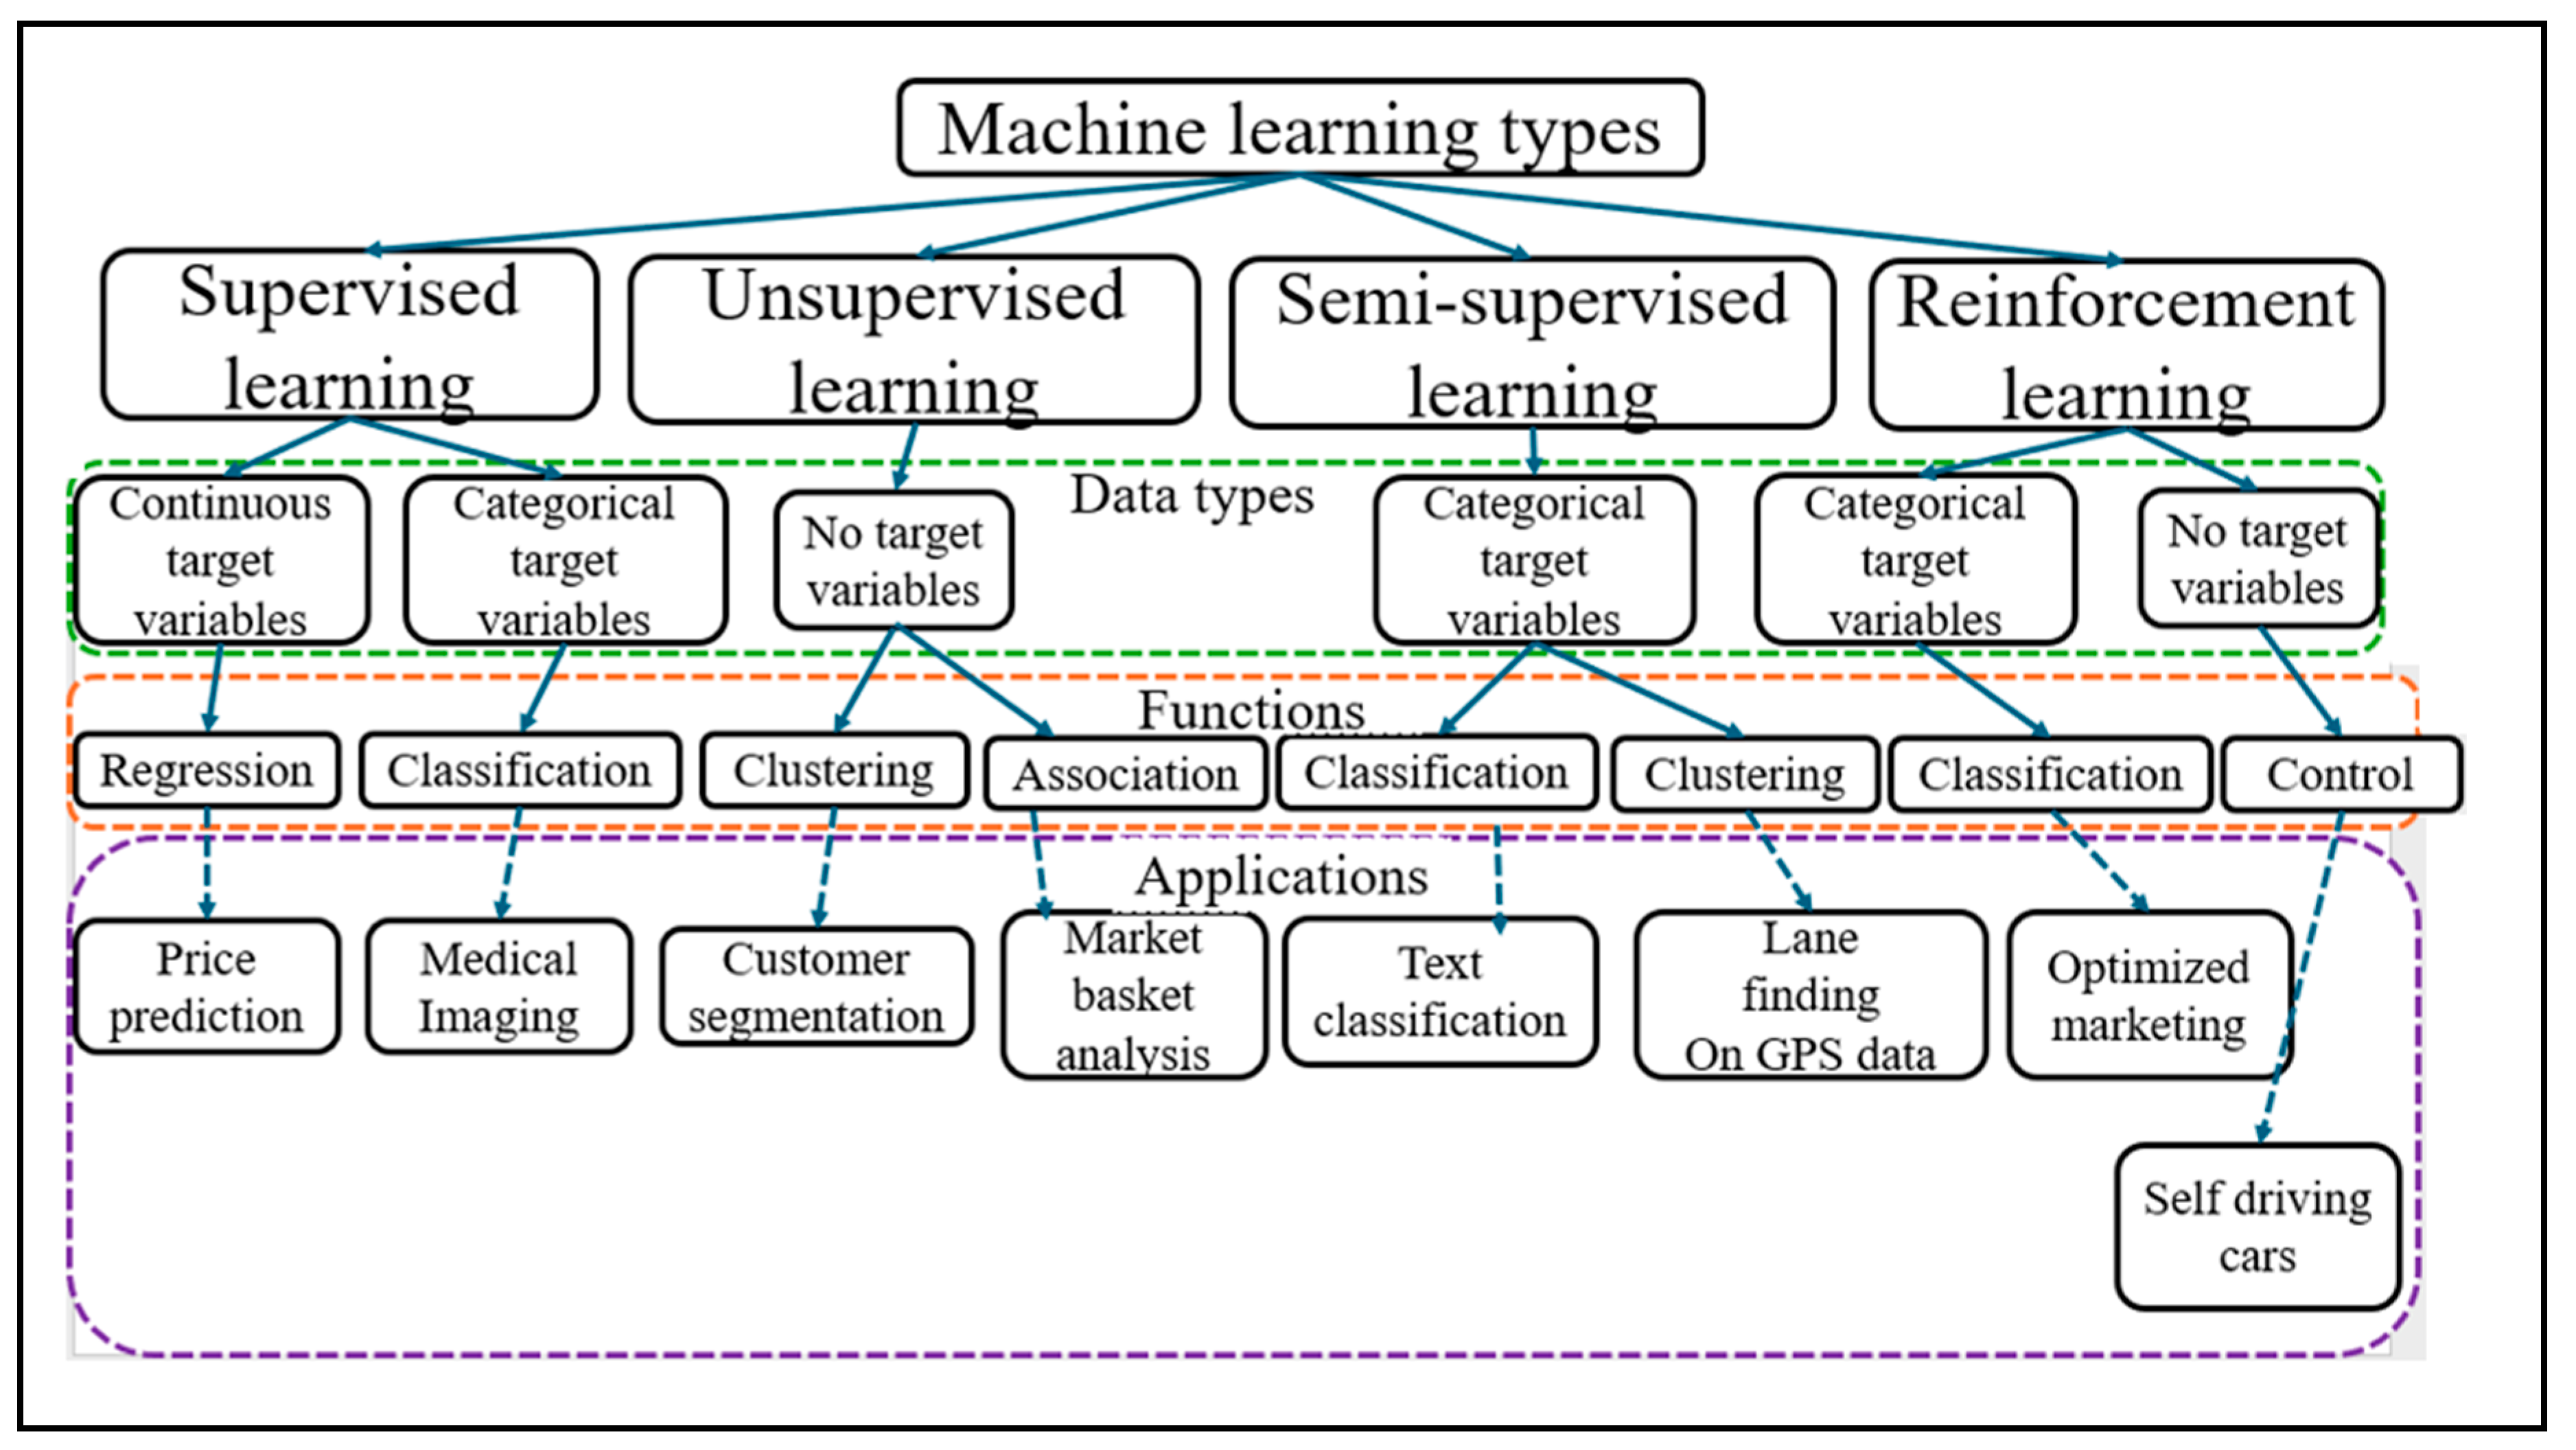
3.5.5. Machine Learning Algorithms
ML is termed Artificial Narrow Intelligence (ANI). It is a branch of AI dedicated to creating algorithms and statistical models that enable computer systems to learn from data and make decisions without explicit programming [115,116]. The primary aim of ML is to identify general patterns within a training data set to develop accurate decision rules for classification or regression tasks, and then apply these rules to new, unseen data. ML has enhanced automation in decision-making across various domains, including image processing and data mining [115,116,117,118,119,120]. Figure 8 presents the proportion of ML in AI and Figure 10 presents the types of ML, linking them to specific data types and illustrating their typical functions.
Figure 10.
Machine learning types linked to different data types and functions.
3.5.6. Pattern Recognition (PR)
PR is a specialized area within ML focused on identifying and learning feature patterns in data. Unlike broader ML, which automates the process of feature learning, PR techniques are specifically designed for discerning feature patterns. In practical applications, PR can effectively distinguish and identify specific NTs or groups of NTs and has proven accurate in detecting and predicting concentrations of NTs such as SE and DA [1].
AI algorithms are applied for NT estimation in biological fluids or chemical mixtures based on the objective of the study as follows:
- Detection: Identifying and categorizing different NTs.
- Quantification: Predicting the concentrations of known NTs.
- Simultaneous detection and quantification: Determining both the types and quantities of NTs. The word “estimation” is also used interchangeable with Simultaneous detection and quantification throughout this paper.
3.5.7. Deep Learning
DL, particularly through convolutional neural networks (CNNs), addresses the limitations of traditional ML in feature learning by combining feature extraction blocks and artificial neural networks (ANNs) to perform tasks typically requiring human intelligence. The feature extraction blocks include input, convolution, activation (e.g., ReLU, sigmoid, SoftMax), and pooling layers that introduce non-linearity and enable the automatic learning of low- to high-level data features without human intervention. These blocks also support dimensionality reduction and feature selection, improving model training efficiency and reducing overfitting. The ANN, forming the second part of the CNN, performs classification or regression using deep neural networks composed of multiple interconnected layers inspired by multilayer-perceptron (MLP) algorithms [45,47,53], and modeled after biological neurons in the brain as shown on Figure 11. These networks are trained via backpropagation and optimized using gradient descent, though they require large, labeled datasets, significant computational resources, and careful hyperparameter tuning to avoid overfitting. Figure 12 lays out the basic CNN architecture. To the best of our knowledge, the only research using DL and CNNs for pattern recognition in NT includes studies [43,45] and [45,47,53,76], respectively.
The use of AI to replicate and model human intelligence must adhere to stringent guidelines to ensure accurate analysis in critical areas such as medicine, biomedical science, and chemometrics [109]. For this systematic review, the chosen publications were required to follow these guidelines. These guidelines encompass:
- Clarity of Aim
The papers reviewed had clearly defined problems and objectives, which facilitated the comparison of different algorithms across various datasets. This approach allowed us to rank AI algorithms based on their error rates for each dataset. For this review, we specifically targeted papers that explored AI applications for the automatic detection and quantification of NTs. Out of the 33 papers reviewed, 11 (2,3,9,38,48,49,51,59,60,61,110]) concentrated on NT detection, while the remaining 22 addressed NT quantification or both detection and quantification (Table 3).
- b.
- The data
Electrochemical data considered in this review can be classified into two main types: time-dependent (time series) and potential-dependent. Time series data involve recording NT measurements over time, where time is the varying independent variable, while potential-dependent data involve recording NT measurements as the potential varies, with potential as the independent variable. In both cases, the current is typically the dependent variable. Time series data are commonly associated with in-vivo studies, while voltage-dependent data are often linked to in-vitro studies. Electrochemical data can also be categorized by their order: zero-order, first-order, or second order [76]. Zero-order data are point data or zero-dimensional (0-D) data, usually recorded using potentiometric techniques. These are single-value data, and simple linear regression is commonly used for their analysis due to its straightforward computational procedure. First-order data are one-dimensional (1-D) or one-dimensional vectors. These data represent the relationship between a dependent variable (such as current) and a varying independent variable (such as potential). Most electrochemical techniques, particularly in-vivo, generate this type of data during the biorecognition of NTs. For instance, voltammetric techniques, which measure current as a function of applied potential, generate 1-D data. Differential pulse voltammetry is a popular voltammetric technique for collecting 1-D data. Various machine learning algorithms and artificial neural networks can be applied to analyze 1-D data from the biorecognition of NTs. Second-order data are two-dimensional (2-D) or image data, obtained by varying two independent variables simultaneously. Fast-scan cyclic voltammetry is a commonly used voltammetric technique for in-vivo studies that produces pseudo-color plots of current as both potential and time vary during the biorecognition of NTs. Convolutional neural networks (CNN) are particularly effective for analyzing 2-D data, as they excel at extracting low-level features from these complex datasets. Due to the complexity of 1-D and 2-D data, which involve multiple dimensions, their analysis requires advanced computation. Dimensionality reduction techniques such as linear discriminant analysis (LDA), principal component analysis (PCA), and partial least squares (PLS) are often employed to reduce dimensionality to 0-D, simplifying the processing. Figure 13 illustrates different dimensionalities of electrochemical data.
In the publications reviewed, the types, sources, and recording processes of data used for detecting and quantifying NTs were crucial considerations. Setting clear objectives guided the data collection and analysis for optimal decision-making. Out of the studies examined, 9 ([21,38,45,47,48,49,51,59,60]) utilized data from real-world scenarios (in-vivo), while the remaining 24 relied on synthetic data (in-vitro). Real-world data is generally preferred over synthetic data for better generalization of AI models across various scenarios [115]. Most studies involved statistical analysis to ensure that their conclusions were objective and not due to chance. Key data preparation steps included curation, cleaning, and visualization. Visualization methods varied, with common approaches being histograms of error distributions, whisker-and-box plots, and range plots. Preprocessing steps typically involved handling missing values, encoding categorical variables, scaling numerical features, and splitting data into training and testing sets. Additionally, the studies clearly stated the hypotheses they aimed to test and verified whether the data supported these hypotheses.
- c.
- Factors and Levels
Any parameter that influences the output of an AI model when altered is considered a factor. These factors include model hyperparameters, input features, and the training set, among others. The choice of these factors depends on the objectives of the experiments [76]. For example, factors can involve fixing an algorithm and optimizing its hyperparameters, comparing algorithms by "learning" one of them, or using multiple datasets.
Feature engineering is a crucial process in improving a model's predictive performance. This process involves creating new features, selecting relevant ones, or transforming existing features [116,117]. Key aspects of feature engineering include feature selection, feature computation, dimensionality reduction, normalization, and hierarchy construction. Prior to selecting and designing an AI model, significant attention was given to choosing uncorrelated features that could effectively differentiate between classes of NTs. Techniques such as PCA, PLS [1,21,34,41,42], and LDA [2,3,35,37,49] were commonly used for reducing the dimensionalities of uncorrelated features. Table 7 and Table 8 summarize the various feature selection techniques and dimensionality reduction methods used in the reviewed papers, respectively.
- d.
- The procedure and experimental design
At this stage, the selection of the appropriate machine learning algorithm(s) is based on factors such as the type of problem (e.g., classification, regression), the characteristics of the data, and the performance criteria. Consideration may also be given to hyperparameter tuning and factorial designs. However, for the papers reviewed, factorial designs were not employed as these studies had a clear understanding that the factors were independent and did not interact. This is because the number of experiment replications was determined by the dataset sizes [116]. Typically, replication sizes were kept small for large datasets, but this approach can sometimes make it challenging to compare distributions. For example, the assumption of Gaussian distribution may not hold true for parametric tests. Generally, a portion of the data was reserved as a test set, while the rest was used for training and validation. Validation was performed multiple times through resampling the training data and averaging the model results from all samples. Table 9 summarizes the model selection and hyperparameter tuning techniques reviewed.
- e.
- Performing the experiment
The chosen model(s) are trained on the training dataset using the selected algorithm(s), which involves learning the patterns and relationships present in the data. Instead of training a new model, pre-trained models can also be utilized. Before conducting a large factorial experiment with numerous factors and levels, it is advisable to perform a few preliminary trials to ensure that all expectations are met. The algorithms were investigated thoroughly and impartially, with minimal bias from the experimenters when multiple algorithms were employed. Typically, it is best practice to have testers separate from developers for each model.
- f.
- Performance metrics
After training, the model's performance is evaluated using a separate testing dataset or through cross-validation. Evaluation metrics vary depending on the specific problem but typically include accuracy, precision, recall, F1-score, misclassification error for the detection of NTs and mean squared error, root mean squared error, mean absolute error, R-squared values for quantification or simultaneous detection and quantification of NTs [72,76]. In cost-sensitive scenarios, both the output and system complexity are considered. Most of the studies reviewed primarily used accuracy as the quality metric for detection tasks, while mean squared error and mean absolute error were employed for quantification or simultaneous detection and quantification of NTs. The R-squared value was used to determine the best regression fits in quantification tasks. Table 10 and Table 11 below summarize the differences between different metrics used for classification and regression problems respectively.
Where,
- ➢
- TP = True Positives (correctly predicted positives). Here, the model said positive, and it's true.
- ➢
- TN = True Negatives (correctly predicted negatives). Here, the model said negative, and it's true.
- ➢
- FP = False Positives (incorrectly predicted positives). Here, the model said positive, but it's false.
- ➢
- FN = False Negatives (incorrectly predicted negatives). Here, the model said negative, but it's false.
Where,
- ➢
- yi= actual or true value
- ➢
- = predicted value
- ➢
- n = number of data points
Once a satisfactory model has been developed and evaluated, it can be deployed into a production environment where it will make predictions on new, unseen data. This deployment process may include creating APIs and integrating with other systems. After deployment, it is crucial to continuously monitor the model's performance and retrain it as necessary to adapt to evolving data patterns. This ongoing maintenance ensures the model remains accurate and reliable in real-world conditions. José et al. [9] and Sanjeet et al. [54] were pioneers in proposing deployable models based on TinyML and Optimized Carbon Threaded-based Miniaturized Devices, respectively.
4. Survey Outcome
This section presents details on the AI algorithms, methodological approaches, and key findings reported in the 33 peer-reviewed studies selected for this review, focusing on both in-vivo and in-vitro estimation of NTs.
4.1. Detection of Neurotransmitters
When both the types and concentrations of NTs in complex biological fluids are unknown, ML classification algorithms are used to identify the types of NTs present, without quantifying their concentrations [9]. Several algorithms have demonstrated effectiveness in distinguishing NT signals. These include supervised learning algorithms like LDA, Support Vector Machines (SVM), Random Forest (RF), Extreme Gradient Boosting (XGBOOST), and Gradient Boosting Machine (GBM); unsupervised algorithms such as Hierarchical Clustering Analysis (HCA); and Deep Learning (DL) algorithms, which have demonstrated superior accuracy compared to other approaches [2,3,9,38,48,49,51,59,60,61] as summarized on Table 13 and describe below.
4.1.1. Application of Conventional Machine Learning Algorithms
- linear discriminant analysis
LDA is a supervised learning algorithm that discriminates between the different types of NTs in a mixture. It is a powerful tool used for dimensionality reduction in the data collected by the biosensors. LDA identifies linear combinations of original features in the data thereby generating canonical factors [2,3]. These factors are linearly independent from each other. The linear independence of the factors minimizes within-class variance while maximizing between-class variance of the training data. This prevents the overfitting of the models when trained and tested with canonical factors.
Abbasi-Moayeda et al [2], used LDA with two canonical factors (68.64% and 12.43%) for the rapid and visual detection of DA, NEP and levodopa in a concentration range of 10–100 μM and discriminated these NTs from ascorbic acid in a concentration range of 40–80 μM with a cross-validation accuracy of 100%. To collect data, they designed a tricolor fluorescence probe incorporated in a single well having red quantum dots, blue carbon dots and green quantum dots. The probe responded to three wavelengths of light 450, 520 and 630 nm and generated current as output. The data recorded was a matrix of 3 wavelength (sensor elements) × 4 NTs × 9 concentration × 3 replicates, giving a total of 324 data points.
Xiaotong et al [3], used LDA with three different sets of canonical factors ( (22.7%,62.4%), (88.9%, 10.8%) and (72.2%, 25.9%)) to detect DA, SE, EP, NEP, L-dopa and DOPAC in concentrations ranging from 0.8μM to 3μM. Data was collected by using a colorimetric nanozyme sensor array with dendritic mesoporous silica embedded with metal nanoparticles (nanozymes). The nanozymes were silver, gold and platinum nanoparticles. 90 data points were recorded from a matrix of 3 nanozymes × 6 NTs × 5 replicates. The data collected were the changes in color fingerprints of the NTs that resulted from their inhibitory action on the catalytic effect of nanozymes.
- b.
- Support vector machines
SVMs are supervised learning algorithms. They are effective in handling the complex nonlinear data recorded by the biosensors during the biosensing of NTs. They provide robust generalizations of model performances. SVM works by finding the optimal hyperplane that best separates data points belonging to different types of NTs in a high-dimensional space [38,55]. SVM’s aims are to maximize the margin, which is the distance between the hyperplane and the nearest data points corresponding to each NT. SVM is robust in maintaining the tradeoff between bias and variance, reducing thereby avoiding overfitting.
- c.
- Randomforest
RF is an ensemble learning method that builds strong predictive models by combining the predictions of multiple weak models, often decision trees [56]. RF is an algorithm used to solve problems with limited data recorded by the biosensors during the biosensing of the NTs. It is an example of bagging and ensemble algorithms. It is used to limit the risk of overfitting that may occur in decision trees, and it handles missing value data well. GBM and XGBOOST, just like RF, are ensemble learning methods but have boosting properties. They differ from RF by training the data that were previously classified at each decision tree.
Siamak et al [38], used SVM with a linear kernel and RF to detect DA release in vivo in mice brains. The brains were stimulated with a single pulse of current with a strength of 0.1 or 0.3 mA. This generated time series data for DA at a concentration of approximately 2μM from two brain regions (where DA is released and where it is not). 600 images were collected for every 200 frames of baseline fluorescence. Data was collected in triplicate with alternating pulse strengths. The Z-score was used to normalize the data and the leave-one-out cross-validation was used in training the models. The average detection accuracy of 55.5% was obtained with SVM and 83.2% was obtained with RF when mice less than 12 weeks were used.
- d.
- Hierarchical clustering algorithm
HCA is an unsupervised learning algorithm that groups data points of NTs together based on the similarities of their features or the distance between them [55]. The grouping is done in a hierarchy of clusters in the NT datasets in a tree-like structure called the dendrogram. The references [2,3,35,37] and [55] used HCA to validate the in-vitro results obtained from NTs detection. They applied HCA for samples with fixtures of NTs with unknown concentrations or for in-vivo environments like the brains of mice, where the concentrations of the NTs are unknown.
- d.
- Embedded machine learning
The purpose for applying AI algorithms for automatic detection and quantification NTs is to palliate the effects of interferences, crosstalks and electrode “fouling” in the pattern recognition of NTs. DA is usually the target NT of importance. Jose et al [9] used TinyML to enhance electrochemical biosensors by distinguishing DA from interfering substances (uric acid and ascorbic acid) using SWV data. They generated a dataset of 5,492 samples through data augmentation and categorized it into four classes: Contaminated DA, Clean DA, PBS, and Unknown Chemical. Using a Keras-based deep learning model with four dense layers, they achieved high classification accuracy of 98.1% (32-bit) and 96.01% (8-bit) on an embedded system with minimal memory usage. The study demonstrated the feasibility of low-power AI for interference correction in DA detection. However, it was limited to four categories and did not reflect the complexity of real brain chemistry involving multiple neurotransmitters. Moreover, voltage-dependent data were processed as time-series inputs, which may reduce accuracy in broader applications. The guidelines and procedures established by the work done by Jahangiri et al [123] were not applied prior to assimilating the voltage-dependent data to time-series data. Also, it is not clear why the window size chosen for their analyses was equal to the entire length of the patterns for all the categories. Furthermore, the work focused solely on detecting the categories without predicting their concentrations. While the simultaneous detection and prediction of the concentration of the NTS is primordial for the real-time in-situ pattern recognition of dopamine. Last, the work does not explicitly or implicitly mention the pattern recognition algorithm applied in the proposed TinyML. This makes reproducibility not feasible.
4.1.2. Application of Deep Learning Algorithms
DA is released in the central nervous system through the activities of dopaminergic neurons, classified as tonic or phasic based on the speed and firing rates of these neurons. Tonic DA release occurs more slowly, over tens of seconds or minutes, while phasic DA release happens on a sub-second timescale, requiring fast and accurate monitoring systems for proper detection in vivo. Noninvasive detection techniques, such as imaging combined with deep learning, have shown promising results for monitoring DA.
Goyal et al. [55] proposed a deep learning model for detecting tonic DA from in vivo and in vitro voltammetry data. Matsushita et al. [59,60] developed CNNs for the automatic detection of phasic DA from FSCV data, achieving a performance of 98.31% with the CNN approach and 97.66% using an end-to-end object detection system with YOLOv3. The interaction between DA and SE also plays a role in determining susceptibility to Parkinson’s disease, as shown by Battaglia et al. [121]. Consequently, several studies have focused on the simultaneous detection and quantification of DA and SE [1,122], aiming to detect early symptoms of Parkinson’s disease with high accuracy for timely treatment.
This subsection analyzed how NTs are detected and classified into distinct categories. Table 12 summarizes the reviewed works that focused on the detection of NTs. A significant challenge in the detection of NTs lies in the simultaneous presence of multiple NTs at extremely low equilibrium concentrations and other interfering species like acids and metal ions in biological fluids. Furthermore, the coexistence of multiple NTs poses considerable hindrances for obtaining real-time, species-specific quantitative information on the NTs. Consequently, these problems hinder the accurate classification of NTs into different categories, exacerbate the lack of real-time information on NT specific quantities or concentrations in biological fluids and impedes a comprehensive understanding of the regulatory roles of NTs in the body. Therefore, precise and accurate quantification of NT concentrations is essential, as described next.
4.2. Quantification (Prediction of Concentrations) of Neurotransmitters
When the types of NTs in complex biological fluids are known, their individual concentrations can be predicted using regression algorithms. In this approach, the concentrations are estimated after identifying the specific NTs present. Supervised machine learning regression techniques proposed for this task include Multivariate Linear Regression (MLR) [35], Kernelized Ridge Regression (KRR) [36], Bayesian Linear Regression [36], Simple Linear Regression [46], and Quadratic Regression [46]. Deep learning models have also been suggested for predicting NT concentrations. These algorithms are summarized in Table 13 and described below.
- Linear Regression
Linear Regression is a supervised learning algorithm commonly used to quantitatively determine the NTs present in a mixture from the voltammograms of currents recorded by the biosensors. It is the simplest and fastest form of regression to implement and predicts continuous concentrations of the NTs. In simple linear regression (equation 3), a linear function is established between an independent variable or feature (current) and a dependent variable or NT concentration [73,76]. In Multivariate linear regression function is established between several independent features and dependent variables (equation 4).
y= wᵀx + b
Where y is the dependent variable or unknown concentration, x is the independent variable or scanning voltages, w is the weight matrix and b is the bias term.
Y=XB+E
Here, a multivariate linear regression function is established between several independent features (X) and dependent variables (Y). Where, the matrix Y represents the dependent variables or the unknown NT concentrations, the matrix X represents independent variables, corresponding to the scanning voltages (features), the matrix B represents the weight coefficients and the matrix E represents the sum of the error terms and noise for each response, usually assumed to be normally distributed.
- 2.
- Quadratic regression
Quadratic regression models the relationship between the data variables of the NTs that are not linearly related but are curvilinear or have parabolic fits. A quadratic kernel is usually applied to recorded NT data to transform its original space to a quadratic space where a quadratic equation is fit to the data for more efficient analysis.
Sanjeet et al [54] proposed a miniaturized hardware device using carbon threads for the simultaneous detection of DA and SE. Data was collected using cyclic voltammetry and differential pulse voltammetry in a potential range of -0.5 V to 1 V and concentration range of 0.5μM to 150μM for DA and 0.5μM to 200μM for SE. Linear regression, random forest regression, GBM regression and support vector regression were used to validate the results obtained from their proposed hardware device. The performance metrics used for the models were the mean absolute error (MAE) and the R-squared values. These metrics had values ranging from 16.25% to 41.56% for the MAE and 0.56 to 0.92 for the R-squared values.
- 3.
- Bayessian linear regression
Bayesian linear regression uses conditional probability to express the meaning of one feature from the recorded NT data as a linear combination of other features. In Bayesian linear regression, a Bayesian kernel is used on recorded NT data to transform its original space into a Bayesian space for Bayesian relationships to be established between the features.
- 4.
- Kernelized ridge regression
Kernelized Ridge Regression is a non-parametric technique used to estimate the conditional expectation of a random variable or features in the recorded NT data. In KRR a kernel trick is used on the common ridge regression that has been modeled using features obtained by linear least squares techniques [73,76]. KRR is an extension of MLR obtained by adding a penalty on the sum of squares of the individual weights in MLR. KRR has an estimator which is like noisy Gaussian process regression [36].
Nchouwat et al [24] developed a machine learning approach to automatically quantify dopamine (DA) release using near-infrared catecholamine nanosensor (nIRCat) data from mouse brain tissue across three developmental stages. By analyzing 251 image frames from the dorsolateral and dorsomedial striatum, a CatBoost regression model was trained, achieving high accuracy (R² = 0.97, MSE = 0.001) within a ±10% prediction tolerance. For improved efficiency, the model was distilled into a kernelized Ridge regression. This framework demonstrates strong potential for mapping age- and region-specific dopamine dynamics, supporting the advancement of targeted therapies for neurodegenerative diseases like Parkinson’s and depression.
Kallabis et al [36] quantitatively determined DA in the presence of magnesium ions using kernel ridge regression (KRR) and Bayesian linear regression with an average error of 5.5%. Data was recorded using fluorine-doped tin oxide electrodes (FTO) and differential pulse voltammetry. A total of 438 measurements of DA with concentrations of range 20 to 400uM and magnesium with concentration range of 0 to 600uM were recorded with the FTO in a potential range of -50mV to +350mV vs.Ag/AgCl 1 M KCl. The features extracted from the 438 voltammograms were the peak currents, peak potentials and the potential width at half peak currents. 50% of the data was used for training and 50% for testing the models.
This subsection analyzed how accurate quantities or concentrations of NTs in complex biological fluids are predicted. Table 12 summarizes the reviewed works that focused on the quantification of NTs. A significant limitation of quantifying NT concentrations separately from their detection is that the process is time-consuming, costly, less accurate, and unsuitable for simultaneous analysis of multiple NTs in-vivo. To address this challenge, the development of AI algorithms capable of analyzing multiple NTs in complex biological fluids is of utmost importance as discussed next.
4.3. Simultaneous Detection and Quantification of Neurotransmitters
When the types and concentrations of multiple neurotransmitters (NTs) in complex biological fluids are unknown, it becomes necessary to simultaneously identify the individual NTs present and quantify their concentrations in order to effectively analyze their patterns PCR, PLSR and DL are commonly used pattern recognition algorithms for their simultaneous detection and quantification as described below.
4.3.1. Application of Principal Component Regression and Partial Least Squared Regression
PCR applies PCA to reduce feature dimensionality by extracting uncorrelated principal components, followed by regression fitting. However, PCR only maximizes variance in explanatory features, not the target variable, which limits its predictive performance [1,41]. PLSR addresses this limitation by computing latent variables that maximize covariance between explanatory features and the dependent variable, resulting in more accurate regression fitting [1,41]. PLSR is particularly suitable for high-dimensional regression problems with more parameters than samples, projecting predictors into a latent space to optimize outcomes [21]. Despite their advantages, both PCR and PLSR still require improvements in sensitivity and discrimination, especially for analyzing chemically similar mixtures.
Sazonova et al [1] focused on detecting and predicting NT concentrations using voltammetry and pattern recognition techniques. They used PCR and PLSR to simultaneously detect DA and SE in in-vitro mixtures. Data were collected by varying concentrations of DA and SE, creating 72 unique combinations. Measurements were taken using DPV over a range of potentials, resulting in over 1,000 data points per mixture. The data were then analyzed using PCA to extract key features and PLSR to predict NT concentrations. Their results showed accuracy of 42-62% for DA and 33-50% for SE, which improved to 81-91% for DA and 91-100% for SE when extending the accuracy ranges. However, these results required expanding the acceptable concentration range, which indicated the predictions were not precise and deviated from true concentrations. Additionally, the models overfitted, as training accuracies exceeded testing accuracies. To improve prediction accuracy and avoid overfitting, further research should focus on simplifying NT recognition and refining feature selection for better concentration prediction.
Salimian et al [33], used UV–vis spectroscopy and PCR to simultaneously detect levodopa and carbidopa in mixtures, drugs, and breast milk. Here, a UV–vis spectrophotometric approach was combined with two multivariate calibration techniques namely net analyte signal and PCR to measure levodopa and carbidopa simultaneously in lab-prepared mixtures, pharmaceutical tablets, and breast milk samples. Using the net analyte signal method, the average recovery rates were 98.10% for levodopa and 99.60% for carbidopa, with relative standard deviation values kept below 5.5% and 4%, respectively. In comparison, the PCR method yielded slightly lower recoveries: 96.86% for levodopa and 92.43% for carbidopa. To determine the optimal number of components in the PCR model, K-Fold cross-validation was applied, resulting in 7 components for levodopa and 3 for carbidopa, with corresponding mean square error of prediction (MSEP) values of 1.50 and 7.14. Overall, the results showed that the net analyte signal model provided better performance than the PCR model. The net analyte signal -based method also proved effective for analyzing levodopa and carbidopa in both commercial tablet formulations and breast milk samples.
Nchouwat et al [111] built upon the work done by Sazonova et al [1] to detect NTs in complex mixtures and predict their concentrations with reduced procedural complexity for SE and DA. The average testing accuracies of estimation using PCA-GPR for DA alone, SE alone and their mixture (DA–SE) were 87.6%, 88.1%, and 96.7%, respectively. Using PLS-GPR, the testing accuracies of estimation for DA alone, SE alone, and their mixture (DA–SE) were 87.3%, 83.8%, and 95.1%, respectively. Furthermore, they explored methods of reducing the procedural complexity in estimating the NTs by finding reduced subsets of features for accurately detecting and predicting their concentrations. The reduced subsets of features found in the oxidation potential windows of the NTs improved the testing accuracy of the estimation of DA–SE to 97.4%. They showed that selecting scanning voltages found in the oxidation potential windows of these two NTs increased their estimation accuracies when true concentrations were used and did not need to increase the concentration levels for accuracy improvement as done by Sazanova et al [1]. Table 13 summarizes the algorithms used in the publications selected for this review and Figure 14 shows the plot of the corresponding number of publications per AI algorithm used.
Table 12.
Summary of the scopes of reviewed papers related to AI.
| Scope | Summary | References |
|---|---|---|
| NT detection | These are classification processes that group NTs one at a time into distinct categories without prior knowledge of their types or concentrations in the biological fluid being studied. | [2,3,9,35,37,38,40,44,47,48,49,50,52,56,59,60,61] |
| NT quantification | These are regression processes used to quantify NT concentrations one at a time, based on prior knowledge of the types of NTs present in the biological fluid being studied | [21,24,34,36,45,46,47,50,52,53,56] |
| Simultaneous Detection and quantification of NTs | These are combined classification and regression processes in which multiple NTs are simultaneously categorized and their concentrations quantified, without prior knowledge of the types or concentrations of NTs present in the biological fluid being studied | [1,33,42,43,54,55,57,58,111] |
Table 13.
Summary of the AI algorithms used for NT detection and quantification.
| Algorithm | Learning type | Summary | References |
|---|---|---|---|
| LDA | Supervised | Reduces data dimensions while maximizing class separation by finding the feature combinations that best distinguish between categories | [2,3,35,37], [49] |
| SVM | Supervised | Finds the optimal boundary (hyperplane) to separate classes by maximizing the margin between different class data points for better generalization. | [38,55] |
| RF | Supervised and ensemble | Build multiple decision trees and combine their outputs for more accurate, performant, robust and stable predictions. | [38,52,55], [56] |
| GBM and CATBOOST | Supervised and ensemble | build models sequentially, where each new model corrects errors made by the previous ones and combines many weak learners (usually decision trees) to create a strong predictive model. | [24,41,48] |
| XGBOOST | Supervised | an optimized version of gradient boosting that is faster and more efficient through advanced regularization, parallel processing, and handling of missing values | [40,48,49] |
| HCA | Unsupervised | builds a hierarchy of clusters by either merging or splitting data points based on similarity and creates a dendrogram to visualize the nested grouping of data. | [2,3,35], [37,55] |
| LR | Supervised | Models the relationship between one independent variable and one dependent variable by fitting a straight line and predicts the dependent variable based on the linear relationship with the independent variable. | [46,50,51,52,55,56] |
| MLR | Supervised | Models the relationship between two or more independent variables and one dependent variable, fitting a linear equation to predict the outcome based on the combined effect of all input variables. | [35,37] |
| QR | Supervised | Models the relationship between the independent variable(s) and the dependent variable using a second-degree polynomial (a quadratic equation) | [46] |
| BLR | Supervised | Incorporates Bayesian inference to estimate the distribution of model parameters, providing a probabilistic approach to linear regression and offering not just point estimates but also uncertainty estimates for the model's predictions | [36] |
| KRR | Supervised | Combines Ridge Regression with the kernel trick to model nonlinear relationships and maps input features into a higher-dimensional space to perform linear regression in that space, enabling it to capture complex patterns. | [36] |
| PCR | Supervised and dimensionality reduction | Combines Principal Component Analysis (PCA) for dimensionality reduction with linear regression. It uses the principal components (uncorrelated features) as inputs to predict the target variable. | [1,33,41], [42,111] |
| PLSR | Supervised and dimensionality reduction | Reduces predictors to a smaller set of uncorrelated components while maximizing the covariance between predictors and the response variable | [1,21,34,41], [46,57,111] |
| DL | Supervised, Semi supervised, unsupervised or reinforcement learning | Uses multi-layered neural networks to automatically learn complex patterns from large amounts of data | [9,35,37], [42,43], [45,47,53], [58,59,60,61] |
All publications with Convolutional Neural Networks (CNN), Deep Neural Networks (DNN) and Artificial Neural Networks (ANN) are placed in a single bin called Deep Learning (DL) as they are all similar techniques.
Figure 14.
Frequency of publications using AI algorithms.
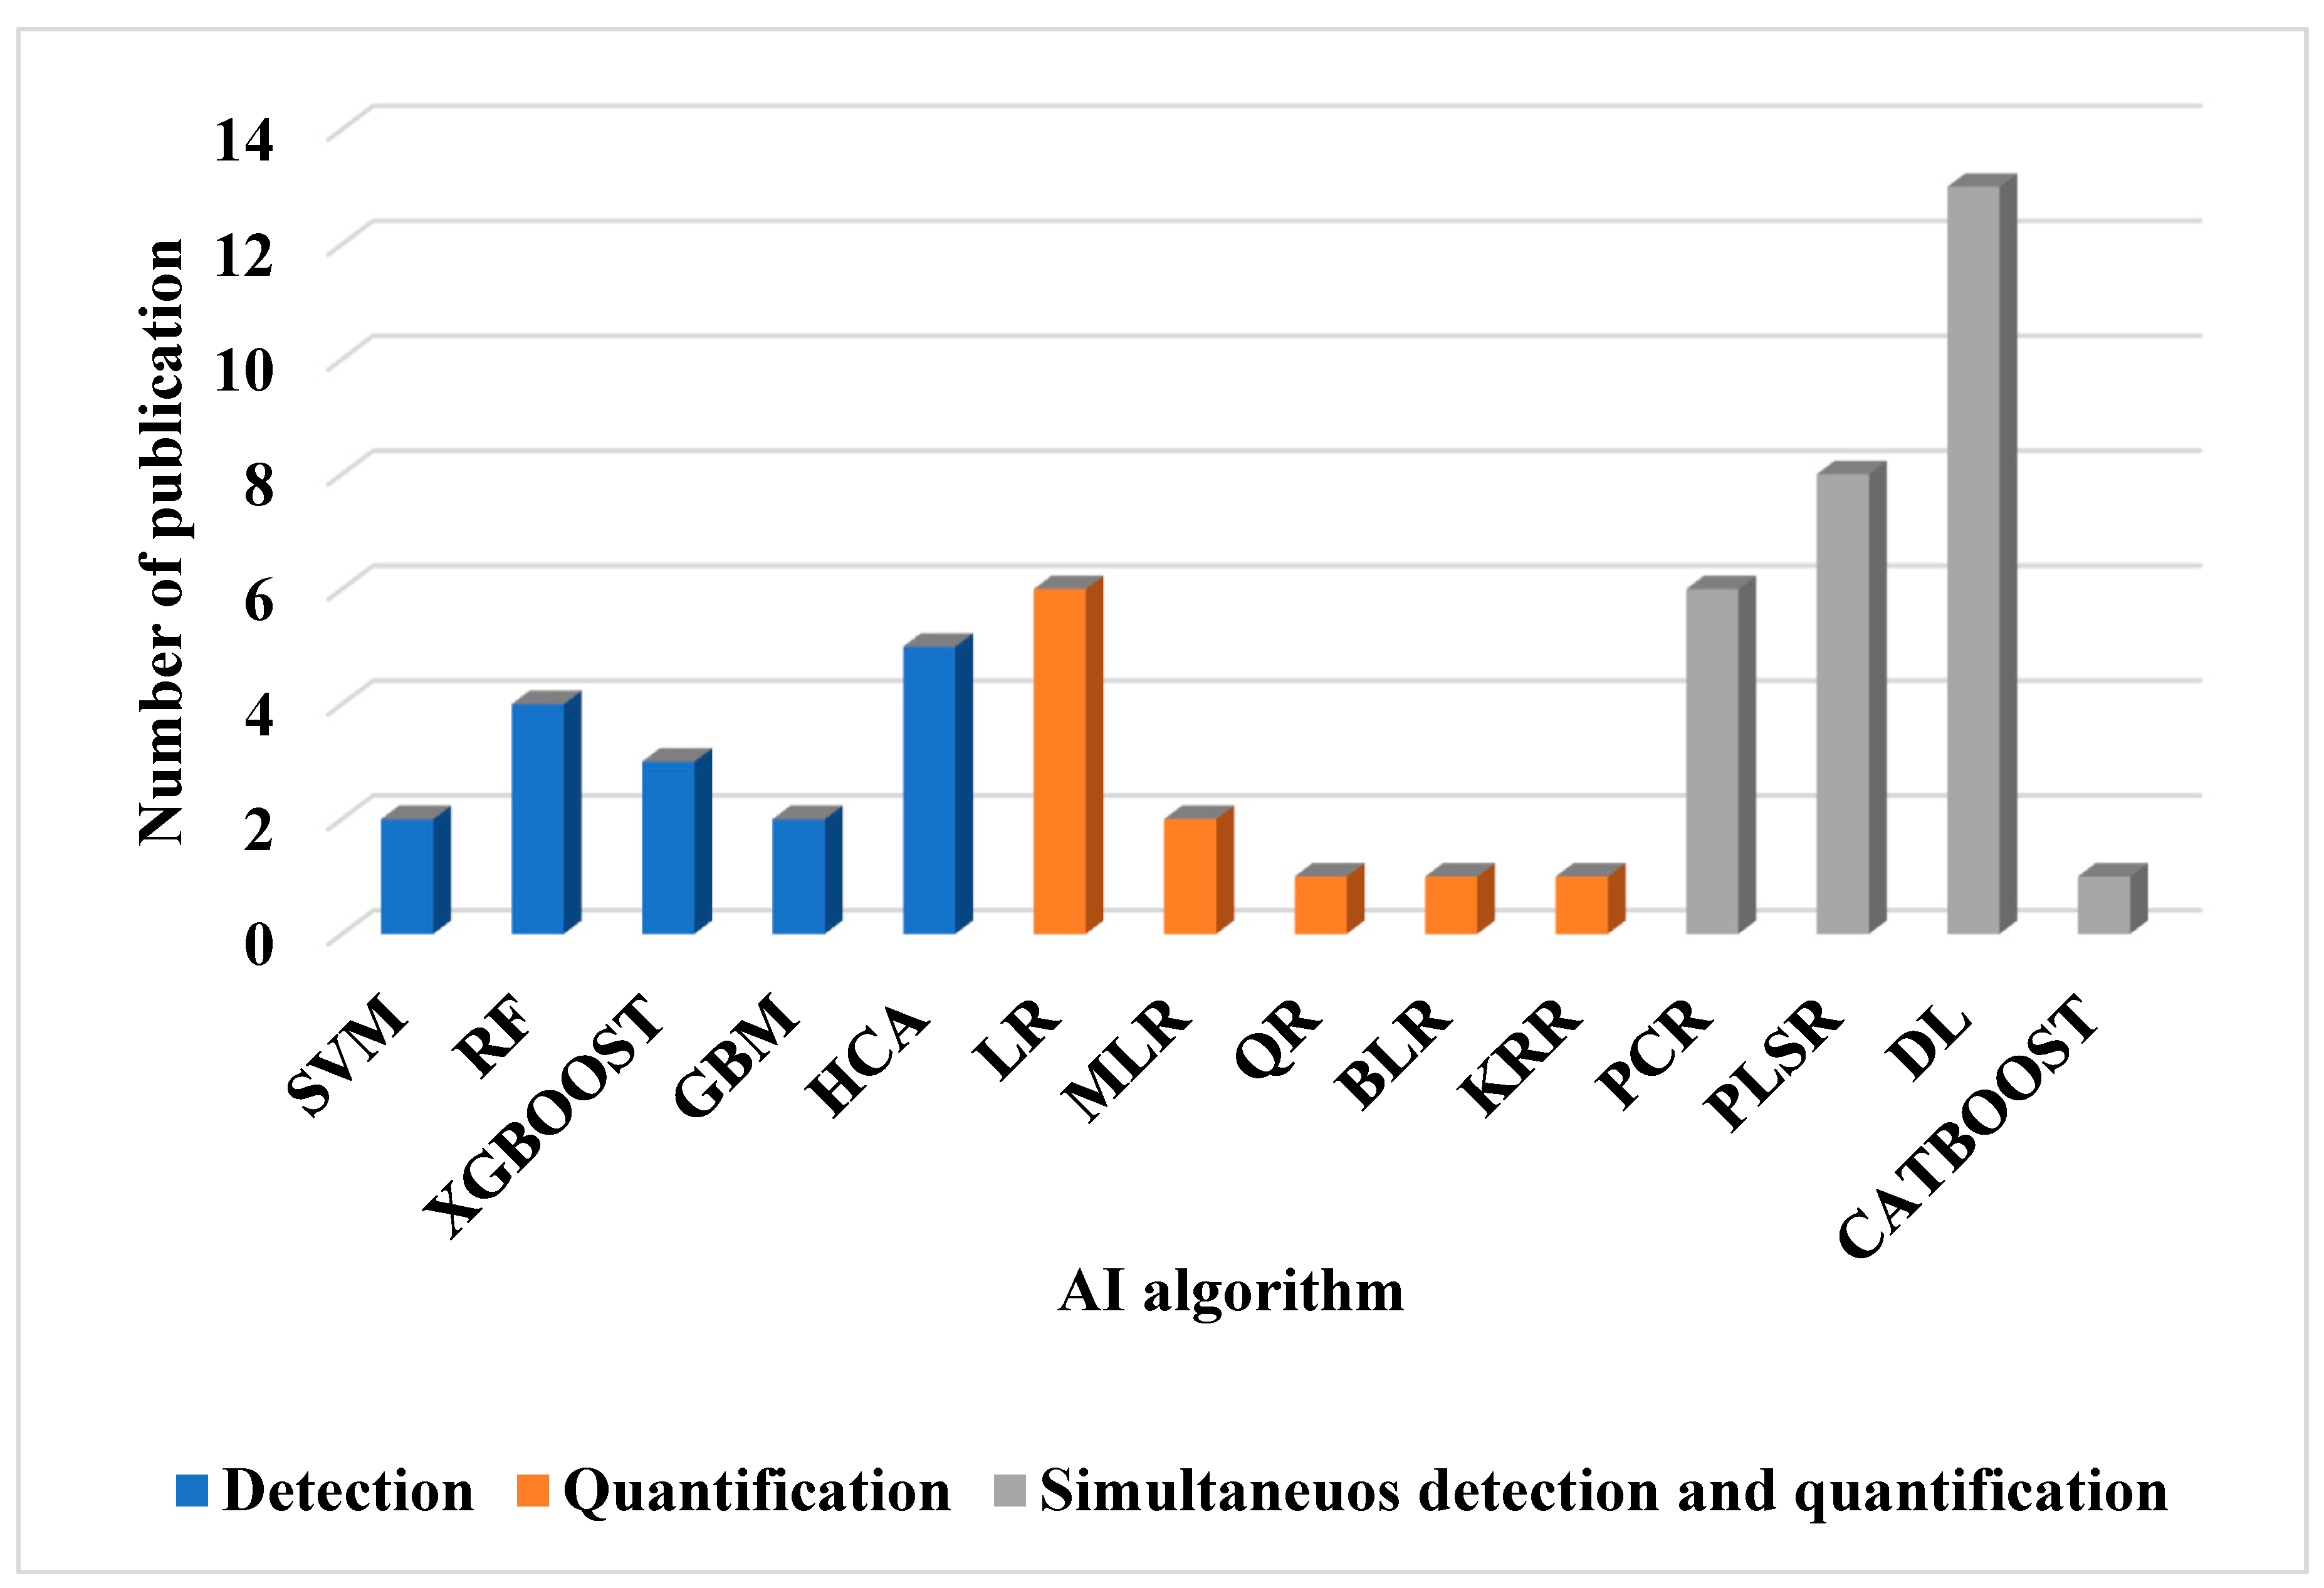
4.3.2. Application of Deep Learning and Artificial Neural Networks
DL and ANN are the most used AI techniques for the biorecognition of NTs with 13 publications (Figure 6). This is because deep learning avoids the hectic task of manual feature engineering, necessary for the building of the AI models. Furthermore, DL techniques use 2-D (image) data for AI model training and testing. These image data are readily acquired non-invasively using imaging techniques both in vivo and in vitro, contrary to 1-D data that are mostly recorded invasively using voltammetric techniques and implantable biosensors. The biosensors need to be implanted into sites where biorecognition of the NTs is done. Implantation of biosensors causes damage to the surrounding cells at the sites of implantation and biases the data recorded by the sensors. Furthermore, DL is more accurate than the other AI techniques [42]. Additionally, the advantages of DL have favored the growth of interest in the simultaneous detection and quantification of NTs in recent decades with 27 publications and distribution shown on Figure 6. This is also due to the increase in computational power and memory of computers, capable of handling 2-D data.
The limitation in the use of DL is the need for extremely large 2-D data sets which are not always possible to get, especially from in vivo studies where animals are sometimes euthanized prior to data collection [76]. 1-D data are mostly analyzed using PCR and PLSR for the pattern recognition of the NTs. This is because they are powerful pattern recognition algorithms made of efficient dimensionality reduction tools of PCA, and partial least squares analysis (PLS) used in PCA and PLSR respectively. These tools help to compute linearly independent features from 1-D data. The features computed are then used for AI model training. This ensures that the trained models are not overfitted and can be generalized to other unseen 1-D data [1].
Hoseok et al [42] conducted the first study using DL to predict neurochemical concentrations from both in-vitro and in-vivo FSCV data, comparing its performance to PCR. They found that while DL and PCR performed similarly for detecting individual NTs (DA, EP, NE, SE), DL outperformed PCR when detecting mixtures. Data were collected using FSCV across five concentrations (100–500 nM), with 500 scans per concentration, and data augmentation expanded the training set to 36,000 scans. DL achieved slightly higher accuracy (96.23%) than PCR (95.39%) for DA detection. The study demonstrated deep learning’s superiority in single-analyte detection but did not address simultaneous multi-analyte detection or practical in vivo application using DPV. Future work should focus on multi-NT detection using DPV for greater real-world applicability.
Seongtak et al. [43] developed a deep learning method to simultaneously estimate tonic levels of DA and SE with high temporal resolution in vitro. By leveraging data from FSCV, their approach addresses key limitations of traditional techniques such as microdialysis, which struggle with low temporal resolution and are not well-suited for monitoring multiple NTs over time. The deep learning model also demonstrated significantly greater accuracy than conventional background subtraction methods, especially in estimating SE concentrations. These findings highlight the potential of this approach for real-time, simultaneous monitoring of both phasic and tonic NT activity in future in vivo studies.
4.3.3. Application of Embedded Machine Learning
Sanjeet et al. [54] developed an optimized carbon thread-based miniaturized electrochemical sensing device capable of simultaneously detecting DA and SE, with the integration of machine learning to improve data analysis and reduce manual intervention. The device, fabricated using a CO₂ laser scriber, demonstrated broad linear detection ranges (0.5–150 μM) for DA and 0.5–200 μM for SE with low limits of detection (0.25 μM for DA, 0.22 μM for 5-HT) and strong linearity (R² = 0.99 and 0.98, respectively; N = 3). Real sample testing in blood serum confirmed high recovery and selectivity. To enhance prediction accuracy, various ML regression models were applied to the analytical dataset (80% training, 20% testing). Among these, decision tree, k-nearest neighbors, gradient boosting, adaptive boosting, and random forest models achieved R²-scores above 0.98 with low error rates, outperforming linear and support vector regression. The study highlights the potential of combining miniaturized EC sensing with ML for highly accurate and efficient diagnostic applications.
This subsection analyzed how multiple NTs are simultaneously detected, classified into distinct categories and how their accurate quantities or concentrations in complex biological fluids can be predicted. The simultaneous detection and quantification of NTs is unique in that it entails the simultaneous estimation of multiple NTs in complex biological fluids, specifically targeting the discrimination of NT signals in the presence of interfering species like ascorbic acid, uric acid, metal ions and other background noise. Furthermore, it has the potential of using data from various biosensors including bioenzyme and nanoparticle-based implantable biosensors used for NT estimation. These sensors have enhanced sensitivity through the modification of their functional surfaces with chitosan-immobilized and nanoparticles. Table 12 summarizes the reviewed works that focused on the simultaneous detection and quantification of NTs.
4.4. AI Algorithms and Voltammetric Techniques for NT Detection
As discussed in section 3.2, voltammetric techniques in NT detection are advantageous over spectroscopy, fluorometry and colorimetry because they can be easily implemented in-vivo, are low cost, have rapid responses and can easily be implemented in portable devices. The prominent works discussed and summarized in Table 14 include the state-of-the-art research published by Jose et al [9] on the automatic detection of NTs and the state-of-the-art research published by Sazanova et al [1], Hoseok et al [42] and Nchouwat et al [111] on the automatic detection and quantification of NTs.
4.5. Limitations of the Existing Studies Employing AI Algorithms Trained on Voltammetric Data
Several challenges persist in the accurate detection and quantification of neurotransmitters (NTs) in complex biological environments, as highlighted in current literature. These challenges include
- Elevated detection thresholds for NT estimation. Sazonova et al. [1] extended the estimation thresholds of NT concentrations beyond the actual concentration ranges, resulting in wider confidence intervals. Consequently, the predicted NT concentrations often fail to reflect the true levels present in complex biological matrices, thereby compromising the reliability of these estimations.
- Limited discrimination of NTs during simultaneous NT quantification. Although the proposed computational models demonstrate high performance metrics, they are frequently unable to fully discriminate between different NT species. Accurate and complete discrimination is essential for comprehensive profiling of individual NTs and is a critical requirement for identifying biomarkers associated with neurodegenerative diseases.
- Restricted NT species coverage and simplified mixtures of NT species. Existing studies generally investigate only a limited subset of NTs, even though biological fluids naturally contain a vast array of NT species in dynamic equilibrium. For a more representative analysis, it is necessary to evaluate extended NT species libraries and more complex mixtures, which better reflect physiological conditions.
- Resource-intensive computational models. Many of the AI-based approaches proposed for automatic NT detection and quantification are computationally intensive, resulting in slow processing times and high resource demands. These limitations hinder their applicability in real-time or near-real-time settings. To overcome this, model compression techniques such as knowledge distillation or transfer learning can be employed to develop lightweight, computationally efficient alternatives (e.g., simplified linear models).
- Model overfitting and bias-related performance issues. Numerous AI models exhibit significant overfitting, as indicated by disproportionately high training accuracy compared to validation performance. This can be attributed to the high-dimensionality, noise, and variance inherent in biological datasets. These issues cause models to learn noise patterns along with meaningful signals. Effective mitigation strategies include robust data preprocessing, noise reduction, and advanced feature engineering to isolate and prioritize relevant features from complex datasets.
4.6. Tools Used for the Automatic Detection and Quantification of Neurotransmitters
The need for the real-time monitoring of the “true” patterns of NTs in situ has caught the attention of researchers in the recent decade. This is due to the important roles played by the NTs in maintaining human physical and mental health. The monitoring of the NTs is very challenging due to the multiplexed signals and crosstalks generated by the NTs, especially in vivo. To this aim, numerous tools have been used to deconvolve the multiplexed signals and crosstalks recorded by electrochemical techniques. The tools reported in the 33 papers used for this review are both hardware and software tools. Two papers implemented deployable hardware devices. Concerning software tools, 2 papers used MATLAB [1,36], one paper used Edge Impulse development platform [9] and the rest of the 30 papers used Python programming platforms including Jupyter Notebook, Google Collaboratory, R-programming and VS Code.
5. Discussion
The automatic detection and quantification of NTs can be classified as chemometric studies when analyses are done in-vitro or bioinformatic studies when analyses are done in-vivo. Chemometrics is the most reported with 90 % of the studies done in-vitro and selected for this review. It is the application of AI in analytical chemistry and metabolomics. Chemometrics is a data-driven means of extracting valuable information from chemical systems for accurate decision making. Chemometrics is inherently interdisciplinary, using methods frequently employed in core data-analytic disciplines such as multivariate statistics, applied mathematics, and computer science, in order to address problems in chemistry. In summary, chemometrics serves as a vital toolbox for modern analytical chemistry, empowering scientists to extract actionable insights from complex chemical data. By harnessing the power of mathematical and statistical methods, chemometric experts contribute to advancements in various fields, including pharmaceuticals, environmental monitoring, food safety, and materials science. As analytical techniques continue to evolve and generate increasingly large datasets, the role of chemometrics in extracting knowledge from data is poised to become even more indispensable in the years to come.
5.1. Challenges Faced in the Automatic Detection and Quantification of Neurotransmitters
The automatic detection and quantification of NTs faces many challenges that largely contribute to the degradation of the results obtained from the chemometric or bioinformatic analyses. These challenges are included but not limited to the following:
1.The major challenge faced is the small sizes of the data sets available for the training of the AI models. One reason for the small sizes of the datasets is because of the limitation in the range of operating potentials for some biosensors that are used to record the signal patterns of the NTs. These limitations limit the maximum number of data points that can be recorded by a particular sensor. Another reason for the limited data is because of the need to euthanize animals prior to in vivo data recording. These problems can be solved by designing the sensors with materials that remain stable over greater potential ranges and undertaking in vitro experiments to avoid the euthanizing of the animals. Data augmentation techniques appropriate for these types of data should be explored to artificially increase the sizes of the data sets.
2. Implantable biosensors are very fragile and easily break during implantation or during manipulation while estimating the NTs. This makes their use and maintenance very difficult. This difficulty may not be directly addressed by AI but mechanically resistant nanofiber materials that are highly conductive can be used to mitigate this problem.
3. The surface modification on the biosensors aimed to enhance their selectivity and sensitivity by using biopolymers to immobilize bio-enzymes and nanoparticles make the sensors become bulky. This bulkiness sometimes damages the tissues at their sites of implantation. The damaged tissues cause abscesses around the sensors impeding electron diffusion between the sensors and analytes under measurement. Furthermore, some biopolymers used as immobilizing matrices reject some neurochemicals. This is the case with chitosan rejecting ascorbic acid. These factors reduce the performance of the sensors and introduce noise to the measured signals. These challenges can be mitigated using AI by training models on larger, more representative datasets that include controlled noise to simulate the effects of surface modifications. This approach enhances the models' ability to generalize to new, unseen data
4. The passivation of the biosensors greatly contributes to the reduction in their performance. This is due to the reduction in the sensitivity of the biosensors when a particular NT is adsorbed to the functional surface of the biosensors when used for a very long period. This problem can be mitigated through the use of bio-enzymes and nanoparticles, which accelerate the conversion of NTs, thereby reducing their adsorption onto the functional surfaces of biosensors. Additionally, AI-based mitigation involves training models on larger and more representative datasets that incorporate controlled noise to simulate the effects of passivation. This strategy improves the models’ ability to generalize to new, unseen data
5. Cross-talk and fouling of biosensors by NTs. These occur due to NTs similar electrochemical responses at certain potentials, as well as their comparable chemical structures to other neurochemicals and metal ions. These issues reduce the specificity and discriminative ability of the biosensors. This problem can be mitigated by designing biosensors that are highly specific to individual NTs using biocatalysts including bioenzymes.
6. The effective surface areas of the biosensors are not yet optimized for the detection of NTs in-vivo. To this aim, miniaturizing the sensors by using nanofibers material during sensor design will increase the effective contact surface area between the sensors and the analytes under test.
5.2. Potential Application of the Automatic Detection and Quantification of Neurotransmitters
NTs are present in various body fluids, including cerebrospinal fluids, blood and urine. Simultaneous detection and quantification of NTs in these different fluids serve distinct purposes and present different challenges, as discussed below.
5.2.1. Estimation of Neurotransmitters in Cerebrospinal Fluid from Brain Samples
NTs present in the cerebrospinal fluid of the brain are important biomarkers for neurodegenerative diseases. For instance, DA is an important biomarker for Parkinson’s disease while the interaction between SE and NEP in the brain plays an important role for anxiety and depression [92]. The U.S Department of Health and Human Services declared the early detection and treatment of Parkinson's disease to be national priority tasks. This is because a 2022 Parkinson's Foundation-backed study revealed that nearly 90,000 people are diagnosed with Parkinson's disease every year in the U.S and projects that over 1.2 million people in the U.S will be living with Parkinson's by 2030. According to the WHO, the global estimates in 2019 showed over 8.5 million individuals living with Parkinson's disease and 117,400 died from it [124]. Since dopamine is an important biomarker for Parkinson's disease, the accurate real-time monitoring of the in vivo concentration of the NTs and hence dopamine will help in the early diagnosis and treatment of Parkinson’s disease. Therefore, the potential application of the automatic detection and quantification of NTs and hence dopamine, will be in the medical therapies of deep brain stimulation for the treatment of neurological disorders including Parkinson’s disease and depression. This will reduce the death tolls caused by neurological disorders [63,64,65,66,67]. The current therapeutic approach used in the treatment of neurological disorders is based on open-loop-deep brain stimulation. The main drawback of the current open loop deep brain stimulator is that it has no feedback loop to indicate the appropriate duration, intensity and duty cycle of the electric impulses to be sent into the brain to stimulate the release of dopamine when there is shortage of dopamine or when to stop sending electric pulses when dopamine is in excess [125]. As a result, electric impulses are sent nonstop and uncontrolled into the brain during the therapeutic treatment of Parkinson’s disease [126]. To remedy this, doctors usually depend on their experience to decide on the duration, intensity and duty cycle of the electrical pulses to be administered to the patients, which is not always accurate. Therefore, the models to be developed from automatic detection and quantification of NTs will enable real time measurement and monitoring of the signal patterns of several NTs accurately and simultaneously in the brain [1]. Consequently, the early diagnosis of neurological diseases will be facilitated. Further, the models will enable the separation of the measured real time signal patterns of the NTs to get discriminated signals for NTs, especially dopamine. The discriminated dopamine signals will then be fed back into the control loop of the open-loop-deep brain stimulator to make it become a closed loop deep brain stimulator. This new stimulator will enhance the treatment of Parkinson’s disease and other neurological diseases [125,126]. Human errors potentially made by the doctors during the treatment of the disease will be reduced by indicating to the stimulator the appropriate electric signals to be sent into the brain during therapeutic treatments. Figure 15 summarizes the processes of open and closed loop deep brain stimulation therapies.
5.2.2. Estimation of Neurotransmitters from Urine Samples
Accurately detecting and quantifying NTs in urine provides a simple way to monitor health and make specific medical diagnoses. Because it is easy to perform, urine testing is sometimes used in functional and integrative medicine to check for NTs imbalance and nervous system function. In clinical settings, urinary metabolites, such as vanillylmandelic acid (VMA) for norepinephrine and homovanillic acid (HVA) for DA, help diagnose conditions like pheochromocytoma and neuroblastoma. They offer insights into how neurotransmitters are processed in the body. However, urinary NT levels do not directly relate to activity in the central nervous system (CNS). These levels reflect breakdown products from the body that are influenced by diet, kidney function, and liver metabolism. Therefore, their usefulness in standard psychiatric or neurological assessments is limited.
5.2.3. Estimation of Neurotransmitters from Blood Samples
Measuring NTs in blood gives useful insights into how the nervous system works. It helps diagnose endocrine tumors, monitor drug therapy, and research biomarkers for neurological and psychiatric disorders. For instance, high blood serotonin levels may suggest carcinoid syndrome. Additionally, measuring DA or SE precursors in plasma can aid research on depression or Parkinson’s disease. In clinical trials, blood tests are used to track how well medications are working and whether patients are following their treatment plans. However, there are significant limitations to blood NT levels. The blood-brain barrier stops a direct link to central nervous system (CNS) activity. Also, circulating NTs usually exist in low amounts and break down quickly. These issues require sensitive testing methods, which make blood testing more suitable for research and specific clinical uses rather than routine mental health assessments.
6. Conclusion
The significant problems faced by the state-of-the art biosensors that can’t be solved by conventional analytical methods are low sensitivity and selectivity among likely biological interfering NTs and background noise. Additionally, electrode “fouling” and crosstalk caused by the interferences of the signal patterns generated by NTs can’t be handled by the conventional analytical methods. These problems are exacerbated when the biosensors are used in complex biological fluids including cerebrospinal fluids. Attempts to mitigate these problems have been made by modifying the functional surfaces of the biosensors through the combined actions of nanoparticles and bioenzymes. However, lingering multiplexed signals and crosstalk resulting from interferences between different species of NTs end up being recorded, especially in the complex biological fluids. Therefore, AI algorithms have been proposed to efficiently deconvolve the lingering multiplexed signals and crosstalk by removing the background interference and noise to reveal the “true” signal patterns corresponding to NTs. This paper presented the first survey based on 33 peer reviewed articles focusing on the application of AI algorithms for the automatic detection and quantification of NTs in complex matrices. The implementation of AI algorithms to data recorded by implantable biosensors has the potential to enhance the reliability of the biosensors in discriminating NT-responses. This makes it possible for the “true” signal responses of NTs from the multiplexed signals to be obtained. The real-time in situ discriminated responses, particularly that of DA, have potential applications in future therapies including closed-loop-deep brain stimulations to control neurodegenerative diseases including Parkinson’s disease, depression and Alzheimer’s.
References
- N. Sazonova, J. Njagi, Z. Marchese, M. Ball, S. Andreescu, and S. Schuckers, “Detection and prediction of concentrations of neurotransmitters using voltammetry and pattern recognition,” Ann. Int. Conf. of the IEEE Eng in Med. And Biol. Soci., pp. 3493–3496, 2009.
- S. Abbasi-Moayeda, M. R. Hormozi-Nezhada and M. Maazac, “A multichannel single-well sensor array for rapid and visual discrimination of catecholamine neurotransmitters” Sensors & Actuators: B. Chemical 296 (2019) 126691.
- W. Xiaotong, L. Yuling, L. Yan, Lei Tan, W. Jinyi, W. Zixuan, M. Zhong and Y. Liang “Colorimetric nanozyme sensor array for the pattern recognition of monoamine neurotransmitters using dendritic mesoporous silica embedded with metal nanoparticles” Sensors & Actuators: B. Chemical 369 (2022) 132287.
- Bo Si and Edward Song “Recent Advances in the Detection of Neurotransmitters” MDPI, Chemosensors 4, Jan 2018.
- H. Jiayi, E.Spanolios, C.E.Froehlich,C.L.Wouters and C.L.Haynes, “Recent Advances in the Development and Characterization of Electrochemical and Electrical Biosensors for Small Molecule Neurotransmitters”, ACS Sens. 2023, 8, 1391−1403.
- Yi Su, S.Bian, and M.Sawan, “ Real-time in vivo detection techniques for neurotransmitters: a review,” Royal Society of Chemistry, Analyst. 2020.145.6193.
- D.Yifan,L.Shihua & T.Yang, “Real-Time Monitoring of Neurotransmitters in the Brain of Living Animals”, ACS Appl. Mater. Interfaces 2023, 15, 138−157.
- G.F. Giordano, L.F.Ferreira, I.R.S.Bezerra, J.A.Barbosa, J.N.Y.Costa, G.J.C.Pimentel & R.S.Lima, “Machine learning toward high-performance electrochemical sensors”, Analytical and Bioanalytical Chemistry (2023) 415:3683–3692.
- J. I. F De Oliveira, M. C. Faleiros, D. C. Ferreira, M. Veerappan, and S. N. Khaled, “Empowering Electrochemical Biosensors with AI:Overcoming Interference for Precise Dopamine Detection in Complex Samples” Adv. Intell. Syst. 2023, 5, 2300227.
- J.Njagi, M.M. Chernov, J. C. Leiter, and S. Andreescu, “Amperometric Detection of Dopamine in Vivo with an Enzyme Based Carbon Fiber Microbiosensor” Anal. Chem. 2010, 82, 989–996.
- E.Dumitrescu, A.Deshpande, K. N. Wallace, and S. Andreescu, “Time-Dependent Monitoring of Dopamine in the Brain of LiveEmbryonic Zebrafish Using Electrochemically Pretreated Carbon Fiber Microelectrodes”. [CrossRef]
- N.Chauhan,, S. Soni, P. Agrawal,Y.P.S. Balhara, U. Jain, “Recent advancement in nanosensors for neurotransmitters detection: Present and future perspective”, Process Biochemistry 91 (2020) 241–259.
- Singh, A.Sharma,, A. Ahmed, A. K. Sundramoorthy, H. Furukawa, S. Arya and A. Khosla, “Recent Advances in Electrochemical Biosensors: Applications, Challenges, and Future Scope”, Biosensors 2021, 11, 336. [CrossRef]
- Nissar, M. I. Izharuddin, W. A.Mir & T.A.Shaikh, “Machine Learning Approaches for Detection and Diagnosis of Parkinson’s Disease - A Review” 7th Int. Conf on Ad .Comp& Com. Sys (ICACCS),2021.
- Rana, A. Dumka , R. Singh , M. Rashid , N. Ahmad & M. K. Panda, “An Efficient Machine Learning Approach for Diagnosing Parkinson’s Disease by Utilizing Voice Features”, Electronics 2022, 11, 3782. [CrossRef]
- R.Mathur, V. Pathak and D. Bandil, “Parkinson Disease Prediction Using Machine Learning Algorithm”, Advances in Intelligent Systems and Computing 841. [CrossRef]
- R. S. Stadena, I.Moldoveanua,J.F.van Stadena, “Pattern recognition of neurotransmitters using multimode sensing”, Journal of Neuroscience Methods 229 (2014) 1–7.
- S. Banerjee, S. McCracken, Md. F. Hossain and G. Slaughter “Electrochemical Detection of Neurotransmitters,” MDPI, Biosensors 2020, 10, 101.
- S. D. Niyonambaza, P. Kumar, P. Xing,J .Mathault, P.D. Koninck, E. Boisselier, M. Boukadoum and A.Miled, “A Review of Neurotransmitters Sensing Methods for Neuro-Engineering Research” MDPI, Applied Sciences 2019.
- T.Shiravand & A.Azadbakht, “Impedimetric biosensor based on bimetallic AgPt nanoparticle-decorated carbon nanotubes as highly conductive film surface”, Jour. Solid State Electrochem (2017) 21:1699–1711. [CrossRef]
- L. Martens,N. B. Kroemer, V. Teckentrup, L. Colic, N. Palomero-Gallagher, L. Meng and M. Walter “Localized Prediction of Glutamate from Whole-Brain Functional Connectivity of the Pregenual Anterior Cingulate Cortex” The Journal of Neuroscience, November 18, 2020, 40(47):9028–9042.
- L. Zhang, H. Cai, J. Pei, H. Li, L. Cao, W. Zhu, R. Dang and Y. Deng, “Simultaneous detection of multiple neurotransmitters and their metabolites in rat brain homogenates and microdialysates by LC-MS/MS”. Royal Society of Chemistry, Anal Methods 2020.
- Yangguang, A.M. Buchanan, C. E. Witt and P. Hashemi, “Frontiers in electrochemical sensors for neurotransmitter detection: towards measuring neurotransmitters as chemical diagnostics for brain disorders” Royal Society of Chemistry, Anal Methods 2019.11.2738.
- Nchouwat et al, “Simultaneous Detection and Quantification of Age-Dependent Dopamine Release”, preprint 2025. [CrossRef]
- S.K. Arumugasamy, G. Chellasamy, S. Gopi, S. Govindaraju and K. Yun, “Current advances in the detection of neurotransmitters by nanomaterials: An update,” Trends in Analytical Chemistry,2002.
- N.Desai, D. Rana, S. Salave, R. Gupta, P. Patel, B, Karunakaran,A. Sharma, G. Jyotsnendu, D. Benival and N. Kommineni, “Chitosan: A Potential Biopolymer in Drug Delivery and Biomedical Applications”, Pharmaceutics 2023, 15, 1313. [CrossRef]
- J. Ding and Y. Guo, “Recent Advances in Chitosan and its Derivatives in Cancer Treatment”, Frontiers in Pharmacology, Volume 13, Article 888740, April 2022.
- Aranaz, A. R. Alcántara, M. C. Civera, C. Arias, B. Elorza, A. H. Caballero, and N.Acosta,” Chitosan: An Overview of Its Properties and Applications, Polymers 2021, 13, 3256. [CrossRef]
- S. Naskar, S. Sharma, K. Ketousetuo “Chitosan-based nanoparticles: An overview of biomedical applications and its preparation” Journal of Drug Delivery Science and Technology 49 (2019) 66–81.
- Y. Jiang and W. Jayne, “Recent development in chitosan nanocomposites for surface-based biosensor applications” Electrophoresis 2019, 40, 2084–2097.
- X. Jin, X.Fengna , L. Deshui, Q. Wu and L.Xianfu, “The effect of the chitosan membrane properties on the enzyme adsorption and performance for the construction of horseradish peroxidase biosensors”, Carbohydrate Polymers 85 (2011) 786–791.
- D.L.Robinson, B.J. Venton, M.L. Heien and R.M. Wightman, “Detecting subsecond dopamine release with fast-scan cyclic voltammetry in vivo”, Clinical Chemistry. 49 (10):1763–73. October 2003. PMID 14500617. [CrossRef]
- M. Salimian, M. R. Sohrabi and S. Mortazavinik “Application of net analyte signal and principal component regression for rapid simultaneous determination of Levodopa and carbidopa in commercial pharmaceutical formulation and breast (human) milk sample using spectrophotometric method” Spectrochimica Acta Part A: Molecular and Biomolecular Spectroscopy 283 (2022) 121741.
- Dowek, M. Berge, P. Prognon, L. François-Xavier, E. Larquet, A. Tfayli, L. M. M. Minh and E. Caudron “Discriminative and quantitative analysis of norepinephrine and epinephrine by surface-enhanced Raman spectroscopy with gold nanoparticle suspensions” Analytical and Bioanalytical Chemistry (2022) 414:1163–1176.
- S. Jafarinejad, A. Bigdeli, M. Ghazi-Khansari, P. Sasanpour and M. R. Hormozi-Nezhad, “Identification of Catecholamine Neurotransmitters Using a Fluorescent Electronic Tongue” ACS Chem. Neurosci. 2020, 11, 25−33.
- Kallabis, P. Beyerlein, F. Lisdat “Quantitative determination of dopamine in the presence of interfering substances supported by machine learning tools” Bioelectrochemistry 157 (2024) 108667.
- S. Jafarinejad, M. Ghazi-Khansari, FGhasemi, P.Sasanpour & M. R.Hormozi-Nezhad “Colorimetric Fingerprints of Gold Nanorods for Discriminating Catecholamine Neurotransmitters in Urine Samples” Science Report 15-8- 2017.
- K.S. Siamak, N. Ouassil, S.J. Yang, and M. P. Landry, “Identifying Neural Signatures of Dopamine Signaling with Machine Learning”, ACS Chem. Neurosci. 2023, 14, 2282−2293.
- M.H.M. Facure, G. Gahramanova, D.Zhang,T. Zhang,C. E. Shuck, L.A. Mercante, D. S. Correa, Y. Gogotsi, “All-MXene electronic tongue for neurotransmitters detection”, Biosensors and Bioelectronics 262 (2024) 116526.
- Yuki Komoto et al “Time-resolved neurotransmitter detection in mouse brain tissue using an artificial intelligence-nanogap” Scientific Reports (2020) 10:11244.
- J. Kim, Y. Oh, C. Park, Y. M. Kang, H. Shin, I. Y. Kim, and Jang, “Comparison study of partial least squares regression analysis and principal component analysis in fast-scan cyclic voltammetry,” International Journal of Electrochemical Science, vol. 14, no. 7, pp. 5924–5937, 2019.
- Hoseok, H. Shin, H. U. Cho, C.D. Blaha, M. L. Heien, O. Yoonbae , K. H. Lee, and D. P. Jang,”Neurochemical Concentration Prediction Using Deep Learning vs Principal Component Regression in Fast Scan Cyclic Voltammetry: A Comparison Study” ACS Chem. Neurosci. 2022, 13, 2288−2297.
- S. Kang, Y. Jeong and Ji-Woong Choi, “Simultaneous Estimation of Tonic Dopamine and Serotonin withHigh Temporal Resolution In Vitro Using Deep Learning” 45th Annual International Conference of the IEEE Engineering,2023.
- S.Rantataro,, I.Parkkinen, M. Airavaara, & T. Laurila,”Real-time selective detection of dopamine and serotonin at nanomolar concentration from complex in vitro systems”,Biosensors and Bioelectronics 241 (2023) 115579.
- Anna Marie Buchanan et al “Serotonin as a biomarker of toxin-induced Parkinsonism” Molecular Medicine (2024) 30:33.
- Simon Bellemare-Rousseau et al “FPGA-based Prediction System for Neurotransmitter Concentration Measurement from Spectrophotometry Data” IEEE INT CONF.2020.
- Doyun Kim et al “An Automated Cell Detection Method for TH-positive Dopaminergic Neurons in a Mouse Model of Parkinson’s Disease Using Convolutional Neural Networks” Experimental Neurobiology 2023.
- Jian Lv et al “Amperometric Identification of Single Exosomes and Their Dopamine Contents Secreted by Living Cells” Anal. Chem. 2023, 95, 11273−11279.
- Andrea Di Credico et al “Machine learning identifies phenotypic profile alterations of human dopaminergic neurons exposed to bisphenols and perfluoroalkyls” Science Report (2023) 13:21907.
- Arijit Pal, Souvik Biswas, Koel Chaudhury, and Soumen Das “Paper Sensor Modified with MoS2 for Detection of Dopamine Using a Machine-Intelligent Web App Interface” ACS Appl. Mater. Interfaces 2023, 15, 43060−43074.
- S. Kapur, G. Remington, “Serotonin-dopamine interaction and its relevance to schizophrenia,” Am J. Psychiatry, vol. 153, pp.466-76, 1996.
- V. Kammarchedu and A.Ebrahimi “Advancing Electrochemical Screening of Neurotransmitters Using a Customizable Machine Learning-Based Multimodal System” Chemical and biological sensors 2023.
- Bang, Yi Luo, L. S. Barbosa, K. T. Kishida, M. R. Witcher, and P. R. Montague“Noradrenaline tracks emotional modulation of attention in human amygdala”Current Biology 33, 1–8, NOV,20,2023.
- Sajeet et al “A Machine Learning Approach for Simultaneous Electrochemical Detection of Dopamine and Serotonin in an Optimized Carbon Thread-based Miniaturized Device” IEEE Sensor Journal Apr, 17, 2024.
- 55. Abhinav Goyal et al “Resolution of tonic concentrations of highly similar neurotransmitters using voltammetry and deep learning”, Molecular Psychiatry, 2024. [CrossRef]
- K. Unger, J.P. Keller, M. Altermatt, V. Gradinaru, L.L. Looger and L.Tian, “Directed Evolution of a Selective and Sensitive Serotonin Sensor via Machine Learning”, Cell 183, 1986–2002, December 23, 2020.
- C.S. Movassaghi, K. A. Perrotta, H.Yang, R.Iyer, X. Cheng, M. Dagher, M. A.Fillol and A. M. Andrews, “Simultaneous serotonin and dopamine monitoring across timescales by rapid pulse voltammetry with partial least squares regression”, Analytical and Bioanalytical Chemistry (2021) 413:6747–6767.
- Zhang, S. Shailja, C. Borba, Y. Miao, M.Goebel, R.Ruschel, K. Ryan, W. Smith, and B. S. Manjunath, “Automatic classification and neurotransmitter prediction of synapses in electron microscopy”, Biological Imaging (2022), 2: e6.
- G.H. G. Matsushita, C. da Cunha and A.Sugi, “Automatic Identification of Phasic Dopamine Release”, 25th International Conference on Systems, Signals and Image Processing (IWSSIP), 2018.
- G.H.G. Matsushita, A.H. Sugi, Y. M.G. Costa, A.Gomez-A,C.Da Cunha, and L. S. Oliveira, “Phasic dopamine release identification using convolutional neural network” Computers in Biology and Medicine 114 (2019) 103466.
- Y. Xue, J.Wenliang, Y. Jiang, y. Ping, and L.Mao, “Deep Learning for Voltammetric Sensing in a Living Animal Brain”, Angew. Chem. Int. Ed. 2021, 60, 23777 – 23783.
- Chun-Hung Chang, L. Chieh-Hsin and L. Hsien-Yuan “Machine Learning and Novel Biomarkers for the Diagnosis of Alzheimer’s Disease” MDPI, Int. J. Mol. Sci. 2021, 22, 2761.
- Stepen et al, “At home adaptive dual target deep brain stimulation in Parkinson’s disease with proportional control”, Brain, Volume 147, Issue 3, March 2024, Pages 911–922,.
- Satoka H. Fujimoto1 et al “Deep brain stimulation induces white matter remodeling and functional changes to brain-wide networks”.
- D.M Herz, M.J Frank, H. Tan and S. Groppa “Subthalamic control of impulsive actions: insights from 3 deep brain stimulation in Parkinson’s disease”, Brain, awae184. [CrossRef]
- Izabely de dos Reis Paula et al “Deep brain stimulation of the subthalamic nucleus under general anesthesia versus local anesthesia in the treatment of Parkinson’s disease: a meta-analysis of randomized clinical trials”, Neurosurgical Review (2024) 47:346.
- K.A. Johnson, M.S. Okun, K.W. Scangos, H.S. Mayberg and C. de Hemptinne, “Deep brain stimulation for refractory major depressive disorder: a comprehensive review”, Molecular Psychiatry (2024) 29:1075–1087. [CrossRef]
- Alik S. Widge, “Closing the loop in psychiatric deep brain stimulation: physiology, psychometrics, and plasticity”, Neuropsychopharmacology (2024) 49:138–149. [CrossRef]
- Nanditha Rajamani et al “Deep brain stimulation of symptom-specific networks in Parkinson’s disease”, Nature Communications | (2024) 15:4662.
- B. Davidson, L. Milosevic, L. Kondrataviciute, L. V. Kalia and S. K. Kalia,” Neuroscience fundamentals relevant to neuromodulation: Neurobiology of deep brain stimulation in Parkinson's disease”, Neurotherapeutics 21 (2024) e00348.
- Chudzik, A.Sledzianowski and A. W. Przybyszewski, “Machine Learning and Digital Biomarkers Can Detect Early Stages of Neurodegenerative Diseases” Sensors 2024, 24, 1572. [CrossRef]
- Nishanth Gopinath “Artificial intelligence and neuroscience: An update on fascinating relationships”, Process Biochemistry 125 (2023) 113–120.
- Z.Zhou , Tailin Xu and X. Zhang, “Empowerment of AI algorithms in biochemical sensors”, Trends in Analytical Chemistry 173 (2024) 117613.
- C.Rivera, J. J. Swerdlow, R. L. Summerscales,P. P. T. Uppala,R. M. Filho, M. R. C. Neto and H. J. Kwon, “Data-Driven Modeling of Smartphone-Based Electrochemiluminescence Sensor Data Using Artificial Intelligence”, Sensors 2020, 20, 625. [CrossRef]
- Y.Yang, F. Xu, J.Chen, C. Tao, Y. Li, Q. Chen, S. Tang, H. K. Lee and W. Shen, “Artificial intelligence-assisted smartphone-based sensing for bioanalytical applications: A review”, Biosensors and Bioelectronics 229 (2023) 115233.
- P.Puthongkham, S.Wirojsaengthonga and A.Suea-Ngamd, “Machine learning and chemometrics for electrochemical sensors: moving forward to the future of analytical chemistry”, Analyst, 2021, 146, 6351.
- B. Kitchenham and S. Charters, ‘‘Guidelines for performing systematic literature reviews in software engineering,’ School Comput. Sci. Math., Keele Univ., Keele, U.K., Tech. Rep. EBSE-2007-01, 2007.
- B. Kitchenham, ‘‘Procedures for performing systematic reviews,’ Dept. Comput. Sci., Keele Univ., Keele, U.K., Tech. Rep. 0400011T.1, 2004, pp. 1–26, vol. 33.
- R. M. Wightman, L.J. May and A.C. Michael,” Detection of dopamine dynamics in the brain” ANALYTICAL CHEMISTRY, VOL. 60, NO. 13, JULY 1, 1988 • 769 A.
- Y. Wang, Y.Li, L.Tang, J.Lu and J.Li,” Application of graphene-modified electrode for selective detection of dopamine”, Electrochemistry Communications 11 (2009) 889–892.
- M. Sajid, N. Baig, and K. Alhooshani,” Chemically modified electrodes for electrochemical detection of dopamine: Challenges and opportunities”, Trends in Analytical Chemistry 118 (2019) 368e385.
- P.A. Rasheed and Jae-Seung Lee, “Recent advances in optical detection of dopamine using nanomaterials”, Microchim Acta (2017) 184:1239–1266.
- Y.R.Kima, S.Bonga, Y.Kanga, Y.Yanga, R. K. Mahajanb, J.S. Kimc and H. Kima, “Electrochemical detection of dopamine in the presence of ascorbic acid using graphene modified electrodes”, Biosensors and Bioelectronics 25 (2010) 2366–2369.
- X.Liu, and J.Liu, “Biosensors and sensors for dopamine detection”, VIEW. 2021;2:20200102.
- J. Stewart, J. Hendry, and L. Dennany, “Whole Blood Electrochemiluminescent Detection of Dopamine”, Anal. Chem. 2015, 87, 11847−11853.
- L. Wu, L. Feng, J. Ren and X. Qu,” Electrochemical detection of dopamine using porphyrin-functionalized graphene”, Biosensors and Bioelectronics 34 (2012) 57–62.
- 87. X.Zhang,X.Chen, S. Kai, H. Wang, J. Yang, F.Wu and Z. Chen, “Highly Sensitive and Selective Detection of Dopamine Using One-Pot Synthesized Highly Photoluminescent Silicon Nanoparticles”, Anal. Chem. 2015, 87, 3360−3365.
- J.Zhao, L.Zhao, C. Lan, and S. Zhao, “Graphene quantum dots as effective probes for label-free fluorescence detection of dopamine”, Sensors and Actuators B 223 (2016) 246–251.
- Jaekyung Kim et al “Automatic and Reliable Quantification of Tonic Dopamine Concentrations In Vivo Using a Novel Probabilistic Inference Method”, ACS Omega 2021, 6, 6607−6613.
- .
- K. E. Dunham1 and B. J. Venton, “Electrochemical and biosensor techniques to monitor neurotransmitter changes with depression”, Analytical and Bioanalytical Chemistry (2024) 416:2301–2318.
- K. J. Ressler and C.B. Nemeroff, “The Role of Serotonergic and Noradrenergic Systems in Depression and Anxiety Disorder,” Depr. Anxi., vol. 12 (Suppl 1), pp.2-19, 2000.
- Niyonambaza S.D., Kumar P., Xing P., Mathault J., De Koninck P., Boisselier E., Boukadoum M., Miled A. “A Review of Neurotransmitters Sensing Methods for Neuro-Engineering Research” Appl. Sci. 2019; 9:4719.
- Linan-Rico A., Ochoa-Cortes F., Beyder A., Soghomonyan S., Zuleta-Alarcon A., Coppola V., Christofi F.L. Mechanosensory Signaling in Enterochromaffin Cells and 5-HT Release: Potential Implications for Gut Inflammation. Front. Neurosci. 2016;10:564. [CrossRef]
- Camilleri M. Serotonin in the gastrointestinal tract. Curr. Opin. Endocrinol. Diabetes Obes. 2009;16:53–59. [CrossRef]
- Reigstad C.S., Salmonson C.E., Rainey J.F., III, Szurszewski J.H., Linden D.R., Sonnenburg J.L., Farrugia G., Kashyap P.C. Gut microbes promote colonic serotonin production through an effect of short-chain fatty acids on enterochromaffin cells. FASEB J. 2015;29:1395–1403. [CrossRef]
- Murley A.G., Rowe J.B. Neurotransmitter deficits from frontotemporal lobar degeneration. Brain. 2018;141:1263–1285. [CrossRef]
- Iovino L., Tremblay M.E., Civiero L. Glutamate-induced excitotoxicity in Parkinson’s disease: The role of glial cells. J. Pharmacol. Sci. 2020;144:151–164. [CrossRef]
- Le Gall L., Anakor E., Connolly O., Vijayakumar U.G., Duddy W.J., Duguez S. Molecular and Cellular Mechanisms Affected in ALS. J. Pers. Med. 2020;10:101. [CrossRef]
- Strandwitz P. Neurotransmitter modulation by the gut microbiota. Brain Res. 2018;1693:128–133. [CrossRef]
- Koshal P., Jamwal S., Kumar P. Glucagon-like Peptide-1 (GLP-1) and neurotransmitters signaling in epilepsy: An insight review. Neuropharmacology. 2018;136:271–279. [CrossRef]
- W. Song, L. S. Seung, M. Savini, L. Popp, L. C.Vicki and L. Segatori “ Ceria Nanoparticles Stabilized by Organic Surface Coatings Activate the Lysosome-Autophagy System and Enhance Autophagic Clearance” American Chemical Society,2014.
- S. Boonkaew, A. Dettlaff, M.Sobaszek, R. Bogdanowicz, M. Jönsson-Niedziółka,” Electrochemical determination of neurotransmitter serotonin using boron/nitrogen co-doped diamond-graphene nanowall-structured particles”, Journal of Electroanalytical Chemistry 926 (2022) 116938.
- N. Alyamni, J. L. Abot and A. G. Zestos, “Advances in Voltammetric Methods for the Measurement of Biomolecules” ECS Sens. Plus 3 027001: 2024. [CrossRef]
- S.Bindra and· R. Jain,” Artificial intelligence in medical science: a review”, Irish Journal of Medical Science (1971 -) (2024) 193:1419–1429.
- H.A. Younis, , T. A. E.Eisa,, M.Nasser,T.M.Sahib,A.A. Noor,O. M. Alyasiri, S. Salisu, I.M. Hayder, and H. A. Younis,” A Systematic Review and Meta-Analysis of Artificial Intelligence Tools in Medicine and Healthcare: Applications, Considerations, Limitations, Motivation and Challenges”, Diagnostics 2024, 14, 109. [CrossRef]
- Grzybowski, K. Jin and W. Hongkang Wu, “Challenges of artificial intelligence in medicine and dermatology” Clinics in Dermatology (2024) 42, 210–215.
- Morris Gordon et al “A scoping review of artificial intelligence in medical education: BEME Guide No. 84”, MEDICAL TEACHER 2024, VOL. 46, NO. 4, 446–470.
- 2021; 109. Bo Yin,, Hong Lin Zhai, Bing Qiang Zhao, Ke Xin Bi, Jia Ying Mi, “Chemometrics-assisted simultaneous voltammetric determination of multiple neurotransmitters in human serum”, Bioelectrochemistry 139 (2021) 107739.
- T. W. Bernklau, B. Righetti, L. S. Mehrke, and S. N. Jacob,” Striatal dopamine signals reflect perceived cue–action–outcome associations in mice”, Nature Neuroscience, 10 Jan, 2024. [CrossRef]
- Nchouwat et al “Pattern Recognition ofNeurotransmitters: Complexity Reduction for Serotonin and Dopamine”,Biosensors 2025, 15(4), 209. [CrossRef]
- Im-Fong Ip, Yi-Shan Wang, and Chia-Chen Chang, “Aptamer-based detection of serotonin based on the rapid in situ synthesis of colorimetric gold nanoparticles,” Nanotechnology Reviews 2023; 12: 20220514.
- M. Dagher, Ka.A. Perrotta, S. A. Erwin, A. Hachisuka, R. Iyer, S.C. Masmanidis, H.Yang, and A. M. Andrews,” Optogenetic Stimulation of Midbrain Dopamine Neurons Produces Striatal Serotonin Release,” ACS Chem. Neurosci. 2022, 13, 946−958.
- P.Lachance, D. Gauvreau, É. Boisselier, M.Boukadoum and A. Miled, “Breaking Barriers: Exploring Neurotransmitters through In Vivo vs. In Vitro Rivalry”, Sensors 2024, 24, 647. [CrossRef]
- Tan Kian Hua, “ A Short Review on Machine Learning” Authorea,Oct 04,2022.
- .
- J. Apon, Md. S. Abid, K. A. Morshed, M. M. Nishat, F. Faisal &N.N. I. Moubarak,” Power System Harmonics Estimation using Hybrid Archimedes Optimization Algorithm-based Least Square method,” 13th ICTS, Oct 2021.
- M.R Kabir, M.M Muhaimin, M.A Mahir, M.M Nishat, F. Faisal &N.N.I. Moubarak,” Procuring MFCCs from Crema-D Dataset for Sentiment Analysis using Deep Learning Models with Hyperparameter Tuning,” IEEE, RAAICON, Dec 2021.
- A.A Rahman, M.I Siraji, L.I Khalid, F. Faisal, M.M Nishat, M.R Islam,N.N.I Moubarak, “Detection of Mental State from EEG Signal Data: An Investigation with Machine Learning Classifiers,” 14th Int, Conf, KST, Jan 2022.
- N.N.I Moubarak, N.M.M Omar, VN Youssef, “Smartphone-sensor-based human activities classification for forensics: a machine learning approach” Journal of Electrical Systems and Information Technology 11 (1), 33.
- S. Battaglia, C. Nazzi and J. F. Thayer, “Genetic differences associated with dopamine and serotonin release mediate fear-induced bradycardia in the human brain” Translational Psychiatry (2024) 14:24. [CrossRef]
- F. S. Manciu, M. Manciu, J.D. Ciubuc, E.M. Sundin,K. Ochoa,M. Eastman, W. G. Durrer, J.Guerrero, B.Lopez, M. Subedi and K.E. Bennet,” Simultaneous Detection of Dopamine and Serotonin—A Comparative Experimental and Theoretical Study of Neurotransmitter Interactions” Biosensors 2019, 9, 3. [CrossRef]
- Jahangiri, H. A. Rakha, “Applying machine learning techniques to transportation mode recognition using mobile phone sensor data,” IEEE transactions on intelligent transportation systems ,2406/2417, 16 -May,2015.
- https://www.parkinson.org/understanding-parkinsons/statistics?utm_source=google&utm_medium=adgrant&utm_campaign=Info&utm_term=parkinson%27s%20statistics&gad_source=1&gclid=Cj0KCQjw2ou2BhCCARIsANAwM2HRDW60Eer6uiH8VlfM4apLoohXrzhLcsfi_BqRmUOzK-De0RVNjOUaAgVEEALw_wcB.
- M. Parastarfeizabadi and A. Z. Kouzani,”Advances in closed-loop deep brain stimulation devices”,Journal of NeuroEngineering and Rehabilitation (2017) 14:79.
- W. Bouthour , P. Mégevand , J.Donoghue, C.Lüscher,and N. Birbaumer and P. Krack.”Biomarkers for closed-loop deep brain stimulation in Parkinson disease and beyond”Nature Review Neurology. 2019 Jun;15(6):343-352. [CrossRef]
Figure 3.
Publication trend using AI for estimating NTs from 2009 to May 2025.
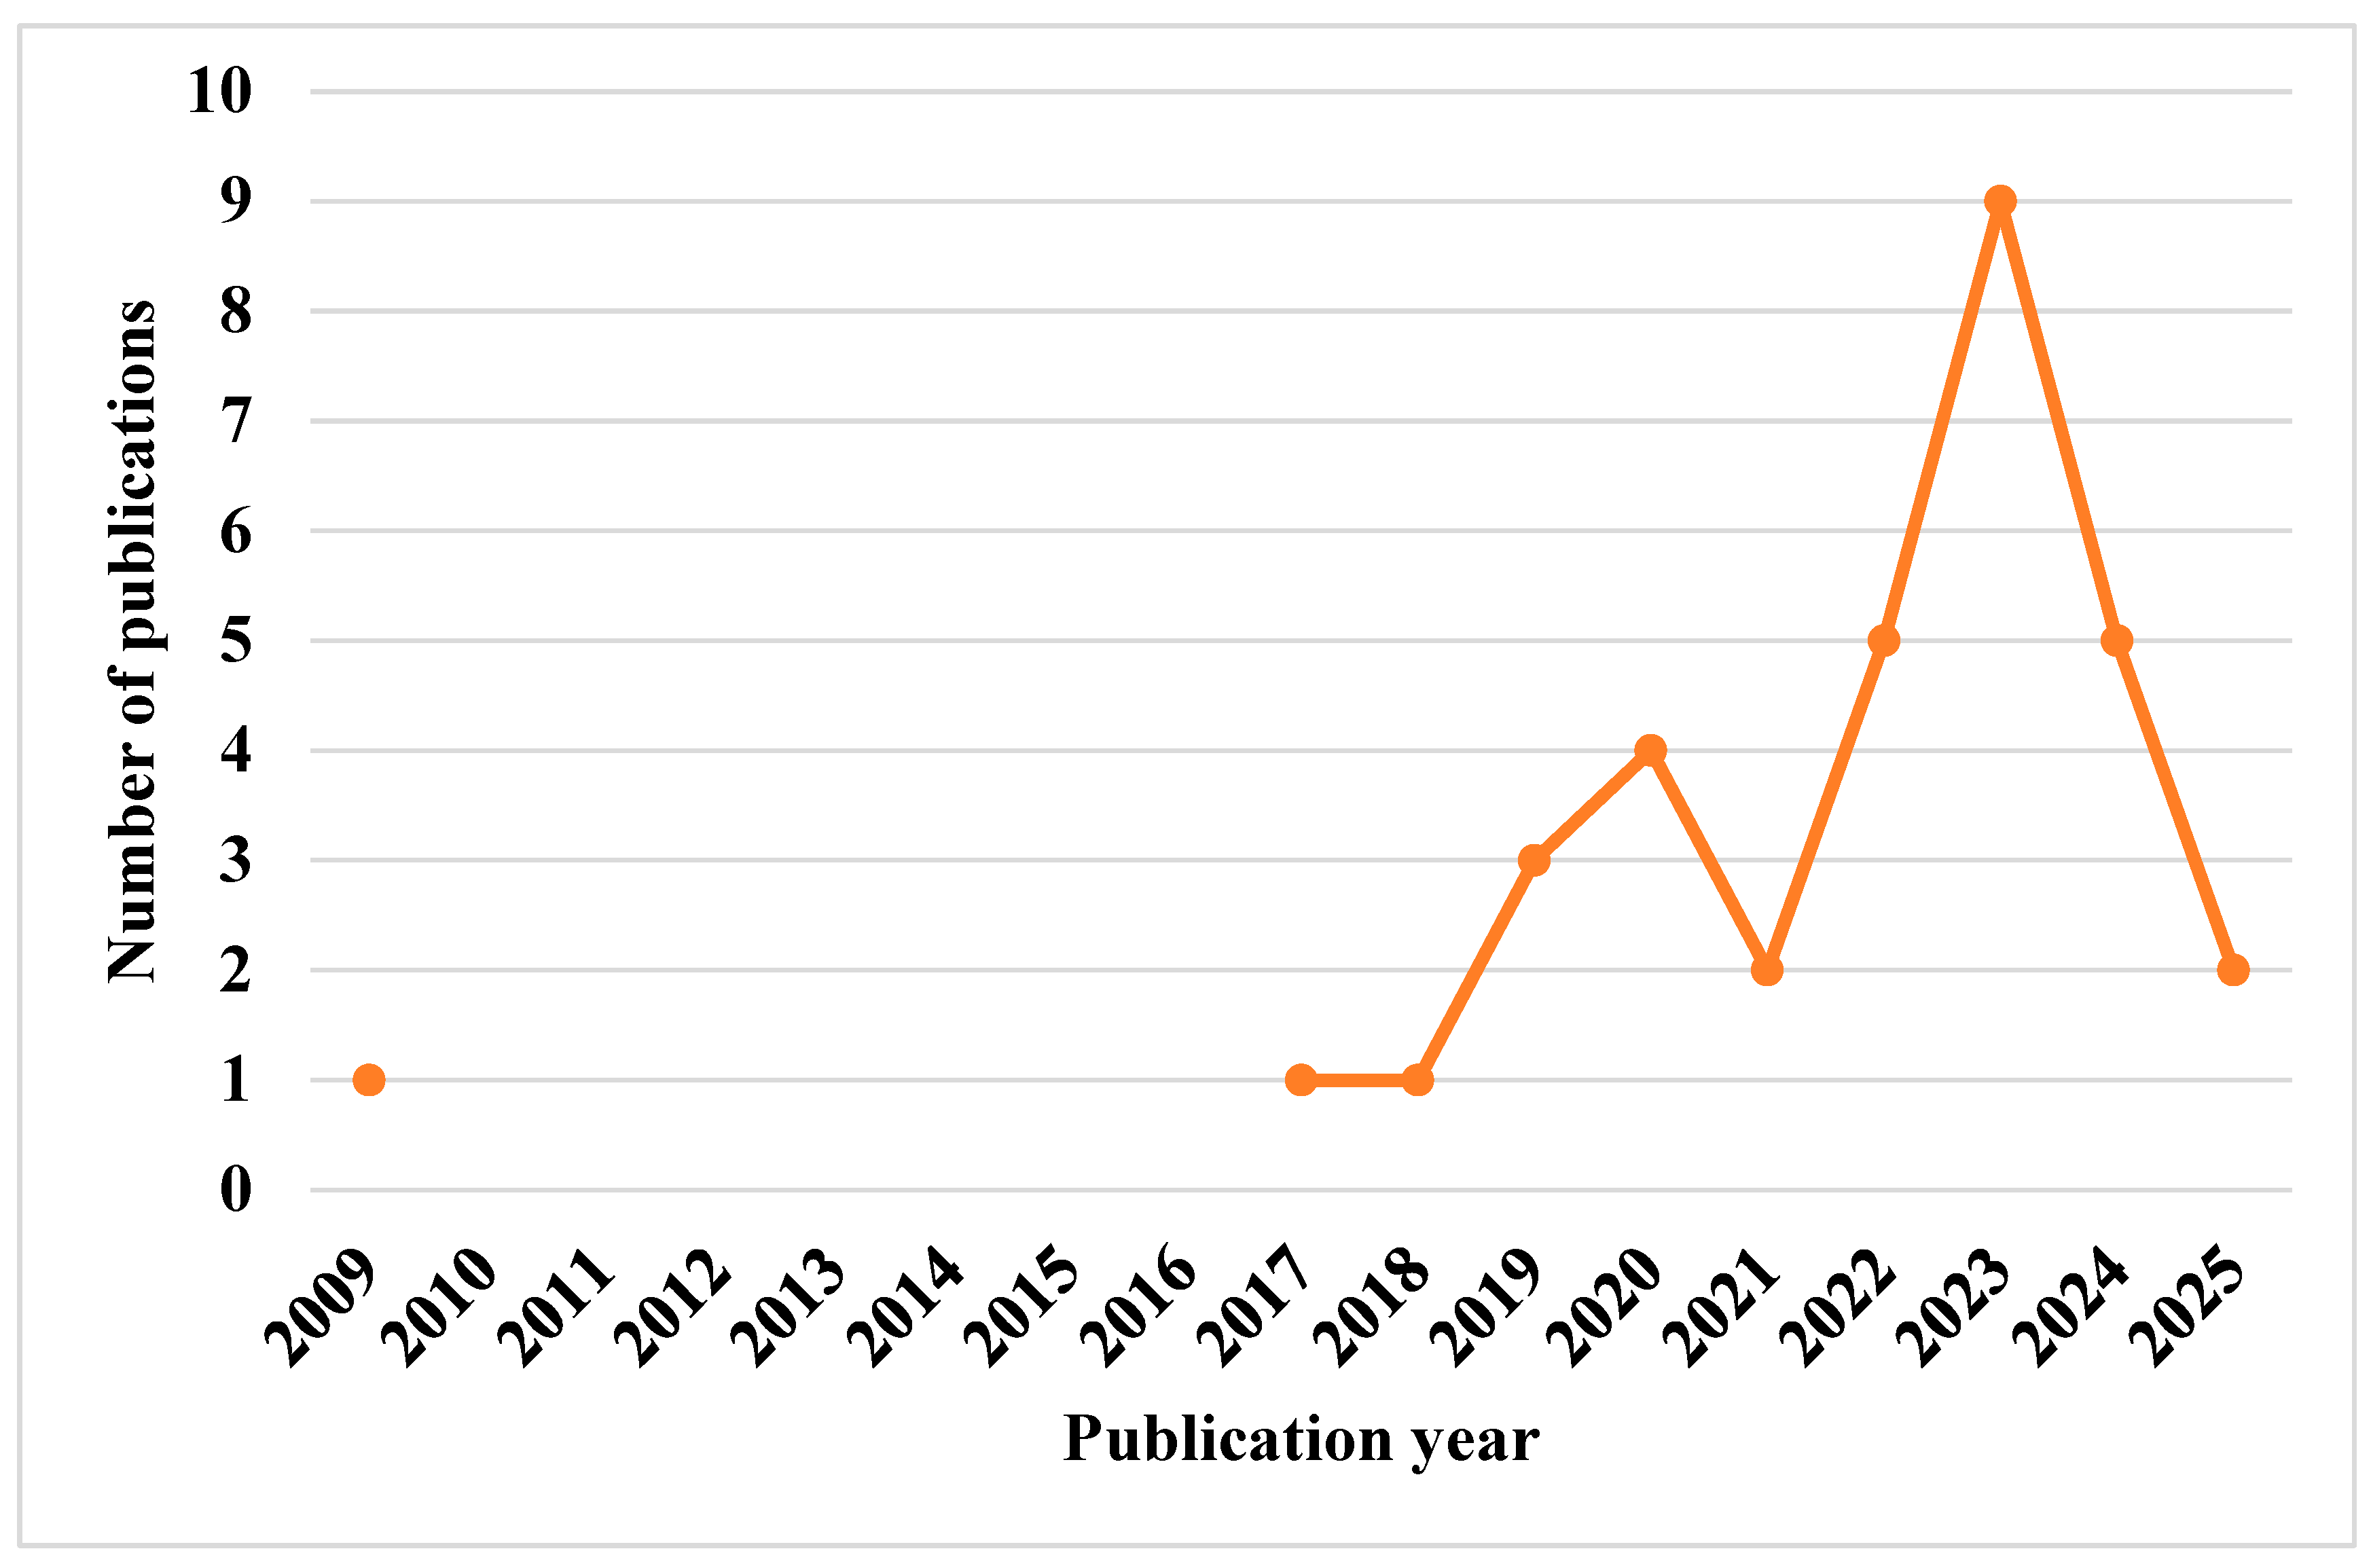
Figure 6.
Voltammograms recorded for 40 μM DA, 40 μM ascorbic acid (AA) and a mixture containing 40 μM DA and 40 μM AA using conventional glassy carbon electrodes with bare surfaces (without the incorporation of nanoparticles or bio-enzymes). The oxidation peak currents for all three solutions appear at approximately the same potential (~0.14 V), which can be attributed to the structural similarity between AA and DA, resulting in overlapping electrochemical behavior. However, the peak current of the mixed solution is significantly amplified compared to either individual species, indicating a non-linear response that does not correspond to the peak current response of pure DA or AA.
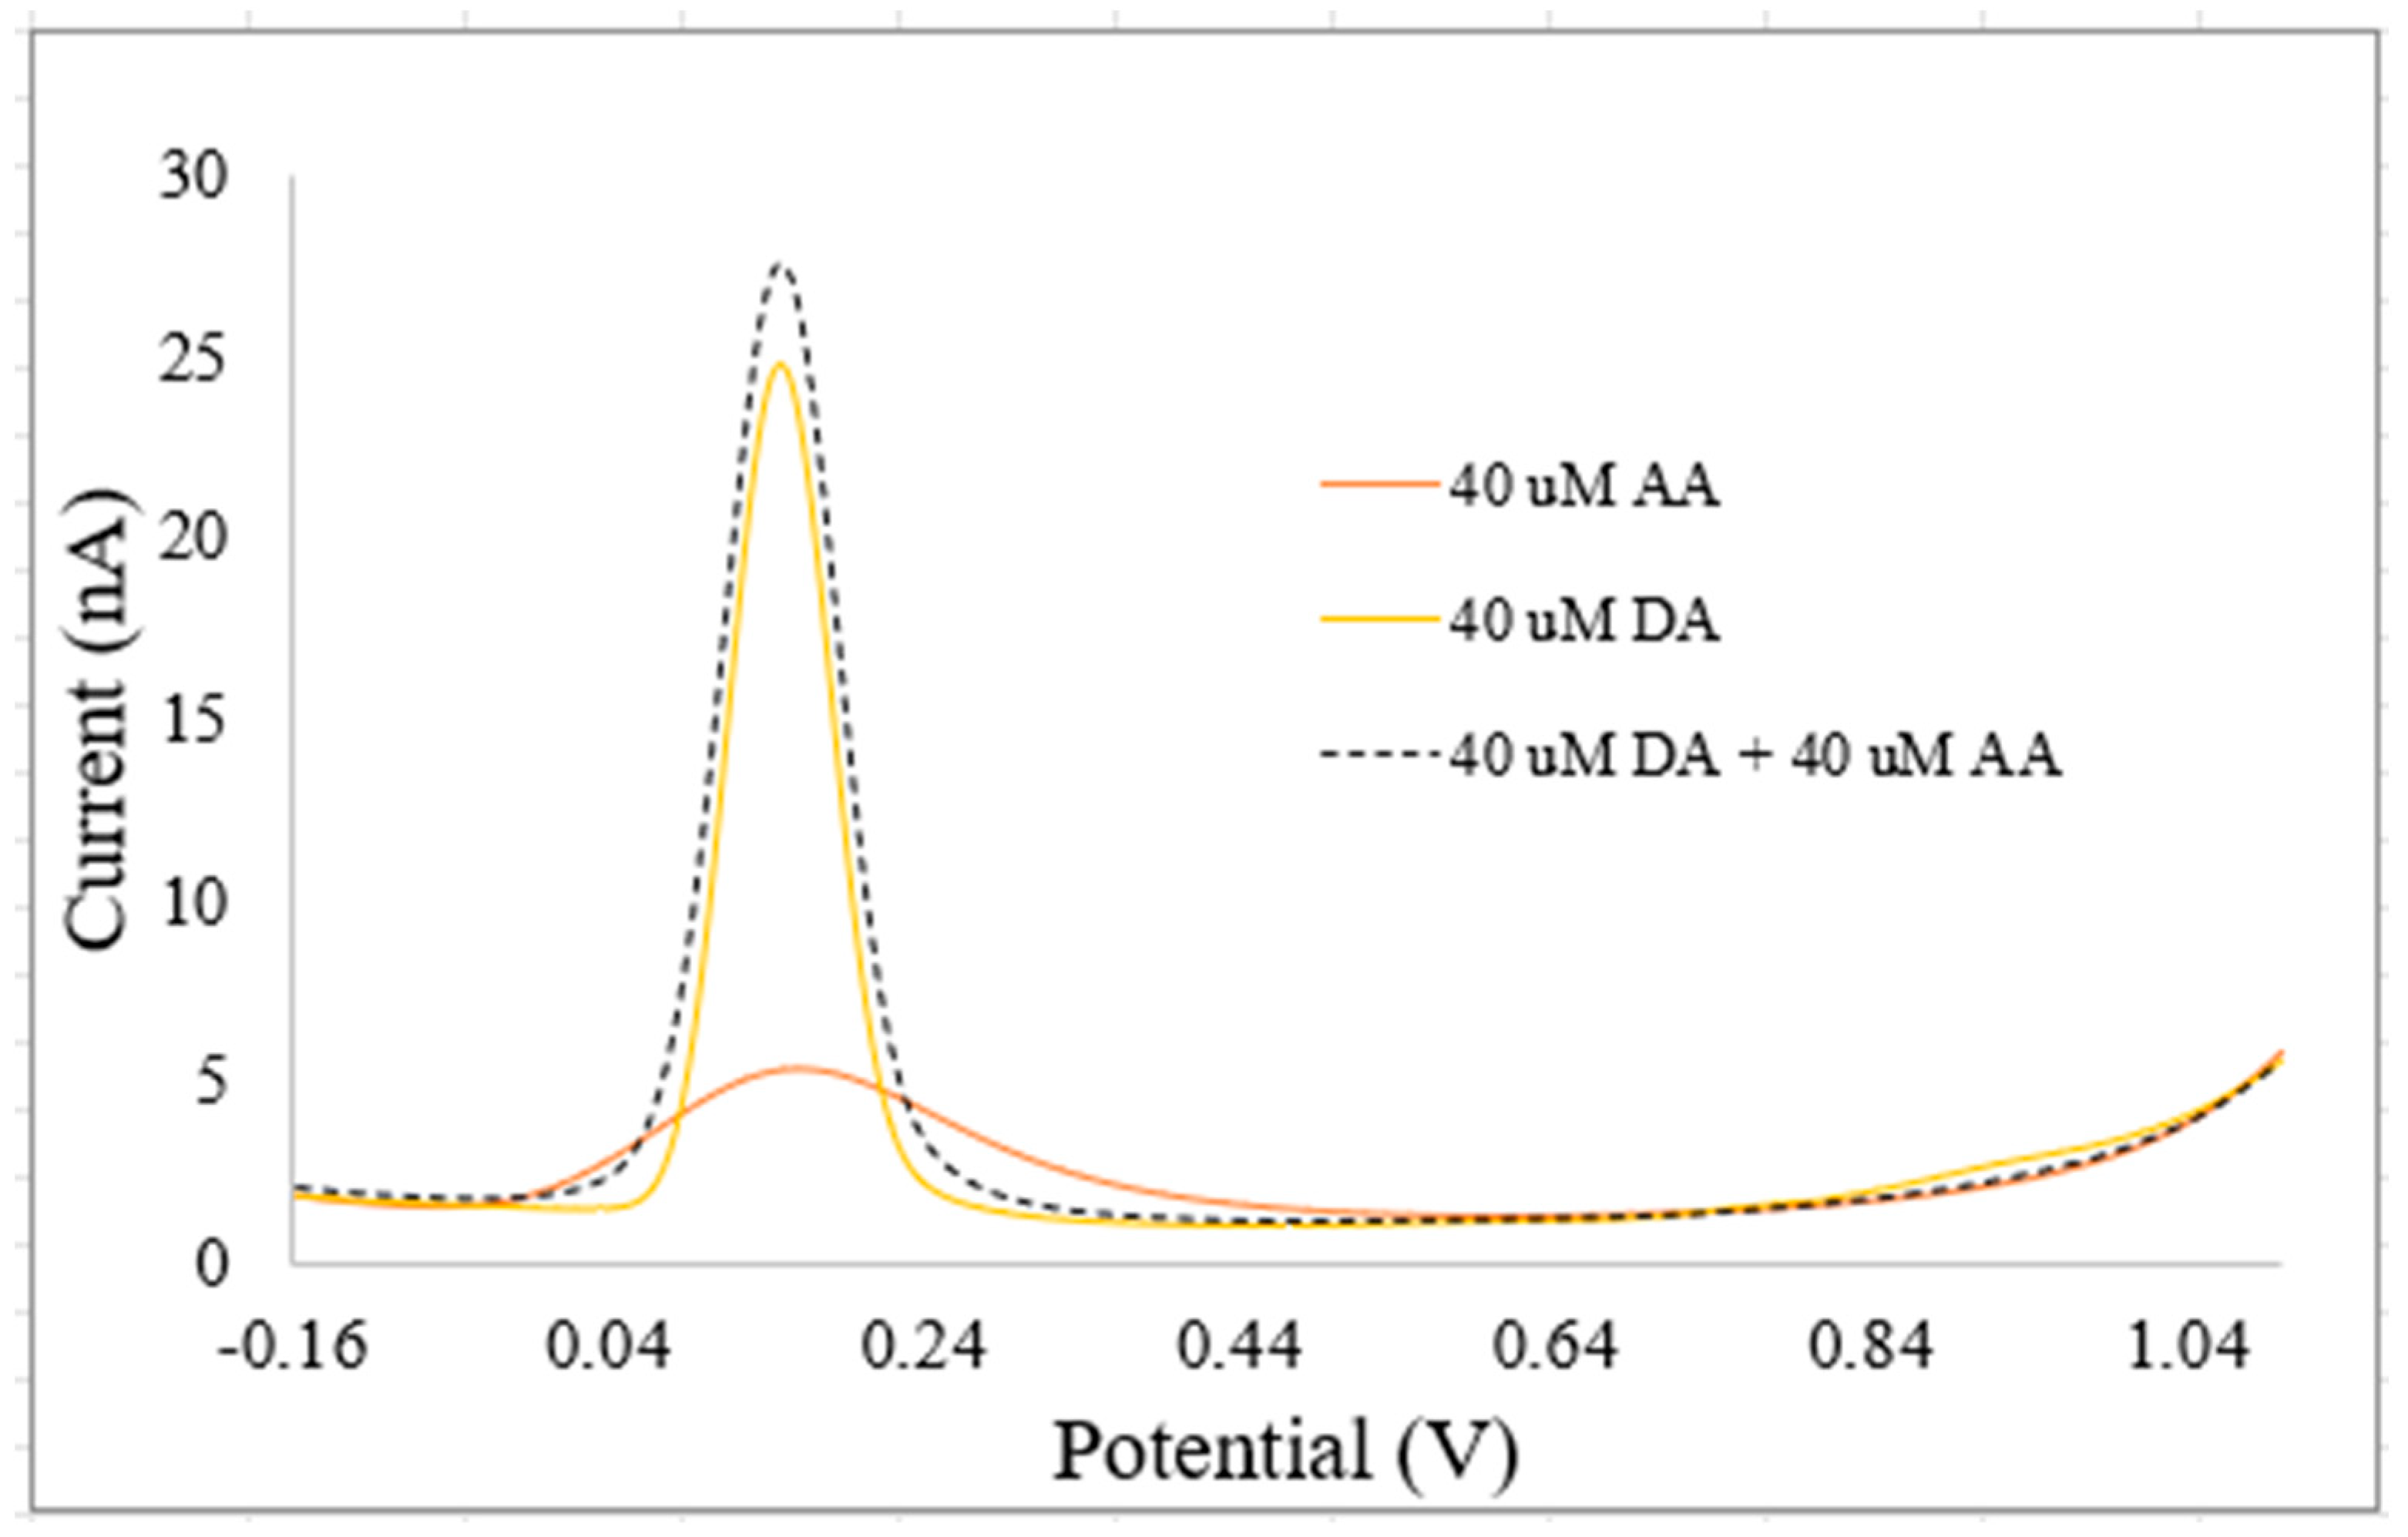
Figure 7.
Frequency for application of voltammetric techniques in NT detection and quantification. Abbreviations are defined in Table 5.
Figure 7.
Frequency for application of voltammetric techniques in NT detection and quantification. Abbreviations are defined in Table 5.
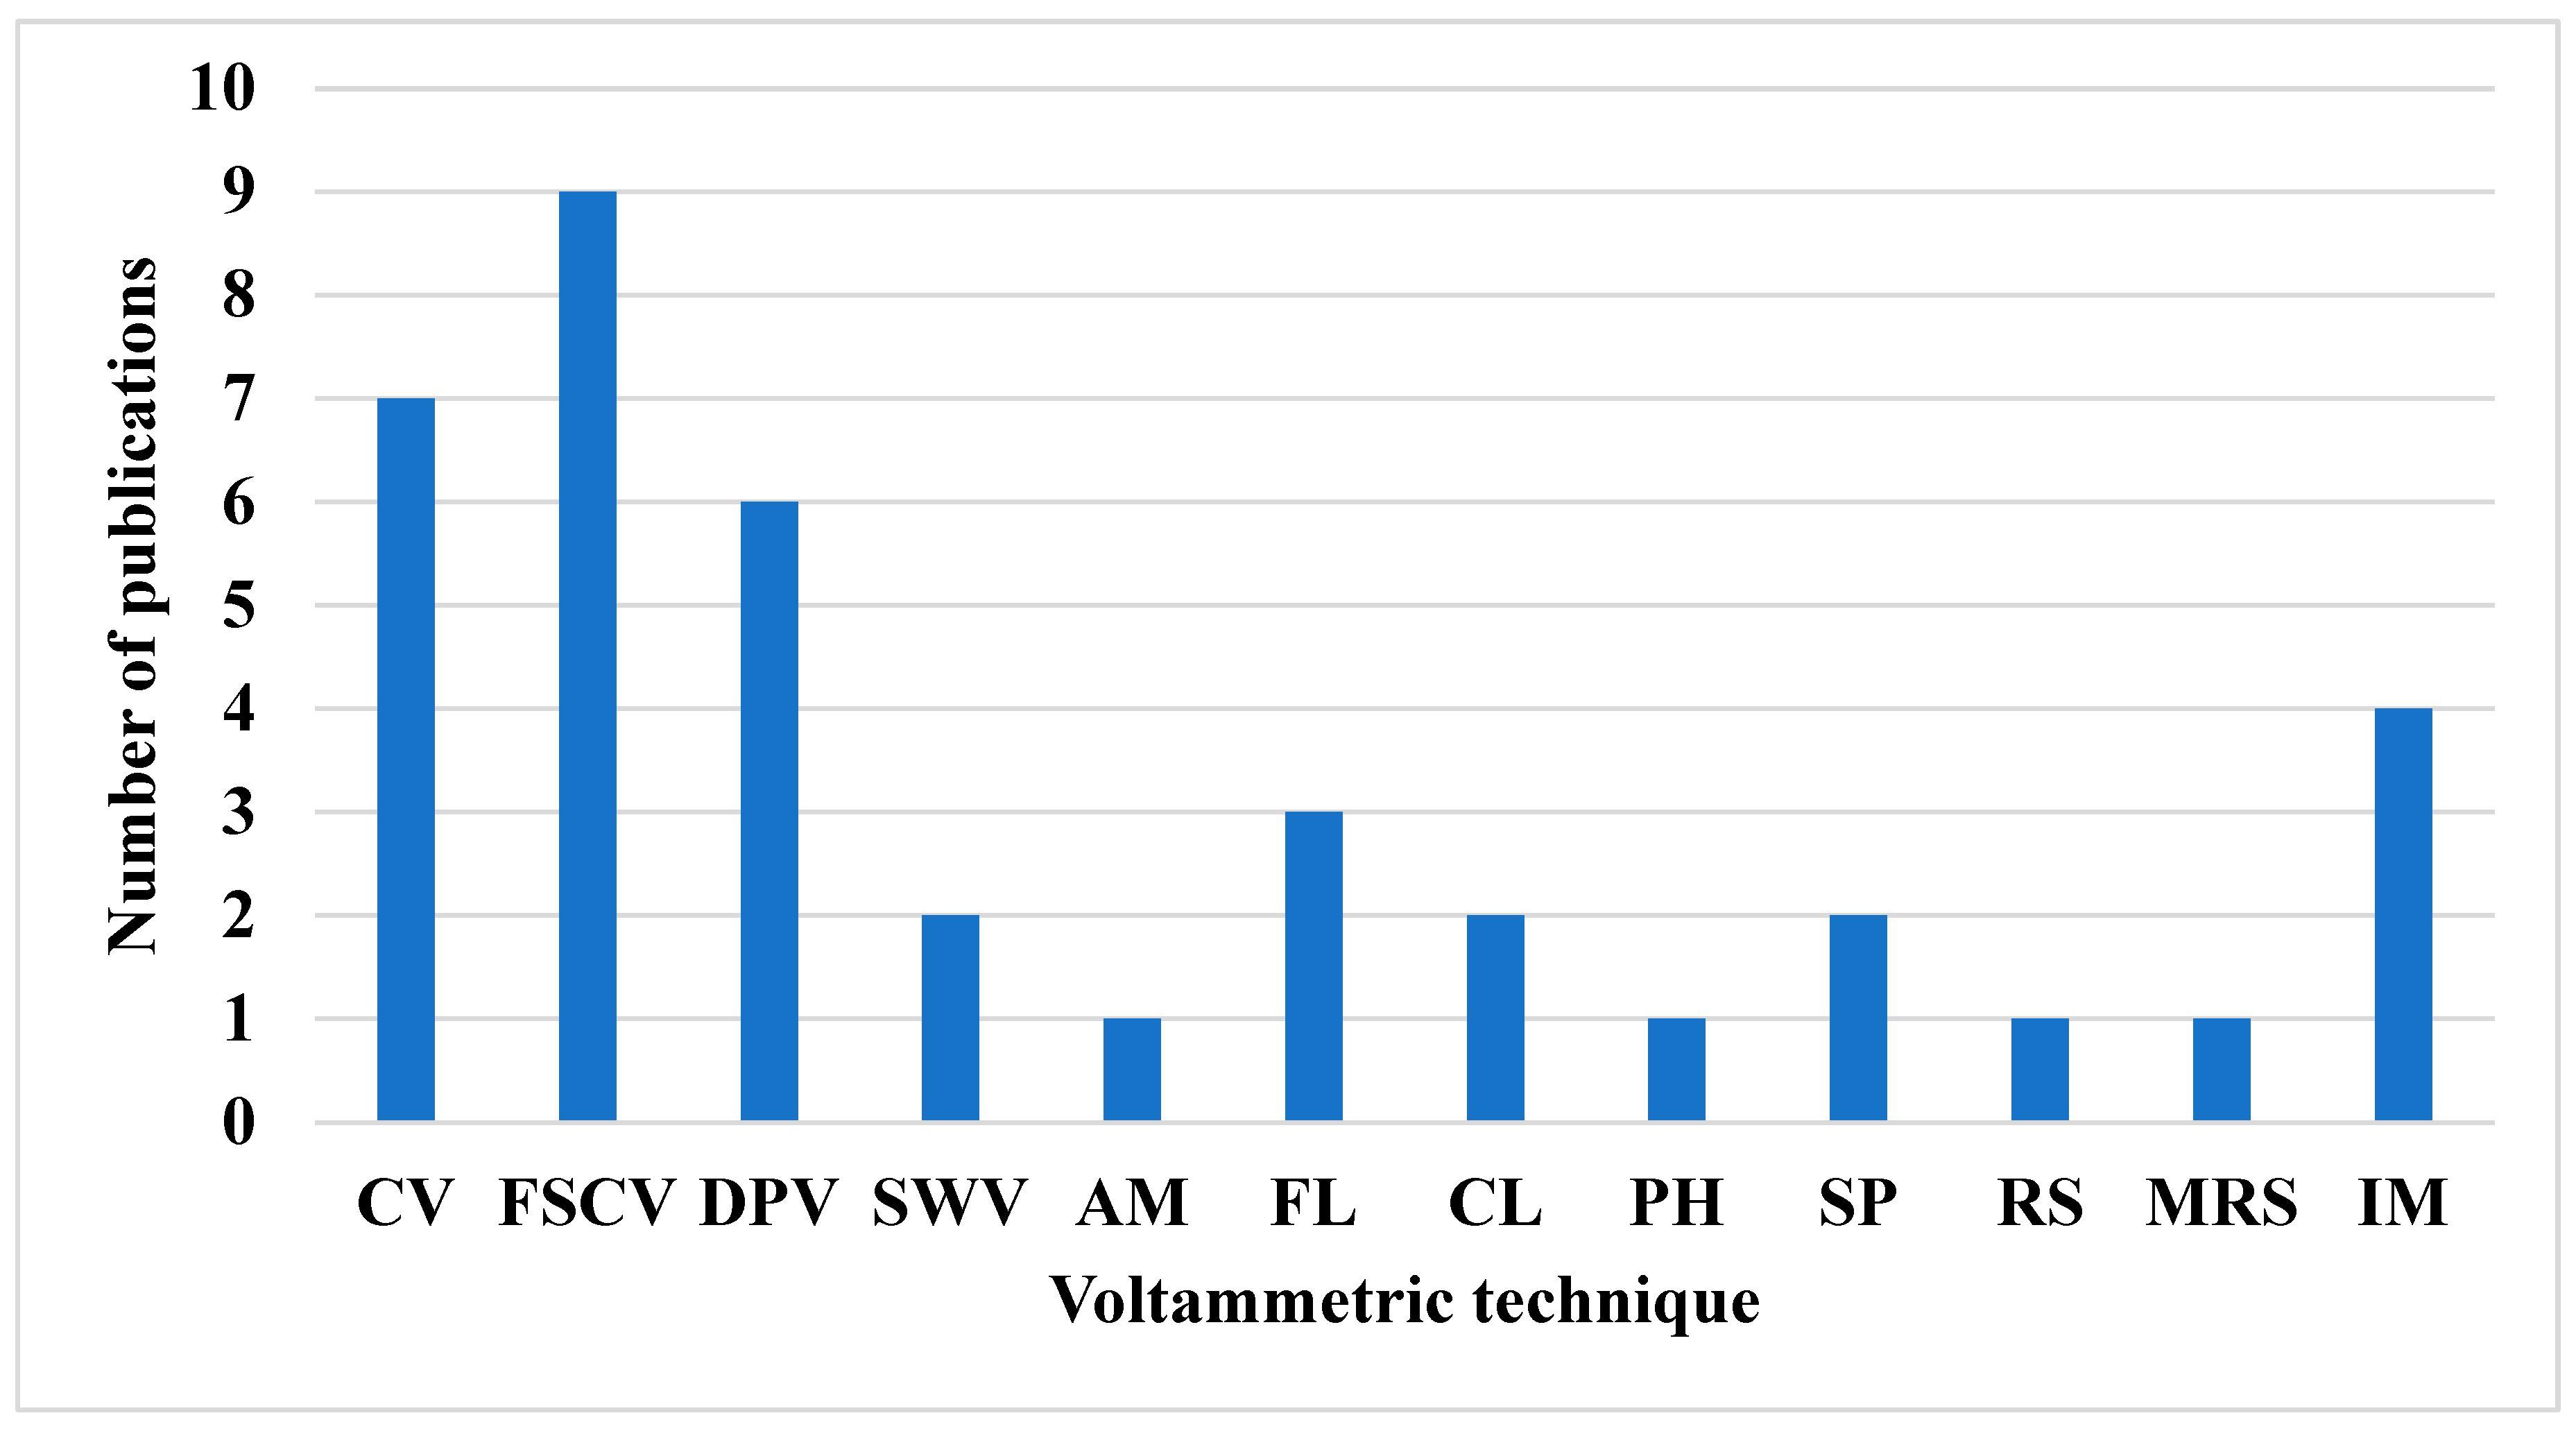
Figure 8.
Proportions of the constitutive parts of AI with examples.
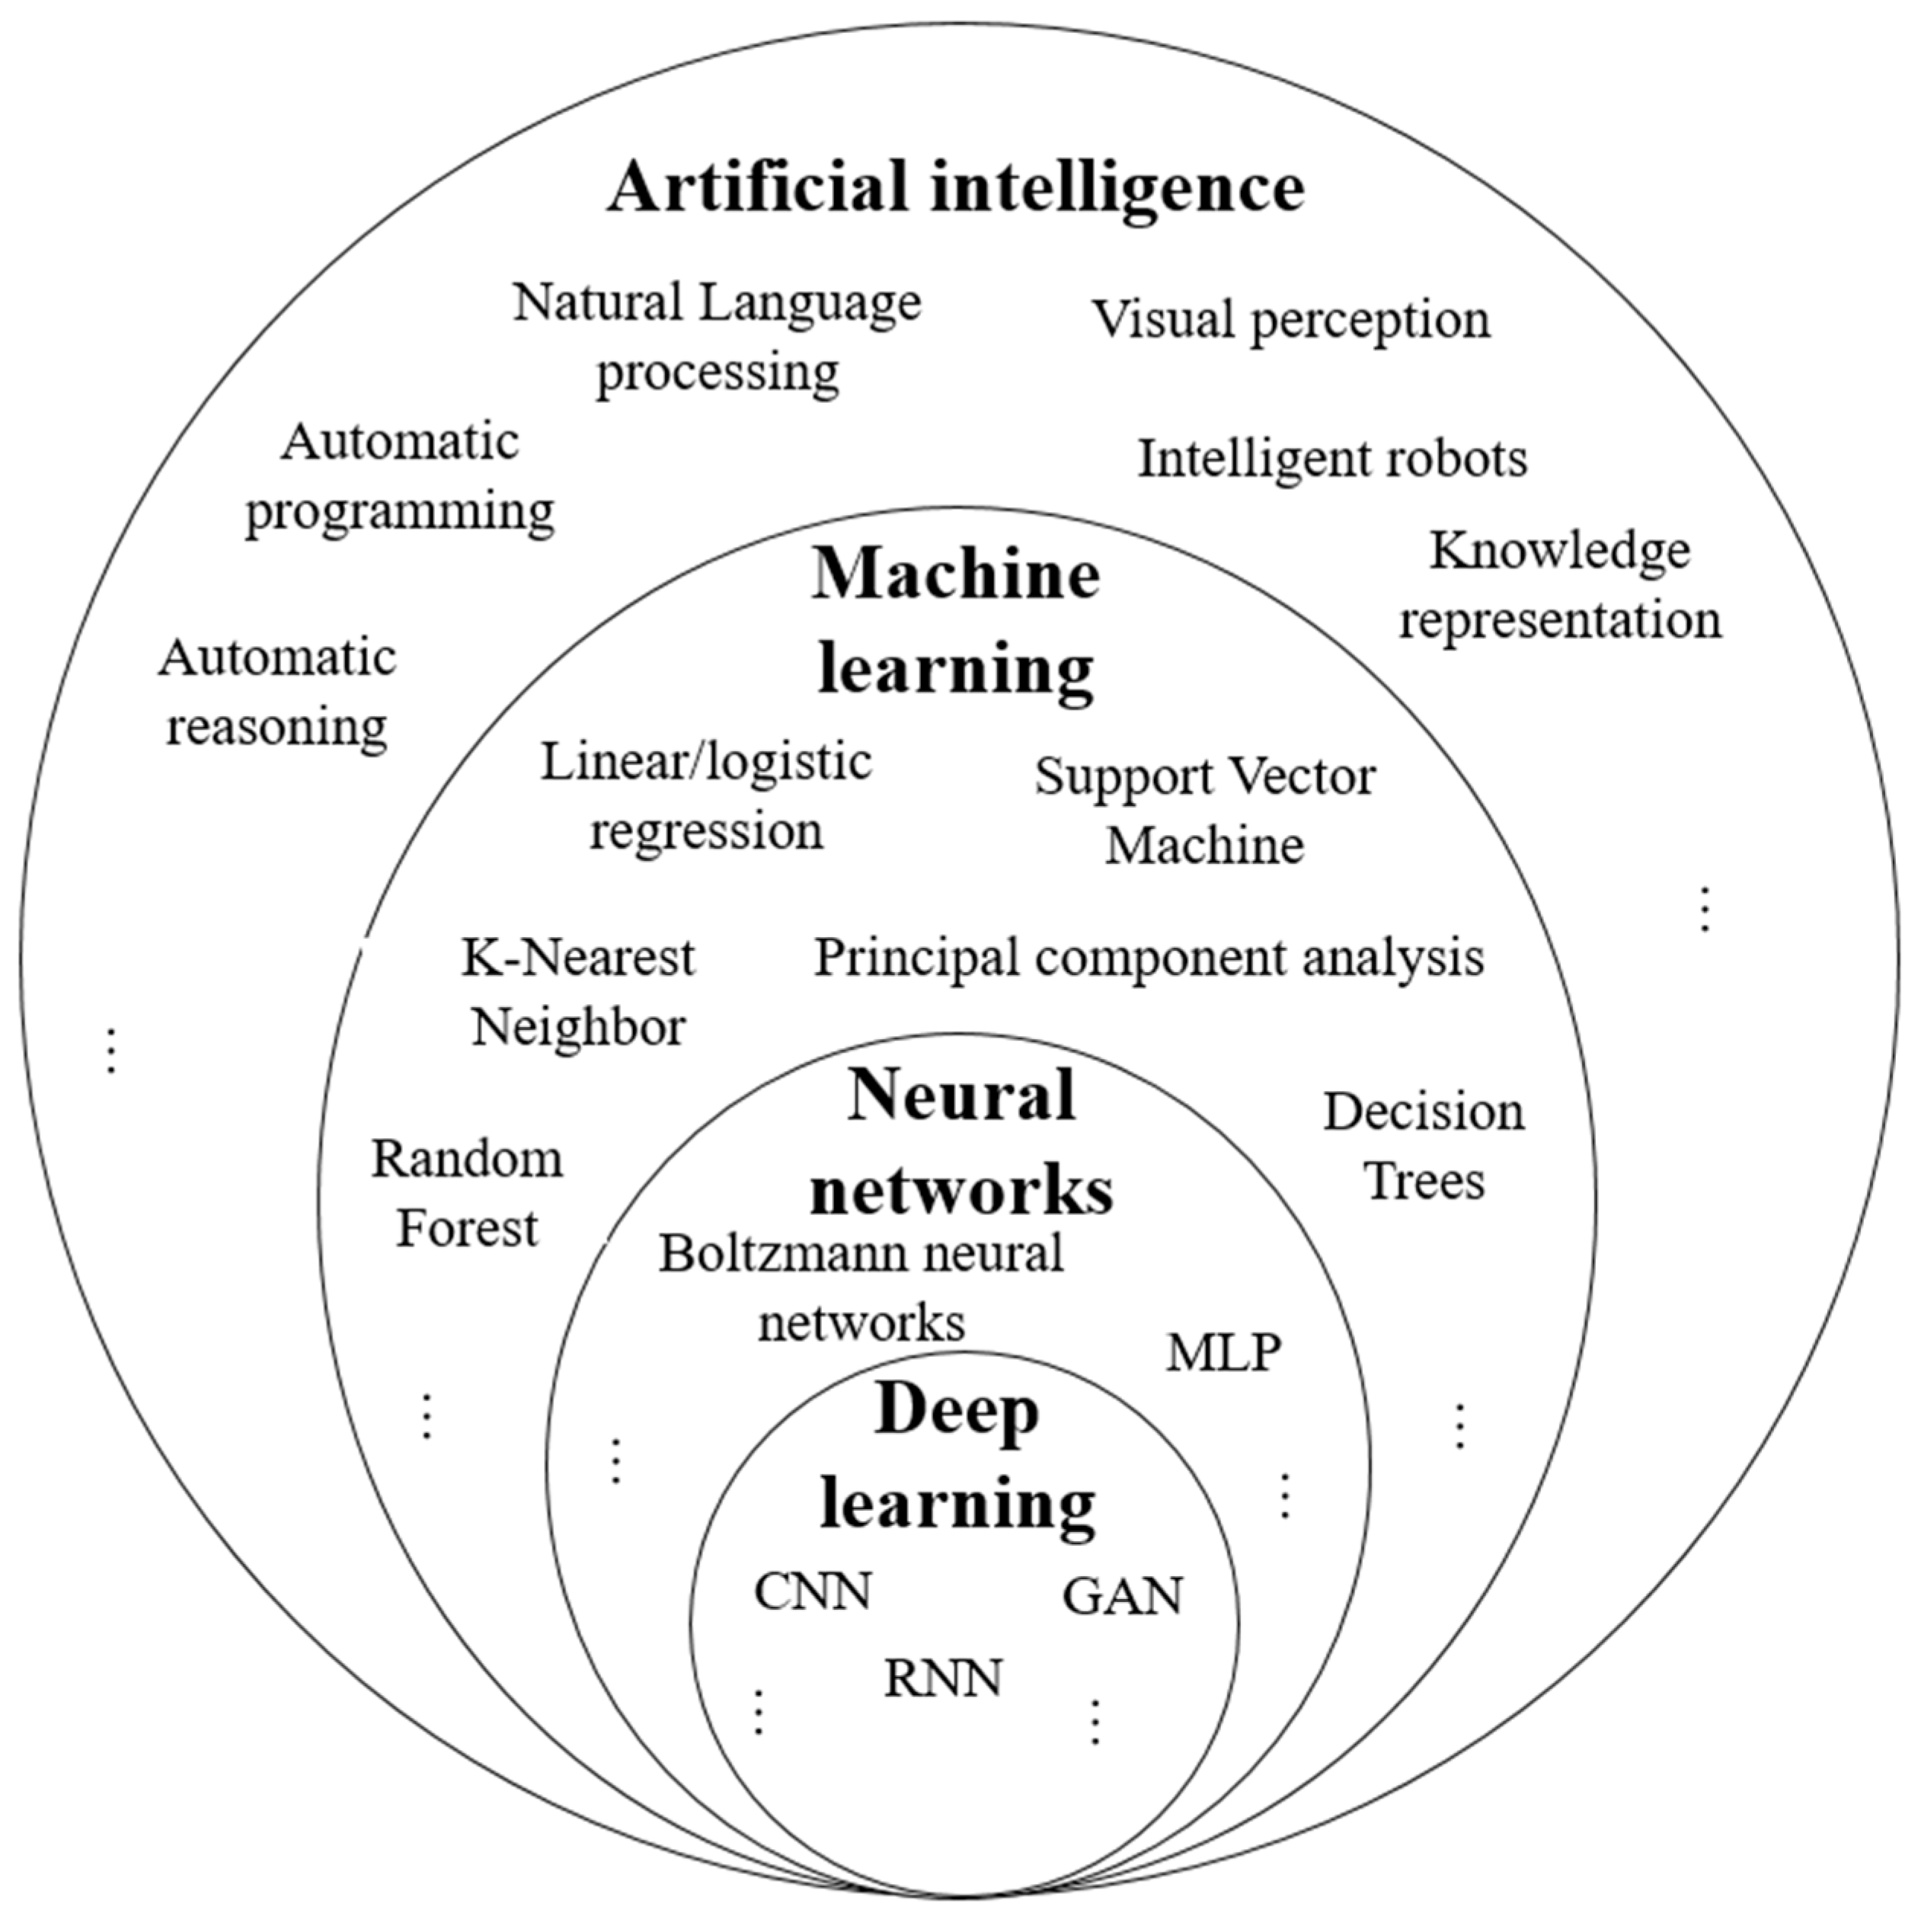
Figure 11.
Neural networks (a) artificial (b) brain neurons
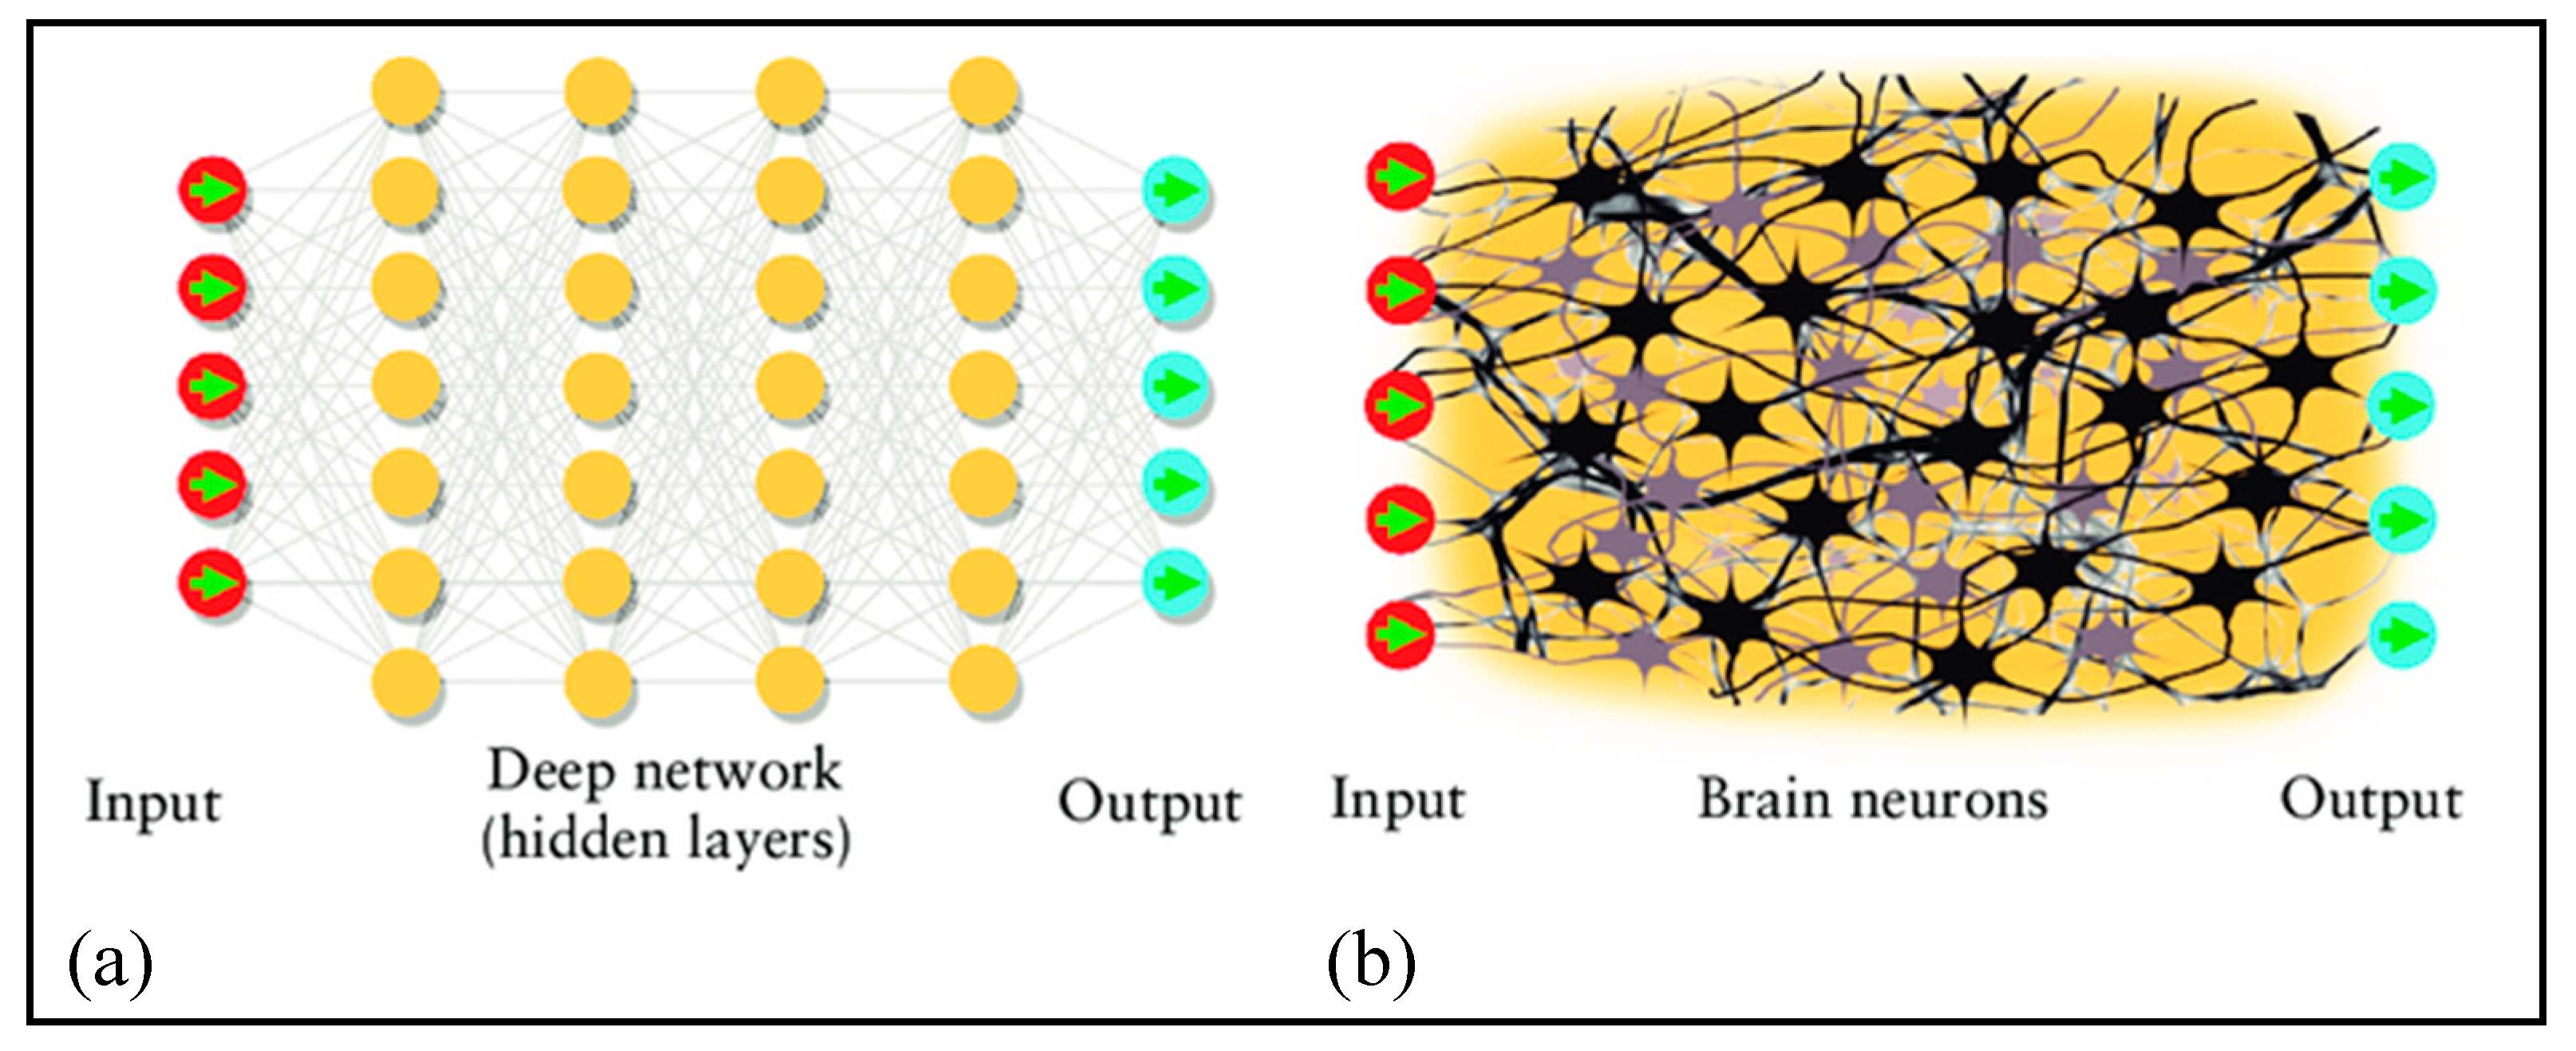
Figure 12.
Basic CNN architecture with ReLU activation layer, adapted for the detection of NTs.
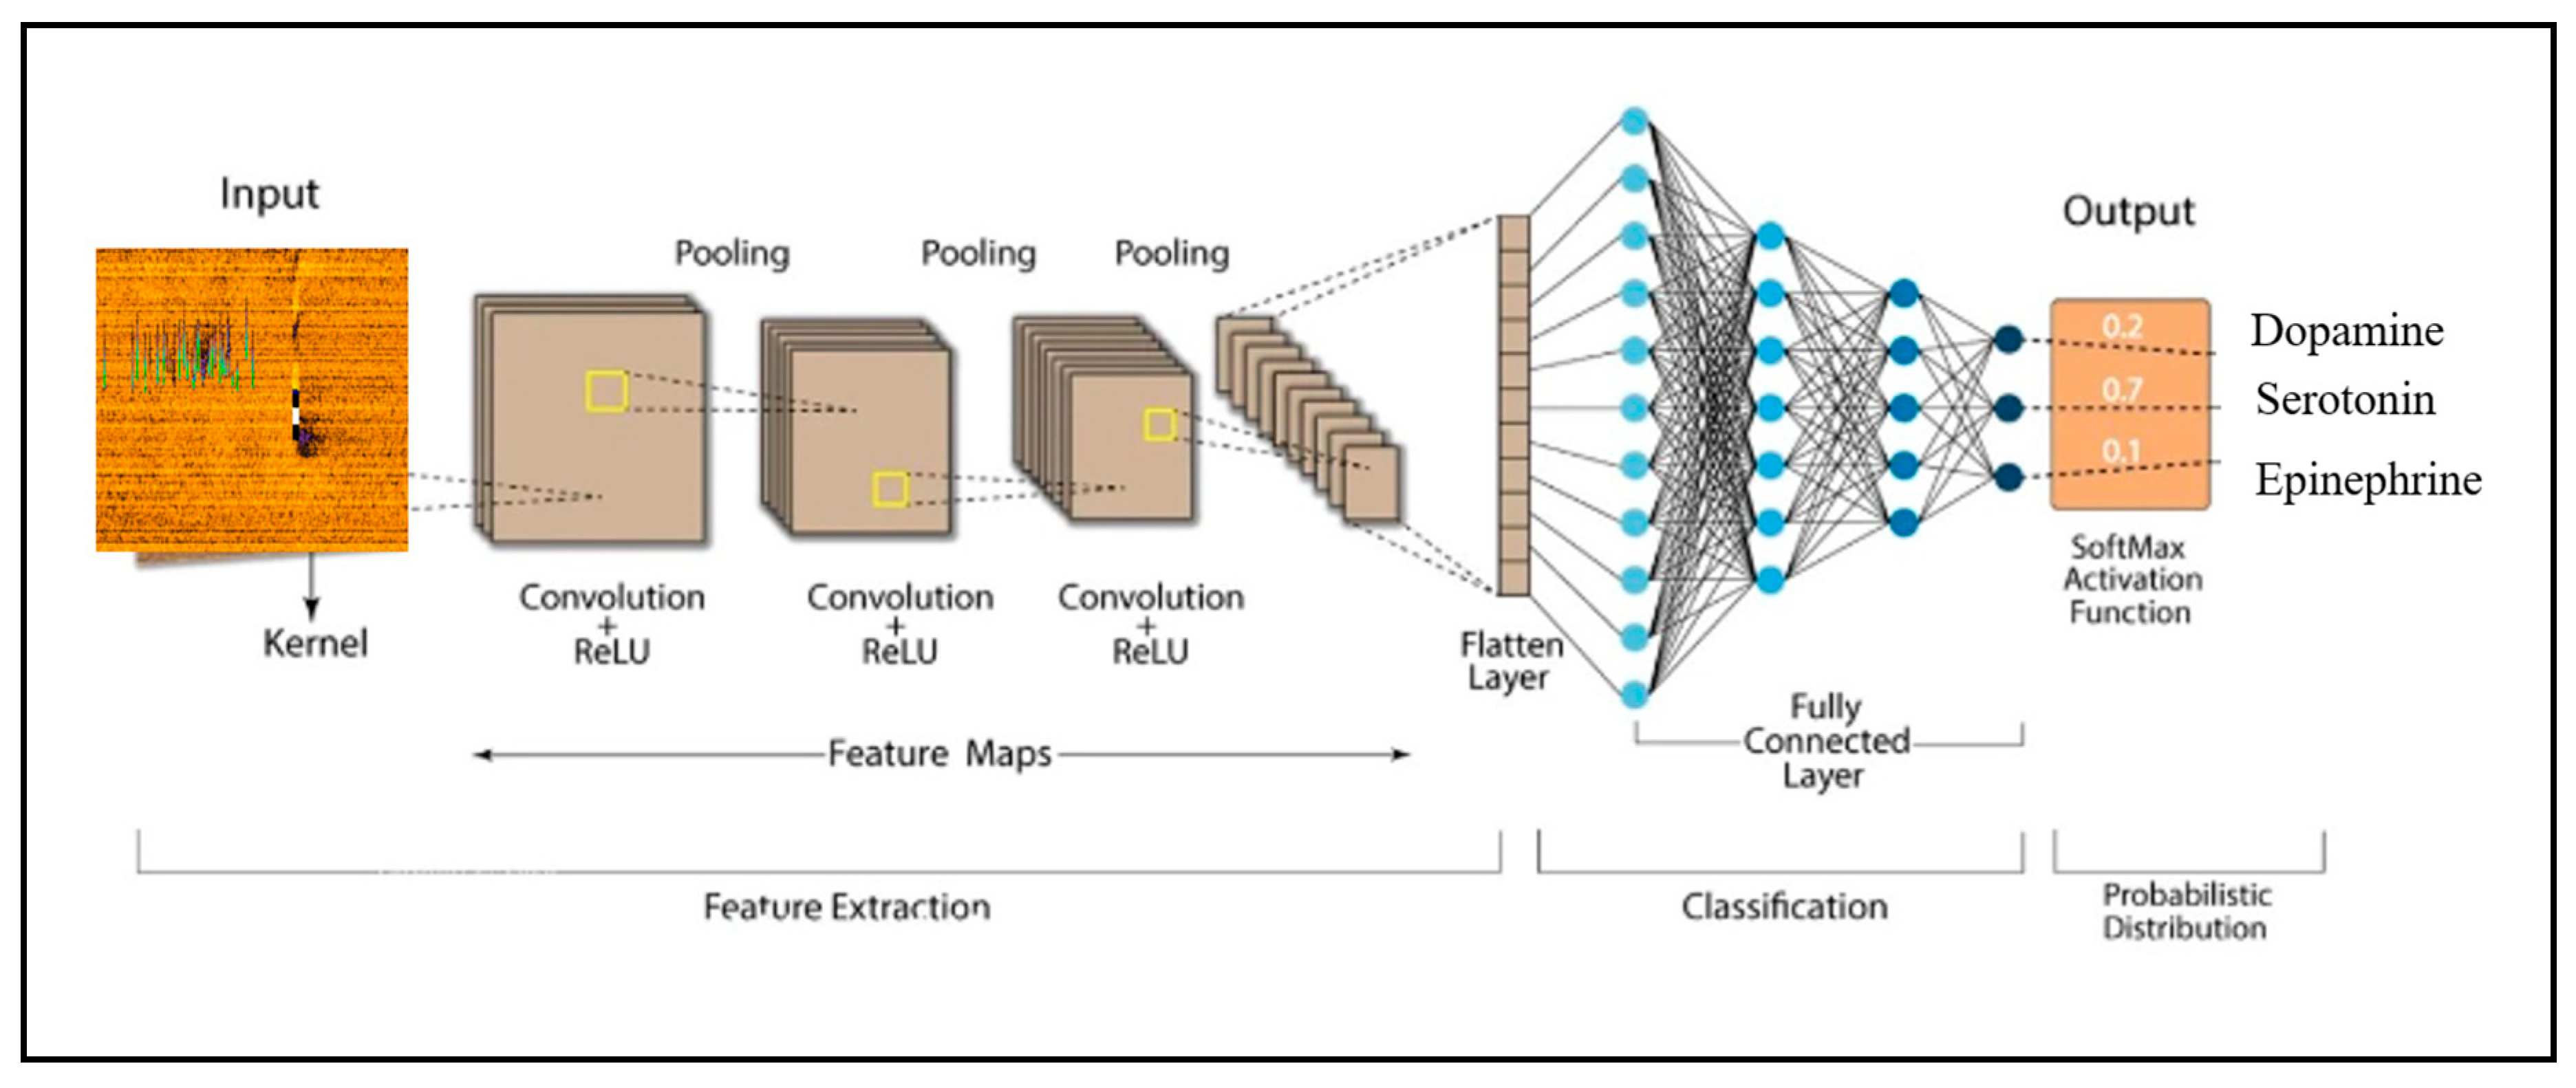
Figure 13.
Example plots for the types of dimensionalities of electrochemical data with different units of measurements. a) Zero order data presented as a dot obtained by sampling 1-D voltammogram data of DA. This dot corresponds to discrete current and potential values of 20nA and 0.24V respectively. b) First order data or 1-D vectors. These are sample voltammograms of current vs potentials for a triplicate of in-vitro mixtures of serotonin and dopamine concentrations of 100uM, recorded by DPV. c) Second order data. This is a pseudo color plot of dopamine released in-vivo after the FSCV experiment.
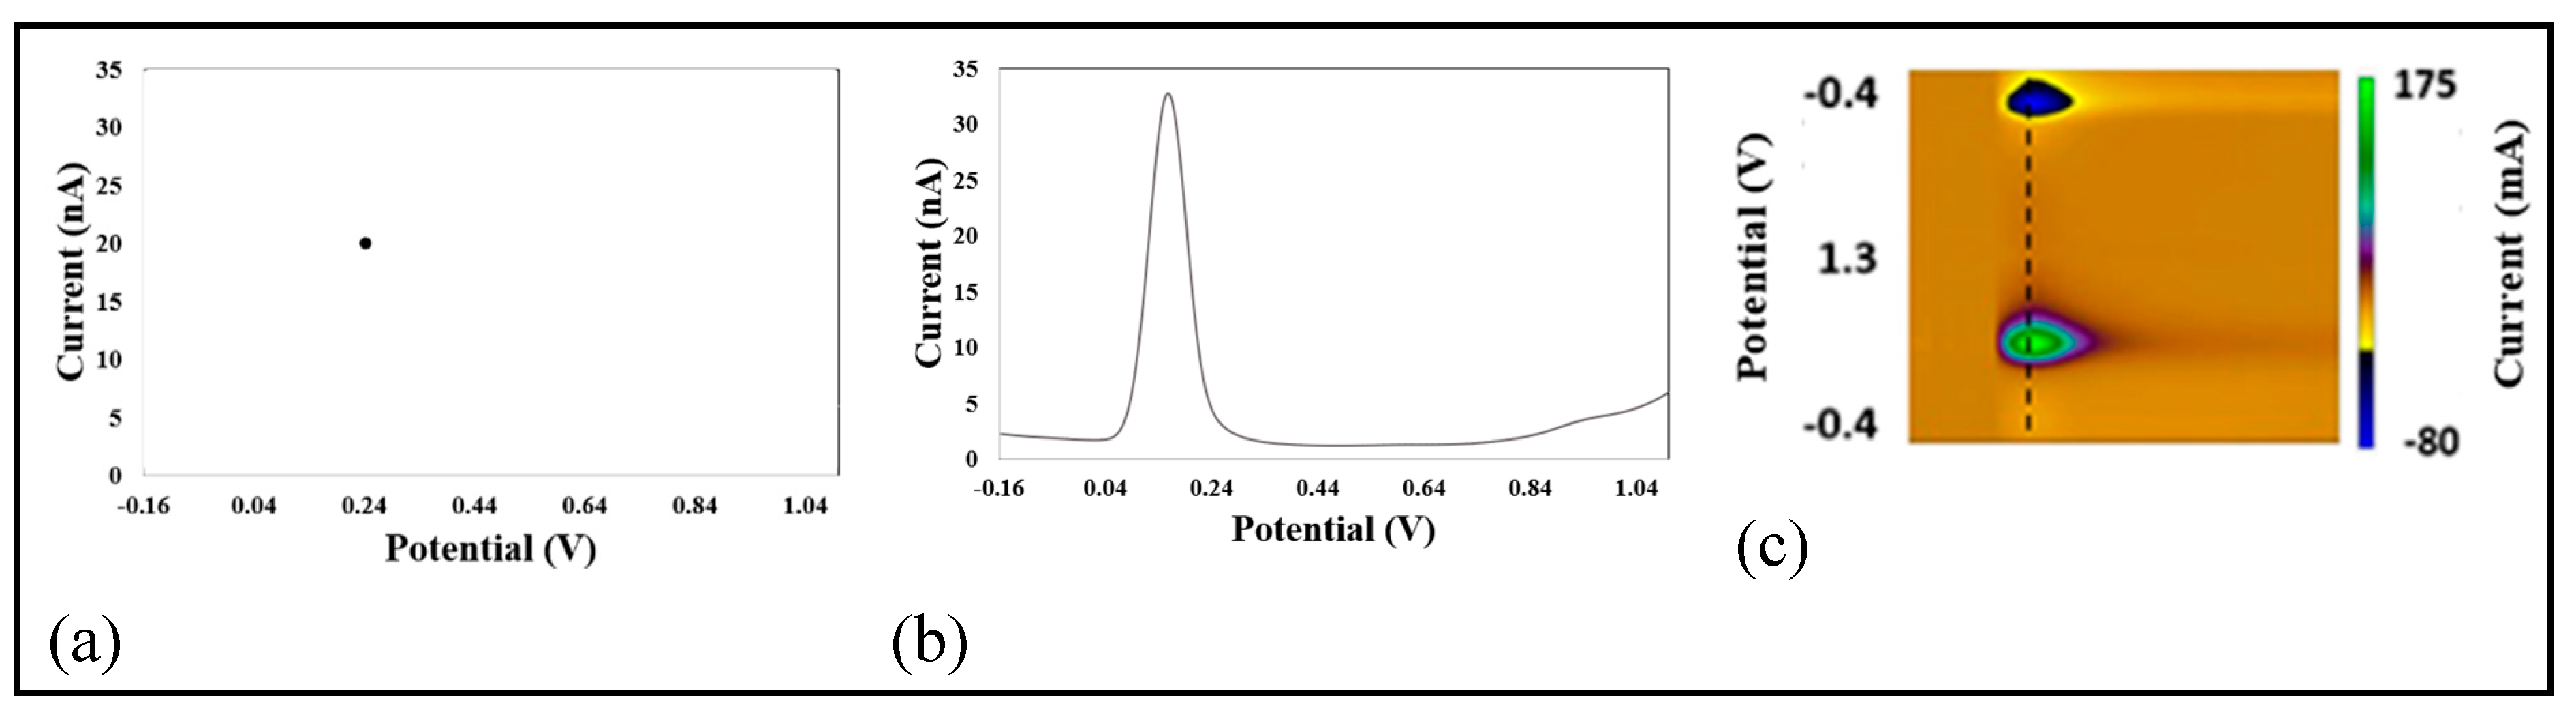
Figure 15.
(a) Opened loop deep brain stimulation. A physician is needed to manually evaluate and determine the right signal parameters for the control of the IPG, (b) Closed loop deep brain stimulation. No direct involvement of a physician in the evaluation and determination of the signal parameters for the IPG control. (c) The state-of-the -art and future placements of the bioelectrode relative to dopaminergic cells during DBS surgery. The equilibrium concentration of DA at any time and location in the brain(body) determines its proper neurologic functions.
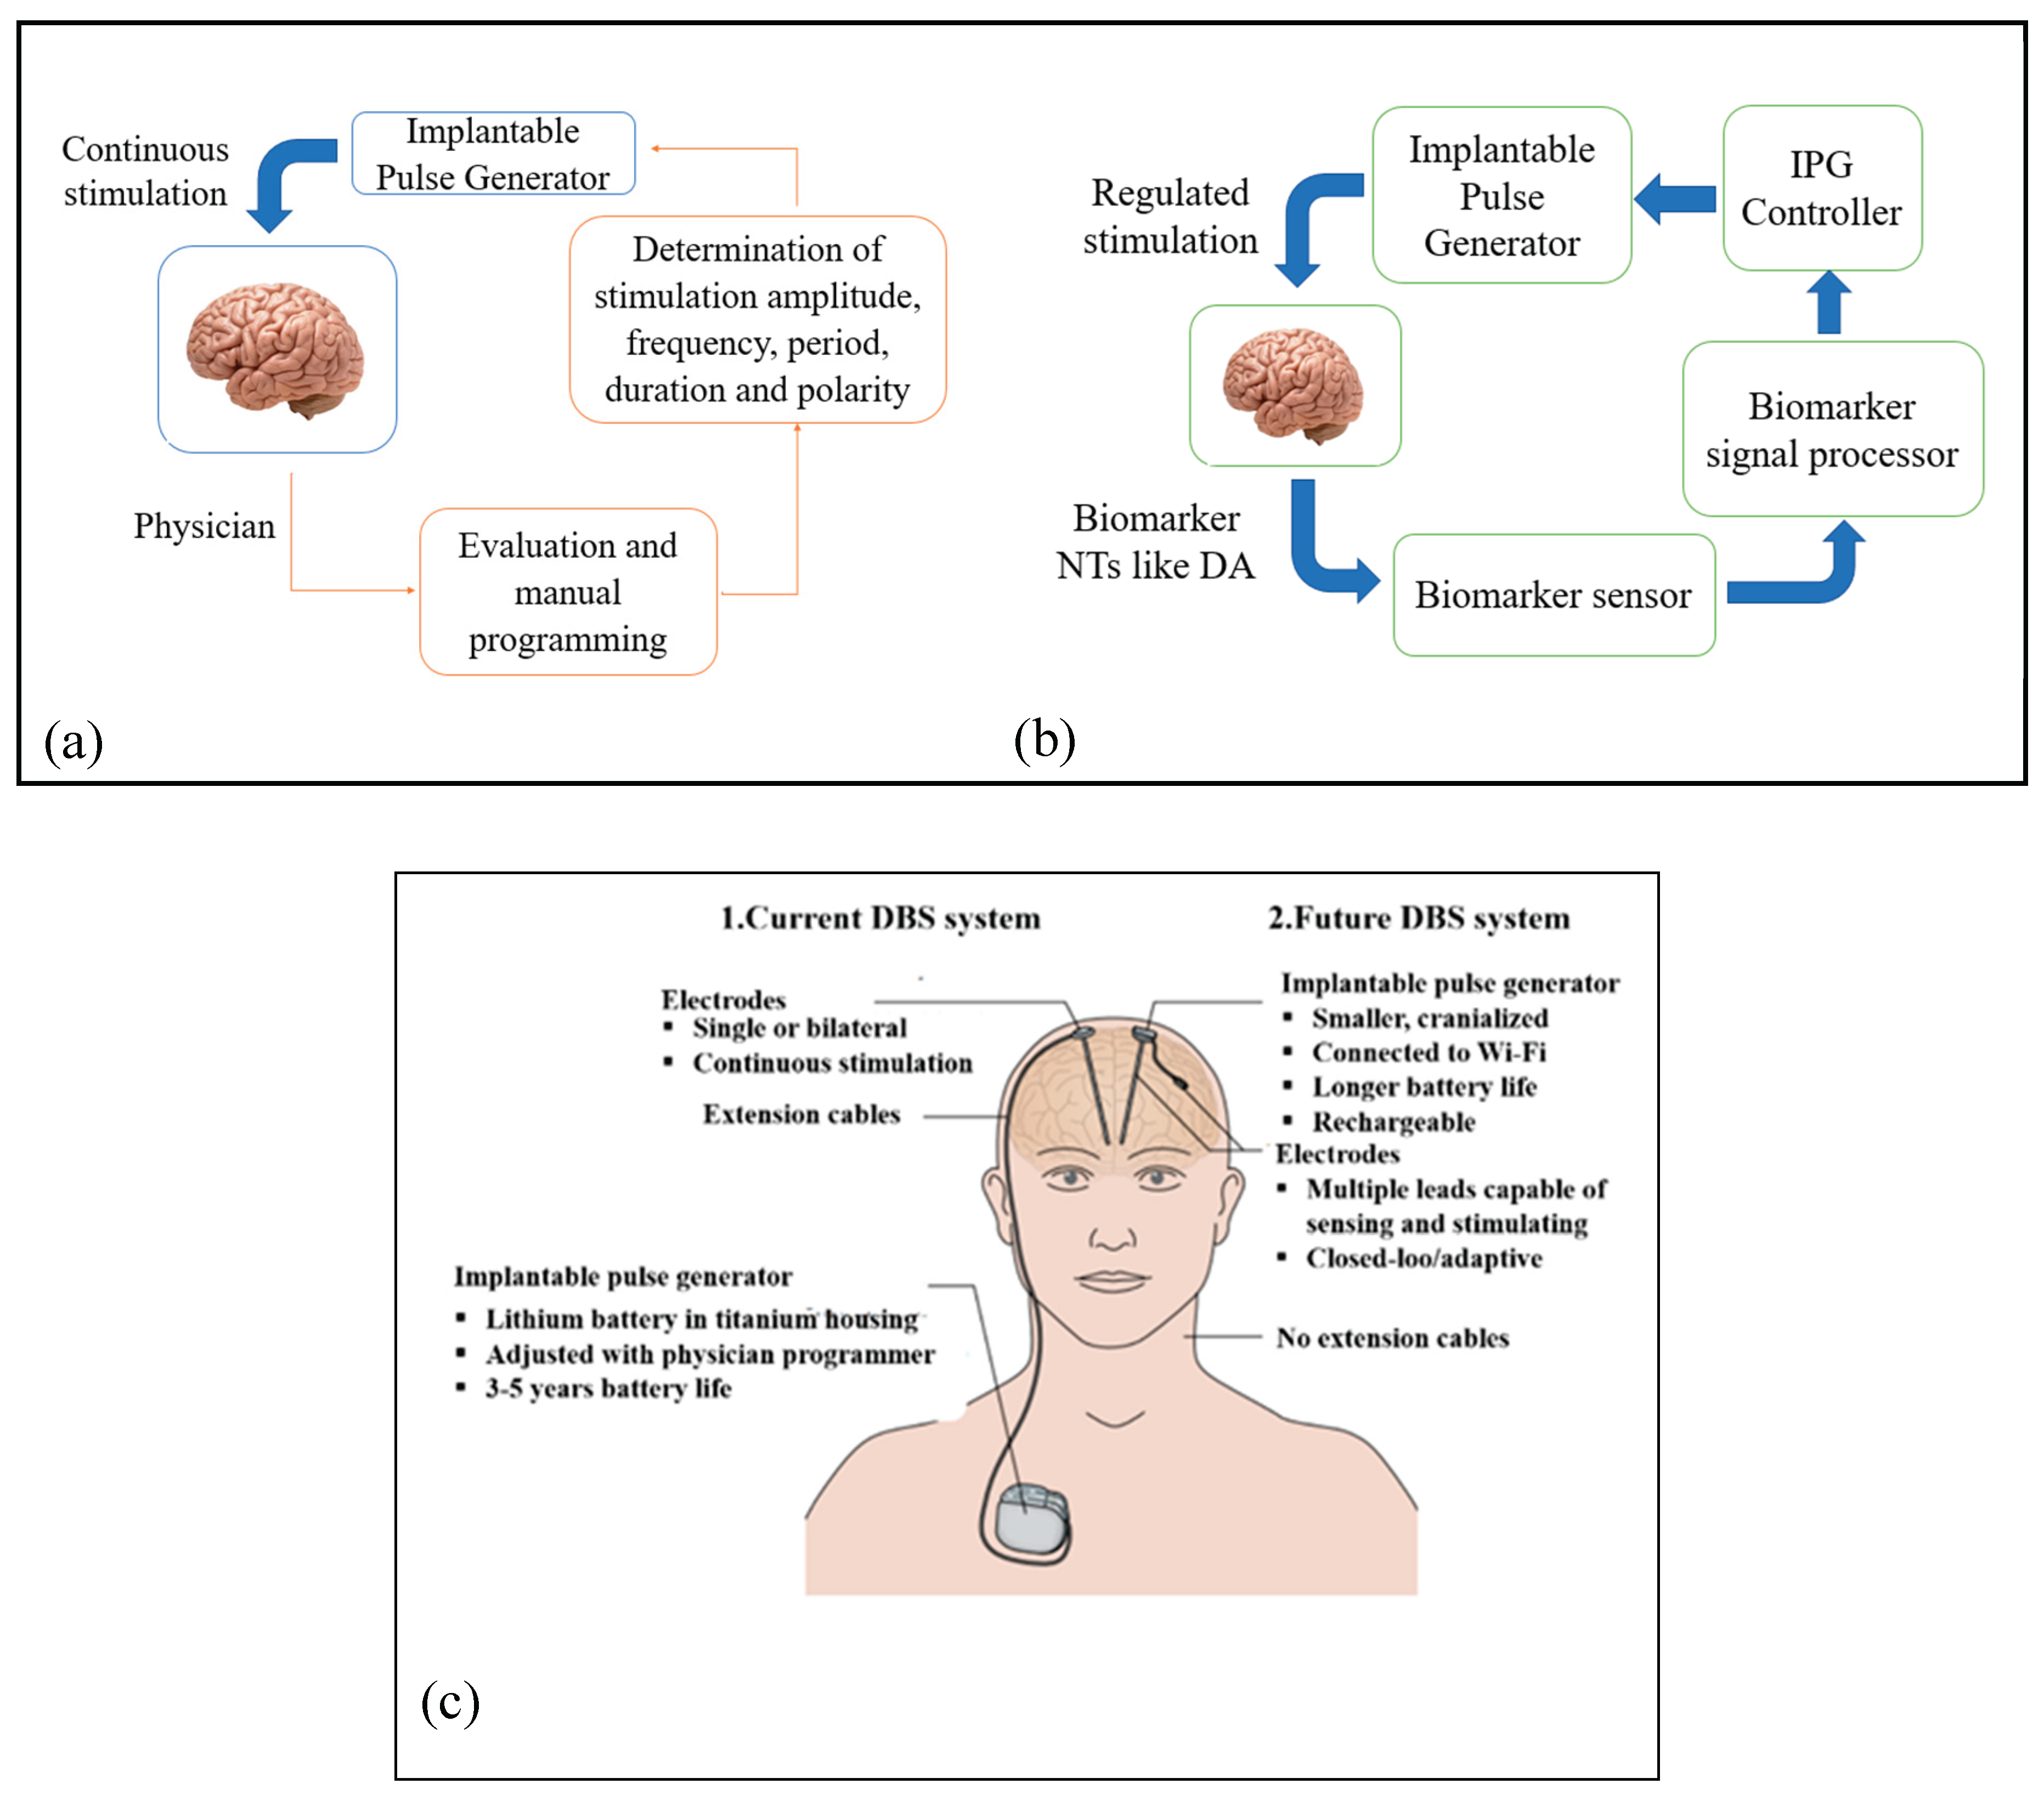
Table 1.
Summary of related reviews.
| Paper | Summary | Scope | |||
|---|---|---|---|---|---|
| NT Analysis | Voltammetric sensing techniques | Simultaneous NT detection | Application of AI | ||
| Bo Si et Al [4] | Summarized recent NT sensing techniques and explored prospects for their simultaneous detection | ✓ | |||
| Yi Su et al [6] | Analyzed current in-vivo NT detection techniques, focusing on real-time brain disorder diagnosis | ✓ | |||
| Saikat et al [18] | Surveyed electrochemical techniques for real-time, high-temporal-resolution NT sensing. | ✓ | ✓ | ✓ | |
| Shimwe et al [19] | Reviewed advances in NT detection, covering in-vivo sampling, imaging, electrochemical, nano-sensing, spectrometric, and analytical methods for both in vitro and in vivo use | ✓ | ✓ | ✓ | |
| Yangguang et al [23] | Highlighted key technical advances and in-vivo NT studies that may aid brain disorder diagnostics | ✓ | ✓ | ||
| Shiva et al [25] | Examined how NTs interact with nanomaterials, their role in diagnostics, detection techniques, and prospects for simultaneous detection and use in biological samples | ✓ | ✓ | ||
| Pathath et al [82] | Summarized recent nanomaterial-based optical methods for dopamine detection, covering its clinical relevance and advances in spectroscopic techniques. | ✓ | |||
| Xixian et al [84] | Discussed dopamine detection via molecular recognition methods and recent advances using nanomaterials and molecularly imprinted polymers | ✓ | |||
| Dunham et al [91] | Reviewed electrochemical techniques for NT detection and studied depression mechanisms. | ✓ | ✓ | ||
| This review | Reviews the use of AI for the automated detection and quantification of multiple NTs | ✓ | ✓ | ✓ | ✓ |
Table 5.
Summary of voltammetric techniques for NT sensing in papers related to AI.
| Detection technique | Summary | Reference |
|---|---|---|
| CV | Does redox processes by sweeping the potential of a working electrode linearly back and forth while measuring the resulting current | [40,44,50,52,54,55,56,57], |
| FSCV | It operates by applying a rapidly varying voltage to a microelectrode, enabling real-time monitoring of NT dynamics | [41,42,43,45,53,59,60,61] |
| DPV | Enhances electrode sensitivity by superimposing small voltage pulses onto a linearly increasing potential and measuring the current just before and after each pulse | [1,36,50,52,54] |
| SWV | Applies a symmetrical square wave potential on top of a staircase potential and measures the difference in current at the end of each forward and reverse pulse. | [9,52] |
| AM | Applies a constant potential to an electrode and measuring the resulting current proportional to the concentration of an electroactive species over time. | [48] |
| FL | Measures the intensity of fluorescent light emitted by a substance after it has absorbed light or other electromagnetic radiation | [2,35,56] |
| CL | Measures the concentration of a substance by detecting the intensity of its color, typically using a colorimeter to quantify light absorption at a specific wavelength | [3,37] |
| PH | Measures the intensity of light, typically in the visible spectrum, and is used to determine the concentration of substances based on the amount of light absorbed or transmitted through a sample | [51] |
| SP | Measures how much light a substance absorbs across a specific range of wavelengths, typically using a spectrophotometer. | [33,46] |
| RS | Uses the scattering of monochromatic light, usually from a laser, to study vibrational, rotational, and other low-frequency modes in molecules | [34] |
| MRS | Measures the magnetic properties of atomic nuclei to provide information about the chemical environment and structure of molecules in a sample | [21] |
| IM | Captures visual representations of NT signaling using specialized techniques like microscopy, MRI, CT scans, or fluorescence. | [38,47,49,58] |
Table 7.
Summary of the feature selection techniques.
| Method | Type | Description | Pros | Cons | Examples |
|---|---|---|---|---|---|
| Statistical tests | Filter | Selects features based on statistical scores | Fast and model independent | Ignore the interactions between features and is univariate | Chi-square, ANOVA, Mutual information |
| Recursive Feature Elimination (RFE) | Wrapper | Recursively removes the least important features based on model performance | Considers feature interactions and is model specific | Computationally expensive and prone to overfitting | RFE with SVM or RF |
| Forward/Backward Selection | Wrapper | Iteratively adds/removes features based on model score | Considers feature combinations |
Slow with many features, model-specific | Stepwise Regression |
| Lasso Regression | Embedded | Uses regularization to shrink less important features’ coefficients to zero | Integrated with model and handles multicollinearity | Only linear relationships with biased coefficients | L1 regularization |
| Tree-based Feature importance | embedded | Uses importance-scores from models like decision trees | Captures non*linear relationships and is fast with trees | Model specific and sometimes less interpretable | Random Forest, XGBoost |
| Filter+ Wrapper or Embedded | Hybrid | Combines speed of filter with accuracy of wrapper/embedded methods | Balanced trade-off between performance and efficiency | More complex implementation and tuning of parameters is required | SelectKBest + RFE |
Table 8.
Summary of data dimensionality reduction techniques.
| Method | Type | Description | Pros | Cons | Use Cases | References |
|---|---|---|---|---|---|---|
| Principal Component Analysis (PCA) | Linear | Projects data into directions of maximum variance | Unsupervised, fast and reduces redundancy | Assumes linearity, hard to interpret components | Preprocessing image compression | [1,21,24,33,37,42,46,48,57] |
| Linear Discriminant Analysis (LDA) | Linear | Finds axes that maximize class separation | Supervised, good for classification | Only works with labeled data, assumes normality | Face recognition, pattern classification | [2,3,35,37,49] |
| t-distributed Stochastic Neighbor Embedding (t-SNE) | Non-linear | Preserves local structure for visualization | Captures complex patterns and great for 2D/3D plots | Slow, non-deterministic, not suitable for downstream ML models | High-dimensional data visualization | [35] |
| Uniform Manifold Approximation and Projection (UMAP) | Non-linear | Similar to t-SNE but faster and preserves more global structures | Fast, scalable, preserves global and local structures | Complex tuning, not always interpretable | Bioinformatics, NLP embeddings | [56] |
| Isomap | Manifold learning | Preserves geodesic distances on a manifold | Captures non-linear structures | Sensitive to noise, slow on large datasets | 3D shape analysis and visualization | N/A |
| Neural Autoencoder | Autoencoder | Learns low-dimensional representations via neural networks | Learns non-linear features and is customizable | Requires more data and tuning, it is a black-box so less interpretable | Image denoising, anomaly detection | [9,35,43] |
| Truncated SVD | Matrix Factorization | Factorizes a matrix into low-rank approximations | Efficient, interpretable, works with sparse data | Assumes linearity, less powerful for non-linear data | Text data recommender systems | [43] |
Table 9.
Summary of the AI model selection and hyperparameter tuning techniques.
| Technique | Description | Use case | Pros | Cons | References |
|---|---|---|---|---|---|
| Hold-Out Validation | Splits dataset into training and test sets, usually in a ratio 80:20 | Quick checks large datasets | Simple and fast | Performance depends on split and high variance | [24,52,55,58] |
| K-Fold Cross-Validation | Splits data into K parts, trains on k-1, tests on 1 and repeats k times | General-purpose model evaluation | Reduces variance, uses data efficiently | Computationally expensive | [1,2,9,24,33,34,35,40,46,47,49,53] |
| Stratified K-Fold Cross-Validation | Same as K-Fold but preserves class ratios | Classification with imbalanced classes | Fairer evaluation in class imbalance | More complex than regular K-Fold | [24,111] |
| Leave-One-Out Cross-Validation | Special case of K-Fold where k=n (n is the number of samples) | Adapted for small datasets | Very low bias | Very high variance and high computation cost. | [38,52] |
| Nested Cross-Validation | Inner loop for model tuning, outer loop for evaluation | Hyperparameter tuning with fair evaluation. | Avoid overfitting during tuning. | Very computationally expensive. | [56] |
| Bootstrap | Sample data with replacement, evaluate across many resamples. | Adapted for small datasets, estimating confidence intervals. | Good variance estimation. | Biased estimates, complex interpretation. | N/A |
| Grid Search Cross-Validation | Exhaustively tries combinations of hyperparameters with cross validation. | Hyperparameter tuning. | Systematic and thorough. | Computationally intensive and doesn't scale well. | [24,59,60] |
| Random Search Cross-Validation | Randomly samples hyperparameter combinations. | Tuning with large search spaces. | More efficient than grid search. | May miss optimal values. | [38] |
| Bayesian Optimization | Probabilistically selects promising hyperparameter values. | Advanced hyperparameter tuning. | More efficient and informed than grid/random search. | More complex implementation. | [24,111] |
| Automated ML (AutoML) | Uses meta-learning or optimization to automate model selection. | Users with limited ML expertise. | Handles selection, tuning, and ensemble techniques. | Less control; can be a black box. | [9,35,43] |
Table 10.
Summary of the metrics used for NT detection.
| Metric | Formula | Focus | Range | Applied when | Sensitive to | References |
|---|---|---|---|---|---|---|
| Accuracy |
|
Overall correct predictions | [0,1] | Classes are balanced and errors are equally weighted | Class imbalance | [1,2,3,9,33,35,38,48,49,50,58,59,60] |
| Precision | Correctness of positive predictions | [0,1] | False positives weigh more | False positives | [46] | |
| Recall | Finds actual positives | [0,1] | False negative weigh more | False negatives | [47] | |
| F1-Score |
|
Balance between precision and recall | [0,1] | Classes are uneven with imbalanced datasets | Both FP and FN | [40,45,47,59,60] |
| Misclassification error | 1-Accuracy |
Overall error | [0,1] | An idea of the rate of error is needed | Class imbalance | N/A |
Table 11.
Summary of the metrics used for simultaneous NTs detection and quantification.
| Metric | Name | Formula | Focus | Range | Sensitiveness to outliers | Interpretation | References |
|---|---|---|---|---|---|---|---|
| MSE | Mean Squared Error | Penalize large errors more heavily | [0, ∞] | Yes | Penalizes large errors with less intuitive units as error is given as the square of the units of targets | [24,33,54] | |
| RMSE | Root Mean Square Error | Penalize large errors more heavily | [0, ∞] | Yes | Penalizes large errors more heavily with more intuitive units as it gives error in the same units as the targets | [34,42,52,54,55] | |
| MAE | Mean Absolute Error | Robust and easy-to-understand average error | [0, ∞] | No | Less interpretable but error given with the same units as the targets | [36,54] | |
| R2 | Coefficient of Determination | Explains variance of the data | [-∞,1] | Can be | Does not penalize large errors and explains how will models fits predictions | [1,21,24,33,54] |
Table 14.
Studies integrating AI with voltammetry for the detection of NTs.
| Study | ML Algorithm | NTs | Conc. range | Sensing Technique | Dataset measurements | Max. Acc.% | Type of study |
|---|---|---|---|---|---|---|---|
| Sazanova et al [1] | PCR, PLSR | DA, SE | 0-100 (uM) |
DPV |
216 Cross validation |
100 (with extended true values) | Simultaneous detection and quantification |
| Jose et al [9] | TinyML (DL) | AA, UA, DA, AA/DA, UA/DA, AA/UA/ DA | 0-500 (uM) |
SWV |
5492 (augmented) 80:20 split |
98.1 | Detection |
| Hoseok et al [42] | DL, PCR | DA, SE, EP, NE | 0-700 (nM) |
FSCV |
36 000 (augmented) 50:50 split |
96.23 | Simultaneous detection and quantification |
| Nchouwat et al [111] | PCR, PLSR | DA, SE | 0-100 (uM) | DPV | 216 Cross validation |
98 (with true values) | Simultaneous detection and quantification |
Disclaimer/Publisher’s Note: The statements, opinions and data contained in all publications are solely those of the individual author(s) and contributor(s) and not of MDPI and/or the editor(s). MDPI and/or the editor(s) disclaim responsibility for any injury to people or property resulting from any ideas, methods, instructions or products referred to in the content. |
© 2025 by the authors. Licensee MDPI, Basel, Switzerland. This article is an open access article distributed under the terms and conditions of the Creative Commons Attribution (CC BY) license (http://creativecommons.org/licenses/by/4.0/).
Copyright: This open access article is published under a Creative Commons CC BY 4.0 license, which permit the free download, distribution, and reuse, provided that the author and preprint are cited in any reuse.


