
Submitted:
14 August 2025
Posted:
20 August 2025
You are already at the latest version
Abstract
Transformer models have reshaped natural language processing by using attention mechanisms to model relationships across sequences. Here, we adapt this architecture to brain imaging with Neurobiologically-Optimized Transformers (Neuro-BOTs)—a framework that embeds prior neurobiological knowledge directly into the model's attention layers. Rather than learning attention weights solely from data, Neuro-BOTs incorporate fixed spatial filters derived from brain maps—such as neurotransmitter distributions, mitochondrial density, or anatomical connectivity. These priors guide how the model attends to functional MRI features across brain regions. We evaluate Neuro-BOTs on three classification tasks using resting-state fMRI. In a Parkinson’s disease dataset, incorporating a noradrenergic filter improves classification accuracy from 71.3% to 89.7%, suggesting that early-stage noradrenergic dysfunction is a key discriminative signal. To assess specificity, we test the model on healthy ageing datasets—where no single biological system should dominate—and find no spurious performance gains across diverse filters and configurations. To assess sensitivity, we apply the model to two small datasets measuring LSD-induced brain responses where we hypothesised knowledge about the pharmacological profile of the drug (serotonergic priors) would improve classification despite limited sample size. These results show that embedding biologically meaningful priors into Transformer architectures enhances both accuracy and interpretability across a wide range of contexts and applications. More broadly, Neuro-BOTs provide a principled way to integrate multiscale brain knowledge into deep learning models, enabling new forms of biologically grounded inference in clinical prediction and cross-species translation.
Keywords:
transformer architecture
; neuroimaging
; biologically informed machine learning
; attention mechanisms
; neurotransmitter systems
; Parkinson’s disease
; ageing
; LSD
; resting-state fMRI
; interpretability
1. Introduction
Transformer models have reshaped natural language processing (NLP) by enabling systems to learn which parts of a sequence are most relevant for a given task—a mechanism known as ‘attention’. Unlike earlier models such as recurrent neural networks (RNNs) (Elman 1990), which process sequences one step at a time, Transformers can compare all parts of a sequence simultaneously (Vaswani et al. 2017). This allows them to capture long-range relationships—for example, how the beginning of a sentence might influence its end. Transformer models underpin widely used tools such as BERT (used to understand text) and GPT (used to generate text) (Devlin et al. 2019; Radford et al. 2018; Radford et al. 2019), and their architecture has since been applied to other domains such as image analysis (Dosovitskiy et al. 2020).
Despite this progress, neuroimaging has yet to fully adopt Transformer-based approaches. Most current models treat brain regions as isolated features, ignoring the fact that the brain functions as an interconnected, hierarchical system. Prior efforts have tried to incorporate biological information—such as gene expression or anatomical connectivity—but these are usually added post modelling and not embedded into the model itself.
Transformer architectures may be particularly well suited to computational neuroscience because, just as attention in language models allows the system to weigh relationships between words, attention in neural models are shaped by known biological relationships between brain regions. For example, attention might be stronger between regions connected by white-matter tracts, or that share similar neurotransmitter receptor densities (Hansen et al. 2022; Lawn et al. 2023). Embedding such domain-specific biological priors directly into the model has the potential to enhance both accuracy and interpretability of current models of neural systems.
Here, we introduce Neurobiologically-Optimized Transformers (Neuro-BOTs) —a framework that adapts Transformers for brain imaging by embedding biologically informed attention mechanisms directly into the architecture. In standard Transformers, attention weights are learned purely from the data. Neuro-BOTs, by contrast, use fixed attention filters derived from neurobiological maps—such as neurotransmitter receptor distributions (Markello et al. 2022), mitochondrial density (Mosharov et al. 2024), or large-scale structural connectivity (Betzel et al. 2019)—to constrain how the model processes neuroimaging data. These filters act as biologically grounded hypotheses regarding which brain regions are more likely to influence each other.
We evaluate Neuro-BOTs using resting-state functional MRI (rs-fMRI) across three classification tasks:
- Parkinson’s disease (PD). We first test whether Neuro-BOTs can distinguish PD patients from healthy controls. We hypothesize that attention filters based on noradrenergic maps will improve performance, as early-stage PD is known to affect noradrenergic pathways.
- Healthy ageing (specificity test). We next test whether any one biological prior spuriously improves performance by using two independent ageing datasets as a negative control. Contrary to neurodegenerative disorders, ageing affects simultaneously multiple molecular, cellular and brain network systems and there is no expectation for one biological filter to be more predictive than others (Dafflon et al. 2020; Sala-Llonch, Bartrés-Faz, and Junqué 2015; Brusini et al. 2022; Smith et al. 2020)
- LSD pharmacology (sensitivity test): Finally, we test whether Neuro-BOTs can detect drug-induced changes in functional connectivity following administration of LSD, a compound of growing interest in psychopharmacology and neuroscience. Given LSD’s high-affinity binding to serotonin receptors, particularly 5-HT₂A, and its secondary modulation of other monoaminergic systems such as dopamine and norepinephrine (Bonson and Murphy 1996), we hypothesize that attention filters informed by associated neurotransmitter maps will enhance detection of these effects. This is tested across two independent cohorts.
Together, these experiments are designed to determine whether embedding biological structure into Transformer models improves both predictive power and neurobiological interpretability, especially in low-sample or noisy settings.
1.1. NLP Transformers
Transformer models can learn contextual relationships between words, even when those words are far apart in a sentence. For example, in the sentence:
“The man who walked into the room looked surprised when he saw me.”
A Transformer can link “man” with “he”—despite the intervening words. The standard Transformer follows an encoder–decoder structure: the encoder first processes the input sequence and creates internal representations; the decoder then uses these to generate the output sequence (Figure 1A).
Inside each encoder layer, each word is first converted into a numerical embedding that captures its semantic content. A positional encoding is then added to indicate the word’s position in the sequence. These position-aware embeddings are fed through self-attention layers, which allow each word to attend to others in the sentence. In ‘multi-head’ attention, the model does this multiple times in parallel, with each head learning a specific relationship. The outputs are then passed through a small feed-forward neural network.
Decoder layers have a similar structure but include two key changes: firstly, they apply masked self-attention, meaning each word only sees previous words in the sequence—important for left-to-right generation. Secondly, they include cross-attention, where each output word also attends to the encoder’s output, allowing it to incorporate information from the input (Figure 1B).
To learn embeddings, the model is trained on large amounts of text and gradually learns which words tend to appear in similar contexts. For instance, words like ‘teacher’ and ‘student’ often appear in similar environments and are therefore placed close together in the associated embedding space (Figure 1C).
Since Transformers perform parallel processing, they need a way to keep track of the order in which words appear. Positional encoding achieves this by adding a fixed pattern of waveforms to each word’s embedding. Each word is assigned a unique location in this periodic space depending on its position in the sentence (Figure 1D).
Next, self-attention heads learn to connect words based on the combined semantic and positional inputs. For example, one head might learn to connect subjects with objects across long distances, while another might focus on local word connections (Figure 1E).
Transformer models, originally developed for natural language processing, are now being applied to neuroimaging. In one line of work, they have been used to compress high-dimensional brain images into compact latent representations using architectures like vector-quantized variational autoencoders (VQ-VAEs) (Razavi, Van den Oord, and Vinyals 2019; van den Oord, Vinyals, and Kavukcuoglu 2017). These map complex inputs such as brain scans into discrete codes, enabling simplified representations that are easier to model and analyse. When trained on brain-related data, these models can learn the distribution of typical neurological patterns, making them useful for detecting subtle abnormalities (Razavi, Van den Oord, and Vinyals 2019; Mendes et al. 2024).
Here, we propose a new Transformer-based architecture—Neuro-BOTs—that incorporates biological priors directly into the attention mechanism. Relationships between brain regions are shaped by biological factors such as anatomical connectivity or neurotransmitter profiles. Neuro-BOTs embed these priors into the model using fixed attention filters derived from empirical maps of e.g., gene expression or functional connectivity. This approach enables interpretable learning across spatially organized brain imaging data and grounds attention using known neurobiological constraints.
1.2. Neuro-BOT Architecture
Neuro-BOT inputs consist of regional neuroimaging features sampled across anatomically defined parcels. Each region is processed by the encoder to predict cognitive or task-related states (Figure 2A). Each region is initialized with an embedding vector, modulated by spatially structured priors (e.g., gene expression). Self-attention is constrained using biologically inspired patterns—either fixed or parametrically filtered—before being passed to feedforward layers (Figure 2B).
Regional feature vectors are learned from diverse brain atlases. Each region is embedded in a high-dimensional space, where proximity reflects anatomical or functional relationships (Figure 2C). Analogous to sinusoidal encodings in NLP Transformers, Neuro-BOTs apply spatial basis functions across regions to embed coarse-grained anatomical layout into the model (Figure 2D). Attention is applied across regions via distinct heads, each capturing different relational scales. For instance, one head may prioritize long-range interactions, while another captures short-range dependencies. This biologically constrained attention mechanism enables the model to capture biologically plausible patterns of brain network organization (Figure 2E).
1.3. Input Embeddings
Analogous to word embeddings in NLP, Neuro-BOTs begin by converting brain-derived data into vector representations suitable for model processing. Here, rather than words, imaging-derived features are sampled from spatial units such as voxels or anatomically defined regions of interest (ROIs). In the case of structural MRI, input features may include voxel intensities or morphometric properties (e.g., cortical thickness)(Schaefer et al. 2018). For resting-state fMRI, inputs may reflect time-series statistics such as variance or dissipative energy (Fagerholm et al. 2024). EEG and MEG-derived features could include spectral power across canonical frequency bands (e.g., alpha) or signal complexity metrics such as spectral entropy (Schwilden 2006). These heterogeneous signals are transformed into a unified embedding space, enabling the model to integrate multimodal neuroimaging data within a common computational framework.
1.4. Positional Encodings
In natural language processing, positional encodings allow models to track word order. Neuro-BOTs reinterpret this mechanism through a neurological lens, embedding spatial structure using biologically informed maps. Each positional encoding array reflects a distinct brain atlas or organizational gradient, applied as a scalar, elementwise modulation of the input signals.
These encodings can include maps of grey matter morphometry (Bethlehem et al. 2022), myelin content (Glasser and Van Essen 2011), gene expression (Hawrylycz et al. 2012), cytoarchitecture (Scholtens et al. 2018), receptor density (Beliveau et al. 2017; Hansen et al. 2022), laminar differentiation (Wagstyl et al. 2020), evolutionary expansion (Zilles and Palomero-Gallagher 2017), or large-scale activation patterns from task meta-analyses (Yarkoni et al. 2011). By embedding these types of spatial priors early in the model, Neuro-BOTs are constrained to learn representations that respect known anatomical, molecular, and functional organization.
1.5. Self-Attention Matrices
Where positional encodings impose anatomically localized structure, self-attention matrices model long-range dependencies across the brain. These matrices are constructed from empirical inter-regional relationships—such as those found in functional connectivity networks, structural connectomes, or topological graphs—and encode the covariance structure among brain regions. Attention weights may be derived using decomposition techniques such as independent component analysis (ICA) (Calhoun et al. 2001), singular value decomposition (SVD), or graph-theoretic methods (Petri et al. 2014; Sporns 2013). The resulting matrices quantify how strongly each region is related to every other, based on shared activity patterns or anatomical pathways.
1.6. Mono-Head vs Multi-Head Attention
Neuro-BOTs can operate in either a mono-head or multi-head attention configuration. In the mono-head setup, a single biologically derived attention filter is applied across regions, allowing targeted integration of a specific prior—such as structural connectivity or receptor density. In the multi-head configuration, multiple attention matrices are applied in parallel, each encoding a different biological prior (e.g., laminar differentiation). The outputs of these heads are then concatenated to form a composite representation. This enables the model to integrate diverse sources of neurobiological structure while maintaining alignment with the original input dimensionality.
1.7. Statistical Learning
After encoding, the resulting feature vector is passed to a statistical learning algorithm for classification or regression. Neuro-BOTs are model-agnostic at this stage: the encoded representations can be used with linear classifiers (e.g., logistic regression), nonlinear models (e.g., multilayer perceptrons), or ensemble methods (e.g., gradient boosting) (Dafflon et al. 2020). Given the typical neuroimaging context—high-dimensional features and limited sample sizes—feature selection techniques can be applied to reduce dimensionality and mitigate overfitting prior to final prediction (Pudjihartono et al. 2022).
1.8. Task-Specific Application: Parkinson’s Disease
We demonstrate the Neuro-BOT framework on a binary classification task using resting-state fMRI (rs-fMRI) to distinguish individuals with early PD from healthy controls. The encoder integrates fixed attention filters derived from brain features known to be altered in PD, such as basal ganglia connectivity or dopaminergic receptor density. In addition to accurate classification, the model offers biologically interpretable outputs—highlighting which systems contribute most to prediction. This dual capacity for both prediction and mechanistic insight is a defining strength of the Neuro-BOT approach.
1.9. Statistical Validation: Specificity
To assess the specificity of the Neuro-BOT framework—that is, its ability to avoid false-positive enhancement through inappropriate priors—we applied it to a classification task with no expected benefit from biological attention filters. Specifically, we used rs-fMRI data from two large, publicly available datasets spanning a broad age range. Each dataset was split into matched ‘young’ and ‘old’ groups, with age thresholds selected to avoid the middle-age transition zone (Antal et al. 2025): the younger group was capped below ~45 years, while the older group included individuals aged 65 and above.
Age-related differences in brain function are widespread and well-documented, making this classification task straightforward based on rs-fMRI alone. Crucially, however, we do not expect any single biological prior (e.g., receptor density) to selectively enhance classification accuracy, since aging effects are distributed and nonspecific (Dafflon et al. 2020; Sala-Llonch, Bartrés-Faz, and Junqué 2015; Brusini et al. 2022; Smith et al. 2020). Neuro-BOTs should perform no better than baseline models without specialized attention filters—demonstrating that the architecture does not spuriously attribute signal to irrelevant priors in the absence of targeted pathophysiology.
1.10. Statistical Validation: Sensitivity
To evaluate the sensitivity of Neuro-BOTs—its ability to detect biologically specific effects—we applied the framework to two independent datasets capturing resting-state fMRI under the influence of LSD. The serotonergic system, particularly 5-HT2A receptor activity, is a known primary target of LSD, with secondary modulation of other monoamine pathways including dopamine and norepinephrine (López-Giménez and González-Maeso 2018).
We hypothesized that attention filters based on monoaminergic receptor distributions would significantly enhance classification accuracy relative to baseline, even in small-sample conditions. Neuro-BOTs were tested on both datasets using identical architectures, and we assessed whether priors reflecting serotonin, dopamine, and norepinephrine receptor density improved the model’s ability to distinguish LSD from placebo states. Robust performance across both datasets would indicate that Neuro-BOTs can detect subtle, biologically grounded effects even under limited data regimes.
2. Methods
2.1. Study 1: Participants
The study included 41 patients with idiopathic PD, enrolled at the Parkinson’s Foundation Centre of Excellence at King’s College Hospital, London. Seventeen age-matched healthy controls with no neurological or psychiatric history were also recruited. Written informed consent was obtained from all participants. The AND-PD study was authorised by local ethics committees (REC 21/YH/0016, IRAS 279691) and conducted in accordance with the Declaration of Helsinki.
2.2. Study 1: MRI Acquisition
All MRI data were acquired using a 3 T GE Discovery MR750 scanner equipped with a 32-channel head coil. The imaging protocol included a T1-weighted (T1w) structural scan using a Fast Grey Matter Acquisition T1 Inversion Recovery (FGATIR) 3D sequence (TR = 6150 ms, TE = 2.1 ms, TI = 450 ms, voxel size = 1 x 1 x 1 mm³); approximately 7 minutes of rs-fMRI acquired using a multiband single-echo 3D Echo-Planar Imaging (EPI) sequence (TR = 890 ms, TE = 39 ms, flip angle = 50°, voxel size = 2.7 x 2.7 x 2.4 mm³, MultiBand acceleration factor = 6, 495 volumes).
2.3. Study 1: Image Pre-Processing
Pre-processing of anatomical and functional data was performed using FMRIPREP version 23.2.2 (Esteban et al. 2019). The T1w image was corrected for intensity non-uniformity and skull stripped. Brain surfaces were reconstructed using ‘recon-all’ from FreeSurfer (Fischl 2012), and the brain mask estimated previously was refined with a custom variation of the method to reconcile ANTs-derived and FreeSurfer-derived segmentations of the cortical grey matter (GM). Spatial normalization to the ICBM 152 Nonlinear Asymmetrical template version 2006 was performed through nonlinear registration, using brain-extracted versions of both the T1w volume and the template. Brain tissue segmentation of cerebrospinal fluid (CSF), white matter (WM), and GM was performed on the brain-extracted T1w using FSL’s FAST tool.
The first 8 volumes of the rs-fMRI acquisition were removed, to allow the magnetization to reach the steady state. Functional data was then slice-time corrected, and motion corrected. This was followed by co-registration to the corresponding T1w using boundary-based registration with six degrees of freedom. Motion correction transformations, BOLD-to-T1w transformation, and T1w-to-template (MNI) warp were concatenated and applied in a single step. Physiological noise regressors were extracted using CompCor. Principal components were estimated for the two CompCor variants: temporal (tCompCor) and anatomical (aCompCor). A mask to exclude signal with cortical origin was obtained by eroding the brain mask, ensuring it only contained subcortical structures. Six tCompCor components were then calculated, including only the top 5% variable voxels within that subcortical mask. For aCompCor, six components were calculated within the intersection of the subcortical mask and the union of CSF and WM masks calculated in T1w space, after their projection to the native space of each functional run. Frame-wise displacement (FD) was calculated for each functional volume.
The FMRIPREP functional outputs were then subjected to additional processing using xcp_d version 0.7.4 (Mehta et al. 2024). After interpolating high-motion outlier volumes (FD > 0.5 mm) with cubic spline, confound regression was applied to the fMRI data. The regression matrix included six motion parameters and their derivatives, five aCompCor components relative to CSF and five to WM. Finally, high-pass temporal filtering with a cut-off frequency of 0.001 Hz was applied, followed by spatial smoothing with a FWHM of 6 mm.
Time series were extracted from 200 cortical parcels using the Schaefer functional atlas (Schaefer et al. 2018).
2.4. Study 2: Participants
This part of the validation process included two publicly available datasets.
The first consisted of the Nathan Kline Institute (NKI)-Rockland Sample of rs-fMRI data (TR=645ms) available at at Open-Neuro (Nooner et al. 2012). This cohort was split into two groups, the older one with subjects aged>65 years (n=158, range 65-85), the second one with subjects younger than 25 (n=150, range 18-25). MRI acquisition parameters and pre-processing can all be found in the original publication (Nooner et al. 2012).
The second consisted of the rs-fMRI data-set from the Cambridge Centre for Ageing and Neuroscience (Cam-CAN) study protocol, also a cross-sectional examination of healthy cognitive ageing (Shafto et al. 2014). This cohort was split into two groups, the older one with subjects aged>65 years (n=199, range 65-88), the second one with subjects younger than 35 (n=177, range 18-35). MRI acquisition parameters and pre-processing can all be found in the original publication (Shafto et al. 2014).
2.4. Study 3: Participants
This part of the validation process also involved a data-set that is publicly available in the Open-Neuro collection and contains the measurement of the rs-fMRI response to LSD (Carhart-Harris et al. 2016). Measurements were performed before and after administration of the drug in two separate cohorts with n=15 subjects each. Details on the acquisition and pre-processing of the data are available in the original publication and in the Open-Neuro website.
2.5. NEUROBOT Transformer Implementation
Neuro-BOT’s attention layers were constructed using multiscale biological priors relevant to the data at hand. These priors acted as inductive constraints, embedding known neurobiological structure into the model to enhance both interpretability and performance. Each prior was selected to reflect a mechanistically plausible system implicated in either pathophysiology (PD and ageing) or drug response (LSD study).
For the first study, we were interested in the incorporated whole-brain maps of neurotransmitter transporter densities for dopamine, serotonin, noradrenaline, and acetylcholine (Lawn et al. 2024). Dopaminergic degeneration is the hallmark of PD, but recent work implicates early dysfunction in other monoaminergic systems. Noradrenaline and serotonin—originating from the locus coeruleus and raphe nuclei, respectively—are associated with prodromal non-motor symptoms such as REM sleep behaviour disorder, depression, and fatigue (Doppler et al. 2021; Delaville, Deurwaerdère, and Benazzouz 2011; Buddhala et al. 2015). Acetylcholine, more commonly linked to cognitive decline in later stages, served here as a control prior to test the specificity of monoaminergic contributions.
To capture cellular-level dysfunction, we incorporated mitochondrial maps indexing Complex II and IV expression, mitochondrial tissue density, and regional respiratory capacity (Mosharov et al. 2024). Mitochondrial impairment is an hallmark of PD pathophysiology, contributing to neuronal vulnerability via impaired ATP synthesis, oxidative stress, and the breakdown of energy-dependent processes. These metabolic priors allowed the model to test whether spatial variation in mitochondrial integrity enhances detection of disease-relevant functional signatures.
Structural priors were derived from principal components of structural connectivity matrices (Jolliffe 2002) computed using normative diffusion-weighted imaging data from the Human Connectome Project (Van Essen et al. 2013), following the methods of (Betzel et al. 2019). These components define global patterns of anatomical organization and were used to construct self-attention matrices reflecting large-scale brain topology. As anatomical connectivity constrains the spread of functional activity, integrating structural priors enables the model to account for how network embedding may amplify or restrict pathological dynamics in PD.
As regional features, given the relevance of bioenergetics in PD pathophysiology (Murali Mahadevan et al. 2021; Borsche et al. 2021) we used regional estimates of dissipative energy, a measure of deviation from conservative BOLD dynamics (Fagerholm et al. 2024).
For the specificity test (Study 2), we reused the full attention layer set to examine whether they spuriously enhanced classification in an unrelated age-based task. Input features were simplified to intrinsic activity estimates, calculated as the median absolute deviation (MAD) of each region’s BOLD time series.
In the LSD sensitivity test (Study 3), given the well-known effect of psychedelics on brain connectivity (Petri et al. 2014), we used as feature the average general functional connectivity (GFC) of each region with every other region (Elliott et al. 2019) and we narrowed the attention layers to monoaminergic systems—dopamine, serotonin, and noradrenaline. Given that this was a within subject study (e.g., the same subject was scanned at baseline and after the drug administration), for each subject the GCFs of the baseline and LSD responses were normalized by subtracting the regional subject average GCF for the two studies.
Across all studies, each participant’s data was represented as a 200-dimensional feature vector aligned to the Schaefer parcellation. Each biological map—whether molecular, metabolic, or structural—was resampled into this same space and integrated via either elementwise multiplication (for scalar vectors) or dot product operations (for matrices), modulating the input embeddings by amplifying or suppressing region-specific features.
Each biologically informed encoder was applied independently to transform the input features prior to classification. While multi-head approaches could in principle be used to combine multiple priors, we opted for sequential testing of individual attention layers due to the limited data dimensionality. To reduce overfitting, an ANOVA-based feature selection procedure was applied (Guyon 2003). The number of retained features was scaled conservatively to sample size (~1 feature per 5 samples) (Hua et al. 2004). Specifically, we retained the 10 most informative features per encoder in Study 1, the 5 most informative in Study 3, and varied the number of features in Study 2 to explore specificity and false positive rates.
The reduced feature vectors were then passed to a statistical learning pipeline implemented in MATLAB’s Classification Learner app. We tested a range of classifiers—including linear models, decision trees, discriminant analysis, naïve Bayes, logistic regression, support vector machines, k-nearest neighbours, kernel approximation methods, ensemble models, and neural networks. Performance was evaluated using stratified 5-fold cross-validation, ensuring balanced class proportions across folds (Paluszek, Thomas, and Ham 2022). For each encoder, we report the mean accuracy of the top three performing classifiers.
2.6. Statistics
To evaluate whether any individual attention or encoder layer significantly enhanced classification performance, we tested observed accuracy values against a null hypothesis of no improvement. We used MATLAB’s built-in outlier detection tools, applying both parametric and non-parametric criteria to identify statistically meaningful effects.
2.6.1. Parametric Outlier Detection (Grubbs’ Test)
Grubbs’ test detects a single outlier by calculating the standardized deviation of the most extreme value from the sample mean, scaled by the standard deviation (Grubbs 1950). The null hypothesis is rejected if this deviation exceeds the critical value at .
2.6.2. Non-Parametric Outlier Detection (MAD)
As a distribution-free alternative, we also used a non-parametric test based on the median absolute deviation (MAD). A value is flagged as an outlier if it lies more than three scaled MADs from the median, again approximating a significance level of . The scaled MAD is calculated as:
where:
and the function is the inverse of the complementary error function :
This dual approach ensures robustness in detecting statistical outliers among model accuracies, both when normality holds (Grubbs) and when it does not (MAD).
3. Results
3.1. Study 1: Parkinson’s Disease
Table 1 reports mean classification accuracies across the top three statistical models for each encoder configuration, reflecting the effect of different positional and self-attention layers applied to the baseline input (regional estimates of dissipative energy). While the best-performing algorithms varied by condition, ensemble methods and neural networks were most frequently among the top three.
None of the five self-attention layers derived from structural connectivity (principal components of Human Connectome Project data) yielded notable gains, with accuracies clustering tightly around a mean of 72.6 ± 1.3%. Similarly, most positional encoders—including those based on mitochondrial and neurotransmitter maps—showed modest or negligible effects.
However, the noradrenaline transporter-based positional encoder produced a substantial improvement in performance, reaching 89.7% accuracy—significantly higher than all other configurations, as confirmed by both Grubbs’ test and scaled MAD outlier detection . This result suggests a potentially unique role of noradrenergic system integrity in distinguishing PD from healthy controls using resting-state fMRI.
The best-performing model was a neural network incorporating noradrenaline-based positional encoding. This model achieved an overall classification accuracy of 89.7%, correctly identifying 38 out of 41 PD patients and 14 out of 17 healthy controls. Misclassifications were evenly split, with three false positives and three false negatives, resulting in a sensitivity of 92.7%, specificity of 82.4%, and an F1-score of 0.93. These results confirm the strong discriminative power of the noradrenaline encoder in this clinical context.
3.2. Study 2: Ageing Data
Table 2 and Table 3 summarize classification results for the NKI and CAM-CAN datasets, respectively. Each cell shows the mean classification accuracy across the top three statistical models, repeated for three different feature counts (N = 50, 100, 200). As expected, no individual positional encoder or self-attention layer produced a statistically significant improvement in classification accuracy. This aligns with the hypothesis that ageing affects the brain in a globally distributed manner, unlike neurodegenerative diseases such as PD.
Accuracy increased with feature number and plateaued at N = 200 in both datasets, further supporting the view that distributed processes drive detectable differences. Notably, overall classification performance exceeded 90% at higher feature counts, confirming sufficient statistical power. The absence of spurious performance spikes from any individual encoder strengthens confidence that the Neuro-BOT framework does not produce false positives due to overfitting or improper statistical control.
3.3. Study 3: Sensitivity Analysis – LSD Response Data
Table 4 summarizes results from two independent LSD studies (n = 15 each, pre-post design). Each cell reports the average classification accuracy across the top three statistical models, for each attention configuration. This experiment assessed the sensitivity of Neuro-BOTs to known neurochemical perturbations using a limited sample size and a restricted attention set (monoaminergic layers only).
In Study 1, all configurations—baseline, dopamine, serotonin, and noradrenaline—achieved perfect classification (100%), reflecting a highly separable effect of LSD on global brain dynamics. In Study 2, however, baseline accuracy dropped to 91.1%. Here, only the serotonin-based attention layer significantly improved classification performance, increasing accuracy to 97.8% (p < 0.05). This finding aligns with the known pharmacology of LSD, which exerts its primary psychoactive effects through high-affinity binding to 5-HT2A receptors (López-Giménez and González-Maeso 2018).
4. Discussion
In this study, we introduced Neuro-BOTs—an approach that applies Transformer models to brain imaging by embedding biologically-informed constraints into the model’s architecture. Unlike traditional models that learn purely from data, Neuro-BOTs incorporate established neurological maps—such as neurotransmitter systems, energy metabolism, or structural connectivity—into their attention mechanisms. This allows the model to focus on biologically meaningful patterns when analysing brain scans. In a case study using resting-state fMRI, we found that embedding a map of noradrenaline transporter density led to a significant improvement in classifying patients with PD versus healthy controls. This result supports growing evidence that early dysfunction in brainstem noradrenergic systems plays a key role in PD, even before motor symptoms appear (Braak et al. 2003; Surmeier, Obeso, and Halliday 2017; Weinshenker 2018).
Although it may seem surprising that dopaminergic filters did not boost classification accuracy—given the well-known role of dopamine loss in PD—this finding aligns with emerging evidence that degeneration of noradrenergic neurons in the brainstem often occurs even earlier. Specifically, studies show that the locus coeruleus, which produces noradrenaline, is affected in the earliest stages of the disease, before the more widely recognized damage to dopamine-producing cells in the substantia nigra (Zarow et al. 2003; Patt and Gerhard 1993). This early noradrenergic dysfunction has been linked to non-motor symptoms such as REM sleep behaviour disorder (Delaville, Deurwaerdère, and Benazzouz 2011; Doppler et al. 2021), impaired glymphatic clearance which in turn compromises mitochondrial energy production (Hauglund et al. 2025; Kopeć et al. 2023), and fatigue symptoms (Di Vico et al. 2025). The fact that our model was most sensitive to noradrenaline-related disruption suggests that biologically guided attention layers can detect subtle, early-stage brain changes that might be missed by models relying only on data patterns. However, please also note that the attention layer used the brain distribution of the noradrenaline transporter that has non-trivial affinity for dopamine (Dipasquale et al. 2020).
To test the robustness of our approach, we assessed both its specificity and sensitivity on experimental data. For specificity, we used healthy ageing as a null case where no biological prior should provide an advantage—since ageing affects the brain in a non-specific way. As expected, Neuro-BOTs did not show any spurious performance gains across two independent ageing datasets, even when we varied the number of features included. To test sensitivity, we applied the model to two small datasets measuring brain responses to LSD. Despite the limited sample size, Neuro-BOTs successfully detected meaningful effects when guided by biologically relevant priors—specifically, attention layers based on monoaminergic neurotransmitters. This suggests that the model is sensitive enough to pick up subtle, biologically grounded signals even in challenging, low-data scenarios.
Beyond the examples shown in this study, Neuro-BOTs point to a broader conceptual shift: treating neural inference as a form of translation. Just as language models convert one sentence into another while preserving meaning, Neuro-BOTs aim to map between different representations of brain function—such as from imaging data to clinical diagnosis, or from one biological descriptor (e.g., neurotransmitter density) to another (e.g., functional connectivity). This framing opens new possibilities: aligning neural patterns across patient subgroups, comparing pharmacological effects across studies, or even bridging insights between animal models and human disease. From this viewpoint, biologically informed attention mechanisms become not just statistical tools, but structured translators grounded in neuroscience.
Traditionally, cross-domain mapping in neuroscience has relied on linear techniques like canonical correlation analysis or partial least squares to identify shared variance across modalities (McIntosh et al. 1996). Neuro-BOTs extend this idea into the nonlinear, high-dimensional space of deep learning—while preserving interpretability by anchoring attention mechanisms in known biology. In cognitive science, intelligence has been described as a form of translation between internal and external states. Neuro-BOTs offer an architecture for operationalizing this idea, using tools originally developed for language modelling to make biologically-grounded inferences. This opens up new methodological possibilities: beyond classification and clustering, Neuro-BOTs can serve as hypothesis-generating engines for mechanistic research. For example, while noradrenergic filters proved most useful in PD, dopaminergic encoders might offer greater predictive value in conditions like schizophrenia or ADHD, where dopamine systems are more centrally implicated.
The Neuro-BOT framework can be extended to a wide range of clinical conditions by tailoring its biological priors to specific pathophysiological mechanisms. For example, serotonergic maps may enhance modelling in depression or anxiety, where they could help predict treatment response to SSRIs. In disorders characterized by altered arousal or fatigue—such as chronic fatigue syndrome, post-COVID-19 syndrome, or PTSD—histaminergic or noradrenergic encoders might reveal hidden subtypes linked to neuromodulatory imbalance. In Alzheimer’s disease, cholinergic filters may be especially sensitive to early degeneration. More complex disorders, like bipolar disorder or multiple sclerosis, could benefit from combining multiple priors—such as mitochondrial and neurotransmitter maps—using multi-head attention to uncover interacting biological pathways if the sample sizes allow. These hypotheses are testable using existing neuroimaging data, PET imaging for validation, pharmacological interventions, and longitudinal studies of disease progression. Such applications not only expand the clinical utility of Neuro-BOTs, but also position them as tools for biologically grounded, mechanism-driven brain drug discovery with potential ready applications across rodent and primate species.
While our findings are encouraging, several limitations should be noted. In the PD study for instance, the sample size was relatively small and unbalanced between groups, which may affect the generalizability of the results. Additionally, while our use of fixed biological priors improves interpretability, it may reduce flexibility when applied to other domains or datasets. Future work should aim to validate these findings in larger, more diverse populations and explore broader applications of the Neuro-BOT framework. This includes expanding beyond classification to tackle generative modelling, time-series prediction, and multimodal integration—for example, combining PET and fMRI data within a single architecture. The use of interpretable, biologically informed attention layers also opens up opportunities for model-driven hypothesis testing, such as estimating the relative contribution of specific neurotransmitter systems to psychiatric or neurodegenerative conditions.
By framing brain modelling as a biologically grounded translation problem, Neuro-BOTs offer a principled approach to multiscale inference. Future extensions—such as incorporating decoder modules for bidirectional inference or using multimodal attention maps that integrate molecular, anatomical, and behavioural organization priors—could further enhance both accuracy and interpretability. As these models evolve, their greatest strength may be their ability to move beyond prediction, toward generating biologically meaningful insights that deepen our understanding of the brain.
Beyond classification, Neuro-BOTs offer a novel framework for representational neuroscience. By learning embeddings of brain states constrained by biological priors, the model implicitly constructs a structured representational space in which relationships between conditions—such as disease severity, pharmacological response, or cognitive states—can be quantified and visualized. This shifts the model’s role from prediction to interpretation, allowing researchers to ask not just what differs between brain states, but how those differences are organized in relation to known biology. In future work, decoder modules could even invert this process, generating hypothetical brain patterns that correspond to specific abstract representations or clinical targets. These capacities position Neuro-BOTs as generative tools for mapping, measuring, and manipulating brain representations in a biologically grounded, data-driven framework.
Author Contributions
FET developed the concept, wrote part of the scripts, performed part of the computations and wrote the manuscript. DM, EDF, GdA, MF, MM wrote part of the scripts and performed part of the calculations. LB and SR coordinated the clinical experimental work and collected the data. MP, PE and MV contributed to the concept and the data analysis plan. All the authors contributed to the writing, reviewing and editing of the manuscript.
Data Availability Statement
All the MATLAB files required to produce the results in this manuscript are available at https://github.com/fturkhei/NEURO-BOT.
Acknowledgments
F.E.T. and D.M. are funded by the NIHR Maudsley Biomedical Research Centre at South London and Maudsley NHS Foundation Trust and King’s College London. G.d.A. is funded by the “London Interdisciplinary Doctoral Programme” (LIDo), funded by the BBSRC. E.D.F. and M.B. are funded by Masaryk University. MV is supported by EU funding within the Italian the Italian Ministry of University and Research PNRR “National Center for HPC, BIG DATA AND QUANTUM COMPUTING (Project no. CN00000013 CN1), the Italian Ministry of University and Research within the Complementary National Plan PNC DIGITAL LIFELONG PREVENTION - DARE (Project no PNC0000002_DARE), and by Fondo per il Programma Nazionale di Ricerca e Progetti di Rilevante Interesse Nazionale (PRIN), (Project no 2022RXM3H7).
Conflicts of Interest
No competing interests are declared by all the authors.
References
- Antal, B.B., H. van Nieuwenhuizen, A.G. Chesebro, H.H. Strey, D.T. Jones, K. Clarke, C. Weistuch, E.M. Ratai, K.A. Dill, and L. R. Mujica-Parodi. ‘Brain aging shows nonlinear transitions, suggesting a midlife “critical window” for metabolic intervention’. Proc Natl Acad Sci U S A 2025, 122, e2416433122. [Google Scholar] [CrossRef] [PubMed]
- Beliveau, V., M. Ganz, L. Feng, B. Ozenne, L. Højgaard, P.M. Fisher, C. Svarer, D.N. Greve, and G. M. Knudsen. ‘A High-Resolution In Vivo Atlas of the Human Brain’s Serotonin System’. J Neurosci 2017, 37, 120–128. [Google Scholar] [CrossRef]
- Bethlehem, R.A.I., J. Seidlitz, S.R. White, J.W. Vogel, K.M. Anderson, C. Adamson, S. Adler, G.S. Alexopoulos, E. Anagnostou, A. Areces-Gonzalez, D.E. Astle, B. Auyeung, M. Ayub, J. Bae, G. Ball, S. Baron-Cohen, R. Beare, S.A. Bedford, V. Benegal, F. Beyer, J. Blangero, M. Blesa Cábez, J.P. Boardman, M. Borzage, J.F. Bosch-Bayard, N. Bourke, V.D. Calhoun, M.M. Chakravarty, C. Chen, C. Chertavian, G. Chetelat, Y.S. Chong, J.H. Cole, A. Corvin, M. Costantino, E. Courchesne, F. Crivello, V.L. Cropley, J. Crosbie, N. Crossley, M. Delarue, R. Delorme, S. Desrivieres, G.A. Devenyi, M.A. Di Biase, R. Dolan, K.A. Donald, G. Donohoe, K. Dunlop, A.D. Edwards, J.T. Elison, C.T. Ellis, J.A. Elman, L. Eyler, D.A. Fair, E. Feczko, P.C. Fletcher, P. Fonagy, C.E. Franz, L. Galan-Garcia, A. Gholipour, J. Giedd, J.H. Gilmore, D.C. Glahn, I.M. Goodyer, P.E. Grant, N.A. Groenewold, F.M. Gunning, R.E. Gur, R.C. Gur, C.F. Hammill, O. Hansson, T. Hedden, A. Heinz, R.N. Henson, K. Heuer, J. Hoare, B. Holla, A.J. Holmes, R. Holt, H. Huang, K. Im, J. Ipser, C.R. Jack, Jr., A.P. Jackowski, T. Jia, K.A. Johnson, P.B. Jones, D.T. Jones, R.S. Kahn, H. Karlsson, L. Karlsson, R. Kawashima, E.A. Kelley, S. Kern, K.W. Kim, M.G. Kitzbichler, W.S. Kremen, F. Lalonde, B. Landeau, S. Lee, J. Lerch, J.D. Lewis, J. Li, W. Liao, C. Liston, M.V. Lombardo, J. Lv, C. Lynch, T.T. Mallard, M. Marcelis, R.D. Markello, S.R. Mathias, B. Mazoyer, P. McGuire, M.J. Meaney, A. Mechelli, N. Medic, B. Misic, S.E. Morgan, D. Mothersill, J. Nigg, M.Q.W. Ong, C. Ortinau, R. Ossenkoppele, M. Ouyang, L. Palaniyappan, L. Paly, P.M. Pan, C. Pantelis, M.M. Park, T. Paus, Z. Pausova, D. Paz-Linares, A. Pichet Binette, K. Pierce, X. Qian, J. Qiu, A. Qiu, A. Raznahan, T. Rittman, A. Rodrigue, C.K. Rollins, R. Romero-Garcia, L. Ronan, M.D. Rosenberg, D.H. Rowitch, G.A. Salum, T.D. Satterthwaite, H.L. Schaare, R.J. Schachar, A.P. Schultz, G. Schumann, M. Schöll, D. Sharp, R.T. Shinohara, I. Skoog, C.D. Smyser, R.A. Sperling, D.J. Stein, A. Stolicyn, J. Suckling, G. Sullivan, Y. Taki, B. Thyreau, R. Toro, N. Traut, K.A. Tsvetanov, N.B. Turk-Browne, J.J. Tuulari, C. Tzourio, É Vachon-Presseau, M.J. Valdes-Sosa, P.A. Valdes-Sosa, S.L. Valk, T. van Amelsvoort, S.N. Vandekar, L. Vasung, L.W. Victoria, S. Villeneuve, A. Villringer, P.E. Vértes, K. Wagstyl, Y.S. Wang, S.K. Warfield, V. Warrier, E. Westman, M.L. Westwater, H.C. Whalley, A.V. Witte, N. Yang, B. Yeo, H. Yun, A. Zalesky, H.J. Zar, A. Zettergren, J.H. Zhou, H. Ziauddeen, A. Zugman, X.N. Zuo, E.T. Bullmore, and A. F. Alexander-Bloch. ‘Brain charts for the human lifespan’. Nature 2022, 604, 525–533. [Google Scholar]
- Betzel, R.F., A. Griffa, P. Hagmann, and B. Mišić. ‘Distance-dependent consensus thresholds for generating group-representative structural brain networks. Netw Neurosci 2019, 3, 475–496. [Google Scholar] [CrossRef]
- Bonson, K.R. , and D. L. Murphy. ‘Alterations in responses to LSD in humans associated with chronic administration of tricyclic antidepressants, monoamine oxidase inhibitors or lithium. Behav Brain Res 1996, 73, 229–233. [Google Scholar] [CrossRef]
- Borsche, M., S. L. Pereira, C. Klein, and A. Grünewald. ‘Mitochondria and Parkinson’s Disease: Clinical, Molecular, and Translational Aspects. J Parkinsons Dis 2021, 11, 45–60. [Google Scholar] [CrossRef]
- Braak, H., K. Del Tredici, U. Rüb, R.A. de Vos, E.N. Jansen Steur, and E. Braak. ‘Staging of brain pathology related to sporadic Parkinson’s disease. Neurobiol Aging 2003, 24, 197–211. [Google Scholar] [CrossRef]
- Brusini, I., E. MacNicol, E. Kim, Ö Smedby, C. Wang, E. Westman, M. Veronese, F. Turkheimer, and D. Cash. ‘MRI-derived brain age as a biomarker of ageing in rats: validation using a healthy lifestyle intervention. Neurobiol Aging 2022, 109, 204–215. [Google Scholar] [CrossRef] [PubMed]
- Buddhala, C., S. K. Loftin, B.M. Kuley, N.J. Cairns, M.C. Campbell, J.S. Perlmutter, and P. T. Kotzbauer. ‘Dopaminergic, serotonergic, and noradrenergic deficits in Parkinson disease. Ann Clin Transl Neurol 2015, 2, 949–959. [Google Scholar] [CrossRef] [PubMed]
- Calhoun, V.D., T. Adali, G.D. Pearlson, and J. J. Pekar. ‘A method for making group inferences from functional MRI data using independent component analysis. Hum Brain Mapp 2001, 14, 140–151. [Google Scholar] [CrossRef]
- Carhart-Harris, R.L., S. Muthukumaraswamy, L. Roseman, M. Kaelen, W. Droog, K. Murphy, E. Tagliazucchi, E.E. Schenberg, T. Nest, C. Orban, R. Leech, L.T. Williams, T.M. Williams, M. Bolstridge, B. Sessa, J. McGonigle, M.I. Sereno, D. Nichols, P.J. Hellyer, P. Hobden, J. Evans, K.D. Singh, R.G. Wise, H.V. Curran, A. Feilding, and D. J. Nutt. ‘Neural correlates of the LSD experience revealed by multimodal neuroimaging. Proc Natl Acad Sci U S A 2016, 113, 4853–4858. [Google Scholar] [PubMed]
- Dafflon, J., W. H.L. Pinaya, F. Turkheimer, J.H. Cole, R. Leech, M.A. Harris, S.R. Cox, H.C. Whalley, A.M. McIntosh, and P. J. Hellyer. ‘An automated machine learning approach to predict brain age from cortical anatomical measures. Hum Brain Mapp 2020, 41, 3555–3566. [Google Scholar] [CrossRef]
- Delaville, C., P. D. Deurwaerdère, and A. Benazzouz. ‘Noradrenaline and Parkinson’s disease. Front Syst Neurosci 2011, 5, 31. [Google Scholar] [CrossRef] [PubMed]
- Devlin, Jacob, Ming-Wei Chang, Kenton Lee, and Kristina Toutanova. 2019. “BERT: Pre-training of Deep Bidirectional Transformers for Language Understanding.” In, 4171–4186. Minneapolis, Minnesota: Association for Computational Linguistics.
- Di Vico, I.A. Moretto, A. Tamanti, G. Tomelleri, G. Burati, D. Martins, O. Dipasquale, M. Veronese, A. Bertoldo, E. Menini, A. Sandri, S. Ottaviani, F.B. Pizzini, M. Tinazzi, and M. Castellaro. 2025. ‘Molecular-Informed Network Analysis Unveils Fatigue-Related Functional Connectivity in Parkinson’s Disease. Mov Disord.
- Dipasquale, O., D. Martins, A. Sethi, M. Veronese, S. Hesse, M. Rullmann, O. Sabri, F. Turkheimer, N.A. Harrison, M.A. Mehta, and M. Cercignani. ‘Unravelling the effects of methylphenidate on the dopaminergic and noradrenergic functional circuits. Neuropsychopharmacology 2020, 45, 1482–1489. [Google Scholar] [CrossRef]
- Doppler, C.E.J. A.M. Smit, M. Hommelsen, A. Seger, J. Horsager, M.B. Kinnerup, A.K. Hansen, T.D. Fedorova, K. Knudsen, M. Otto, A. Nahimi, P. Borghammer, and M. Sommerauer. 2021. ‘Microsleep disturbances are associated with noradrenergic dysfunction in Parkinson’s disease. Sleep 2021, 44. [Google Scholar] [CrossRef]
- Dosovitskiy, Alexey, Lucas Beyer, Alexander Kolesnikov, Dirk Weissenborn, Xiaohua Zhai, Thomas Unterthiner, Mostafa Dehghani, Matthias Minderer, Georg Heigold, Sylvain Gelly, Jakob Uszkoreit, and Neil Houlsby. 2020. ‘An Image is Worth 16x16 Words: Transformers for Image Recognition at Scale. ArXiv 2020.
- Elliott, M.L., A. R. Knodt, M. Cooke, M.J. Kim, T.R. Melzer, R. Keenan, D. Ireland, S. Ramrakha, R. Poulton, A. Caspi, T.E. Moffitt, and A. R. Hariri. ‘General functional connectivity: Shared features of resting-state and task fMRI drive reliable and heritable individual differences in functional brain networks. Neuroimage 2019, 189, 516–532. [Google Scholar]
- Elman, Jeffrey L. ‘Finding Structure in Time. Cognitive Science 1990, 14, 179–211. [Google Scholar] [CrossRef]
- Esteban, O., C. J. Markiewicz, R.W. Blair, C.A. Moodie, A.I. Isik, A. Erramuzpe, J.D. Kent, M. Goncalves, E. DuPre, M. Snyder, H. Oya, S.S. Ghosh, J. Wright, J. Durnez, R.A. Poldrack, and K. J. Gorgolewski. ‘fMRIPrep: a robust preprocessing pipeline for functional MRI. Nat Methods 2019, 16, 111–116. [Google Scholar] [CrossRef]
- Fagerholm, E.D., R. Leech, F.E. Turkheimer, G. Scott, and M. Brázdil. ‘Estimating the energy of dissipative neural systems. Cogn Neurodyn 2024, 18, 3839–3846. [Google Scholar] [CrossRef] [PubMed]
- Fischl, B. ‘FreeSurfer. Neuroimage 2012, 62, 774–781. [Google Scholar] [CrossRef] [PubMed]
- Glasser, M.F. , and D. C. Van Essen. ‘Mapping human cortical areas in vivo based on myelin content as revealed by T1- and T2-weighted MRI. J Neurosci 2011, 31, 11597–11616. [Google Scholar] [CrossRef]
- Grubbs, F.E. ‘Sample Criteria for Testing Outlying Observations’. Ann. Math. Statist. 1950, 21, 27–58. [Google Scholar] [CrossRef]
- Guyon, I. ‘An Introduction to Variable and Feature Selection. Journal of Machine Learning Research 2003, 3, 1157–1182. [Google Scholar]
- Hansen, J.Y., G. Shafiei, R.D. Markello, K. Smart, S.M.L. Cox, M. Nørgaard, V. Beliveau, Y. Wu, J.D. Gallezot, É Aumont, S. Servaes, S.G. Scala, J.M. DuBois, G. Wainstein, G. Bezgin, T. Funck, T.W. Schmitz, R.N. Spreng, M. Galovic, M.J. Koepp, J.S. Duncan, J.P. Coles, T.D. Fryer, F.I. Aigbirhio, C.J. McGinnity, A. Hammers, J.P. Soucy, S. Baillet, S. Guimond, J. Hietala, M.A. Bedard, M. Leyton, E. Kobayashi, P. Rosa-Neto, M. Ganz, G.M. Knudsen, N. Palomero-Gallagher, J.M. Shine, R.E. Carson, L. Tuominen, A. Dagher, and B. Misic. ‘Mapping neurotransmitter systems to the structural and functional organization of the human neocortex. Nat Neurosci 2022, 25, 1569–1581. [Google Scholar] [CrossRef]
- Hauglund, Natalie L. , Mie Andersen, Klaudia Tokarska, Tessa Radovanovic, Celia Kjaerby, Frederikke L. Sørensen, Zuzanna Bojarowska, Verena Untiet, Sheyla B. Ballestero, Mie G. Kolmos, Pia Weikop, Hajime Hirase, and Maiken Nedergaard. ‘Norepinephrine-mediated slow vasomotion drives glymphatic clearance during sleep. Cell 2025, 188, 606–622.e17. [Google Scholar] [CrossRef]
- Hawrylycz, M.J., E. S. Lein, A.L. Guillozet-Bongaarts, E.H. Shen, L. Ng, J.A. Miller, L.N. van de Lagemaat, K.A. Smith, A. Ebbert, Z.L. Riley, C. Abajian, C.F. Beckmann, A. Bernard, D. Bertagnolli, A.F. Boe, P.M. Cartagena, M.M. Chakravarty, M. Chapin, J. Chong, R.A. Dalley, B. David Daly, C. Dang, S. Datta, N. Dee, T.A. Dolbeare, V. Faber, D. Feng, D.R. Fowler, J. Goldy, B.W. Gregor, Z. Haradon, D.R. Haynor, J.G. Hohmann, S. Horvath, R.E. Howard, A. Jeromin, J.M. Jochim, M. Kinnunen, C. Lau, E.T. Lazarz, C. Lee, T.A. Lemon, L. Li, Y. Li, J.A. Morris, C.C. Overly, P.D. Parker, S.E. Parry, M. Reding, J.J. Royall, J. Schulkin, P.A. Sequeira, C.R. Slaughterbeck, S.C. Smith, A.J. Sodt, S.M. Sunkin, B.E. Swanson, M.P. Vawter, D. Williams, P. Wohnoutka, H.R. Zielke, D.H. Geschwind, P.R. Hof, S.M. Smith, C. Koch, S.G.N. Grant, and A. R. Jones. ‘An anatomically comprehensive atlas of the adult human brain transcriptome. Nature 2012, 489, 391–399. [Google Scholar] [PubMed]
- Hua, Jianping, Zixiang Xiong, James Lowey, Edward Suh, and Edward R. Dougherty. ‘Optimal number of features as a function of sample size for various classification rules. Bioinformatics 2004, 21, 1509–1515. [Google Scholar] [CrossRef]
- Jolliffe, I.T. 2002. Principal Component Analysis, Springer-Verlag New York, Inc: New York.
- Kopeć, K. Szleszkowski, D. Koziorowski, and S. Szlufik. 2023. ‘Glymphatic System and Mitochondrial Dysfunction as Two Crucial Players in Pathophysiology of Neurodegenerative Disorders. Int J Mol Sci 2023, 24. [Google Scholar] [CrossRef]
- Lawn, T., A. Giacomel, D. Martins, M. Veronese, M. Howard, F.E. Turkheimer, and O. Dipasquale. ‘Normative modelling of molecular-based functional circuits captures clinical heterogeneity transdiagnostically in psychiatric patients. Commun Biol 2024, 7, 689. [Google Scholar] [CrossRef]
- Lawn, T., M. A. Howard, F. Turkheimer, B. Misic, G. Deco, D. Martins, and O. Dipasquale. ‘From neurotransmitters to networks: Transcending organisational hierarchies with molecular-informed functional imaging. Neurosci Biobehav Rev 2023, 150, 105193. [Google Scholar] [CrossRef]
- López-Giménez, J.F. , and J. González-Maeso. ‘Hallucinogens and Serotonin 5-HT(2A) Receptor-Mediated Signaling Pathways. Curr Top Behav Neurosci 2018, 36, 45–73. [Google Scholar]
- Markello, Ross D. , Justine Y. Hansen, Zhen-Qi Liu, Vincent Bazinet, Golia Shafiei, Laura E. Suárez, Nadia Blostein, Jakob Seidlitz, Sylvain Baillet, Theodore D. Satterthwaite, M. Mallar Chakravarty, Armin Raznahan, and Bratislav Misic. ‘neuromaps: structural and functional interpretation of brain maps. Nature Methods 2022, 19, 1472–1479. [Google Scholar] [CrossRef]
- McIntosh, A.R., F. L. Bookstein, J.V. Haxby, and C. L. Grady. ‘Spatial pattern analysis of functional brain images using partial least squares. Neuroimage 1996, 3, 143–157. [Google Scholar] [CrossRef]
- Mehta, Kahini, Taylor Salo, Thomas J. Madison, Azeez Adebimpe, Danielle S. Bassett, Max Bertolero, Matthew Cieslak, Sydney Covitz, Audrey Houghton, Arielle S. Keller, Jacob T. Lundquist, Audrey Luo, Oscar Miranda-Dominguez, Steve M. Nelson, Golia Shafiei, Sheila Shanmugan, Russell T. Shinohara, Christopher D. Smyser, Valerie J. Sydnor, Kimberly B. Weldon, Eric Feczko, Damien A. Fair, and Theodore D. Satterthwaite. ‘XCP-D: A robust pipeline for the post-processing of fMRI data. Imaging Neuroscience 2024, 2, 1–26. [Google Scholar] [CrossRef]
- Mendes, Sergio Leonardo, Walter Hugo Lopez Pinaya, Pedro Mario Pan, Ary Gadelha, Sintia Belangero, Andrea Parolin Jackowski, Luis Augusto Rohde, Euripedes Constantino Miguel, and João Ricardo Sato. ‘GPT-based normative models of brain sMRI correlate with dimensional psychopathology. Imaging Neuroscience 2024, 2, 1–15. [Google Scholar] [CrossRef]
- Mosharov, E.V. M. Rosenberg, A.S. Monzel, C.A. Osto, L. Stiles, G.B. Rosoklija, A.J. Dwork, S. Bindra, Y. Zhang, M. Fujita, M.B. Mariani, M. Bakalian, D. Sulzer, P.L. De Jager, V. Menon, O.S. Shirihai, J.J. Mann, M. Underwood, M. Boldrini, M.T. de Schotten, and M. Picard. 2024. ‘A Human Brain Map of Mitochondrial Respiratory Capacity and Diversity. bioRxiv 2024. [Google Scholar]
- Murali Mahadevan, H., A. Hashemiaghdam, G. Ashrafi, and A. B. Harbauer. ‘Mitochondria in Neuronal Health: From Energy Metabolism to Parkinson’s Disease. Adv Biol (Weinh) 2021, 5, e2100663. [Google Scholar] [CrossRef]
- Nooner, Kate B., Stanley Colcombe, Russell Tobe, Maarten Mennes, Melissa Benedict, Alexis Moreno, Laura Panek, Shaquanna Brown, Stephen Zavitz, Qingyang Li, Sharad Sikka, David Gutman, Saroja Bangaru, Rochelle Tziona Schlachter, Stephanie Kamiel, Ayesha Anwar, Caitlin Hinz, Michelle Kaplan, Anna Rachlin, Samantha Adelsberg, Brian Cheung, Ranjit Khanuja, Chaogan Yan, Cameron Craddock, Vincent Calhoun, William Courtney, Margaret King, Dylan Wood, Christine Cox, Clare Kelly, Adriana DiMartino, Eva Petkova, Philip Reiss, Nancy Duan, Dawn Thompsen, Bharat Biswal, Barbara Coffey, Matthew Hoptman, Daniel C. Javitt, Nunzio Pomara, John Sidtis, Harold Koplewicz, Francisco X. Castellanos, Bennett Leventhal, and Michael Milham. 2012. ‘The NKI-Rockland Sample: A Model for Accelerating the Pace of Discovery Science in Psychiatry. Frontiers in Neuroscience 2012, 6.
- Paluszek, Michael, Stephanie Thomas, and Eric Ham. 2022. ‘MATLAB Machine Learning Toolboxes.’ in Michael Paluszek, Stephanie Thomas and Eric Ham (eds.), Practical MATLAB Deep Learning: A Projects-Based Approach (Apress: Berkeley, CA).
- Patt, S. , and L. Gerhard. ‘A Golgi study of human locus coeruleus in normal brains and in Parkinson’s disease. Neuropathol Appl Neurobiol 1993, 19, 519–523. [Google Scholar] [CrossRef] [PubMed]
- Petri, G., P. Expert, F. Turkheimer, R. Carhart-Harris, D. Nutt, P.J. Hellyer, and F. Vaccarino. ‘Homological scaffolds of brain functional networks. J R Soc Interface 2014, 11, 20140873. [Google Scholar] [CrossRef] [PubMed]
- Pudjihartono, N., T. Fadason, A.W. Kempa-Liehr, and J. M. O’Sullivan. ‘A Review of Feature Selection Methods for Machine Learning-Based Disease Risk Prediction. Front Bioinform 2022, 2, 927312. [Google Scholar] [CrossRef]
- Radford, Alec, Karthik Narasimhan, Tim Salimans, and Ilya Sutskever. 2018. ‘Improving language understanding by generative pre-training’.
- Radford, Alec, Jeff Wu, Rewon Child, David Luan, Dario Amodei, and Ilya Sutskever. 2019. “Language Models are Unsupervised Multitask Learners.” In.
- Razavi, Ali, Aaron Van den Oord, and Oriol Vinyals. 2019. ‘Generating diverse high-fidelity images with vq-vae-2. Advances in neural information processing systems 2019, 32.
- Sala-Llonch, Roser, David Bartrés-Faz, and Carme Junqué. 2015. ‘Reorganization of brain networks in aging: a review of functional connectivity studies. Frontiers in Psychology, 2015.
- Schaefer, A., R. Kong, E.M. Gordon, T.O. Laumann, X.N. Zuo, A.J. Holmes, S.B. Eickhoff, and B. T. T. Yeo. ‘Local-Global Parcellation of the Human Cerebral Cortex from Intrinsic Functional Connectivity MRI. Cereb Cortex 2018, 28, 3095–3114. [Google Scholar] [CrossRef]
- Scholtens, L.H., M. A. de Reus, S.C. de Lange, R. Schmidt, and M. P. van den Heuvel. ‘An MRI Von Economo - Koskinas atlas. Neuroimage 2018, 170, 249–256. [Google Scholar] [CrossRef]
- Schwilden, H. ‘Concepts of EEG processing: from power spectrum to bispectrum, fractals, entropies and all that. Best Pract Res Clin Anaesthesiol 2006, 20, 31–48. [Google Scholar] [CrossRef]
- Shafto, M.A., L. K. Tyler, M. Dixon, J.R. Taylor, J.B. Rowe, R. Cusack, A.J. Calder, W.D. Marslen-Wilson, J. Duncan, T. Dalgleish, R.N. Henson, C. Brayne, and F. E. Matthews. ‘The Cambridge Centre for Ageing and Neuroscience (Cam-CAN) study protocol: a cross-sectional, lifespan, multidisciplinary examination of healthy cognitive ageing. BMC Neurol 2014, 14, 204. [Google Scholar] [CrossRef]
- Smith, S.M. T. Elliott, F. Alfaro-Almagro, P. McCarthy, T.E. Nichols, G. Douaud, and K. L. Miller. 2020. ‘Brain aging comprises many modes of structural and functional change with distinct genetic and biophysical associations. Elife 2020, 9. [Google Scholar] [CrossRef]
- Sporns, O. ‘Structure and function of complex brain networks. Dialogues Clin Neurosci 2013, 15, 247–262. [Google Scholar] [CrossRef] [PubMed]
- Surmeier, D.J., J. A. Obeso, and G. M. Halliday. ‘Selective neuronal vulnerability in Parkinson disease. Nat Rev Neurosci 2017, 18, 101–113. [Google Scholar] [CrossRef]
- van den Oord, Aäron, Oriol Vinyals, and Koray Kavukcuoglu. 2017. ‘Neural discrete representation learning. CoRR abs/1711.00937 (2017). arXiv 2017, arXiv:1711.00937.
- Van Essen, D.C., S. M. Smith, D.M. Barch, T.E. Behrens, E. Yacoub, and K. Ugurbil. ‘The WU-Minn Human Connectome Project: an overview. Neuroimage 2013, 80, 62–79. [Google Scholar] [CrossRef] [PubMed]
- Vaswani, Ashish, Noam Shazeer, Niki Parmar, Jakob Uszkoreit, Llion Jones, Aidan Gomez, Lukasz Kaiser, and Illia Polosukhin. 2017. ‘Attention Is All You Need’.
- Wagstyl, K., S. Larocque, G. Cucurull, C. Lepage, J.P. Cohen, S. Bludau, N. Palomero-Gallagher, L.B. Lewis, T. Funck, H. Spitzer, T. Dickscheid, P.C. Fletcher, A. Romero, K. Zilles, K. Amunts, Y. Bengio, and A. C. Evans. ‘BigBrain 3D atlas of cortical layers: Cortical and laminar thickness gradients diverge in sensory and motor cortices. PLoS Biol 2020, 18, e3000678. [Google Scholar] [CrossRef]
- Weinshenker, D. ‘Long Road to Ruin: Noradrenergic Dysfunction in Neurodegenerative Disease. Trends Neurosci 2018, 41, 211–223. [Google Scholar] [CrossRef]
- Yarkoni, T., R. A. Poldrack, T.E. Nichols, D.C. Van Essen, and T. D. Wager. ‘Large-scale automated synthesis of human functional neuroimaging data. Nat Methods 2011, 8, 665–670. [Google Scholar] [CrossRef]
- Zarow, C., S. A. Lyness, J.A. Mortimer, and H. C. Chui. ‘Neuronal loss is greater in the locus coeruleus than nucleus basalis and substantia nigra in Alzheimer and Parkinson diseases. Arch Neurol 2003, 60, 337–341. [Google Scholar] [CrossRef]
- Zilles, K. , and N. Palomero-Gallagher. ‘Multiple Transmitter Receptors in Regions and Layers of the Human Cerebral Cortex. Front Neuroanat 2017, 11, 78. [Google Scholar] [CrossRef] [PubMed]
Figure 1.
Core components of a Transformer language model. A) A Transformer processes an input sequence using two parts: an encoder (ENC) and a decoder (DEC). The input sentence is split into four tokens (e.g., the first token is “how”) and passed into the encoder, one at a time. The encoder is made up of N identical stacked layers, which iteratively refine each token’s representation in B). The decoder also contains N layers and receives the target sentence shifted by one position to the right — this allows it to predict the next word at each step during training. B) Zoom-in on a single encoder and decoder layer from Panel A. Each encoder layer takes the word embeddings and adds positional encodings, then passes the result through multi-head self-attention, followed by a feed-forward process, which transforms each token’s vector independently using a small neural network. Decoder layers add two components: 1) masked self-attention, which prevents access to future tokens during generation, and 2) cross-attention, which allows decoder tokens to attend to encoder outputs. C) During pre-training (top left), the model learns to associate each word with a 512-dimensional vector of values between –1 and 1. Words that often appear in similar contexts—like ‘teacher’ and ‘student’—end up close together in this high-dimensional space. In contrast, usually unrelated words like ‘banana’ are positioned farther away. The plot on the right shows a 2D projection of these relative positions for illustration. D) To encode word order, Transformers add 512 sine waves of varying frequency—one per embedding dimension. Each word’s position in the sentence (e.g., ‘Once’ = 0, ‘upon’ = 1, etc.) is used to sample all sinusoids at a fixed horizontal offset (shown as vertical dashed lines). These values are then added to the word embeddings from C), imprinting the token’s position in the model. E) Multi-head attention allows the model to learn different types of relationships in parallel. For instance, one head might capture long-range dependencies—e.g., linking the subject ‘bear’ to the object ‘woods’—while another might attend to local context, such as words nearby to the current token ‘bear’—i.e., ‘The’ and ‘walked’.
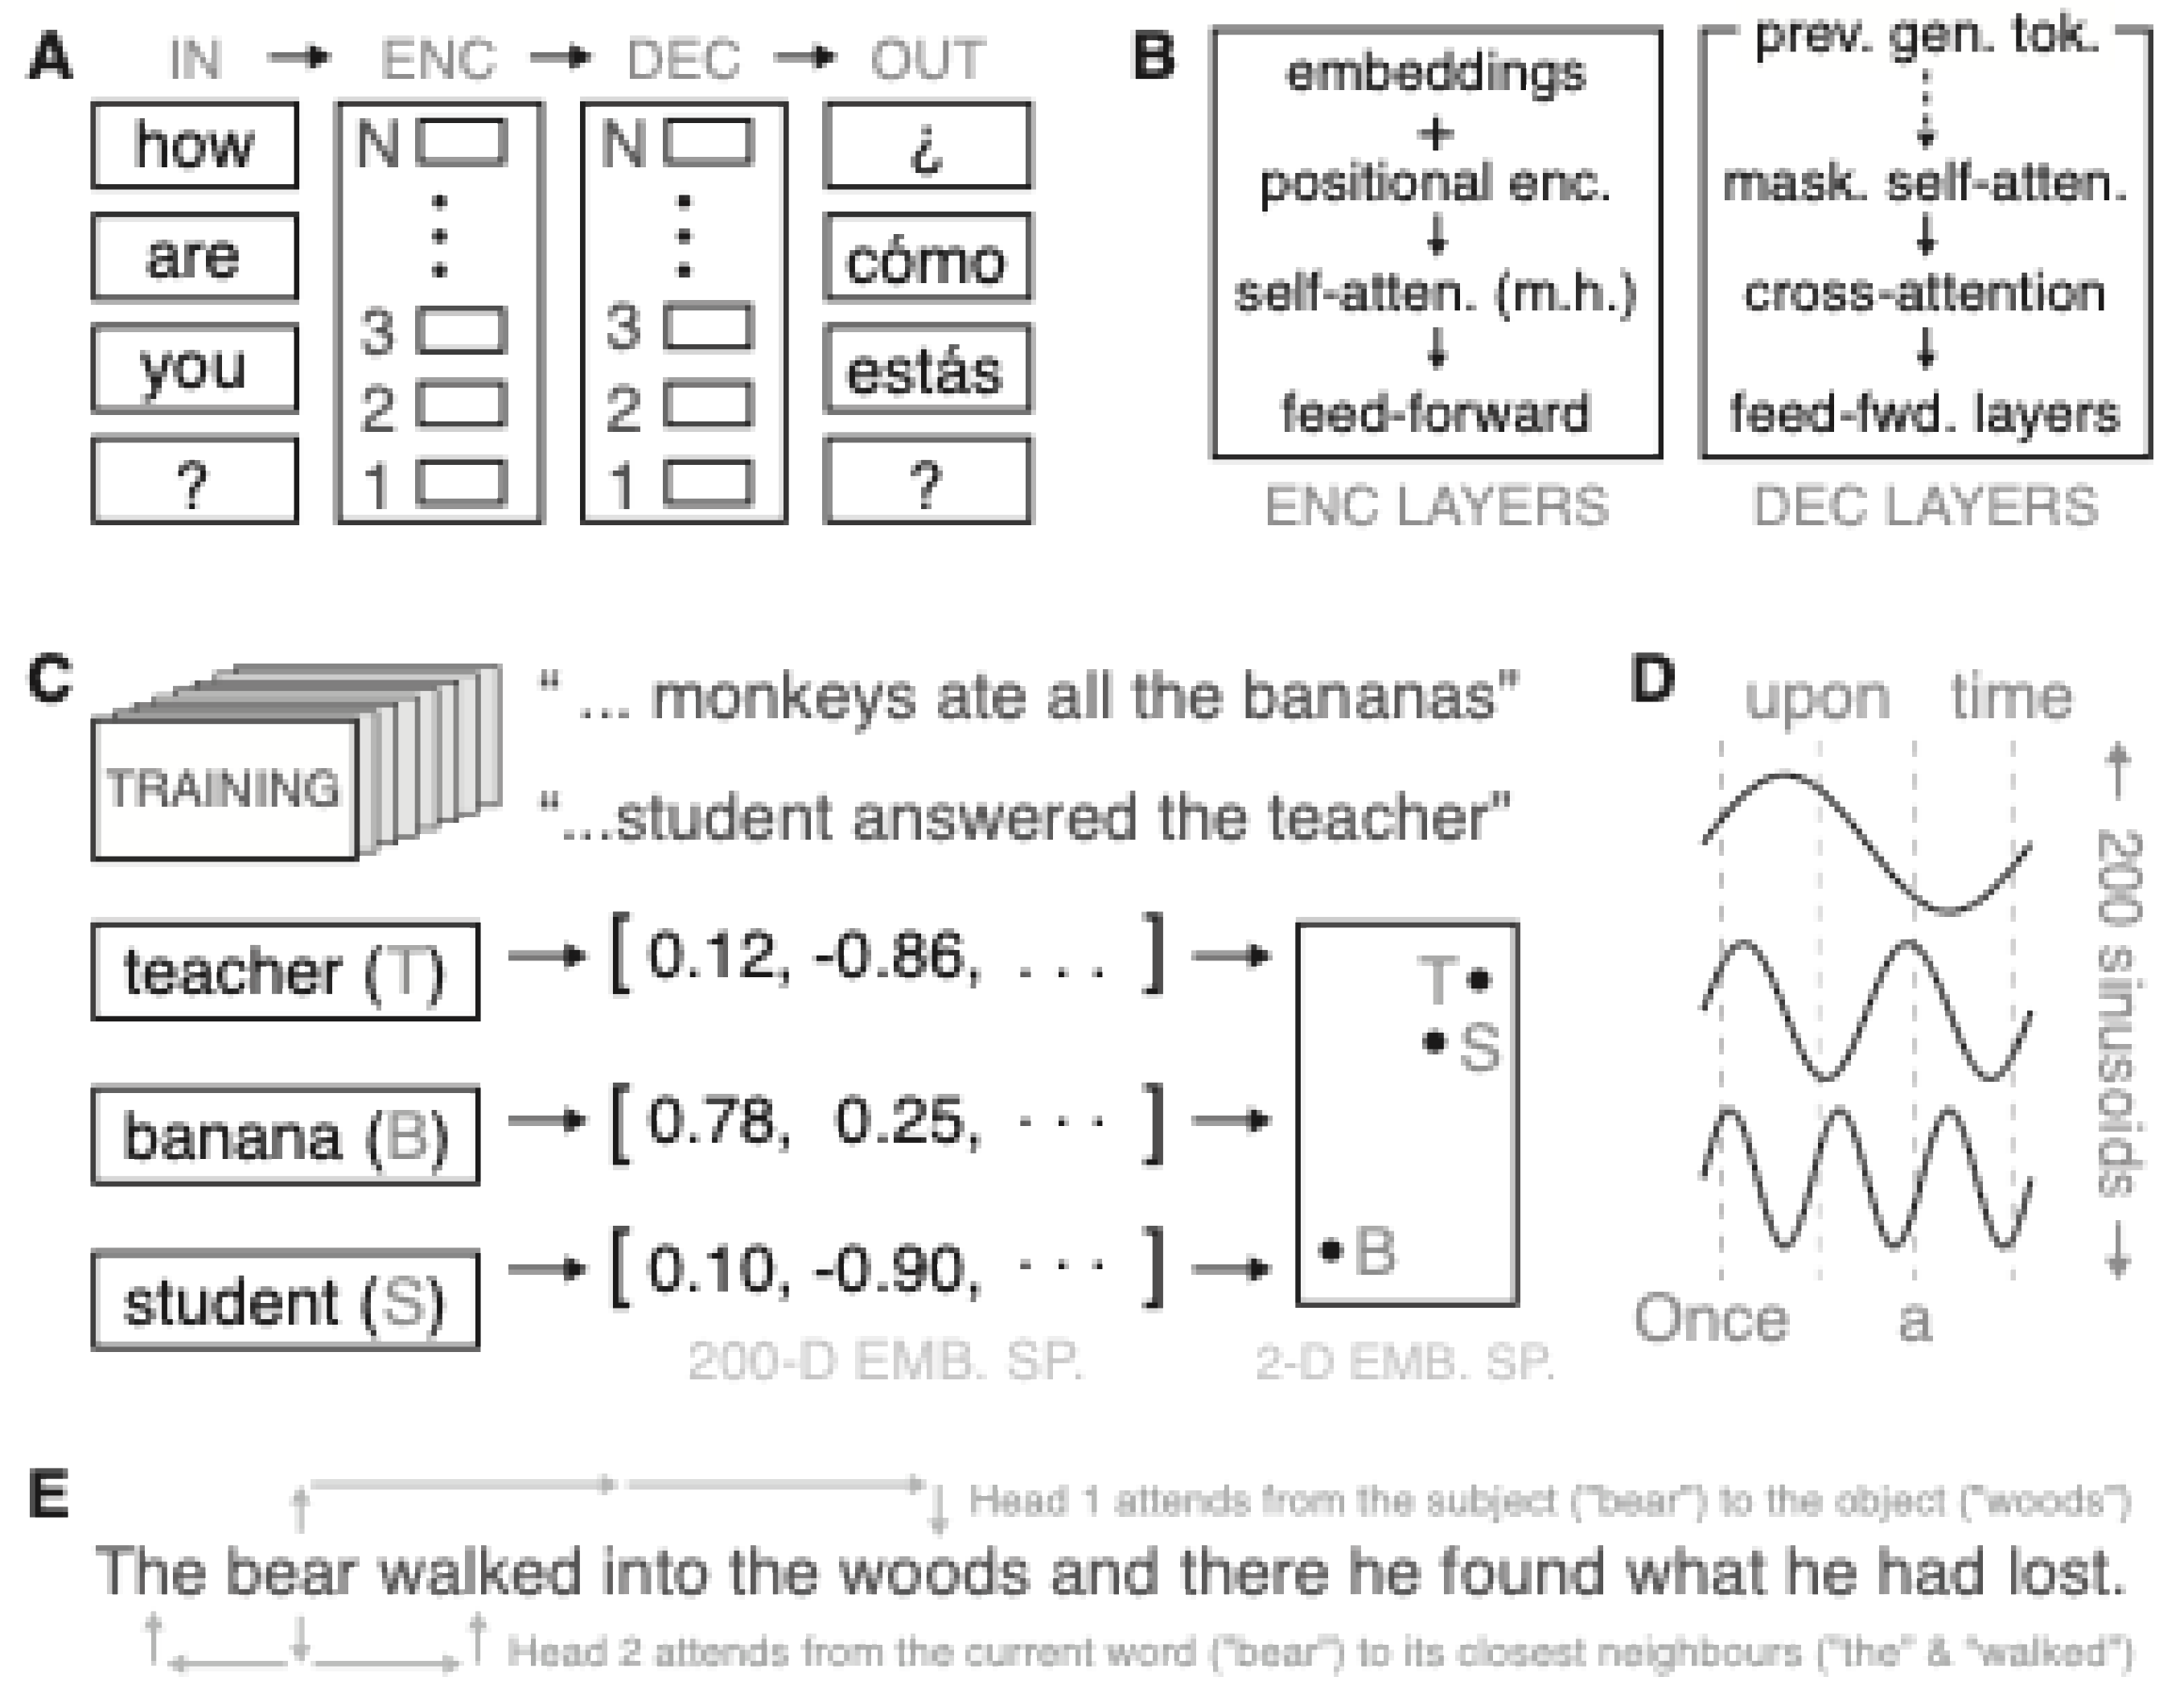
Figure 2.
Neuro-BOT Encoder Architecture. A) Schematic of Neuro-BOT model. Inputs consist of features from brain regions such as the ACC, which are processed to predict brain states (e.g., rest or task). B) Encoder stack. Regional embeddings are modulated by spatial priors, passed through constrained self-attention, and projected by feedforward layers. C) Region-level feature embeddings are derived from neurobiological maps (e.g., gene expression), and then projected into 512-dimensional embedding space. We show a 2D projection of this space on the right, in which highly related regions such as V1 and V2 are close together, whereas the PCC is further away. D) Spatial basis functions use sinusoidal encodings to embed anatomical layout using smooth patterns across cortical regions (e.g., the IPL). E) Biologically structured attention heads model long- and short-range inter-regional dependencies.
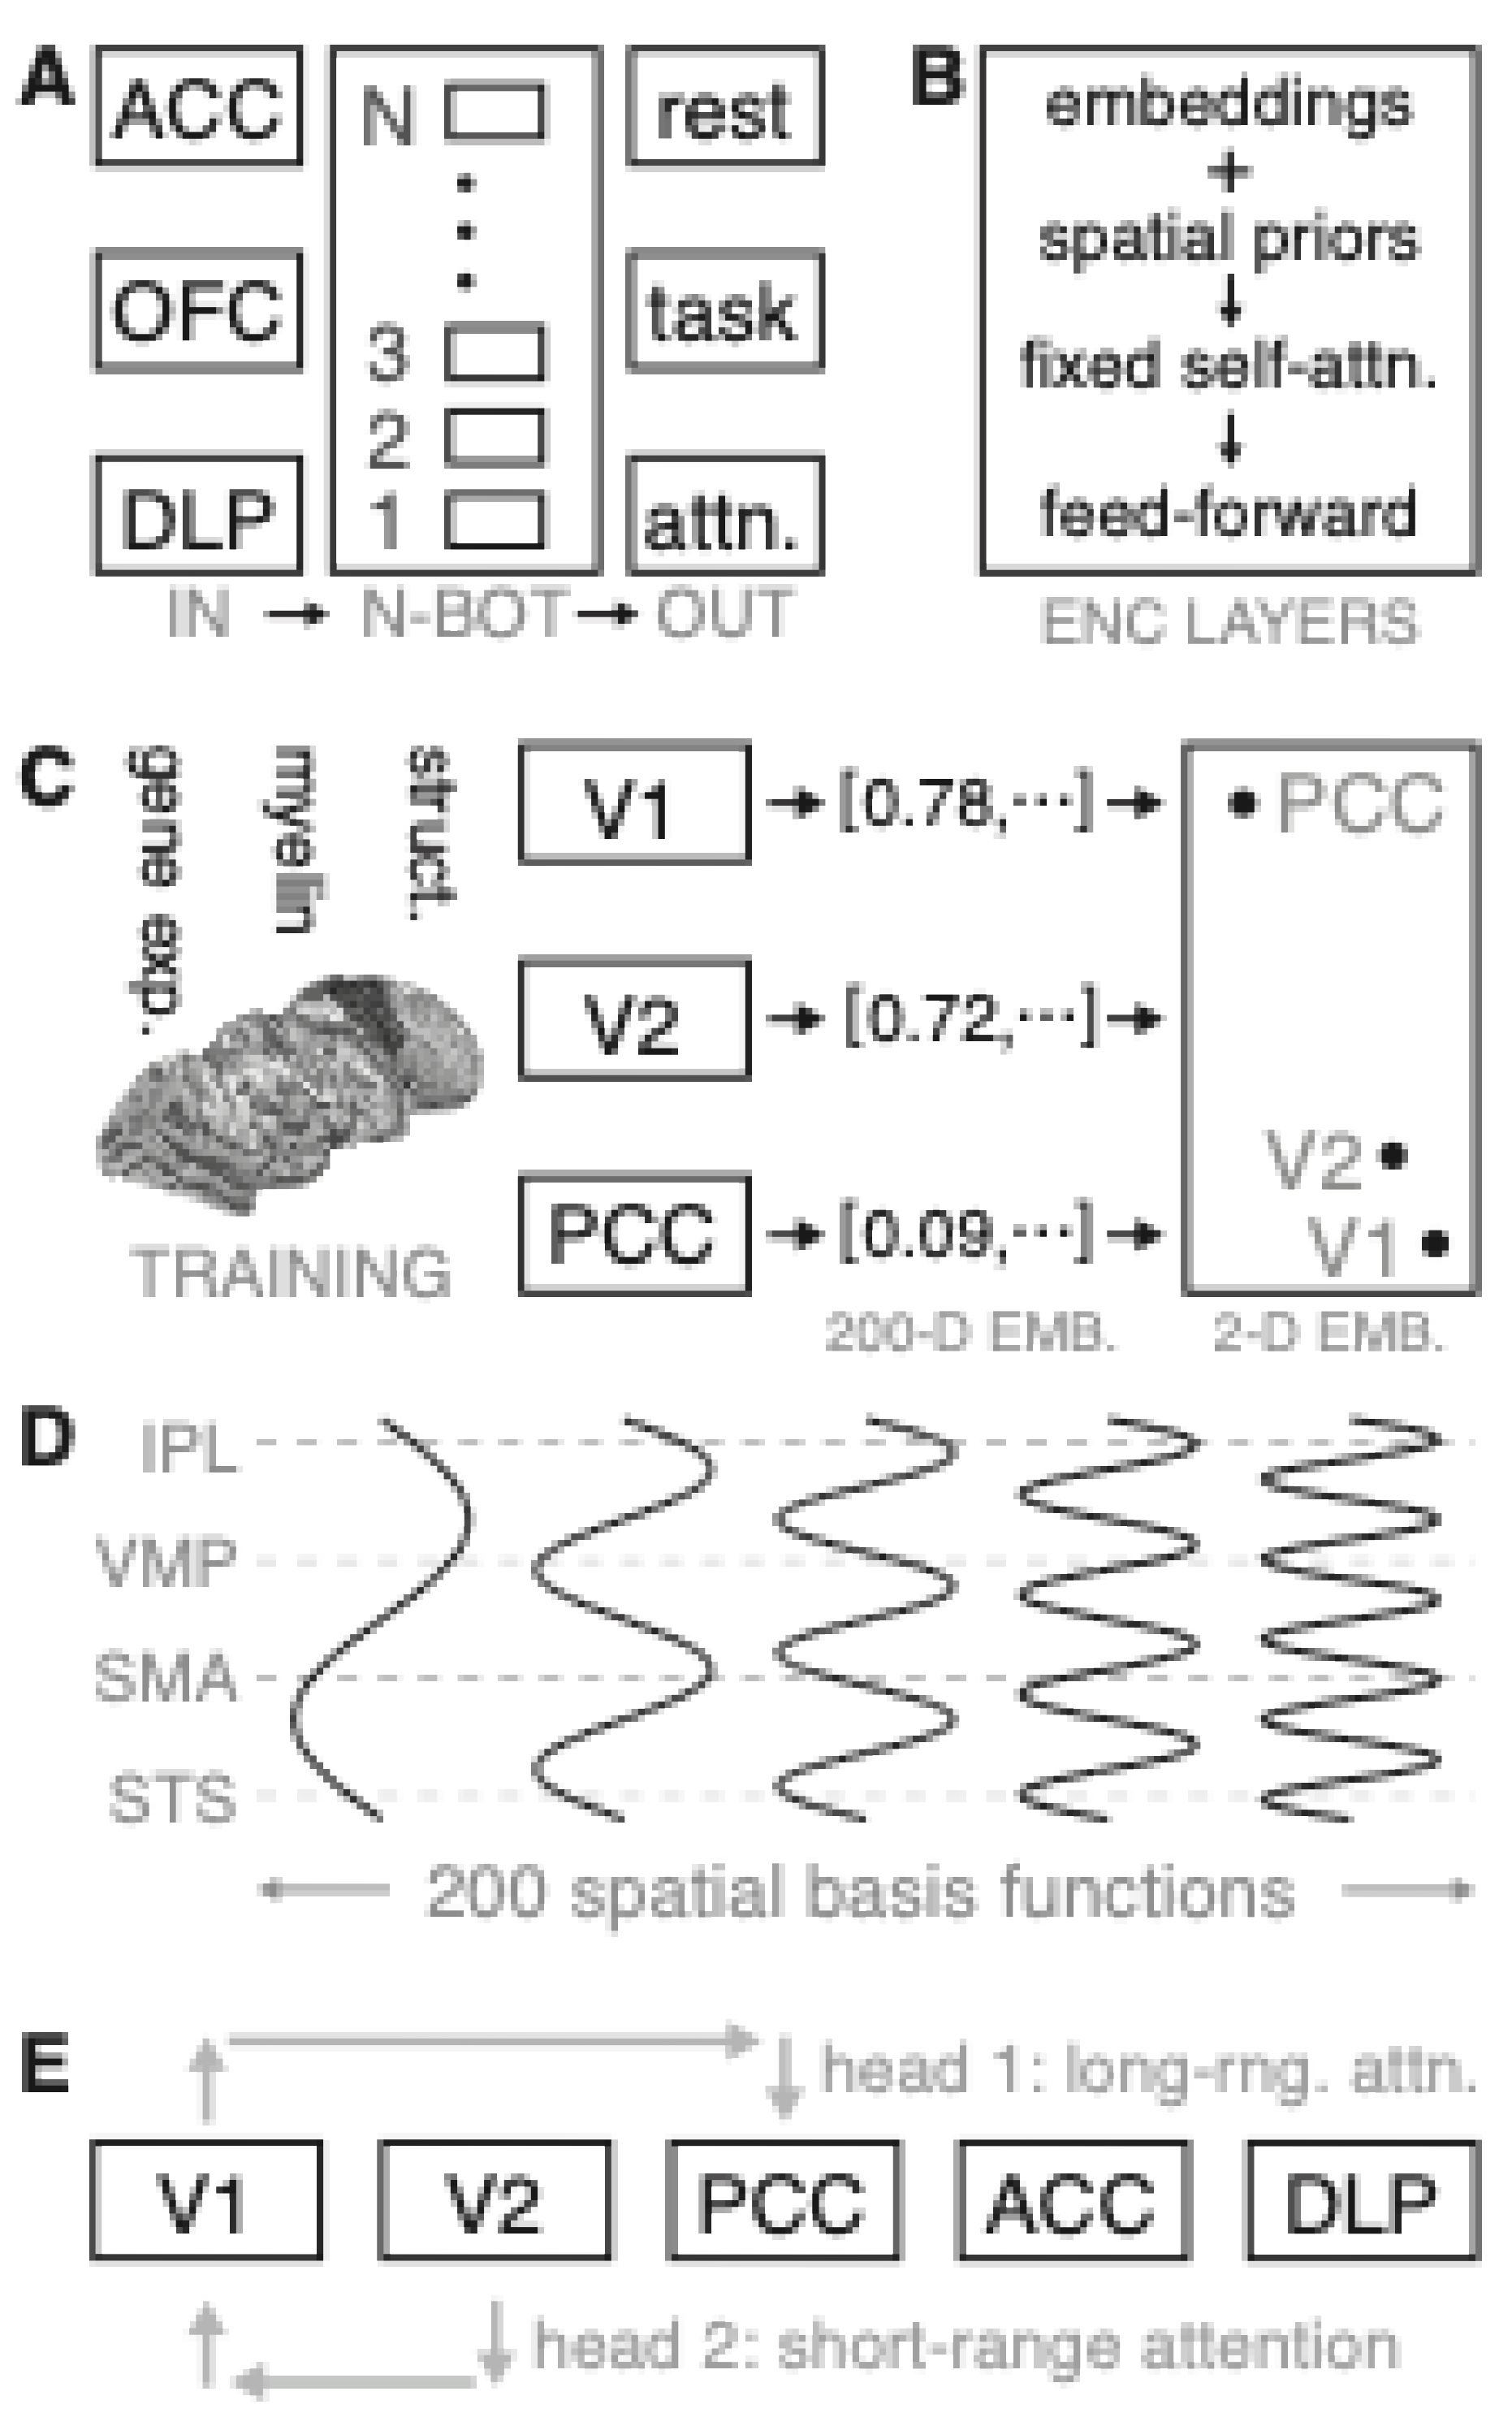

Table 1.
Mean classification accuracy (%) across the top three statistical models for each layer type and configuration. The noradrenaline-based positional encoder produced a significant performance improvement over all other conditions , as assessed by both parametric and non-parametric outlier detection.
| TYPE OF LAYER | LAYER | ACCURACY (%) |
| NONE | 71.3 | |
|
POSITIONAL ENCODERS |
DOPAMINE | 73.0 |
| SEROTONIN | 74.7 | |
| NORADRENALINE | 89.7* | |
| ACETYLCHOLINE | 71.3 | |
| MITOCHONDRIAL COMPLEX II | 73.0 | |
| MITOCHONDRIAL COMPLEX IV | 71.8 | |
| MITOCHONDRIAL DENSITY | 71.3 | |
| TISSUE RESPIRATORY CAPACITY | 75.3 | |
| MITOCHON. RESPIR. CAPACITY | 73.0 | |
| SELF-ATTENTION LAYERS | PRINCIPAL COMPONENT 1 | 71.3 |
| PRINCIPAL COMPONENT 2 | 73.0 | |
| PRINCIPAL COMPONENT 3 | 73.0 | |
| PRINCIPAL COMPONENT 4 | 71.8 | |
| PRINCIPAL COMPONENT 5 | 71.8 |
Table 2.
NKI dataset. Each cell reports the average classification accuracy (%) across the top three statistical models for each attention layer. Results are shown for three feature counts (N = 50, 100, 200). No layer yielded statistically significant performance improvements across any condition.
Table 2.
NKI dataset. Each cell reports the average classification accuracy (%) across the top three statistical models for each attention layer. Results are shown for three feature counts (N = 50, 100, 200). No layer yielded statistically significant performance improvements across any condition.
| LAYER TYPE | LAYER | ACCURACY (%) | ||
| # FEATURES | N=200 | N=100 | N = 50 | |
| NONE | 93.6 | 83.9 | 77.0 | |
|
POSITIONAL ENCODERS |
DOPAMINE | 94.2 | 84.3 | 77.9 |
| SEROTONIN | 94.2 | 85.6 | 77.4 | |
| NORADRENALINE | 93.8 | 84.8 | 77.8 | |
| ACETYLCHOLINE | 93.7 | 83.8 | 78.6 | |
| MITOCHON. COMPLEX II | 93.6 | 82.8 | 77.7 | |
| MITOCHON. COMPLEX IV | 94.0 | 85.9 | 77.2 | |
| MITOCHONDRIAL DENSITY | 94.2 | 83.7 | 79.1 | |
| TISSUE RESP. CAPACITY | 94.2 | 84.2 | 77.5 | |
| MITOCHO. RESP. CAPAC. | 94.2 | 83.4 | 76.8 | |
| SELF-ATTN. LAYERS | PRINCIPAL COMPONENT 1 | 92.6 | 84.0 | 77.4 |
| PRINCIPAL COMPONENT 2 | 94.2 | 82.7 | 77.1 | |
| PRINCIPAL COMPONENT 3 | 92.9 | 83.1 | 76.9 | |
| PRINCIPAL COMPONENT 4 | 93.7 | 83.1 | 77.8 | |
| PRINCIPAL COMPONENT 5 | 93.3 | 81.7 | 77.1 | |
Table 3.
CAM-CAN dataset. Mean classification accuracy (%) across the top three statistical models for each attention layer, shown at three feature counts (N = 20, 100, 200). As with the NKI dataset, no attention layer produced statistically significant gains in classification accuracy at any feature level.
| LAYER TYPE | LAYER | ACCURACY (%) | ||
| # FEATURES | N = 200 | N = 100 | N = 20 | |
| NONE | 92.0 | 90.9 | 85.4 | |
|
POSITIONAL ENCODERS |
DOPAMINE | 92.5 | 91.2 | 86.4 |
| SEROTONIN | 91.9 | 91.5 | 85.0 | |
| NORADRENALINE | 91.8 | 90.0 | 83.0 | |
| ACETYLCHOLINE | 92.1 | 90.0 | 84.0 | |
| MITOCHON. COMPLEX II | 92.1 | 90.5 | 85.1 | |
| MITOCHON. COMPLEX IV | 91.2 | 91.0 | 86.1 | |
| MITOCHONDRIAL DENSITY | 92.4 | 90.1 | 84.9 | |
| TISSUE RESP. CAPACITY | 92.5 | 89.8 | 85.7 | |
| MITOCHON. RESP. CAPAC. | 92.5 | 91.0 | 84.4 | |
| SELF-ATTN. LAYERS | PRINCIPAL COMPONENT 1 | 92.2 | 90.9 | 84.8 |
| PRINCIPAL COMPONENT 2 | 92.9 | 89.7 | 85.2 | |
| PRINCIPAL COMPONENT 3 | 91.0 | 90.5 | 85.7 | |
| PRINCIPAL COMPONENT 4 | 91.1 | 90.2 | 83.3 | |
| PRINCIPAL COMPONENT 5 | 92.2 | 89.5 | 84.5 | |
Table 4.
LSD dataset. Average classification accuracy (%) for distinguishing pre- and post-drug conditions, shown for each monoaminergic attention layer across two independent studies. While all configurations reached 100% accuracy in Study 1, only the serotonin layer yielded a statistically significant gain in Study 2 (p < 0.05).
| LAYER TYPE | LAYER | ACCURACY (%) | |
| STUDY 1 | STUDY 2 | ||
| NONE | 100 | 91.1 | |
|
POSITIONAL ENCODERS |
DOPAMINE | 100 | 91.1 |
| SEROTONIN | 100 | 97.8* | |
| NORADRENALINE | 100 | 91.1 | |
Disclaimer/Publisher’s Note: The statements, opinions and data contained in all publications are solely those of the individual author(s) and contributor(s) and not of MDPI and/or the editor(s). MDPI and/or the editor(s) disclaim responsibility for any injury to people or property resulting from any ideas, methods, instructions or products referred to in the content. |
© 2025 by the authors. Licensee MDPI, Basel, Switzerland. This article is an open access article distributed under the terms and conditions of the Creative Commons Attribution (CC BY) license (http://creativecommons.org/licenses/by/4.0/).
Copyright: This open access article is published under a Creative Commons CC BY 4.0 license, which permit the free download, distribution, and reuse, provided that the author and preprint are cited in any reuse.


