
Submitted:
20 September 2025
Posted:
22 September 2025
You are already at the latest version
Abstract
This study characterizes the spatial attributes of the Kotkot Watershed Forest Reserve
(KWFR) in Metro Cebu, Philippines, to provide a foundation for hydrological
modeling and conservation planning. Watersheds in rapidly urbanizing regions
face increasing land use pressures, making it essential to assess their
biophysical variability and susceptibility to degradation. Using the Soil and
Water Assessment Tool Plus (SWAT+), the 7,950.78-hectare KWFR was delineated
into 17 subbasins and 187 landscape units (LSUs), allowing for detailed
analysis of land use, soil, and slope distribution. Results show that perennial
cropland dominates the watershed, accounting for 81.56% of the total area,
while forested zones are largely confined to higher elevations. Soil mapping
identified Baguio clay loam as the most extensive type (66.59%), followed by
Faraon clay (30.71%) and Mandaue clay loam (2.78%). Slope analysis indicated
that 36% of the area falls under steep to very steep categories (30–>50%),
with an additional 29.03% under moderately steep terrain (18–30%). These
conditions, intersecting with agricultural expansion, highlight critical areas
prone to soil erosion, sedimentation, and nonpoint source pollution. The
datasets generated offer essential inputs for hydrological simulation and
inform evidence-based land use planning to enhance the ecological resilience
and water security functions of the KWFR.
Keywords:
Kotkot Watershed Forest Reserve
; SWAT+
; Land use
; Soil Distribution
; Hydrological modelin
1. Introduction
The hydrological cycle is a key component of Earth’s system processes, playing a central role in water resource management, food security, and ecosystem sustainability. Understanding how water flows across watersheds is crucial for addressing climate variability, predicting flood and drought occurrences, managing land use changes, and ensuring the long-term availability of water resources [1,2] In this regard, physically based distributed hydrological models such as the Soil and Water Assessment Tool (SWAT) and its updated version, SWAT+, have gained prominence for simulating watershed-scale hydrological processes in both gauged and ungauged basins [3,4].
The SWAT+ model, in particular, offers improved capabilities in representing watershed processes by allowing a more flexible spatial representation of landscape elements and routing options [4]. This is especially important in tropical countries like the Philippines, where watersheds are characterized by diverse topographies, land uses, and climatic conditions. One such watershed is the KWFR in Cebu, Philippines, an area of strategic importance for local water supply, agriculture, and biodiversity conservation. The KWFR has been subject to increasing anthropogenic pressures, such as deforestation, agricultural intensification, urban encroachment, and informal settlements, all of which alter the natural hydrologic regime and threaten water quality and availability [5].
Modeling watersheds like KWFR is essential for establishing a robust baseline understanding of how water flows, infiltrates, evaporates, and transports sediments across diverse landscapes and under varying environmental conditions. This foundational knowledge is particularly critical in tropical upland systems, where steep terrain, heterogeneous land cover, and human-induced changes such as deforestation and agricultural expansion strongly influence hydrological processes [6,7]. By applying the Soil and Water Assessment Tool Plus (SWAT+), it becomes possible to simulate and quantify the spatial and temporal dynamics of key hydrologic components—runoff, infiltration, evapotranspiration, and sediment yield—with high spatial resolution and process-level detail.
SWAT+ is especially well-suited for watersheds like KWFR due to its capability to integrate detailed spatial data on land use, soil types, topography, and climate inputs, thereby enabling the delineation of landscape units that reflect the real-world heterogeneity of the watershed [3,8]. This level of modeling granularity is instrumental not only in understanding current watershed functioning but also in evaluating the potential outcomes of various land and water management scenarios. For instance, changes in forest cover, agricultural intensification, or urban expansion can be modeled to assess their impact on water availability, sediment transport, and water quality. Likewise, anticipated shifts in precipitation and temperature patterns due to climate change can be analyzed to identify areas of vulnerability and guide adaptive responses.
As such, watershed-scale hydrological modeling serves as a decision-support tool for integrated watershed management (IWM), enabling policymakers, planners, and local stakeholders to test and compare the effectiveness of conservation measures, reforestation programs, sustainable agriculture practices, and ecosystem-based adaptation strategies before implementation [9,10]. In the context of the KWFR, an important water source for Metro Cebu, such modeling is indispensable for ensuring water security, minimizing land degradation, and building long-term watershed resilience.
Despite the abundance of hydrological models available, many watersheds in the Philippines remain underrepresented in modeling studies due to limited availability of high-resolution data, technical expertise, and funding [11]. This lack of data-driven assessments limits the capacity of local governments and stakeholders to make informed decisions on water resource management, especially in rural areas. Addressing this gap, the present study employs the SWAT+ model to characterize the KWFR in terms of its subbasin delineation, land use, soil, and slope classifications.
This study aims to generate a spatially distributed baseline hydrologic representation of the KWFR using SWAT+, supported by remote sensing data, GIS tools, and field-collected information. It is a foundational step in building a long-term modeling framework to support water resource planning and ecological conservation in the area. Specifically, the study addresses the following objectives: (1) delineate the watershed into subbasins and landscape units (LSUs) using digital elevation and stream networks; (2) classify land use, slope, and soil types relevant to hydrologic processes; and (3) provide a preliminary characterization of hydrologic components for future calibration and validation using SWAT+.
By incorporating recent methodologies and leveraging open-source tools, this research contributes to the growing literature on tropical watershed modeling and supports evidence-based policymaking for watershed protection. The study aligns with the broader objectives of sustainable development and climate resilience under the Philippine Water Supply and Sanitation Master Plan [12] especially in ensuring reliable water supply amidst environmental change.
2. Materials and Methods
2.1. Study Site Description
2.1.1. Geographic location and administrative jurisdiction
The KWFR is located in Cebu Province, spanning Cebu City in the south, Danao City in the north, and the municipalities of Liloan, Consolacion, Compostela, and Balamban, at geographic coordinates 10.34°–10.44°N latitude, 123.90°–124.11°E (Figure 1). The KWFR was integrated into the Central Cebu Protected Landscape (CCPL) through R.A. No. 9486, together with the Lusaran WFR, Mananga WFR, Central Cebu National Park (CCNP), Buhisan WFR, and Sudlon National Park (SNP) Covering approximately 7,950.78 ha based on SWAT+. Cebu Island stretches approximately 196–215 km in length, with a maximum width of 32–35 km and a total land area of about 446,800–508,839 ha, making it one of the major islands of the Central Visayas. The island is predominantly rolling to mountainous, with about 30% of its terrain characterized by slopes of 18% or less, while the remainder consists of moderately to steeply sloping uplands [13,14]. The area is also topographically varied, with elevations ranging from below 100 m to over 700 m above sea level, influencing the spatial distribution of land use and hydrologic response units [15].
2.1.2. Climate and Hydrology
Climatically, the KWFR falls under Type III of the Modified Coronas Climate Classification of the Philippines, which is distinguished by the absence of a clearly defined dry season, with relatively drier conditions from November to April and abundant rainfall during the rest of the year [16, 17]. Based on data from nearby PAGASA synoptic stations, the watershed experiences an average annual precipitation of approximately 69.82 mm, with mean temperatures ranging from 25.12 °C to 29.04 °C and an average relative humidity of 77.38% [18]. This climatic regime exerts significant influence on watershed hydrology and ecosystem dynamics, shaping runoff, soil moisture, and evapotranspiration patterns. Moreover, the interplay of heavy seasonal rainfall and topographic steepness elevates the risk of soil erosion, flash flooding, and sediment yield, underscoring the importance of hydrological modeling in water resource planning.
2.1.3. Geology, soils and land use
Geologically, the KWFR is underlain by a diverse suite of formations reflecting Cebu Island’s complex tectonic history. Tertiary limestones, including the Tuburan Limestone, dominate the lower elevations and shape karst landscapes, while metamorphic and ultramafic basement rocks contribute to the rugged and steep terrain in the uplands [19, 20]. The upper reaches host a mosaic of lithologies, including basalt, shale/mudstone, limestone, diorite, and conglomerates, indicative of Cebu’s position within a volcanic arc system.
The soils are equally varied, with Baguio clay loam and Mandaue clay loam as the dominant types, interspersed with smaller patches of Faraon clay, particularly in higher elevations and steep phases [21,22]. These soil types are derived from weathered volcanic and sedimentary substrates and are highly susceptible to erosion when vegetation cover is removed. Combined with steep topography and dynamic land use (forest patches, agriculture, pasture, wetlands, and urban expansion), these geologic–edaphic conditions contribute to the watershed’s vulnerability to soil erosion, land degradation, and sediment yield.
These conditions such as geological diversity, fragile soils, and intensive land-use conversion, highlight the watershed’s ecological sensitivity. With ongoing deforestation, agricultural expansion, and increasing freshwater demand from Metro Cebu, the integration of land use/land cover (LULC) analysis and hydrological modeling becomes imperative to guide sustainable watershed management and mitigate trade-offs between domestic water supply, agricultural productivity, and biodiversity conservation.
2.2. SWAT+ Model Configuration
The Soil and Water Assessment Tool Plus (SWAT+) was chosen for its ability to simulate hydrologic and biogeophysical processes in heterogeneous watersheds. Unlike the classic SWAT, SWAT+ subdivides subbasins into Landscape Units (LSUs) that preserve spatial identity, defined by unique combinations of land use, soil, and slope class [23,24]. This is particularly suited to tropical uplands such as KWFR, where steep terrain and fragmented land use drive localized hydrologic responses.
Model setup was conducted using QSWAT+ 3.0.3 in QGIS 3.40.4 (Bratislava), linked to the SWAT+ Editor for parameterization and simulation. The 12.5 m ALOS PALSAR DEM provided topographic inputs for watershed delineation, including flow directions, stream networks, and slope gradients [25]. After DEM processing and stream thresholding, the watershed was delineated into 17 subbasins and 187 LSUs, forming the basis for simulating evapotranspiration, infiltration, surface runoff, and erosion.
2.3. Data Inputs
To operationalize the model, spatial and tabular datasets were standardized for consistency:
2.3.1. Land Use/Land Cover (LULC)
Based on NAMRIA (2020) data, refined using Google Earth (2021–2023) to update transitional zones and misclassified areas. LULC classes were harmonized with SWAT+ codes (e.g., OFOR = open forest, AGRL/PERC = agriculture/perennial crops, URBN = urban), reflecting forests in uplands, agriculture in mid-elevations, and built-up zones downstream [26,27].
2.3.2. Soils
Derived from BSWM maps, rasterized at 30 m resolution and cross-checked with the Harmonized World Soil Database (HWSD). Three main soil types were identified: Baguio Clay Loam (BGCL) with moderate permeability, Faraon Clay (FC) with high clay content and low infiltration, and Mandaue Clay Loam (MCL) with intermediate properties [28,29].
2.3.3. Slope
Generated from the ALOS PALSAR DEM and classified into six FAO (2006) slope categories (0–3%, 3–8%, 8–18%, 18–30%, 30–50%, >50%), consistent with BSWM/DENR (2021) for erosion risk and land suitability analysis.
2.3.4. Climate
Daily precipitation and min/max temperature (2020–2023) from PAGASA were interpolated and converted into SWAT+ time series inputs.
All layers were projected to UTM Zone 51N (WGS84) and resampled to 30 m resolution, balancing computational efficiency with terrain detail. Although calibration and validation were not yet possible due to limited hydrologic data, this baseline model provides a reference framework for future refinement.
3. Results
3.1. Watershed Delineation and Spatial Characteristics
The KWFR was delineated into 17 subbasins and 187 Landscape Units (LSUs) using the SWAT+ framework. The delineation employed a high-resolution ALOS PALSAR DEM (12.5 m), which allowed precise extraction of watershed boundaries, flow directions, and stream networks. Figure 2 shows the delineated watershed, highlighting the topographic diversity of the area. Upland subbasins are characterized by steep, forested terrain, while downstream subbasins exhibit gentler slopes dominated by agriculture and peri-urban development.
3.2. Land Use/ Land Cover
3.2.1. Land Use/land cover distribution by area and percentage
Table 1 presents the land use/land cover (LULC) composition of the Kotkot Watershed Forest Reserve (KWFR). The watershed is predominantly agricultural, with perennial cropland (AGRL/PERC) occupying 81.56% of the total area (6,484.51 ha). Forested areas (FRST) account for 10.85% (862.47 ha), primarily concentrated in the uplands. Built-up areas (URBN) cover 3.94% (313.54 ha), while inland water bodies represent 1.70% (135.51 ha). Minor land cover types include shrubland/brushland (1.93%) and pasture/grassland (0.09%).
3.2.2. Spatial pattern/arrangement and use/land cover in KWFR
Figure 3 shows the spatial arrangement of land uses within the Kotkot Watershed Forest Reserve. Forested areas are concentrated in upper elevations and steep slopes, agricultural lands dominate mid- to lower-elevation zones with moderate slopes, and urban or built-up areas are clustered in downstream subbasins along settlement corridors. Wetlands and pasturelands are spatially limited, occurring mainly in transitional or low-lying areas.
3.3. Soil Distribution
3.3.1. Soil distribution of KWFR by area and percentage
Table 2 presents the soil composition of the Kotkot Watershed Forest Reserve (KWFR). The watershed is dominated by Baguio clay loam (BGCL), which covers 66.59% of the total area (5,294.16 ha). Faraon Clay (FC) accounts for 30.71% (2,441.43 ha), while Mandaue clay loam (MCL) is the least represented at 2.78% (220.82 ha).
3.3.2. Spatial pattern/arrangement of soils of KWFR.
Figure 4 shows the spatial distribution of soils within the Kotkot Watershed Forest Reserve (KWFR). Baguio clay loam (BGCL) dominates the western and central portions, Faraon Clay (FC) is concentrated in the central to eastern regions, and Mandaue clay loam (MCL) occurs in isolated patches along the eastern fringes. This arrangement highlights the heterogeneity of soil cover across the watershed.
3.4. Slope Distribution and Hydrological Implications
3.4.1. Slope distribution in per cent based on FAO 2006/BSWM
Table 3 shows that the terrain of the Kotkot Watershed Forest Reserve (KWFR) is predominantly steep to very steep. Slopes of 18–30% are the most extensive, covering 2,308.34 ha (29.03%) of the watershed. Steeper zones of 30–50% occupy 2,267.73 ha (28.52%), while areas exceeding 50% account for 670.50 ha (8.43%). Collectively, slopes greater than 30% comprise more than one-third of the watershed. By contrast, gently sloping to nearly level areas (0–8%) cover only 13%, primarily concentrated in the eastern lowlands.
3.4.2. Spatial pattern/arrangement of slope classes in KWFR (in percent)
Figure 5 illustrates the spatial distribution of slope classes across the Kotkot Watershed Forest Reserve (KWFR). Steep to very steep terrain (>30%) is concentrated in the upper and central subbasins, which are predominantly forested. Moderately sloping areas (8–18% and 18–30%) extend across mid-elevation zones, where agricultural expansion has encroached into slopes exceeding 18%. Field-based LSU assessments confirmed farming activities in at least six subbasins with slopes steeper than 18%. Lowland and gently sloping areas (<8%) occur mainly in the downstream portions but remain spatially limited.
3.5. Watershed Configuration and Hydrological Modeling
The delineated subbasins and Landscape Units (LSUs) provide the structural foundation for hydrologic modeling of the Kotkot Watershed Forest Reserve (KWFR) using SWAT+ (Soil and Water Assessment Tool Plus). Each LSU integrates land use, soil type, and slope class, allowing spatially distributed representation of hydrological processes such as evapotranspiration, surface runoff, infiltration, and soil erosion. The LSU configuration achieved fine spatial resolution, enhancing the model’s ability to capture the physical heterogeneity of the watershed. This setup establishes a robust framework for subsequent model calibration and validation using observed hydrological and sediment data.
4. Discussion
4.1. Watershed Delineation and Spatial Characteristics
The spatial disaggregation into subbasins and LSUs improves the model’s ability to simulate hydrologic processes by capturing the heterogeneity of terrain, land use, and soil characteristics [23,24]. The use of a high-resolution DEM is critical for accurate delineation of hydrological response units and enhances the spatial realism of hydrological simulations [25]. The observed gradient in topography and land use reflects the ecological and management complexity typical of tropical mountainous catchments in the Philippines [30,31]. Furthermore, the LSU configuration provides a robust framework for localized hydrological assessments and supports the design of targeted interventions in soil conservation, water resource management, and climate resilience.
4.2. Land Use/ Land Cover and Hydrologic Implications
4.2.1. Land Use/land cover distribution by area and percentage
The dominance of perennial cropland indicates strong agricultural pressure on the KWFR, with forested zones increasingly restricted to upland areas. This spatial distribution mirrors broader trends in tropical watersheds where agricultural expansion occurs at the expense of forest cover. Although shrubland/brushland and pasture/grassland occupy limited areas, they remain hydrologically significant due to their influence on infiltration, groundwater recharge, and water retention processes [32,33]. The presence of built-up areas and water bodies further underscores the multifunctional nature of the watershed and suggests potential trade-offs between land productivity, ecological resilience, and hydrological stability.
4.2.2. Spatial pattern/arrangement and use/land cover in KWFR
Agricultural land use in mid- to lower-elevation zones underscores both the suitability of these areas for cultivation and their vulnerability to runoff and erosion when management practices are inadequate [34,35]. Concentration of urban development in downstream corridors increases impervious surfaces, altering runoff dynamics and potentially heightening flood risks. Although wetlands and pasturelands occupy smaller areas, their hydrological roles in water storage, flood buffering, and nutrient cycling remain essential for watershed resilience [32, 36 ,37]. The spatial distribution of land use reflects the interaction between topography and human activity. Forests in upland and steep areas provide critical ecosystem services such as flow regulation, infiltration enhancement, and erosion control [38].
4.2.3. Hydrologic Implications
The observed LULC configuration has significant implications for watershed hydrology. Forested LSUs are associated with high infiltration rates, enhanced groundwater recharge, and reduced surface runoff [38,39]. In contrast, agriculture and urban LSUs, particularly on moderate to steep slopes, exhibit higher runoff, reduced infiltration, and elevated erosion risk [35,40]. Recent studies confirm that cropland expansion and urbanization in tropical uplands increase nonpoint source pollution and sediment transport, threatening downstream water quality and ecosystem services [41,42,43]
The heterogeneity of land use across KWFR highlights the necessity of spatially explicit hydrological modeling to identify erosion-prone hotspots and inform land management. Protecting forest cover and wetlands, while promoting sustainable agricultural practices (e.g., contour farming, agroforestry), is critical for mitigating runoff and sustaining the watershed’s ecosystem services [39].
4.3. Soil Distribution and its hydrologic implications
4.3.1. Soil distribution of KWFR by area and percentage
The predominance of Baguio clay loam indicates that much of the watershed is underlain by soils with relatively good water-holding capacity but also susceptibility to erosion on steep slopes. The extensive coverage of Faraon Clay further highlights areas where limited permeability and high runoff potential may influence hydrological responses, particularly during intense rainfall events. Although Mandaue clay loam constitutes only a small fraction of the watershed, its localized distribution may still play an important role in shaping infiltration and drainage patterns. Together, the soil composition underscores the need to account for spatial variability in soil properties when modeling hydrological processes and designing conservation strategies for the KWFR.
4.3.2. Spatial pattern/arrangement of soils of KWFR.
The heterogeneous soil distribution contributes to variable hydrological responses across subbasins. Upland areas dominated by Faraon Clay are more susceptible to surface runoff and erosion due to lower permeability, increasing the risk of sedimentation during high-intensity rainfall. In contrast, BGCL-dominated zones provide greater infiltration capacity and can serve as groundwater recharge areas, enhancing baseflow during dry periods [34,40]. The limited occurrence of MCL along the eastern fringes, while spatially minor, may create localized differences in drainage and infiltration. These spatial contrasts underscore the importance of integrating soil variability into watershed modeling to capture hydrological processes accurately and to inform site-specific conservation strategies.
4.3.3. Hydrologic implications
The soils of the KWFR are highly variable, shaping infiltration, runoff, erosion potential, and plant productivity across the basin. Baguio Clay Loam (BGCL) is the most extensive soil type, covering 66.59% of the watershed, and is predominantly found in the western and central zones. It is generally deep and moderately well-drained, supporting substantial vegetative cover and contributing to high water retention capacity, which reduces surface runoff and regulates baseflow [21,18].
In contrast, Faraon Clay (FC) occupies 30.71% of the watershed, concentrated in central to eastern subbasins where sloping terrain coincides with this soil’s high clay content. FC is less permeable, leading to reduced infiltration and greater susceptibility to surface runoff and erosion, especially during heavy rainfall events. This vulnerability underscores the need for conservation measures such as contour farming, terracing, or vegetative buffer strips in FC-dominated zones to prevent sediment loss and downstream siltation [44,45].
Mandaue Clay Loam (MCL), though covering only 2.78% of the watershed, occurs in scattered patches along the eastern fringes. With intermediate permeability, MCL influences local runoff and infiltration dynamics and requires careful management in subbasins where it overlaps with agricultural use [29]. The spatial heterogeneity of these soils, as shown in Figure 5, creates contrasting hydrological responses within the watershed, where BGCL-dominated areas act as recharge and regulation zones, while FC- and MCL-dominated areas are prone to runoff and erosion. This diversity highlights the necessity of incorporating accurate soil representation in hydrological models like SWAT+, as well as implementing soil-specific land management practices to enhance resilience, reduce erosion, and sustain water provisioning functions [46]
4.4. Slope Distribution and Hydrological Implications
4.4.1. Slope distribution in percent based on FAO 2006/BSWM
The prevalence of steep to very steep slopes indicates a high degree of topographic constraint in the KWFR, shaping both land-use distribution and hydrological processes [47,48]. Areas with slopes above 30% are especially vulnerable to soil erosion and mass wasting, particularly where agricultural expansion occurs without adequate conservation measures [49,50]. The concentration of gently sloping terrain in the eastern lowlands reflects their suitability for settlement and cultivation, but this also increases the likelihood of land use pressures in those limited areas [51]. The dominance of steep terrain underscores the need for slope-sensitive land management strategies, including soil conservation, reforestation, and erosion control measures to safeguard watershed stability and downstream water resources [52,53].
4.4.2. Spatial pattern/arrangement of slope classes in KWFR
The concentration of steep to very steep terrain in the upper and central subbasins emphasizes the watershed’s susceptibility to erosion and sediment yield, particularly under increasing land use pressures [53,54]. Agricultural encroachment into slopes above 18% highlights the expansion of cultivation into marginal lands, increasing risks of soil loss and nonpoint source pollution [53]. Field validation strengthens the interpretation that inappropriate farming practices on sloping terrain exacerbate watershed degradation [50]. Meanwhile, the scarcity of lowland and gently sloping areas concentrates settlement and infrastructure in narrow downstream corridors, indirectly intensifying cultivation on steeper slopes. These spatial dynamics underscore the need for slope-sensitive land use regulation, agroforestry, and soil conservation practices to mitigate erosion risks and sustain watershed functions [53].
4.4.3. Hydrologic Implications
Slope is a key driver of hydrological processes, influencing infiltration, overland flow, sediment transport, and land suitability. As slope steepness increases, the risks of soil erosion, mass wasting, and sediment yield rise substantially, especially in areas where vegetation cover is degraded [35,55]. When steep slopes are converted to agriculture or settlements, soil detachment and sediment delivery to streams accelerate, compromising water quality, aquatic habitats, and downstream reservoirs [56]. Recent studies confirm that slope–land use interactions are among the most critical determinants of watershed sediment yield under climate and land use pressures in tropical catchments [29,35].
The spatial overlap of steep terrain with agricultural encroachment in KWFR highlights priority zones for conservation. Recommended interventions include vegetative buffer strips, reforestation of vulnerable uplands, contour plowing, and terracing, which can substantially reduce erosion and improve infiltration [57]. These nature-based solutions not only mitigate slope-driven degradation but also align with integrated watershed management principles that aim to balance ecological integrity, land productivity, and water security [58].
4.5. Watershed Configuration and Hydrological Modeling
The LSU-based framework significantly improves the predictive capacity of SWAT+ in watersheds with complex terrain and mixed land uses, such as KWFR. By accounting for spatial heterogeneity, the model can generate more reliable estimates of water balance components and sediment dynamics [24]. Such detail is particularly valuable for assessing land use change impacts and identifying priority areas for targeted soil and water conservation interventions [24]. Once calibrated, the model will enable scenario-based planning, allowing stakeholders to evaluate conservation strategies, land cover transitions, and climate variability. Moreover, the spatially explicit outputs provide baseline data essential for integrated water resources management (IWRM), supporting the sustainable management of KWFR as a critical water source for Metro Cebu [59].
5. Conclusions
The KWFR is characterized by agricultural dominance, fragmented forest cover in steep uplands, and built-up expansion in downstream zones. Its soils, primarily clay loams, generally support infiltration and baseflow, but areas with high clay content and cultivation on sloping terrain are prone to runoff and erosion. The predominance of steep to very steep slopes further increases vulnerability to soil erosion, sedimentation, and water quality decline under intensive land use pressures. These findings demonstrate that KWFR is ecologically sensitive, requiring targeted conservation measures such as reforestation, vegetative buffers, contour farming, and soil management practices. Integrating these interventions into policy frameworks, watershed planning, and community-based management will be critical for enhancing resilience, protecting fragile ecosystems, and sustaining KWFR’s role as a vital water source for Metro Cebu.
Author Contributions
Analysis, C.O.O.; writing—original draft, C.O.O.; writing—review & editing, C.C.F.; methodology, M.L. and C.C.F.; supervision, M.L. and C.C.F. All authors have read and agreed to the published version of the manuscript.
Funding
Please add: This research was funded by the Department of Science and Technology—Engineering Research and Development for Technology (DOST-ERDT) scholarship program.
Data Availability Statement
The raw data supporting the conclusions of this article will be made available by the authors on request.
Conflicts of Interest
The authors declare no conflicts of interest.
Abbreviations
The following abbreviations are used in this manuscript:
| KWFR | Kotkot Watershed Forest Reserve |
| SWAT | Soil and Water Assessment Tool |
| LSU | Landscape Unit/s |
| GIS | Geographic Information System |
| CCPL | Central Cebu Protected Landscape |
| LULC | Land Use/ Land Cover |
| FAO | Food and Agriculture Organization |
| DENR | Department of Environment and Natural Resources |
| DEM | Digital Elevation Model |
| BGCL | Baguio Clay Loam |
| FC | Faraon Clay |
| MCL | Mandaue Clay Loam |
References
- Liu, M.; Wang, D.; Chen, X.; Chen, Y.; Gao, L.; Deng, H. Impacts of climate variability and land use on the blue and green water resources in a subtropical basin of China. Sci. Rep. 2022, 12, 20993. [Google Scholar] [CrossRef] [PubMed]
- Zhang, L.; Nan, Z.; Xu, Y.; Li, S. Hydrological impacts of land use change and climate variability in the headwater region of the Heihe River Basin, Northwest China. PLoS ONE 2016, 11, e0158394.Author 1, A.; Author 2, B. Book Title, 3rd ed.; Publisher: Publisher Location, Country, 2008; pp. 154–196.
- Gitau, M.W.; Chaubey, I. Regionalization of SWAT model parameters for use in ungauged watersheds. Water 2010, 2, 849–871. Author 1, A.B. (University, City, State, Country); Author 2, C. (Institute, City, State, Country). Personal communication, 2012. [CrossRef]
- Bailey, R.T.; Bieger, K.; Arnold, J.G.; Bosch, D.D. A new physically-based spatially-distributed groundwater flow module for SWAT+. Hydrology 2020, 7, 75. [Google Scholar]
- Department of Environment and Natural Resources—Environmental Management Bureau (DENR-EMB). (2021). Water quality status report of rivers in Cebu City. Environmental Management Bureau Region 7. https://r7.emb.gov.ph.
- Nkwasa, A.; Chawanda, C.J.; Jägermeyr, J.; van Griensven, A. Improved representation of agricultural land use and crop management for large-scale hydrological impact simulation in Africa using SWAT+. Hydrol. Earth Syst. Sci. 2022, 26, 71–92. [Google Scholar] [CrossRef]
- Sorribas, M.V.; Bravo, J.M.; Paz, A.R.; Collischonn, W.; van Griensven, A. Large wetlands representation in SWAT+: The case of the Pantanal in the Paraguay River Basin. Front. Water 2024, 6, 1451648. [Google Scholar]
- Naik, M.; Abiodun, B.J. Modelling the potential of land use change to mitigate the impacts of climate change on future drought in the Western Cape, South Africa. Theor. Appl. Climatol. 2024, 155, 6371–6392. [Google Scholar] [CrossRef]
- López-Ballesteros, A.; Senent-Aparicio, J.; Srinivasan, R.; Pérez-Sánchez, J. Assessing the impact of best management practices in a highly anthropogenic and ungauged watershed using the SWAT model: A case study in the El Beal Watershed (Southeast Spain). Agronomy 2019, 9, 576. [Google Scholar] [CrossRef]
- Briones, R.; Ella, V.; Bantayan, N. Hydrologic impact evaluation of land use and land cover change in Palico Watershed, Batangas, Philippines using the SWAT model. J. Environ. Sci. Manag. 2016, 19, 82–96. [Google Scholar] [CrossRef]
- Hoey, T.B.; Tolentino, P.L.M.; Guardian, E.L.; Perez, J.E.G.; Williams, R.D.; Boothroyd, R.J.; David, C.P.C.; Paringit, E.C. Flood estimation for ungauged catchments in the Philippines. Hydrol. Earth Syst. Sci. Discuss. 2024, 2024, 1–26. [Google Scholar]
- National Economic and Development Authority (NEDA). Philippine Development Plan 2023–2028. NEDA: Pasig City, Philippines, 2023.
- Quimio, F.G. Land resources and slope classification of Cebu Island, Philippines. Bureau of Soils and Water Management, Department of Agriculture: Quezon City, Philippines, 2006.
- Encyclopædia Britannica. Cebu Island. Encyclopædia Britannica, Inc. 2016. Available online: https://www.britannica.com/place/Cebu-Island-Philippines.
- Department of Environment and Natural Resources (DENR). Protected Areas of Central Visayas: Status Report. DENR–Region 7: Cebu City, Philippines, 2021.
- Philippine Atmospheric, Geophysical and Astronomical Services Administration (PAGASA). Climate Change in the Philippines. Technical Report; DOST-PAGASA: Quezon City, Philippines, 2011. [Google Scholar]
- Cinco, T.A.; de Guzman, R.G.; Hilario, F.D.; Wilson, D.M. Long-term trends and extremes in observed daily precipitation and near-surface air temperature in the Philippines for the period 1951–2010. Atmos. Res. 2014, 145–146, 12–26.
- Lasco, R.; Pulhin, F.; Sanchez, J.; Villamor, G.; Abelard, K.; Villegas, K. Climate change and forest ecosystems in the Philippines: Vulnerability, adaptation and mitigation. J. Environ. Sci. Manag. 2008, 11, 1–14. [Google Scholar]
- Rodrigo, J.; Schlagintweit, F. The Lower Cretaceous Tuburan Limestone of Cebu Island, Philippines: Microfacies, micropalaeontology, biostratigraphy, and palaeogeographic perspectives. Carnets Geol. 2022, 22, 661–679. [Google Scholar] [CrossRef]
- Peterson, J.A. Landscape evolution in Cebu, Central Philippines: The impact of sea level, social history, and tectonism on archaeological landscapes. Asian Perspect. 2013, 52, 190–212. [Google Scholar] [CrossRef]
- Paringit, E.C.; Otadoy, R.E. Land cover and vegetation dynamics in Cebu Island, Philippines. University of the Philippines Diliman: Quezon City, Philippines, 2007.
- University of San Carlos—Phil-LiDAR 1 Project. LiDAR surveys and flood mapping of Balamban River Basin, Cebu: Soil classification report. University of San Carlos: Cebu City, Philippines, 2015.
- Bieger, K.; Hörmann, G.; Fohrer, N. Simulation of streamflow and sediment with the Soil and Water Assessment Tool in a data scarce catchment in the Three Gorges Region, China. J. Environ. Qual. 2014, 43, 37–45. [Google Scholar] [CrossRef] [PubMed]
- Arnold, J.G.; Moriasi, D.N.; Gassman, P.W.; Abbaspour, K.C.; White, M.J.; Srinivasan, R.; Santhi, C.; Harmel, R.D.; van Griensven, A.; Van Liew, M.W.; Kannan, N.; Zehnder, A.J.B. SWAT+: The new version of the Soil and Water Assessment Tool. J. Hydrol. 2018, 563, 219–233. [Google Scholar]
- Gemechu, T.M.; Zhao, H.; Bao, S.; Yangzong, C.; Liu, Y.; Li, F.; Li, H. Estimation of hydrological components under current and future climate scenarios in Guder Catchment, Upper Abbay Basin, Ethiopia, using the SWAT. Sustainability 2021, 13, 9689. [Google Scholar] [CrossRef]
- Bermoy, M.M.; Cacayan, V.O.; Carido, J.C.; Apdohan, A.G.; Cacayan, A.O. Prediction of future land use land cover (LULC) and assessment of its impact on the water supply availability of Butuan City–Taguibo River Watershed and Forest Reserve (TRWFR), Philippines. Int. Arch. Photogramm. Remote Sens. Spatial Inf. Sci. 2023, XLVIII-4/W6-2022, 81–86.
- Candido, C.G.; Blanco, A.C.; Borlongan, N.J.B.; de la Cruz, R.M. Multisource and multitemporal land cover mapping of Greater Luzon Island using Google Earth Engine. Int. Arch. Photogramm. Remote Sens. Spatial Inf. Sci. 2023, XLVIII-4/W8-2023, 93–99. [Google Scholar] [CrossRef]
- Rawls, W.J.; Brakensiek, D.L.; Saxton, K.E. Estimation of soil water properties. Trans. ASAE 1982, 25, 1316–1320. [Google Scholar] [CrossRef]
- Ella, V.B. Simulating soil erosion and sediment yield in small upland watersheds using the WEPP model. Univ. Philipp. Los Baños, 2005.
- Soriano, M.; Hilvano, N.; Garcia, R.; Hao, A.J.; Alegre, A.; Tiburan, C., Jr. Land use/land cover change detection and urban sprawl analysis in the Mount Makiling Forest Reserve watersheds and buffer zone, Philippines. Environments 2019, 6, 9. [Google Scholar] [CrossRef]
- Encisa-Garcia, J.O.; Pulhin, J.M.; Cruz, R.V.O.; Simondac-Peria, A.C.; Ramirez, M.A.M.; De Luna, C.C. Land use/land cover changes assessment and forest fragmentation analysis in the Baroro River Watershed, La Union, Philippines. J. Environ. Sci. Manag. 2020, SI-2, 14–27.
- Fohrer, N.; Haverkamp, S.; Eckhardt, K.; Frede, H.-G. Hydrologic response to land use changes on the catchment scale. Phys. Chem. Earth B 2001, 26, 577–582. [Google Scholar] [CrossRef]
- Namara, R.E.; Awuni, J.A.; Barry, B.; Giordano, M.; Hope, L.; Owusu, E.S.; Forkuor, G. Smallholder shallow groundwater irrigation development in the Upper East Region of Ghana. IWMI Research Report 2011, 143, 35 p. International Water Management Institute (IWMI).
- García-Ruiz, J.M.; Nadal-Romero, E.; Lana-Renault, N.; Beguería, S. Erosion in Mediterranean landscapes: Changes and future challenges. Geomorphology 2013, 198, 20–36. [Google Scholar] [CrossRef]
- Tibebe, D.; Bewket, W. Surface runoff and soil erosion estimation using the SWAT model in the Keleta watershed, Ethiopia. Land Degrad. Dev. 2011, 22, 551–564. [Google Scholar]
- McCartney, M.; Rebelo, L.M.; Senaratna Sellamuttu, S.; De Silva, S. Wetlands, agriculture and poverty reduction. IWMI: Colombo, Sri Lanka, 2010; Vol. 137.
- Dwarakish, G.S.; Ganasri, B.P. Impact of land use change on hydrological systems: A review of current modeling approaches. Cogent Geosci. 2015, 1, 1115691. [Google Scholar] [CrossRef]
- Bruijnzeel, L.A. Hydrological functions of tropical forests: Not seeing the soil for the trees? Agric. Ecosyst. Environ. 2004, 104, 185–228. [Google Scholar] [CrossRef]
- Locatelli, B.; Vignola, R. Managing watershed services of tropical forests and plantations: Can meta-analyses help? For. Ecol. Manag. 2009, 258, 1864–1870. [Google Scholar] [CrossRef]
- Sun, W.; Shao, Q.; Liu, J.; Zhai, J. Assessing the effects of land use and topography on soil erosion on the Loess Plateau in China. Catena 2014, 121, 151–163. [Google Scholar] [CrossRef]
- Rodríguez-Romero, A.J.; Rico-Sánchez, A.E.; Mendoza-Martínez, E.; Gómez-Ruiz, A.; Sedeño-Díaz, J.E.; López-López, E. Impact of Changes of Land Use on Water Quality, from Tropical Forest to Anthropogenic Occupation: A Multivariate Approach. Water 2018, 10, 1518. [Google Scholar] [CrossRef]
- MacKenzie, K.M.; Singh, K.; Binns, A.D.; Whiteley, H.R.; Gharabaghi, B. Effects of urbanization on stream flow, sediment, and phosphorous regime. J. Hydrol. 2022, 612, 128283. [Google Scholar] [CrossRef]
- Pang, X.; Gao, Y.; Guan, M. Linking downstream river water quality to urbanization signatures in subtropical climate. Sci. Total Environ. 2023, 870, 161902. [Google Scholar] [CrossRef]
- DBMP PhilRice. Faraon series properties. Philipp. Rice Res. Inst. n.d. Available online: https://dbmp.philrice.gov.ph/soils/series/Negros-Occidental/faraon/property (accessed on 18 September 2025).
- City of Toledo. (2006). Chapter 2: Physical characteristics. In City of Toledo Comprehensive Land Use Plan. Retrieved from https://www.scribd.com/doc/120406640/chapter-2-physical-characteristics.
- Qiu, J.; Turner, M.G. Importance of landscape heterogeneity in sustaining hydrologic ecosystem services in an agricultural watershed. Ecosphere 2015, 6, 229. [Google Scholar] [CrossRef]
- Señeris, G.T.; Orlina, E.R.; Tumaca, C.M.; Raga-as, M.L. Assessment of potential impact to soil erosion in Aklan River Watershed: A GIS remote sensing approach. Environ. Ecol. Res. 2024, 12, 232–252. [Google Scholar] [CrossRef]
- Olivares, R.U.; Germar, P.; Catacutan, D. Environmental assessment of soil erosion in Inabanga watershed, Bohol, Philippines using ^137Cs. Nat. Hazards 2016, 83, 753–771. [Google Scholar] [CrossRef]
- Tao, H.; Huang, Y.; Chen, L.; Liu, Z.; Zhang, W. Study on erosion and stability of the ecological slope. Front. Earth Sci. 2023, 10, 1071231. [Google Scholar] [CrossRef]
- Torrefranca, I.; Batin, J.; Abad, J. GIS-based watershed characterization and morphometric assessment for sustainable watershed management in the Philippines. J. Spatial Hydrol. 2024, 20, 55–72. [Google Scholar] [CrossRef]
- Ocampo, C.O.V. Consequences of land use and land-cover dynamics on the water quality in Mananga River Watershed Reserve, Metro Cebu, Philippines. Water Qual. Res. J. 2025, 60, 431–[page numbers]. [Google Scholar] [CrossRef]
- Bhattarai, K.; Paudel, B.; Lamsal, K. Influence of topography on sustainable land management. Agriculture 2020, 10, 224. [Google Scholar] [CrossRef]
- Dapin, I.G.; Ella, V.B. GIS-based soil erosion risk assessment in the watersheds of Bukidnon, Philippines using the RUSLE model. Sustainability 2023, 15, 3325. [Google Scholar] [CrossRef]
- Kaliraj, S.; Kavarni, C.; Muthamilselvan, A.; Gayen, S.; Abishek, S.R.; Pitchaimani, V.S.; Karuppannan, S. Evaluation of soil erosion and sediment yield in tropical river basin of the Western Ghats, South India using GIS-based RUSLE and SDR models. Environ. Sustain. Indic. 2025, 27, 100854. [Google Scholar] [CrossRef]
- Neitsch, S.L.; Arnold, J.; Kiniry, J.R.; Williams, J.R. Soil and water assessment tool theoretical documentation. Version 2011.
- Borrelli, P.; Robinson, D.A.; Fleischer, L.R.; Lugato, E.; Ballabio, C.; Alewell, C.; Meusburger, K.; Modugno, S.; Schütt, B.; Ferro, V.; Bagarello, V.; Van Oost, K.; Montanarella, L.; Panagos, P. An assessment of the global impact of 21st century land use change on soil erosion. Nat. Commun. 2017, 8, 2013. [Google Scholar] [CrossRef]
- Ramos-Scharron, C.E.; MacDonald, L.H. Development and application of a GIS-based sediment budget model. J. Environ. Manag. 2007, 84, 157–172. [Google Scholar] [CrossRef]
- Singh, V.P. Hydrologic modeling: progress and future directions. Geosci. Lett. 2018, 5, 1–18. [Google Scholar] [CrossRef]
- Cai, X.; Wallington, K.; Shafiee-Jood, M.; Marston, L. Understanding and managing the food-energy-water nexus–opportunities for water resources research. Adv. Water Resour. 2018, 111, 259–273. [Google Scholar] [CrossRef]
Figure 1.
Location Map of KWFR as a component of Central Cebu Protected Landscape (CCPL).
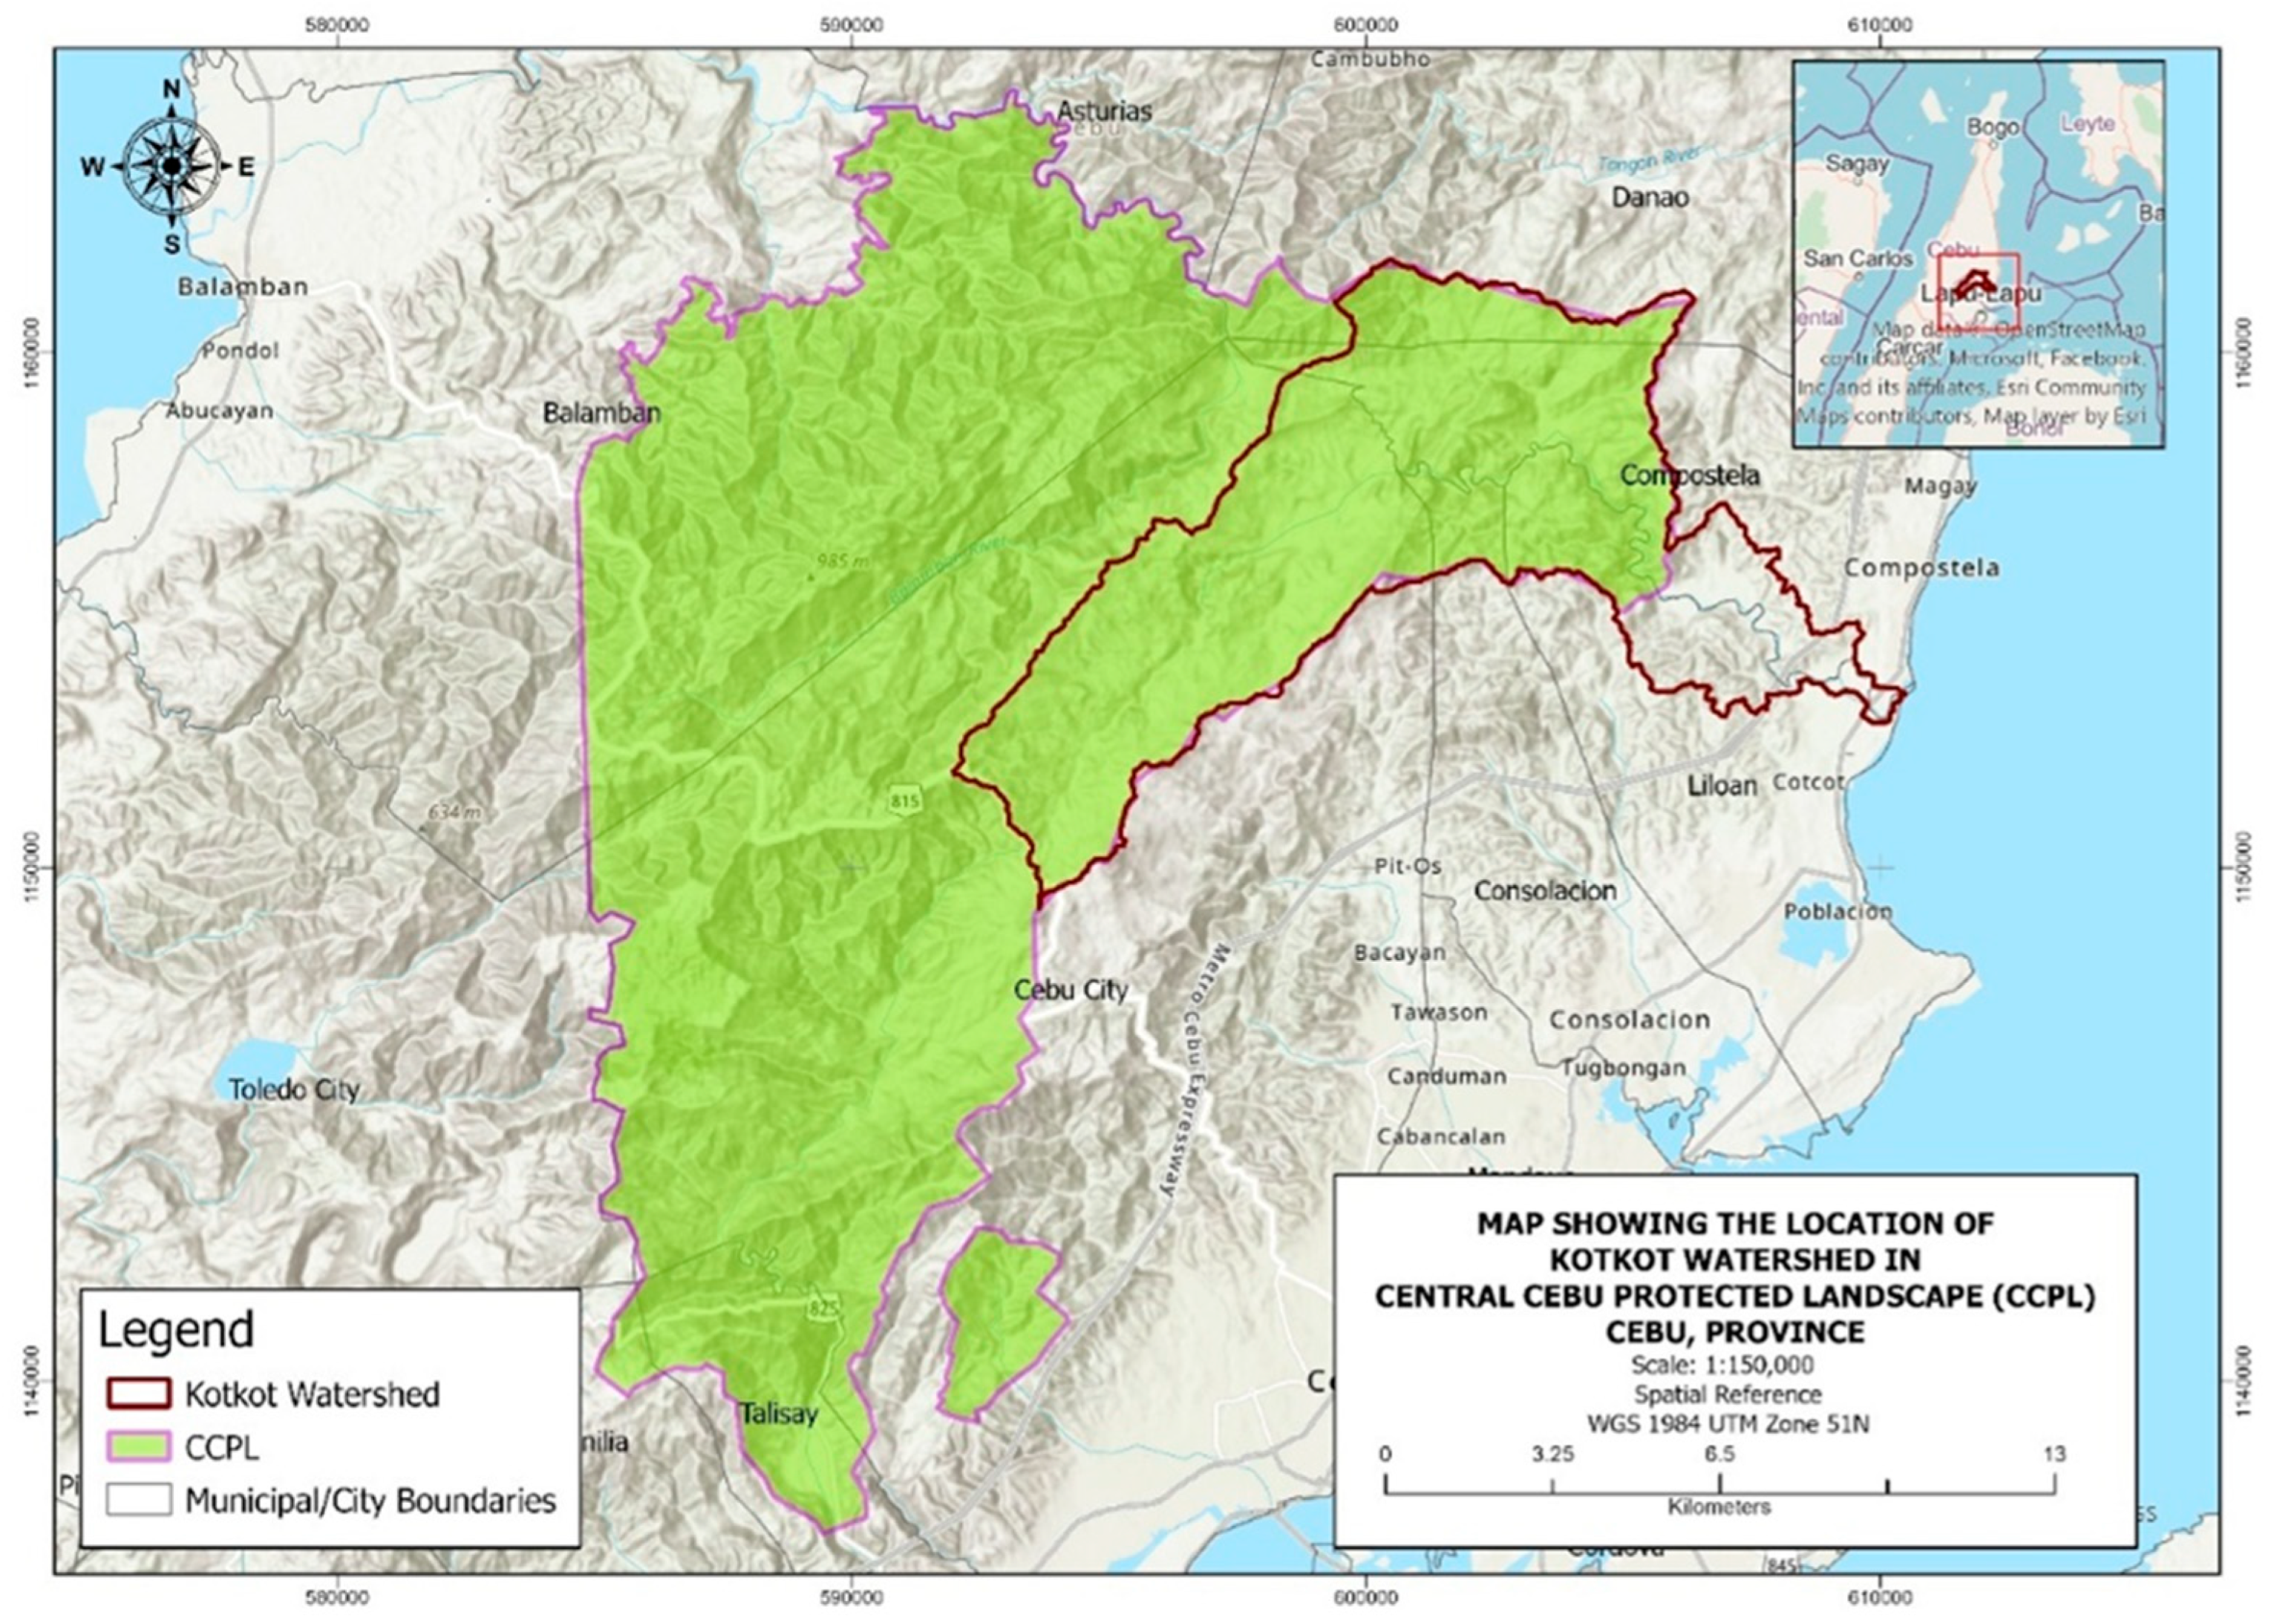
Figure 2.
Delineation of subbasins and Landscape Units (LSUs) of KWFR using SWAT+ (ALOS PALSAR DEM 12.5 m).
Figure 2.
Delineation of subbasins and Landscape Units (LSUs) of KWFR using SWAT+ (ALOS PALSAR DEM 12.5 m).
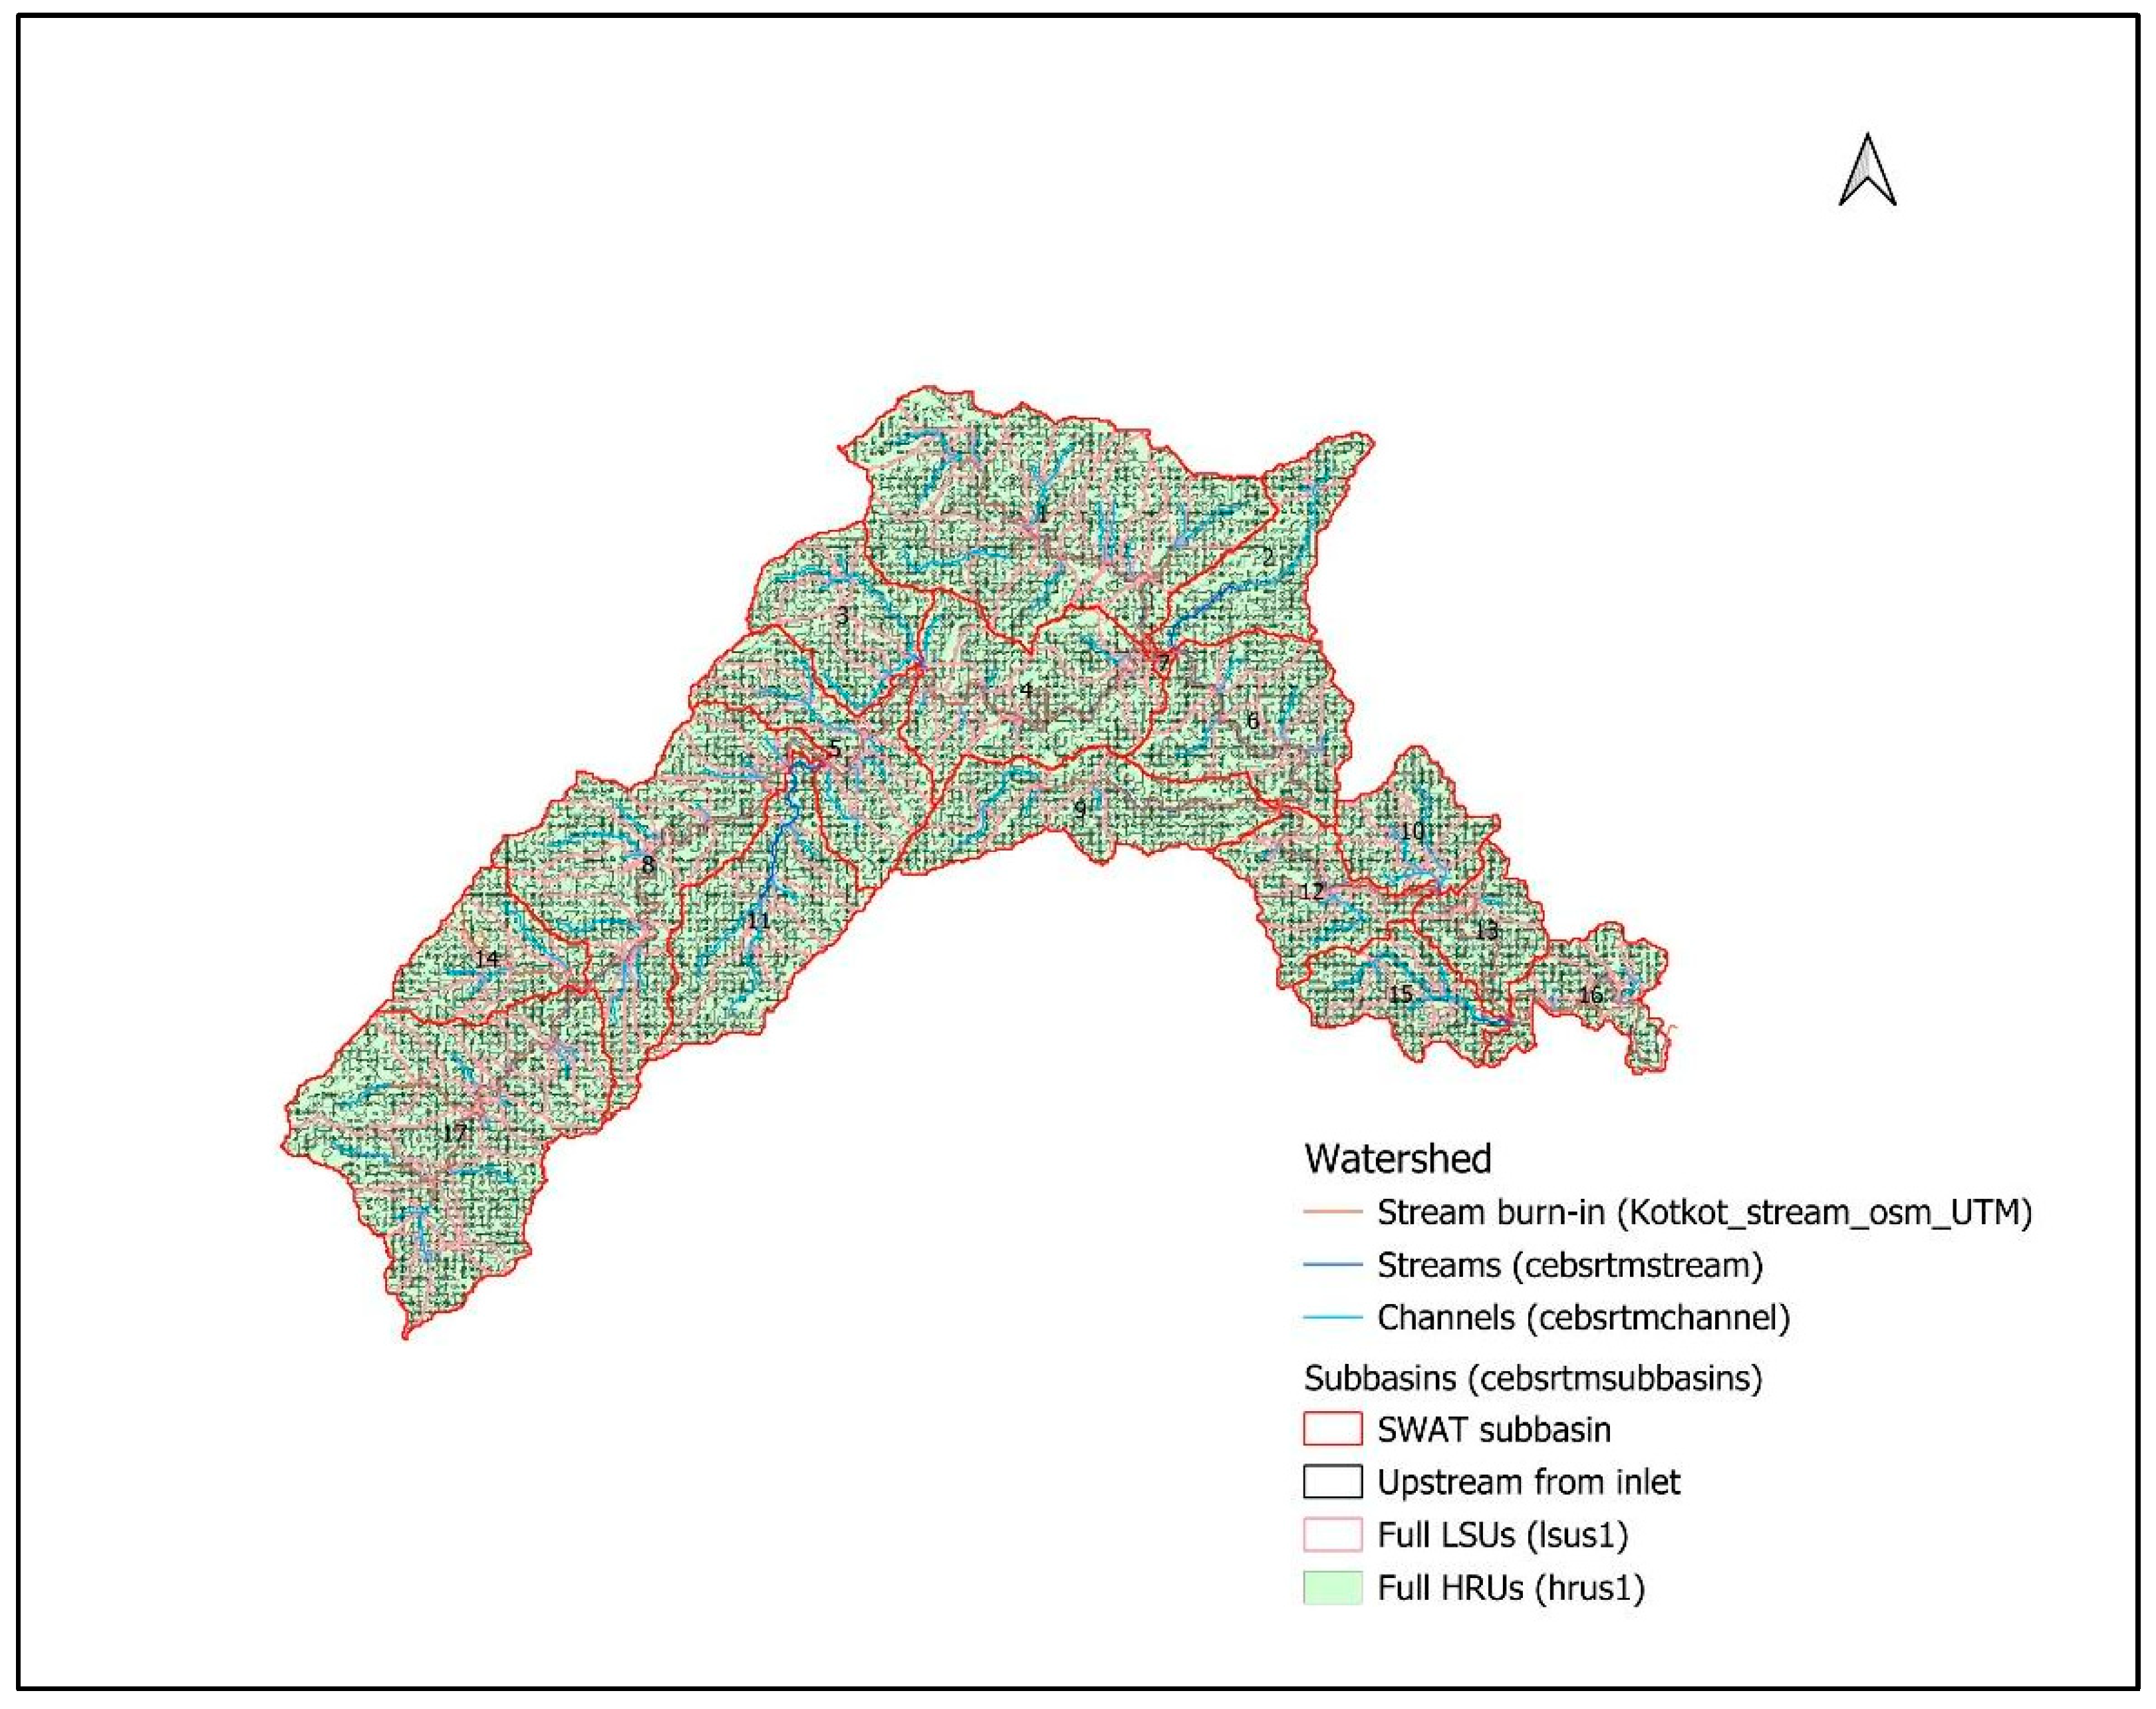
Figure 3.
Land use/land cover map of KWFR.
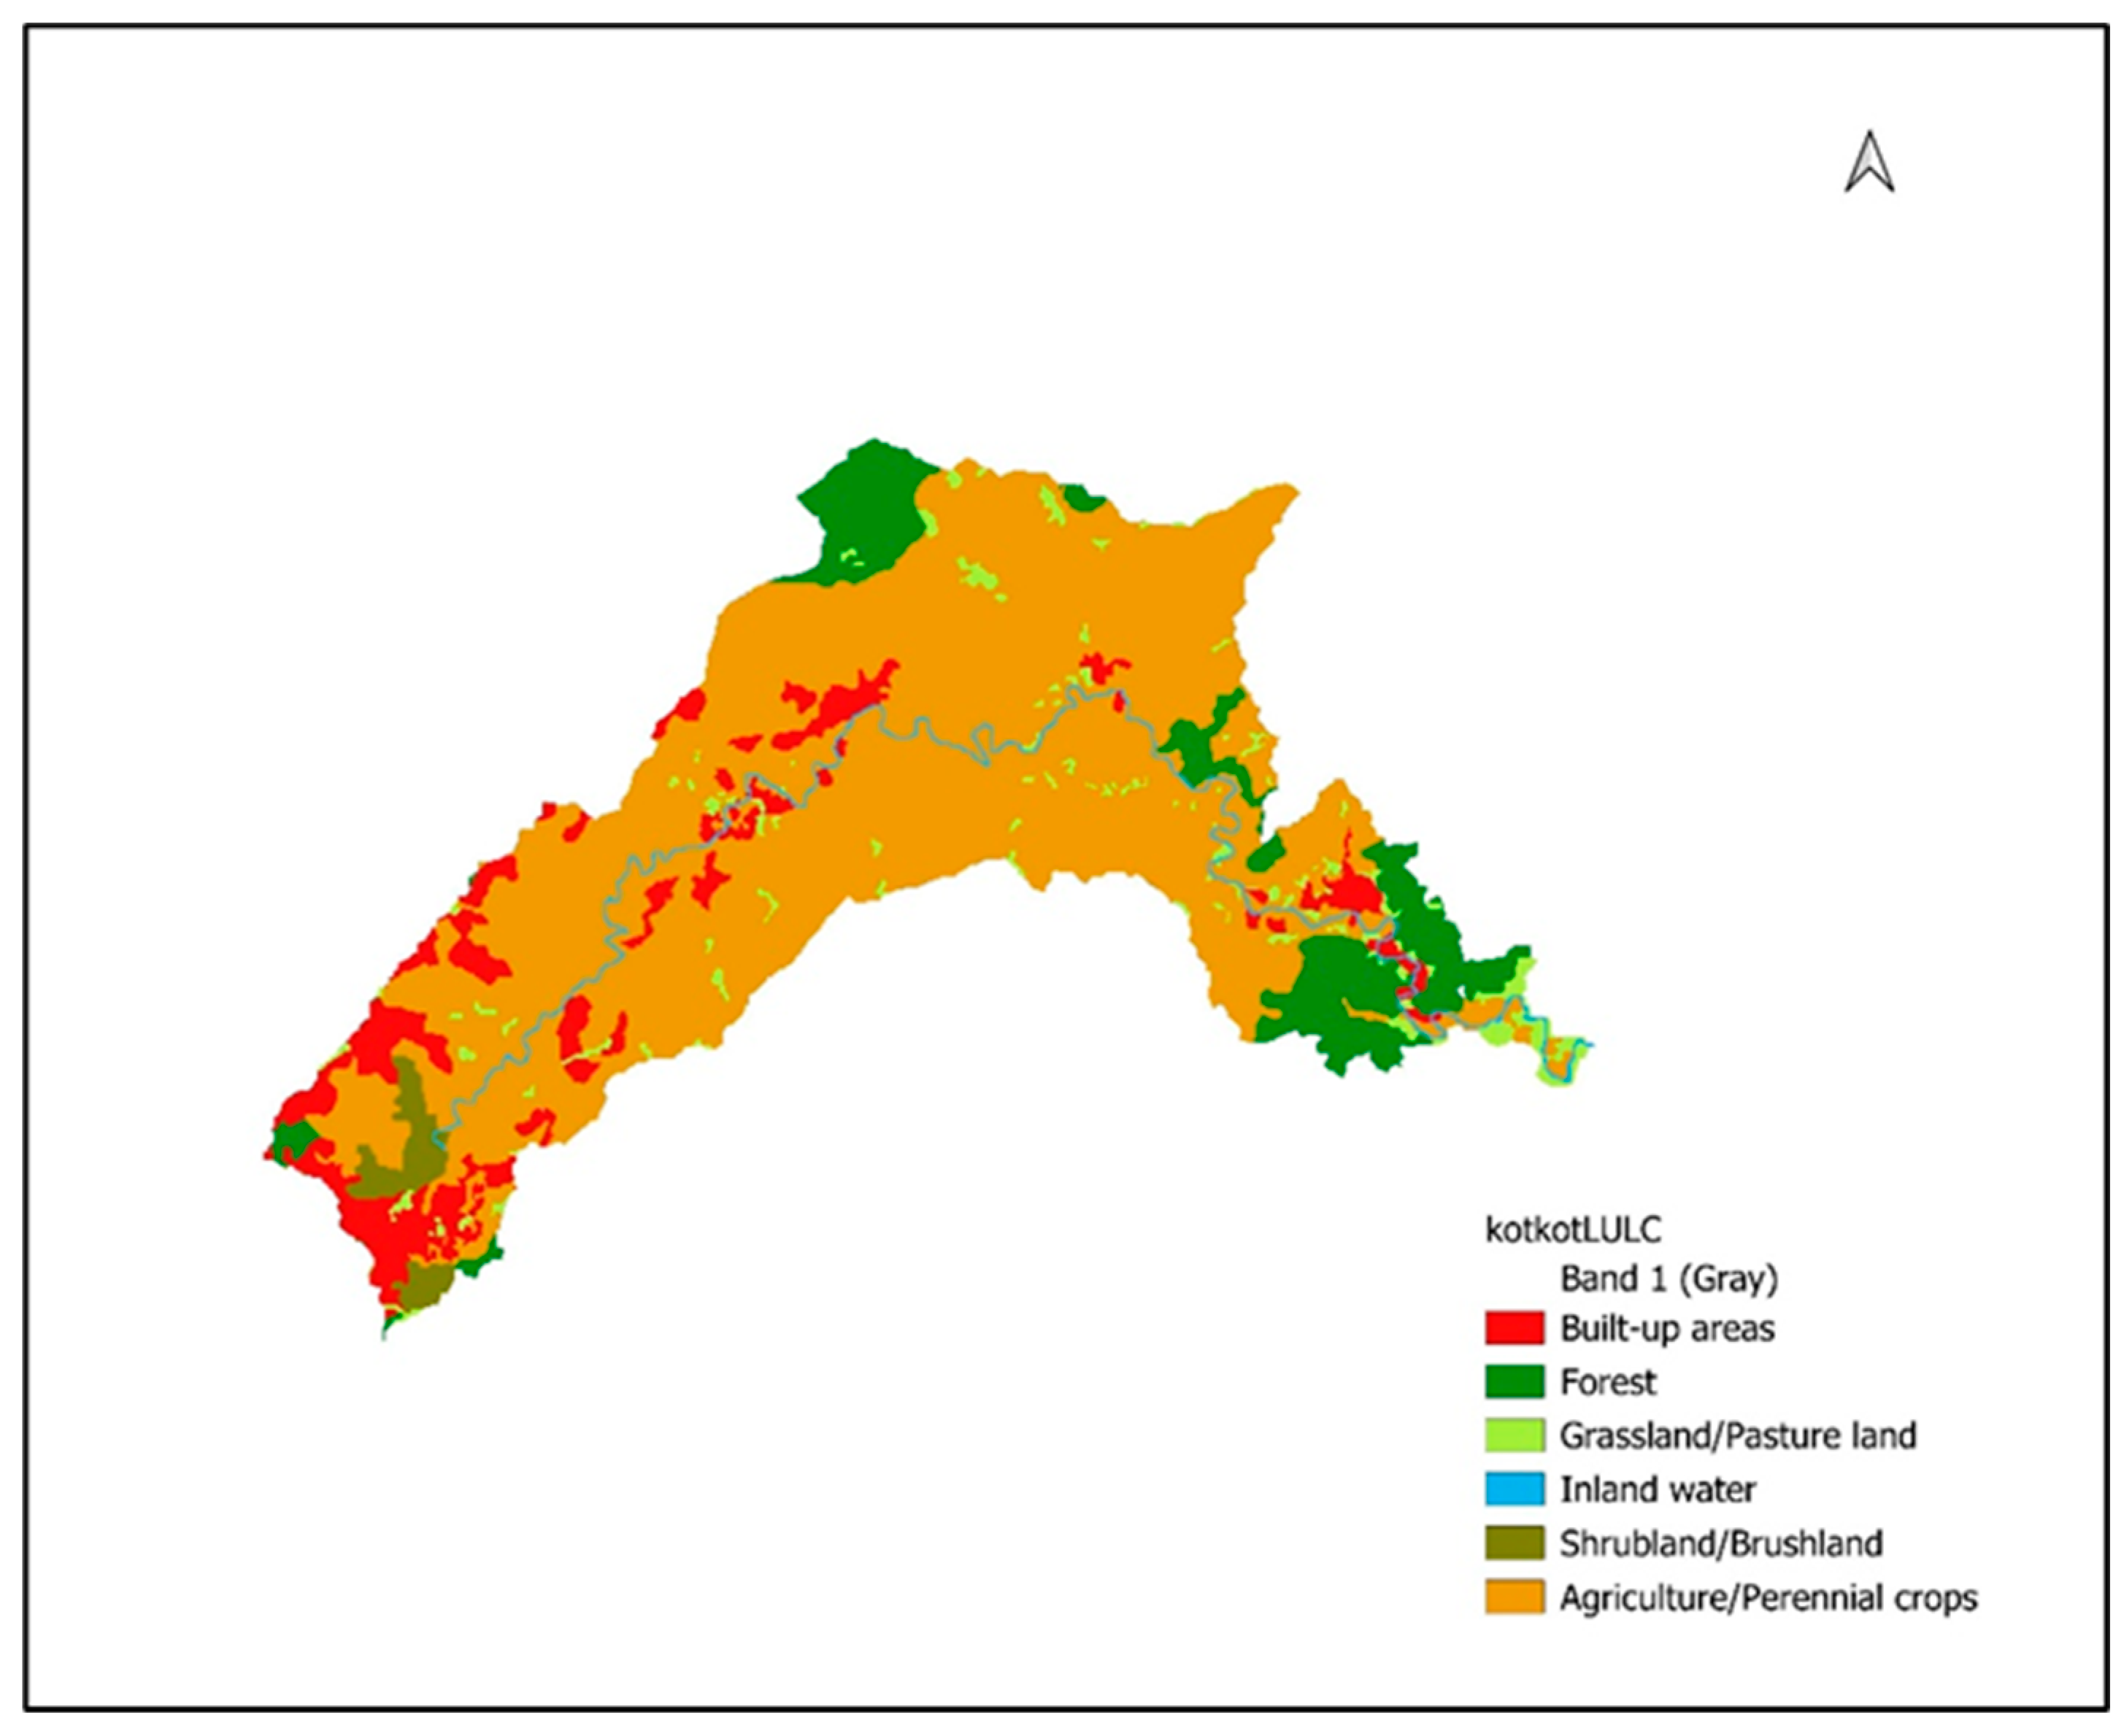
Figure 4.
Soil distribution map of KWFR.
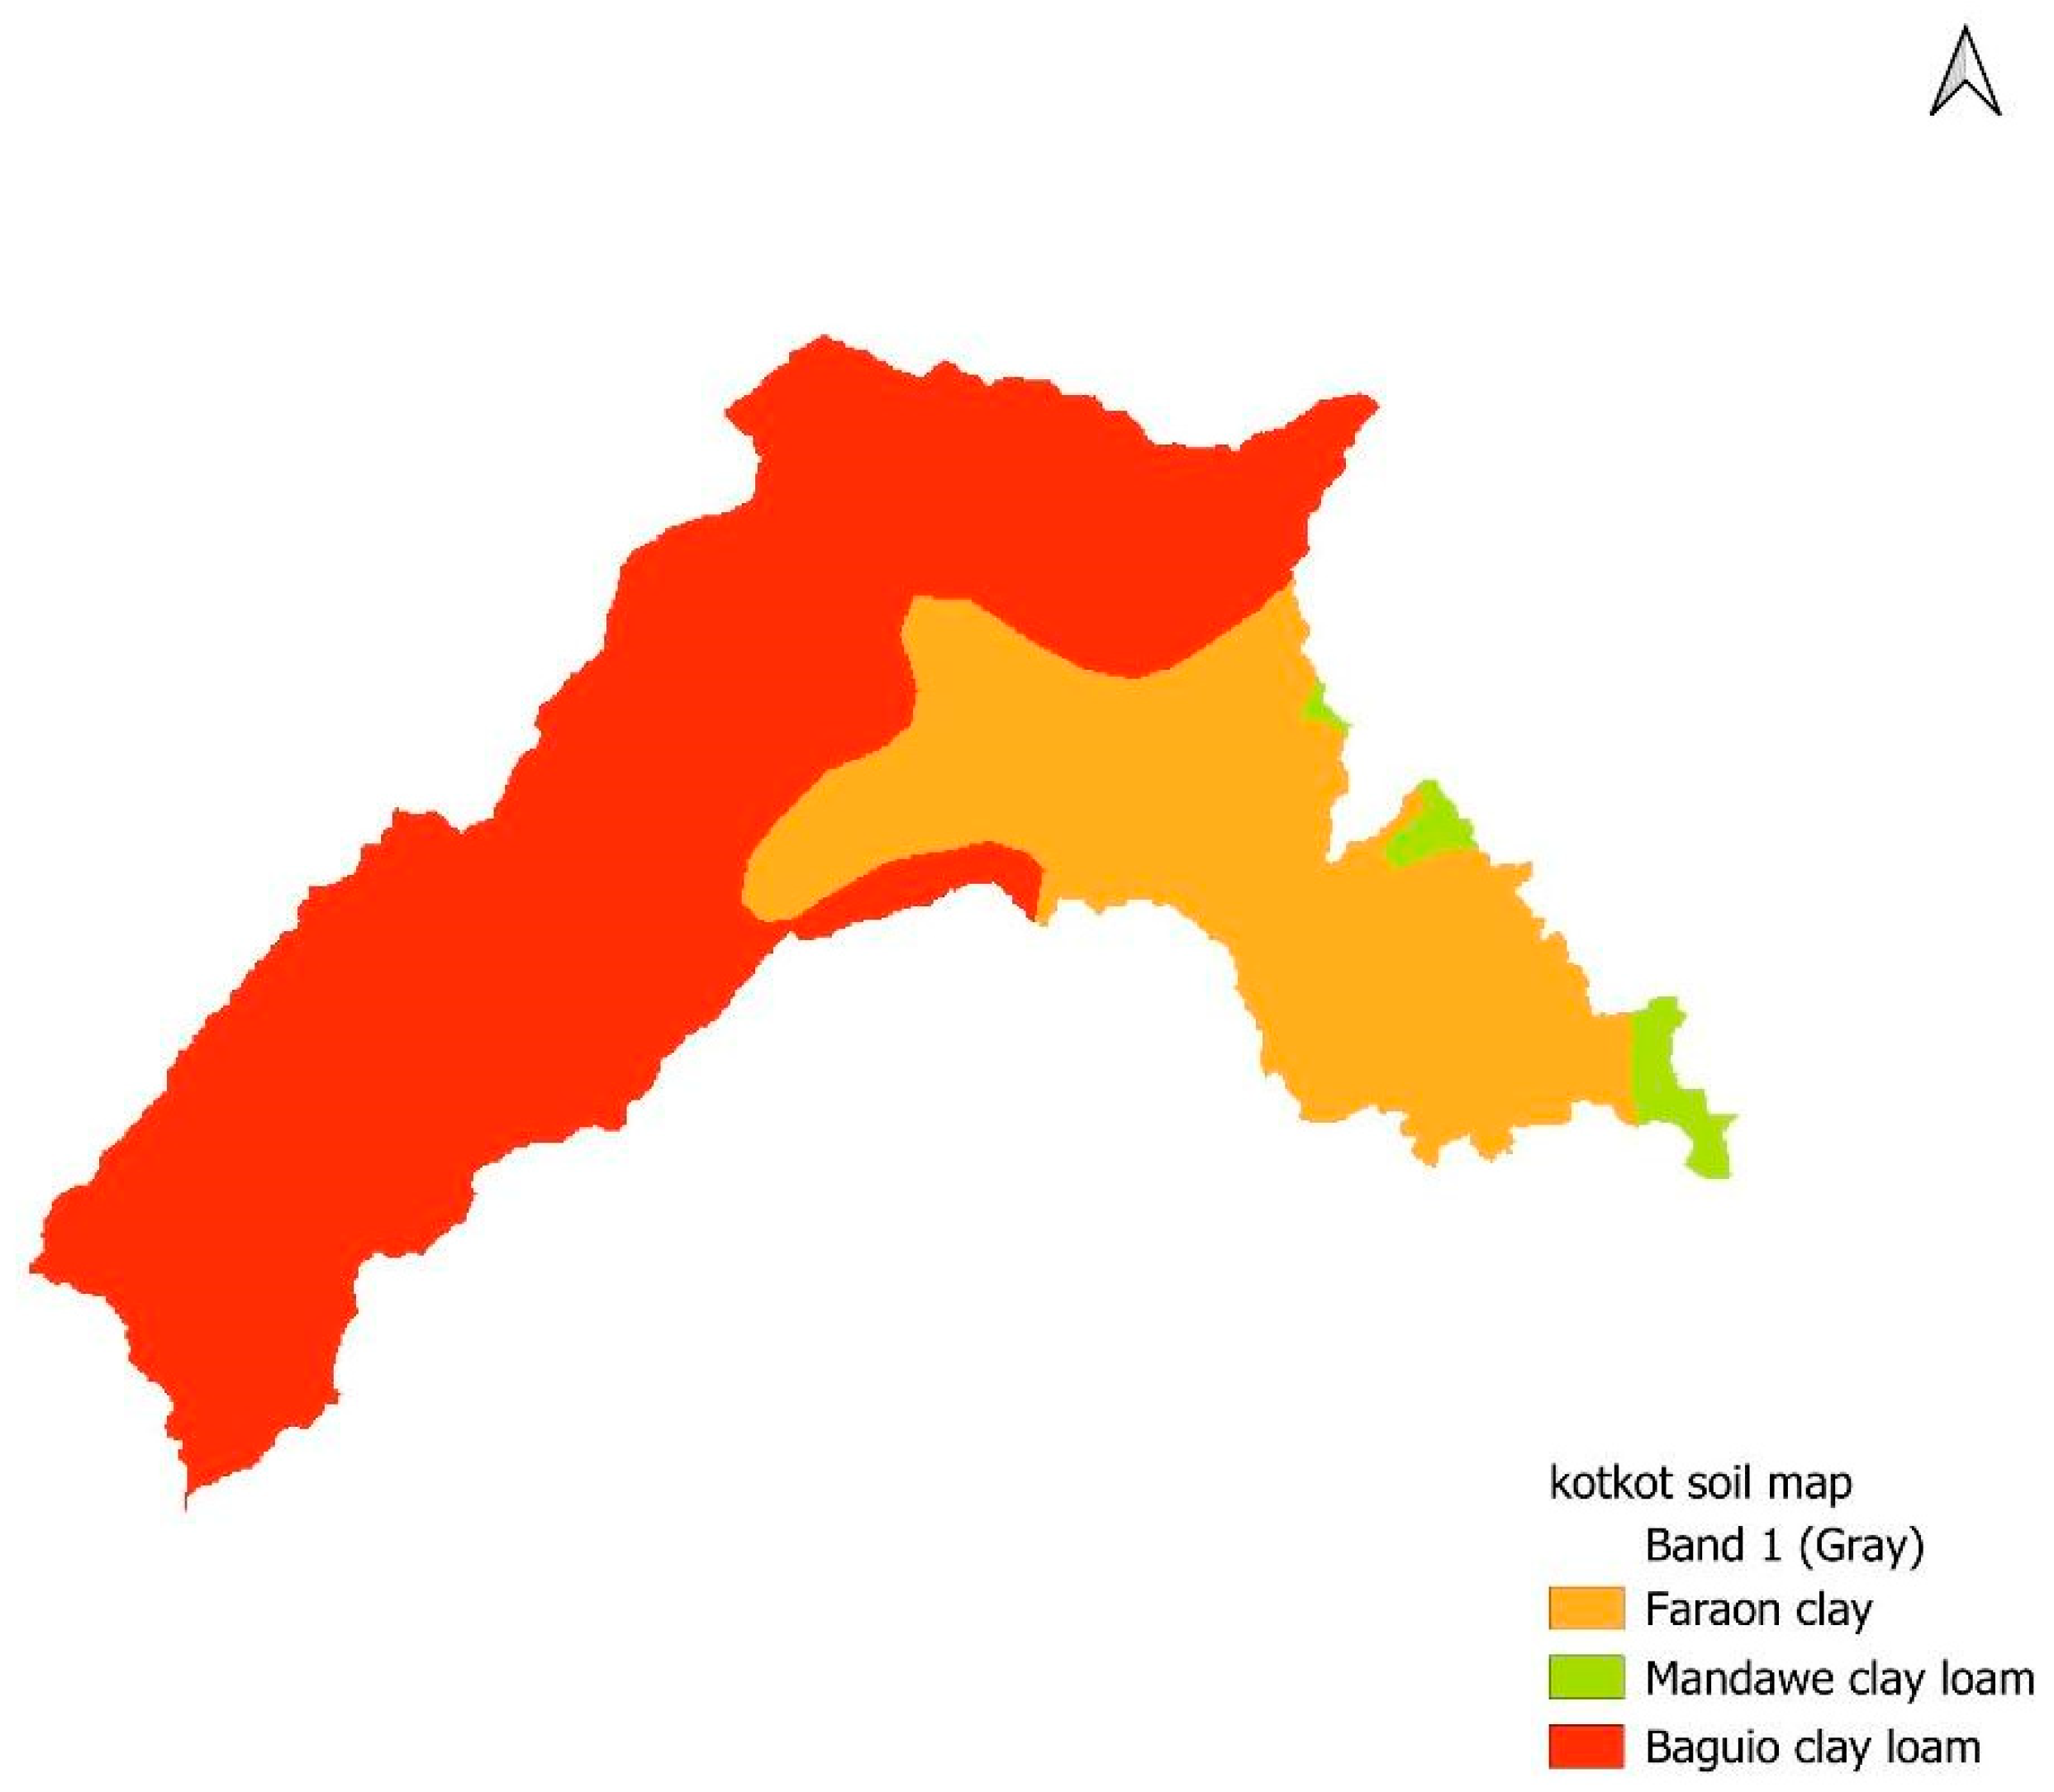
Figure 5.
Slope distribution map of KWFR based on FAO (2006/2020) classification with modification.
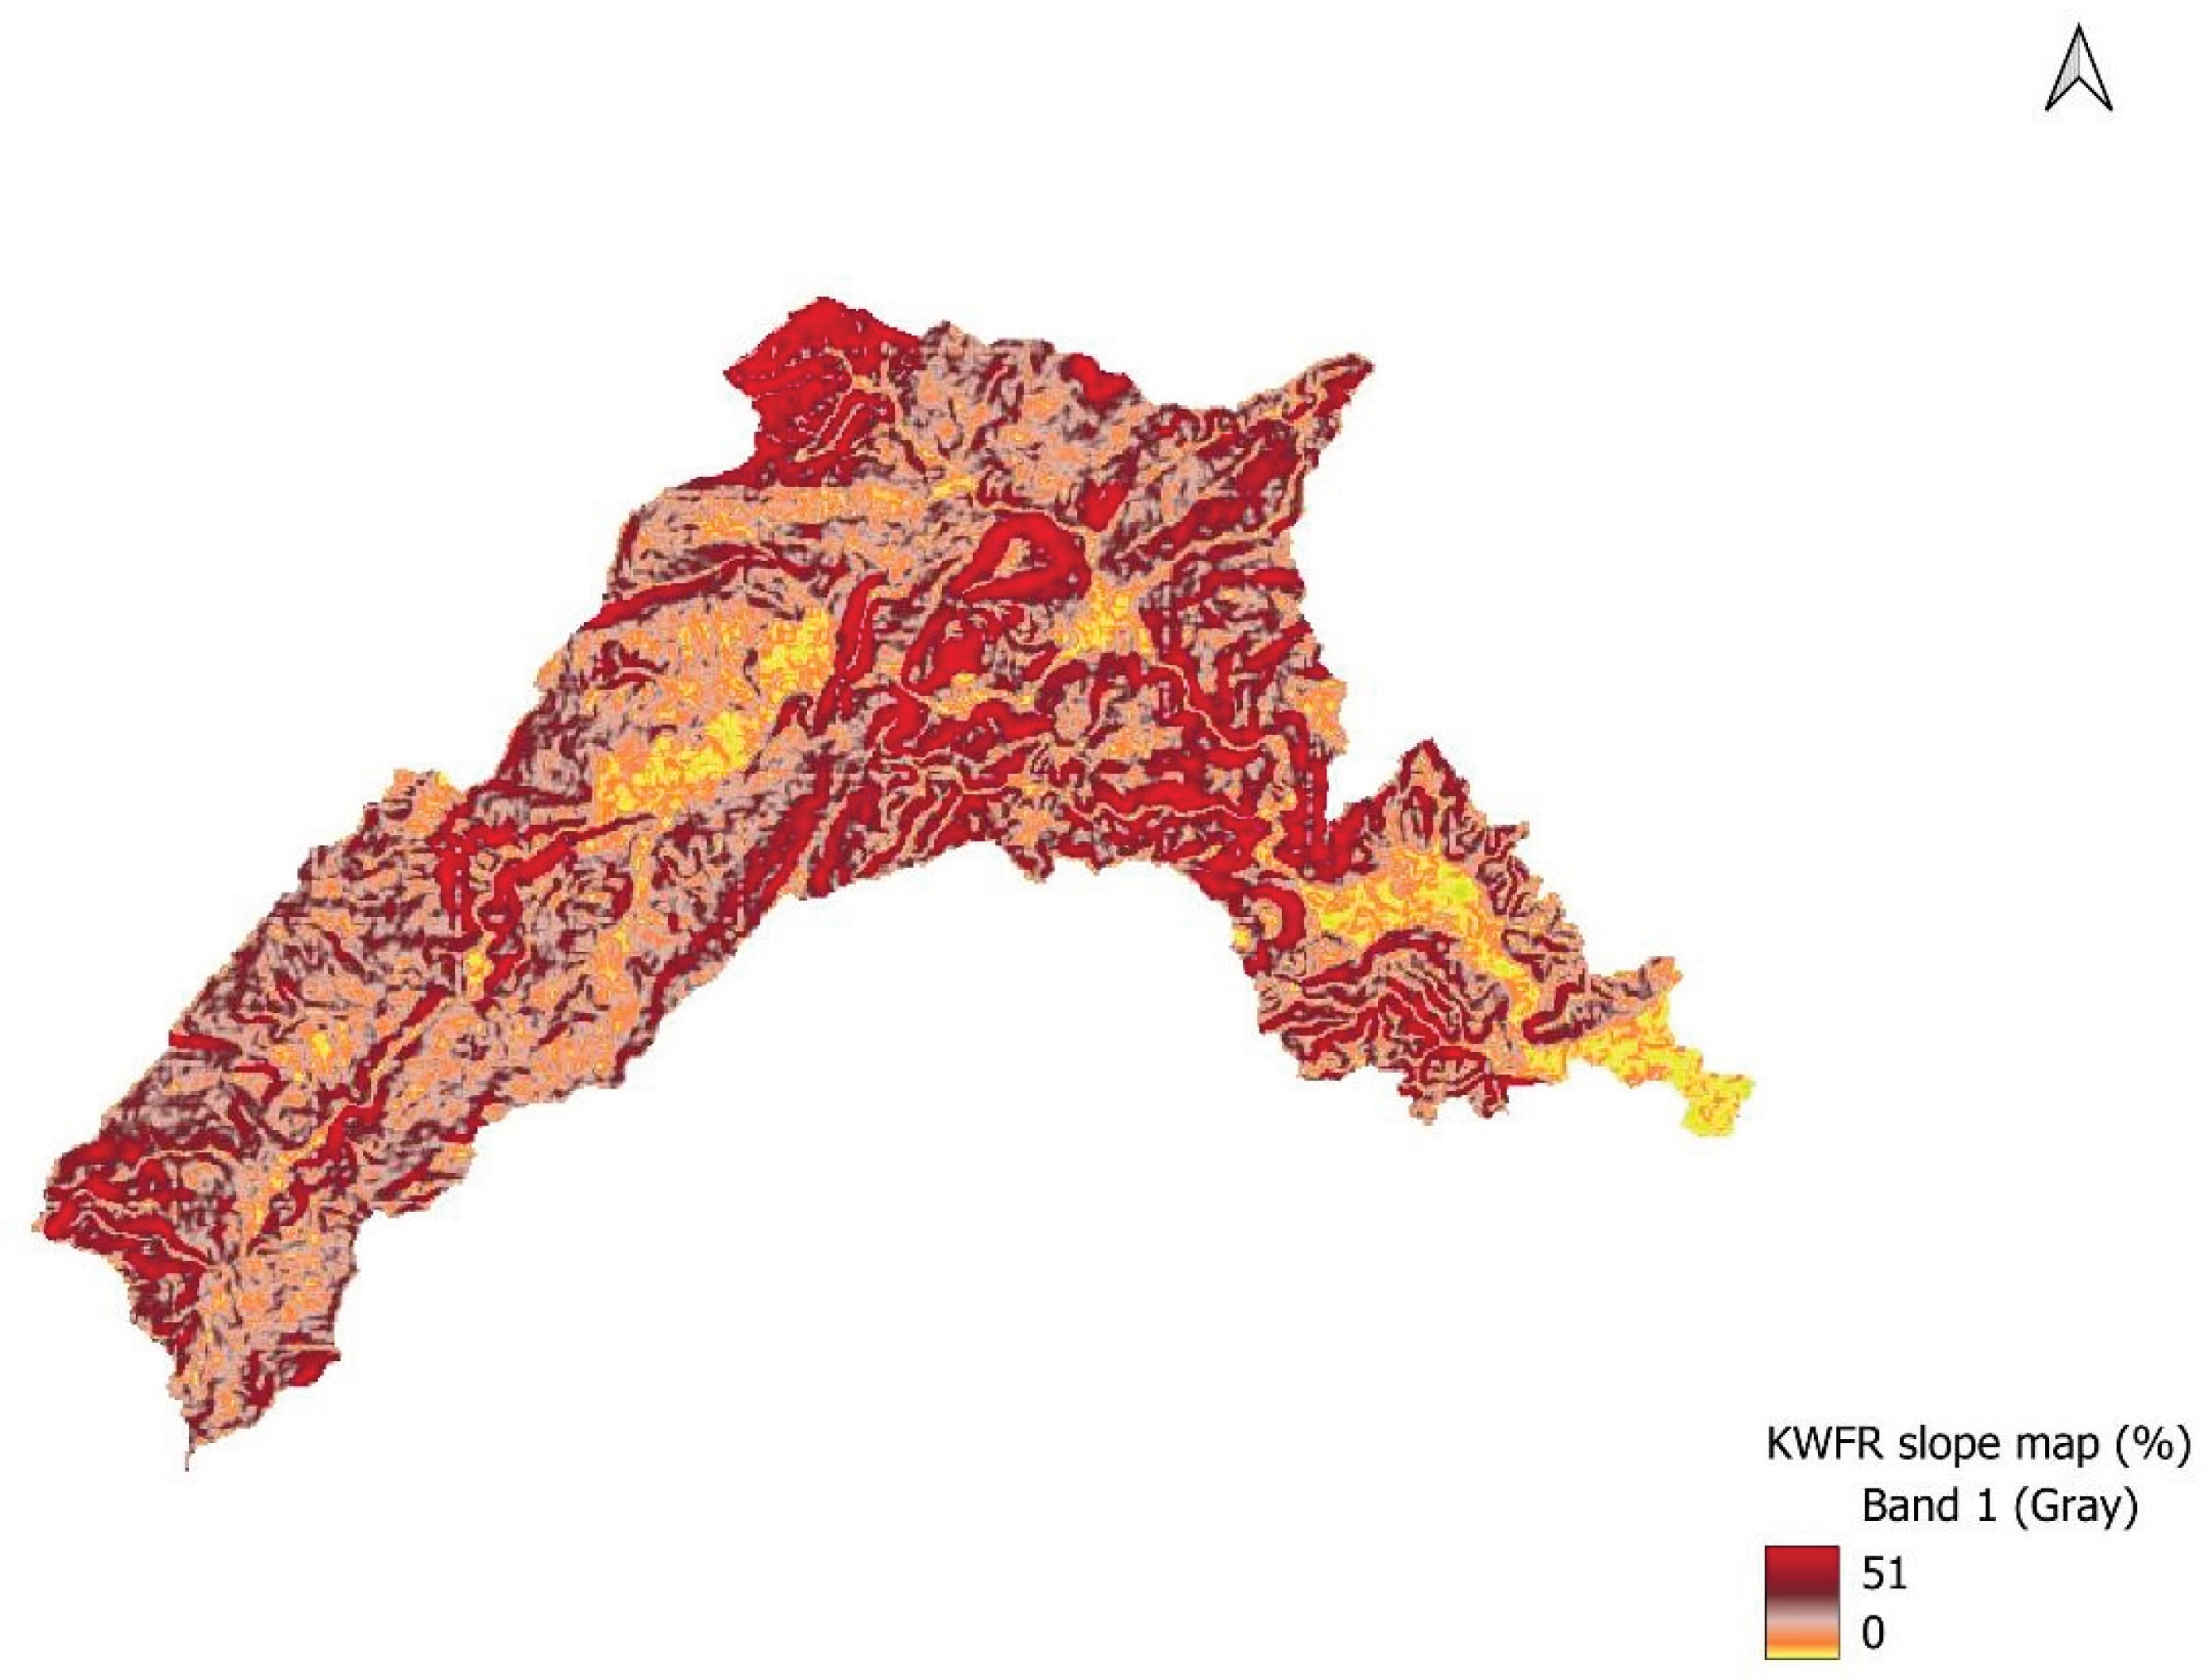

Table 1.
Land use/land cover distribution of KWFR (watershed area = 7,950.78 ha).
| Land Use | Area (ha) | % Watershed |
|---|---|---|
| Open Forest | 862.47 | 10.85 |
| Perennial Cropland | 6,484.51 | 81.56 |
| Built-up Areas | 313.54 | 3.94 |
| Inland Water | 135.51 | 1.70 |
| Pasture Land/grassland | 7.20 | 0.09 |
| Shrubland/Brushland | 153.18 | 1.93 |
Table 2.
Soil distribution of KWFR (total watershed area = 7,950.78 ha).
| Soil | Area (ha) | % Watershed |
|---|---|---|
| Baguio clay loam (BGCL) | 5,294.16 | 66.59 |
| Faraon Clay (FC) | 2,441.43 | 30.71 |
| Mandaue clay loam (MCL) | 220.82 | 2.78 |
Table 3.
Slope distribution in percent of KWFR (total watershed area = 7,950.78 ha).
| Slope | Area (ha) | % Watershed | Description |
|---|---|---|---|
| 0-3 | 341.85 | 4.30 | Flat terrain |
| 3-8 | 689.47 | 8.67 | Gently sloping |
| 8-18 | 1,678.52 | 21.11 | Moderately sloping |
| 18-30 | 2,308.34 | 29.03 | Strongly sloping |
| 30-50 | 2,267.73 | 28.52 | Steep terrain |
| 50> | 670.50 | 8.43 | Very steep terrain |
Disclaimer/Publisher’s Note: The statements, opinions and data contained in all publications are solely those of the individual author(s) and contributor(s) and not of MDPI and/or the editor(s). MDPI and/or the editor(s) disclaim responsibility for any injury to people or property resulting from any ideas, methods, instructions or products referred to in the content. |
© 2025 by the authors. Licensee MDPI, Basel, Switzerland. This article is an open access article distributed under the terms and conditions of the Creative Commons Attribution (CC BY) license (https://creativecommons.org/licenses/by/4.0/).
Copyright: This open access article is published under a Creative Commons CC BY 4.0 license, which permit the free download, distribution, and reuse, provided that the author and preprint are cited in any reuse.


