
Submitted:
17 September 2025
Posted:
19 September 2025
You are already at the latest version
Abstract
Thailand’s mango export industry faces significant challenges in meeting stringent international quality standards, particularly the costly phytosanitary X-ray irradiation process. Current fixed-dose irradiation methods result in substantial energy waste due to variations in fruit size. This research presents a low-cost, real-time system that integrates computer vision and artificial intelligence (AI) to optimize this process. By capturing a single top-view 2D image, the system accurately estimates the three-dimensional characteristics (width, height, and depth) of 'Nam Dok Mai Si Thong' mangoes. This dimensional data is crucial for dynamically adjusting the radiation dose for each fruit, leading to significant reductions in energy consumption and operational costs. Our novel approach utilizes a Linear Regression combined with Co-Kriging (LR+CoK) model to precisely estimate fruit depth from 2D data, a key limitation in previous studies. The system demonstrated high efficacy, achieving a dimensional estimation error (RMSE) of less than 0.46 cm and a size grading accuracy of up to 93.33 percent. This technology not only enhances sorting and grading efficiency but also offers a practical solution to lower the economic and energy burden of phytosanitary treatments, directly improving the sustainability of fruit export operations.
Keywords:
computer vision
; artificial intelligence (AI)
; fruit export industry
; phytosanitary treatment
; Nam Dok Mai Si Thong Mango
1. Introduction
The Nam Dok Mai Si Thong Mango is one of Thailand’s most important agricultural products, playing a significant role in the nation’s economy as a high-value export commodity. According to available data, Thailand is the second-largest mango exporter in Asia and the seventh-largest in the world, with an export value reaching 3,236.16 million baht in 2023. Key export markets include countries with high purchasing power and stringent import standards, such as China, Japan, South Korea, the United States, and the European Union.
Among the various mango cultivars, ’Nam Dok Mai Si Thong’ is highly popular in the global market due to its unique sweet taste and attractive appearance. The success of Thai mango exports hinges on the ability to maintain product quality in accordance with the importing countries’ requirements. These standards are not limited to taste but also cover strict external physical attributes, including uniform skin color, standard shape, correct size grading, and, crucially, the absence of surface defects such as bruises, lesions, or insect damage.
Grading mangoes to a premium quality standard can increase profits for farmers and exporters by 30-50%. Therefore, having an effective and reliable quality control process is not just an option but a critical factor for accessing high-value markets and building consumer confidence on an international level [1,2,3,4].
Food irradiation is a processing technique used to enhance food safety and extend shelf life. The primary objectives of this process include eliminating pathogenic microorganisms, delaying the spoilage and ripening of fruits, inhibiting sprouting in vegetables during storage, and controlling insect and parasite contamination. This technology has gained international acceptance and is utilized in over 40 countries, including the United States, France, Canada, China, the Philippines, South Africa, Pakistan, and Thailand. Irradiated food products must be labeled with the purpose of the treatment and the date of irradiation. In Thailand, the Food and Drug Administration (FDA) is the regulatory body responsible for overseeing the use of food irradiation. The regulations stipulate that the radiation must originate from one of the following approved sources:
- Gamma rays from Cobalt-60 or Cesium-137 sources.
- X-rays generated from machines operating at or below an energy level of 5 million electron volts (MeV).
- Electron beams generated from machines operating at or below an energy level of 10 million electron volts (MeV).
Current food irradiation laws focus on the intended purpose of the treatment rather than specifying the types of food that can be irradiated. A key principle is that the radiation dose applied must be the minimum required to achieve the desired objective while ensuring the maximum dose remains at a level safe for consumption. This process must preserve the food’s nutritional value and maintain desirable sensory characteristics, such as taste and texture. The radiation absorbed dose, measured in Grays (Gy), is defined as the amount of energy absorbed per unit weight of the food. The safety of food irradiation has been affirmed by international bodies and the U.S. FDA, which have concluded that fresh foods irradiated at doses up to 1 kGy, dried foods up to 30 kGy, and other foods at an average dose of up to 10 kGy pose no toxicological, nutritional, or microbiological risks to consumers [5,6,7]. The Synchrotron Light Research Institute (Public Organization) in Nakhon Ratchasima, Thailand, has been actively involved in the research and development of irradiation technology, including the construction of a 6 MeV irradiator for agricultural applications. This machine is used to delay the spoilage of fruits and vegetables by using X-rays to eliminate microorganisms. The X-rays are produced by accelerating high-energy electrons to strike a heavy metal target. However, a significant challenge with the current system is its operational method: the irradiator emits radiation continuously across its entire field, regardless of the size of the object being processed. This practice leads to substantial energy waste and, consequently, increases production costs [8,9].
Our research indicates that the dimensions (width, height, and depth) of the irradiated object are critical factors that directly influence the required dose and exposure time. Larger objects necessitate longer exposure times, which requires careful calibration of the conveyor belt speed to ensure thorough and uniform irradiation. The speed must be optimized—not too slow and not too fast—to prevent product damage. Proper calibration of both speed and time is essential for determining the precise energy required for the process. Since higher energy consumption directly translates to higher operational costs, optimizing these parameters is crucial for the economic viability of food irradiation. X-ray irradiation is an effective technology for controlling microbial contamination in food. Research has demonstrated its efficacy in reducing bacterial counts in both solid and liquid food matrices. Optimal radiation doses can be determined to eliminate pathogens without degrading key nutritional components such as sugars, proteins, fats, and vitamin C. For instance, doses of 1.5 and 2.0 kGy were found to completely inhibit the growth of tested bacteria [10]. This preservation method is particularly valuable for fresh produce. A study on Korean ’Maehyang’ strawberries showed that X-ray doses below 1.0 kGy effectively reduced microbial, bacterial, and fungal populations in a dose-dependent manner throughout the storage period. This process slows down decay and physicochemical changes, making irradiation a viable hygienic option for the international trade of fresh fruits like strawberries [11]. In the context of fruit exports, irradiation is often complemented by other advanced technologies for quality control. For example, ’Nam Dok Mai’ mangoes, which are irradiated for export, also undergo automated grading processes. These systems may utilize image processing techniques and ANN to estimate the mass and dimensions (width, height and depth) of the mangoes from images captured by multiple cameras, ensuring consistent quality for international markets [12].
Therefore, the primary objective of this study is to develop and validate a low-cost, image-based system capable of accurately estimating the three-dimensional volume of mangoes to enable dynamic dose control in the X-ray irradiation process, thereby reducing energy consumption and operational costs.This paper presents the design of an integrated system that uses artificial intelligence (AI) and computer vision to address this inefficiency. The proposed system is capable of estimating the three-dimensional size (width, height and depth) of ’Nam Dok Mai Si Thong’ mangoes from a single 2D image in real-time. This enables automated classification based on standard export grades and, more importantly, provides the critical data n eeded to dynamically optimize the dose for the X-ray phytosanitary process. By tailoring the irradiation to the volume of each mango, the system can significantly reduce energy consumption and operational costs. The successful application of this advanced technology in the post-harvest process for mangoes can enhance the economic value of the Thai fruit industry and serve as a model for other agricultural products.
2. Methodology
This section outlines the research methodology and techniques used in the study, including the characteristics and cultivation of Nam Dok Mai Si Thong mangoes, the irradiation process in export handling, the application of computer vision for dimensional analysis, and the development of predictive models such as Linear Regression, Artificial Neural Networks, Gaussian Process Regression, and Co-Kriging. Evaluation metrics employed to assess model accuracy are also presented.
2.1. Nam Dok Mai Si Thong Mango
Mango is one of the most popular tropical fruits, valued for both its delicious flavor and high nutritional content, earning the title of “King of Tropical Fruits.” This study utilized Nam Dok Mai Si Thong mangoes (Mangifera indica L., cv. Nam Dok Mai Si Thong), a premium-grade cultivar selected for its economic importance in Thai exports. As illustrated in Figure 1, this cultivar is widely known for its role in dishes such as mango sticky rice.
Mango cultivation is widespread across Thailand, particularly in the northern and northeastern regions where soil and climatic conditions are highly favorable. Suitable soils are generally sandy loam to clay loam with good drainage, a pH of 5.5–7.5, and moderate to high fertility. The crop thrives in tropical to subtropical climates, requiring an average temperature of 24–30 °C and a prolonged dry season of 3–4 months to induce flowering.
Harvesting is carried out when the fruit reaches the mature-ripe stage for export. Export-grade mangoes must be certified under Good Agricultural Practices (GAP), and their size classification follows the Thai Agricultural Standard established by the National Bureau of Agricultural Commodity and Food Standards (ACFS) [14], which categorizes fruits according to weight as shown in Table 1.
Currently, the main postharvest processes for exporting mangoes, as shown in Figure 2, include quality grading, size classification, and disinfection by either hot-water immersion/steam treatment at 46–47 °C or irradiation [15]. However, these processes remain costly and time-consuming. Therefore, this research aims to develop improved approaches that enhance efficiency and suitability for industrial-scale applications.
2.2. Irradiation in Mango Export Processing
In Thailand, the Synchrotron Light Research Institute (Public Organization) has initiated a project to develop a 6 MeV linear accelerator for X-ray irradiation to sterilize fresh fruits [8,9]. This system operates at an electron beam energy of 6 MeV, capable of producing X-rays to deliver doses up to 1 kGy for fresh fruit sterilization, as shown in Figure 3. The RF Linac accelerates electrons by transferring high-power radiofrequency energy through an electric field, enabling precise control over beam energy and dose delivery [16]. The design and construction of this accelerator, carried out domestically in Thailand, represent a significant advancement in local expertise and related technologies. This achievement not only supports current agricultural applications but also lays the foundation for future developments in high-level irradiation technology. The principle of this system is to accelerate electron beams using a linear accelerator, directing them onto a heavy metal target to generate X-rays. These X-rays are then applied to sterilize fresh fruits and vegetables, thereby extending their postharvest shelf life. Importantly, the operating energy must remain below the international safety limits established by the World Health Organization (WHO) to prevent the induction of radioactivity in irradiated produce, ensuring both food safety and consumer confidence [17].
In the irradiation of Nam Dok Mai mangoes for export, a low radiation dose of 0.4–0.6 kGy is applied to control insect pests and delay ripening, without significantly affecting the fruit’s color, aroma, taste, or nutritional quality [18]. The X-rays used in this process are generated by accelerating high-energy electrons onto a heavy metal target, effectively sterilizing and controlling pests. However, X-ray generation is more costly than gamma irradiation. Therefore, efficient energy utilization and precise estimation of the mango’s geometric dimensions width, height, and depth are essential [19], enabling proper adjustment of conveyor speed and electron beam power to achieve the required dose. To determine the optimal operating conditions, the relationships among fruit geometry, delivered dose, irradiation time, and system power are considered, as described by the following equations.
Equation (1) describes Beer–Lambert attenuation of dose inside the product, where is the dose at depth D and is the surface dose.
Equation (2) aggregates the system factors into a single coefficient (), indicating that the surface dose increases with the beam power P and the mass absorption coefficient , and decreases with the conveyor speed v and the width of the object W (irradiated span).
Equation (3) gives the exposure time as a mango of length L passes the scan head at conveyor speed v.
Equation (4) yields the total irradiation energy from the average beam power P and the exposure time t.
Symbols and units
From these equations, when the target dose is held constant, increasing the conveyor speed (v) reduces , which must be compensated by increasing P or reducing the irradiated width. Conversely, for a fixed conveyor speed, P directly controls the dose. The product geometry () therefore governs exposure time, internal dose, and total energy consumption, which are directly linked to production cost.
2.3. Computer Vision
In this study, computer vision techniques were applied to extract the geometric characteristics of mangoes from two-dimensional images. The features of interest obtained from this process were the fruit’s width and height. The original images were captured using a digital camera with a resolution of 640 x 480 pixels and subsequently cropped to 480 x 280 pixels in order to eliminate unnecessary background and focus solely on the mango region. After preprocessing, the images were converted into grayscale using the standard ITU-R BT.601 linear transformation, which accounts for the human visual system’s response to luminance. This grayscale conversion is expressed in equation as follows
Where are the intensity values of each color channel. The ITU-R BT.601 standard is based on the human eye’s sensitivity to brightness, being most sensitive to green, followed by red, and least sensitive to blue. The weights 0.299, 0.587, and 0.114 are derived from the luminous efficiency function, which represents the spectral response of human vision. This produces a grayscale image that closely resembles human visual perception and has become a standard in computer vision and image processing [20,21]. Similar approaches in fruit classification have been demonstrated in mango grading and sorting systems, where external features such as length, width, and surface defects are extracted from images as the basis for quality classification [22,23] Subsequently, the images were processed using Canny edge detection, a highly popular edge detection algorithm in image processing, as it provides sharp edges and effectively reduces noise. The algorithm consists of four main steps as follows:
- Noise Reduction (Gaussian Filtering); To reduce noise that may generate false edges before edge detection, Gaussian smoothing was applied:
-
Gradient Calculation (Edge Strength and Direction); To compute the edge strength by calculating gradients along the x and y axes using the Sobel operator:Then, the magnitude and orientation of the gradient were determined as:
- Non-Maximum Suppression; Retaining only the gradient values at each pixel that are local maxima along the direction perpendicular to the edge, thereby producing thin and sharp edges.
- Hysteresis Thresholding. A process that makes Canny more stable than simple thresholding by applying two thresholds and to decide whether a pixel is an edge or not. This ensures that the detected edges remain continuous while reducing false edges caused by noise:
In this study, the values and were selected, as the dataset contained images with varying illumination levels. These values were found suitable for maintaining edge continuity and reducing false edge detection. From the resulting edge map, contours were extracted using the function `cv2.findContours`, and the contour with the largest area was selected to represent the mango. Then, `cv2.minAreaRect` was used to determine the minimum bounding rectangle, yielding the mango’s width and height in pixels as:
Where represent the shorter and longer sides of the bounding rectangle around the mango. Pixel dimensions were then converted into physical units (Pixel-to-Physical Conversion) in centimeters. From camera calibration, the scale factors for pixel-to-centimeter conversion were obtained as:
Where and were determined from experimental calibration.
The obtained width and height values from this step were subsequently used as input for predicting the depth and weight of the mango in the Linear Regression stage.
2.4. Linear Regression
Since the use of a two-dimensional camera cannot directly measure the depth () of the mango, linear regression was employed to construct a predictive model [24]. The general form of the regression equation can be written as:
where
| y | is the dependent variable or predicted value |
| is independent variables where | |
| is intercept | |
| is regression coefficients of each independent variable |
In this study, the width () and height () were used as independent variables, while the depth () was the dependent variable. The regression model is expressed as:
Where denotes the regression function learned from empirical data collected from 84 mango samples. The advantage of linear regression is that it provides straightforward interpretation and efficient computation. However, it has limitations in capturing nonlinear relationships effectively. These limitations are addressed in the subsequent stages by employing Artificial Neural Networks (ANN) and Gaussian Process Regression (GPR).
2.5. Artificial Neural Network
Artificial Neural Networks (ANNs) are mathematical models inspired by the information processing mechanism of the human brain. The basic architecture consists of an input layer, one or more hidden layers, and an output layer. Each node (neuron) computes a weighted linear summation of its inputs and then passes the result through an activation function to generate the output. The general formulation of a neuron in layer l can be expressed as:
Where denotes the weights, the bias term, the output from the previous layer, and the activation function. For classification problems, such as mango size categorization, the Softmax function is applied at the output layer to transform the outputs into class probabilities, as shown below:
Where represents the probability of the input belonging to class k, and K is the total number of classes (here, is L, 2L, and 3L). The ANN model was trained using backpropagation and gradient descent to minimize the loss function. In this study, the Categorical Cross-Entropy loss was employed, as defined in:
The input features consisted of the actual mango dimensions—width , height , and depth measured from 84 mango samples. The output labels corresponded to the fruit size groups (L, 2L, 3L). To further enhance model performance, Optuna, an automated hyperparameter optimization framework based on Bayesian search and the Tree-structured Parzen Estimator (TPE) [25], was applied. The optimization problem was formulated as:
Where represents the set of hyperparameters (e.g., number of hidden layers, neurons per layer, dropout rate, learning rate, and number of epochs), and is the objective function, here defined as the validation accuracy. Through multiple trials, Optuna identified the optimal hyperparameters, achieving the highest classification accuracy of 92.31% with hidden layers = [173, 95], dropout = 0.104, learning rate = 0.161, and epochs = 250. The optimized configuration was then retrained on the combined training and validation set and subsequently evaluated on the test set to assess the model’s generalization capability for mango size classification.
2.6. Gaussian Process Regression and Co-Kriging
Gaussian Process Regression (GPR) is a non-parametric Bayesian learning model that employs a Gaussian process (GP) to represent an unknown function . The fundamental assumption is that the function values follow a multivariate Gaussian distribution over all data points [26]. A Gaussian process is generally defined as:
Where denotes the mean function and the covariance (kernel) function, with common choices including the Radial Basis Function (RBF) and the Matern kernel [27]. The predictive mean and variance of GPR are given by:
where is the predictive mean and is the predictive variance. This dual capability of providing both predictions and uncertainty has led to GPR being widely applied in fields such as time-series analysis [26], financial forecasting [27], and indoor positioning [28]. In this study, GPR was applied to high-fidelity (HF) data collected from 84 mango samples, using width , height , and depth as independent variables to predict mango weight. However, since HF data are limited, the model was extended with Co-Kriging, which incorporates multi-fidelity data to improve prediction accuracy [29]. The two fidelity levels considered are:
- Low-Fidelity (LF): Approximate data, including width and length extracted from 290 mango images, and depth estimated via Linear Regression.
- High-Fidelity (HF): Ground-truth physical measurements from 84 mangoes.
The Co-Kriging model, as proposed by Kennedy and O’Hagan (2000) [30], is defined as:
where represents the high-fidelity function, is the low-fidelity function, is a scaling parameter that captures the linear correlation between the two fidelity levels, is a Gaussian Process that models the discrepancy between the scaled low-fidelity function and the high-fidelity function. By leveraging Co-Kriging, the model benefits from the abundance of low-fidelity LF data and the reliability of HF measurements, leading to more accurate HF predictions. In this study, GPR was first employed for mango weight prediction using HF data, while Co-Kriging combined with Linear Regression was introduced to estimate mango depth from LF image-based measurements in the initial stage. This strategy improves prediction accuracy, particularly for estimating mango depth, which cannot be directly captured from 2D imaging. Similar to applications in adaptive surface measurement [31], this approach balances efficiency (large LF dataset) and accuracy (smaller HF dataset), making it highly suitable for agricultural produce quality assessment.
2.7. Evaluation Metrics
To evaluate the predictive performance of the proposed models, three widely used error metrics were employed: Mean Absolute Percentage Error (MAPE), Mean Absolute Error (MAE), and Root Mean Squared Error (RMSE). These metrics are extensively applied in machine learning and modeling studies as they effectively quantify the discrepancy between predicted and observed values.
Mean Absolute Percentage Error (MAPE) MAPE measures the average error in percentage terms, which allows comparison across datasets with different units of measurement.
Mean Absolute Error (MAE) MAE represents the average of the absolute errors, expressed in the same unit as the target variable, making it intuitive and straightforward to interpret.
Root Mean Squared Error (RMSE) RMSE is the square root of the mean squared error and gives higher weight to larger errors (outliers) compared to MAE, making it more sensitive to severe deviations.
Where = true value, = predicted value and N= number of samples.
3. Experimental Setup and Data Acquisition
In this experiment, a total of 84 Nam Dok Mai Si Thong mangoes were selected from 3 sources: the Maejo University farm in northern Thailand, which operates under Good Agricultural Practices (GAP); the community market of Suranaree University of Technology; and the central wholesale market in Nakhon Ratchasima Province, representing cultivation in the northeastern region of Thailand. All samples were carefully transported under controlled conditions to minimize postharvest deterioration. Physical measurements, including width, height, depth, and weight, were recorded for each mango using digital calipers and a precision balance, as shown in Table 2. These measurements served as ground-truth data for calibrating and validating the computer vision and artificial intelligence models, as illustrated in Figure 4.
The experimental setup employed a Logitech BRIO 4K Ultra HD camera for image acquisition and a UT383 mini light meter for illumination monitoring. Light intensity ranged from 330 to 1020 lux and was adjusted using a dimmable LED light, as shown in Figure 5. The camera was positioned at a distance of 55.5 cm from the conveyor surface, corresponding to the level of the scan horn of the irradiation machine. Images were captured at a resolution of 640 × 480 pixels. The system was designed to integrate image-based feature extraction (width and height) with predictive modeling for depth and weight estimation, forming the basis for mango size classification into export categories 1L, 2L and 3L. A total of 435 images were collected, consisting of 100 images for training the computer vision model, 290 images for generating LF data, and 45 images of unseen data divided into 3 sets of 15 images each.
The use of mangoes from multiple sources represents a significant advantage of this study, as it encompasses not only experimental plots but also real production and trade supply chains. However, in practice, it is difficult to control the quality of mangoes from each source due to factors such as harvest maturity and transportation duration. As mangoes advance in age, their ripening stage increases, leading to physical and chemical changes, including softening of the flesh, variations in sugar and acid content, changes in color, and alterations in size [32]. Although such diversity introduces additional complexity, it ultimately enhances the robustness of the computer vision and artificial intelligence models, enabling their practical application under diverse real-world conditions. Consequently, the developed results and models demonstrate strong practical utility and hold significant potential for deployment in industrial applications.
4. Results and Discussion
This section presents the results of dimensional analysis of Nam Dok Mai mangoes, including the estimation of width, height, and depth from image-based computer vision techniques. In addition, the outcomes of size classification and weight prediction using ANN and GPR models are discussed to evaluate the accuracy and effectiveness of the proposed approach.
4.1. Measurement of Nam Dok Mai Si Thong Mango Dimensions
In estimating the width and height of mangoes from top-view images using Computer Vision and Image Processing techniques, 100 images were used for training, with controlled variations in illumination levels within the dataset as shown in Figure 6. The model was then tested with three sets of unseen data.
The optimal threshold values were found to be Tlow = 144 and Thigh = 255, which provided the most accurate results for estimating mango width and length under illumination conditions of 330–1020 lux. The results are summarized in Table 3 as follows:
The average MAPE was 2–3%, while MAE ranged from 0.19–0.32 cm, and RMSE ranged from 0.23–0.43 cm. This level of accuracy confirms that the dimensional estimates are reliable inputs for the subsequent weight prediction and size classification stages. For estimating the mango depth, the relationship between width and length was employed. Ground-truth data from 84 Nam Dok Mai Si Thong mangoes were used to train an LR model, resulting in the regression equation presented as Equation (27).
The method was further improved by combining Linear Regression with Co-Kriging (LR+CoK), which is particularly suitable in cases where high-fidelity (HF) data are limited. In this approach, low-fidelity (LF) data were generated from 290 images, and LR was applied to establish the regression relationship, as shown in Equation (28). These LF data were then combined with HF data to train a multi-fidelity Co-Kriging model.
The learning results showed that the LR+CoK method yielded the lowest average errors, with MAPE = 1.20%, MAE = 0.082 cm, and RMSE = 0.099 cm. The test graphs demonstrated that LF data could be effectively transferred to HF data, while the Gaussian process of the discrepancy term generated a continuous predictive surface that captured the true trends accurately. The 1D slice plots further confirmed correct multi-fidelity behavior, as shown in Figure 7. Specifically, when HF data were dense, the Co-Kriging model corrected the discrepancies that LR alone could not capture, whereas in sparse HF regions, the model reverted to relying on LF estimates. This ensured safer and more stable predictions. The results of mango height estimation using the Linear Regression (LR) method and the combined Linear Regression with Co-Kriging (LR+CoK) method are presented in the Table 4.
From the test results using three sets of unseen data, where the width and length obtained from the computer vision processing stage were used to estimate the height, it was found that both LR alone and LR+CoK achieved MAPE in the range of 2–4%, MAE between 0.10–0.33 cm, and RMSE between 0.13–0.38 cm. These values are considered acceptable for the evaluation of agricultural yields. However, in the case of Unseen Data Set 2, the LR+CoK method produced better results, demonstrating the effectiveness of CoK when the LF dataset exhibited shape, illumination, and placement characteristics close to the HF domain. According to Equation (23), the GPR of the discrepancy term can accurately learn the deviation patterns between LF and HF. For Unseen Data Sets 1 and 3, some images contained specular highlights or edge fragments from the computer vision stage, causing errors in the extracted width and length values. When these were used in CoK, which relies on the parameters and estimated from a limited HF dataset, this led to overcorrection or extrapolation beyond the HF domain. As a result, RMSE increased, while MAPE and MAE significantly deteriorated. However, despite these limitations, the overall estimate of mango dimensions (width, height and depth) remained highly accurate and within acceptable limits, serving as reliable input for the subsequent steps of size classification using ANN and weight prediction using GPR.
4.2. Size-Based Sorting of Nam Dok Mai Si Thong Mangoes
In classifying the size of mangoes, this study employed both ANN and GPR for prediction. The ANN directly outputs the “size” of the mango, whereas GPR predicts the “weight” of the mango, which is then mapped to a size category based on the standard criteria. For ANN, since it is a highly flexible model (universal approximator), even with a shallow architecture, a small number of parameters, and proper feature scaling, it can still perform effectively on small datasets while reducing the risk of overfitting. In this work, ANN models were trained in two configurations: with default parameters and with hyperparameter tuning using Optuna (number of layers/neurons, dropout rate, learning rate, and number of epochs). The objective was to find a balance between flexible decision boundaries and robustness against unseen data. The training results are illustrated in Figure 8.
From the training process, the ANN model achieved an accuracy of 86.67%, while the Optuna-tuned ANN model achieved an improved accuracy of 93.33%. These models were then evaluated on three sets of unseen data, where each image was first processed to predict the width, height, and depth using the methods described above. The results of these evaluations are presented in Figure 9 and Figure 10.
Since size determination depends on numerical weight, and production lines require confidence in results near the boundary thresholds, GPR was employed to predict the weight. The advantage of GPR is that it provides both the predicted value and the predictive variance, which can be used to establish risk-based decision policies. The results obtained from training the GPR model are shown as follows:
From Figure 11, it can be observed that GPR exhibits very low uncertainty at each prediction point, indicating that the model achieves high accuracy. The model was then tested with unseen data, where GPR used W, H, and D as inputs to predict the weight, which was then mapped to a size category based on the standard criteria shown in Table above. The results are presented in Figure 12 and Table 5 as follows:
When the results of the size predictions from all three methods were summarized in terms of accuracy for clearer comparison, the outcomes are presented in Table 6 as follows:
The test results with the three unseen datasets showed that ANN (Default) exhibited high stability and achieved an immediate accuracy improvement when using the depth estimated from CoK, reaching 93.33% in two sets. This indicates that the quality of the depth variable plays a critical role in class separation, sharpening the width, height, and depth decision boundary and reducing misclassification between adjacent classes. The ANN+Optuna model performed better in certain cases, particularly in test Set 3. However, due to the limited number of real samples, it may have exhibited domain-specific tuning effects, leading to fluctuations in accuracy across test sets. Most misclassifications occurred near the class boundaries (weight thresholds), which aligns with the physical reality that fruits often vary slightly in shape despite having similar weights.
In contrast, GPR was employed for weight prediction. Its advantage lies in providing both the predicted value and the predictive variance, enabling the implementation of risk-aware decision-making in production lines. Across all three test sets, the mean absolute error MAE of weight prediction was approximately 20 grams. While this error level is not negligible, it is well within the tolerance for accurate size classification. This is because the weight range for each size category spans several tens of grams, a margin much wider than the prediction error.. Notably, when depth estimated from LR+CoK was used, it reduced bias near the size boundaries, resulting in size classification accuracy as high as 93.33% across all test sets. Therefore, if a system with consistent accuracy and confidence estimation is required, the combination of GPR (weight to size) with depth from LR+CoK is recommended. On the other hand, if a lightweight and straightforward system is preferred, ANN (Default) with Depth from LR+CoK also provides high and stable performance. These findings highlight that the key factor lies in obtaining high-quality depth information from LR+CoK, which enhances the performance of both ANN and GPR simultaneously—yielding sharper decision boundaries for ANN and more accurate weight predictions for GPR.
The results demonstrate a progression of innovation, beginning with the accurate image-based measurement of mango width and height. The main challenge, estimating the third dimension (depth), was effectively addressed by the LR+CoK model, which consistently outperformed the standard LR model by leveraging a combination of limited high-fidelity and abundant low-fidelity data. This improved depth estimation was the critical factor that subsequently enhanced the performance of both the ANN for direct size classification and the GPR for weight-based grading. A key finding is the trade-off between different modeling approaches. While the Optuna-tuned ANN showed high accuracy, its performance fluctuated across test sets, suggesting potential overfitting to specific training domains. In contrast, the GPR model, when paired with the superior depth data from LR+CoK, provided a consistently high accuracy of 93.33 percent across all unseen datasets. The practical advantage of GPR lies not only in its accuracy but also in its ability to provide a predictive variance. This is highly valuable in an industrial setting, as it allows for risk-based decision-making. For instance, mangoes with weights predicted near a size-grade boundary and high variance could be flagged for manual inspection, thereby minimizing costly grading errors.
Most importantly, the dimensional accuracy achieved directly translates to the primary goal of this research: optimizing the phytosanitary irradiation process. The MAE in weight prediction of approximately 20 grams is well within the acceptable tolerance for grading, but more critically, the precise dimensional data (W, L, D) allows for the real-time calculation of the required radiation dose according to Equations (1)-(4). By adjusting the conveyor speed or beam power for each individual fruit, the system can prevent energy waste from over-irradiating smaller mangoes, directly addressing the core problem of high operational costs in the current fixed-dose systems. Therefore, the combination of GPR with depth estimation from LR+CoK emerges as the most robust and industrially viable solution, offering both high accuracy and valuable confidence metrics for real-world deployment in agri-food supply chains.
5. Conclusions
This study developed and validated a low-cost, non-invasive system for the real-time, three-dimensional estimation of ’Nam Dok Mai Si Thong’ mangoes using a single 2D camera. The key innovation was the implementation of a Linear Regression with Co-Kriging (LR+CoK) technique, which effectively overcame the inherent limitations of 2D imaging to produce highly accurate depth estimations. This enhanced dimensional data served as a robust foundation for subsequent AI models, enabling a GPR-based weight prediction model to achieve a size classification accuracy of 93.33 percent on unseen test data. The direct application of this research lies in transforming the efficiency and sustainability of the fruit export industry. By providing precise fruit dimensions in real-time, the system allows for the dynamic optimization of phytosanitary X-ray irradiation, minimizing energy consumption and reducing operational costs significantly. This work provides a practical engineering solution that not only improves agricultural quality control but also enhances the economic viability of post-harvest processing.
Future work will focus on expanding the model’s robustness by incorporating a more diverse dataset of mango cultivars and integrating the system with a physical conveyor for a tangible evaluation of energy savings and throughput enhancement in a pilot-scale production line.
Author Contributions
Conceptualization, J.S. and I.W.; methodology, J.S., S.K. and I.W.; software, S.P., S.R. and I.W.; validation, J.S., T.S. and I.W.; formal analysis, J.S. and I.W; investigation, T.S. and I.W; resources, J.S. and S.K.; data curation, S.R. and I.W.; writing—original draft preparation, T.S. and I.W.; writing—review and editing, J.S., T.S.,S.K. and I.W.; visualization, T.S. and I.W.; supervision, J.S.,T.S.and S.K.; project administration, J.S.; funding acquisition, J.S. and S.K. All authors have read and agreed to the published version of the manuscript.
Funding
This research was funded by the Suranaree University of Technology (SUT), grant IRD7-707-67.
Data Availability Statement
Dataset available on request from the authors.
Acknowledgments
The authors gratefully acknowledge the generous support from Suranaree University of Technology (SUT) and the Synchrotron Light Research Institute (Public Organization). AI-powered tools were utilized for translation and grammatical editing to improve the language and clarity of this manuscript.
Conflicts of Interest
The authors declare no conflicts of interest.
Abbreviations
The following abbreviations are used in this manuscript:
| ANN | Artificial Neural Network |
| CoK | Co-Kriging |
| GPR | Gaussian Process Regression |
| HF | High Fidelity |
| LF | Low Fidelity |
| LR | Linear Regression |
References
- Dissayasakda, N. Thai Mango Guide, 2023. Accessed: 2025-09-12.
- Chomchalow, N.; Na Songkhla, P. Thai Mango Export: A Slow-but-Sustainable Development. AU Journal of Technology 2008, 12, 1–8. [Google Scholar]
- Kitagawa, H. The Potential of Thai Fruits and Vegetables in the Japanese Market. Kasetsart Journal of Social Sciences 1991, 12, 59–67. [Google Scholar]
- Tangpao, T.; Phuangsaujai, N.; Kittiwachana, S.; George, D.R.; Krutmuang, P.; Chuttong, B.; Sommano, S.R. Evaluation of Markers Associated with Physiological and Biochemical Traits during Storage of ‘Nam Dok Mai Si Thong’ Mango Fruits. Agriculture 2022, 12. [Google Scholar] [CrossRef]
- Ministry of Public Health. Notification of the Ministry of Public Health (No. 297) B.E. 2549 (2006): Re: Irradiated Food. Royal Thai Government Gazette, Vol. 123, Special Part 118 Ngor, pp. 23–26, 2006. Copy published in the Government Gazette, General edition no. 127, Special section 121 Ngor, 18th October 2010. Accessed: 2025-09-12.
- Codex Alimentarius Commission. General Standard for Irradiated Foods (CODEX STAN 106-1983, Rev. 1-2003), 2003.
- U.S. Food and Drug Administration. CFR – Code of Federal Regulations Title 21, Part 179: Irradiation in the Production, Processing, and Handling of Food. Federal Register, Docket No. FDA-1999-F-2405 (formerly 1999F-5522), 2014. Current revision. Final rule published February 25, 2014.
- Chunjarean, S.; Manasatitpong, K.; Yachum, N.; Phacheerak, W.; Kokkrathoke, S.; Pongampai, S.; Kulthanasomboon, P.; Jummunt, S.; Klinkhieo, S. Development of a 6 MeV electron beam energy Linac for fruit sterilization. Journal of Physics: Conference Series 2023, 2431, 012071. [Google Scholar] [CrossRef]
- Kokkrathoke, S.; Yachum, N.; Chunjarean, S.; Manasatitpong, K. Synchronisation of linear accelerator for fruit irradiation with FPGA-based system. Journal of Physics: Conference Series 2023, 2653, 012028. [Google Scholar] [CrossRef]
- Alanazi, S.F. Evaluating the effect of X ray irradiation in the control of food bacterial pathogens. Journal of King Saud University - Science 2023, 35, 102367. [Google Scholar] [CrossRef]
- Yoon, Y.S.; Ameer, K.; Song, B.S.; Kim, J.K.; Park, H.Y.; Lee, K.C.; Eun, J.B.; Park, J.H. Effects of X-ray irradiation on the postharvest quality characteristics of ‘Maehyang’ strawberry (Fragaria × ananassa). Food Chemistry 2020, 325, 126817. [Google Scholar] [CrossRef] [PubMed]
- Utai, K.; Nagle, M.; Hämmerle, S.; Spreer, W.; Mahayothee, B.; Müller, J. Mass estimation of mango fruits (Mangifera indica L., cv. ‘Nam Dokmai’) by linking image processing and artificial neural network. Engineering in Agriculture, Environment and Food 2019, 12, 103–110. [Google Scholar] [CrossRef]
- SPACEBAR. Thai People vs. Mango Sticky Rice: When Did This Deliciousness Begin? Original article in Thai; English title provided by translator.
- Thai Agricultural Standard: Mango (TAS 5-2015), 2015. Royal Thai Government Gazette, Volume 132, Section 179.
- Penchaiya, P.; Tijskens, P. Assessing the peel colour behaviour of mango ‘Nam Dok Mai See Thong’ during cool storage. Acta Horticulturae 2017, pp. 207–212. https://doi.org/10.17660/ActaHortic.2017.1154.27. [CrossRef]
- Jitvisate, M.; Apiwattanakul, P.; Kangrang, N.; Saisut, J.; Thongbai, C.; Rimjaem, S. Compact RF linear accelerator for electron beam irradiation applications at PBP-CMU Electron Linac Laboratory. Nuclear Science and Techniques 2025, 36. [Google Scholar] [CrossRef]
- Princess Maha Chakri Sirindhorn The information Technology Foundation, U.T.I.o.H.R.H. Newsletter, Vol. 1/2023. https://www.princess-it.org/wp-content/uploads/2024/04/20230331_PSIT_NewsLetter2023_Q1-CT-M-2-Final.pdf, 2023. ISSN 2287-0156.
- Sultana, T.; Maraz, K.M.; Ahmed, A.; Shultana, S.; Khan, R. Effect of Irradiation process on mango. GSC Advanced Research and Reviews 2021, 9, 108–118. [Google Scholar] [CrossRef]
- Kim, J.; Moreira, R.G.; Castell-Perez, M.E. Improving phytosanitary irradiation treatment of mangoes using Monte Carlo simulation. Journal of Food Engineering 2015, 149, 137–143. [Google Scholar] [CrossRef]
- Gonzalez, R.C.; Woods, R.E. Digital Image Processing, 4th ed.; Pearson, 2018.
- Pratt, W.K. Digital Image Processing: PIKS Scientific Inside, 4th ed.; Wiley-Interscience, 2007.
- Thong, N.D.; Thinh, N.T.; Cong, H.T. Mango Classification System Uses Image Processing Technology and Artificial Intelligence. In Proceedings of the 2019 International Conference on System Science and Engineering (ICSSE), 2019, pp. 45–52. [CrossRef]
- Tai, N.D.; Lin, W.C.; Trieu, N.M.; Thinh, N.T. Development of a Mango-Grading and -Sorting System Based on External Features, Using Machine Learning Algorithms. Agronomy 2024, 14. [Google Scholar] [CrossRef]
- Montgomery, D.C.; Peck, E.A.; Vining, G.G. Introduction to Linear Regression Analysis, 5th ed.; Wiley, 2012.
- Akiba, T.; Sano, S.; Yanase, T.; Ohta, T.; Koyama, M. Optuna: A Next-generation Hyperparameter Optimization Framework 2019. pp. 2019, 2623–2631. [Google Scholar] [CrossRef]
- De Caro, D.; Ippolito, M.; Cannarozzo, M.; Provenzano, G.; Ciraolo, G. Assessing the performance of the Gaussian Process Regression algorithm to fill gaps in the time-series of daily actual evapotranspiration of different crops in temperate and continental zones using ground and remotely sensed data. Agricultural Water Management 2023, 290, 108596. [Google Scholar] [CrossRef]
- Suphawan, K.; Kardkasem, R.; Chaisee, K. A Gaussian Process Regression Model for Forecasting Stock Exchange of Thailand. Trends in Sciences 2022, 19, 3045. [Google Scholar] [CrossRef]
- Wu, J.; Xu, R.; Huang, R.; Hong, X. Data-Efficient Training of Gaussian Process Regression Models for Indoor Visible Light Positioning. Sensors 2024, 24. [Google Scholar] [CrossRef] [PubMed]
- Song, Z.; Liu, Z.; Zhang, H.; Zhu, P. An improved sufficient dimension reduction-based Kriging modeling method for high-dimensional evaluation-expensive problems. Computer Methods in Applied Mechanics and Engineering 2024, 418, 116544. [Google Scholar] [CrossRef]
- Kennedy, M.C.; O’Hagan, A. Predicting the Output from a Complex Computer Code When Fast Approximations Are Available. Biometrika 2000, 87, 1–13. [Google Scholar] [CrossRef]
- Zhang, B.; Feng, P.; Sun, Z.; Cheng, X.; Zeng, L.; Fan, C. Efficient sampling method based on co-kriging for free-form surface measurement. Precision Engineering 2023, 84, 136–147. [Google Scholar] [CrossRef]
- Chen, X.; Xue, J.; Chen, X.; Zhao, X.; Ali, S.; Huang, G. Gaussian process regression for prediction and confidence analysis of fruit traits by near-infrared spectroscopy. Food Quality and Safety 2022, 7, fyac068. [Google Scholar] [CrossRef]
Figure 1.
(a) Export-grade Nam Dok Mai Si Thong mango from Maejo University Farm. (b) Mango sticky rice dessert [13].
Figure 1.
(a) Export-grade Nam Dok Mai Si Thong mango from Maejo University Farm. (b) Mango sticky rice dessert [13].
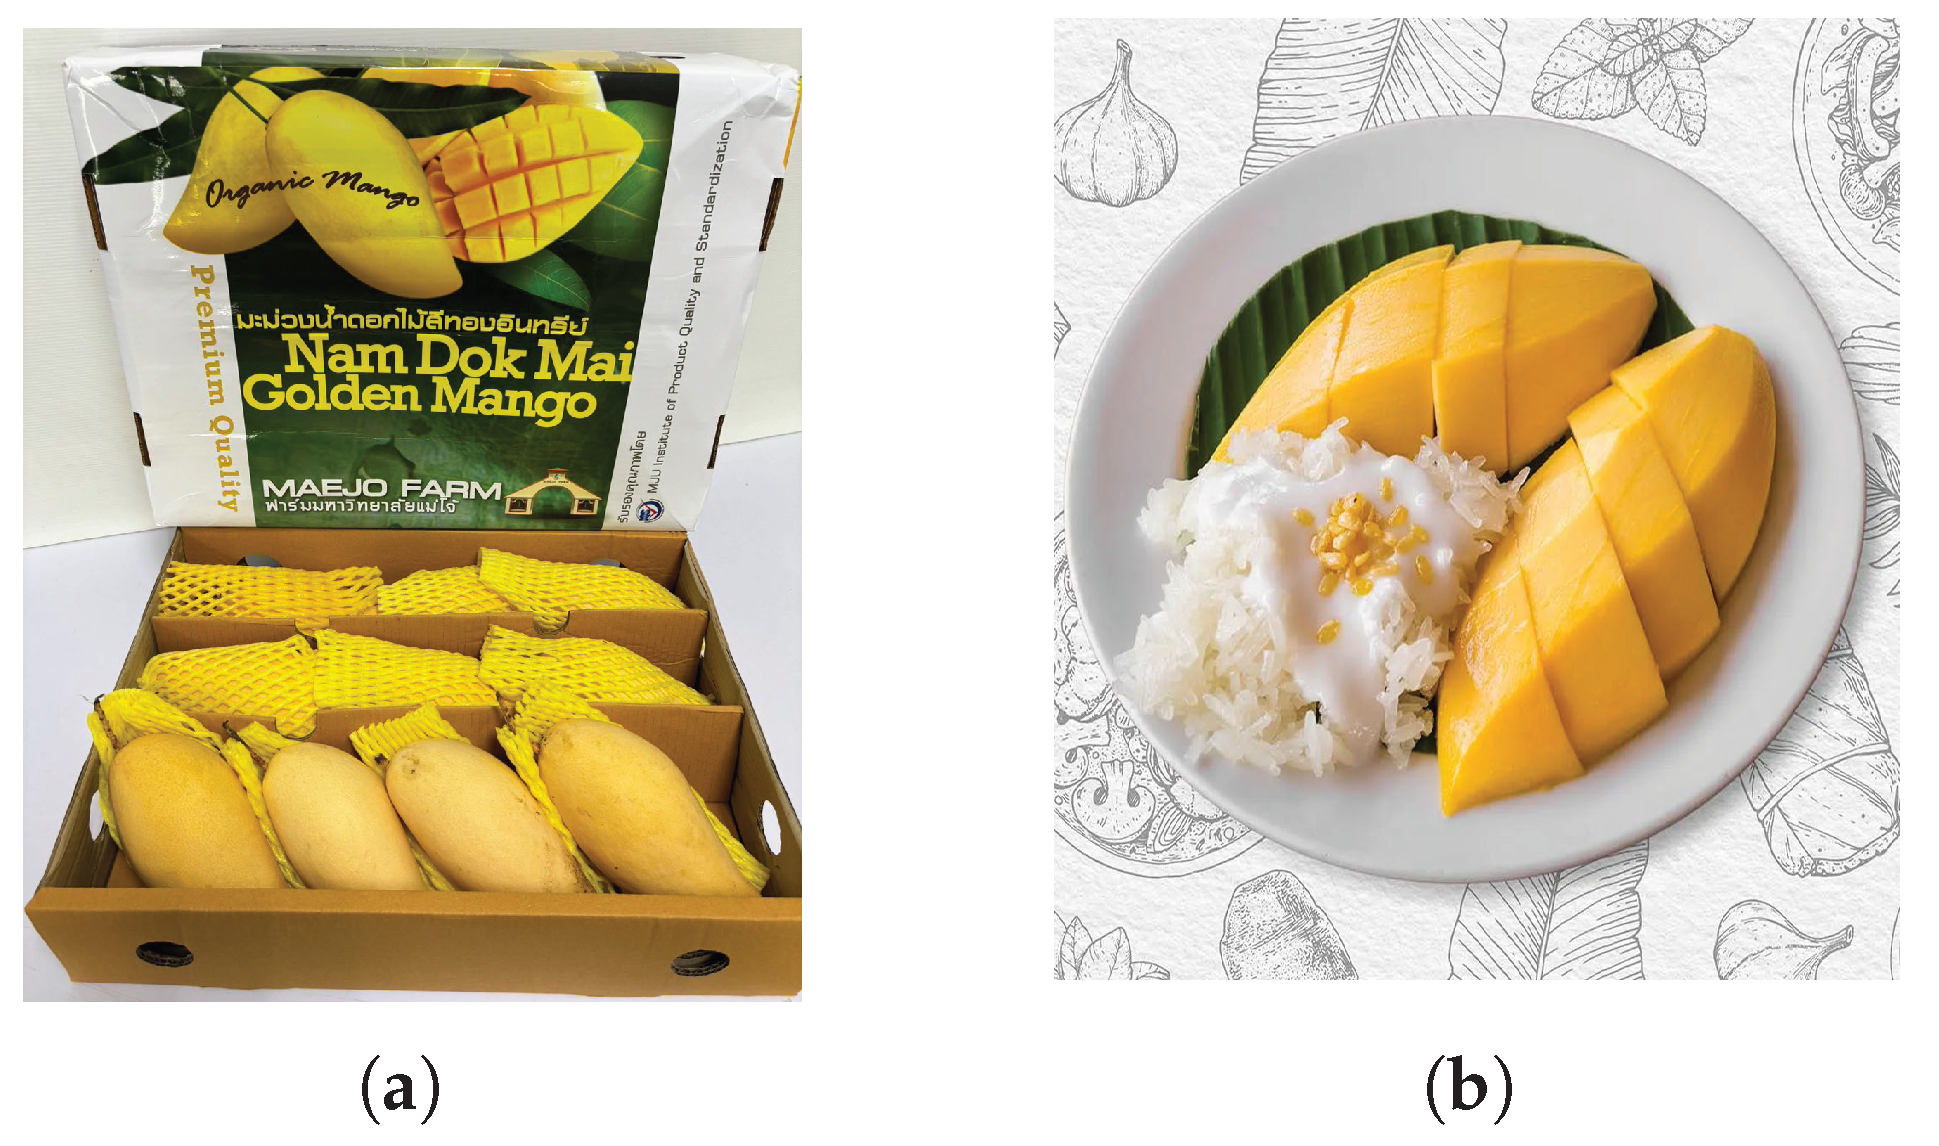
Figure 2.
Postharvest management system of Nam Dok Mai mangoes: current practices, identified problems, and AI-Based improvements.
Figure 2.
Postharvest management system of Nam Dok Mai mangoes: current practices, identified problems, and AI-Based improvements.
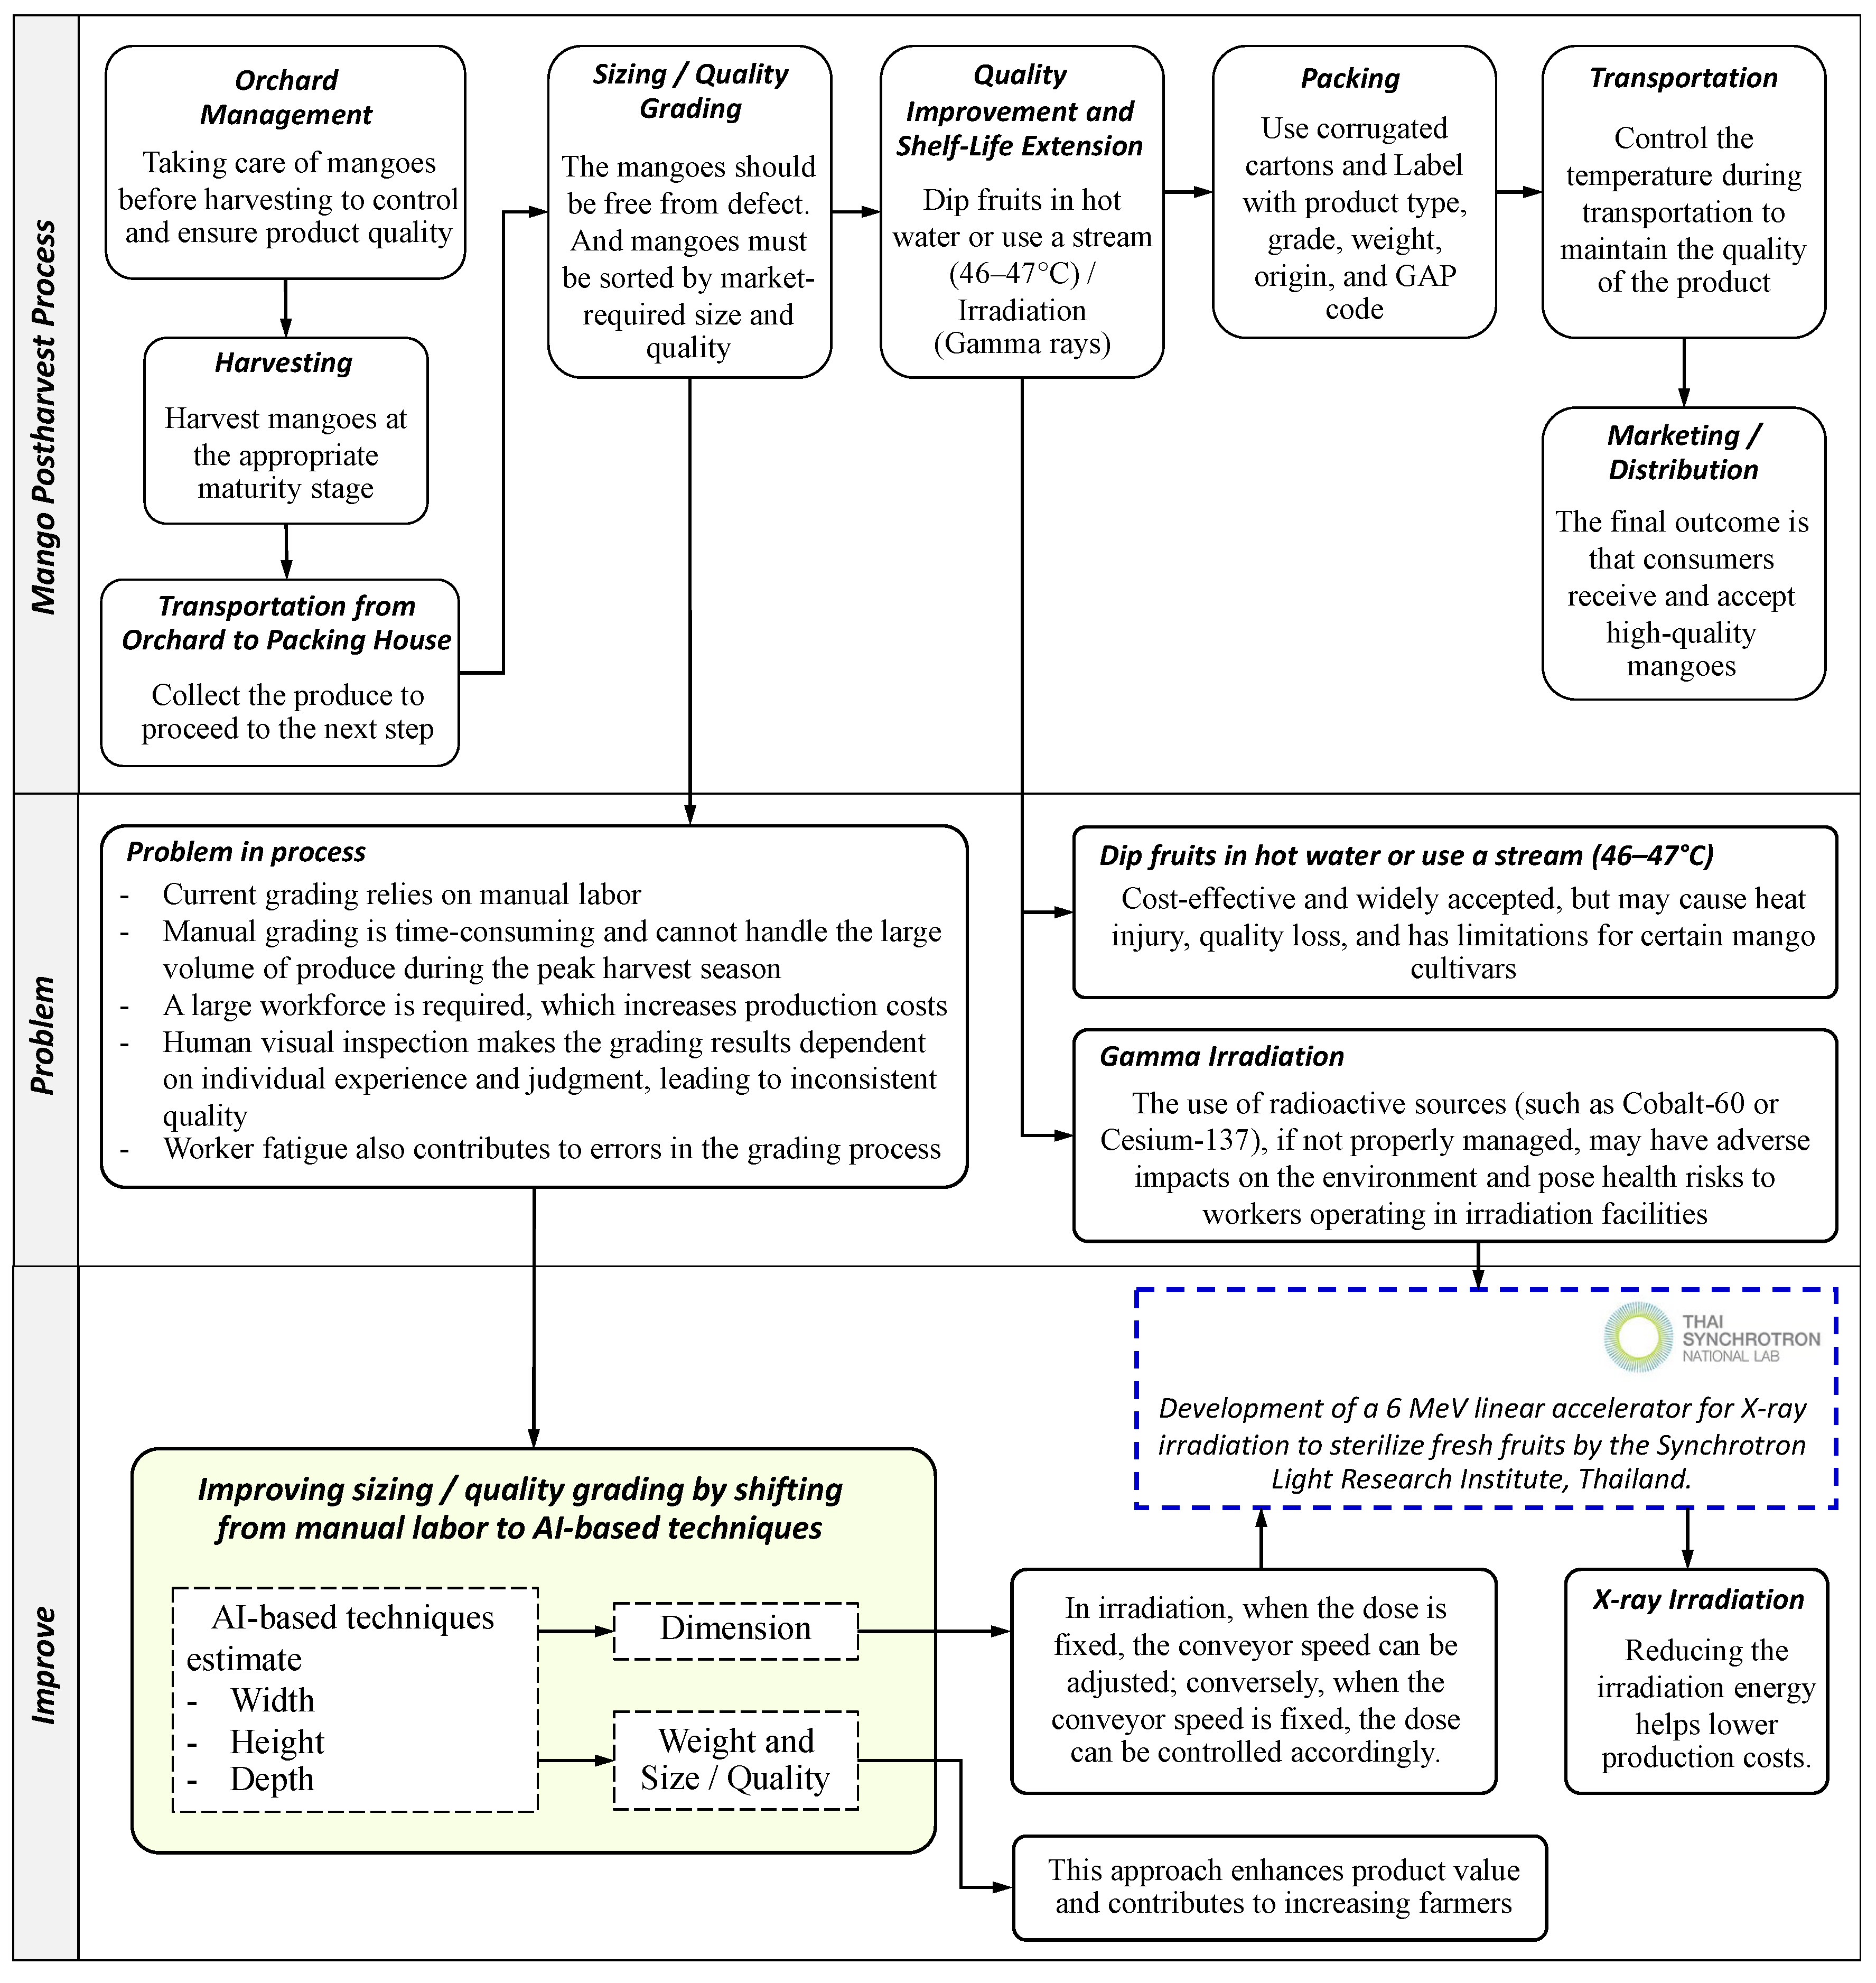
Figure 3.
Linear accelerator 6 MeV for X-ray irradiation to sterilize fresh fruits by the Synchrotron Light Research Institute, Thailand.
Figure 3.
Linear accelerator 6 MeV for X-ray irradiation to sterilize fresh fruits by the Synchrotron Light Research Institute, Thailand.
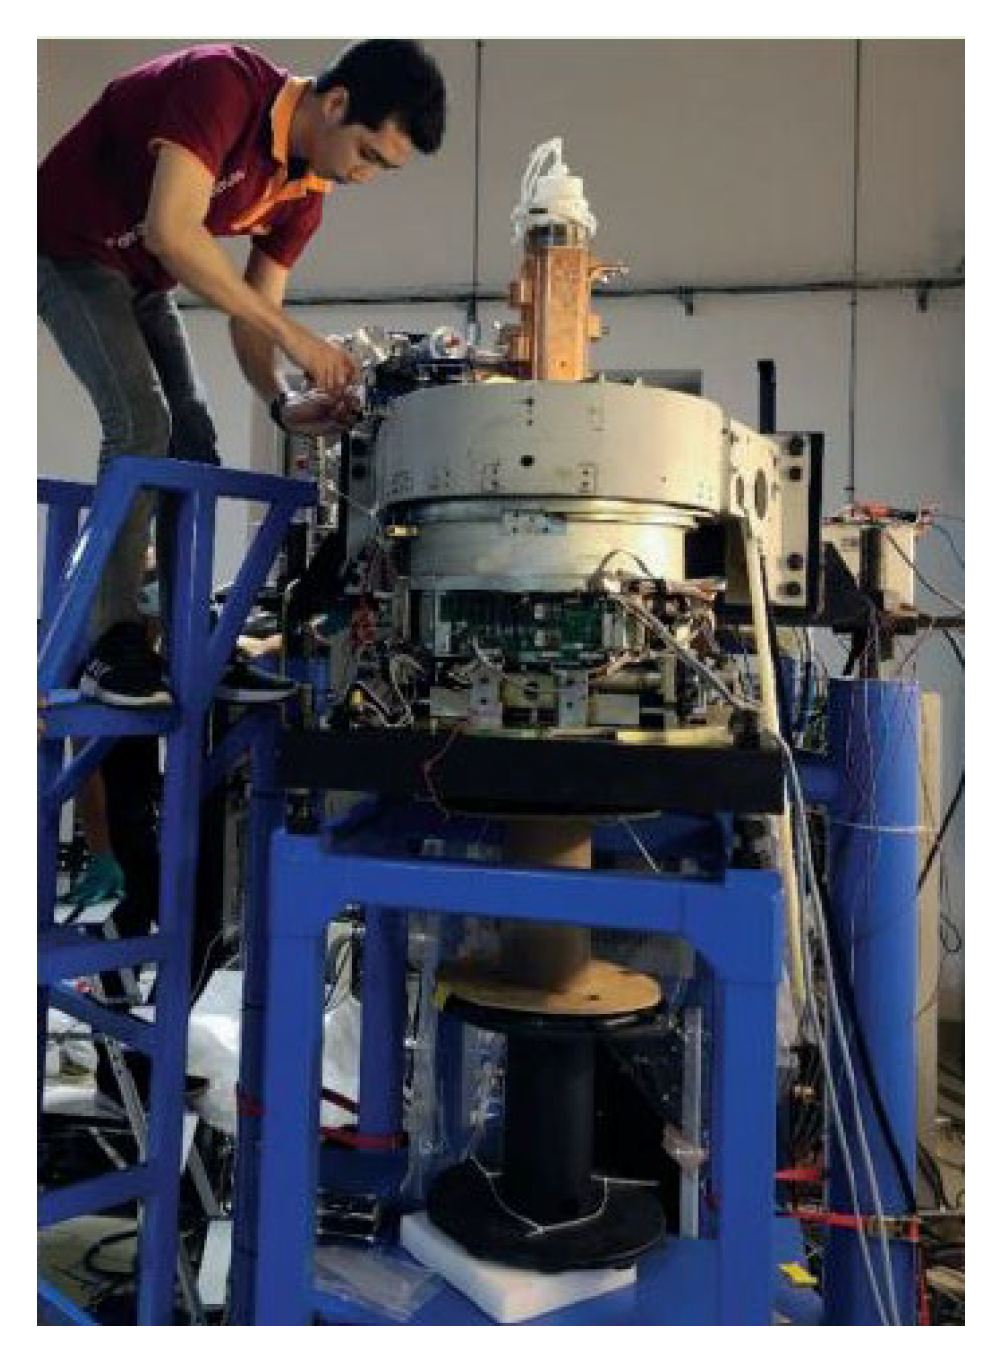
Figure 4.
Measurement of mango physical attributes: width, height, depth, and weight.
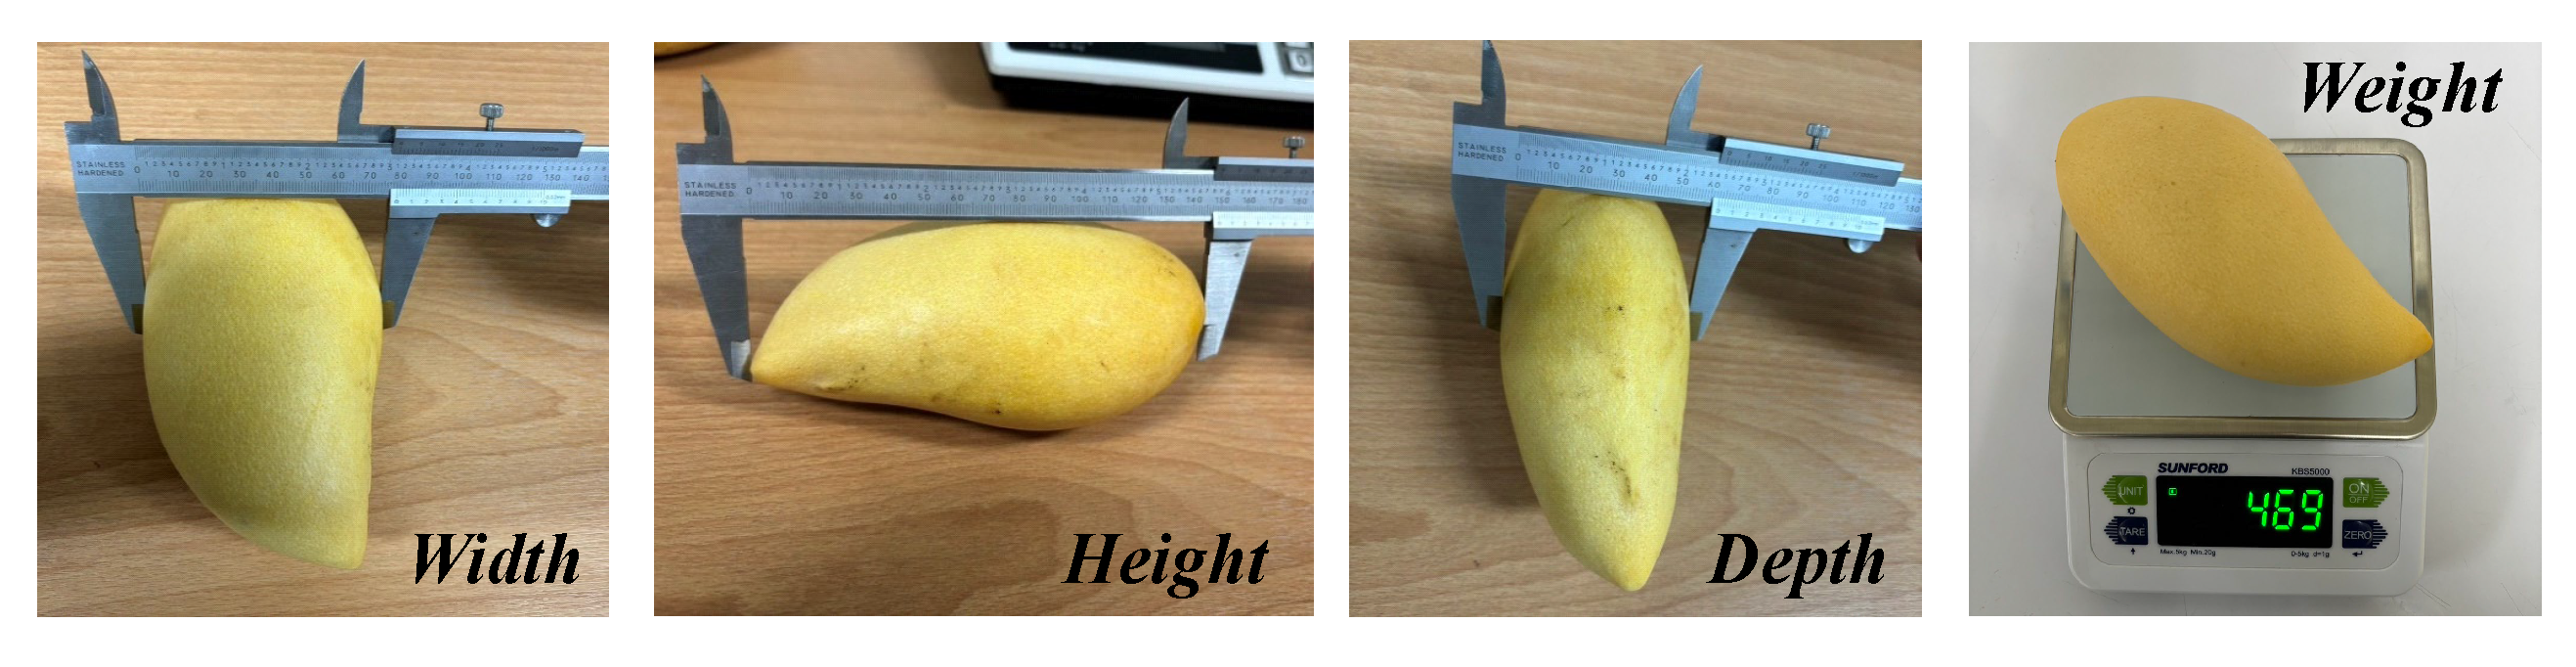
Figure 5.
Experimental setup for mango image acquisition.
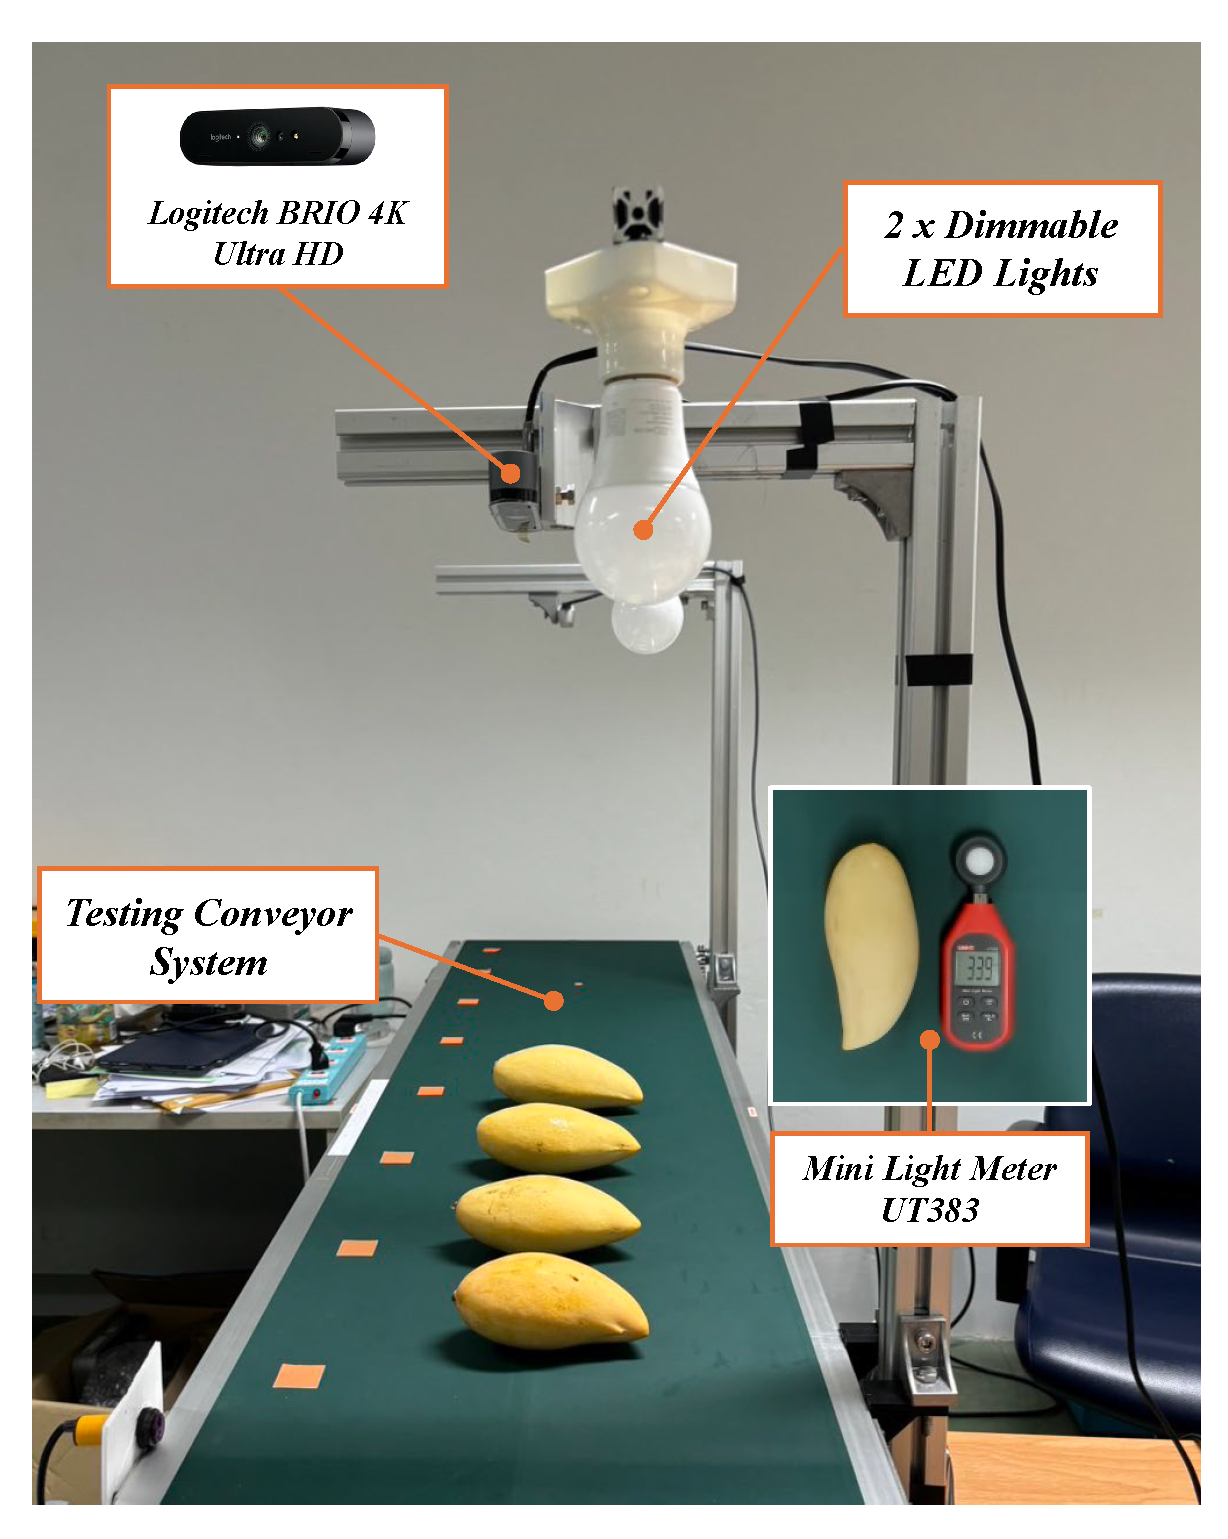
Figure 6.
Examples of edge detection and dimension estimation (width and height) of Nam Dok Mai Si Thong mangoes from top-view images using computer vision techniques under different illumination conditions.
Figure 6.
Examples of edge detection and dimension estimation (width and height) of Nam Dok Mai Si Thong mangoes from top-view images using computer vision techniques under different illumination conditions.
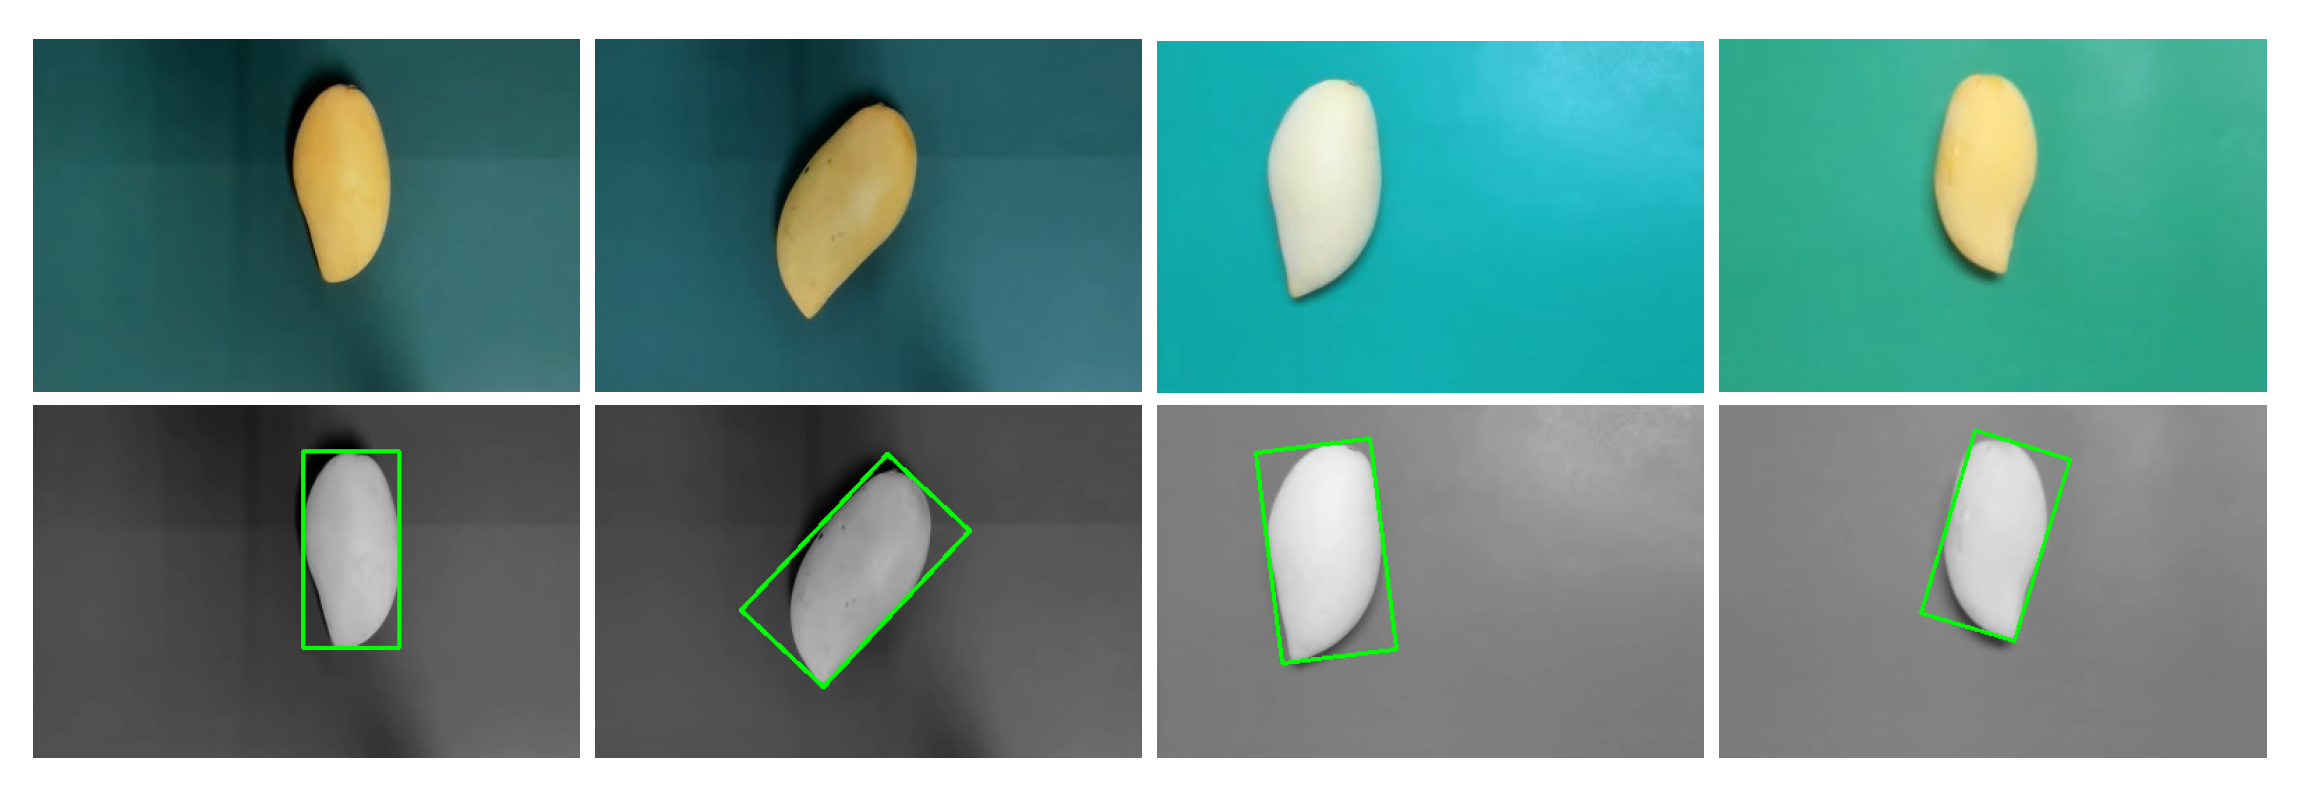
Figure 7.
Depth estimation results using LR + CoK (a) 1D slice analysis with LF and HF data. (b) Comparison of true versus predicted depth values.
Figure 7.
Depth estimation results using LR + CoK (a) 1D slice analysis with LF and HF data. (b) Comparison of true versus predicted depth values.
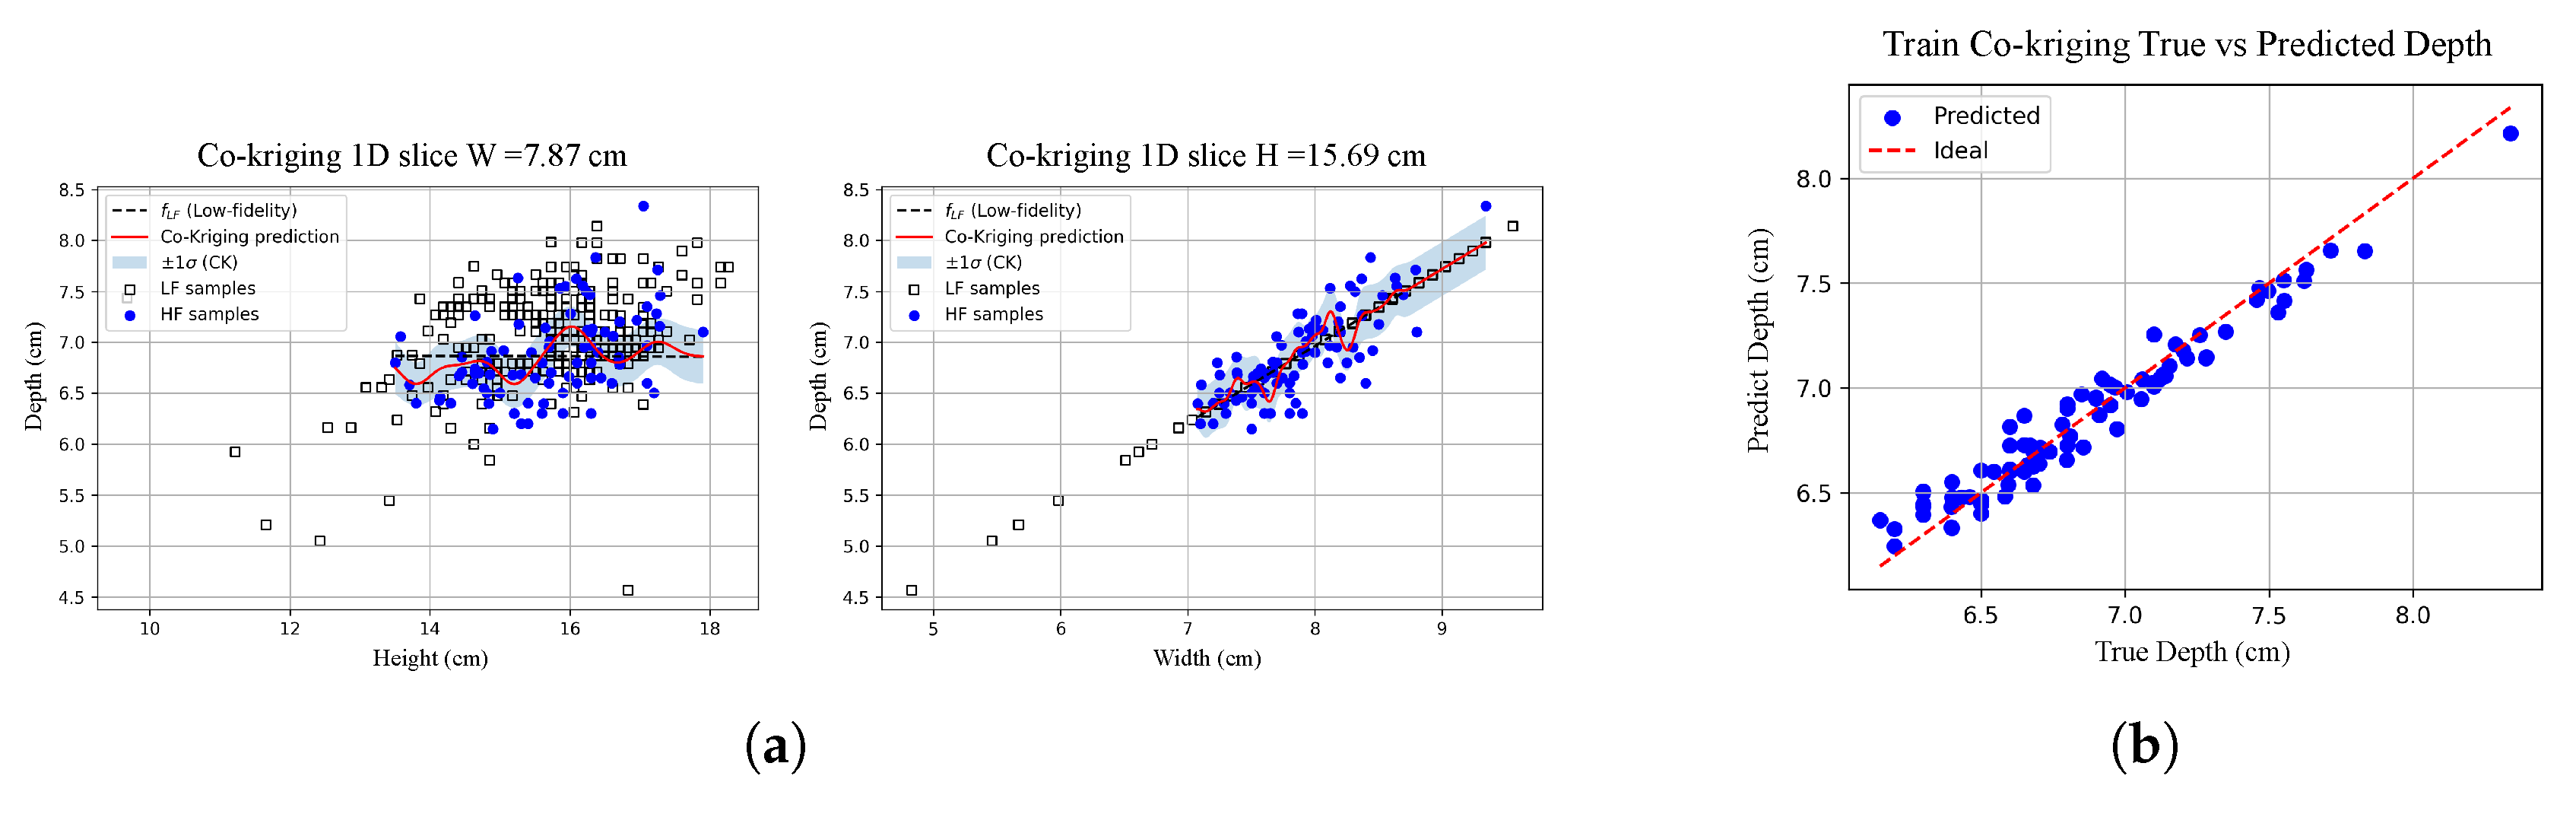
Figure 8.
Training results of ANN for mango size classification: (a) ANN with default parameters. (b) ANN with optimized hyperparameters tuned by Optuna.
Figure 8.
Training results of ANN for mango size classification: (a) ANN with default parameters. (b) ANN with optimized hyperparameters tuned by Optuna.
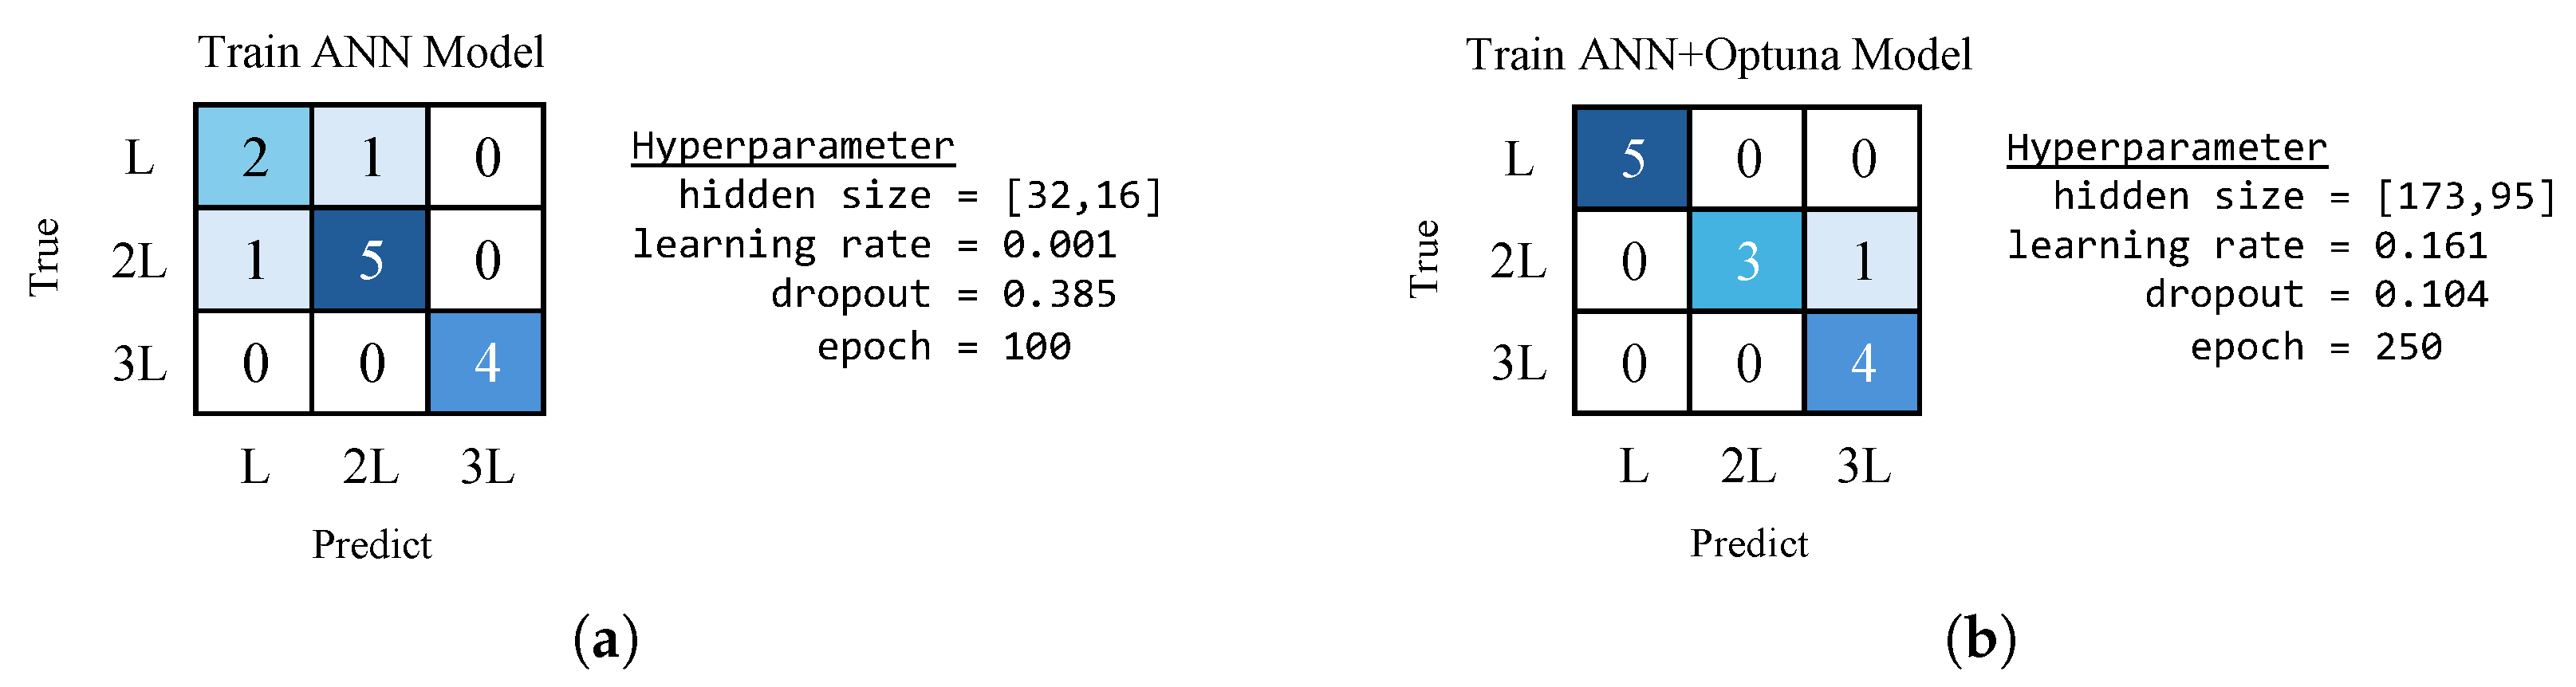
Figure 9.
Test results of mango size classification using ANN with default parameters: (a) Using depth estimated from LR. (b) Using depth estimated from LR + Co-Kriging.
Figure 9.
Test results of mango size classification using ANN with default parameters: (a) Using depth estimated from LR. (b) Using depth estimated from LR + Co-Kriging.

Figure 10.
Test results of mango size classification using ANN with Optuna parameters: (a) Using depth estimated from LR. (b) Using depth estimated from LR + CoK.
Figure 10.
Test results of mango size classification using ANN with Optuna parameters: (a) Using depth estimated from LR. (b) Using depth estimated from LR + CoK.
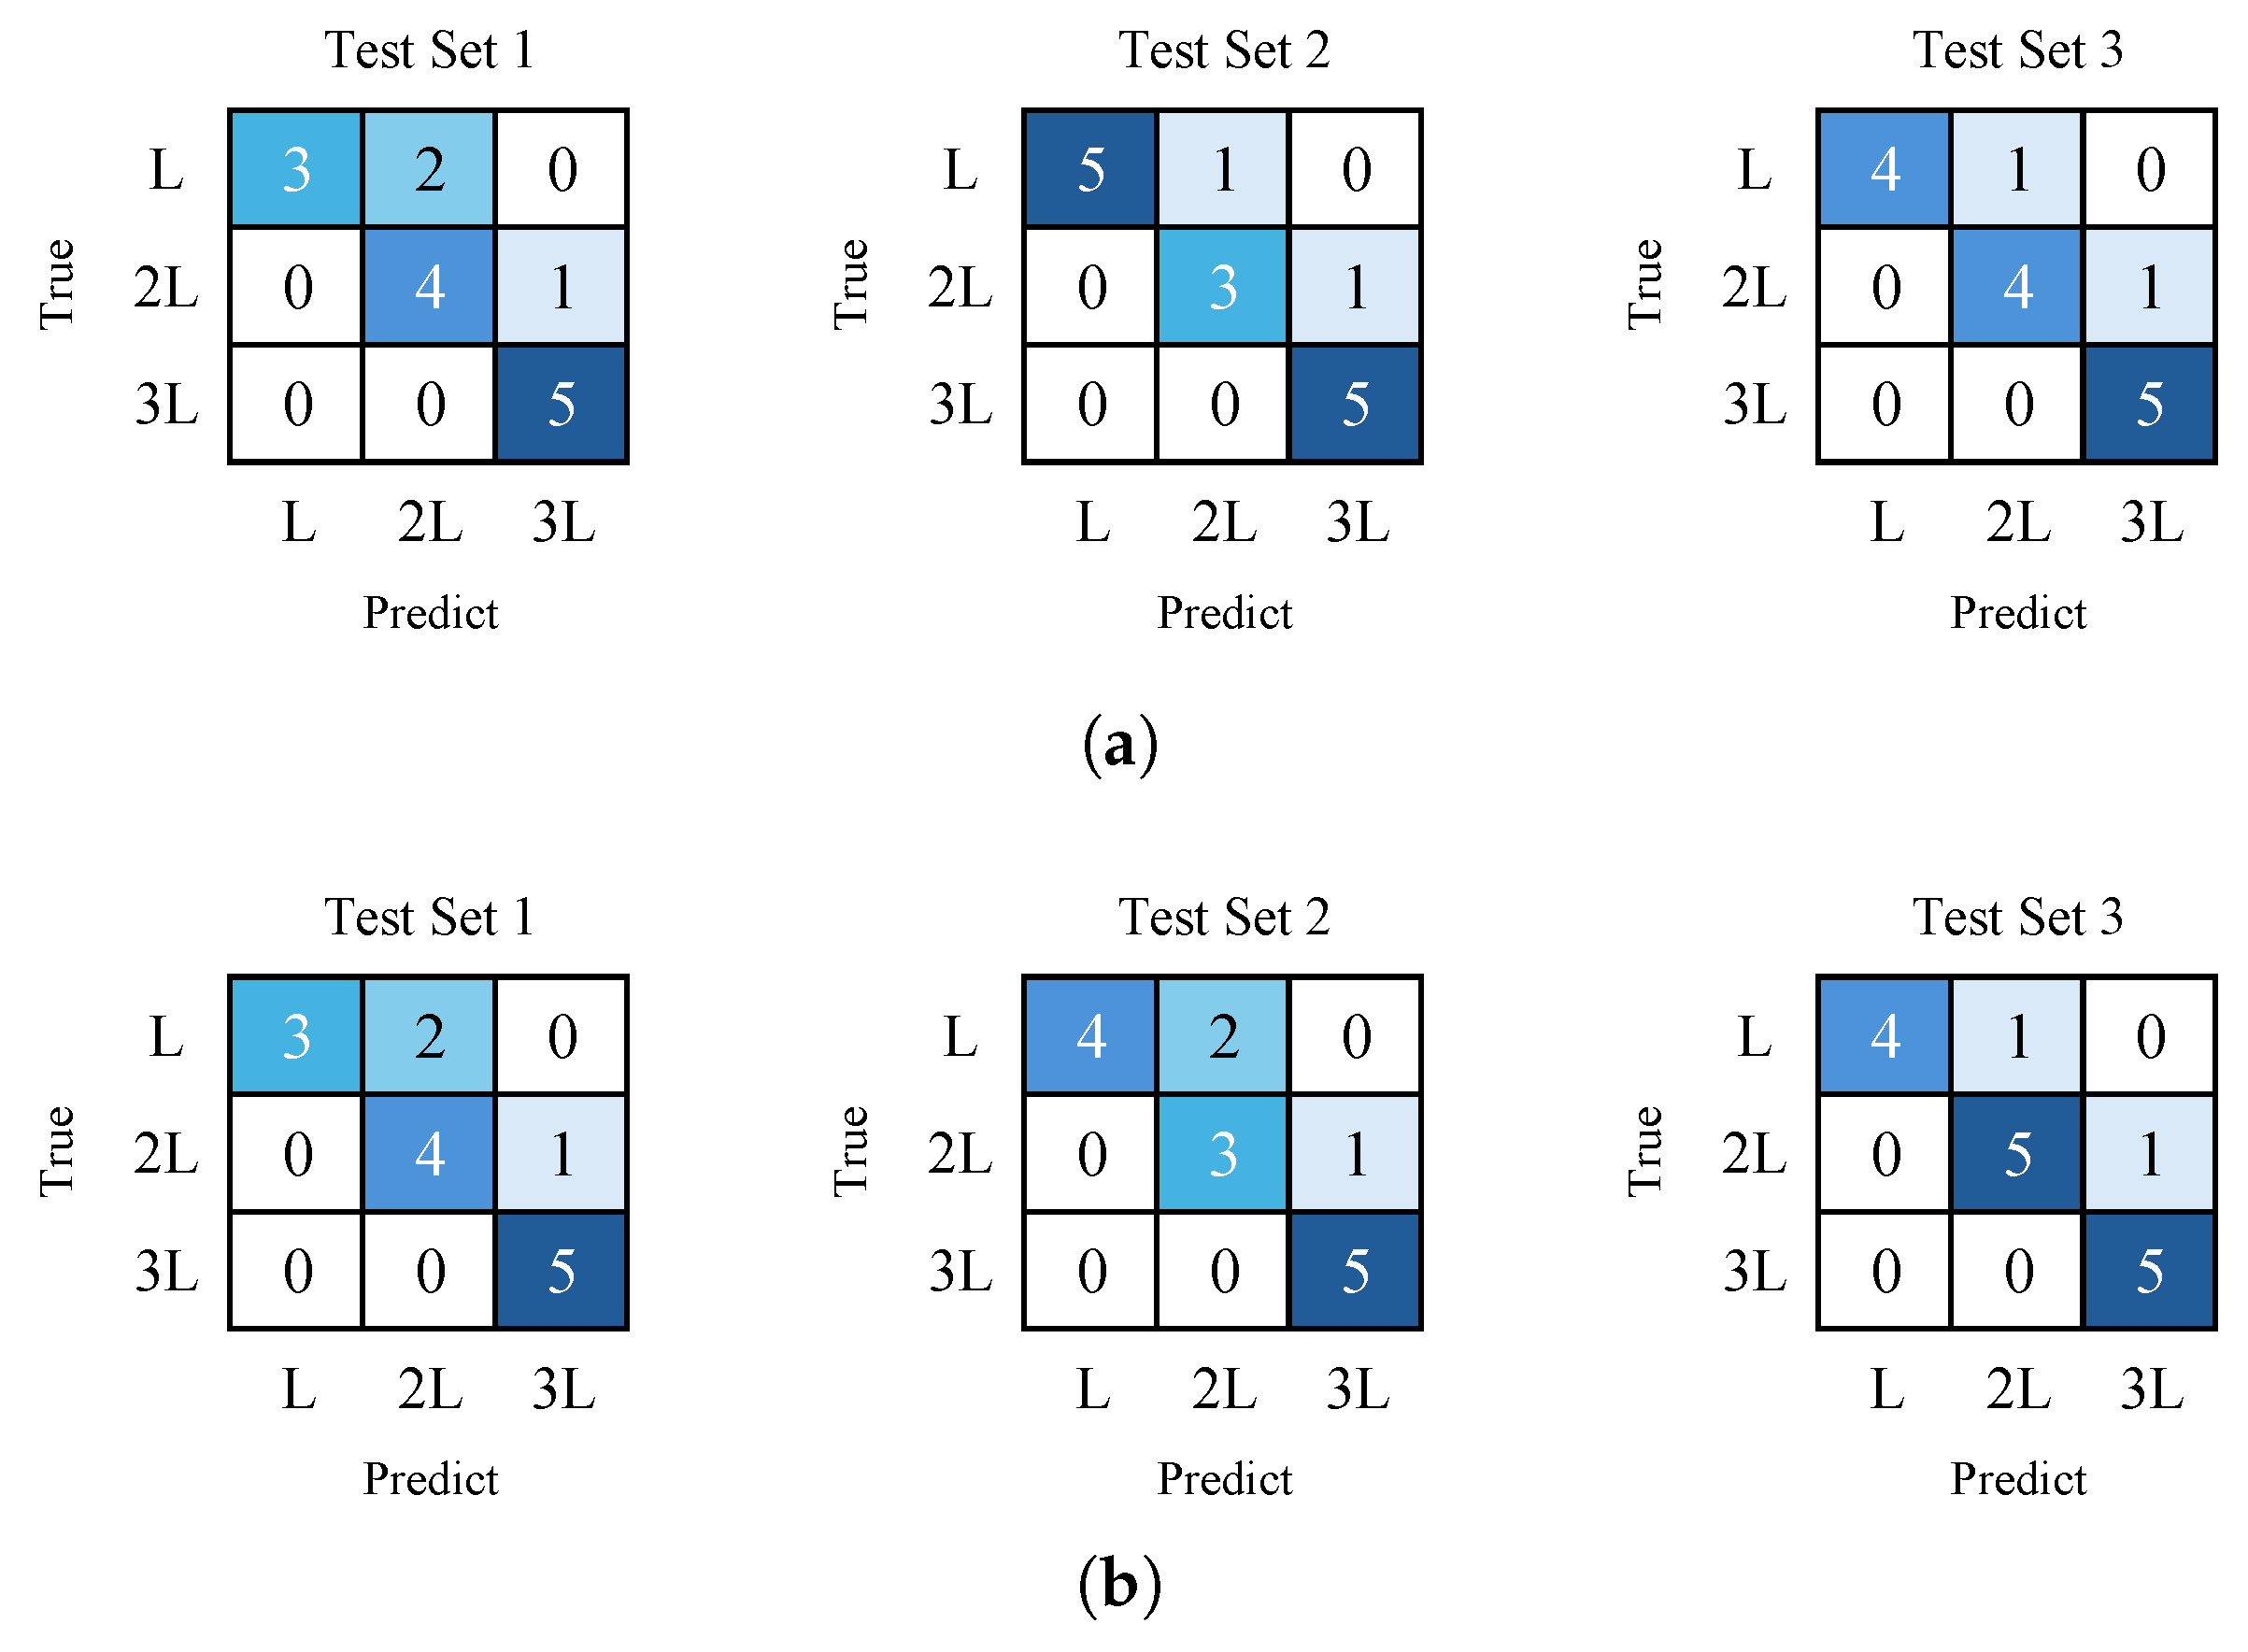
Figure 11.
Training results of Gaussian Process Regression (GPR) for mango weight prediction.
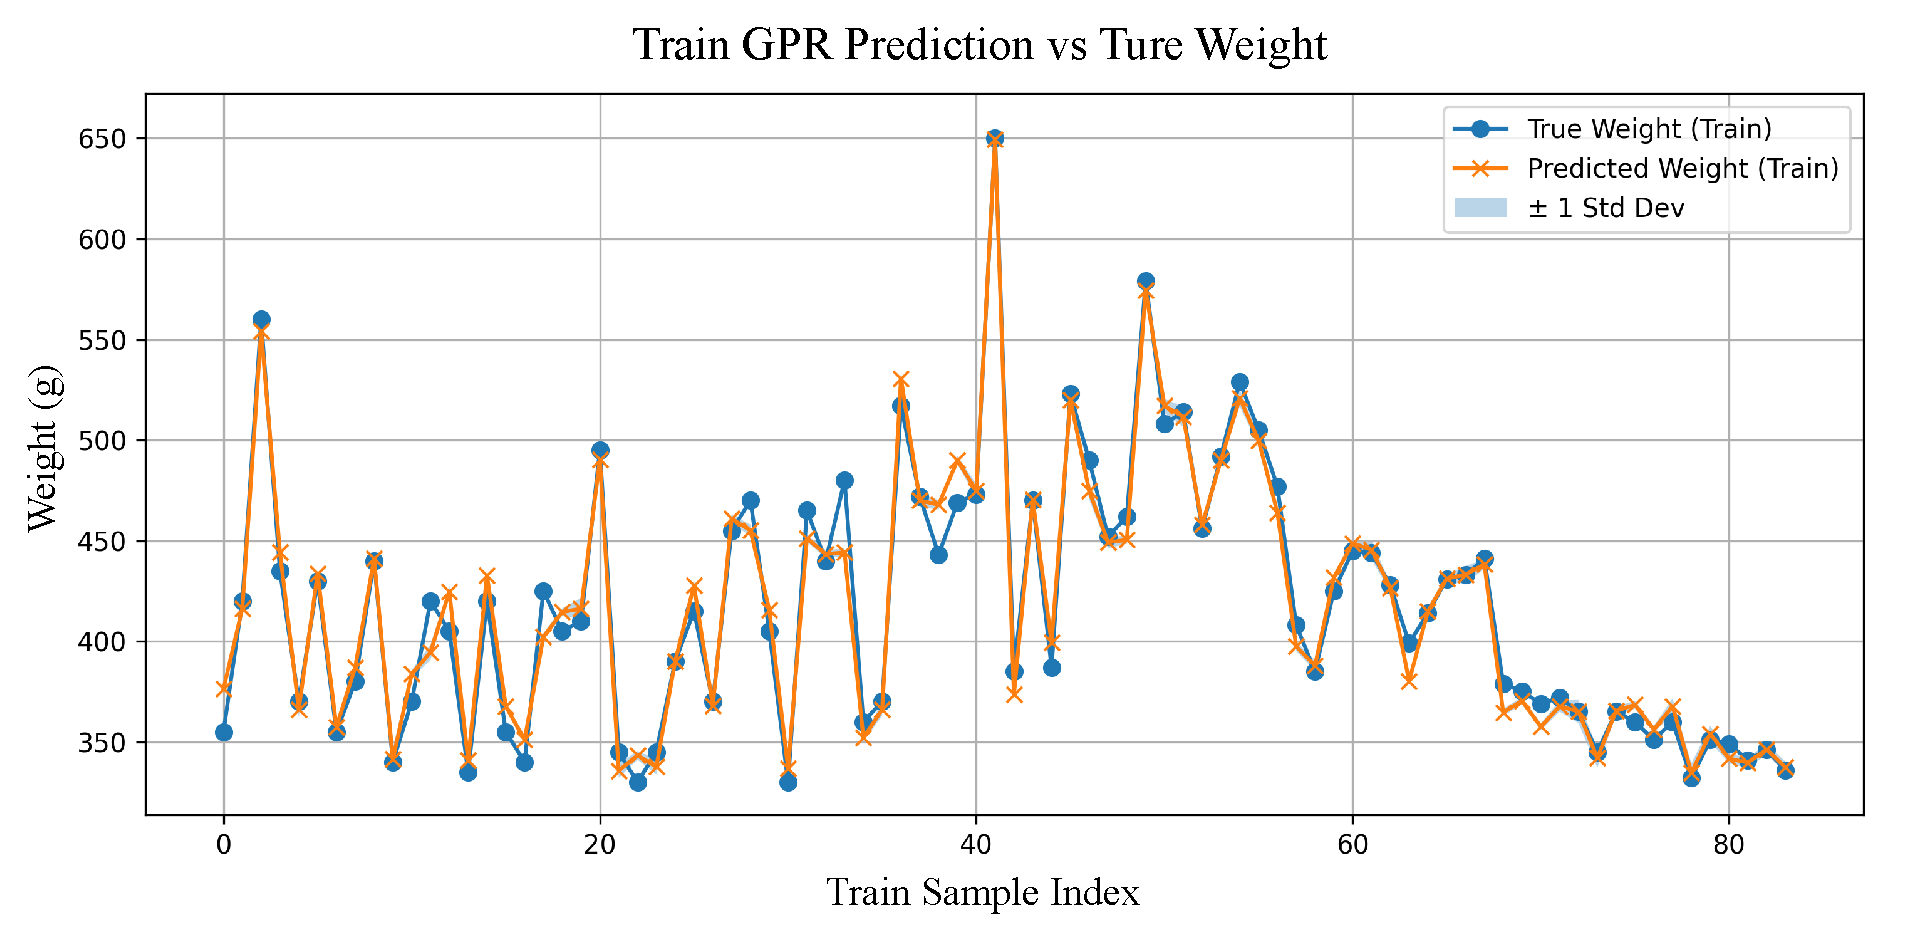
Figure 12.
Test results of mango weight prediction using GPR with depth estimated from LR and LR+Co-Kriging on unseen test datasets.
Figure 12.
Test results of mango weight prediction using GPR with depth estimated from LR and LR+Co-Kriging on unseen test datasets.
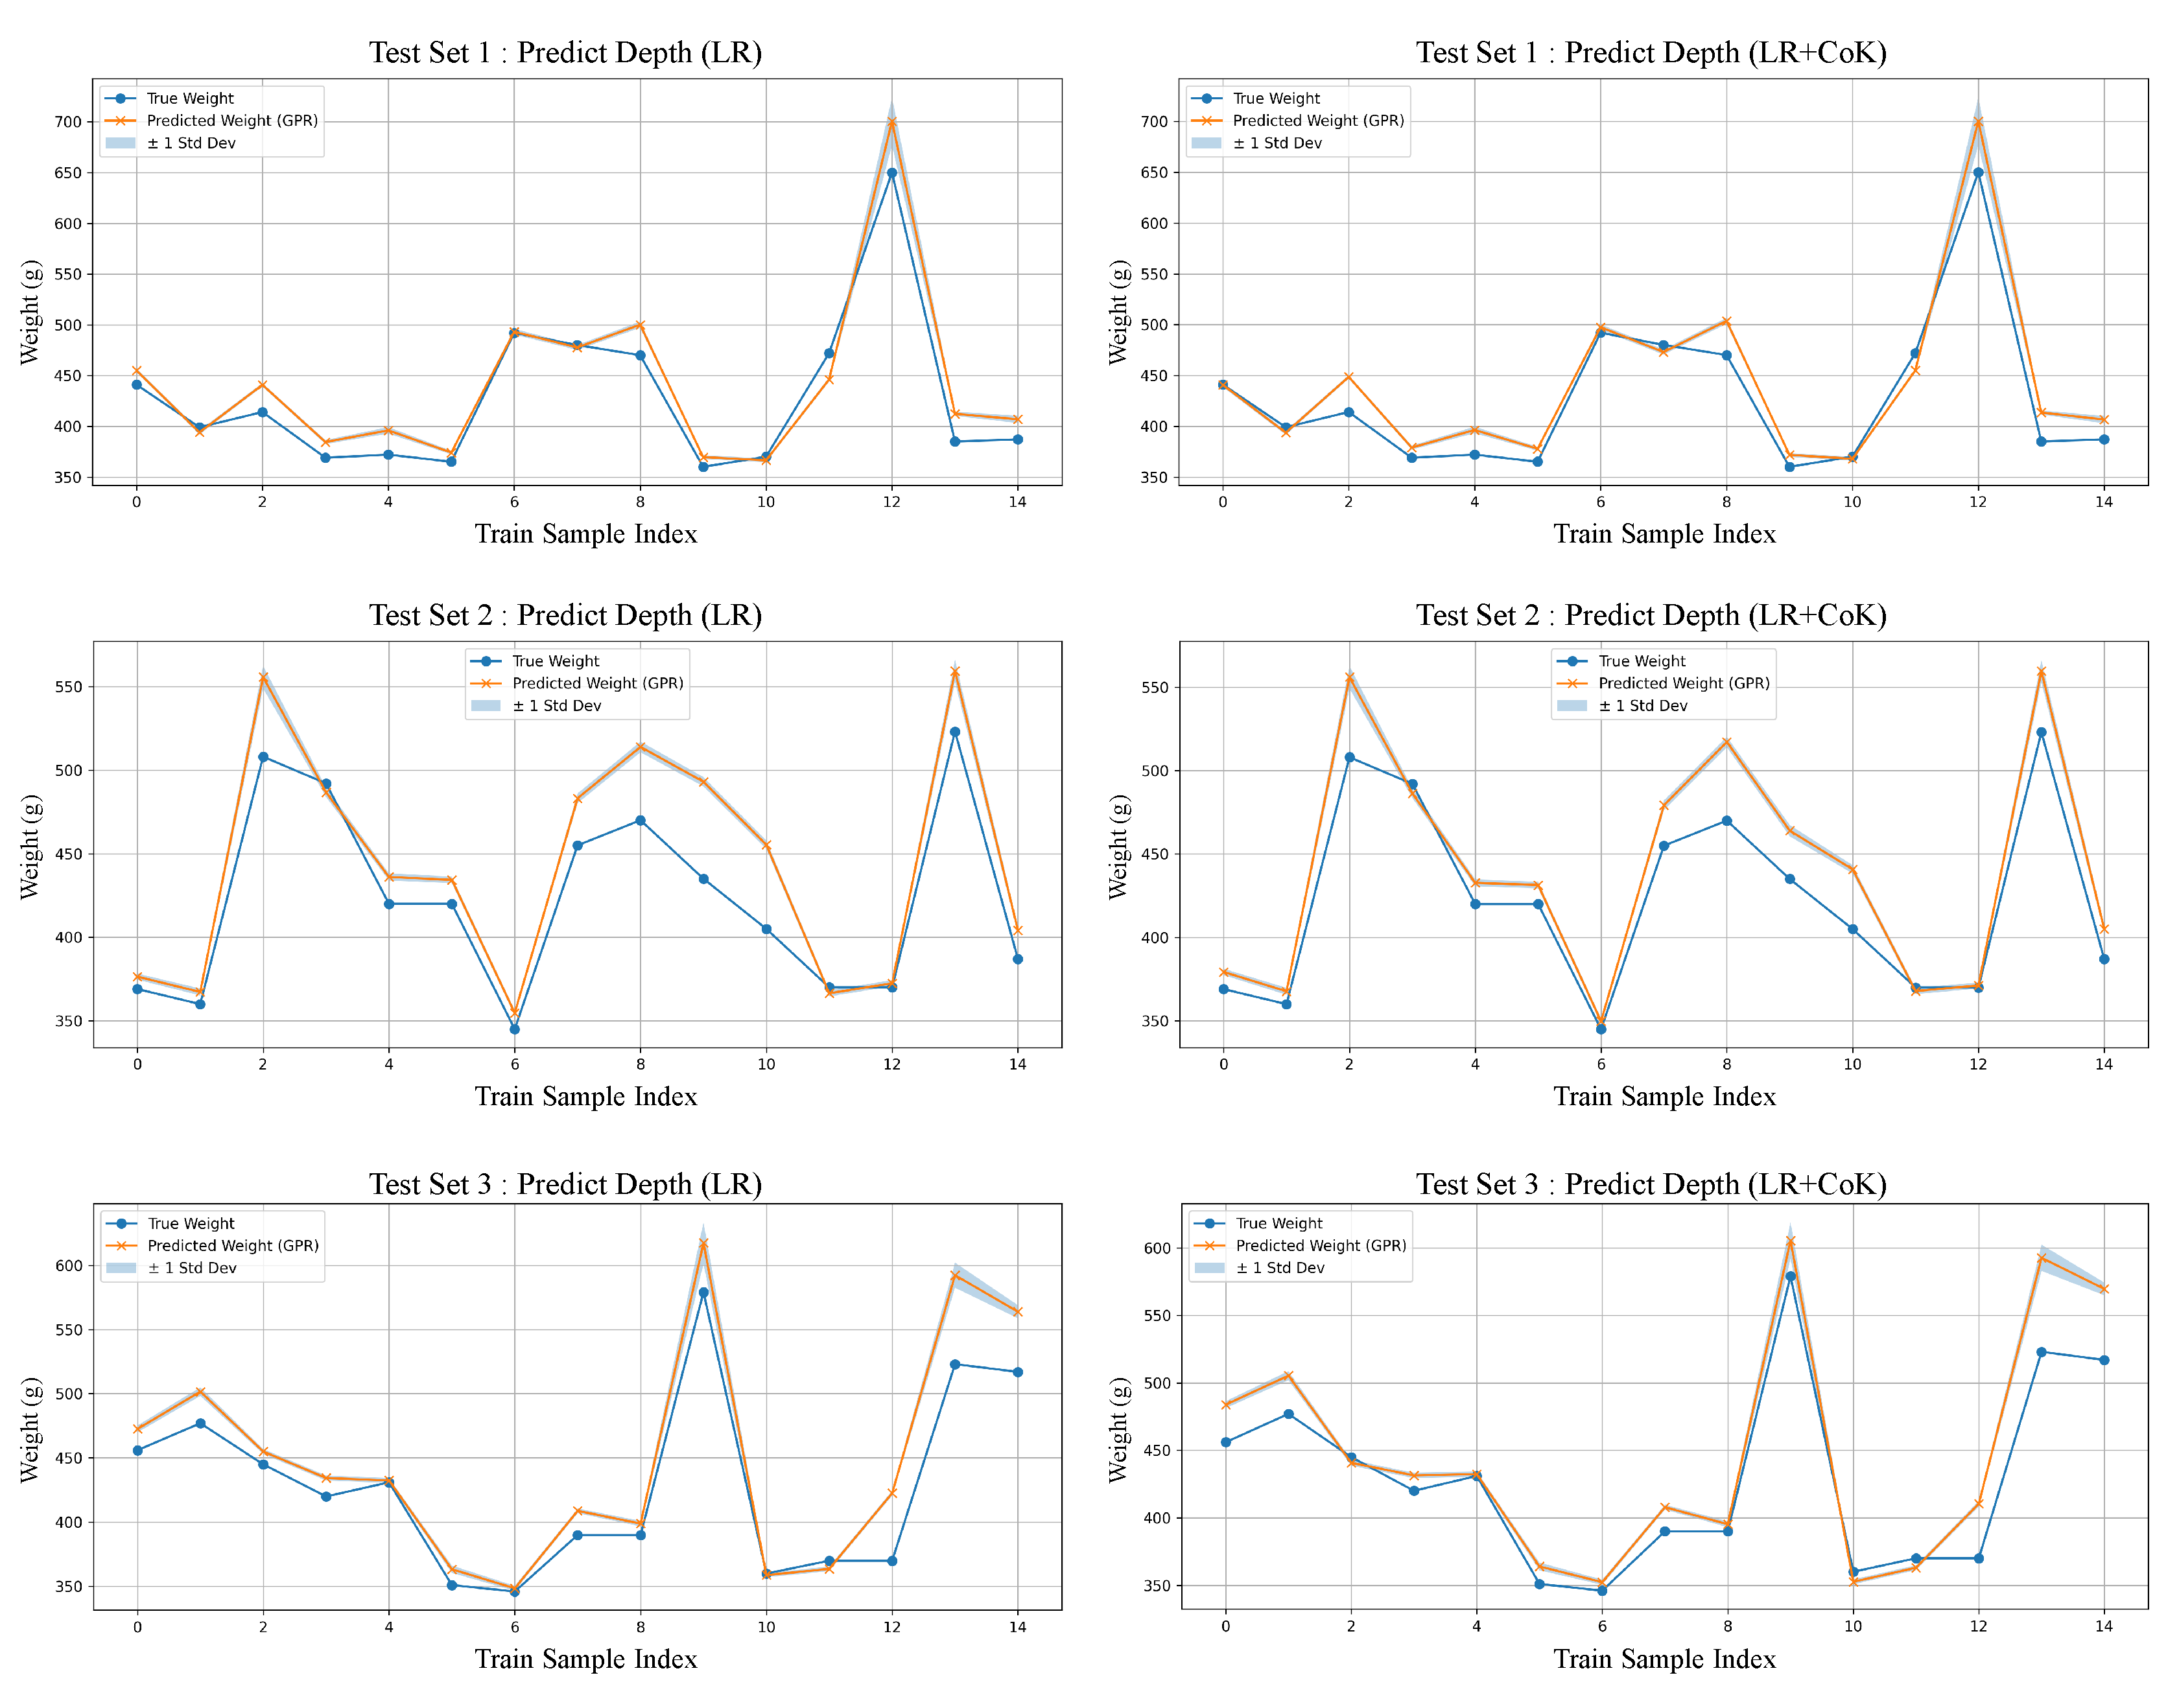

Table 1.
Size grading of mangoes by fruit weight (ACFS standard).
| Size of Mango | Weight (g) |
|---|---|
| 2S | 225-249 |
| S | 250-279 |
| M | 280-329 |
| L | 330-379 |
| 2L | 380-449 |
| 3L | More than 450 |
Table 2.
Number of fruits and dimensional ranges of 84 Nam Dok Mai Si Thong mangoes by size category.
Table 2.
Number of fruits and dimensional ranges of 84 Nam Dok Mai Si Thong mangoes by size category.
| Size | Number of mango fruits |
Range (Min-Max) | |||
|---|---|---|---|---|---|
| Width (cm) | Height (cm) | Depth (cm) | Weight (g) | ||
| 1L | 31 | 7.08-7.90 | 13.50-15.63 | 6.15-7.06 | 330-379 |
| 2L | 29 | 7.39-8.45 | 14.64-17.20 | 6.30-7.26 | 380-445 |
| 3L | 24 | 7.87-9.34 | 15.26-17.90 | 6.85-8.34 | 452-650 |
Table 3.
Results of mango width and height measurement using computer vision.
| Evaluation Metrics |
Width (cm) | Height (cm) | ||||||
|---|---|---|---|---|---|---|---|---|
| ]2*Train | Test | ]2*Train | Test | |||||
| Set 1 | Set 2 | Set 3 | Set 1 | Set 2 | Set 3 | |||
| MAPE (%) | 2.622 | 2.328 | 2.439 | 2.543 | 1.797 | 2.058 | 1.271 | 1.604 |
| RSME (cm) | 0.247 | 0.234 | 0.234 | 0.266 | 0.367 | 0.371 | 0.324 | 0.427 |
| MAE (cm) | 0.206 | 0.186 | 0.193 | 0.198 | 0.280 | 0.319 | 0.205 | 0.255 |
Table 4.
Evaluation results of mango depth estimation using LR and LR+CoK.
| Evaluation Metrics |
Test | Test | ||||
|---|---|---|---|---|---|---|
| Set 1 | Set 2 | Set 3 | Set 1 | Set 2 | Set 3 | |
| MAPE (%) | 2.384 | 3.552 | 1.528 | 2.530 | 2.850 | 4.760 |
| RSME (cm) | 0.206 | 0.289 | 0.132 | 0.223 | 0.226 | 0.385 |
| MAE (cm) | 0.163 | 0.241 | 0.106 | 0.173 | 0.194 | 0.329 |
Table 5.
Evaluation results of mango size (Weight) classification using GPR with depth estimated from LR and LR+CoK.
Table 5.
Evaluation results of mango size (Weight) classification using GPR with depth estimated from LR and LR+CoK.
| Evaluation Metrics |
Train | Test () | Test () | ||||
|---|---|---|---|---|---|---|---|
| Set 1 | Set 2 | Set 3 | Set 1 | Set 2 | Set 3 | ||
| MAPE (%) | 1.864 | 4.010 | 5.250 | 4.750 | 3.990 | 4.400 | 4.690 |
| RSME (g) | 7.671 | 21.914 | 29.662 | 29.484 | 22.252 | 25.055 | 28.680 |
| MAE (g) | 10.350 | 17.624 | 23.160 | 21.599 | 17.488 | 19.643 | 21.270 |
Table 6.
Model performance comparison in terms of accuracy for mango size classification across different depth estimation methods
Table 6.
Model performance comparison in terms of accuracy for mango size classification across different depth estimation methods
| Test | ANN | ANN+Optuna | GPR | |||
|---|---|---|---|---|---|---|
| Set 1 | 86.67 | 93.33 | 80.00 | 80.00 | 73.00 | 93.33 |
| Set 2 | 80.00 | 86.67 | 86.67 | 80.00 | 86.67 | 93.33 |
| Set 3 | 86.67 | 93.33 | 86.67 | 93.33 | 86.67 | 93.33 |
Disclaimer/Publisher’s Note: The statements, opinions and data contained in all publications are solely those of the individual author(s) and contributor(s) and not of MDPI and/or the editor(s). MDPI and/or the editor(s) disclaim responsibility for any injury to people or property resulting from any ideas, methods, instructions or products referred to in the content. |
© 2025 by the authors. Licensee MDPI, Basel, Switzerland. This article is an open access article distributed under the terms and conditions of the Creative Commons Attribution (CC BY) license (http://creativecommons.org/licenses/by/4.0/).
Copyright: This open access article is published under a Creative Commons CC BY 4.0 license, which permit the free download, distribution, and reuse, provided that the author and preprint are cited in any reuse.


