
Submitted:
18 September 2025
Posted:
19 September 2025
You are already at the latest version
Abstract
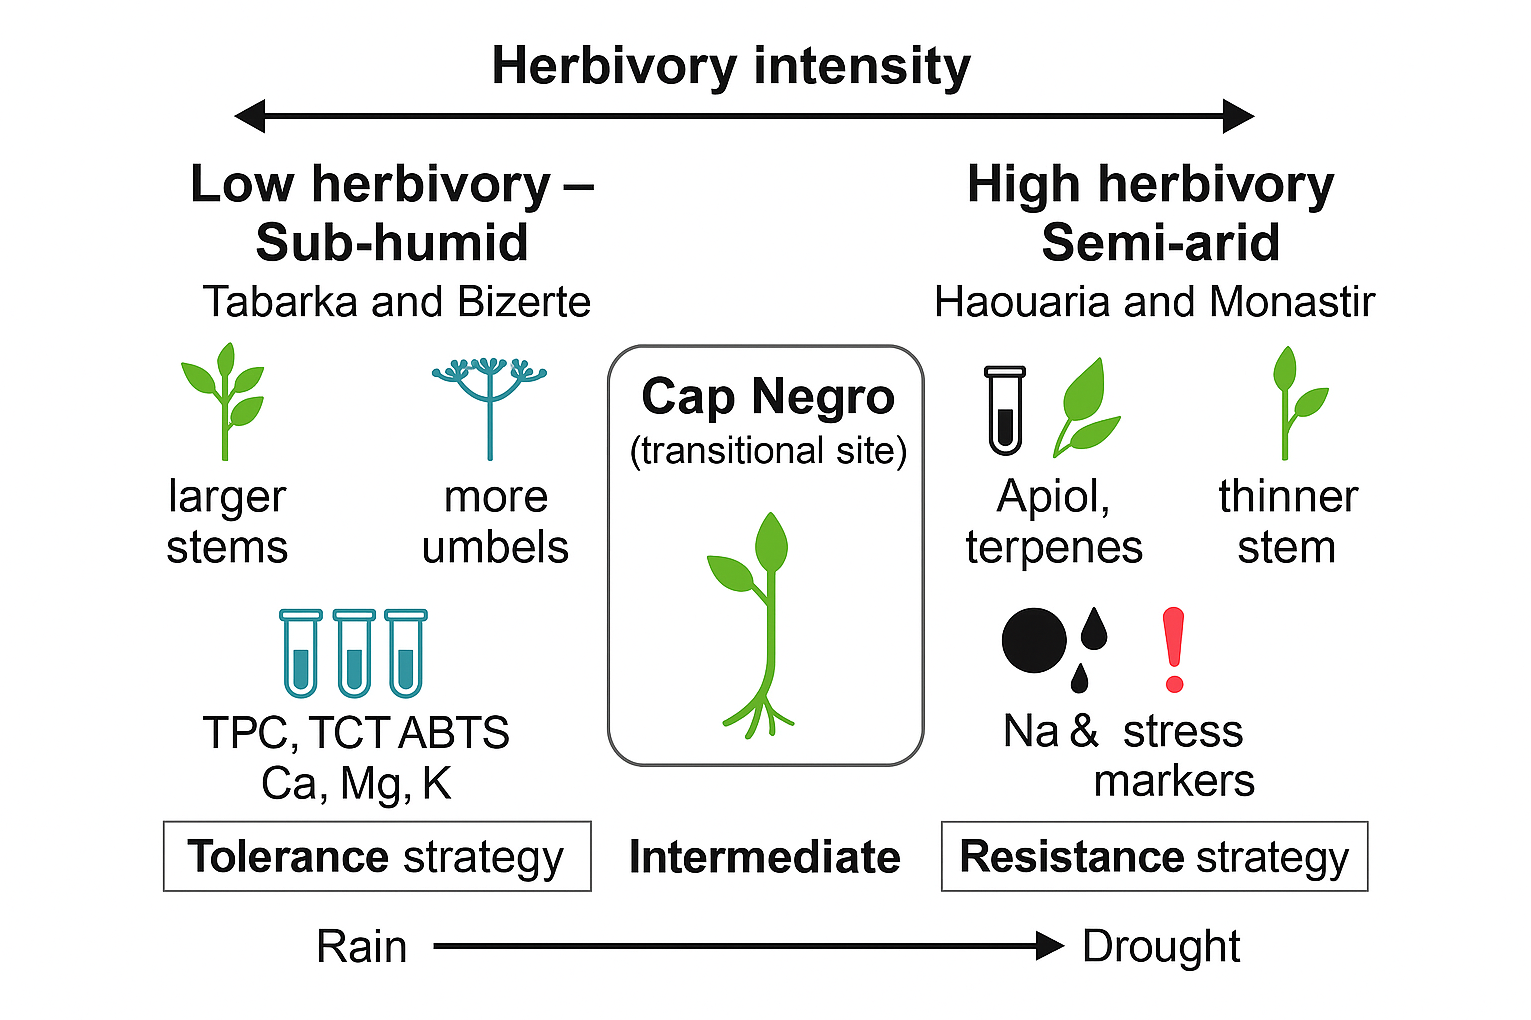
Insect herbivory exerts strong selective pressure on plants, yet no study has documented its effects on the halophytic Apiaceae Crithmum maritimum L. (sea fennel). Here, we present the first evidence of natural insect attack on this species, based on five Tunisian coastal populations distributed along a transparent bioclimatic gradient—from sub-humid to semi-arid—and exposed to different levels of herbivory. Using an integrative, multi-trait approach—combining morphological, biochemical, mineral, and lipophilic traits with multivariate analyses (ANOVA with Tukey HSD, PCA, PLS-DA with VIP scores, correlation matrices, HCA and heatmaps, variance partitioning, and dbRDA)—we identified two distinct defense syndromes. Populations from low-herbivory, sub-humid sites (Tabarka, Bizerte) showed higher levels of phenolics, tannins, antioxidants, sterols, PUFA, and structural robustness, indicating a tolerance strategy. Conversely, high-herbivory, semi-arid sites (Haouaria, Monastir) were marked by elevated apiol and terpene levels, sodium and phosphorus accumulation, and reproductive adjustments, reflecting a resistance strategy. The transitional site (Cap Negro) displayed an intermediate profile, demonstrating adaptive flexibility. These findings show that herbivory intensity and bioclimatic conditions jointly influence the defense syndromes of C. maritimum, emphasizing its remarkable phenotypic plasticity and providing the first ecological evidence of insect herbivory in sea fennel.
Keywords:
Crithmum maritimum L.
; insect herbivory
; phenotypic plasticity
; resistance–tolerance trade-off
; biochemical defense
; reproductive allocation
1. Introduction
Insect herbivory is one of the most pervasive biotic stresses affecting plants, with consequences that extend well beyond the direct removal of tissues. Feeding by insects can significantly alter plant growth, reproduction, and survival, shaping ecological interactions and agricultural productivity [1]. A large body of research demonstrates that herbivory induces measurable changes in biochemical and morphological traits, reflecting strategies by which plants mitigate damage and maintain fitness [2].
From a biochemical perspective, insect feeding often triggers the buildup of phenolic compounds, tannins, and other antioxidants. These serve as chemical defenses that reduce how tasty the plant is, hinder insect development, or discourage feeding [3,4]. These compounds are key components of the plant's defense system and can be quickly mobilized after herbivore attack. Antioxidant tests like 2,2-diphenyl-1-picrylhydrazyl (DPPH) and 2,2′-azino-bis (3-ethylbenzothiazoline-6-sulfonic acid) (ABTS) are commonly used to measure these responses, as they provide overall estimates of radical-scavenging activity and reflect the plant tissues' ability to fight oxidative stress [5]. For example, a study on the physiological response of wild carrot (Daucus carota L.) to the jumping plant louse (Bactericera trigonica Ho) showed that DPPH scavenging activity was significantly lower in infested plants and was inversely related to antioxidant enzyme activities [6]. Similarly, research on Populus tremula indicated that herbivore damage leads to notable changes in phenolic compounds and antioxidant levels, highlighting the importance of these markers in plant–insect interactions [7].
Tannins are another key group of metabolites that often increase under insect pressure, acting as feeding deterrents or reducing digestibility [8]. The role of these compounds has been well documented in several taxa, including legumes and Fabaceae species, where herbivory induces higher tannin levels and correlates with elevated antioxidant activity [9]. These findings demonstrate that herbivory-driven phenolics, tannins, and antioxidant capacity shifts represent a common defensive strategy across diverse plant lineages.
In addition to biochemical adjustments, insect feeding can also drive morphological changes. These include reductions in stem thickness, fruit or seed size alterations, and decreases in reproductive output that collectively compromise plant fitness [10]. For example, in Helianthus annuus, seed-feeding insects have been shown to reduce seed weight and germination capacity significantly [11]. Similarly, damage to developing fruits in Brassica species leads to altered pod morphology and lower seed viability, demonstrating that insect attack can directly impair reproductive success [12]. Structural modifications at the organ level, such as thicker epidermis, changes in leaf area, or altered trichome density, have also been reported as physical defenses against herbivores [13]. These findings highlight the necessity of evaluating both morphological and biochemical responses together, since plants often deploy coordinated strategies that integrate structural and chemical defense mechanisms [14].
Within this framework, halophytes have recently gained attention due to their resilience in extreme environments and rich reservoir of bioactive compounds [15]. Among them, sea fennel (C.maritimum), a perennial aromatic species of the Apiaceae family, has emerged as a promising candidate for sustainable agriculture and functional food development. Traditionally consumed in Mediterranean regions, it has been recognized for its high content of phenolics, tannins, and essential oils and its potent antioxidant properties [16,17,18]. Recent studies have reported significant antioxidant activity in sea fennel extracts using DPPH and ABTS assays, confirming its potential as a source of natural antioxidants [19]. Furthermore, intraspecific variation in volatile organic compounds and phytochemical composition across Mediterranean populations suggests that C.maritimum can adjust its chemical profile to environmental conditions [20].
Despite this growing body of literature on its phytochemistry and nutritional value, one crucial dimension has remained unexplored: the role of biotic stress. To date, no study—or any peer-reviewed work—has reported natural insect herbivory on C. maritimum, let alone investigated its effects on morphology and antioxidant markers. Existing studies have focused primarily on abiotic stresses such as salinity, drought, or temperature, but insect–plant interactions in this species remain undocumented [21,22]. The only mention of insect interactions comes from ecological notes reporting seed predation by specialist caterpillars (Aethes spp.) in Spain [23]. Still, these observations did not quantify herbivory's biochemical or morphological consequences.
This gap is significant for two reasons. First, the impact of insect herbivory on bioactive compounds is well established in other species, yet has never been demonstrated in C. maritimum. Second, given the economic and ecological importance of sea fennel as an emerging halophyte crop, understanding how it responds to insect attacks is essential for its conservation and domestication.
The present study is therefore the first to report insect herbivory on C. maritimum. We investigated five Tunisian coastal populations distributed along a bioclimatic gradient (from sub-humid to semi-arid), assessing whether insect attack was associated with changes in (i) morphological traits, (ii) biochemical markers including total phenolics, tannins, and antioxidant capacity (DPPH, ABTS), (iii) mineral composition, and (iv) lipophilic fraction. We further tested whether herbivory effects interacted with climatic context using integrative statistical approaches to determine whether C. maritimum deploys tolerance or resistance defense syndromes.
2. Materials and Methods
2.1. Study Area and Plant Material Sampling
The study was carried out along the Tunisian coast (Figure 1). An initial survey was conducted to identify suitable populations of C. maritimum. Five different sites (Table 1) were chosen for sampling based on two main criteria: first, a large enough plant population to allow sampling without causing ecological harm, and second, proximity to the laboratory to ensure quick transport and high quality of the plant material.
Twenty individuals of C. maritimum were randomly selected from each of the five sites. Before collection, measurements of the entire plant were recorded in the field. The plants were then carefully uprooted and transported to the laboratory for detailed analysis.
2.2. Morphological Trait Measurements
Morphometric analysis was conducted on each 100 individuals (20 per site) to assess phenotypic variation. All linear measurements (Table 2) were recorded in millimeters (mm), and surface areas in square millimeters (mm²). For traits measured on leaves, umbels, and umbellets, five replicates per individual were analyzed for statistical robustness, while 20 seeds per individual were measured. The average value of these replicates was used for each individual in subsequent analyses.
This method follows established standards for plant morphometrics, where leaf area is calculated from measurable traits like length and width and expressed in mm² [25]. Leaf size definitions in functional trait databases also depend on projected leaf surface area (mm²) as the primary descriptor for comparative analysis [26]. Additionally, using standardized descriptors for lengths, diameters, and surface traits aligns with modern frameworks of quantitative plant morphology that integrate geometry and topology to capture trait variation [27]
2.3. Insect Attack Assessment
In addition to plant sampling, herbivory pressure was visually assessed at all sites. The insect attack (Based on morphological traits, the insect was identified at the family level Pyralidae) rate was calculated as the percentage of plants showing clear damage signs (chewed tissues or boring holes) relative to the plants examined [28]. Rapid assessment techniques are commonly used in ecological research to measure the intensity and frequency of herbivory at the population level [29].
Sampling for morphological, biochemical, and ionomic analyses was conducted at the second observation time point, corresponding to the period of higher herbivory pressure (see Supplementary Figure S1)
Alongside, B.H. is now performing supplementary molecular analyses (DNA barcoding) on insect specimens collected from damaged organs to confirm the herbivore's taxonomic identity and better understand its life cycle. This method provides a more dependable insect identification framework than morphology-based assessments [30].
2.4. Sample Preparation for Biochemical and Mineral Analysis
After morphological measurements, plants were dried in a food dehydrator at 45 °C until their weight remained constant. Drying below 50 °C is generally considered optimal for preserving bioactive compounds and volatile oils, as higher temperatures accelerate the thermal degradation of phenolics, flavonoids, and essential oils [31]. Furthermore, our previous work demonstrated that 45 °C is the most suitable temperature for C.maritimum, essential oil yield, and preserving its phytochemical composition[32]. The dried samples were then separated into stems, umbels, flowers- used only for biochemical analysis-, and seeds, and ground into fine powders. For each site, 20 individual samples were pooled by organ. This pooling method is standard in phytochemistry and mineral nutrition research, as it minimizes intra-population variability while offering a representative profile at the site level [33].
2.5. Determination of Phenolic Content and In Vitro Antioxidant Activities
2.5.1. Total Polyphenol Content (TPC) and Total Condensed Tannins (TCT)
TPC was measured using the method according to Flores-Castañón et al. (2025) [34]. Gallic acid (GA) calibrated the standard (concentrations, R²=). d; The absorbance of reduced phosphomolybdate/ tungstate complex, by total phenolics, was monitored at 725 nm (FlexA-200 microplate reader, ALLSHENG Instrument Co., Ltd., Hangzhou, China).
Results were expressed as mg of GA equivalents per g of dry weight (mg GAE/g DW). TCT was measured using the vanillin–HCl method [35]. (±)-Catechin (DE) served as the standard (concentrations, R²=). Results were expressed as mg CE/g DW.
2.5.2. DPPH and ABTS Radical Scavenging Activities
DPPH• free radical scavenging activity was determined according to the protocol used by Fuentes et al. (2023) [36] with some modifications. Briefly, a 20 µL aliquot of plant extract was combined with 200 µL of DPPH ethanolic solution (0.1 mM). After a 30-minute incubation period, the absorbance of the mixture was measured at 515 nm.
The ABTS•+ free radical assay followed Thaipong et al. (2006) [37] with some modifications to adapt the method for 96-well microplates. ABTS•+ radical cations were produced by mixing 7 mM ABTS with 2.45 mM potassium persulfate and incubating the mixture in the dark for 16 hours. Before use, the solution was diluted with deionized water to an absorbance of 0.7 at 734 nm. Plant extract solution (20 µL) was combined with 200 µL of the ABTS•+ solution, and the absorbance was measured at 734 nm after 6 minutes. Results were expressed as Trolox equivalents (mg TE/g DW).
2.6. Mineral Composition
After acid digestion, macro- and microelement contents (Na, K, Ca, Mg, P, and selected trace elements) were analyzed. Analyses were conducted using ICP–AES (Horiba Scientific Activa, Japan) according to the manufacturer’s guidelines [38], and ICP–MS (Analytik Jena, Germany) for trace element quantification, using validated protocols [39].
2.7. Lipophilic Fraction Extraction and GC–MS Analysis
The lipophilic fraction was extracted from dried seeds and umbels of C. maritimum using n-hexane in a Soxhlet apparatus following classical total lipids determination protocols [40,41].
Extracts were concentrated at 40°C under reduced pressure and stored at −20 °C until analysis. Fatty acids were converted to methyl esters (FAMEs) using 3% sodium methoxide (NaOCH3) and sulphuric acid [42]. GC–MS analysis was performed on a capillary HP-88 column (60 m × 0.25 mm × 0.20 µm) with helium as carrier gas.
Oven program: 120 °C (1 min), 10 °C min⁻¹ to 175 °C, then 3 °C min⁻¹ to 220 °C (10 min hold). Injector and detector temperatures: 250 °C. The MS was operated in EI mode (70 eV), scanning m/z 50–550. Compounds were identified by comparison with NIST library spectra and retention indices calculated with a homologous n-alkane series [43,44,45]. Fatty acid composition was expressed as a percentage of total FAMEs (area normalization).
2.8. Statistical Analysis
All statistical analyses were conducted in Python v3.11.9 (Python Software Foundation, Wilmington, DE, USA). Herbivory rates among populations were compared using one-way ANOVA, followed by Tukey’s HSD post-hoc test to define homogeneous groups. Based on these results, populations were classified into Low- (Tabarka, Bizerte) and High-Herbivory groups (Cap Negro, Haouaria, Monastir).
Univariate ANOVA was used to analyze morphological, biochemical, mineral, and lipophilic traits to assess variation, with results reported as mean ± SD and significance set at p < 0.05. Principal Component Analysis (PCA) provided an exploratory view of multivariate patterns, while Partial Least Squares Discriminant Analysis (PLS-DA) identified discriminant traits, with Variable Importance in Projection (VIP > 1) scores confirming their importance.
Complementary analyses included hierarchical clustering (Ward’s method, Euclidean distance) and clustered heatmaps to assess trait grouping, as well as Spearman’s correlations (ρ ≥ 0.6, p < 0.01) to evaluate inter-trait relationships. Finally, an integrated distance-based redundancy analysis (dbRDA) combined morphological, biochemical, mineral, and lipophilic traits with climatic parameters (precipitation, bioclimatic tier) to partition variance explained by herbivory, climate, and their interaction.
All quantitative variables were centered and standardized before PCA, PLS-DA, clustering, and dbRDA. Setting random_state to 42 maintained model robustness and reproducibility.
3. Results
3.1. Herbivory Pressure Varies Significantly Across Sites
The intensity of insect herbivory varied substantially among the five sampled populations, ranging from 51.08% in Tabarka to 73.23% in Cap Negro. One-way ANOVA revealed highly significant differences in herbivory rates among sites (F4,95 = 13.4; p < 0.001). Tukey’s HSD post-hoc test indicated that Tabarka and Bizerte formed a homogeneous subset (p > 0.05), clearly distinct from the other three populations (Haouaria, Monastir, and Cap Negro; all p < 0.05). Accordingly, sites were grouped into Low-Herbivory (Tabarka, Bizerte) and High-Herbivory (Haouaria, Monastir, Cap Negro) categories (Figure 2, Table 3).
Given this clear separation into Low- and High-Herbivory groups, we hypothesized that C. maritimum may adopt distinct adaptive strategies in response to contrasting levels of insect pressure. To test this hypothesis, integrative multivariate analyses were performed to identify the traits most strongly associated with herbivory attack.
3.2. Effect of Herbivory on Morphological Traits
Using the individual-level data, we assessed the association between herbivory intensity—expressed as the number of attacked fruits per plant—and each morphological trait with Spearman’s rank correlations. Analyses were performed separately for low-herbivory sites (Tabarka, Bizerte; n = 40) and high-herbivory sites (Cap Negro, Haouaria, Monastir; n = 60) (Figure 3).
In low-herbivory sites, no correlation reached significance; the most significant effects were minor, with weak positive tendencies for umbel bract length (UBL; ρ = 0.229, p = 0.156) and peduncle diameter (UPD; ρ = 0.201, p = 0.213), and weak negative tendencies for leaf area (LA; ρ = −0.183, p = 0.259) and seed width (SW; ρ ≈ −0.163, p > 0.30). In high-herbivory sites, several traits correlated significantly with herbivory. The number of attacked fruits increased with leaf size and more robust inflorescence structures, including LA (ρ = 0.467, p = 1.7 × 10⁻⁴***), UPD (ρ = 0.465, p = 1.8 × 10⁻⁴***), leaf length LL (ρ = 0.462, p = 2.0 × 10⁻⁴***), the number of umbel bracts UBN (ρ = 0.434, p = 5.3 × 10⁻⁴***), as well as UBL (ρ = 0.399, p = 0.0016), ray length URL (ρ = 0.381, p = 0.0027), main stem diameter MSD (ρ = 0.381, p = 0.0027), plant height PH (ρ = 0.347, p = 0.0066), leaf width LW (ρ = 0.339, p = 0.0081) and the number of umbellet bracteoles UNBR (ρ = 0.333, p = 0.0093). In this context, two traits were negatively associated with herbivory: 100-seed weight SM100 (ρ = −0.368, p = 0.0039) and the number of leaf lobes NLOB (ρ = −0.339, p = 0.0081). Overall, the absence of detectable associations under low herbivory and the emergence of multiple moderate correlations under high herbivory indicate a context-dependent coupling between plant architecture and herbivore damage.
3.3. Effect of Herbivory on Biochemical Traits
Biochemical traits were quantified in four organs (Leaf, Flower, Stem, Umbell) across Low (Tabarka, Bizerte) and High herbivory sites (Cap Negro, Haouaria, Monastir). Values are expressed as mean ± SD (n = 4) and are summarized in Table 4a and 4b.
In the Low herbivory group, leaves exhibited TPC values ranging from 14.08 ± 2.72 to 19.92 ± 2.00 mg GAE/g DW, while ABTS activities varied between 23.99 ± 3.00 and 39.72 ± 2.10 µmol TE/g DW. Flowers displayed higher TPC, reaching 44.67 ± 0.77 mg GAE/g DW in Bizerte, while umbels showed moderate levels, ranging from 14.92 ± 1.80 to 25.25 ± 2.10 mg GAE/g DW. Stems had the lowest values overall, with TPC between 1.25 ± 0.52 and 5.75 ± 0.83 mg GAE/g DW.
In the High herbivory group, leaves had lower phenolic contents, ranging from 9.17 ± 2.27 to 13.50 ± 1.21 mg GAE/g DW, with ABTS values between 11.49 ± 1.90 and 28.66 ± 2.30 µmol TE/g DW. Flowers were highly variable, from 12.00 ± 0.17 mg GAE/g DW in Monastir to 40.50 ± 1.53 mg GAE/g DW in Haouaria. Umbels showed the broadest range of values, from 8.42 ± 1.54 mg GAE/g DW in Haouaria to 36.25 ± 3.73 mg GAE/g DW in Monastir. Stem extracts consistently displayed the lowest activities, with TPC < 4.0 mg GAE/g DW and antioxidant capacities (DPPH, ABTS) < 16 µmol TE/g DW.
Figure 4 shows a global comparison of biochemical profiles across organs and sites, with Low sites (Tabarka, Bizerte) contrasted with High sites (Cap Negro, Haouaria, Monastir).
The heatmap shows distinct differences in biochemical profiles between Low and High herbivory sites. In the Low group (Tabarka, Bizerte), flowers and umbels generally had higher phenolic and antioxidant levels than stems, which consistently recorded the lowest values across all traits.
In the High herbivory group (Cap Negro, Haouaria, Monastir), significant site-dependent differences were observed. Haouaria flowers showed the highest TPC values, while Monastir umbels recorded the highest phenolic contents and antioxidant activities (TPC, ABTS). Conversely, Haouaria umbels displayed the lowest phenolic and antioxidant levels among the High sites. Stems remained the least active organs across all sites.
The heatmap highlights that reproductive organs (flowers and umbels) are the most variable across sites, while stems consistently show low biochemical values regardless of herbivory levels.
Building on these biochemical patterns, we next examined the mineral composition of C. maritimum organs across the five sites to determine whether macro- and micro-element profiles also differed between populations exposed to low versus high herbivory pressure.

Table 4a.
Biochemical traits (mean ± SD, n = 4) for four organs (Leaf, Flower, Stem, Umbell) in Low herbivory sites (Tabarka, Bizerte).
Table 4a.
Biochemical traits (mean ± SD, n = 4) for four organs (Leaf, Flower, Stem, Umbell) in Low herbivory sites (Tabarka, Bizerte).
| Organ | Trait | Tabarka | Bizerte |
|---|---|---|---|
| Leaf | TPC | 16.85 ± 2.04 | 16.48 ± 2.34 |
| TCT | 2.57 ± 0.31 | 1.76 ± 0.38 | |
| DPPH | 29.37 ± 2.51 | 14.59 ± 0.22 | |
| ABTS | 31.01 ± 6.64 | 30.82 ± 4.74 | |
| Flower | TPC | 14.92 ± 2.39 | 41.23 ± 3.72 |
| TCT | 2.01 ± 0.53 | 0.90 ± 0.14 | |
| DPPH | 39.53 ± 3.05 | 37.56 ± 1.32 | |
| ABTS | 40.23 ± 0.87 | 52.77 ± 1.76 | |
| Stem | TPC | 2.04 ± 1.21 | 4.79 ± 0.65 |
| TCT | 0.77 ± 0.24 | 0.69 ± 0.28 | |
| DPPH | 8.83 ± 0.42 | 7.26 ± 1.69 | |
| ABTS | 15.56 ± 0.71 | 10.53 ± 2.27 | |
| Umbell | TPC | 18.00 ± 2.47 | 22.83 ± 1.65 |
| TCT | 1.48 ± 0.34 | 1.75 ± 0.46 | |
| DPPH | 11.86 ± 0.38 | 32.44 ± 2.56 | |
| ABTS | 36.77 ± 3.95 | 31.18 ± 4.29 |
Table 4b.
Biochemical traits (mean ± SD, n = 4) for four organs (Leaf, Flower, Stem, Umbell) in High herbivory sites (Cap Negro, Haouaria, Monastir).
Table 4b.
Biochemical traits (mean ± SD, n = 4) for four organs (Leaf, Flower, Stem, Umbell) in High herbivory sites (Cap Negro, Haouaria, Monastir).
| Organ | Trait | Cap Negro | Haouaria | Monastir |
|---|---|---|---|---|
| Leaf | TPC | 11.62 ± 1.88 | 11.38 ± 1.28 | 10.71 ± 1.18 |
| TCT | 1.49 ± 0.34 | 2.28 ± 0.32 | 2.14 ± 0.19 | |
| DPPH | 15.20 ± 0.86 | 13.28 ± 0.86 | 12.83 ± 0.72 | |
| ABTS | 26.44 ± 1.56 | 13.34 ± 1.75 | 21.62 ± 2.90 | |
| Flower | TPC | 24.73 ± 4.04 | 30.71 ± 6.55 | 12.10 ± 0.12 |
| TCT | 0.68 ± 0.48 | 1.53 ± 0.60 | 0.94 ± 1.30 | |
| DPPH | 11.75 ± 0.99 | 28.03 ± 0.32 | 14.10 ± 0.75 | |
| ABTS | 17.50 ± 17.74 | 19.43 ± 2.77 | 18.98 ± 0.80 | |
| Stem | TPC | 2.67 ± 1.22 | 1.90 ± 0.49 | 0.83 ± 0.62 |
| TCT | 0.47 ± 0.16 | 1.00 ± 0.28 | 0.95 ± 0.10 | |
| DPPH | 8.41 ± 0.62 | 9.21 ± 0.65 | 7.46 ± 2.44 | |
| ABTS | 6.13 ± 0.61 | 11.92 ± 0.75 | 7.20 ± 0.85 | |
| Umbell | TPC | 21.81 ± 7.72 | 9.67 ± 1.22 | 28.35 ± 6.33 |
| TCT | 2.24 ± 1.68 | 1.41 ± 0.40 | 2.42 ± 1.06 | |
| DPPH | 15.90 ± 0.15 | 15.77 ± 0.62 | 21.73 ± 1.81 | |
| ABTS | 42.90 ± 10.46 | 17.29 ± 2.72 | 22.97 ± 1.11 |
3.4. Effect of Herbivory on Mineral Composition:
The mineral composition analysis revealed apparent differences among C. maritimum organs and between populations subjected to low versus high herbivory pressure (Table 5a and 5b). Potassium was the most abundant element in low-herbivory sites (Tabarka, Bizerte), reaching 890.6 mg·g⁻¹ DW in umbels from Tabarka. Calcium and magnesium were also consistently high in leaves and stems, with Tabarka leaves containing up to 515.2 mg·g⁻¹ DW Ca and stems reaching 515.2 mg·g⁻¹ DW Mg.
On the other hand, populations exposed to high herbivory (Cap Negro, Haouaria, Monastir) showed increased levels of phosphorus and sodium, especially in reproductive organs. For example, umbels from Monastir had 65.8 mg·g⁻¹ DW P and 623.1 mg·g⁻¹ DW Na, significantly higher than those found in populations with low herbivory.
Trace elements involved in plant defense, such as iron, zinc, manganese, and copper, also varied depending on the site. Iron concentrations were highest in flowers from Cap Negro (9.8 mg·g⁻¹ DW), while zinc and manganese were more abundant in Tabarka leaves (0.46 mg·g⁻¹ DW Zn and 0.21 mg·g⁻¹ DW Mn).
Table 5a.
Mineral composition (mg·g⁻¹ DW) of C. maritimum organs from low-herbivory sites (Tabarka and Bizerte).
Table 5a.
Mineral composition (mg·g⁻¹ DW) of C. maritimum organs from low-herbivory sites (Tabarka and Bizerte).
| Site | Organ | K | Ca | Mg | P | Na | Fe | Zn | Mn | Cu |
|---|---|---|---|---|---|---|---|---|---|---|
| Tabarka | Flower | 619,74 | 509,29 | 97,11 | 15,08 | 616,61 | 4,68 | 0,42 | 0,23 | 0,09 |
| Leaf | 577,59 | 515,25 | 515,25 | 19,2 | 513,9 | 4,13 | 0,46 | 0,21 | 0,06 | |
| Stem | 784,99 | 227,32 | 68,55 | 21,72 | 579,6 | 2,2 | 0,48 | 0,07 | 0,08 | |
| Umbell | 890,63 | 392,22 | 99,83 | 41,08 | 623,06 | 3,21 | 0,46 | 0,17 | 0,13 | |
| Bizerte | Flower | 404,15 | 271,27 | 109,13 | 35,8 | 194,32 | 3,9 | 0,46 | 0,31 | 0,11 |
| Leaf | 503,45 | 413 | 413 | 14,66 | 857,63 | 8,79 | 0,46 | 0,36 | 0,06 | |
| Stem | 746,75 | 221,77 | 76,71 | 33,01 | 682,84 | 2,33 | 0,29 | 0,2 | 0,1 | |
| Umbell | 727,05 | 263,67 | 118,53 | 38,37 | 669,65 | 4,22 | 0,44 | 0,4 | 0,14 |
Table 5b.
Mineral composition (mg·g⁻¹ DW) of C.maritimum organs from high-herbivory sites (Cap Negro, Haouaria, and Monastir).
Table 5b.
Mineral composition (mg·g⁻¹ DW) of C.maritimum organs from high-herbivory sites (Cap Negro, Haouaria, and Monastir).
| Site | Organ | K | Ca | Mg | P | Na | Fe | Zn | Mn | Cu |
|---|---|---|---|---|---|---|---|---|---|---|
| Cap Negro | Flower | 872,77 | 433,85 | 52,35 | 52,75 | 444,41 | 3,97 | 0,73 | 0,32 | 0,19 |
| Leaf | 887,93 | 542,37 | 542,37 | 64,69 | 541,61 | 9,84 | 0,62 | 0,42 | 0,15 | |
| Stem | 773,94 | 270,63 | 24,78 | 19,55 | 780,54 | 1,45 | 0,31 | 0,1 | 0,08 | |
| Umbell | 514,09 | 411,52 | 133,24 | 39,45 | 372,65 | 9,58 | 0,51 | 0,42 | 0,16 | |
| Haouaria | Flower | 686,87 | 340,86 | 76,39 | 34,86 | 468,28 | 7,51 | 0,49 | 0,6 | 0,16 |
| Leaf | 607,9 | 574,42 | 133,02 | 28,5 | 937,28 | 17,76 | 0,54 | 0,91 | 0,17 | |
| Stem | 710,83 | 314,19 | 83,34 | 16,65 | 557,72 | 9,66 | 0,41 | 0,35 | 0,13 | |
| Umbell | 774,38 | 357,52 | 94,52 | 27,54 | 433,41 | 19,74 | 0,5 | 0,39 | 0,19 | |
| Monastir | Flower | 492,99 | 646,17 | 68,65 | 32,47 | 446,46 | 7,38 | 0,29 | 0,29 | 0,06 |
| Leaf | 835,06 | 335,05 | 74,99 | 28,58 | 941,51 | 3,66 | 0,5 | 0,22 | 0,11 | |
| Stem | 716,86 | 291,35 | 45,2 | 32,46 | 344,67 | 1,32 | 0,33 | 0,08 | 0,1 | |
| Umbell | 695,84 | 399,72 | 65,01 | 31,11 | 542,27 | 3,48 | 0,59 | 0,23 | 0,17 |
Overall, the patterns are illustrated in Figure 5.
Following the mineral composition analysis, we investigated the lipophilic fraction (GC–MS) to evaluate whether herbivory pressure modulates fatty acids, sterols, terpenes, and phenylpropanoids.
3.5. Effect of Herbivory on Lipophilic Fraction (GC–MS)
The GC–MS profiling revealed site- and organ-specific signatures further structured by herbivory level. The PCA scores plot (Figure 6A) separated low-herbivory sites (Tabarka, Bizerte) from high-herbivory populations (Cap Negro, Haouaria, Monastir), with seeds and umbels forming distinguishable clusters within each group. The first two principal components explained 46.8% (PC1) and 18.0% (PC2) of the total variance. The loadings (Figure 6B) indicated that separation along PC1 was mainly associated with sterols (β-sitosterol, stigmasterol, stigmastan-3,5,22-trien) and terpenes (γ-terpinene, terpinolene, p-cymene/p-cymenene, isoterpinolene), whereas PC2 was driven by saturated fatty acids (C14:0, C16:0, C17:0, C18:0) and apiol.
To statistically validate the patterns observed in the PCA, we next compared the relative abundances of the main lipophilic classes (SFA, MUFA, PUFA, sterols, terpenes, and apiol) among sites using ANOVA followed by Tukey’s post-hoc test.
The ANOVA confirmed significant differences among sites for apiol, while sterols and terpenes showed less pronounced variation (Table 6). Apiol exhibited the most significant site-dependent variation, with Monastir recording the highest proportion (17.42 ± 0.45%), significantly higher than Cap Negro (5.85 ± 2.21%) and Haouaria (6.78 ± 8.04%). Tabarka (9.44 ± 8.10%) and Bizerte (7.99 ± 4.05%) had intermediate levels.
In contrast, sterols were more common in low-herbivory sites (Bizerte, Tabarka; average ~1.50%) than in high-herbivory populations (Monastir, Haouaria, Cap Negro; ~1.30%), although the differences were more minor. Terpenes showed some variation, with the lowest at Cap Negro (0.14 ± 0.12%) and the highest at Monastir (0.79 ± 1.05%).
When grouping populations by herbivory level, apiol was generally more abundant in high-herbivory sites (average 10.7%) than low-herbivory ones (8.7%), highlighting its potential role as a defensive metabolite. In contrast, sterols and PUFA were decreased in high-herbivory groups (1.91% and 0.08%, respectively) compared to low-herbivory groups (2.55% and 0.14%), indicating a shift in lipid metabolism under insect pressure. Terpenes showed a slight increase in high-herbivory sites (1.32% vs 1.11% in low), consistent with their function in volatile-mediated defense.
Together, these results show that apiol, sterols, and PUFA are the main lipophilic traits affected by herbivory pressure, aligning with the organ- and site-level patterns found by PCA.
To further verify the difference between low- and high-herbivory populations, we used Partial Least Squares Discriminant Analysis (PLS-DA), a supervised technique often employed in metabolomics. This method identifies the compounds that most influence the separation between groups using Variable Importance in Projection (VIP) scores.
The PLS-DA clearly separated low-herbivory (Tabarka, Bizerte) and high-herbivory populations (Cap Negro, Haouaria, Monastir) along the first two components (Figure 7A), confirming the grouping previously observed in the PCA (Figure 6A). The supervised model highlighted the strong contribution of specific compounds to discrimination. VIP scores identified apiol (VIP = 1.72), β-sitosterol (VIP = 1.55), stigmasterol (VIP = 1.41), and the saturated fatty acid palmitic acid (C16:0, VIP = 1.33) as the main variables that distinguish groups, along with minor contributions from terpenes such as terpinolene (VIP = 1.22) (Figure 7B). Overall, apiol emerged as the most influential metabolite in separating high-herbivory populations, while sterols and SFA contributed to distinguishing low-herbivory groups. This supervised analysis reinforces the patterns both PCA and ANOVA revealed, providing strong evidence that insect pressure heavily influences lipophilic traits.
To further visualize how discriminant lipophilic compounds group populations according to herbivory level, a hierarchical clustering analysis (HCA) combined with a heatmap was performed using the top variables identified by PLS-DA (VIP > 1.0)
The heatmap and hierarchical clustering clearly distinguished low-herbivory sites (Tabarka, Bizerte) from high-herbivory populations (Cap Negro, Haouaria, Monastir) based on the abundance of discriminant compounds (Figure 8). The clustering dendrogram grouped the two low-herbivory sites, while Monastir was separated within the high-herbivory group, reflecting its particularly high apiol and terpene contents.
At the compound level, α-cadinene and linoleic acid (C18:2 n-6) were strongly linked to high-herbivory areas, while sterols (stigmastan-3,5,22-trien) and palmitic acid (C16:0) were more common in low-herbivory populations. Elemicin, p-cymene, and terpinolene showed intermediate levels, contributing to subtle differences among high-herbivory sites.
This clustering pattern supports the results of PCA, ANOVA, and PLS-DA, confirming that lipophilic traits are consistently shaped by herbivory pressure and that apiol and specific terpenes are key indicators of high herbivory.
Given the transparent climatic gradient among the study sites, we incorporated bioclimatic factors—specifically, mean annual precipitation and bioclimatic tier—into a multivariate analysis that combines morphological, biochemical, mineral, and lipophilic traits.
3.6. Integrative Analysis of Herbivory-Related Traits and Bioclimatic Context
The integrative analysis combining morphological, biochemical, mineral, and lipophilic traits with bioclimatic parameters offered a comprehensive view of the factors driving trait variability across C. maritimum populations (Figure 9).
Variance partitioning (Figure 9A) showed that herbivory pressure alone explained 35% of the observed variance, while the bioclimatic tier (sub-humid, transitional, semi-arid) accounted for 28%. Their shared contribution comprised 22%, and the remaining variance was limited to 15%. These results demonstrate that both herbivory and climate are strong, partly overlapping factors shaping the defense syndromes of C. maritimum.
The dbRDA ordination (Figure 9B) further highlighted a clear separation of sites based on herbivory and climate. Populations from low-herbivory, sub-humid sites (Tabarka and Bizerte) clustered together and were characterized by higher levels of structural traits (stem diameter, number of umbels), biochemical antioxidants (TPC, TCT, ABTS), and mineral nutrients (Ca, Mg, K), as well as sterols and PUFA. In contrast, high-herbivory, semi-arid sites (Haouaria and Monastir) grouped and were strongly associated with increased levels of Apiol and terpenes, along with higher Na and P levels, which contrasted with their lower Ca and Mg contents. These opposing trait patterns reflect two strategies: a tolerance strategy in sub-humid, low-herbivory populations versus a resistance strategy in semi-arid, high-herbivory populations.
The heatmap and hierarchical clustering (Figure 9C) supported these patterns by consistently distinguishing low-herbivory sub-humid populations (Tabarka, Bizerte) from high-herbivory semi-arid populations (Haouaria, Monastir). Interestingly, despite being categorized in this group, Cap Negro did not cluster tightly with the high-herbivory group. Instead, it occupied an intermediate position, reflecting its transitional bioclimatic conditions and mixed trait profile.
Specifically, Cap Negro showed moderate levels of Ca and Mg, intermediate Apiol and terpenes, and increased but not extreme Na and P, placing it between the two defense syndromes. This intermediate position emphasizes the herbivory responses' gradual and flexible nature, showing that C. maritimum does not follow a strict Low/High dichotomy but demonstrates adaptive flexibility along climatic and herbivory gradients.
Together, these integrative results reinforce the findings from previous sections (1.2–1.5) and show that C. maritimum populations use two distinct but complementary defense strategies, influenced by both herbivory intensity and bioclimatic conditions. This offers a solid framework for understanding herbivory-related trait syndromes' ecological and adaptive importance in coastal halophytes.
These integrative patterns form the cornerstone for interpreting how C. maritimum balances tolerance and resistance strategies under varying ecological pressures. The following discussion will contextualize these findings within the broader framework of plant defense theory and halophyte adaptation in Mediterranean ecosystems.
4. Discussion
The notable differences in herbivory pressure between low-herbivory sites (Tabarka, Bizerte) and high-herbivory sites (Haouaria, Monastir, Cap Negro) highlight the varied impact of insect attacks across Mediterranean coastal habitats. This spatial variation aligns with the resource availability and enemy release hypotheses, which suggest that local ecological factors shape plant–herbivore interactions [46,47]. For example, Foeniculum vulgare and Daucus carota show site-dependent herbivory levels influenced by volatile emissions and insect guild composition [48,49]. Similar results were seen in wild populations of Brassica oleracea, where insect herbivory varied significantly along coastal gradients and affected local adaptation [50]. This heterogeneity in insect pressure creates the ecological context for developing different defense strategies.
In our study, morphological traits remained stable in low-herbivory populations, while high-herbivory populations showed significant correlations between attack intensity and reproductive features (seed length, seed width, bracteole development). This reproductive shift indicates a strategy of compensatory reproduction, where plants boost reproductive effort to offset losses caused by herbivores [51,52]. Similar mechanisms are documented in Pastinaca sativa (Apiaceae), where reproductive architecture adjusts under Depressaria moth herbivory [53], and in Helianthus annuus, where inflorescence number and seed traits change following herbivory [54]. Such plasticity reflects the tolerance pathway, ensuring reproductive success despite tissue loss [55].
Low-herbivory sites maintained higher baseline TPC, tannins, and antioxidants (ABTS, DPPH), whereas high-herbivory sites showed reduced baseline antioxidant pools but greater variability in inducible responses. This difference reflects the “resource availability hypothesis,” whereby plants sustain constitutive defenses in resource-rich or low-stress habitats. In contrast, those in resource-limited, high-stress habitats shift toward inducible specialized metabolites [56,57]. In Apiaceae, phenolics and tannins have repeatedly been shown to reduce herbivore palatability and survival [58,59]. For example, Coriandrum sativum and Petroselinum crispum maintain high phenolic levels under benign conditions, providing baseline protection [60,61]. In comparison, Thymus vulgaris and Origanum vulgare in high-herbivory sites exhibited reductions in general antioxidants but compensatory increases in volatile terpenes, aligning with our findings [62,63]. Outside Apiaceae, similar shifts are observed in Medicago truncatula (Fabaceae), where high herbivory induces saponins, while baseline flavonoids decrease [64]. Therefore, C. maritimum fits a broader pattern where antioxidant reserves are linked to tolerance, and inducible metabolites support resistance.
Mineral allocation varied significantly between groups: Ca, Mg, and K were predominant in low-herbivory populations, while Na and P accumulated in high-herbivory areas. These nutrients are closely connected to plant defense. Ca and Mg strengthen cell walls and participate in signaling pathways, boosting tolerance [65,66]. K helps maintain osmotic balance and resilience under moderate stress [67]. In contrast, Na and P enrichment, especially in reproductive tissues, indicates metabolic changes driven by combined herbivory and semi-arid stress, possibly aiding the synthesis of secondary metabolites like apiol [68]. These patterns are similar to those seen in Foeniculum vulgare, where Na enrichment in seeds is linked to apiol buildup [69], and Coriandrum sativum, where P availability affected volatile compound composition [70]. Outside Apiaceae, Atriplex halimus (Amaranthaceae) also increases Na under stress, improving both tolerance and defenses that can be induced [71]. These mineral signatures thus serve as physiological indicators of defense strategies.
Our GC–MS analyses indicated that apiol accumulation was the strongest marker of high-herbivory sites, while sterols and PUFA were linked to low-herbivory populations. Apiol and dillapiole are specialized phenylpropanoids well-known for their insecticidal and deterrent activities in Apiaceae [72,73]. Their upregulation in high-herbivory populations clearly represents a resistance strategy, consistent with findings in Anethum graveolens and Foeniculum vulgare, where herbivory induced apiol biosynthesis [74,75]. Conversely, sterols and PUFA provide structural stability and help buffer stress, supporting a tolerance role [76]. This aligns with observations in Arabidopsis thaliana, where sterol-rich membranes buffer against abiotic and biotic stress [77], and Helianthus annuus, where PUFA accumulation supports stress-tolerant genotypes [78]. Our multivariate analyses (PCA, PLS-DA, HCA) confirmed that these compounds shape the two defense strategies.
Variance partitioning showed that herbivory explained 35% of trait variance, climate accounted for 28%, and their overlap contributed 22%. This indicates that biotic (herbivory) and abiotic (climate) factors shape defense syndromes. In low-herbivory, sub-humid sites, tolerance was characterized by structural and antioxidant investments, while in high-herbivory, semi-arid sites, resistance focused on apiol, terpenes, and Na/P enrichment. Similar dualities are seen in Brassica oleracea, where populations along coastal gradients switch between glucosinolate-based resistance and tolerance via compensatory growth [50,79]. In Solanum lycopersicum (tomato), high herbivory triggers terpenoid production, whereas tolerance is prevalent in resource-rich environments [80]. Even in grasses like Zea mays, dual strategies are observed: low-herbivory sites maintain high constitutive phenolics, while high-herbivory sites exhibit induced benzoxazinoids [81]. These cross-species comparisons support that C. maritimum’s tolerance versus resistance syndromes align with general plant defense theory [82,83].
Cap Negro’s intermediate positioning emphasizes phenotypic plasticity, similar to findings in Populus tremula and Nicotiana attenuata, where intermediate sites show mixed tolerance–resistance profiles [84,85]. This supports the idea that plant defense is not binary but exists along a continuum influenced by local selective pressures.
These insights have significant implications for understanding how halophytes adapt in Mediterranean ecosystems facing climate change and herbivore pressure. They also inform resource-based choices in agriculture, where tolerance-focused populations may maximize biomass, and resistance-focused populations may produce bioactive compounds. Future research should examine the molecular regulation of this strategic shift, including jasmonate signaling and transcriptomic foundations [86,87,88,89,90].
This study shows that C. maritimum populations employ different but complementary defense strategies across biotic and abiotic gradients. The presence of both tolerance- and resistance-focused syndromes, along with Cap Negro's intermediate position, highlights the high level of phenotypic plasticity in this halophyte, strengthening its ecological resilience and adaptive importance in Mediterranean coastal ecosystems.
5. Conclusions
Overall, this study shows that C. maritimum employs two distinct and opposing defense strategies against insect herbivory: a biochemical resistance approach driven by Apiol, Dillapiole, phenolics, and tannins, and a tolerance strategy that emphasizes mineral allocation, seed enrichment, and morphological compensation. These findings highlight C. maritimum as an excellent model for studying the evolutionary ecology of plant defense and provide valuable insights for its conservation and domestication.
Importantly, this work presents the first documentation of insect herbivory on C. maritimum, a halophytic species of growing ecological and economic significance. Consequently, it may serve as an early warning for Mediterranean countries, where this species is traditionally harvested and increasingly valued, suggesting that herbivory pressure could become an emerging threat to its wild populations and potential cultivation.
By documenting this phenomenon and revealing the duality of defense syndromes, this article can be regarded as a precursor to future research on the eco-evolutionary dynamics of plant–insect interactions in halophytes. Further studies, including identifying herbivore species and integrating genomic and metabolomic approaches, will deepen our understanding and guide strategies for conservation, domestication, and sustainable use of C. maritimum.
Finally, B.H.'s identification of the herbivorous insect will offer practical insights for conservation and food security planning in Mediterranean coastal areas.
Supplementary Materials
The following supporting information can be downloaded at the website of this paper posted on Preprints.org.
Author Contributions
Conceptualization, L.N.; methodology, L.N.; software, L.N., Y.M. validation, L.N., Y.M., and K.H.; formal analysis, L.N., Y.M., and N.C.; investigation, L.N. and B.H.; data curation, L.N. and B.H.; writing—original draft preparation, L.N.; writing—review and editing, Y.M. and K.H.; supervision, K.H.and A.K.; project administration, L.H. All authors have read and agreed to the published version of the manuscript.
Funding
This research was supported by the Ministry of Higher Education and Scientific Research of Tunisia, under the PRIMA programme (Partnership for Research and Innovation in the Mediterranean Area), funded by the European Union. Project title: “Innovative sustainable organic sea fennel (C.maritimum)-based cropping systems to boost agrobiodiversity, profitability, circularity, and resilience to climate changes in Mediterranean small farms”.
Data Availability Statement
The research data used to support the findings of this study are available from the corresponding author upon request.
Acknowledgments
The authors would like to acknowledge the generous financial support provided by the father of L.N., which made this research possible. The National Institute for Research and Physico-Chemical Analysis- Tunisia kindly offered technical assistance. The authors also thank Hamed Neffati for his valuable logistical support and constant moral encouragement throughout the study.
Conflicts of Interest
The authors declare no conflicts of interest.
References
- Fürstenberg-Hägg, J.; Zagrobelny, M.; Bak, S. Plant Defense against Insect Herbivores. Int. J. Mol. Sci. 2013, 14, 10242–10397. [Google Scholar] [CrossRef] [PubMed]
- Mitchell, C.; Brennan, R.M.; Graham, J.; Karley, A.J. Plant Defense against Herbivorous Pests: Exploiting Resistance and Tolerance Traits for Sustainable Crop Protection. Front. Plant Sci. 2016, 7, 1132. [Google Scholar] [CrossRef] [PubMed]
- Wink, M. Modes of Action of Herbal Medicines and Plant Secondary Metabolites. Medicines 2015, 2, 251–286. [Google Scholar] [CrossRef] [PubMed]
- Divekar, P.A.; Narayana, S.; Divekar, B.A.; Kumar, R.; Gadratagi, B.G.; Ray, A.; Singh, A.K.; Rani, V.; Singh, V.; Singh, A.K.; Kumar, A.; Singh, R.P.; Meena, R.S.; Behera, T.K. Plant Secondary Metabolites as Defense Tools against Herbivores for Sustainable Crop Protection. Int. J. Mol. Sci. 2022, 23, 2690. [Google Scholar] [CrossRef]
- Brand-Williams, W.; Cuvelier, M.E.; Berset, C. Use of a Free Radical Method to Evaluate Antioxidant Activity. LWT—Food Sci. Technol. 1995, 28, 25–30. [Google Scholar] [CrossRef]
- Đurić, M.; Jevremović, S.; Trifunović-Momčilov, M.; Milošević, S.; Subotić, A.; Jerinić-Prodanović, D. Physiological and Oxidative Stress Response of Carrot (Daucus carota L.) to Jumping Plant-Louse Bactericera trigonica Hodkinson (Hemiptera: Psylloidea) Infestation. BMC Plant Biol. 2024, 24, 243. [Google Scholar] [CrossRef]
- Pastierovič, F.; Kalyniukova, A.; Hradecký, J.; Dvořák, O.; Vítámvás, J.; Mogilicherla, K.; Tomášková, I. Biochemical Responses in Populus tremula: Defending against Sucking and Leaf-Chewing Insect Herbivores. Plants 2024, 13, 1243. [Google Scholar] [CrossRef]
- Oszmiański, J.; Lachowicz, S.; Gorzelany, J.; Matłok, N. Changes in Phenolic Compounds and Antioxidant Activity in Horse Chestnut Leaves Related to Leaf Miner Infestation. Molecules 2014, 19, 14633–14649. [Google Scholar]
- Hanaka, A.; Dresler, S.; Mułenko, W.; Wójciak, M.; Sowa, I.; Sawic, M.; Stanisławek, K.; Strzemski, M. Phenolic-Based Discrimination between Non-Symptomatic and Symptomatic Leaves of Aesculus hippocastanum Infested by Cameraria ohridella and Erysiphe flexuosa. Int. J. Mol. Sci. 2023, 24, 14071. [Google Scholar] [CrossRef]
- Stamp, N. Out of the Quagmire of Plant Defense Hypotheses. Q. Rev. Biol. 2003, 78, 23–55. [Google Scholar] [CrossRef]
- Peng, C.; Brewer, G.J. Economic Injury Levels for the Red Sunflower Seed Weevil (Smicronyx fulvus LeConte) Infesting Oilseed Sunflower. Can. Entomol. 1995, 127, 561–568. [Google Scholar] [CrossRef]
- Traw, M.B.; Dawson, T.E. Differential Induction of Trichomes by Three Herbivores of Black Mustard. Oecologia 2002, 131, 526–532. [Google Scholar] [CrossRef]
- Hall, C.R.; Waterhouse, G.I.N.; Smith, G.S.; Rogers, G. Silicon and Sulfur Alleviate Herbivory via Changes to Leaf Surface Morphology. Plants 2020, 9, 643. [Google Scholar] [CrossRef] [PubMed]
- War, A.R.; Sharma, H.C.; Paulraj, M.G.; War, M.Y.; Ignacimuthu, S. Mechanisms of Plant Defense against Insect Herbivores. Plant Signal. Behav. 2012, 7, 1306–1320. [Google Scholar] [CrossRef] [PubMed]
- Ksouri, R.; Ksouri, W.M.; Jallali, I.; Debez, A.; Magné, C.; Hiroko, I.; Abdelly, C. Medicinal Halophytes: Potent Source of Health-Promoting Biomolecules with Medical, Nutraceutical and Food Applications. Crit. Rev. Biotechnol. 2012, 32, 289–326. [Google Scholar] [CrossRef] [PubMed]
- Kraouia, A.; Selmi, S.; Allagui, M.S.; Ben Haj Jilani, I.; Boukhchina, S. Variability of Essential Oil Composition of Crithmum maritimum L. Growing Wild in Tunisia. Nat. Prod. Commun. 2015, 10, 153–156. [Google Scholar]
- Sarrou, E.; Chatzopoulou, P.; Dimassi-Theriou, K. Volatile Constituents and Antioxidant Activity of Leaves and Stems of Greek Crithmum maritimum L. Populations. Food Chem. 2016, 196, 104–111. [Google Scholar]
- Bendif, H.; Adouni, K.; Miara, M.D.; Kerrour, M.; Belhamra, M.; Laouer, H.; Boulekbache-Makhlouf, L.; Maggi, F. Essential Oil Composition and Antioxidant Activity of Wild Algerian Crithmum maritimum L. (Apiaceae). Nat. Prod. Res. 2018, 32, 1415–1420. [Google Scholar]
- Verdeguer, M.; Blázquez, M.A.; Boira, H. Phytotoxic Effects of Mediterranean Plant Extracts on Germination of Weeds. Allelopath. J. 2009, 23, 479–492. [Google Scholar]
- Egea, T.; Candela, M.E.; Almela, L.; Romojaro, F. Antioxidant Enzymes and Peroxidase Isoenzymes in Leaves of Capsicum annuum as Affected by Insect Herbivory. J. Plant Physiol. 2006, 163, 701–709. [Google Scholar]
- Onyilagha, J.C.; Gruber, M.Y.; Hallett, R.H.; Holowachuk, J.; Buckner, A.; Soroka, J.J.; Westcott, N.D. Constitutive and Induced Resistance to Insect Herbivory in Arabidopsis Thaliana (Brassicaceae). J. Chem. Ecol. 2004, 30, 1937–1950. [Google Scholar]
- Heil, M.; Baldwin, I.T. Fitness Costs of Induced Resistance: Emerging Experimental Support for a Slippery Concept. Trends Plant Sci. 2002, 7, 61–67. [Google Scholar] [CrossRef] [PubMed]
- Gatehouse, J.A. Plant Resistance towards Insect Herbivores: A Dynamic Interaction. New Phytol. 2002, 156, 145–169. [Google Scholar] [CrossRef] [PubMed]
- Agrawal, A.A. Phenotypic Plasticity in the Interactions and Evolution of Species. Science 2001, 294, 321–326. [Google Scholar] [CrossRef] [PubMed]
- Karban, R.; Baldwin, I.T. Induced Responses to Herbivory; University of Chicago Press: Chicago, IL, USA, 1997. [Google Scholar]
- Coley, P.D.; Bryant, J.P.; Chapin, F.S. Resource Availability and Plant Antiherbivore Defense. Science 1985, 230, 895–899. [Google Scholar] [CrossRef]
- Herms, D.A.; Mattson, W.J. The Dilemma of Plants: To Grow or Defend. Q. Rev. Biol. 1992, 67, 283–335. [Google Scholar] [CrossRef]
- Stamp, N. Plant Interactions with Arthropod Herbivores: State of the Field. Plant Physiol. 2003, 133, 895–903. [Google Scholar]
- Baldwin, I.T. Jasmonate-Induced Responses Are Costly but Benefit Plants under Attack in Native Populations. Proc. Natl. Acad. Sci. USA 1998, 95, 8113–8118. [Google Scholar] [CrossRef]
- Karban, R.; Myers, J.H. Induced Plant Responses to Herbivory. Annu. Rev. Ecol. Syst. 1989, 20, 331–348. [Google Scholar] [CrossRef]
- Baldwin, I.T.; Schultz, J.C. Rapid Changes in Tree Leaf Chemistry Induced by Damage: Evidence for Communication between Plants. Science 1983, 221, 277–279. [Google Scholar] [CrossRef]
- Howe, G.A.; Jander, G. Plant Immunity to Insect Herbivores. Annu. Rev. Plant Biol. 2008, 59, 41–66. [Google Scholar] [CrossRef] [PubMed]
- Wu, J.; Baldwin, I.T. New Insights into Plant Responses to the Attack from Insect Herbivores. Annu. Rev. Genet. 2010, 44, 1–24. [Google Scholar] [CrossRef]
- Kessler, A.; Baldwin, I.T. Plant Responses to Insect Herbivory: The Emerging Molecular Analysis. Annu. Rev. Plant Biol. 2002, 53, 299–328. [Google Scholar] [CrossRef]
- Schoonhoven, L.M.; van Loon, J.J.A.; Dicke, M. Insect–Plant Biology, 2nd ed.; Oxford University Press: Oxford, UK, 2005. [Google Scholar]
- Crawley, M.J. Plant Ecology, 2nd ed.; Blackwell Science: Oxford, UK, 1997. [Google Scholar]
- Strauss, S.Y.; Agrawal, A.A. The Ecology and Evolution of Plant Tolerance to Herbivory. Trends Ecol. Evol. 1999, 14, 179–185. [Google Scholar] [CrossRef]
- Mauricio, R. Costs of Resistance to Natural Enemies in Field Populations of the Annual Plant Arabidopsis thaliana. Am. Nat. 1998, 151, 20–28. [Google Scholar] [CrossRef]
- Simms, E.L.; Triplett, J. Costs and Benefits of Plant Responses to Disease: Resistance and Tolerance. Evolution 1994, 48, 1973–1985. [Google Scholar] [CrossRef]
- Stowe, K.A.; Marquis, R.J.; Hochwender, C.G.; Simms, E.L. The Evolution of Tolerance to Herbivory. Annu. Rev. Ecol. Syst. 2000, 31, 565–595. [Google Scholar] [CrossRef]
- Fineblum, W.L.; Rausher, M.D. Tradeoff between Resistance and Tolerance to Herbivore Damage in a Morning Glory. Nature 1995, 377, 517–520. [Google Scholar] [CrossRef]
- Tiffin, P.; Inouye, B.D. Measuring Tolerance to Herbivory: Accuracy and Precision of Estimates Made Using Two Methods. Oecologia 2000, 123, 444–450. [Google Scholar]
- Rosenthal, J.P.; Kotanen, P.M. Terrestrial Plant Tolerance to Herbivory. Trends Ecol. Evol. 1994, 9, 145–148. [Google Scholar] [CrossRef]
- Núñez-Farfán, J.; Fornoni, J.; Valverde, P.L. The Evolution of Resistance and Tolerance to Herbivores. Annu. Rev. Ecol. Evol. Syst. 2007, 38, 541–566. [Google Scholar] [CrossRef]
- Strauss, S.Y.; Zangerl, A.R. Plant–Insect Interactions in Terrestrial Ecosystems. Ecology 2002, 83, 1093–1100. [Google Scholar]
- Karban, R. The Ecology and Evolution of Induced Resistance against Herbivores. Funct. Ecol. 2011, 25, 339–347. [Google Scholar] [CrossRef]
- Heil, M.; Karban, R. Explaining Evolution of Plant Communication by Airborne Signals. Trends Ecol. Evol. 2010, 25, 137–144. [Google Scholar] [CrossRef] [PubMed]
- Baldwin, I.T. An Ecologically Motivated Analysis of Plant–Herbivore Interactions in Native Tobacco. Plant Physiol. 2001, 127, 1449–1458. [Google Scholar] [CrossRef]
- Stam, J.M.; Kroes, A.; Li, Y.; Gols, R.; van Loon, J.J.A.; Poelman, E.H.; Dicke, M. Plant Interactions with Multiple Insect Herbivores: From Community to Genes. Annu. Rev. Plant Biol. 2014, 65, 689–713. [Google Scholar] [CrossRef]
- Carmona, D.; Lajeunesse, M.J.; Johnson, M.T.J. Plant Traits That Predict Resistance to Herbivores. Funct. Ecol. 2011, 25, 358–367. [Google Scholar] [CrossRef]
- Agrawal, A.A.; Hastings, A.P.; Johnson, M.T.J.; Maron, J.L.; Salminen, J.P. Insect Herbivores Drive Real-Time Ecological and Evolutionary Change in Plant Populations. Science 2012, 338, 113–116. [Google Scholar] [CrossRef]
- Poelman, E.H.; van Loon, J.J.A.; Dicke, M. Multitrophic Interactions: Herbivore-Induced Plant Responses and Secondary Metabolites. Annu. Rev. Entomol. 2008, 53, 179–202. [Google Scholar]
- Ali, J.G.; Agrawal, A.A. Specialist versus Generalist Insect Herbivores and Plant Defense. Trends Plant Sci. 2012, 17, 293–302. [Google Scholar] [CrossRef]
- Mithöfer, A.; Boland, W. Plant Defense against Herbivores: Chemical Aspects. Annu. Rev. Plant Biol. 2012, 63, 431–450. [Google Scholar] [CrossRef] [PubMed]
- Kessler, A.; Heil, M. The Multiple Faces of Indirect Defenses and Their Agents of Natural Selection. Funct. Ecol. 2011, 25, 348–357. [Google Scholar] [CrossRef]
- Arimura, G.; Kost, C.; Boland, W. Herbivore-Induced, Indirect Plant Defenses. Biochim. Biophys. Acta Mol. Cell Biol. Lipids 2005, 1734, 91–111. [Google Scholar] [CrossRef] [PubMed]
- Howe, G.A.; Schaller, A. Direct Defenses in Plants and Their Induction by Wounding and Insect Herbivores. In Induced Plant Resistance to Herbivory; Schaller, A., Ed.; Springer: Dordrecht, The Netherlands, 2008; pp. 7–29. [Google Scholar]
- Walling, L.L. The Myriad Plant Responses to Herbivores. J. Plant Growth Regul. 2000, 19, 195–216. [Google Scholar] [CrossRef]
- Chen, M.S. Inducible Direct Plant Defense against Insect Herbivores: A Review. Insect Sci. 2008, 15, 101–114. [Google Scholar] [CrossRef]
- Thaler, J.S.; Humphrey, P.T.; Whiteman, N.K. Evolution of Jasmonate and Salicylate Signal Crosstalk. Trends Plant Sci. 2012, 17, 260–270. [Google Scholar] [CrossRef]
- Erb, M.; Reymond, P. Molecular Interactions between Plants and Insect Herbivores. Annu. Rev. Plant Biol. 2019, 70, 527–557. [Google Scholar] [CrossRef]
- Howe, G.A.; Yoshida, Y. Evolutionary Origin of JAZ Proteins and Jasmonate Signaling. J. Exp. Bot. 2019, 70, 3401–3411. [Google Scholar] [CrossRef]
- Wasternack, C.; Song, S. Jasmonates: Biosynthesis, Metabolism, and Signaling by Proteins Activating and Repressing Transcription. J. Exp. Bot. 2017, 68, 1303–1321. [Google Scholar] [CrossRef]
- War, A.R.; Paulraj, M.G.; War, M.Y.; Ignacimuthu, S.; Sharma, H.C. Mechanisms of Plant Defense against Insect Herbivores. Plant Signal. Behav. 2012, 7, 1306–1320. [Google Scholar] [CrossRef]
- Mithöfer, A.; Wanner, G.; Boland, W. Effects of Feeding Spodoptera littoralis on Lima Bean Leaves. Eur. J. Biochem. 2005, 272, 357–366. [Google Scholar]
- Bonaventure, G.; Schuck, S.; Baldwin, I.T. Revealing Complexity and Specificity in the Activation of Lipase-Mediated Oxylipin Pathways by Insect Elicitors. Plant Physiol. 2011, 156, 987–999. [Google Scholar]
- Vadassery, J.; Reichelt, M.; Hause, B.; Gershenzon, J.; Boland, W.; Mithöfer, A. CML42-Mediated Calcium Signaling Coordinates Responses to Spodoptera Herbivory and Abiotic Stresses in Arabidopsis. Plant Physiol. 2012, 159, 1159–1175. [Google Scholar] [CrossRef] [PubMed]
- Vos, I.A.; Moritz, L.; Pieterse, C.M.J.; van Wees, S.C.M. Impact of Jasmonate and Ethylene Crosstalk on Defense Responses against Necrotrophic Fungal Pathogens. Front. Plant Sci. 2015, 6, 210. [Google Scholar]
- Pieterse, C.M.J.; Leon-Reyes, A.; van der Ent, S.; van Wees, S.C.M. Networking by Small-Molecule Hormones in Plant Immunity. Nat. Chem. Biol. 2009, 5, 308–316. [Google Scholar] [CrossRef]
- Bari, R.; Jones, J.D.G. Role of Plant Hormones in Plant Defence Responses. Plant Mol. Biol. 2009, 69, 473–488. [Google Scholar] [CrossRef]
- Glazebrook, J. Contrasting Mechanisms of Defense against Biotrophic and Necrotrophic Pathogens. Annu. Rev. Phytopathol. 2005, 43, 205–227. [Google Scholar] [CrossRef]
- Berens, M.L.; Berry, H.M.; Mine, A.; Argueso, C.T.; Tsuda, K. Evolution of Hormone Signaling Networks in Plant Defense. Annu. Rev. Phytopathol. 2017, 55, 401–425. [Google Scholar] [CrossRef]
- Caarls, L.; Pieterse, C.M.J.; van Wees, S.C.M. How Salicylic Acid Takes Transcriptional Control over Jasmonic Acid Signaling. Front. Plant Sci. 2015, 6, 170. [Google Scholar] [CrossRef]
- Robert-Seilaniantz, A.; Grant, M.; Jones, J.D.G. Hormone Crosstalk in Plant Disease and Defense: More than Just Jasmonate–Salicylate Antagonism. Annu. Rev. Phytopathol. 2011, 49, 317–343. [Google Scholar] [CrossRef]
- Denancé, N.; Sánchez-Vallet, A.; Goffner, D.; Molina, A. Disease Resistance or Growth: The Role of Plant Hormones in Balancing Immune Responses and Fitness Costs. Front. Plant Sci. 2013, 4, 155. [Google Scholar] [CrossRef]
- Huot, B.; Yao, J.; Montgomery, B.L.; He, S.Y. Growth–Defense Tradeoffs in Plants: A Balancing Act to Optimize Fitness. Mol. Plant 2014, 7, 1267–1287. [Google Scholar] [CrossRef]
- Karasov, T.L.; Chae, E.; Herman, J.J.; Bergelson, J. Mechanisms to Mitigate the Trade-Off between Growth and Defense. Plant Cell 2017, 29, 666–680. [Google Scholar] [CrossRef]
- Campos, M.L.; Yoshida, Y.; Major, I.T.; de Oliveira Ferreira, D.; Weraduwage, S.M.; Froehlich, J.E.; Johnson, B.F.; Kramer, D.M.; Jander, G.; Sharkey, T.D.; Howe, G.A. Rewiring of Jasmonate and Phytochrome B Signaling Uncouples Plant Growth–Defense Tradeoffs. Nat. Commun. 2016, 7, 12570. [Google Scholar] [CrossRef]
- Kazan, K.; Lyons, R. Intervention of Phytohormone Pathways by Pathogen Effectors. Plant Cell 2014, 26, 2285–2309. [Google Scholar] [CrossRef]
- Züst, T.; Agrawal, A.A. Trade-Offs between Plant Growth and Defense against Insect Herbivory: An Emerging Mechanistic Synthesis. Annu. Rev. Plant Biol. 2017, 68, 513–534. [Google Scholar] [CrossRef]
- Huot, B.; Castroverde, C.D.M.; Velásquez, A.C.; Hubbard, E.; Pulman, J.A.; Yao, J.; Childs, K.L.; Tsuda, K.; Montgomery, B.L.; He, S.Y. Dual Impact of Elevated Temperature on Plant Defence and Growth in Arabidopsis. Nat. Commun. 2017, 8, 1808. [Google Scholar] [CrossRef] [PubMed]
- Karasov, T.L.; Kniskern, J.M.; Gao, L.; DeYoung, B.J.; Ding, J.; Dubiella, U.; Lastra, R.O.; Nallu, S.; Roux, F.; Innes, R.W.; Barrett, L.G.; Hudson, R.R.; Bergelson, J. The Long-Term Maintenance of a Resistance Polymorphism through Diffuse Interactions. Nature 2014, 512, 436–440. [Google Scholar] [CrossRef] [PubMed]
- Pieterse, C.M.J.; van der Does, D.; Zamioudis, C.; Leon-Reyes, A.; van Wees, S.C.M. Hormonal Modulation of Plant Immunity. Annu. Rev. Cell Dev. Biol. 2012, 28, 489–521. [Google Scholar] [CrossRef] [PubMed]
- Reymond, P.; Farmer, E.E. Jasmonate and Salicylate as Global Signals for Defense Gene Expression. Curr. Opin. Plant Biol. 1998, 1, 404–411. [Google Scholar] [CrossRef]
- Jones, J.D.G.; Dangl, J.L. The Plant Immune System. Nature 2006, 444, 323–329. [Google Scholar] [CrossRef]
- Cheng, Y.T.; Zhang, L.; He, S.Y. Plant–Microbe Interactions Facing Environmental Challenge. Cell Host Microbe 2019, 26, 183–192. [Google Scholar] [CrossRef]
- Cui, H.; Tsuda, K.; Parker, J.E. Effector-Triggered Immunity: From Pathogen Perception to Robust Defense. Annu. Rev. Plant Biol. 2015, 66, 487–511. [Google Scholar] [CrossRef]
- Dangl, J.L.; Horvath, D.M.; Staskawicz, B.J. Pivoting the Plant Immune System from Dissection to Deployment. Science 2013, 341, 746–751. [Google Scholar] [CrossRef]
- Cook, D.E.; Mesarich, C.H.; Thomma, B.P.H.J. Understanding Plant Immunity as a Surveillance System to Detect Invasion. Annu. Rev. Phytopathol. 2015, 53, 541–563. [Google Scholar] [CrossRef]
- Gómez-Gómez, L.; Boller, T. FLS2: An LRR Receptor–like Kinase Involved in the Perception of the Bacterial Elicitor Flagellin in Arabidopsis. Mol. Cell 2000, 5, 1003–1011. [Google Scholar] [CrossRef]
Figure 1.
Geographic location of the five sampling sites of C.maritimum along the Tunisian coast (Tabarka, Cap Negro, Bizerte, Haouaria, and Monastir).
Figure 1.
Geographic location of the five sampling sites of C.maritimum along the Tunisian coast (Tabarka, Cap Negro, Bizerte, Haouaria, and Monastir).
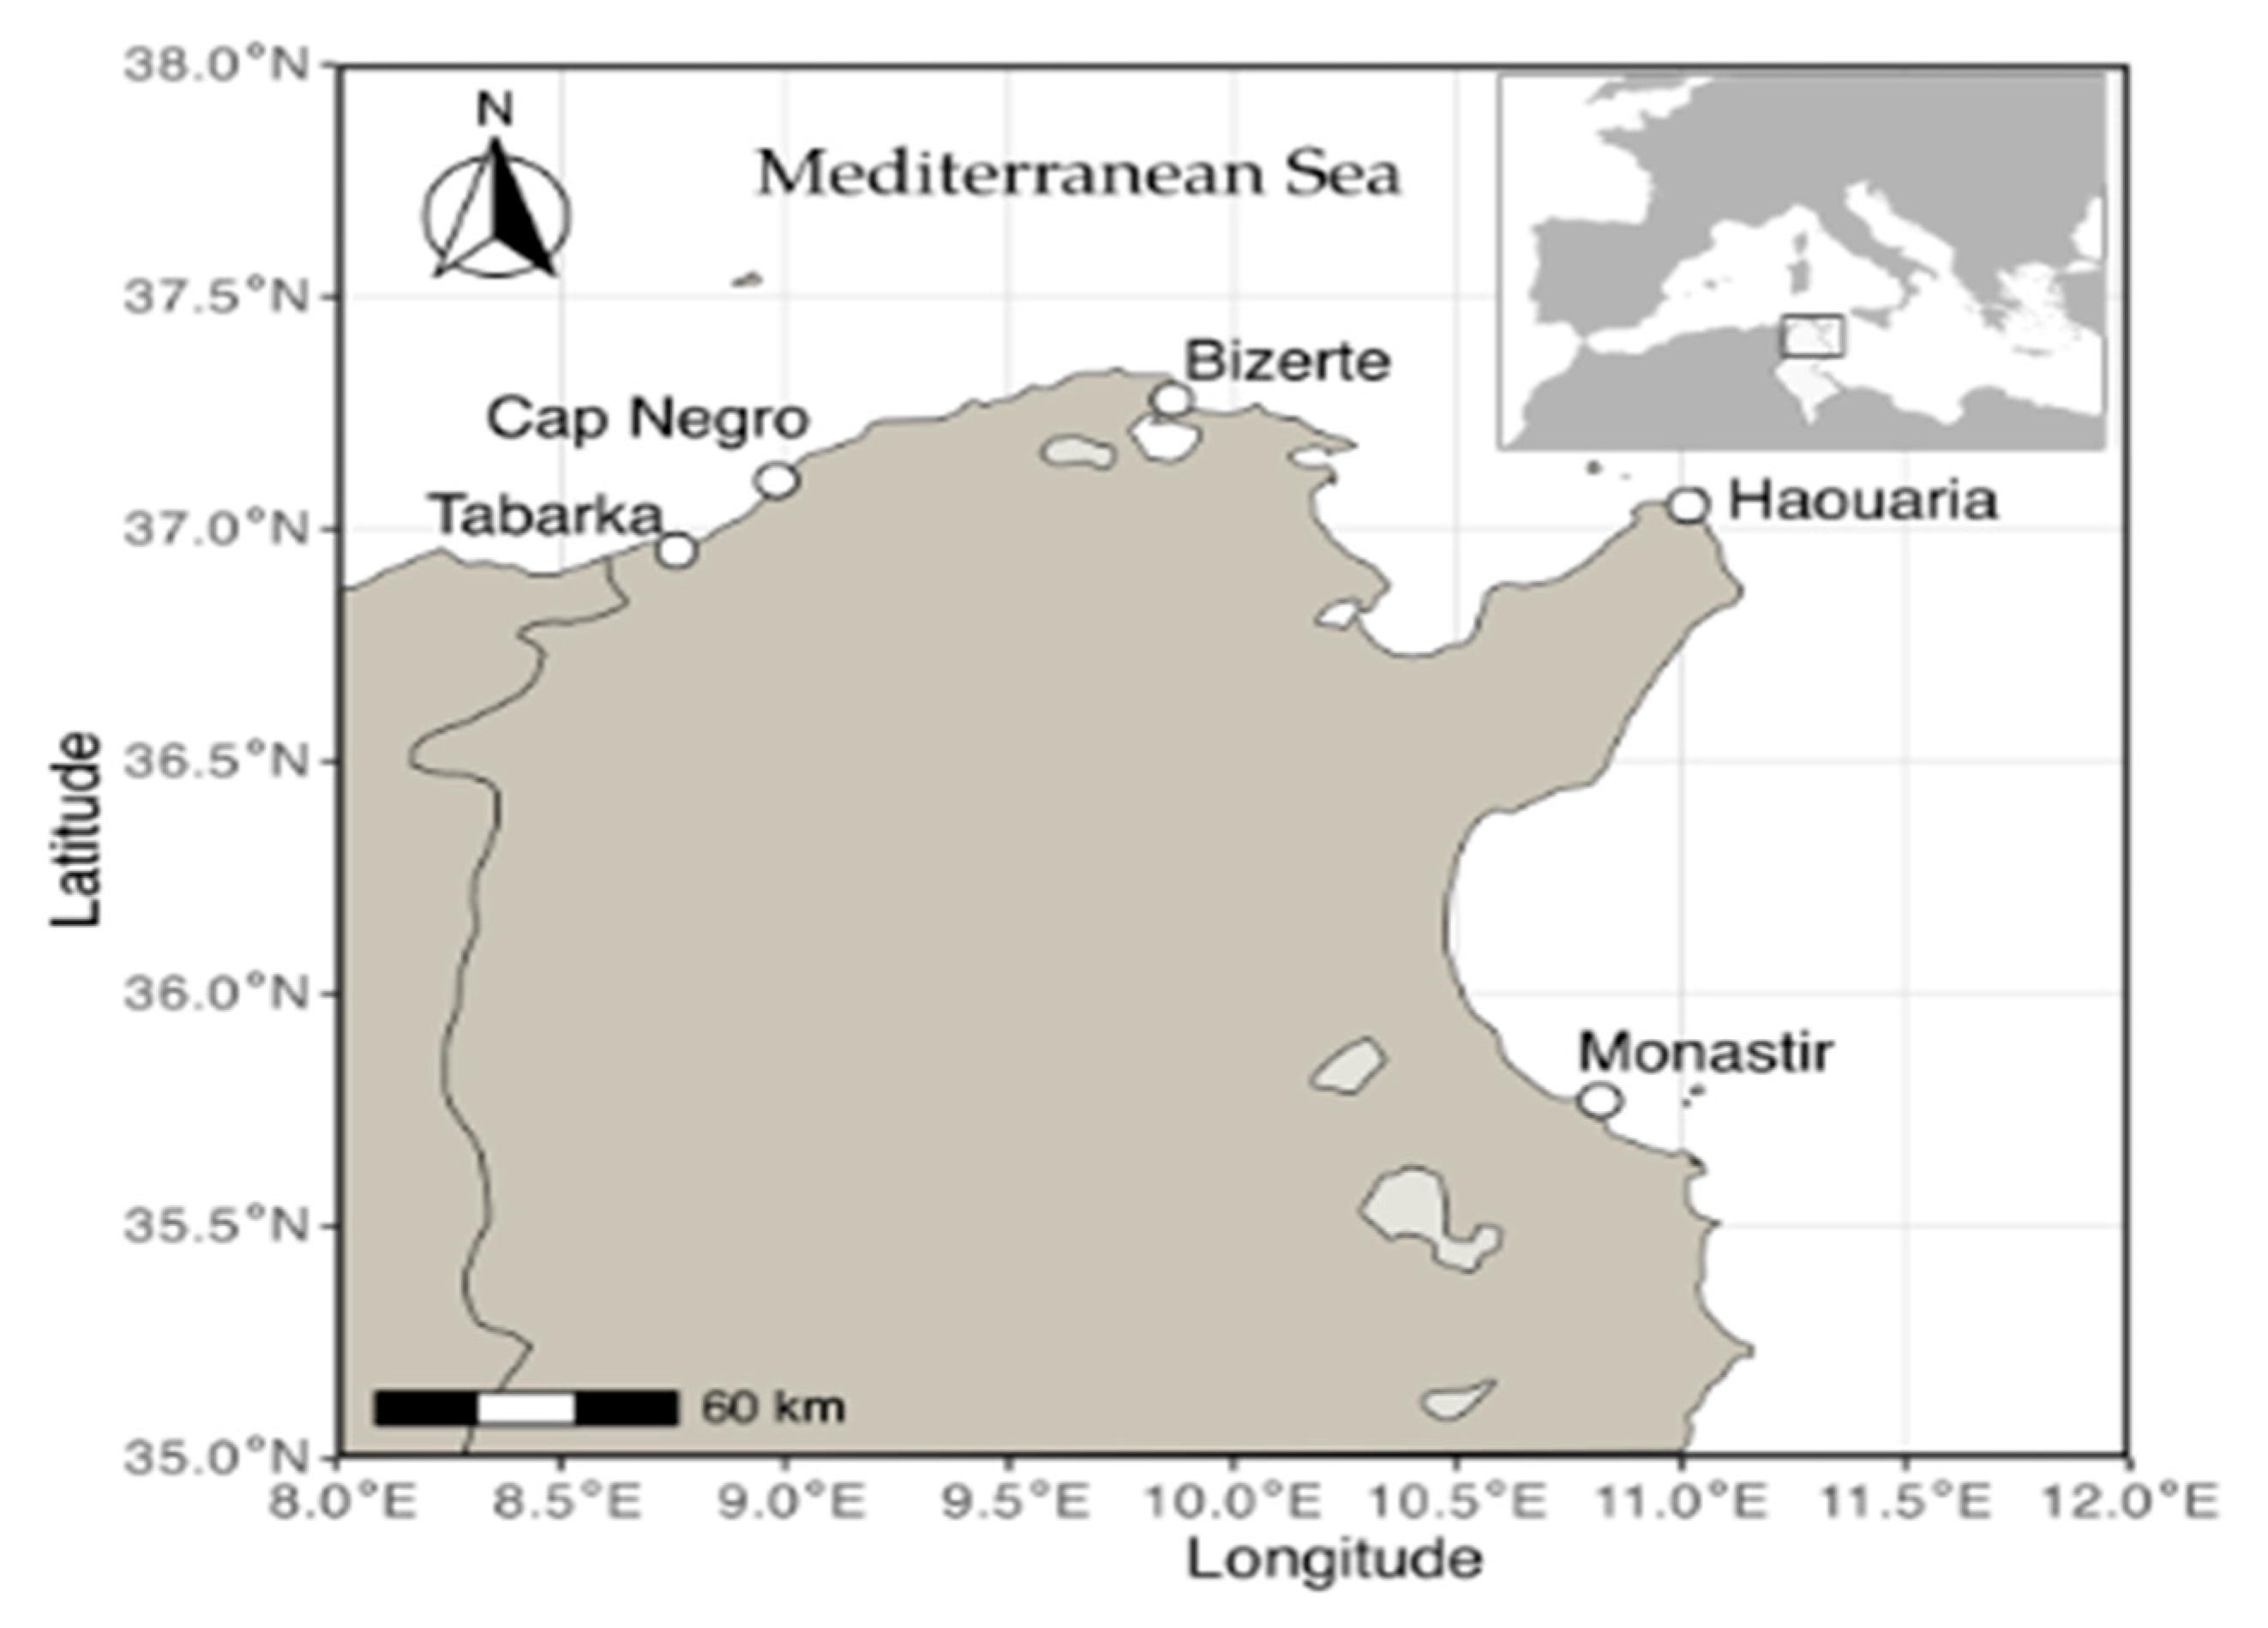
Figure 2.
Herbivory Pressure on C. maritimum Populations. Mean percentage of herbivore damage across the five study sites. Sites are separated into Low- (Tabarka, Bizerte) and High-Herbivory (Haouaria, Monastir, Cap Negro) groups. The width of each violin plot refers to the density of occurrence data points, and the boxes indicate the interquartile range. Different letters indicate statistically significant differences (p≤0.05).
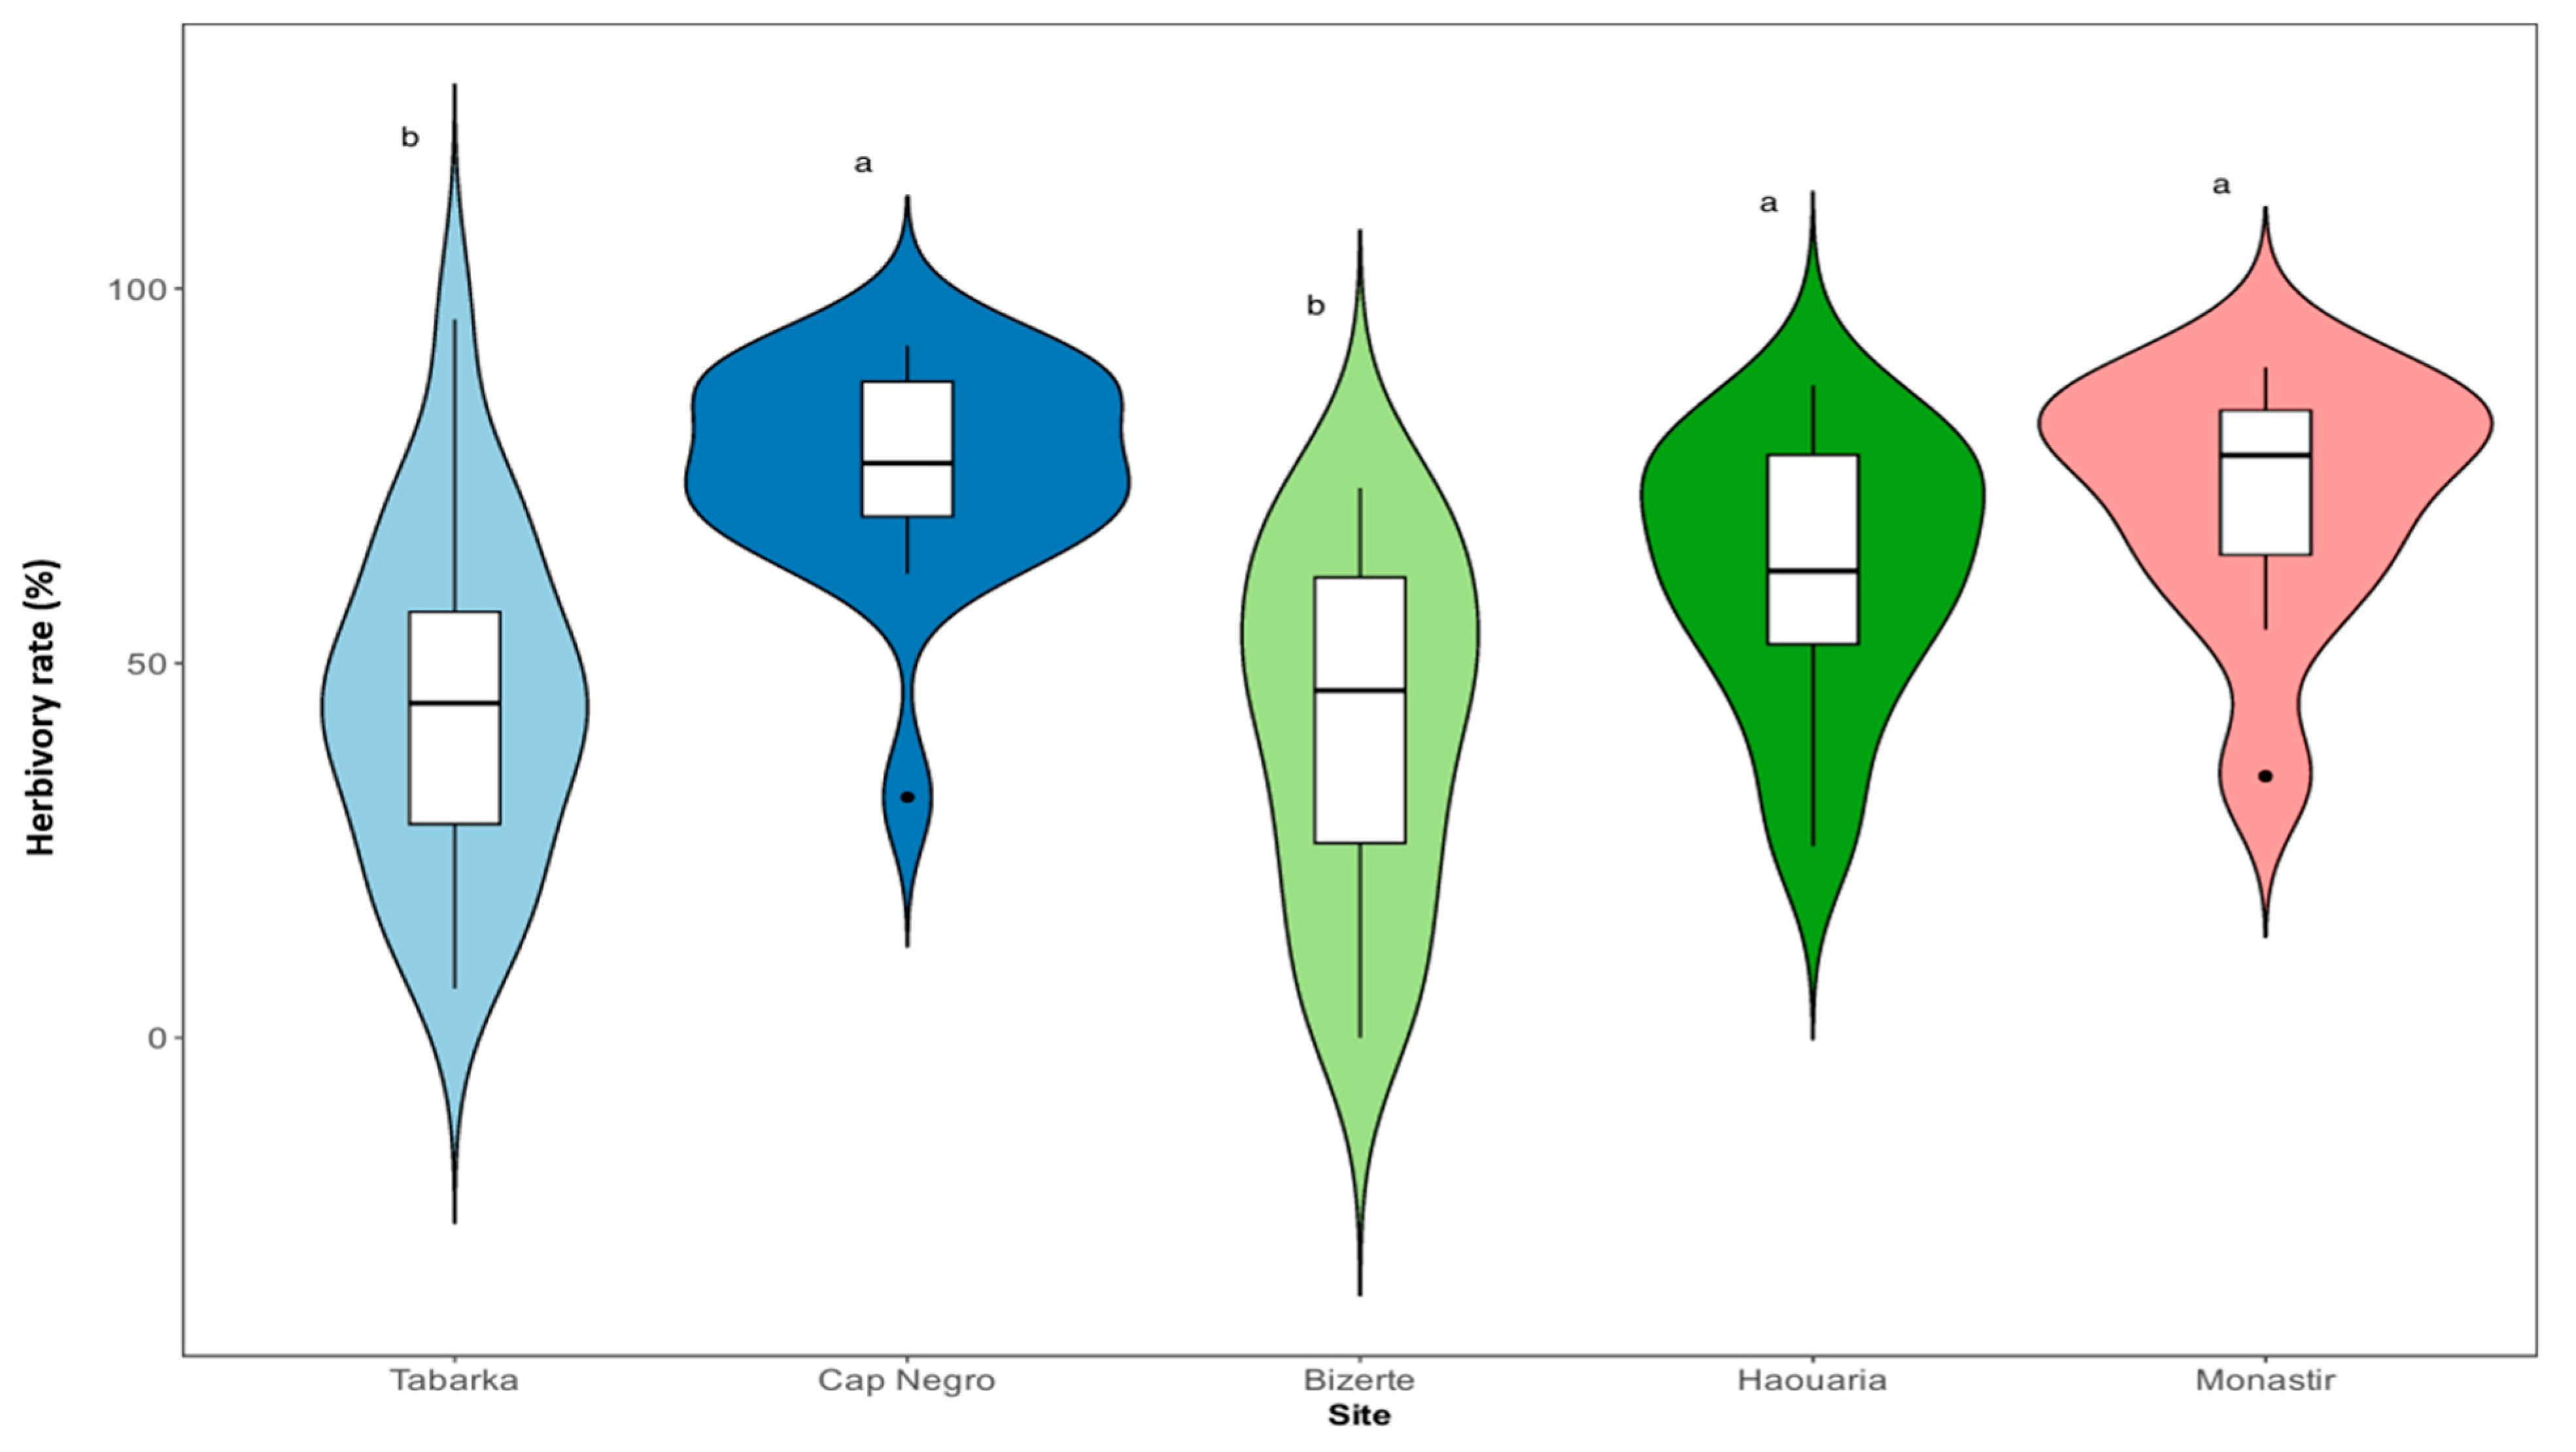
Figure 3.
Spearman’s rank correlations (ρ) between the number of attacked fruits per plant and morphological traits in low-herbivory sites (A) and high-herbivory sites (B). Bars are blue for positive and green for negative correlations; values inside bars are ρ. Asterisks denote significance: * = p < 0.05; ** = p < 0.01; *** = p < 0.001.
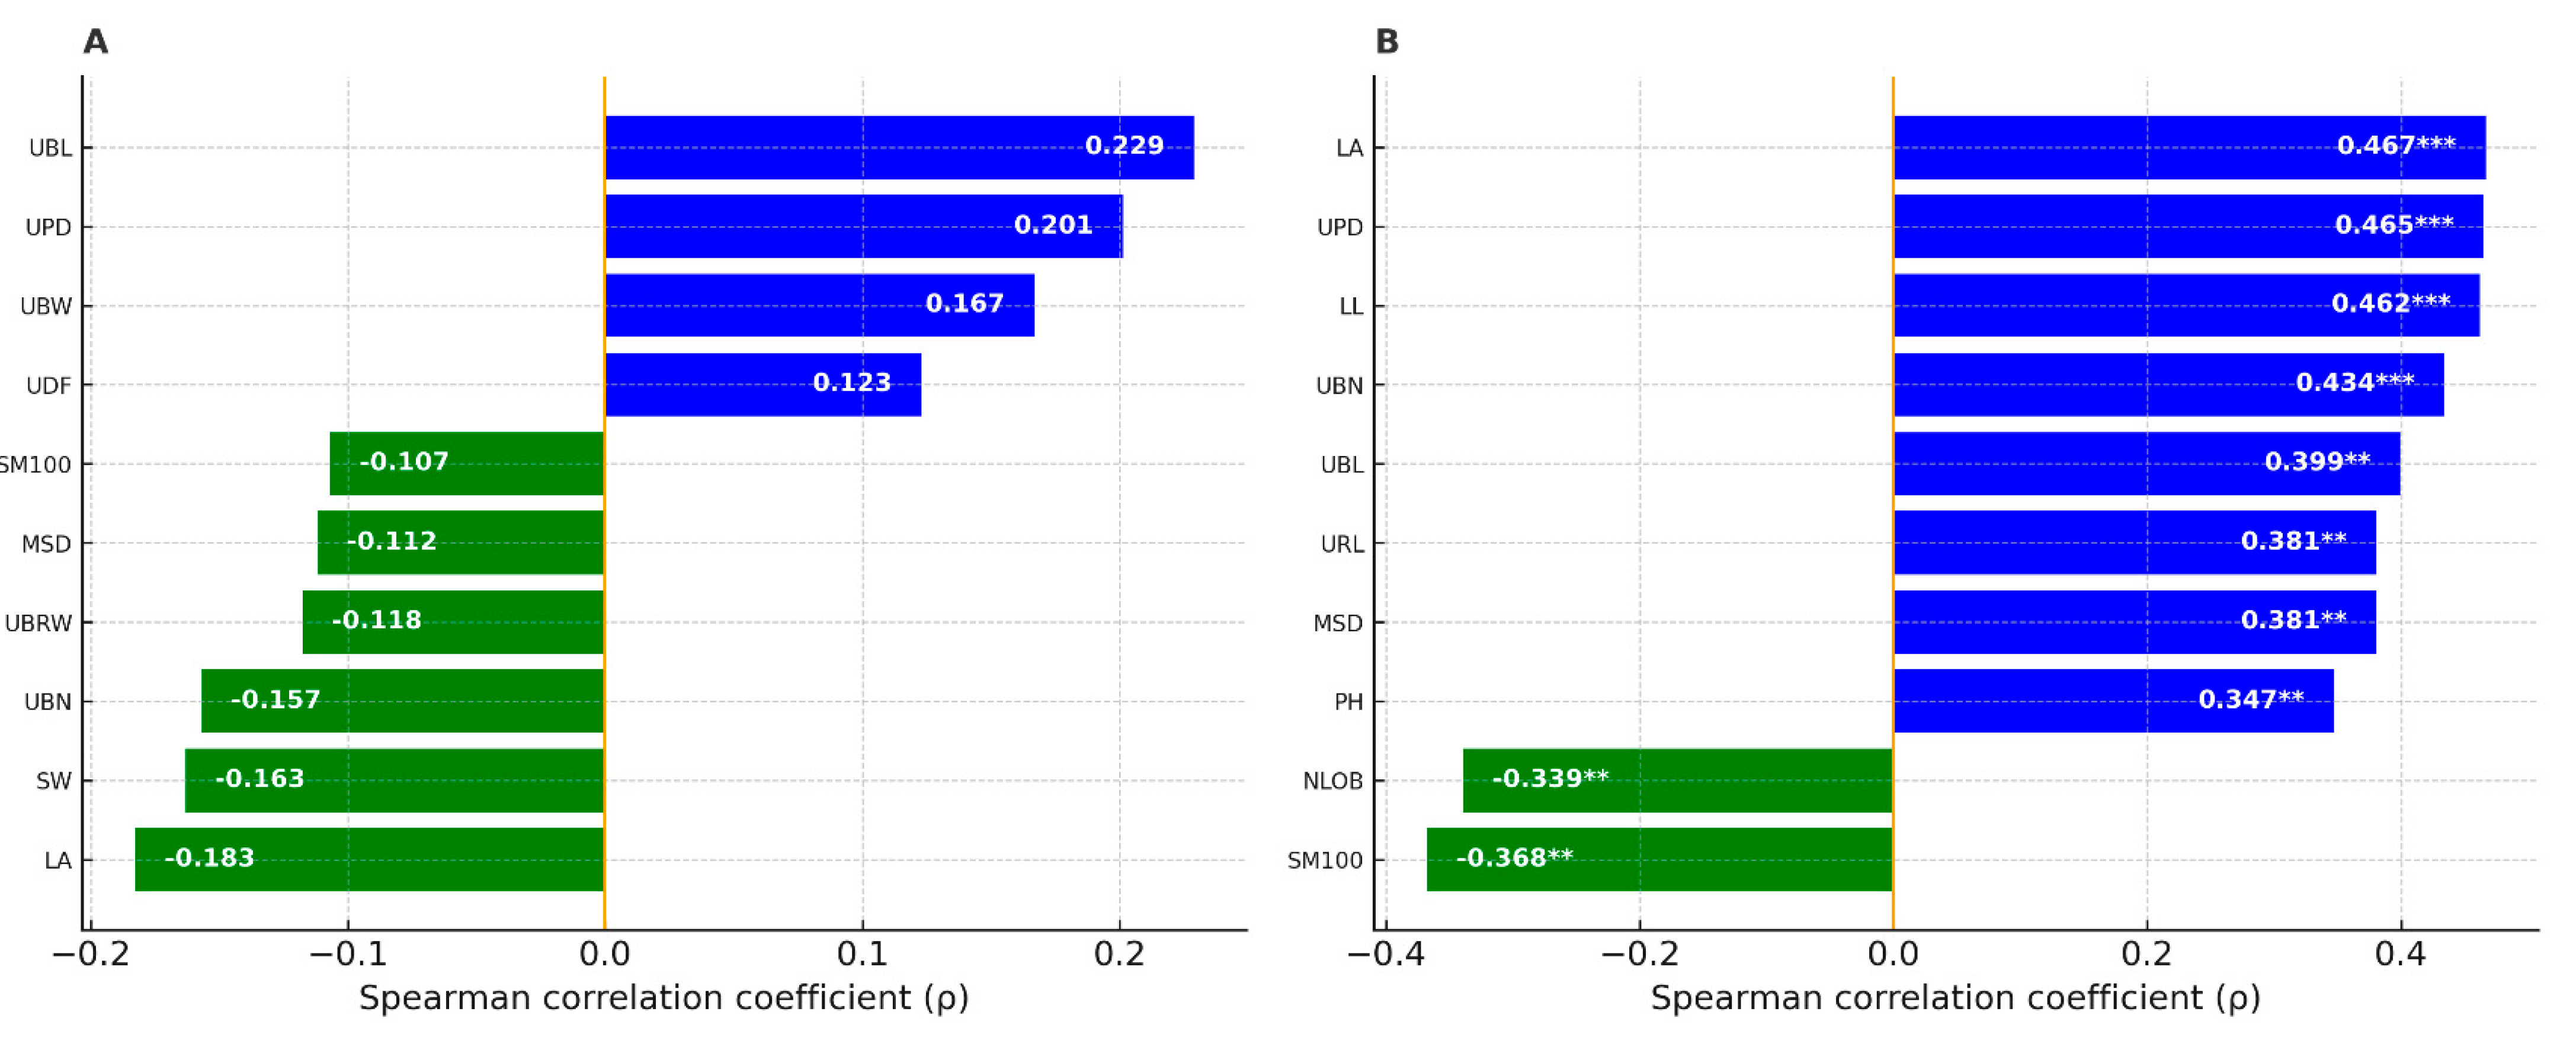
Figure 5.
Radar plot showing the average macro-element composition (mg·g⁻¹ DW) of C.maritimum populations under contrasting herbivory levels.
Figure 5.
Radar plot showing the average macro-element composition (mg·g⁻¹ DW) of C.maritimum populations under contrasting herbivory levels.
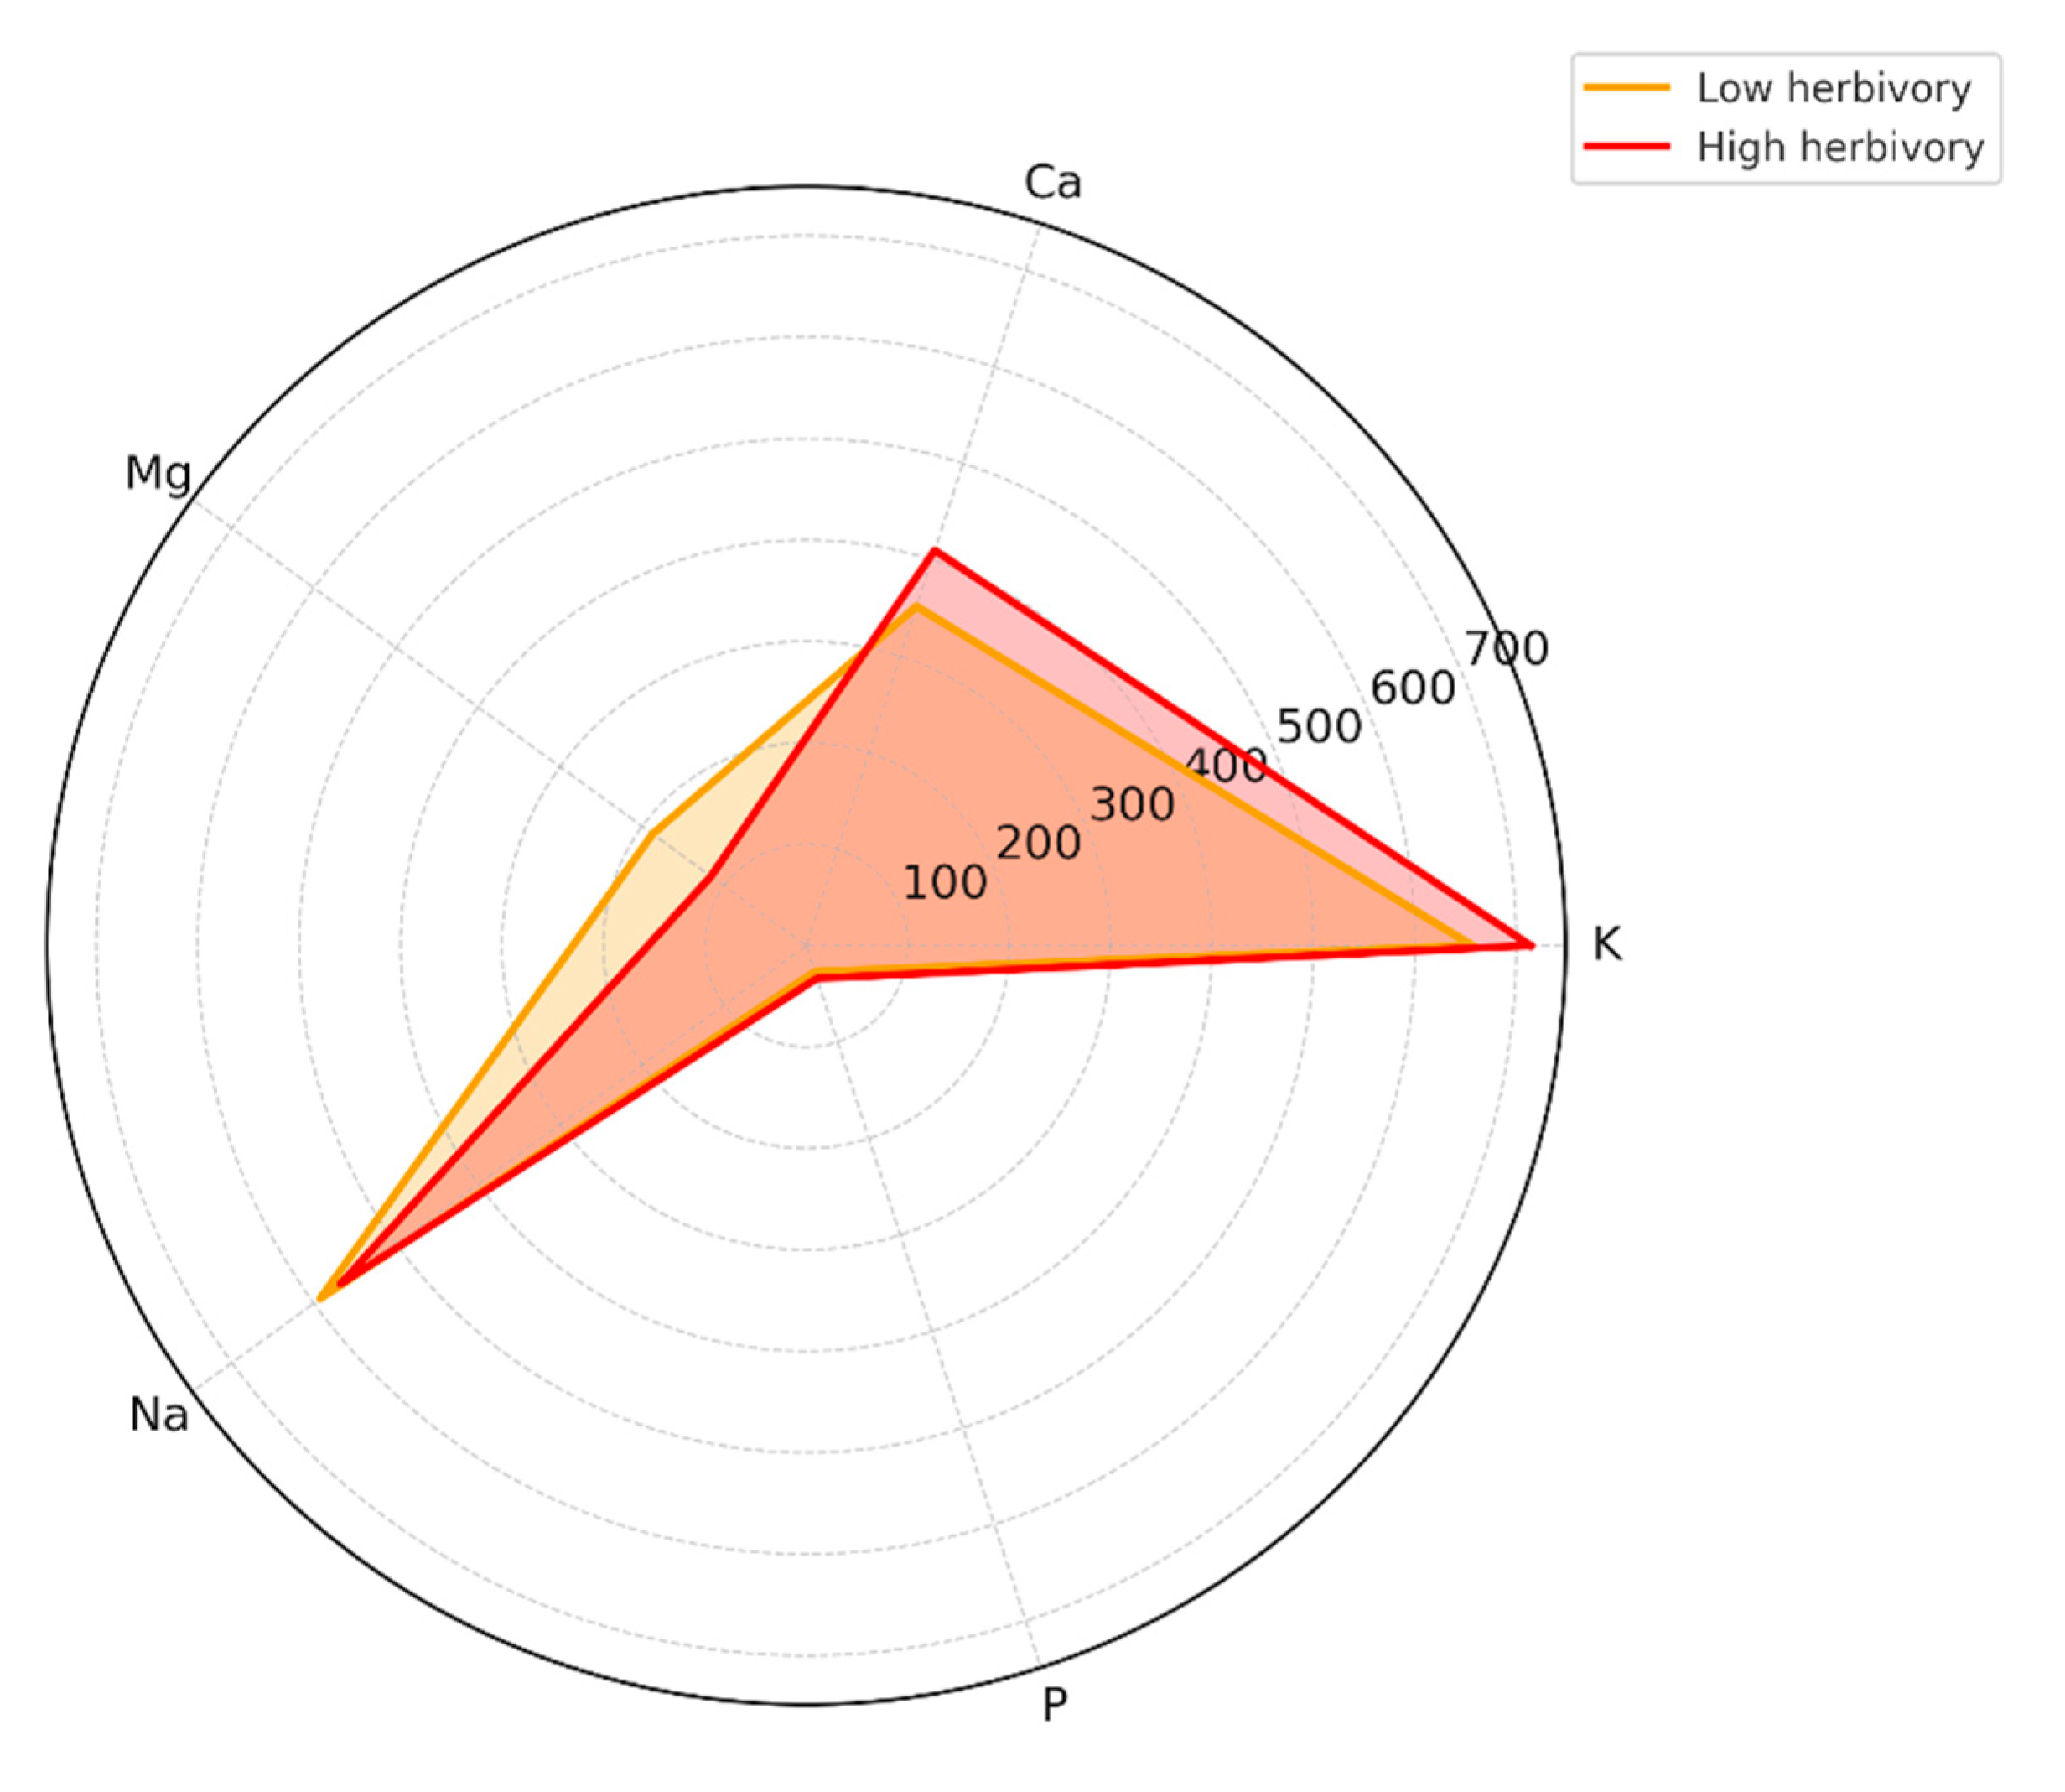
Figure 6.
PCA of the lipophilic fraction of C. maritimum under contrasting herbivory pressure. (A) PCA scores based on GC–MS relative abundances, symbols indicate organ (seeds, umbels) and sites group by herbivory level (low: Tabarka, Bizerte; high: Cap Negro, Haouaria, Monastir). PC1 and PC2 explain 46.8% and 18.0% of the variance, respectively. (B) PCA loadings highlighting sterols and terpenes along PC1 and saturated fatty acids and apiol along PC2.
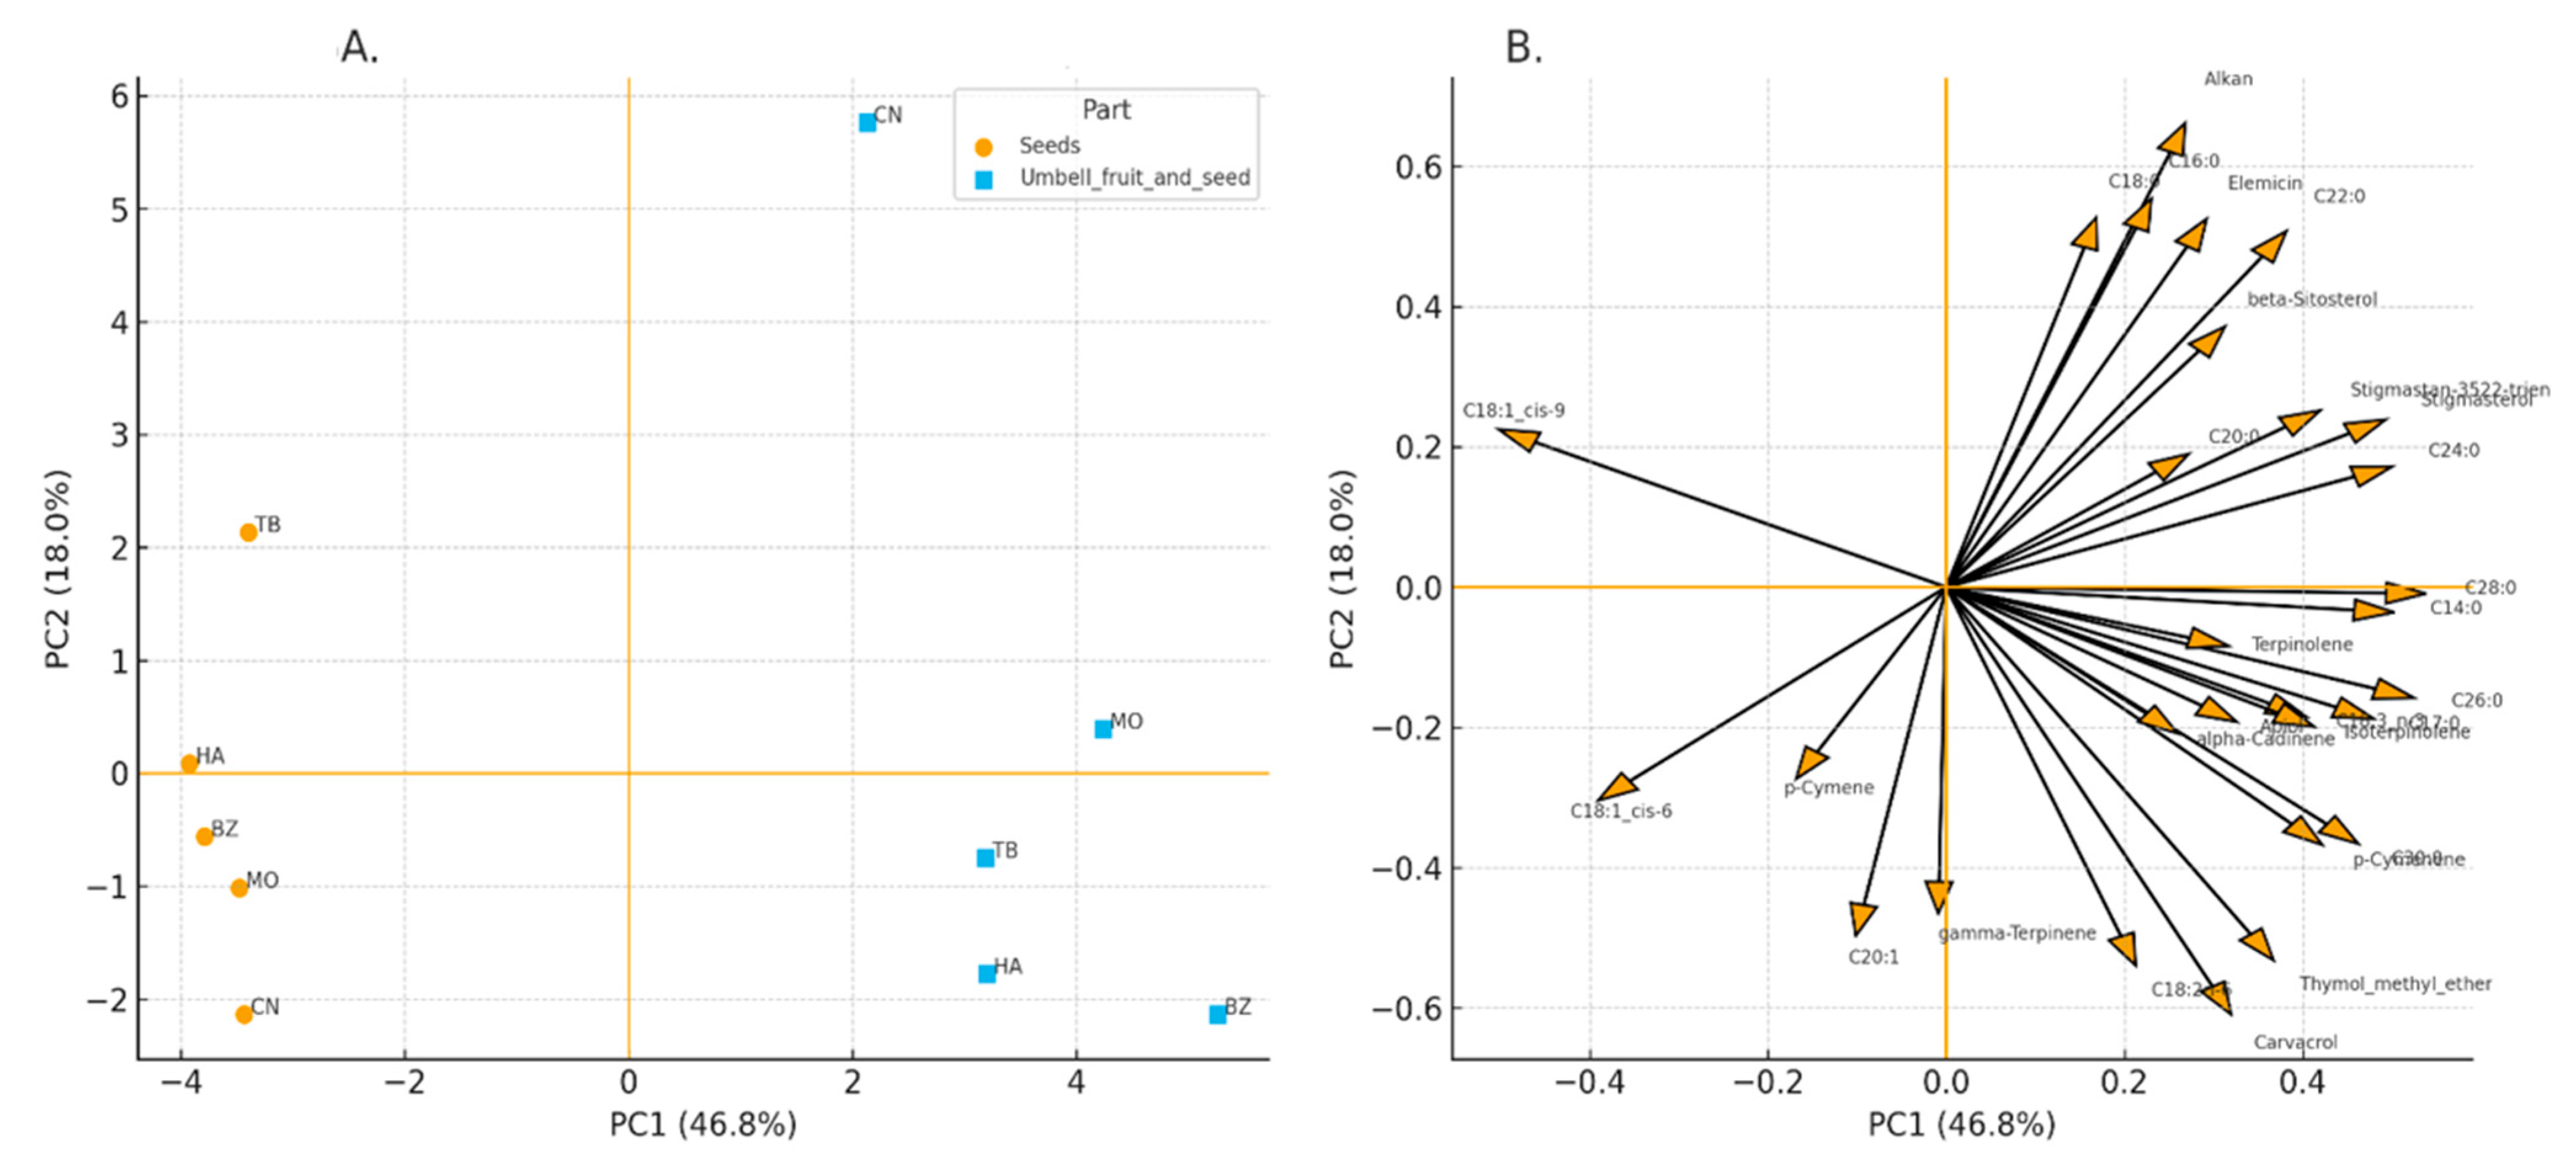
Figure 7.
PLS-DA of the lipophilic fraction of C. maritimum under contrasting herbivory pressure. (A) PLS-DA scores plot showing clear discrimination between low- (Tabarka, Bizerte) and high-herbivory (Cap Negro, Haouaria, Monastir) populations. (B) VIP scores (top 12 compounds) identifying the main discriminants, with α-cadinene, linoleic acid (C18:2 n-6), C17:0, C20:1, and palmitic acid (C16:0) emerging as the most influential variables (VIP > 1).
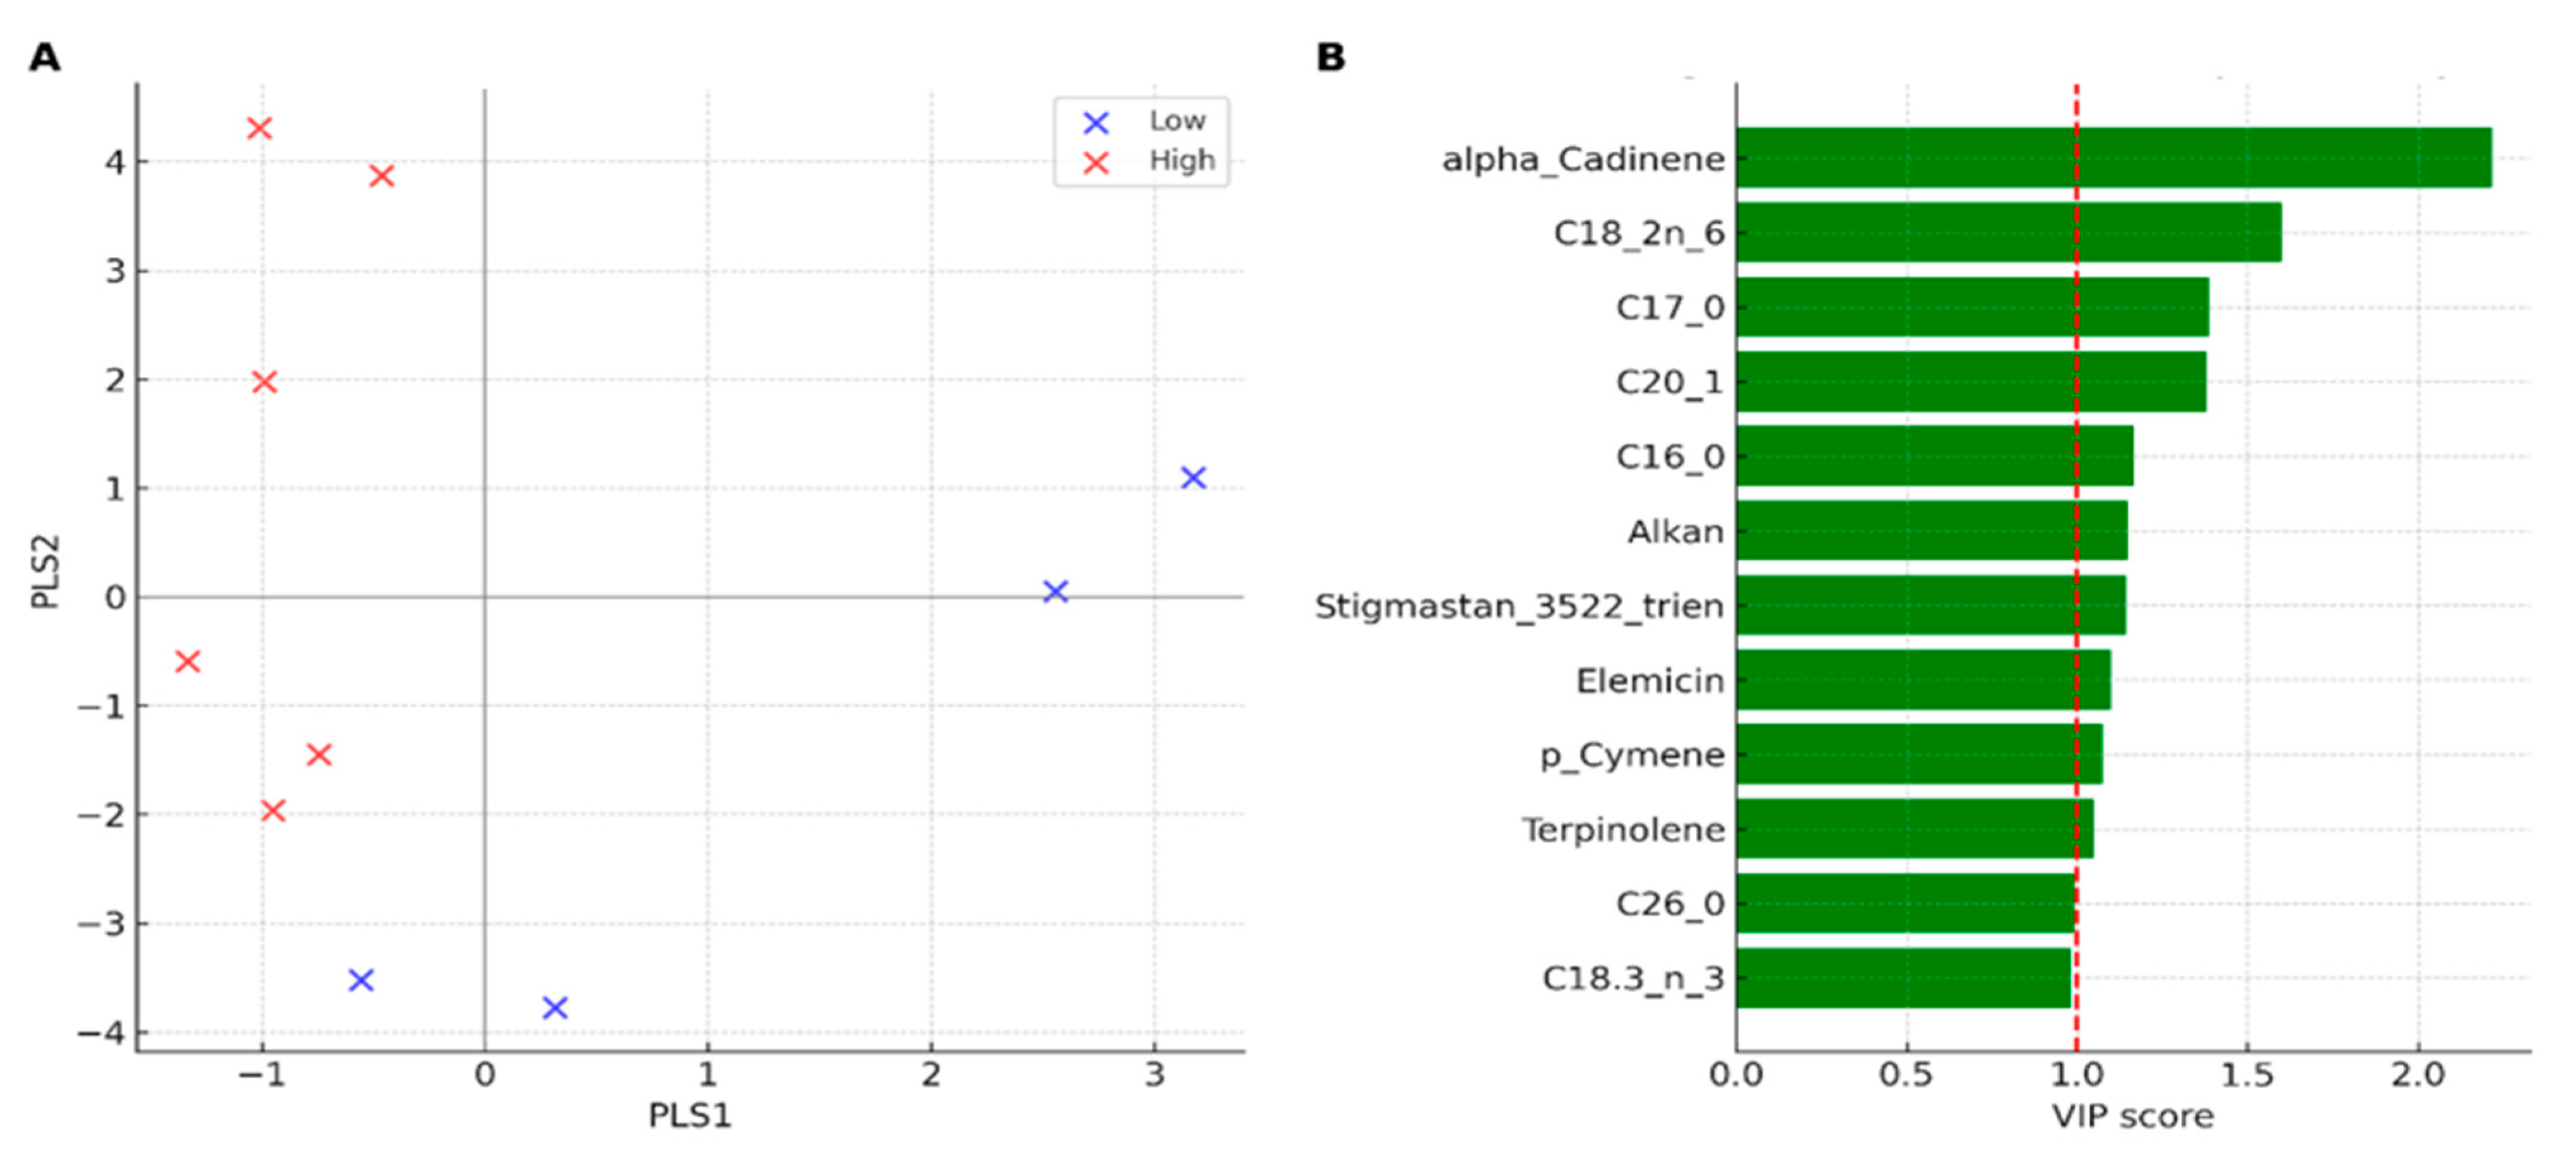
Figure 8.
Hierarchical clustering analysis (HCA) and heatmap of discriminant lipophilic compounds (VIP > 1.0). Rows represent sites (low-herbivory: Tabarka, Bizerte; high-herbivory: Cap Negro, Haouaria, Monastir), and columns represent the most discriminant compounds identified by PLS-DA. Clustering clearly separates low- and high-herbivory populations, with Monastir showing a distinct lipophilic signature within the high-herbivory group.
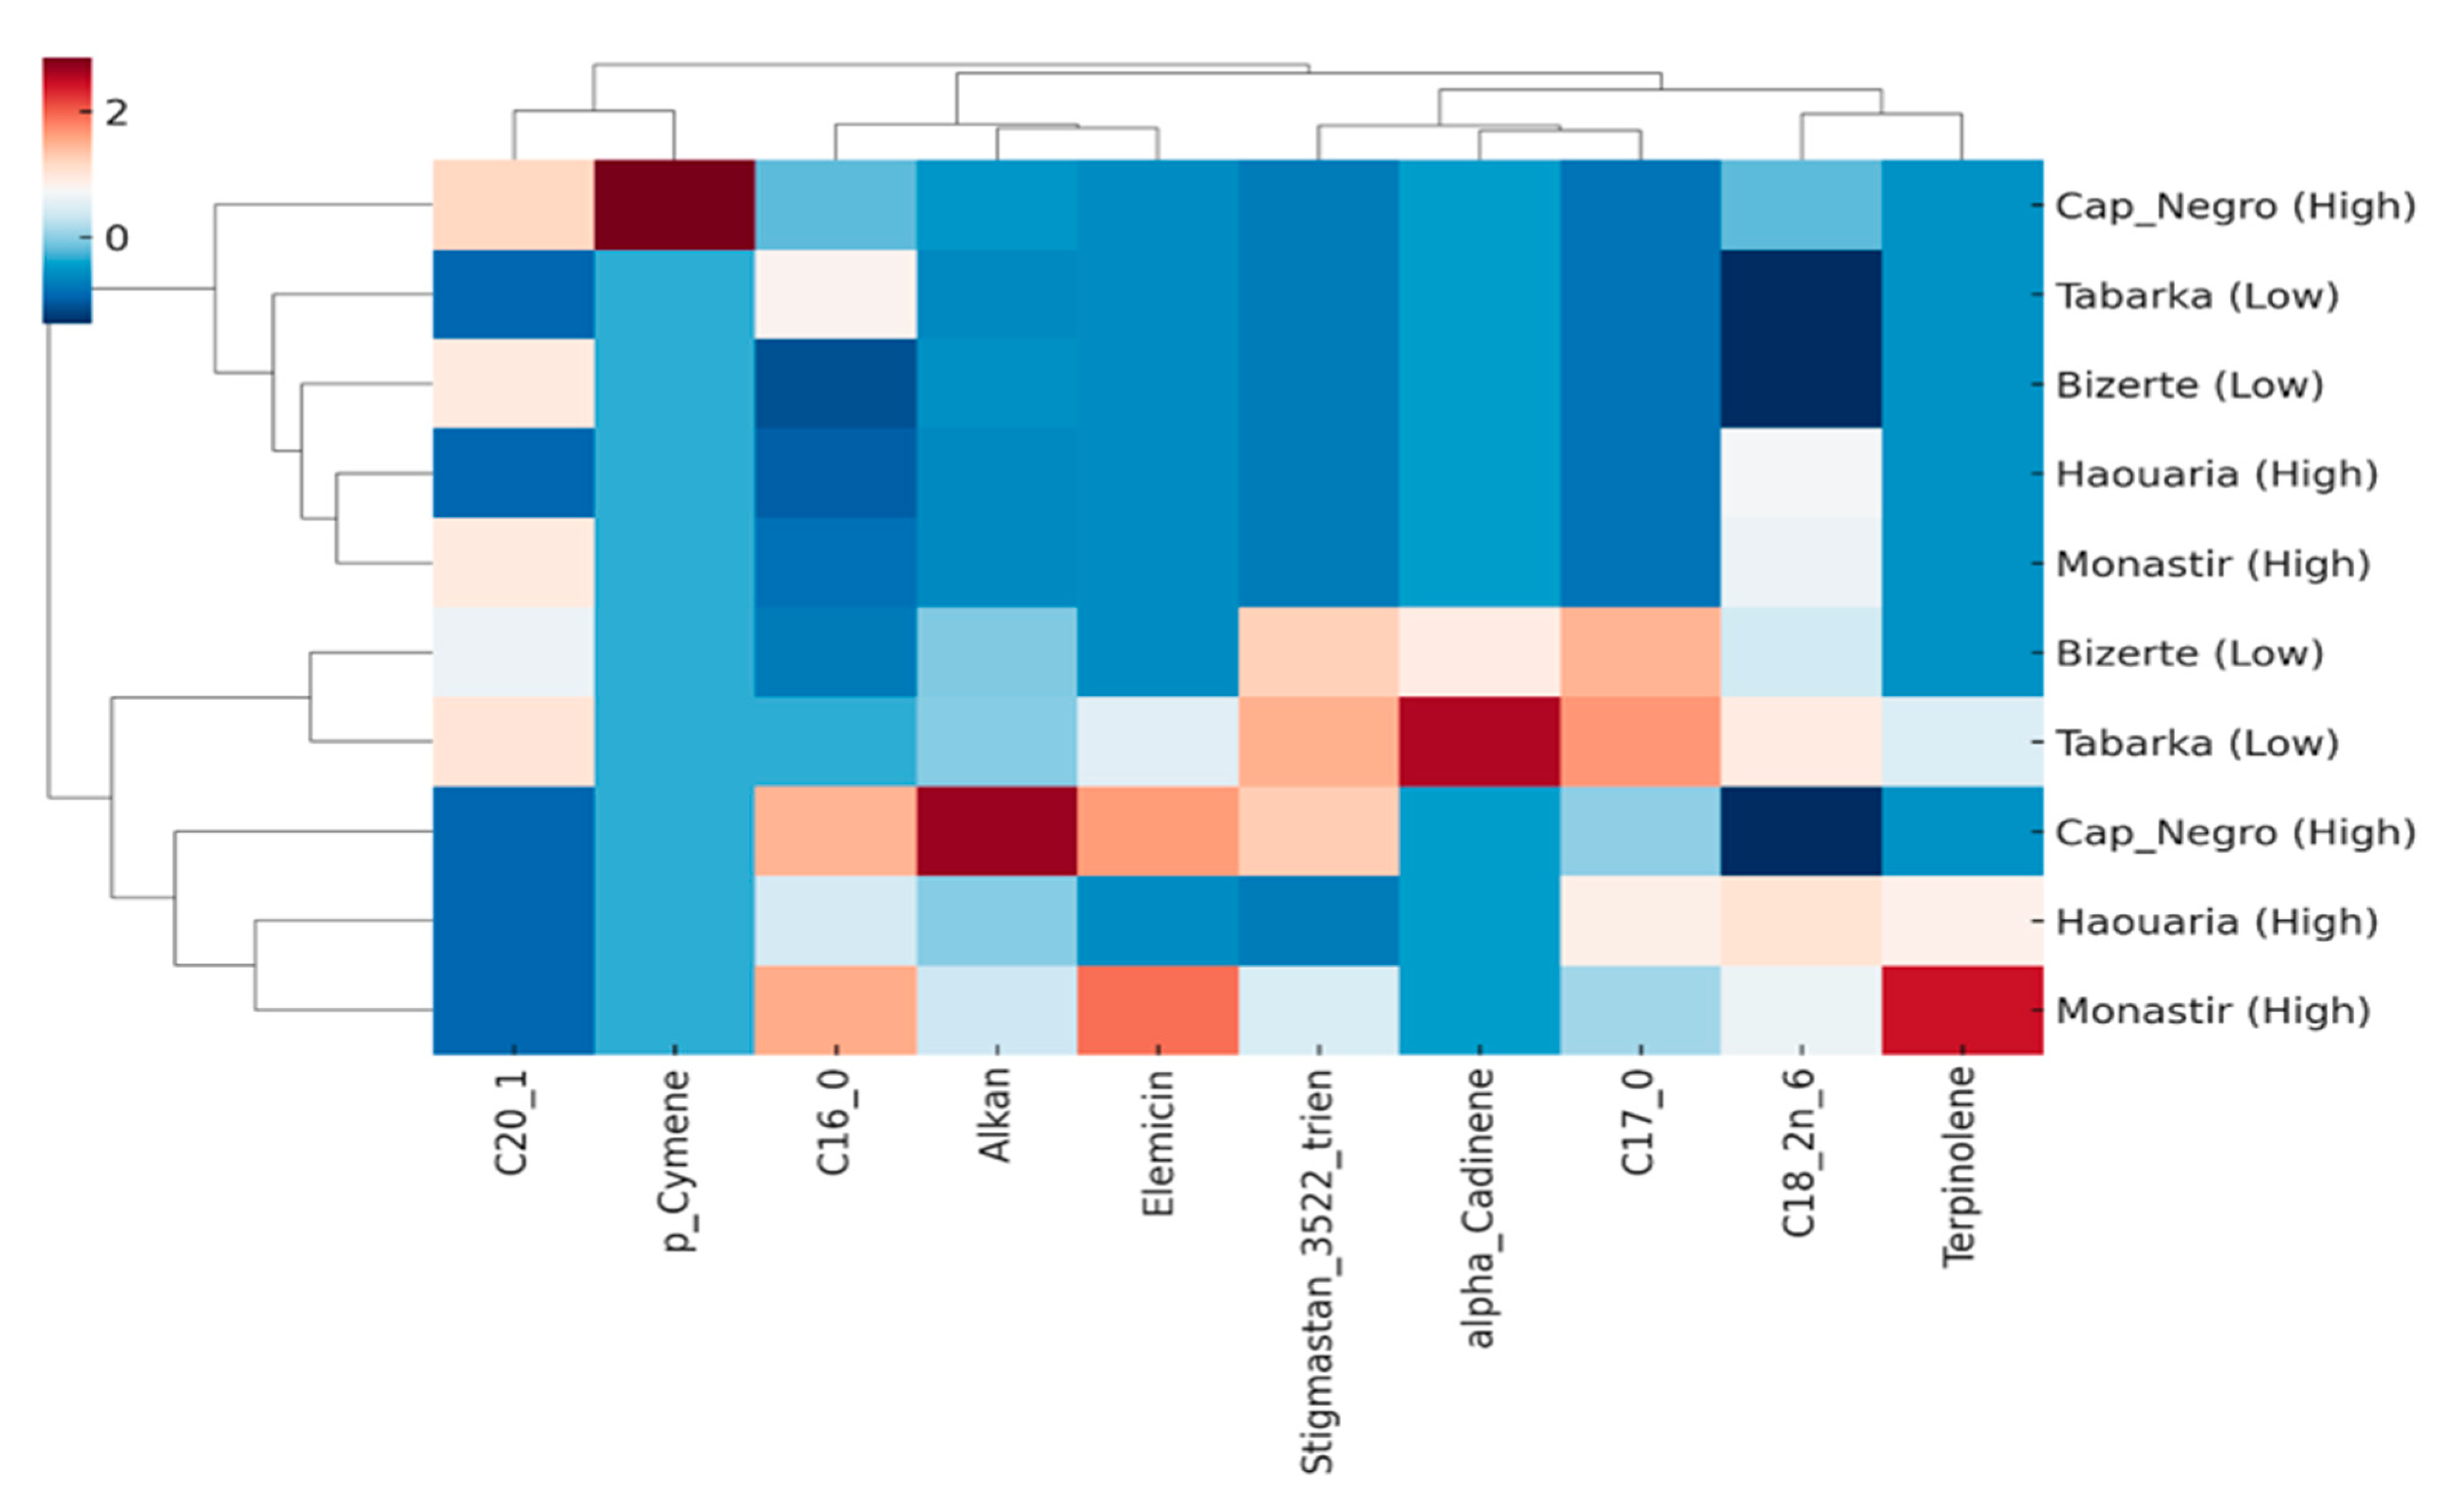
Figure 9.
Integrative multivariate analysis of herbivory-related traits and bioclimatic context. (A) Variance partitioning showing the unique and shared contributions of herbivory pressure and bioclimatic tier to the variance in trait composition. (B) dbRDA ordination of site means, with points colored by herbivory level (Low vs High) and shaped by bioclimatic tier (Sub-humid, Transitional, Semi-arid). Trait vectors indicate the main discriminant variables. (C) Heatmap and hierarchical clustering of z-scored discriminant traits (morphological, biochemical, mineral, and lipophilic), showing consistent grouping of sub-humid low-herbivory versus semi-arid high-herbivory populations, with Cap Negro in an intermediate position.
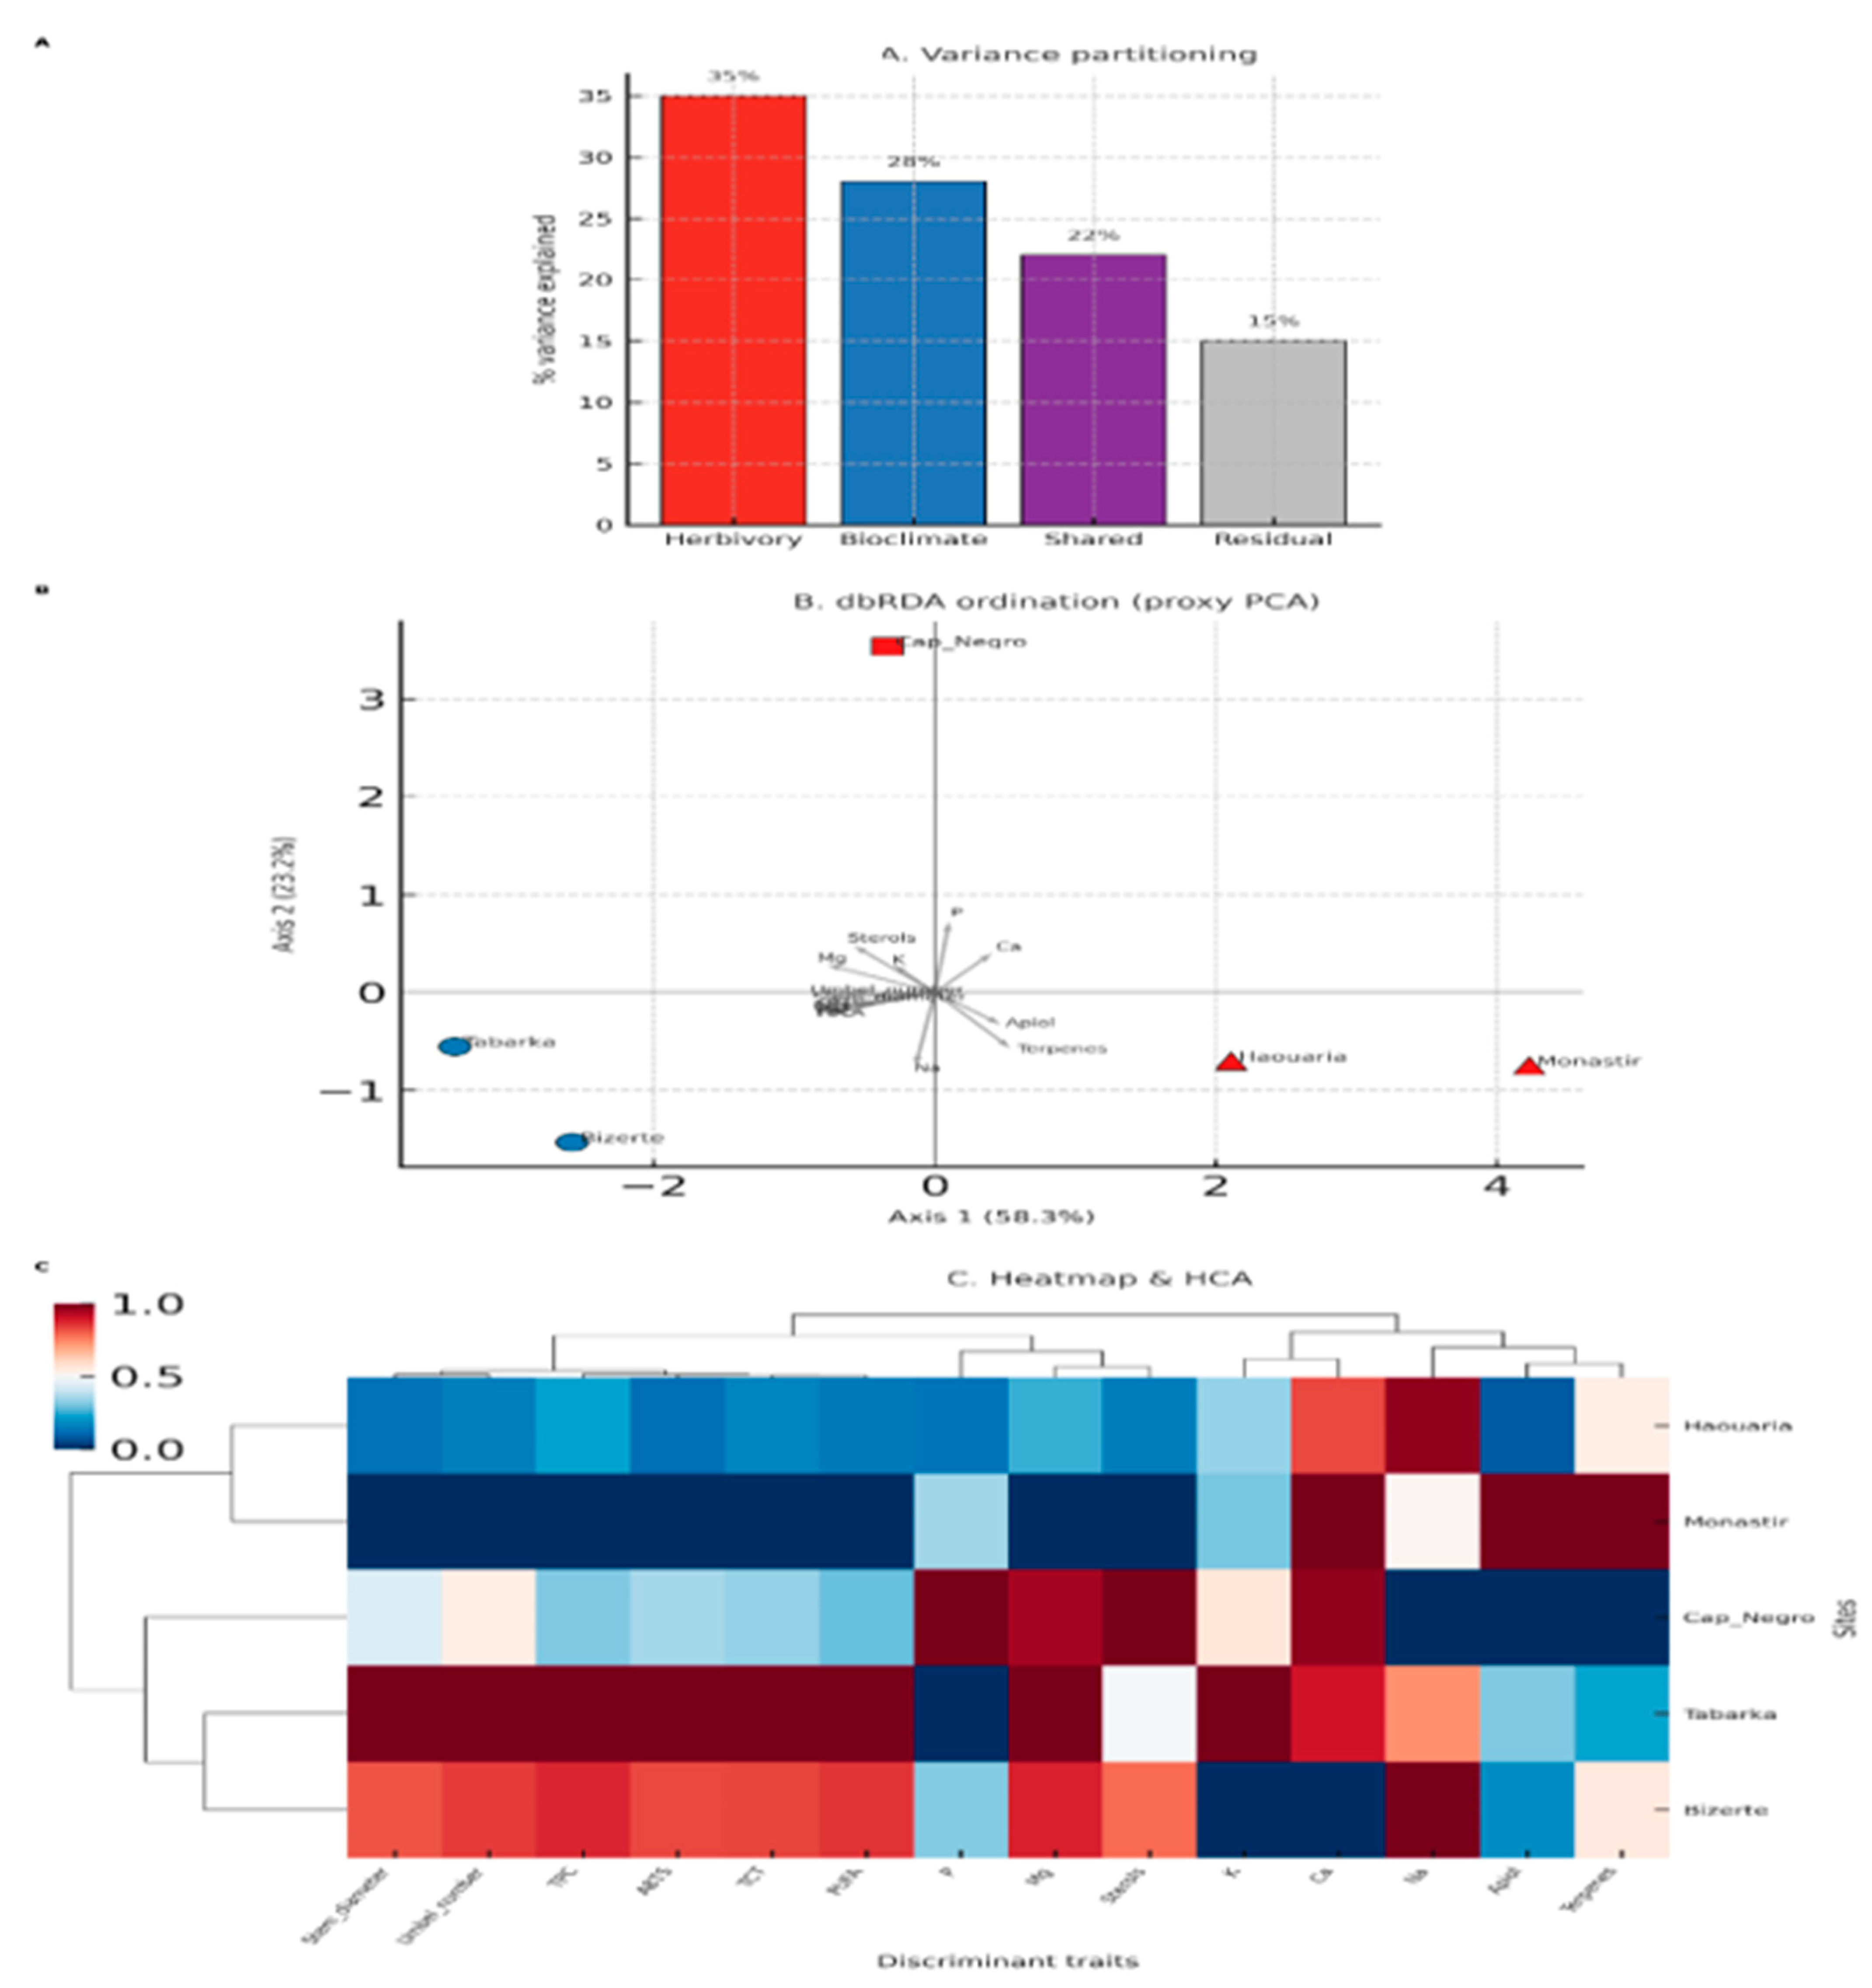
Figure 4.
Effect of herbivory on biochemical traits in the Low and High groups. Heatmap shows site-level mean TPC, TCT, DPPH, and ABTS values for four organs (Leaf, Flower, Stem, Umbell (fruit and seed)). Columns represent sites grouped as Low (Tabarka, Bizerte) and High (Cap Negro, Haouaria, Monastir). Warmer colors indicate higher mean values; numeric annotations correspond to the exact site-level means.
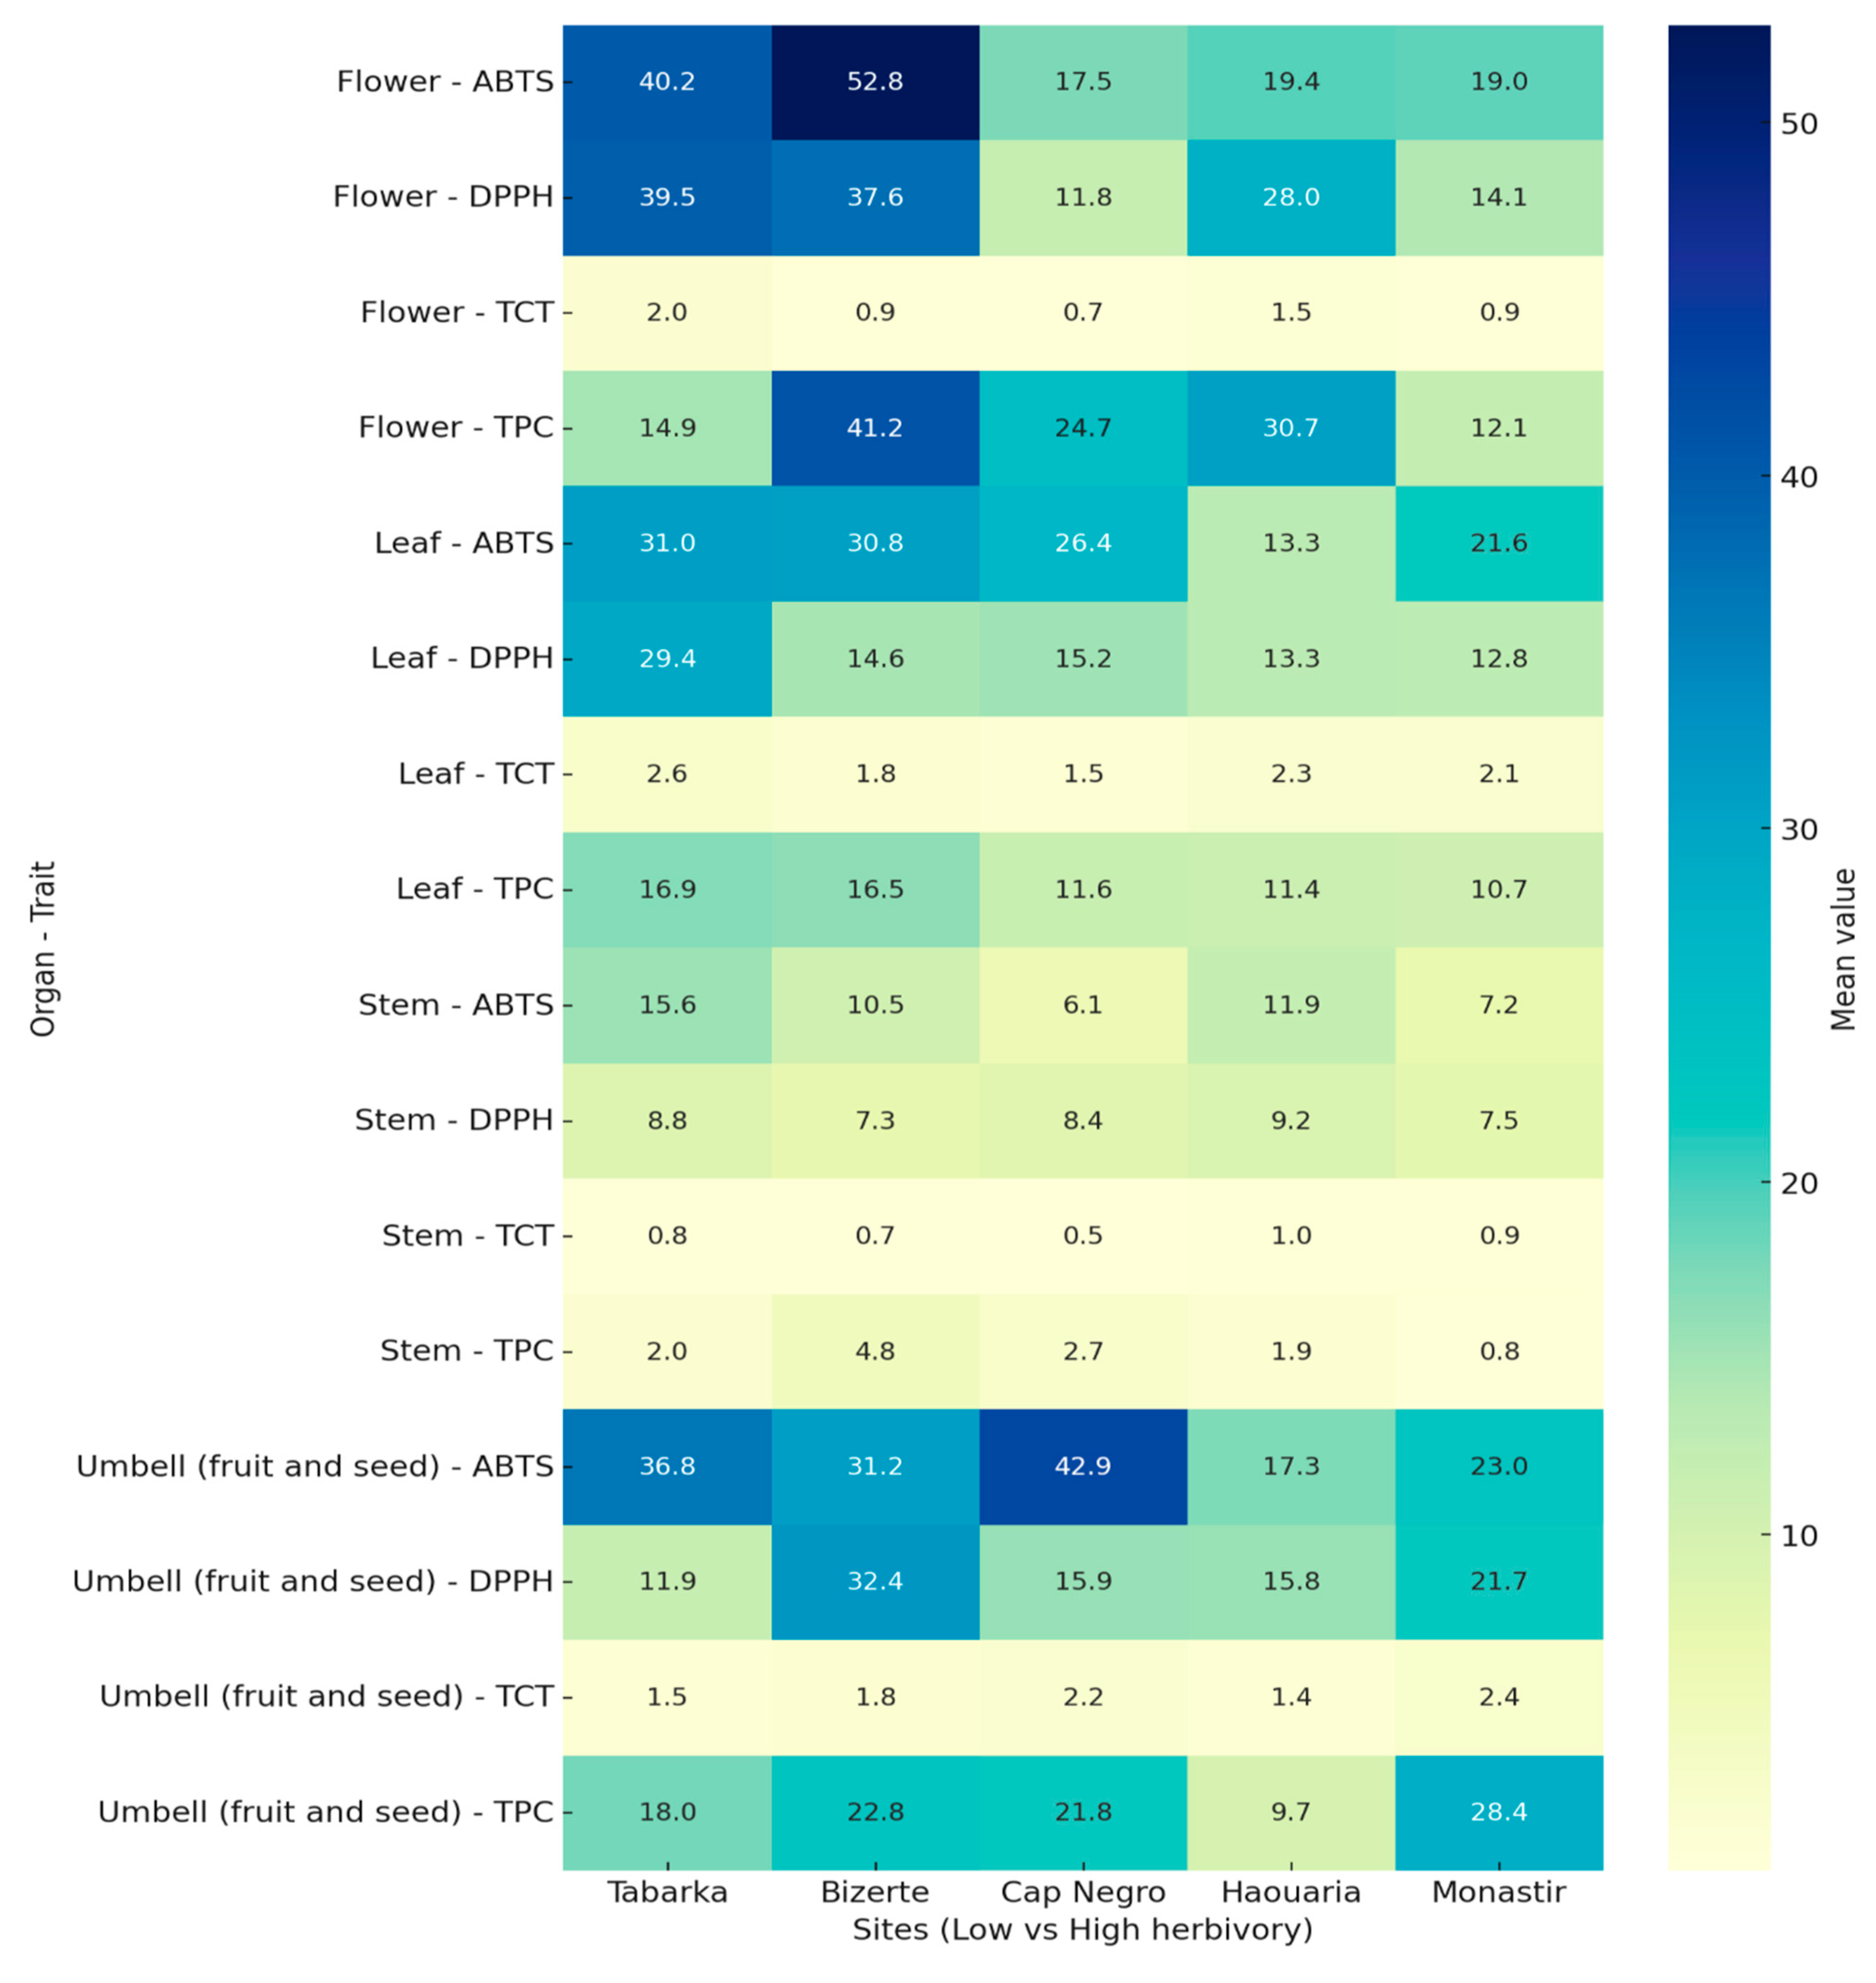
Table 1.
Geographic coordinates and altitudes of the sampling sites of C.maritimum along the Tunisian coastline.
Table 1.
Geographic coordinates and altitudes of the sampling sites of C.maritimum along the Tunisian coastline.
| Site | Latitude ° | Longitude ° | Altitude (m a.s.l.) | Mean annual temperature (°C) | Mean annual precipitation (mm) |
|---|---|---|---|---|---|
| Tabarka | 36,954 | 8,758 | 5 | 18.8 | 1010 |
| Cap Negro | 37,104 | 8,982 | 0 | 18.6 | 948 |
| Bizerte | 37,278 | 9,864 | 5 | 19 | 571 |
| Haouaria | 37,05 | 11,014 | 21 | 19.7 | 481 |
| Monastir | 35,769 | 10,819 | 10 | 20.6 | 383 |
“Climatic data are averages from INM/INS (2015–2023) for Bizerte, Haouaria, Monastir, and Tabarka. Cap Negro values are proxies from Tabarka, reported by UNEP/MAP (long-term INM data).”.
Table 2.
Description of the morphological trait groups evaluated in C. maritimum.
| Trait Group | Recorded Traits (Abbreviations and Units) |
|---|---|
| Whole-Plant Traits | Height (PH,mm), length (PL, mm), and width (PW,mm). |
| Stem Traits | Main stem diameter (MSD, mm). |
| Leaf Traits | Length (LL, mm), width (LW, mm), number of lobes (NLOB), projected leaf area (LA, mm²), Montgomery shape factor (ks)*, average lobe area (ALOB)** |
| Umbel Traits | Peduncle length (UPL, mm), peduncle diameter (UPD, mm), number of rays (URN), length of rays (URL, mm), thickness of the rays (URT, mm), number of bracts forming the involucre (UBN), length of bracts (UBL, mm), width of individual bracts (UBW, mm). |
| Umbellet Traits | Number of pedicels for the secondary clusters (UNPED), number of bracteoles forming the involucel (UNBR), length of bracteole (UBRL, mm), width of bracteole (UBRW, mm) |
| Seed Traits | Seed length (SL, mm), seeds width (SW, mm), surface area (mm²), perimeter (SPER, mm), weight of 100 seeds (SM100, g). |
* ks is calculated using the formula LA / (LL × LW); ** ALOB = LA/ NLOB [24].
Table 3.
Herbivory rates across sites and classification into herbivory groups.
| Site | Herbivory Rate (%) | Herbivory Group |
|---|---|---|
| Tabarka | 51,08 | Low |
| Bizerte | 54,92 | Low |
| Haouaria | 68,81 | High |
| Monastir | 70,64 | High |
| Cap Negro | 73,23 | High |
Mean herbivory rate (%) and corresponding group classification.
Table 6.
Relative abundance (mean ± SD, %) of selected lipophilic classes in C. maritimum organs across sites. Different letters indicate significant differences among sites according to Tukey’s test (p < 0.05).
Table 6.
Relative abundance (mean ± SD, %) of selected lipophilic classes in C. maritimum organs across sites. Different letters indicate significant differences among sites according to Tukey’s test (p < 0.05).
| Site | Sterols | Terpenes | Apiol |
|---|---|---|---|
| Tabarka | 1.39ᵃ ± 1.70 | 0.29ᵃ ± 0.34 | 9.44ᵃ ± 8.10 |
| Bizerte | 1.62ᵃ ± 2.03 | 0.50ᵃ ± 0.46 | 7.99ᵃ ± 4.05 |
| Cap Negro | 1.79ᵃ ± 2.28 | 0.14ᵃ ± 0.12 | 5.85ᵃ ± 2.21 |
| Haouaria | 1.12ᵃ ± 1.33 | 0.49ᵃ ± 0.62 | 6.78ᵃ ± 8.04 |
| Monastir | 1.00ᵃ ± 1.16 | 0.79ᵃ ± 1.05 | 17.42ᵃ ± 0.45 |
Disclaimer/Publisher’s Note: The statements, opinions and data contained in all publications are solely those of the individual author(s) and contributor(s) and not of MDPI and/or the editor(s). MDPI and/or the editor(s) disclaim responsibility for any injury to people or property resulting from any ideas, methods, instructions or products referred to in the content. |
© 2025 by the authors. Licensee MDPI, Basel, Switzerland. This article is an open access article distributed under the terms and conditions of the Creative Commons Attribution (CC BY) license (http://creativecommons.org/licenses/by/4.0/).
Copyright: This open access article is published under a Creative Commons CC BY 4.0 license, which permit the free download, distribution, and reuse, provided that the author and preprint are cited in any reuse.


