1. Introduction
Alzheimer’s disease (AD) and frontotemporal dementia (FTD) are among the most common forms of dementia, both profoundly impairing cognitive and behavioral abilities. AD typically affects both amnestic (learning and memory) and non-amnestic domains (executive function, visuospatial abilities), whereas FTD more often disrupts interpersonal conduct and self-regulation [
1,
2]. Clinically, however, differentiating AD from FTD remains challenging. Both disorders show overlapping patterns of neurodegeneration in the dorsolateral prefrontal cortex and medial temporal lobes, including the amygdala and hippocampus, and behavioral symptoms may overlap, particularly between the behavioral variant of FTD (bvFTD) or primary progressive aphasia and atypical AD [
3,
4]. Although MRI and biomarker assays such as cerebrospinal fluid (CSF) and positron emission tomography (PET) can aid diagnosis, these methods are costly, invasive, and limited in temporal resolution and early detection.
Electroencephalography (EEG) offers a cost-effective, noninvasive, and widely accessible alternative for assessing brain function. Conventional EEG analyses typically focus on spectral power or functional connectivity, but these approaches have limitations. Functional connectivity shows poor test–retest reliability [
5], while spectral analyses are confounded by baseline correction issues and broadband activity [
6].
In recent years, EEG microstate analysis has emerged as a promising approach to characterizing large-scale brain dynamics during rest [
7]. Microstates are quasi-stable scalp potential configurations lasting tens of milliseconds before rapidly transitioning, thought to reflect the sequential activation of large-scale neural networks [
8]. Canonical microstates (A–D) are associated with distinct topographies, temporal features, and putative cognitive functions [
9]. Importantly, microstate parameters such as duration, occurrence, and coverage demonstrate high test–retest reliability across sessions, montages, and clustering procedures, underscoring their potential as biomarkers [
10].
Several studies have examined EEG microstates in AD and FTD. For example, one study reported shorter microstate C duration in FTD compared with AD and controls [
11]. Another study observed increased microstate B duration in early-onset AD and microstate A duration in FTD, along with reduced occurrences of microstates A–C in early-onset AD and reduced microstate C occurrence in FTD [
12]. Also, another study found that semantic dementia patients lacked the typical microstate C but exhibited an atypical microstate E [
13].
Despite these findings, methodological shortcomings limit interpretation. Many prior studies did not apply grand mean fitting or achieved less than 80% explained variance [
12], while others lacked group mean maps or grand mean templates [
11,
13]. Such issues reduce reliability and stability of temporal parameters [
10]. Moreover, most studies constrained analyses to four canonical microstates a priori, though recent work suggests that optimal clustering often exceeds four states, extending to 4–7 maps [
10,
14].
Together, these inconsistencies highlight the need for standardized analysis pipelines. To address this gap, the present study applied a validated microstate workflow in MICROSTATELAB in EEGLAB [
15], focusing only on temporal parameters demonstrated to be reliable [
10]. Additionally, we introduce a ratio approach that normalizes each microstate parameter by the total across all microstates (e.g., relative duration of microstate A = duration of A ÷ total duration). This adjustment reduces inter-individual variability and may improve sensitivity for detecting group differences.
2. Materials and Methods
2.1. Participants
The study included 36 patients with AD, 23 with FTD, and 29 healthy controls (CTL) [
16]. The original dataset could be found in publicly available OpenNeuro: doi:10.18112/openneuro.ds004504.v1.0.8. Cognitive status was assessed using the Mini-Mental State Examination (MMSE) [
17], which ranges from 0 to 30, with lower scores indicating more severe decline. The median disease duration was 25 months (IQR: 24–28.5). No dementia-related comorbidities were reported in the AD group. Diagnoses were made according to Diagnostic and Statistical Manual of Mental Disorders, 3rd ed., revised (DSM-IIIR, DSM IV, ICD-10) [
18] and the National Institute of Neurological, Communicative Disorders and Stroke—Alzheimer’s Disease and Related Disorders Association (NINCDS—ADRDA) [
19]. Mean MMSE scores were 17.75 (SD = 4.5) in the AD group, 22.17 (SD = 8.22) in the FTD group, and 30 in controls. Mean ages were 66.4 years (SD = 7.9) for AD, 63.6 (SD = 8.2) for FTD, and 67.9 (SD = 5.4) for controls.
2.2. EEG Acquisition and Preprocessing
Resting-state EEG was recorded at the 2nd Department of Neurology, AHEPA General Hospital, Thessaloniki, by an experienced neurology team. Signals were acquired with a Nihon Kohden 2100 system using 19 scalp electrodes (Fp1, Fp2, F7, F3, Fz, F4, F8, T3, C3, Cz, C4, T4, T5, P3, Pz, P4, T6, O1, O2) placed according to the 10–20 system. Mastoids (A1, A2) were used as references and for impedance checks. Participants sat with eyes closed during recordings. Data were sampled at 500 Hz with 10 μV/mm resolution. Recordings were referenced to Cz for common-mode rejection. The study was approved by the Scientific and Ethics Committee of AHEPA University Hospital, Aristotle University of Thessaloniki (Protocol No. 142/12-04-2023) and conducted in accordance with the Declaration of Helsinki.
Preprocessing was performed in EEGLAB [
20]. Signals were band-pass filtered (2–20 Hz) following MICROSTATELAB recommendations [
15] and reliability findings [
10]. Artifact Subspace Reconstruction (ASR) was applied with a 0.5 s sliding window and 20 SD threshold. Bad segments were removed using RMS thresholds with a 25% channel-outlier criterion. Data were re-referenced to the average. Independent component analysis (ICA) was then performed, and components with ≥70% probability of ocular or muscle origin were rejected.
2.3. Microstate Analysis
Microstate analysis was conducted using the MICROSTATELAB [
15]. Individual templates were identified with a k-means clustering algorithm with 20 restarts, applied to global field power (GFP) peaks while ignoring polarity. Clustering was performed for solutions ranging from four to seven classes. Group mean maps were then computed, followed by a grand mean map across all participants. Maps were sorted according to the EEG microstate metamap [
14]. The optimal number of classes was defined as the solution yielding more than 80% shared variance with established templates. Both four- and seven-class solutions met this criterion and were therefore retained. Grand mean maps were used to facilitate sorting of all dependent maps. GFP peaks and grand mean templates were applied for backfitting to compute temporal parameters. Duration was defined as the mean length of each microstate, occurrence as the average number per second, and coverage as the percentage of total EEG time occupied by each microstate. Transition probabilities were not analyzed because of their poor test–retest reliability [
10]. Relative duration and occurrence were also calculated by dividing the duration or occurrence of each microstate by the total across all microstates.
2.4. Statistical Analysis
Statistical analyses were performed in MedCalc (version 23.0.8; MedCalc Software Ltd, Ostend, Belgium), MATLAB (version R2023a), and JASP (version 0.19.3). Between-group differences were tested using ANCOVA with age and gender as covariates and with the Kruskal–Wallis test followed by Dunn’s post hoc comparisons. Bonferroni correction was applied for multiple testing. Associations between MMSE scores and microstate parameters were examined using linear regression with age and gender included as covariates.
3. Results
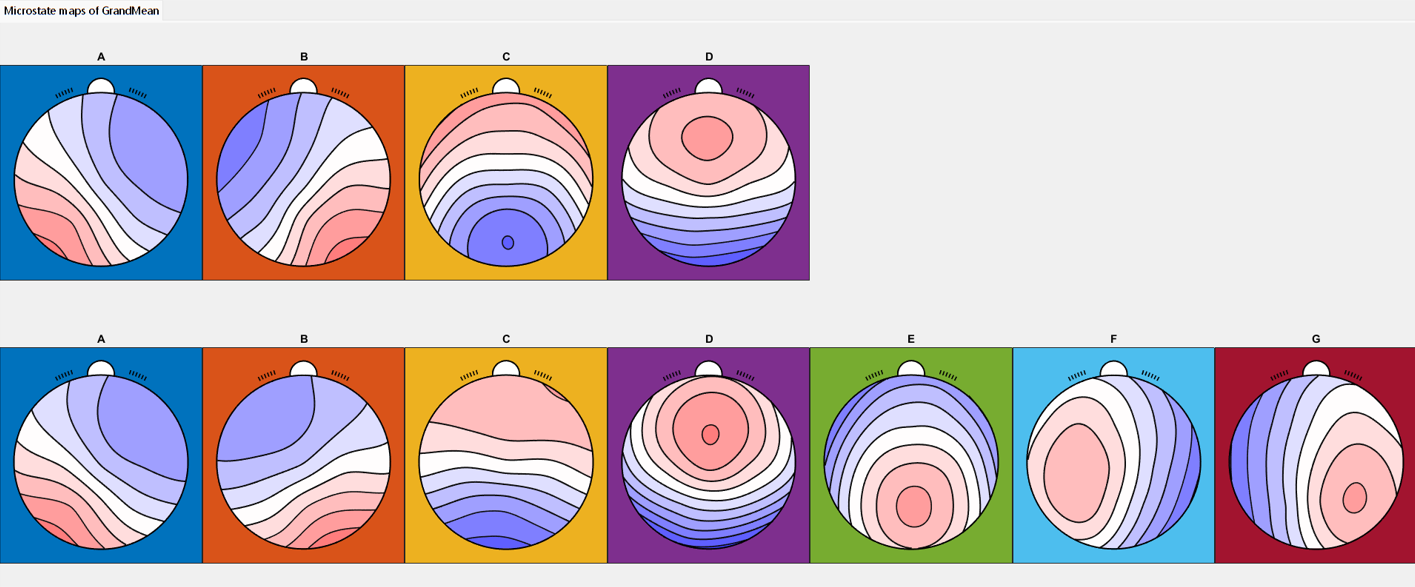
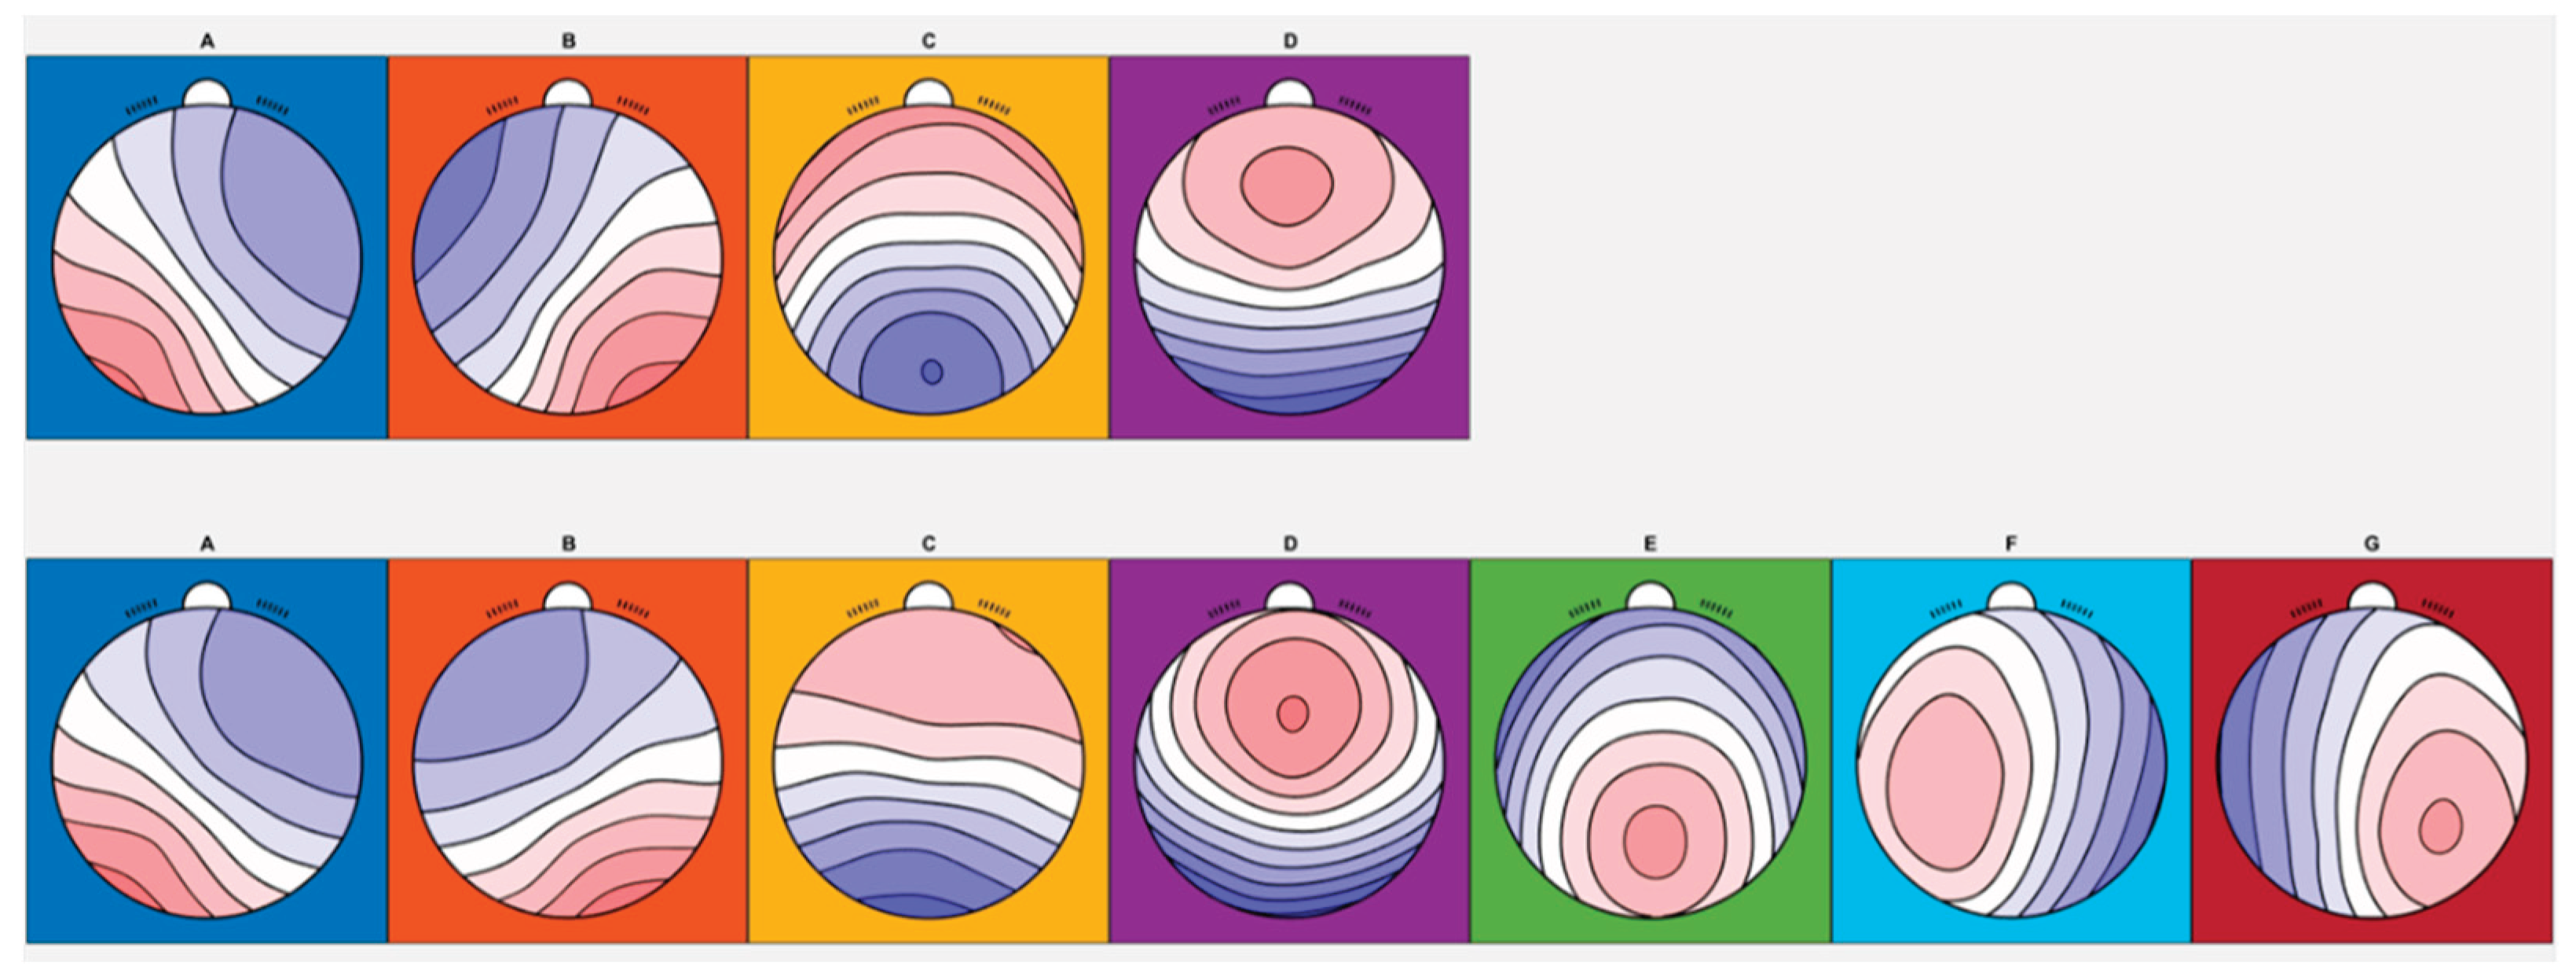
Across participants, both four- and seven-class clustering solutions were identified, and the resulting maps were consistent with published microstate templates [
10] (
Figure 1). For the four-class solution, the shared variance with the published metamaps was 97.35%, 98.70%, 96.86%, and 86.54% for microstates A, B, C, and D, respectively (
Table 1).
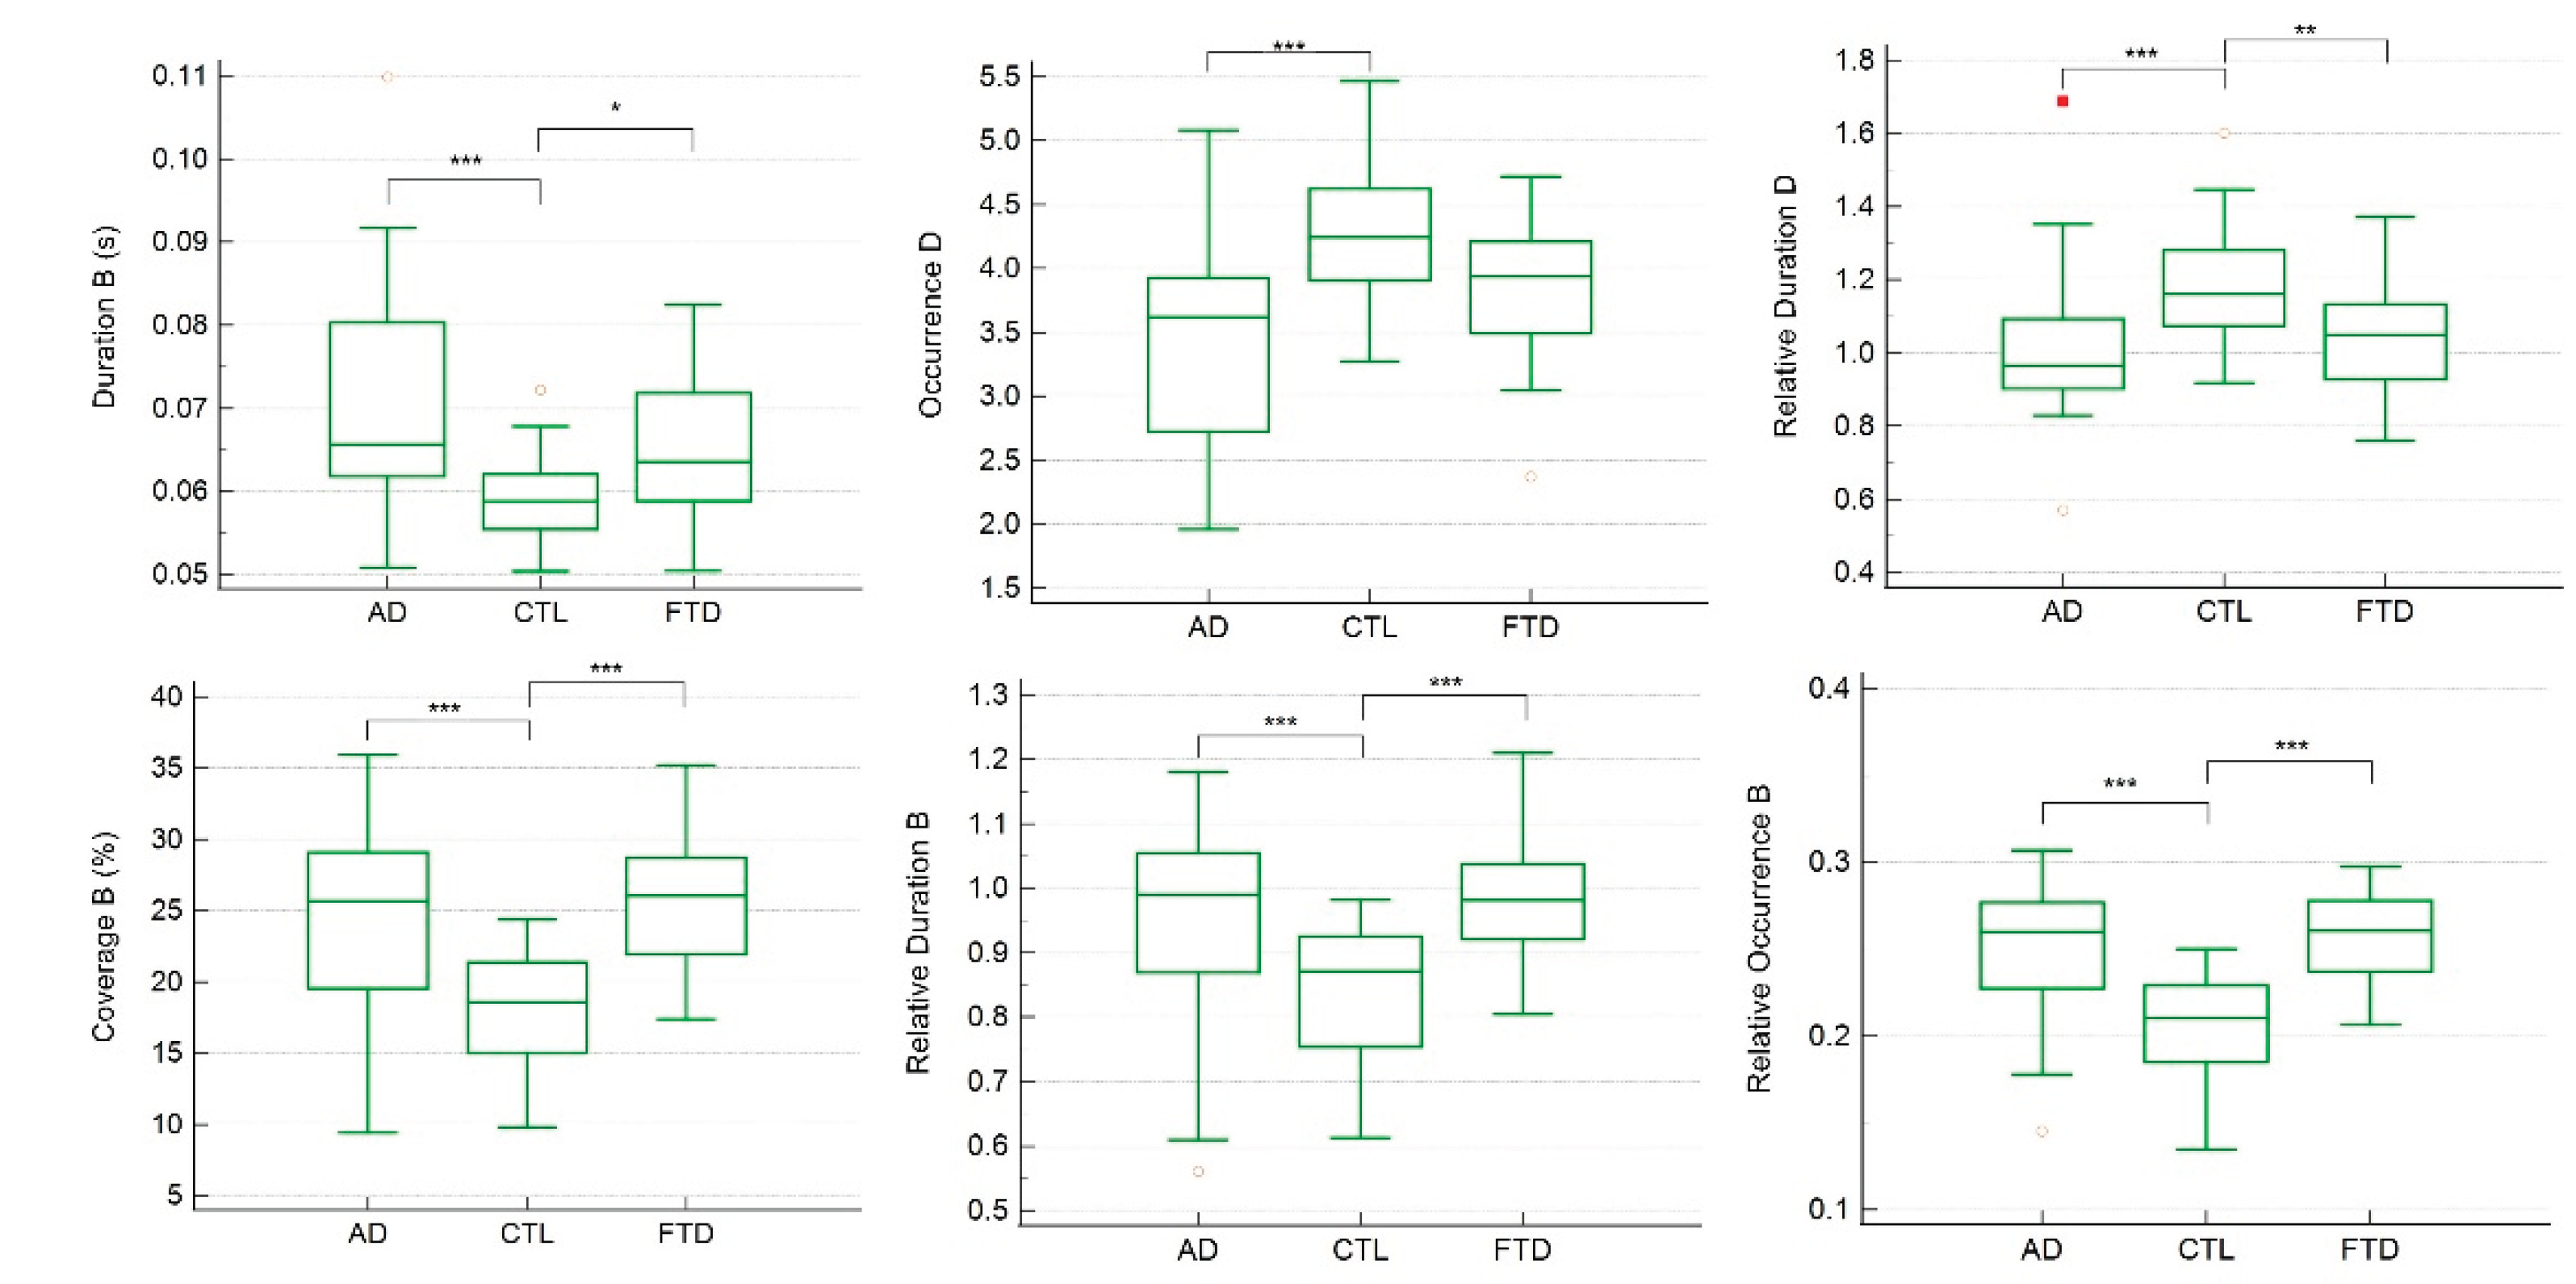
Group comparisons revealed significant differences in the temporal parameters of several microstates. In the four-class solution, ANCOVA and Kruskal–Wallis analyses indicated that the duration, coverage, relative duration, and relative occurrence of microstate B, as well as the occurrence and relative duration of microstate D, differed significantly across CTL, FTD, and AD groups (
Table 2).
Figure 2.
Individual comparisons of each significant temporal parameter across CTL, FTD, and AD groups in 4-classess microstates. In the Box-and-whisker plot, yellow hollow dots represent an outside value (smaller than lower quartile minus 1.5 times the interquartile range or larger than the upper quartile plus 1.5 times the interquartile range (inner fences)). Red rectangles represent a far out value (smaller than the lower quartile minus 3 times the interquartile range, or larger than the upper quartile plus 3 times the interquartile range (outer fences)). Three asterisks represent p value <0.001; two asterisks represent p value <0.01; one asterisk represents p value <0.05.
CTL group compared with both the AD and FTD groups (p < 0.001, except for the duration of microstate B where CTL vs. FTD showed p < 0.05). The occurrence of microstate D was significantly higher in CTL compared with AD (p < 0.001), while the relative duration of microstate D was significantly higher in CTL compared with both AD and FTD (p < 0.001 and p < 0.01, respectively).
Linear regression analyses controlling age and gender confirmed that these temporal parameters were strongly related to MMSE scores (
Table 3). Specifically, the duration, coverage, relative duration, and relative occurrence of microstate B, as well as the occurrence and relative duration of microstate D, were significant predictors of MMSE performance.
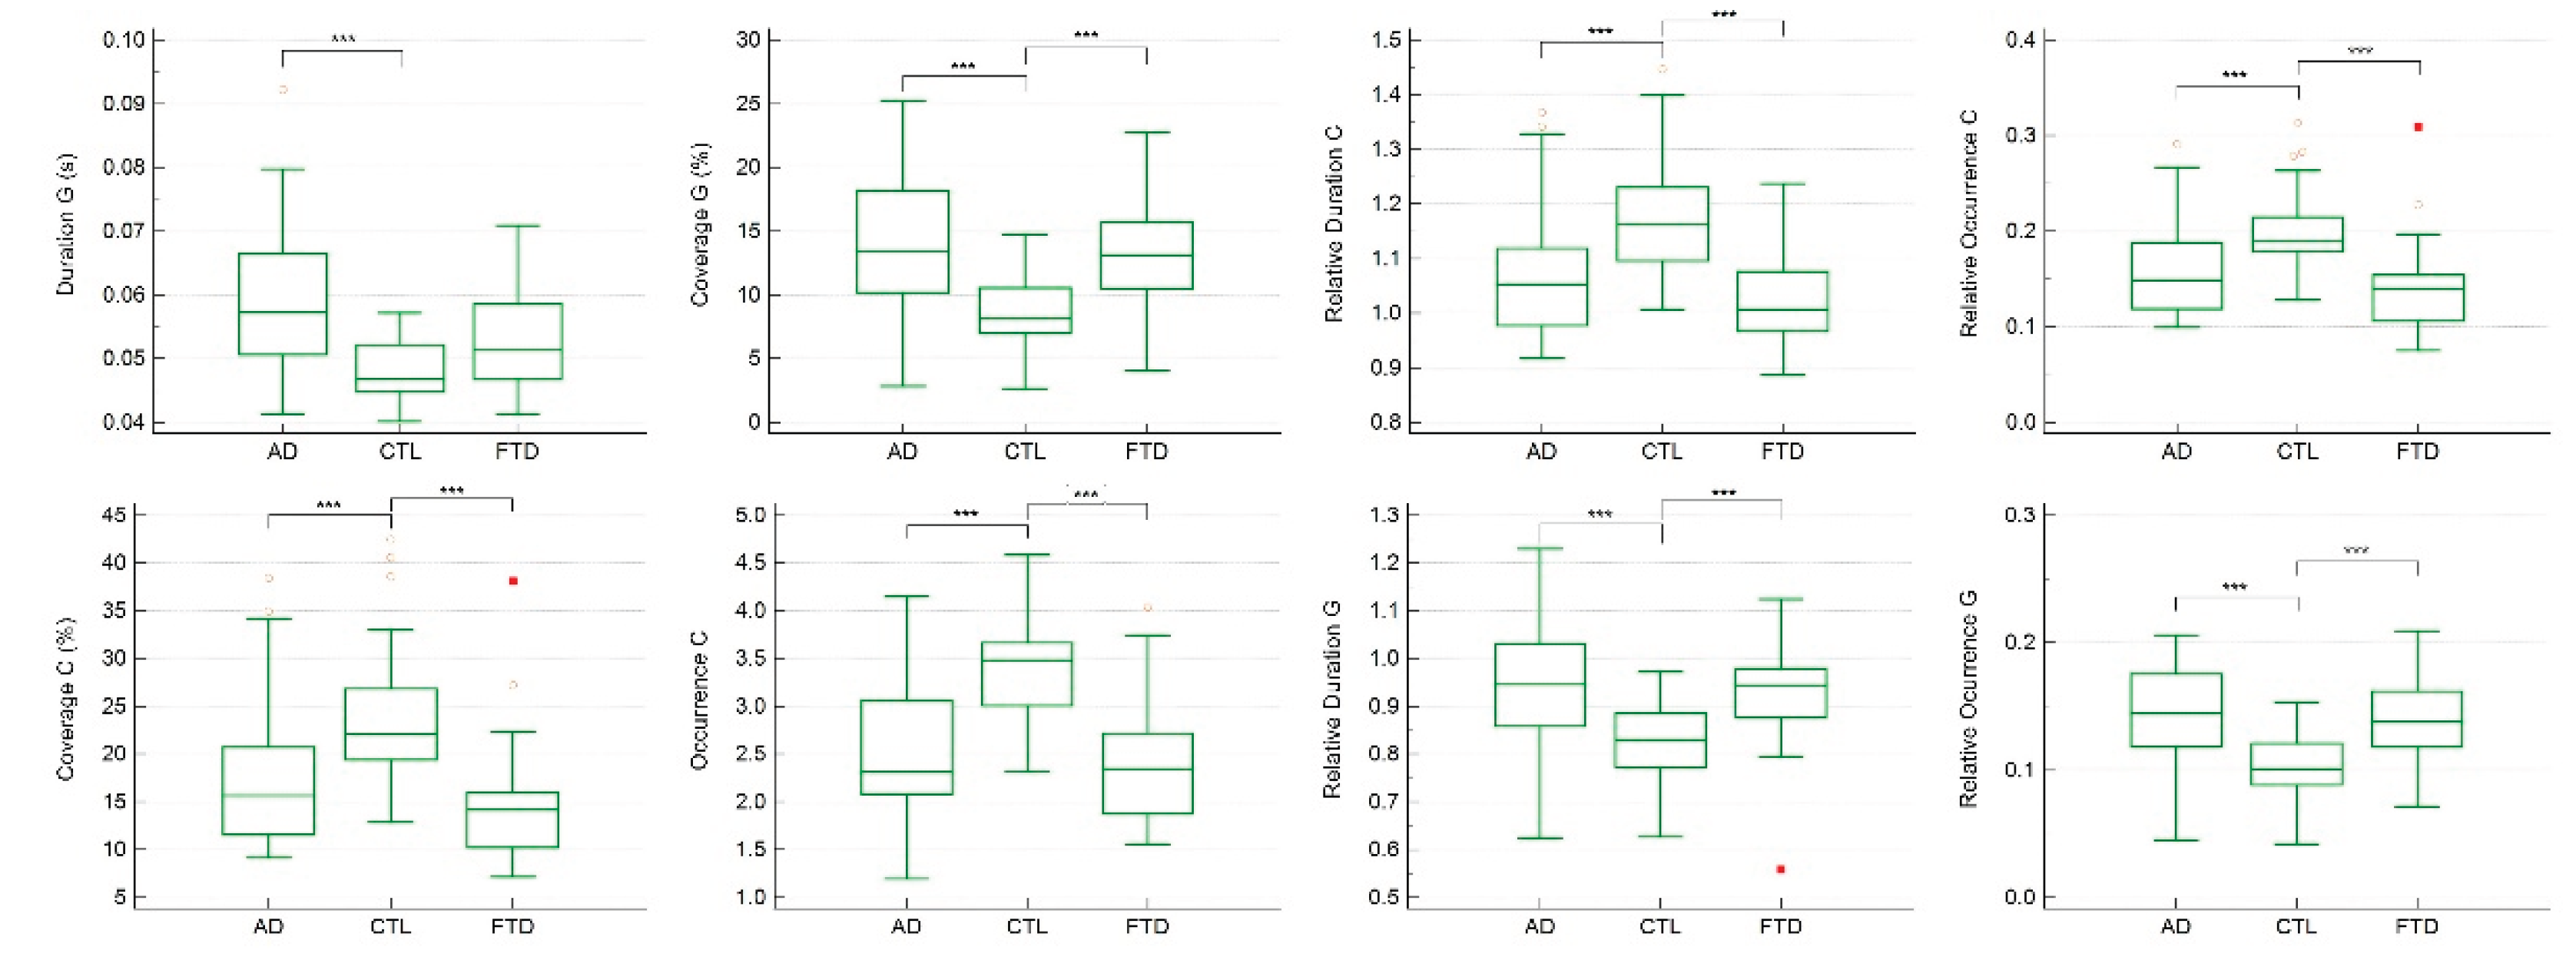
For the seven-class solution, the shared variance with published metamaps was 99.06%, 87.99%, 95.63%, 95.85%, 92.74%, 97.81%, and 92.17% for microstates A through G, respectively (
Table 4). ANCOVA and Kruskal–Wallis analyses identified significant group differences in temporal parameters of microstates C and G (
Table 5).
In particular, the duration of microstate G was significantly longer in AD compared with CTL (p < 0.001). Moreover, the coverage, occurrence, relative duration, and relative occurrence of microstate C, as well as the coverage, relative duration, and relative occurrence of microstate G, were all significantly different in CTL compared with AD and FTD (p < 0.001) (
Figure 3).
Regression analyses further demonstrated that the duration, coverage, relative duration, and relative occurrence of microstate G, together with the occurrence, coverage, relative duration, and relative occurrence of microstate C, were significantly associated with MMSE scores (
Table 6).
4. Discussion
The present study demonstrates that different clustering solutions in EEG microstate analysis reveal distinct but complementary markers of dementia. Using four-class clustering, temporal parameters of microstates B and D differentiated healthy controls from both AD and FTD groups. In contrast, with seven-class clustering, temporal parameters of microstates C and G distinguished controls from the dementia groups. In both clustering solutions, these microstate parameters were also significantly associated with cognitive status, as reflected in MMSE scores. Importantly, applying relative measures of duration and occurrence provided additional discriminatory power. For example, in the seven-class solution, the absolute duration of microstate C and the occurrence of microstate G did not significantly differ between groups, whereas their relative values successfully distinguished healthy controls from dementia patients.
Although four- and seven-class solutions capture different numbers and topographies of microstates, both sets of maps showed high shared variance with published template maps from meta-analyses [
14]. This correspondence supports the validity of our clustering results and aligns with the broader view that microstates reflect brief but functionally meaningful configurations of large-scale brain networks. Functional MRI studies have suggested that canonical microstates correspond to resting-state networks (RSNs), with microstate A linked to phonological processing, microstate B to the visual network, microstate C to the salience network, and microstate D to attentional networks [
21,
22]. According to this framework, spontaneous brain activity alternates rapidly across RSNs, and microstates capture these transitions on the millisecond scale [
23]. However, the mapping between microstates and RSNs remains controversial, since EEG microstates operate on much shorter time scales than fMRI. Some studies report an association between microstates and the default mode network [
24], while others have not confirmed this relationship [
21]. Consequently, microstates that appear topographically similar across different clustering solutions, such as those labeled “B,” may nonetheless index distinct underlying RSNs. This suggests that considering multiple clustering solutions may be important to fully characterize the range of network dynamics in EEG microstate analysis.
Another novel feature of the present study is the use of ratio-normalized parameters, in which the duration or occurrence of each microstate was expressed relative to the total across all microstates. This approach reduces inter-individual variability, which is known to affect EEG microstate measures [
24], and may provide a more reliable index of temporal dynamics. Each temporal parameter captures a different aspect of large-scale network activity: duration reflects microstate stability, occurrence reflects switching rate, and coverage reflects the relative dominance of a microstate. By normalizing duration and occurrence, we may more effectively capture relative changes in network stability and switching that accompany dementia. Although further work is needed to establish the precise neurophysiological meaning of relative parameters, our findings suggest that they provide useful complementary information for distinguishing clinical groups.
Our results further indicate that EEG microstates can serve as early and cost-effective screening markers for dementia. While they did not differentiate between AD and FTD, the microstate parameters we identified reliably separated both patient groups from healthy controls. This aligns with recent recommendations highlighting the potential of EEG biomarkers for dementia diagnosis [
25]. A stratified diagnostic approach could therefore be envisioned, in which EEG microstate analysis is used as an inexpensive and noninvasive first-line screening tool to identify individuals at risk, followed by more costly or invasive methods such as MRI or PET for diagnostic confirmation. Such a tiered approach would lower costs, improve accessibility, and facilitate earlier detection.
Overall, the present findings suggest that temporal parameters of microstates B and D in the four-class solution and microstates C and G in the seven-class solution are promising candidates as biomarkers for distinguishing dementia patients from healthy individuals. While they may not differentiate AD from FTD, they provide a valuable step toward scalable and early screening methods. Future work should extend these results to larger cohorts, prospective designs, and classification analyses to further establish the diagnostic utility and accuracy of microstate-based biomarkers.
5. Conclusions
This study demonstrates that different clustering solutions in EEG microstate analysis highlight distinct temporal parameters capable of distinguishing dementia patients from healthy controls. In the four-class solution, microstates B and D were the most informative, whereas in the seven-class solution, microstates C and G provided the strongest group differentiation. Importantly, normalization of temporal parameters through a ratio approach enhanced discrimination, revealing group differences that were not evident with absolute measures alone.
Although microstate parameters did not separate AD from FTD, they consistently differentiated both patient groups from controls and were closely associated with cognitive performance as measured by MMSE scores. These findings suggest that EEG microstate analysis has potential as a scalable, low-cost, and noninvasive tool for stratifying dementia diagnostics. Used as an initial screening method, EEG microstates may help identify individuals who warrant further evaluation with more costly or invasive techniques such as MRI or PET.
By demonstrating reliable associations between microstate temporal parameters and dementia, the present study provides evidence that EEG microstate analysis can contribute meaningfully to early detection strategies. Future research should focus on validating these findings in larger and more diverse cohorts, refining classification accuracy, and integrating microstate measures with multimodal biomarkers to improve diagnostic precision.
Author Contributions
Conceptualization, methodology, validation, formal analysis, writing—original draft preparation, J.C.
Funding
This research received no external funding.
Institutional Review Board Statement
Ethical review and approval were waived for this study due to the re-analysis of already publicly available dataset.
Informed Consent Statement
Informed consent was obtained from all subjects involved in the study.
Data Availability Statement
The original dataset could be found in OpenNeuro: doi:10.18112/openneuro.ds004504.v1.0.8.
Acknowledgments
The author declares no acknowledgments.
Conflicts of Interest
The authors declare no conflicts of interest.
Abbreviations
The following abbreviations are used in this manuscript:
| EEG |
Electroencephalography |
| AD |
Alzheimer’s disease |
| FTD |
Frontotemporal dementia |
| RSN |
Resting state network |
References
- Knopman, D. S., Amieva, H., Petersen, R. C., Chételat, G., Holtzman, D. M., Hyman, B. T., Nixon, R. A., & Jones, D. T. Alzheimer disease. Nature Reviews Disease Primers 2021 7(1), 33.
- Woolley, J. D., Khan, B. K., Murthy, N. K., Miller, B. L., & Rankin, K. P. The diagnostic challenge of psychiatric symptoms in neurodegenerative disease: Rates of and risk factors for prior psychiatric diagnosis in patients with early neurodegenerative disease. The Journal of Clinical Psychiatry 2011 72(2), 126–133.
- Erkkinen, M. G., Kim, M. O., & Geschwind, M. D. Clinical neurology and epidemiology of the major neurodegenerative diseases. Cold Spring Harbor Perspectives in Biology 2018 10(4), a033118.
- Rabinovici, G. D., Seeley, W. W., Kim, E. J., Gorno-Tempini, M. L., Rascovsky, K., Pagliaro, T. A., et al. Distinct MRI atrophy patterns in autopsy-proven Alzheimer’s disease and frontotemporal lobar degeneration. American Journal of Alzheimer’s Disease and Other Dementias 2007 22(6), 474–488.
- Gudmundsson, S., Runarsson, T. P., Sigurdsson, S., Eiriksdottir, G., & Johnsen, K. Reliability of quantitative EEG features. Clinical Neurophysiology 2007 118(10), 2162–2171.
- Gyurkovics, M., Clements, G. M., Low, K. A., Fabiani, M., & Gratton, G. The impact of 1/f activity and baseline correction on the results and interpretation of time-frequency analyses of EEG/MEG data: A cautionary tale. NeuroImage 2021 237, 118192.
- Michel, C. M., & Koenig, T. EEG microstates as a tool for studying the temporal dynamics of whole-brain neuronal networks: A review. NeuroImage 2018 180(Pt B), 577–593.
- Lehmann, D., Ozaki, H., & Pal, I. EEG alpha map series: Brain micro-states by space-oriented adaptive segmentation. Electroencephalography and Clinical Neurophysiology 1987 67(3), 271–288.
- Michel, C. M., Brechet, L., Schiller, B., & Koenig, T. Current state of EEG/ERP microstate research. Brain Topography 2024 37(2), 169–180.
- Kleinert, T., Koenig, T., Nash, K., & Wascher, E. On the reliability of the EEG microstate approach. Brain Topography 2024 37(2), 271–286.
- Nishida, K., Morishima, Y., Yoshimura, M., Isotani, T., Irisawa, S., Jann, K., et al. EEG microstates associated with salience and frontoparietal networks in frontotemporal dementia, schizophrenia and Alzheimer’s disease. Clinical Neurophysiology 2013 124(6), 1106–1114.
- Lin, N., Gao, J., Mao, C., Sun, H., Lu, Q., & Cui, L. Differences in multimodal electroencephalogram and clinical correlations between early-onset Alzheimer’s disease and frontotemporal dementia. Frontiers in Neuroscience 2021 15, 687053.
- Grieder, M., Koenig, T., Kinoshita, T., Utsunomiya, K., Wahlund, L. O., Dierks, T., & Nishida, K. Discovering EEG resting state alterations of semantic dementia. Clinical Neurophysiology 2016 127(5), 2175–2181.
- Koenig, T., Diezig, S., Kalburgi, S. N., Antonova, E., Artoni, F., Brechet, L., et al. EEG-Meta-Microstates: Towards a more objective use of resting-state EEG microstate findings across studies. Brain Topography 2024 37(2), 218–231.
- Nagabhushan Kalburgi, S., Kleinert, T., Aryan, D., Nash, K., Schiller, B., & Koenig, T. MICROSTATELAB: The EEGLAB toolbox for resting-state microstate analysis. Brain Topography 2024 37(4), 621–645.
- Miltiadous, A., Tzimourta, K. D., Afrantou, T., Ioannidis, P., Grigoriadis, N., Tsalikakis, D. G., Angelidis, P., et al. A dataset of scalp EEG recordings of Alzheimer’s disease, frontotemporal dementia and healthy subjects from routine EEG. Data 2023 8(6), 95.
- Kurlowicz, L., & Wallace, M. The Mini-Mental State Examination (MMSE). Journal of Gerontological Nursing 1999 25(5), 8–9.
- Bell, C. C. DSM-IV: Diagnostic and statistical manual of mental disorders. JAMA 1994 272(10), 828–829.
- McKhann, G., Drachman, D., Folstein, M., Katzman, R., Price, D., & Stadlan, E. M. Clinical diagnosis of Alzheimer’s disease: Report of the NINCDS-ADRDA Work Group under the auspices of Department of Health and Human Services Task Force on Alzheimer’s Disease. Neurology 1984 34(7), 939–944.
- Delorme, A., & Makeig, S. EEGLAB: an open source toolbox for analysis of single-trial EEG dynamics including independent component analysis. Journal of Neuroscience Methods 2004 134(1), 9–21.
- Britz, J., Van De Ville, D., & Michel, C. M. BOLD correlates of EEG topography reveal rapid resting-state network dynamics. NeuroImage 2010 52(4), 1162–1170.
- Khanna, A., Pascual-Leone, A., Michel, C. M., & Farzan, F. Microstates in resting-state EEG: Current status and future directions. Neuroscience and Biobehavioral Reviews 2015 49, 105–113.
- Van de Ville, D., Britz, J., & Michel, C. M. EEG microstate sequences in healthy humans at rest reveal scale-free dynamics. Proceedings of the National Academy of Sciences of the United States of America 2010 107(42), 18179–18184.
- Musso, F., Brinkmeyer, J., Mobascher, A., Warbrick, T., & Winterer, G. Spontaneous brain activity and EEG microstates: A novel EEG/fMRI analysis approach to explore resting-state networks. NeuroImage 2010 52(4), 1149–1161.
- Babiloni, C., Arakaki, X., Azami, H., Bennys, K., Blinowska, K., Bonanni, L., et al. Measures of resting state EEG rhythms for clinical trials in Alzheimer’s disease: Recommendations of an expert panel. Alzheimer’s & Dementia: The Journal of the Alzheimer’s Association 2021 17(9), 1528–1553.
|
Disclaimer/Publisher’s Note: The statements, opinions and data contained in all publications are solely those of the individual author(s) and contributor(s) and not of MDPI and/or the editor(s). MDPI and/or the editor(s) disclaim responsibility for any injury to people or property resulting from any ideas, methods, instructions or products referred to in the content. |
© 2025 by the authors. Licensee MDPI, Basel, Switzerland. This article is an open access article distributed under the terms and conditions of the Creative Commons Attribution (CC BY) license (http://creativecommons.org/licenses/by/4.0/).