
Submitted:
10 September 2025
Posted:
22 September 2025
You are already at the latest version
Abstract
To overcome the limited accuracy of existing street-vitality assessments under dense occlusion and their lack of dynamic, multi-source data fusion, this study proposes an integrated dynamic model that couples an enhanced YOLOv11 with heterogeneous spatio-temporal datasets. The network introduces a Two-backbone architecture for stronger multi-scale fusion, Spatial Pyramid Depth Convolution (SPDConv) for richer urban-scene features, and Dynamic Sparse Sampling (DySample) for robust occlusion handling. Validated in Yibin, the model achieves 90.4 % precision, 67.3 % recall and 77.2 % mAP@50—gains of 6.5 %, 5.3 % and 5.1 % over baseline. By fusing Baidu heat maps, street-view imagery, road networks and POI data, a spatial-coupling framework quantifies the interplay between commercial facilities and street vitality, enabling real-time diagnosis of urban dynamics, targeted retail regulation and adaptive traffic management. The work shifts urban resource allocation from static planning to dynamic, responsive systems.
Keywords:
street vitality
; YOLOv11
; street view image
; pedestrian detection
; Multi-source data fusion
1. Introduction
Since the 20th National Congress of the Communist Party of China, new urbanization has emerged as a central theme in social development. As essential components of urban public space, streets integrate multiple attributes such as transportation, commercial activity, leisure, and social interaction, serving as critical interfaces and windows through which urban vitality is expressed [1,2,3]. In recent years, China’s urbanization strategy has shifted from outward expansion to inward quality enhancement [4], with the new people-centered urbanization model emphasizing the improvement of urban livability and residents’ quality of life [5,6].
Amid the rapid advancement of digital technology, street view imagery has become a significant medium of urban digitization, demonstrating growing value within tourism and urban studies [7,8,9]. Such images enable intelligent analysis and management of urban infrastructure, street environments, and tourism resources through deep learning and computer vision techniques. Moreover, they facilitate the evaluation of urban vitality, reflecting both the efficiency and attractiveness of street usage [10,11,12]. Urban vitality serves as a key indicator of a city’s functionality and appeal, directly influencing residents’ lived experience and the city’s tourism competitiveness [13,14,15]. Street vitality, in particular, represents a core aspect of urban spatial quality [16,17].
Conventional assessment methods, often reliant on manual surveys or single-source sensor data, suffer from limitations such as poor timeliness and inadequate adaptability across diverse scenarios. The integration of multi-source spatio-temporal data and intelligent recognition technologies offers a promising alternative, enabling refined analysis of street functional traits and vitality distribution patterns [18,19,20]. Such approaches provide a scientific foundation for optimizing urban spatial resource allocation, mitigating traffic congestion, and enhancing environmental quality—contributing directly to the realization of the “people’s city” ideal.
Recent advances in multi-source big data have facilitated the development of multidimensional quantitative evaluation frameworks for street vitality. Zarin [21] pioneered a "psychological demand–spatial function" framework, using questionnaires and regression to first quantify the link between public space vitality and well-being. Subsequent use of location services and mobile big data shifted methods from static and global to dynamic and local scales. W Wu[22] utilized mobile phone positioning data to construct multi-temporal activity intensity indicators, revealing the differential impact of high-density built environments on urban vitality. X Niu [23] integrated theories of street urbanism to establish an evaluation system for street vitality—based on intensity and instability—in central Shanghai, uncovering spatial coupling patterns between commercial formats, subway stations, and vitality.On the methodological front, L Wangbao [24] employed Tencent location data and applied both OLS and Geographically Weighted Regression (GWR) models to analyze the influence of the built environment on street vitality. It was found that the GWR model effectively captures spatial heterogeneity. B Yu [25] integrated Baidu heatmaps, POI data, and street view imagery with machine learning techniques to develop a spatiotemporal quantitative method for analyzing street vitality and its driving factors. Y Li [26] built a deep learning model combining multi-object tracking and scene classification to systematically analyze the impact mechanisms of built environment features on street vitality.In another study, L Chen [27] developed a "spatial perception–vitality interaction" framework, examining through a case study of Ya’an’s Xicheng neighborhood the formation mechanisms of spatial vitality and perceptual impacts in historic districts. The study found that emotional perception closely correlates with vitality distribution, and that spatial features alongside place atmosphere markedly affect vitality levels, thereby advancing the use of multi-source data in analyzing vitality-perception relationships in historic areas.
Despite these innovations, current research still faces challenges such as insufficient cross-platform data integration and limited depth in dynamic process analysis. There is a pressing need to establish a standardized processing framework for multi-source heterogeneous data to enhance evaluation accuracy. To address these gaps, this study develops a dynamic street vitality assessment model based on an improved YOLOv11 architecture, using Yibin City as a case study. The enhanced model incorporates a Two-backbone feature extraction network to strengthen multi-scale pedestrian feature capture, employs SPDConv to improve detection robustness in complex street environments, and integrates a DySample mechanism to enhance recognition accuracy in densely occluded scenarios. The model is designed to detect pedestrian presence in real time and compute instantaneous street vitality indices, further combined with spatio-temporal and geospatial data from Baidu heatmaps to derive comprehensive vitality measurements across the study area. Experimental results demonstrate that the improved model achieves a detection accuracy of 90.4%, surpassing the baseline model by 6.5%. This assessment system offers quantitative decision support for precise diagnosis of urban vitality patterns and optimized functional and business type allocation, thereby facilitating people-centered street space renewal.
2. Study Area and Data Sources
2.1. Study Area
Yibin City, a prefecture-level administrative unit in Sichuan Province, is situated at the tri-provincial confluence of Yunnan, Guizhou, and Sichuan, where the Jinsha River, Minjiang River, and Yangtze River converge. Topographically, the area exhibits a general decline in elevation from southwest to northeast, characterized by a subtropical humid monsoon climate. It spans a total area of 13,283 square kilometers.Given the exemplary significance of Cuiping District and Xuzhou District in the transformation and upgrading of the southern Sichuan urban agglomeration, this study focuses on the street networks within the central urban zones of these districts. By examining the coupling relationship between street spatial-functional configurations and the density of population and economic activities, this research aims to analyze variations in vitality and developmental efficiency across different street types. The findings are intended to provide empirical references for promoting coordinated development between old-city regeneration and new-district construction in medium-sized cities in southwestern China.
2.2. Data Sources
2.2.1. Road Network Data
This study utilizes open-source road network data obtained from OpenStreetMap (OSM) as its primary data source. This dataset comprises detailed attributes of various road types and is publicly accessible. For the delineated study area of Yibin City, a series of topological refinement procedures were applied to the raw road network data. These steps included the removal of invalid elements such as discontinuous segments and isolated short branches. The processed output constitutes a coherent and integrated road network system for the study area, as illustrated in Figure 1, thereby providing an accurate and reliable foundation for subsequent spatial analysis.
2.2.2. Baidu Heatmap Data
This study employs Baidu Heat Map data to capture patterns of human activity. The data are derived from Location-Based Service (LBS) positioning signals from mobile devices, as illustrated in Figure 2. By graphically representing spatial density and distribution patterns of crowds, the heatmap effectively serves as a reliable proxy for spatio-temporal dynamics of street vitality.The data collection focused on a two-day sampling period from March 22 to 23, 2025, during which heatmap images were captured at one-hour intervals. This process yielded a total of 48 complete temporal snapshots, forming a robust temporal dataset for subsequent spatio-temporal analysis of urban vitality.
2.2.3. Amap POI Data
The 2025 POI data were acquired via the Amap API. As summarized in Table 1, the dataset encompasses POIs across multiple categories including accommodation, catering, retail, and healthcare services. These data were utilized to calculate both POI density and bus stop density throughout the study area.
2.2.4. Street View Data
The image recognition dataset comprises both open-source data and custom-collected street view images, as illustrated in Figure 3. The dataset includes a total of 2,637 finely annotated images, with 2,373 allocated to the training set and 264 to the validation set. Each original image has a resolution of 1024×2048 pixels. To reduce video memory consumption during model training, all images were resized to 512×512 pixels and subjected to data augmentation. Final model accuracy was evaluated using the validation set.
3. Methodology
3.1. Research Framework
This study implements pedestrian detection using an improved YOLOv11 model and incorporates multi-source geographic information, including Baidu Heatmap data, road network data, and POI data. Geographic feature indicators were derived through spatial statistics and proximity analysis. Indicator weights were determined using principal component analysis. By integrating both intrinsic constituent elements and extrinsic representational factors of streets, a quantitative evaluation system for street vitality was constructed, ultimately yielding composite vitality scores for each street. The research framework is illustrated in Figure 4, offering a scientific foundation for data-driven decision-making in street space optimization and urban planning.
3.2. Improved YOLOv11 Pedestrian Detection Model
The YOLOv11 model follows a four-stage hierarchical structure comprising an input module, a backbone network, a neck network, and a detection head [28]. The backbone network performs fundamental feature extraction, while the neck network facilitates multi-scale feature integration through a feature pyramid architecture. The detection head is responsible for final object classification and localization. Based on this canonical framework, the present study introduces several optimizations and enhancements. The architecture of the improved model is illustrated in Figure 5.
- 1.
- To address the significant scale variation of pedestrians in street scenes, a Two-backbone architecture is proposed, as illustrated in Figure 6. The shallow branch employs a C3k2 module to capture fine-grained features such as pedestrian contours and poses, while the deep branch incorporates a CBFuse module to integrate multi-scale feature representations. Within this framework, the CBLinear module performs channel binding, and the CBFuse module utilizes nearest-neighbor interpolation for feature alignment and weighted fusion. The architecture retains two critical feature scales—1/8 and 1/16—ensures compatibility with pre-trained weights via a Silence module, and enhances feature representation through the incorporation of a C2PSA attention mechanism. This design preserves the computational efficiency of the original YOLOv11 while improving detection performance in occluded and high-density crowd scenarios through its dual-branch CBLinear–CBFuse structure. Experimental results demonstrate a 5.1% improvement in mAP50 compared to the single-backbone configuration.
- 2.
- To address the challenges of dynamic occlusion and complex backgrounds in street scene detection, this study incorporates a SPDConv module into the YOLOv11 architecture [29], as illustrated in Figure 7. This module employs spatial restructuring of feature maps to reduce resolution while preserving informational integrity, and utilizes parallel dilated convolutions with multiple dilation rates to capture multi-scale contextual features. By integrating a channel attention mechanism, it achieves adaptive fusion of local texture details and global semantic information. This design significantly enhances pedestrian detection accuracy in complex environments without compromising real-time performance, thereby offering a reliable quantitative evaluation tool for urban dynamic monitoring.
- 3.
- To mitigate performance degradation in pedestrian detection caused by severe occlusion in high-density urban street scenarios, a DySample [30] is incorporated into the detection head of YOLOv11, as depicted in Figure 8. In contrast to conventional dynamic convolution methods (e.g., CARAFE, FADE), which rely on dynamic kernels to generate sub-networks, DySample operates through a point-based sampling strategy. Its core mechanism involves decomposing a single point in the input feature map into multiple sampling points. Initially, sampling positions are separated via bilinear initialization. Content-aware offsets are then generated to reconstruct the sampling grid, and standard bilinear interpolation is applied for feature resampling.The dynamic behavior arises from the input-dependent prediction of sampling offsets, eliminating the need for dynamic convolution kernels and requiring only a lightweight coordinate offset prediction module. Sparsity is achieved by locally constraining the offset range, which prevents boundary artifacts caused by overlapping sampling points and effectively mitigates feature loss due to motion blur and occlusion. This lightweight architecture offers a practical solution for continuous street vitality monitoring in complex urban environments.
3.3. Construction of a Built Environment Indicator System
-
Quantification Method for External Representation of VitalityThe external representation of street vitality is quantified using the volume of crowd activities derived from location-based service data [31]. This study proposes two vitality measurement indicators: the average vitality intensity, which reflects the comprehensive vitality level throughout the day and is calculated as the mean of 24-hour heatmap data; and the instantaneous vitality intensity, which captures vitality characteristics at specific moments and is derived based on pedestrian detection results from street view images using an improved YOLOv11 model.
- 1.
- Instantaneous vitality intensity provides a dynamic characterization of street space vitality from the perspective of temporal slices. It refers to the relative density of people present in a street space at a given moment, denoted as Vi .
- 2.
-
The average vitality intensity represents the average level of street space vitality over a 24-hour period. The calculation formula is as follows:In the formula, denotes the average vitality intensity value of the street; i represents different time intervals within a given day, where ; and n indicates the number of time intervals included in the calculation.
-
Quantification Method for Intrinsic Composition of Vitality
- 1.
-
Street HierarchyThis paper classifies roads into three tiers: arterial roads, secondary arterial roads, and branch roads, which are assigned values of 3, 2, and 1, respectively.
- 2.
-
POI densityIt serves as an indicator of the concentration level of various functional types within a street. The calculation formula is as follows:In the formula, denotes the public service facility density of the street, and represents the total number of catering, accommodation, health care, and shopping facilities within the street.
- 3.
-
Intersection DensityIntersection density can, to some extent, reflect the density of the road network. It is quantified as the ratio of the number of intersections to the total length of road segments within the study area.
- 4.
-
Bus Stop DensityConvenient public transportation serves as a fundamental basis for organized vitality and contributes to its enhancement. The calculation formula is as follows:In the formula, denotes the bus stop density of the street, and represents the total number of bus stops within the street.
- 5.
-
Green View IndexAdequate street greenery, such as providing shade and purifying the air, is considered instrumental in enhancing pedestrian comfort. The calculation formula is as follows:In the formula, denotes the Green View Index of the street; represents the greenery area, and indicates the total area.
- 6.
-
Sky View FactorThe degree of openness or unobstructed space above a specific location or area. The proportion of sky in a pedestrian’s field of view can reduce feelings of psychological oppression. The calculation formula is as follows:In the formula, denotes the Sky View Factor of the street, and represents the sky area.
- 7.
-
Spatial EnclosureIn any given street, the spatial enclosure is determined by the road width and building height. A higher degree of spatial enclosure indicates greater road width and higher building density on both sides. The calculation formula is as follows:In the formula, denotes the spatial enclosure of the street, represents the building area, indicates the wall area, and refers to the fence area. Note: For specific calculation methods of the Green View Index, Sky View Factor, and Spatial Enclosure, see the authors’ other publication [32].
3.4. Standardization Framework for Multi-Source Heterogeneous Data and Spatio-temporal Coupling Modeling
This study establishes a comprehensive analytical framework for street vitality and the built environment based on spatio-temporal coupling theory [33]. By integrating multi-source spatio-temporal datasets including heatmap and POI data, it enables coupled assessment of dynamic street vitality patterns and built environment elements. During the critical coupling relationship analysis phase, Principal Component Analysis (PCA) was employed to determine weight coefficients for each environmental factor. Through computation of comprehensive built environment scores for streets, the research systematically examines dynamic correlations between street vitality and built environment characteristics across different time periods.
-
Data Infrastructure Development and Standardized PreprocessingBased on the quantification methodologies established in Section 2.1, comprehensive data processing was executed: 13,150 POI across four categories—catering services, retail services, healthcare facilities, and accommodation—were acquired via API; 322 bus stops and 2,843 road intersections were extracted from geospatial datasets; street view imagery underwent semantic segmentation using the SP-Unet model to derive Green View Index, Sky View Factor, and Spatial Enclosure through pixel-level computation; instantaneous vitality intensity was quantified via pedestrian detection with the enhanced YOLOv11 framework; and average vitality intensity was calculated from Baidu Heatmap data obtained through the Baidu Huiyan platform. Data NormalizationIn the formula, denotes the raw value of the j -th indicator for the i -th street, while and represent the minimum and maximum values of each indicator, respectively, used to define the value range for normalization.Missing Value Handling: Outliers identified in the street view segmentation results were addressed using the median imputation method, thus maintaining data continuity.
-
Three-Level Analytical Framework for Spatio-Temporal Coupling ModelsThree-tiered Analytical Framework for Spatio-temporal Coupling Modeling Standardization Layer [34]: As shown in Equation (7), the raw indicators are converted into comparable values within the [0,1] range.Academic Context:In the formula, denotes the weight of the j -th indicator in the k -th principal component, and represents the score of the k -th principal component.Academic Context:In the formula, denotes the principal component weight, and represents the deviation of the principal component score from its mean. T indicates the weighted composite score of the principal components, while C stands for the coordination index, quantifying the fluctuation equilibrium among elements within the system.A value of D>0.25suggests strong coupling, whereas D<0.15indicates a spatio-temporal mismatch. Detailed coupling analysis results are provided in Table 2.

Table 2.
Total Variance Explained.
| Initial Eigenvalues | Extraction Sums | Rotation Sums | |||||||
|---|---|---|---|---|---|---|---|---|---|
| Comp. | Total | % Var. | Cum. % | Total | % Var. | Cum. % | Total | % Var. | Cum. % |
| 1 | 3.282 | 32.816 | 32.816 | 3.282 | 32.816 | 32.816 | 2.556 | 25.562 | 25.562 |
| 2 | 1.766 | 17.657 | 50.473 | 1.766 | 17.657 | 50.473 | 1.461 | 14.611 | 40.173 |
| 3 | 1.516 | 15.160 | 65.633 | 1.516 | 15.160 | 65.633 | 1.372 | 13.723 | 53.896 |
| 4 | 0.906 | 9.064 | 74.697 | 0.906 | 9.064 | 74.697 | 1.219 | 12.192 | 66.088 |
| 5 | 0.601 | 6.011 | 80.707 | 0.601 | 6.011 | 80.707 | 1.062 | 10.616 | 76.704 |
| 6 | 0.525 | 5.245 | 85.952 | 0.525 | 5.245 | 85.952 | 0.925 | 9.248 | 85.952 |
| 7 | 0.499 | 4.990 | 90.943 | - | - | - | - | - | - |
| 8 | 0.400 | 4.003 | 94.945 | - | - | - | - | - | - |
| 9 | 0.296 | 2.959 | 97.904 | - | - | - | - | - | - |
| 10 | 0.210 | 2.096 | 100.000 | - | - | - | - | - | - |
Principal component analysis was conducted on the standardized street vitality and environmental indicators using SPSS software. Based on the rotated component matrix, the weights of the main factors were obtained, and then the comprehensive score of each street was calculated as shown in Table 3.
4. Results and Analysis
4.1. Model Performance Evaluation
Building upon the established research foundation, this study employs precision, recall, and mAP@50 as core evaluation metrics [35]. The enhanced YOLOv11 architecture achieves significant performance gains, attaining 90.4% precision (+6.5%), 67.3% recall (+5.3%), and 77.2% mAP@50 (+5.1%) compared to the baseline model. For pedestrian detection in street imagery, the optimized model demonstrates robust recognition capabilities. Figure 9 juxtaposes original street scenes with corresponding detection outputs, qualitatively validating the model’s efficacy in real-world urban environments.
4.1.1. Ablation Experiment
This study employs systematic ablation experiments to comprehensively evaluate the performance of an enhanced YOLOv11 architecture. Using the standard YOLOv11 model as a baseline—which achieved 83.9% precision, 62.0% recall, and 72.1% mAP@50 while demonstrating stable detection capabilities yet significant shortcomings in small-target recognition within complex scenarios—we incrementally integrated three novel modules: Two-backbone networks, SPDConv, and DySample. Performance impacts were rigorously quantified using our proprietary urban imagery dataset.
The Two-backbone module substantially elevated performance to 86.9% precision, 66.9% recall, and 76.2% mAP@50, corresponding to absolute improvements of 3.0%, 4.9%, and 4.1% respectively. These gains validate its efficacy in enhancing multi-scale feature fusion and contextual information extraction. Subsequent integration of SPDConv yielded 86.3% precision, 65.6% recall, and 74.8% mAP@50, with improvements of 2.4%, 3.6%, and 2.7%. Notably, this module maintained computational efficiency through lightweight architectural design despite modest metric enhancements.
The DySample mechanism exhibited distinctive characteristics, achieving peak precision of 87.3% with a 3.4% absolute gain while attaining 63.8% recall, reflecting a 1.8% improvement. This indicates optimized feature extraction capabilities with minor trade-offs in boundary target detection accuracy. Synergistic module combinations revealed complementary advantages: Two-backbone with SPDConv elevated performance to 88.5% precision, 67.1% recall, and 76.3% mAP@50. Crucially, the fully integrated architecture achieved state-of-the-art results: 90.4% precision, 67.3% recall, and 77.2% mAP@50, representing comprehensive improvements of 6.5%, 5.3%, and 5.1% over the baseline.
These findings empirically validate both individual module efficacy and the holistic architecture’s superiority in enhancing small-target detection precision and complex-scenario adaptability. The ablation study establishes a robust theoretical foundation for model optimization while providing actionable guidance for practical implementations in urban sensing applications
Table 4.
Performance comparison of different YOLOv11 model variants.
| Model | Precision (P) | Recall (R) | mAP50 |
|---|---|---|---|
| YOLOv11 | 83.9 | 62.0 | 72.1 |
| YOLOv11 + Two-backbone | 86.9 | 66.9 | 76.2 |
| YOLOv11 + SPDConv | 86.3 | 65.6 | 74.8 |
| YOLOv11 + DySample | 87.3 | 63.8 | 74.4 |
| YOLOv11 + Two-backbone + SPDConv | 88.5 | 67.1 | 76.3 |
| YOLOv11 + Two-backbone + SPDConv + DySample | 90.4 | 67.3 | 77.2 |
4.1.2. Comparative Experiment
This study systematically validates the performance advantages of the YOLOv11 model through rigorous comparative experiments. Under identical experimental conditions and parameter settings, we conducted comprehensive benchmarking against leading object detection architectures including YOLOv8, YOLOv6, YOLO10n, and YOLO3-tiny.
As quantified in Table 5, YOLOv11 demonstrates significant superiority across multiple key metrics. The model achieves 83.9% precision, 62.0% recall, and 72.1% mAP@50, exhibiting exceptional performance in localization accuracy and false-positive suppression. Analysis reveals, however, that the model maintains potential for improvement in small-target detection and occlusion handling within complex scenarios.
Comparative evaluation reveals distinct performance characteristics: YOLOv8 achieves a higher recall of 64.0% but lags in precision at 82.8% and mAP@50 at 71.7%, indicating limitations in precise localization. YOLOv6 exhibits the weakest performance with 81.7% precision, 60.0% recall, and 70.3% mAP@50, demonstrating notable deficiencies in detecting small and occluded targets. YOLO10n shows comparable performance to YOLOv8 but underperforms relative to YOLOv11 in both recall and mAP@50, suggesting inferior generalization capability. YOLO3-tiny trails comprehensively with 81.0% precision, 59.9% recall, and 66.4% mAP@50, particularly evidenced by its 5.7 percentage-point deficit in mAP@50 relative to YOLOv11, confirming poor adaptability to the studied environments.
Notably, YOLOv11 achieves an average 3.5 percentage-point improvement in mAP@50 over comparative models while maintaining competitive recall rates. The architecture demonstrates marked superiority in multi-scale target detection within complex scenarios, providing a robust solution for high-precision applications while establishing clear pathways for future optimization.
4.2. Spatial Distribution of Street Vitality
Leveraging high-precision detection outputs, this study examines the spatial distribution patterns of street vitality in Yibin City through an integrated analytical framework. Multi-source datasets—including Baidu heatmaps, street view imagery, and POI density—are synthesized within a spatio-temporal coupling architecture to systematically characterize the spatial heterogeneity and temporal dynamics of urban vitality. Figure 10 visually delineates the geospatial distribution of key determinants: instantaneous vitality intensity, mean vitality intensity, POI density, bus stop density, and Green View Index.
Analysis reveals pronounced spatial differentiation: Cuiping District’s core commercial corridor exhibits high-density POI clustering and concentrated bus stop distribution, demonstrating significant positive correlations between commercial service accessibility and vitality enhancement. Conversely, urban fringe areas display depressed vitality metrics despite elevated environmental indicators such as Green View Index, constrained by infrastructural sparsity. This spatial stratification empirically validates the robust association between functional business agglomeration and vitality intensity, with commercial clusters consistently corresponding to human activity hotspots that align topographically with high-density zones in thermal imagery.
4.3. Results of the Spatio-temporal Coupling Model
Derived through principal component analysis [36], composite vitality scores for each street reveal distinct spatial autocorrelation patterns Figure 11, integrating both extrinsic vitality manifestations and intrinsic constituent elements. High-scoring clusters exceeding the 0.25 threshold concentrate along Xuzhou District’s arterial corridors and Cuiping District’s historic blocks, demonstrating exceptional commercial vitality, environmental comfort, and functional diversity. Conversely, low-scoring streets with values below 0.15 predominantly occur in emerging districts and industrial corridors, exhibiting spatio-temporal mismatch characteristics where high POI density paradoxically coincides with suppressed vitality intensity—potentially attributable to traffic congestion or green infrastructure deficiencies. This bifurcation empirically validates nonlinear spatio-temporal coupling between built-environment elements and vitality dynamics, with spatial correlation analysis revealing strong geostatistical interdependence between commercial POI kernel density and heatmap distribution. Critically, pedestrian network optimization emerges as essential permeability enhancement strategy in low-vitality zones, while highly coupled areas exemplify coordinated "spatial carrier-vitality representation" mechanisms. The integrated assessment confirms street vitality arises from synergistic interactions among functional business typologies, traffic organization efficiency, and environmental quality, establishing an empirical foundation for evidence-based urban regeneration strategies through diagnostic spatial stratification of composite scores.
5. Conclusions
This study establishes an enhanced street vitality assessment framework through a modified YOLOv11 model and multidimensional evaluation system, leveraging multisource spatiotemporal data from Yibin City as a representative case. By fusing pedestrian detection outputs with heterogeneous urban datasets, we quantify vitality intensity across distinct streets and conduct a comprehensive multidimensional assessment of street vitality dynamics. Key findings are synthesized as follows:
- 1.
-
Data Acquisition and PreprocessingGeoreferenced sampling points were derived from Yibin’s road network data, with street view imagery collected through field surveys. Image preprocessing involved noise reduction, outlier handling, and missing-value imputation to enhance data quality. A customized dataset was constructed using Labelme for manual annotation, supplemented by public datasets for joint training. Integration of Baidu heatmaps and Amap POI data established a comprehensive vitality analysis database.
- 2.
-
Model Architecture and PerformanceThe enhanced YOLOv11 architecture incorporates three innovative technological breakthroughs: Two-backbone feature extraction networks, spatial pyramid depth-wise convolution (SPDConv), and dynamic sparse sampling (DySample). Experimental validation demonstrates significant performance gains: 6.5%↑ precision, 5.3%↑ recall in occlusion scenarios, and 5.1%↑ mAP@50 versus baseline models. The model outperforms state-of-the-art detection algorithms across all critical metrics, establishing robust capabilities for high-density urban environments.
- 3.
-
Spatio-temporal Coupling MechanismA vitality-built environment coupling model was developed, integrating temporal dimensions (instantaneous/average vitality intensity) and spatial indicators (POI density, street hierarchy, bus stop density, intersection frequency, Green View Index, Sky View Factor, and interface enclosure). Principal component analysis revealed intrinsic weight relationships among these dimensions, enabling computation of composite vitality scores for each street.
- Urban administrators should implement a multi-dimensional intervention strategy encompassing spatial optimization through pedestrian node integration in low-coupling zones—particularly high-density public service areas—to enhance vitality permeability and walkability via street layout refinements; traffic management via dynamic lane allocation deployed through Intelligent Transportation Systems during peak hours on vitality-overflow corridors, improving traffic efficiency while mitigating congestion impacts; environmental enhancement through increased green infrastructure coverage and Sky View Factor elevation to improve microclimate quality, resident comfort, and aesthetic value; and facility optimization via commercial hub development with balanced public service distribution, transit network optimization, and smart urban management system implementation, collectively improving facility accessibility and citizen-centric service delivery to enhance quality of life. This integrated approach addresses spatial, mobility, ecological, and infrastructural dimensions to holistically activate urban vitality.
Author Contributions
Conceptualization, C.H. and W.L.; methodology, W.L.; software, W.L.; validation, W.L.; formal analysis, C.H.; investigation, W.L.; resources, W.L. and C.H.; data curation, W.L.; writing—original draft preparation, W.L.; writing—review and editing, C.H.; visualization, W.L.; supervision, C.H.; project administration, C.H.; funding acquisition, C.H. All authors have read and agreed to the published version of the manuscript.
Funding
This research was supported by the National Natural Science Foundation of China (Grant No. 42471437), the Sichuan Provincial Research Base of Intelligent Tourism (Sichuan University of Science and Engineering) (Grant No. ZHZJ24-02), and the Graduate Innovation Fund of Sichuan University of Science and Engineering (Grant No. Y2024126).
Informed Consent Statement
Not applicable.
Data Availability Statement
The datasets can be provided by the corresponding author upon reasonable request.
Acknowledgments
The authors would like to express their heartfelt gratitude to those people who have helped with this manuscript and to the reviewers for their comments on the manuscript.
Conflicts of Interest
The authors declare no conflicts of interest.
References
- Ji, D.; Tian, J.; Zhang, J.; Zeng, J.; Namaiti, A. Identification and Spatiotemporal Evolution Analysis of the Urban–Rural Fringe in Polycentric Cities Based on K-Means Clustering and Multi-Source Data: A Case Study of Chengdu City. Land 2024, 13, 1727. [Google Scholar] [CrossRef]
- Li, Q.; Cui, C.; Liu, F.; Wu, Q.; Run, Y.; Han, Z. Multidimensional urban vitality on streets: Spatial patterns and influence factor identification using multisource urban data. ISPRS International Journal of Geo-Information 2021, 11, 2. [Google Scholar] [CrossRef]
- Chen, H.; Ge, J.; He, W. Quantifying Urban Vitality in Guangzhou Through Multi-Source Data: A Comprehensive Analysis of Land Use Change, Streetscape Elements, POI Distribution, and Smartphone-GPS Data. Land 2025, 14, 1309. [Google Scholar] [CrossRef]
- Choi, M.J.; Kim, Y.j. Planning paradigm shift in the era of transition from urban development to management: The case of Korea. In Urban Planning Education: Beginnings, Global Movement and Future Prospects; Springer, 2017; pp. 161–174.
- Al-Thani, S.K.; Amato, A.; Koç, M.; Al-Ghamdi, S.G. Urban sustainability and livability: An analysis of Doha’s urban-form and possible mitigation strategies. Sustainability 2019, 11, 786. [Google Scholar] [CrossRef]
- Wei, H.; Li, L.; Nian, M. China’s urbanization strategy and policy during the 14th five-year plan period. Chinese Journal of Urban and Environmental Studies 2021, 9, 2150002. [Google Scholar] [CrossRef]
- Li, P.; Xu, Y.; Liu, Z.; Jiang, H.; Liu, A. Evaluation and Optimization of Urban Street Spatial Quality Based on Street View Images and Machine Learning: A Case Study of the Jinan Old City. Buildings 2025, 15, 1408. [Google Scholar] [CrossRef]
- Liu, Y.; Li, Z.; Tian, Y.; Gao, B.; Wang, S.; Qi, Y.; Zou, Z.; Li, X.; Wang, R. A study on identifying the spatial characteristic factors of traditional streets based on visitor perception: Yuanjia Village, Shaanxi Province. Buildings 2024, 14, 1815. [Google Scholar] [CrossRef]
- Li, X.; Pang, C. A Spatial Visual Quality Evaluation Method for an Urban Commercial Pedestrian Street Based on Streetscape Images—Taking Tianjin Binjiang Road as an Example. Sustainability 2024, 16, 1139. [Google Scholar] [CrossRef]
- Milias, V.; Sharifi Noorian, S.; Bozzon, A.; Psyllidis, A. Is it safe to be attractive? disentangling the influence of streetscape features on the perceived safety and attractiveness of city streets. AGILE: GIScience Series 2023, 4, 8. [Google Scholar] [CrossRef]
- Chen, X.; Zhang, L.; Zhao, Z.; Zhang, F.; Liu, S.; Long, Y. Characterizing and Measuring the Environmental Amenities of Urban Recreation Leisure Regions Based on Image and Text Fusion Perception: A Case Study of Nanjing, China. Land 2023, 12, 1998. [Google Scholar] [CrossRef]
- Zhou, Q.; Zhang, J.; Zhu, Z. Evaluating Urban Visual Attractiveness Perception Using Multimodal Large Language Model and Street View Images. Buildings 2025, 15, 2970. [Google Scholar] [CrossRef]
- Jin, A.; Ge, Y.; Zhang, S. Spatial characteristics of multidimensional urban vitality and its impact mechanisms by the built environment. Land 2024, 13, 991. [Google Scholar] [CrossRef]
- Li, X.; Kozlowski, M.; Salih, S.A.; Ismail, S.B. Evaluating the vitality of urban public spaces: perspectives on crowd activity and built environment. Archnet-IJAR: International Journal of Architectural Research 2024.
- Liu, W.; Yang, Z.; Gui, C.; Li, G.; Xu, H. Investigating the Nonlinear Relationship Between the Built Environment and Urban Vitality Based on Multi-Source Data and Interpretable Machine Learning. Buildings 2025, 15, 1414. [Google Scholar] [CrossRef]
- Xie, Y.; Zhang, J.; Li, Y.; Zhu, Z.; Deng, J.; Li, Z. Integrating multi-source urban data with interpretable machine learning for uncovering the multidimensional drivers of urban vitality. Land 2024, 13, 2028. [Google Scholar] [CrossRef]
- Zheng, G.; Ding, L.; Zheng, J. A Multi-Dimensional Evaluation of Street Vitality in a Historic Neighborhood Using Multi-Source Geo-Data: A Case Study of Shuitingmen, Quzhou. ISPRS International Journal of Geo-Information 2025, 14, 240. [Google Scholar] [CrossRef]
- Guo, X.; Chen, H.; Yang, X. An evaluation of street dynamic vitality and its influential factors based on multi-source big data. ISPRS International Journal of Geo-Information 2021, 10, 143. [Google Scholar] [CrossRef]
- Yue, W.; Chen, Y.; Zhang, Q.; Liu, Y. Spatial explicit assessment of urban vitality using multi-source data: A case of Shanghai, China. Sustainability 2019, 11, 638. [Google Scholar] [CrossRef]
- Xia, C.; Zhang, A.; Yeh, A.G. The varying relationships between multidimensional urban form and urban vitality in Chinese megacities: Insights from a comparative analysis. Annals of the American Association of Geographers 2022, 112, 141–166. [Google Scholar]
- Zarin, S.Z.; Niroomand, M.; Heidari, A.A. Physical and social aspects of vitality case study: Traditional street and modern street in Tehran. Procedia-Social and Behavioral Sciences 2015, 170, 659–668. [Google Scholar]
- Wu, W.; Niu, X. Influence of built environment on urban vitality: Case study of Shanghai using mobile phone location data. Journal of Urban Planning and Development 2019, 145, 04019007. [Google Scholar] [CrossRef]
- Wu, W.; Niu, X.; Li, M. Influence of built environment on street vitality: A case study of West Nanjing Road in Shanghai based on mobile location data. Sustainability 2021, 13, 1840. [Google Scholar] [CrossRef]
- Wangbao, L. Spatial impact of the built environment on street vitality: A case study of the Tianhe District, Guangzhou. Frontiers in Environmental Science 2022, 10, 966562. [Google Scholar] [CrossRef]
- Yu, B.; Sun, J.; Wang, Z.; Jin, S. Influencing factors of street vitality in historic districts based on multisource data: evidence from China. ISPRS International Journal of Geo-Information 2024, 13, 277. [Google Scholar] [CrossRef]
- Li, Y.; Yabuki, N.; Fukuda, T. Exploring the association between street built environment and street vitality using deep learning methods. Sustainable Cities and Society 2022, 79, 103656. [Google Scholar] [CrossRef]
- Chen, L.; Jiang, X.; Tan, L.; Chen, C.; Yang, S.; You, W. Analysis of Spatial Vitality Characteristics and Influencing Factors of Old Neighborhoods: A Case Study of Ya’an Xicheng Neighborhood. Buildings 2024, 14, 3348. [Google Scholar] [CrossRef]
- Khanam, R.; Hussain, M. Yolov11: An overview of the key architectural enhancements. arXiv preprint arXiv:2410.17725 2024.
- Yang, Z.; Wu, Q.; Zhang, F.; Zhang, X.; Chen, X.; Gao, Y. A new semantic segmentation method for remote sensing images integrating coordinate attention and SPD-Conv. Symmetry 2023, 15, 1037. [Google Scholar] [CrossRef]
- Xi, Y.; Qu, D.; Du, L. DDM-YOLOv8s for Small Object Detection in Remote Sensing Images. In Proceedings of the 2024 7th International Conference on Machine Learning and Natural Language Processing (MLNLP). IEEE, 2024, pp. 1–7.
- Zhou, Q.; Zheng, Y. Evaluation research on the spatial vitality of Huaihe Road commercial block in Hefei city based on multi-source data correlation. Sustainability 2024, 16, 3372. [Google Scholar] [CrossRef]
- Hua, C.; Lv, W. Optimizing Semantic Segmentation of Street Views with SP-UNet for Comprehensive Street Quality Evaluation. Sustainability 2025, 17, 1209. [Google Scholar] [CrossRef]
- Li, Z.; Zhao, G. Revealing the spatio-temporal heterogeneity of the association between the built environment and urban vitality in Shenzhen. ISPRS International Journal of Geo-Information 2023, 12, 433. [Google Scholar] [CrossRef]
- Jiang, F.; Ma, J. Predicting urban vitality at regional scales: A deep learning approach to modelling population density and pedestrian flows. Smart Cities 2025, 8, 58. [Google Scholar] [CrossRef]
- Zhang, R.; Lu, Y.; Song, Z. YOLO sparse training and model pruning for street view house numbers recognition. In Proceedings of the Journal of Physics: Conference Series. IOP Publishing, 2023, Vol. 2646, p. 012025.
- Yang, J.; Li, X.; Du, J.; Cheng, C. Exploring the relationship between urban street spatial patterns and street vitality: A case study of Guiyang, China. International journal of environmental research and public health 2023, 20, 1646. [Google Scholar] [CrossRef] [PubMed]
Figure 1.
Road network in the study area.
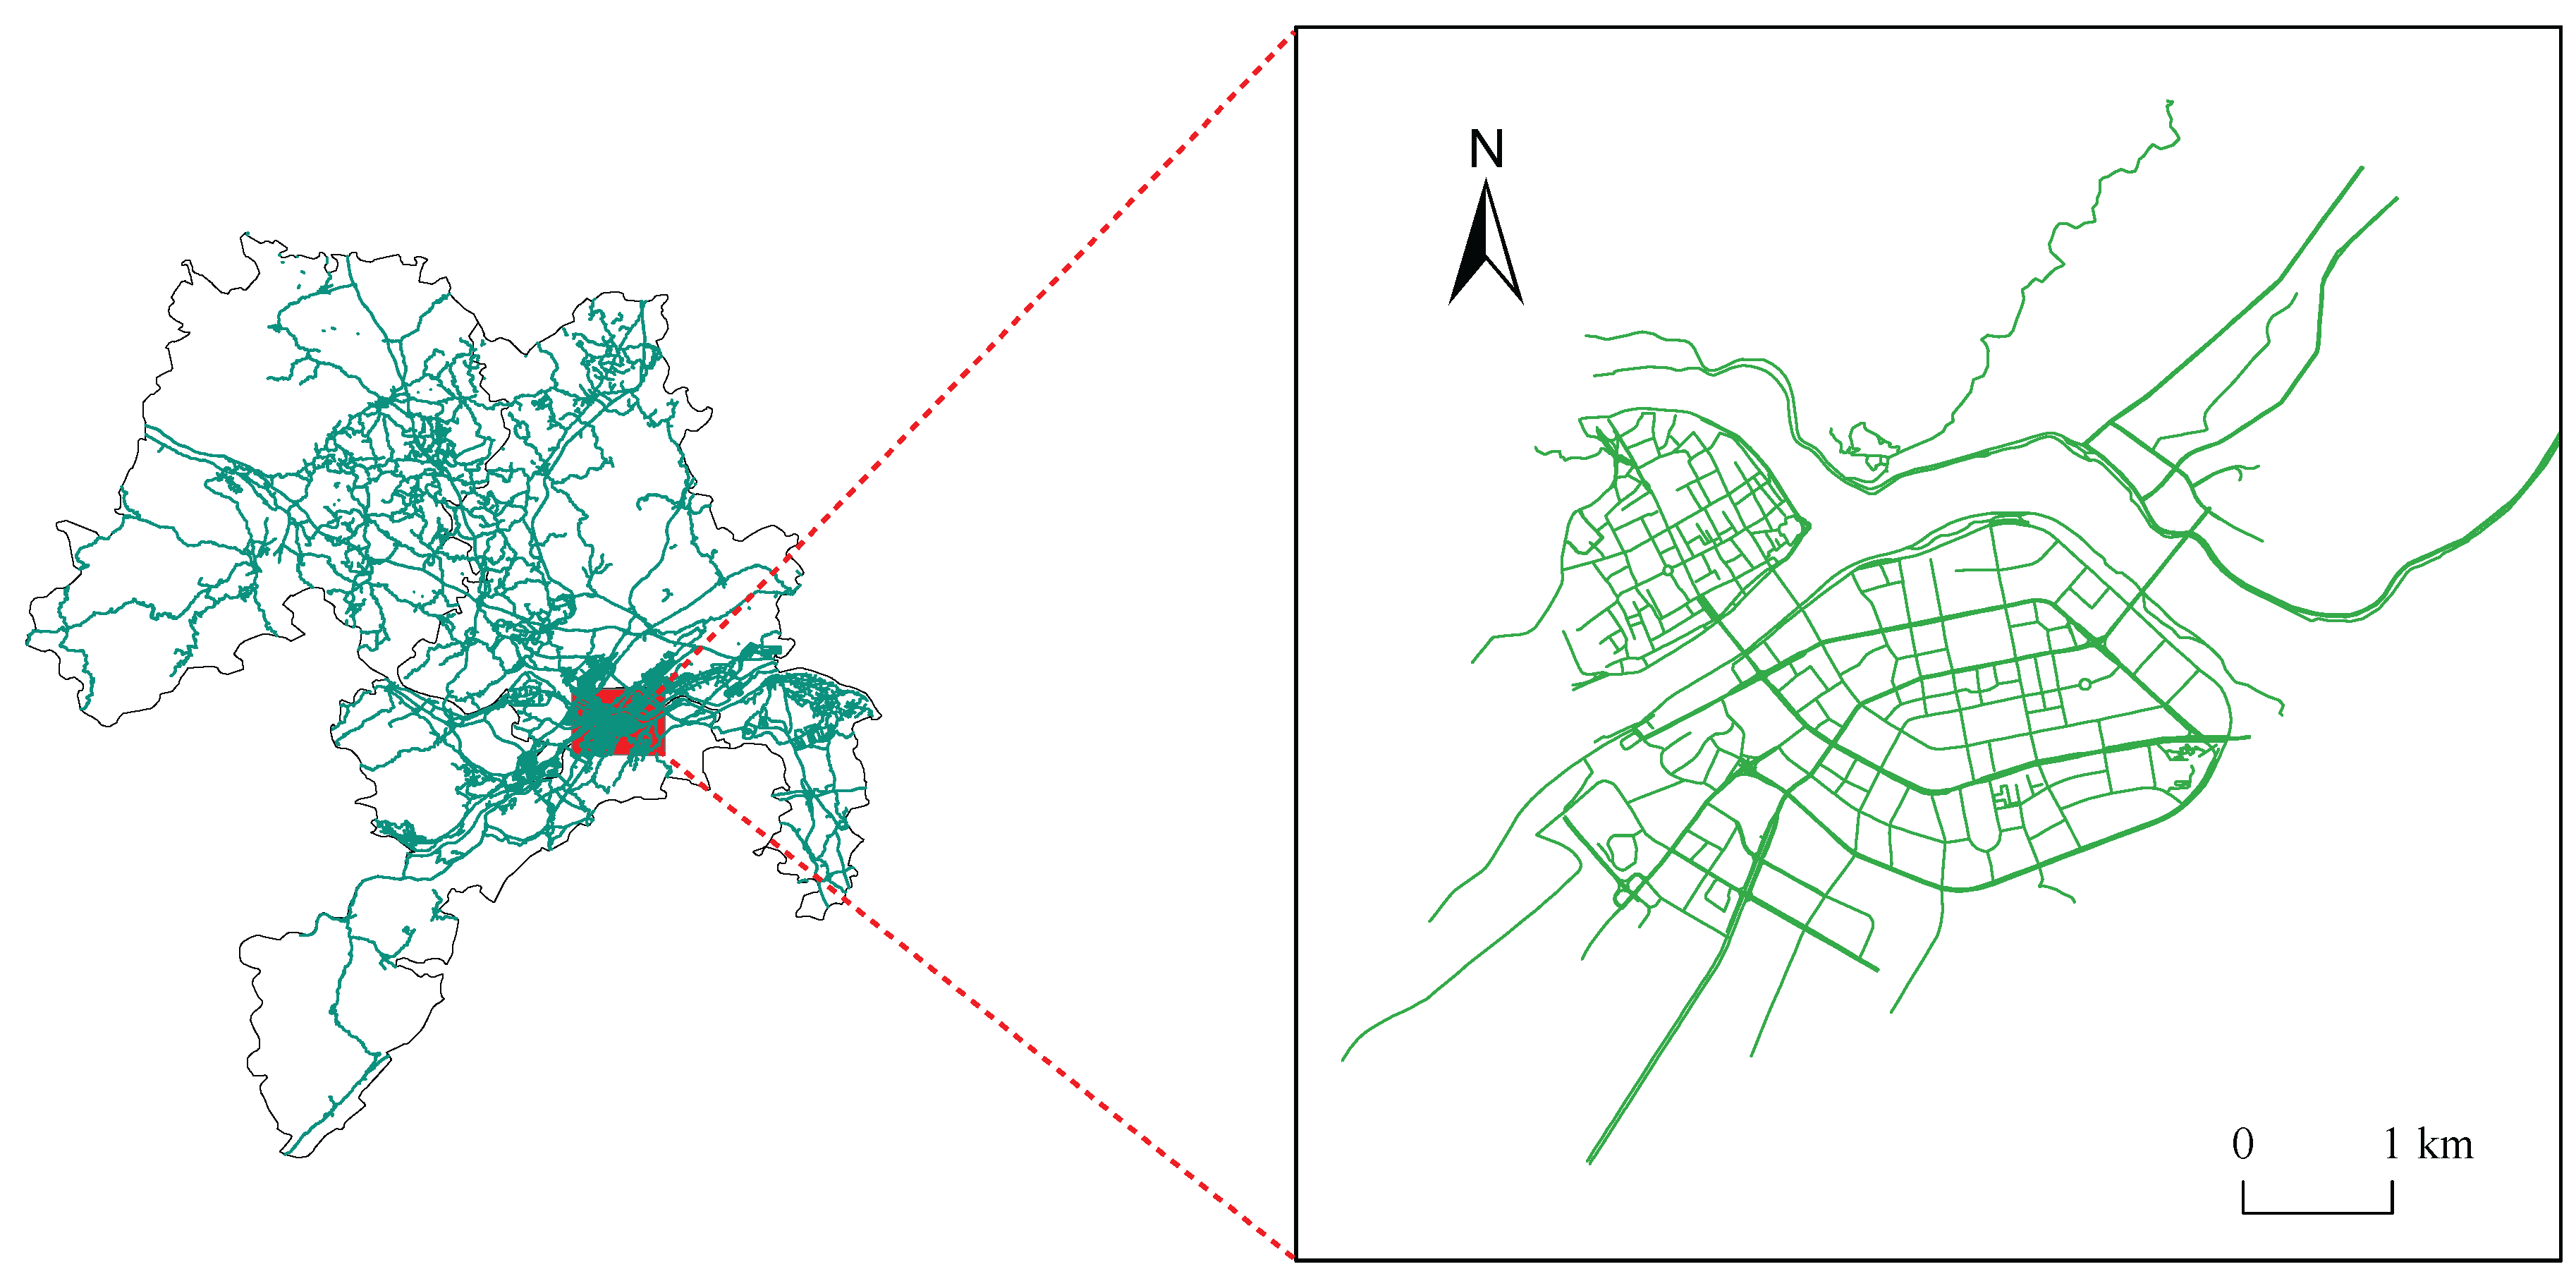
Figure 2.
Thermal data in the study area.
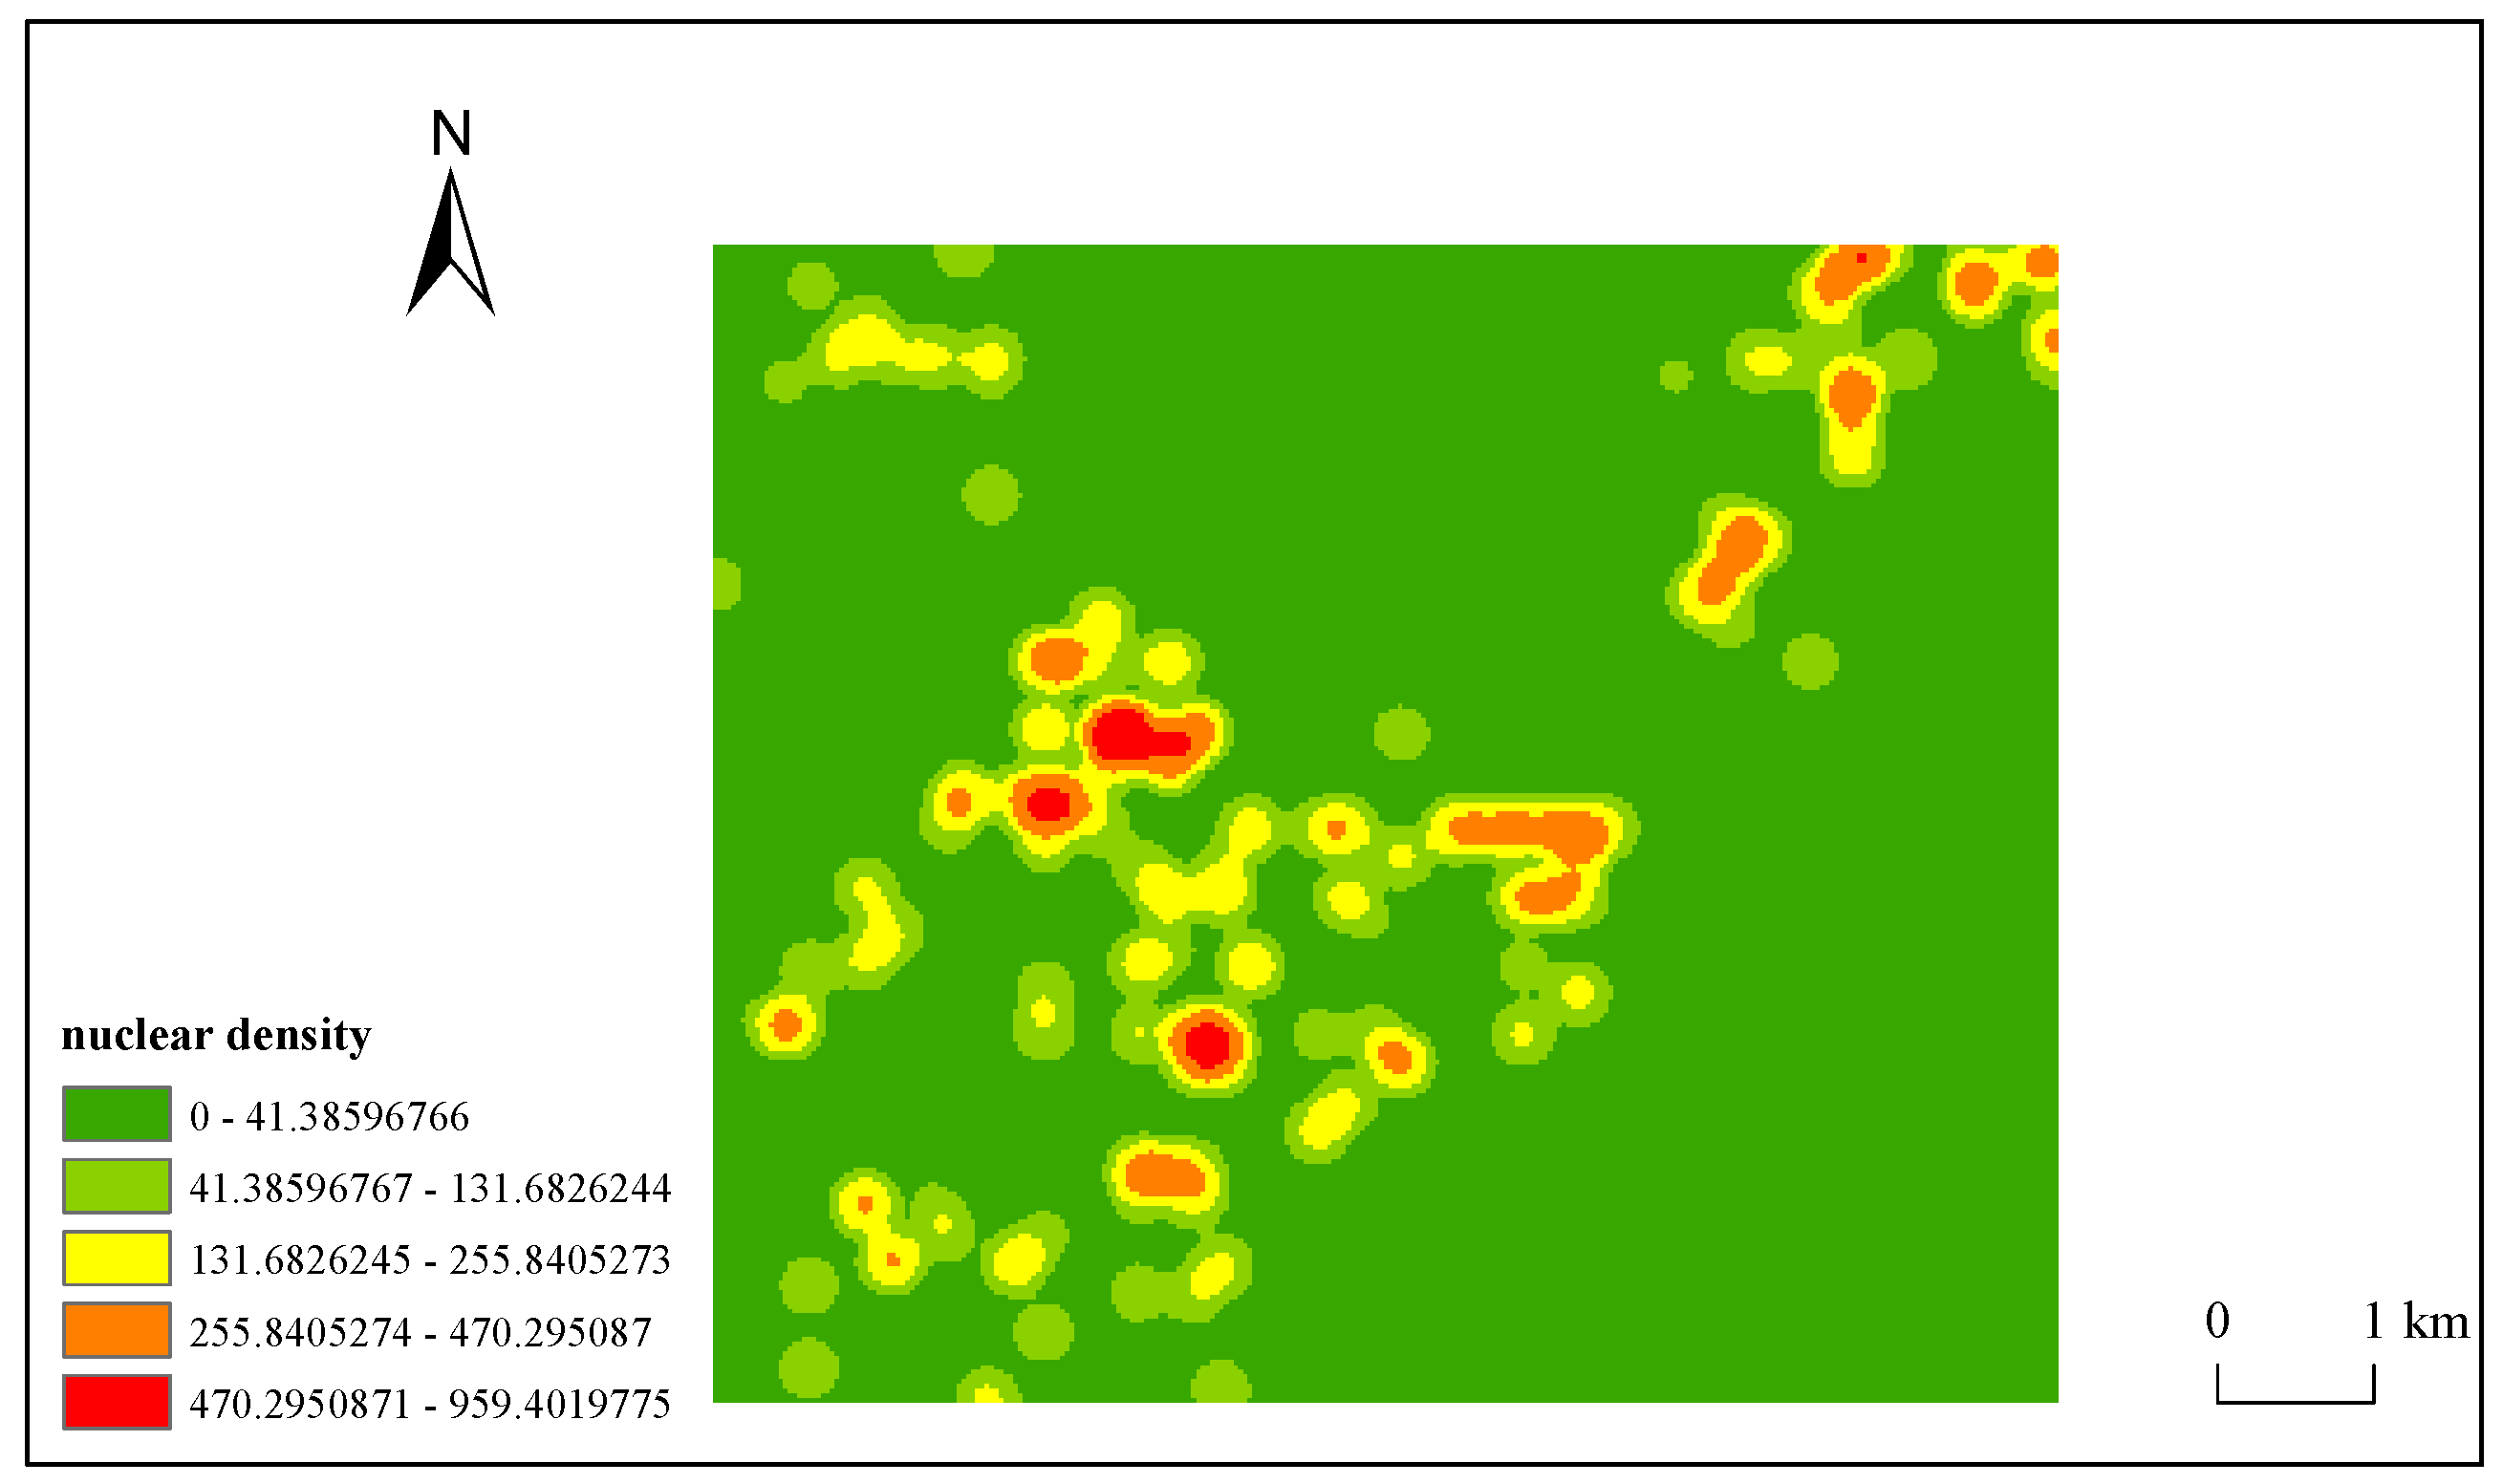
Figure 3.
Street view images.
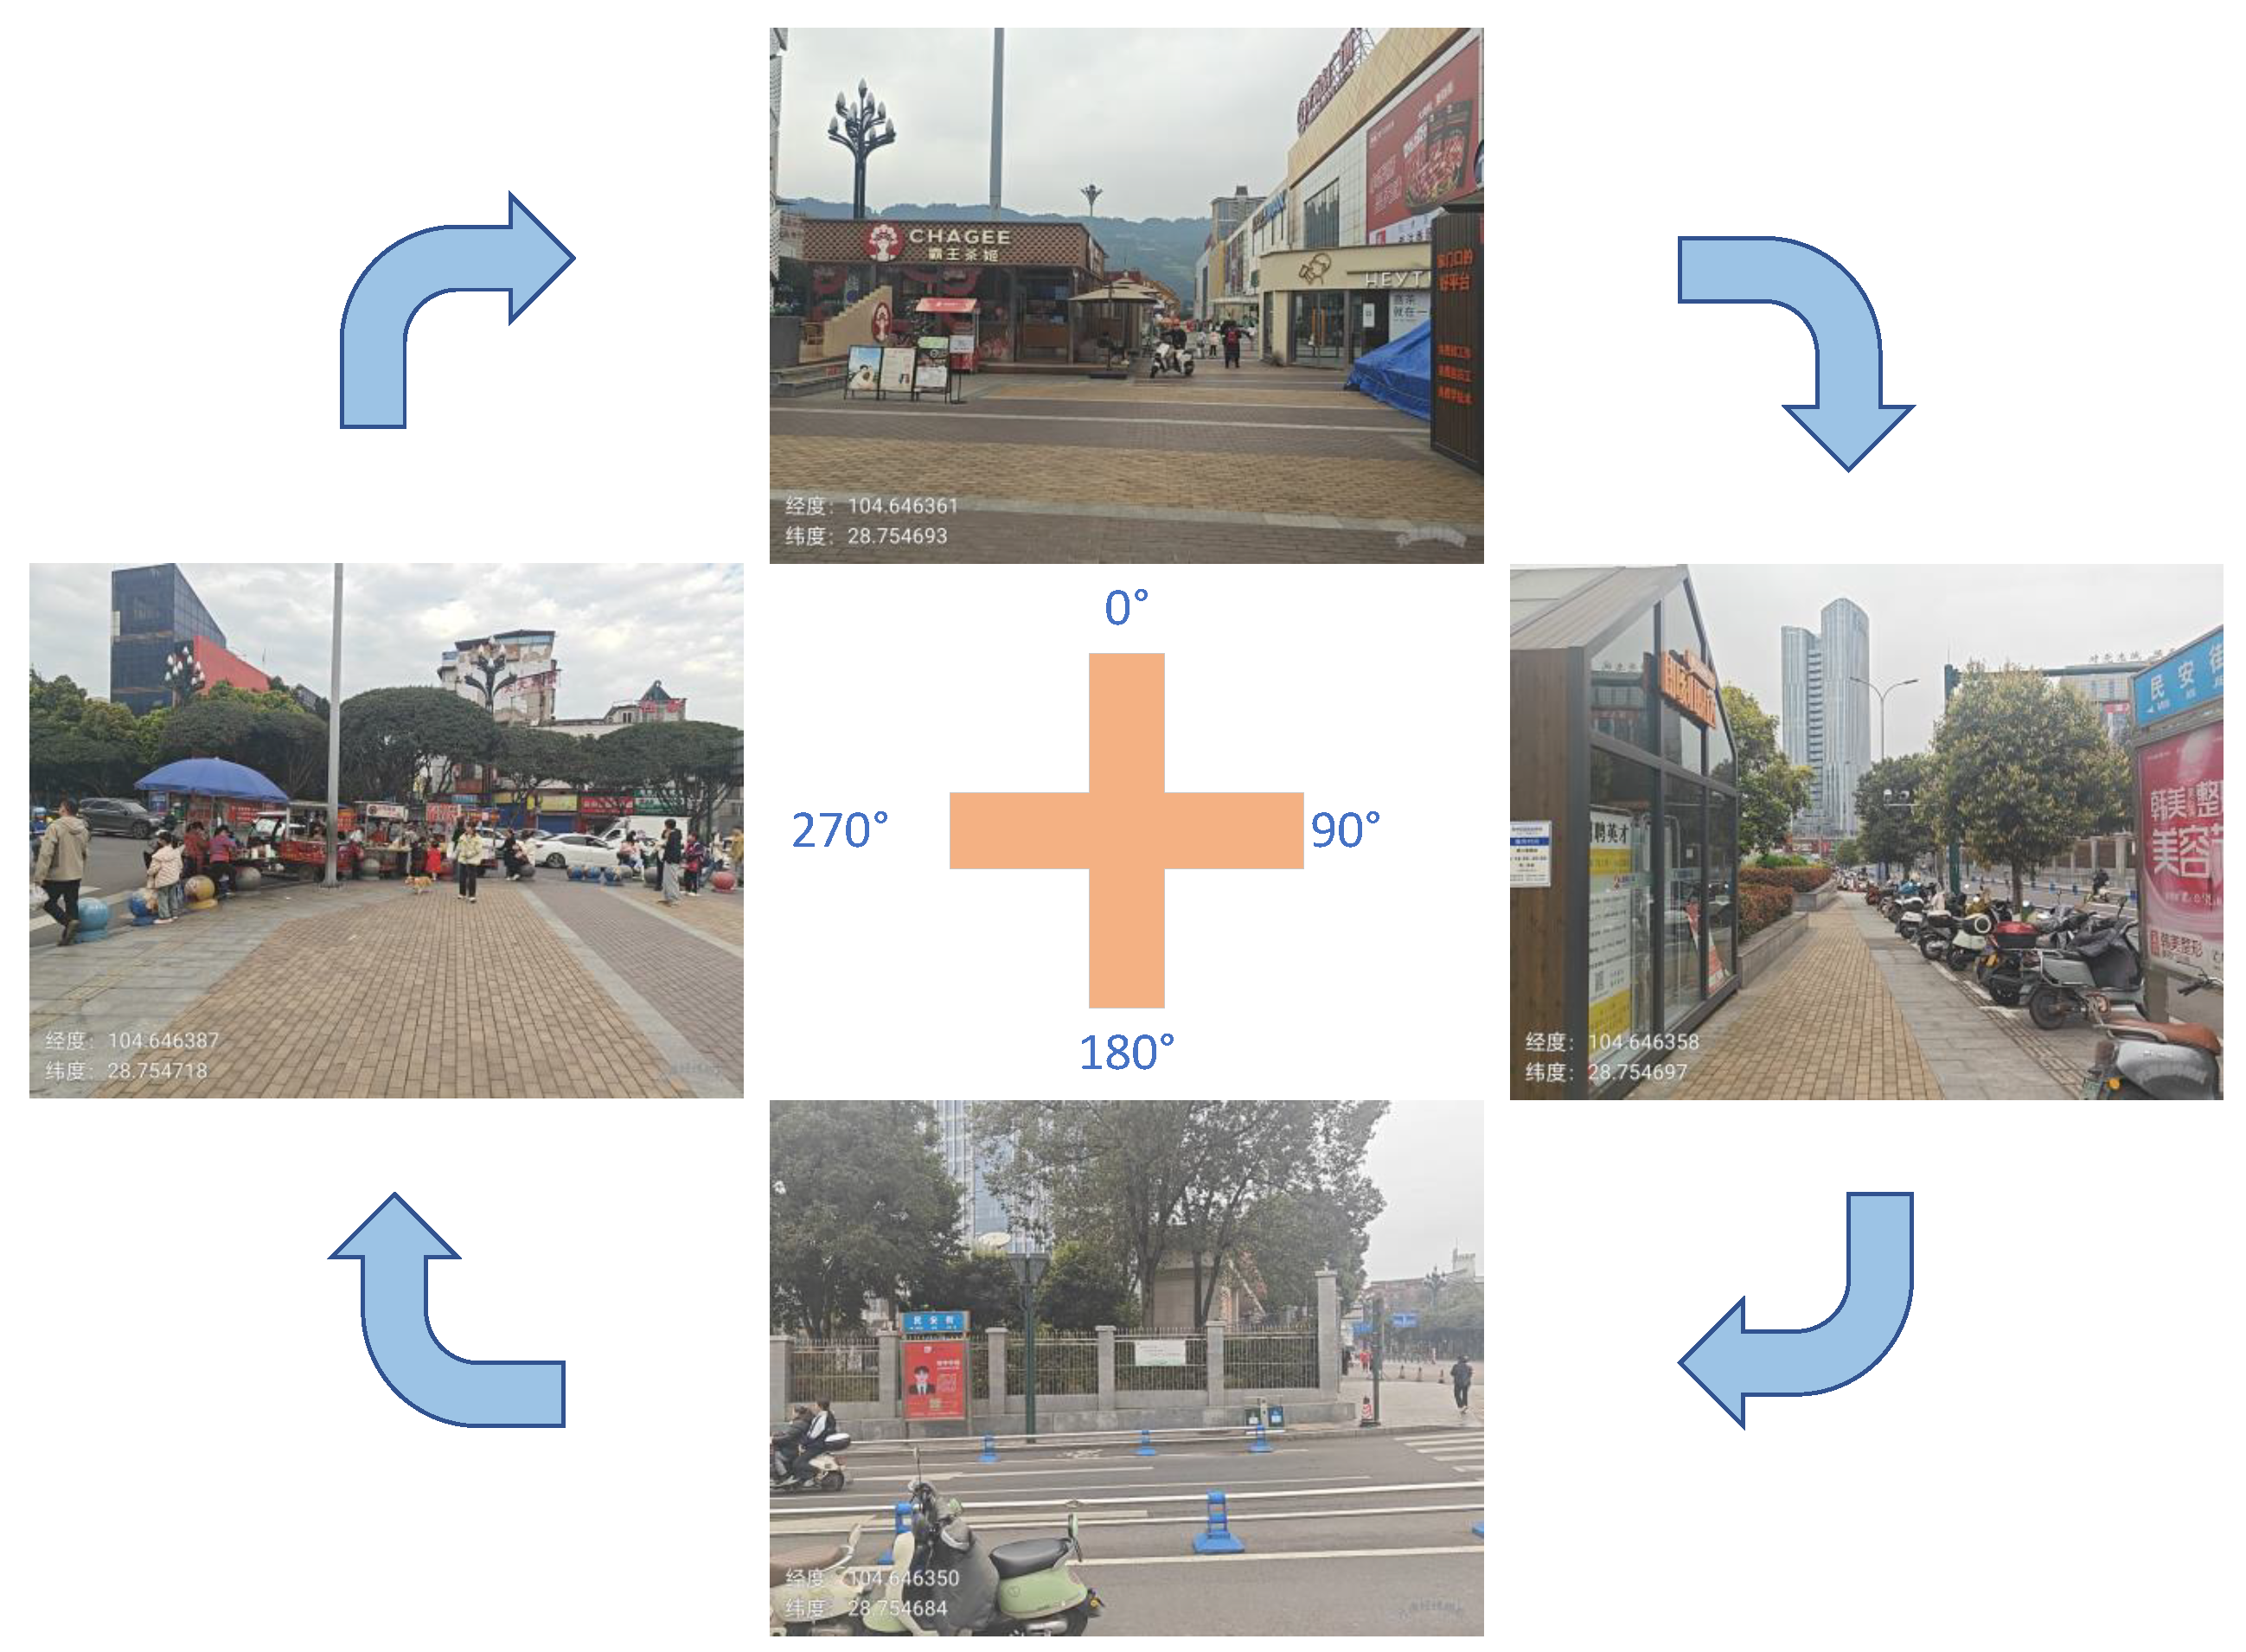
Figure 4.
Research framework.
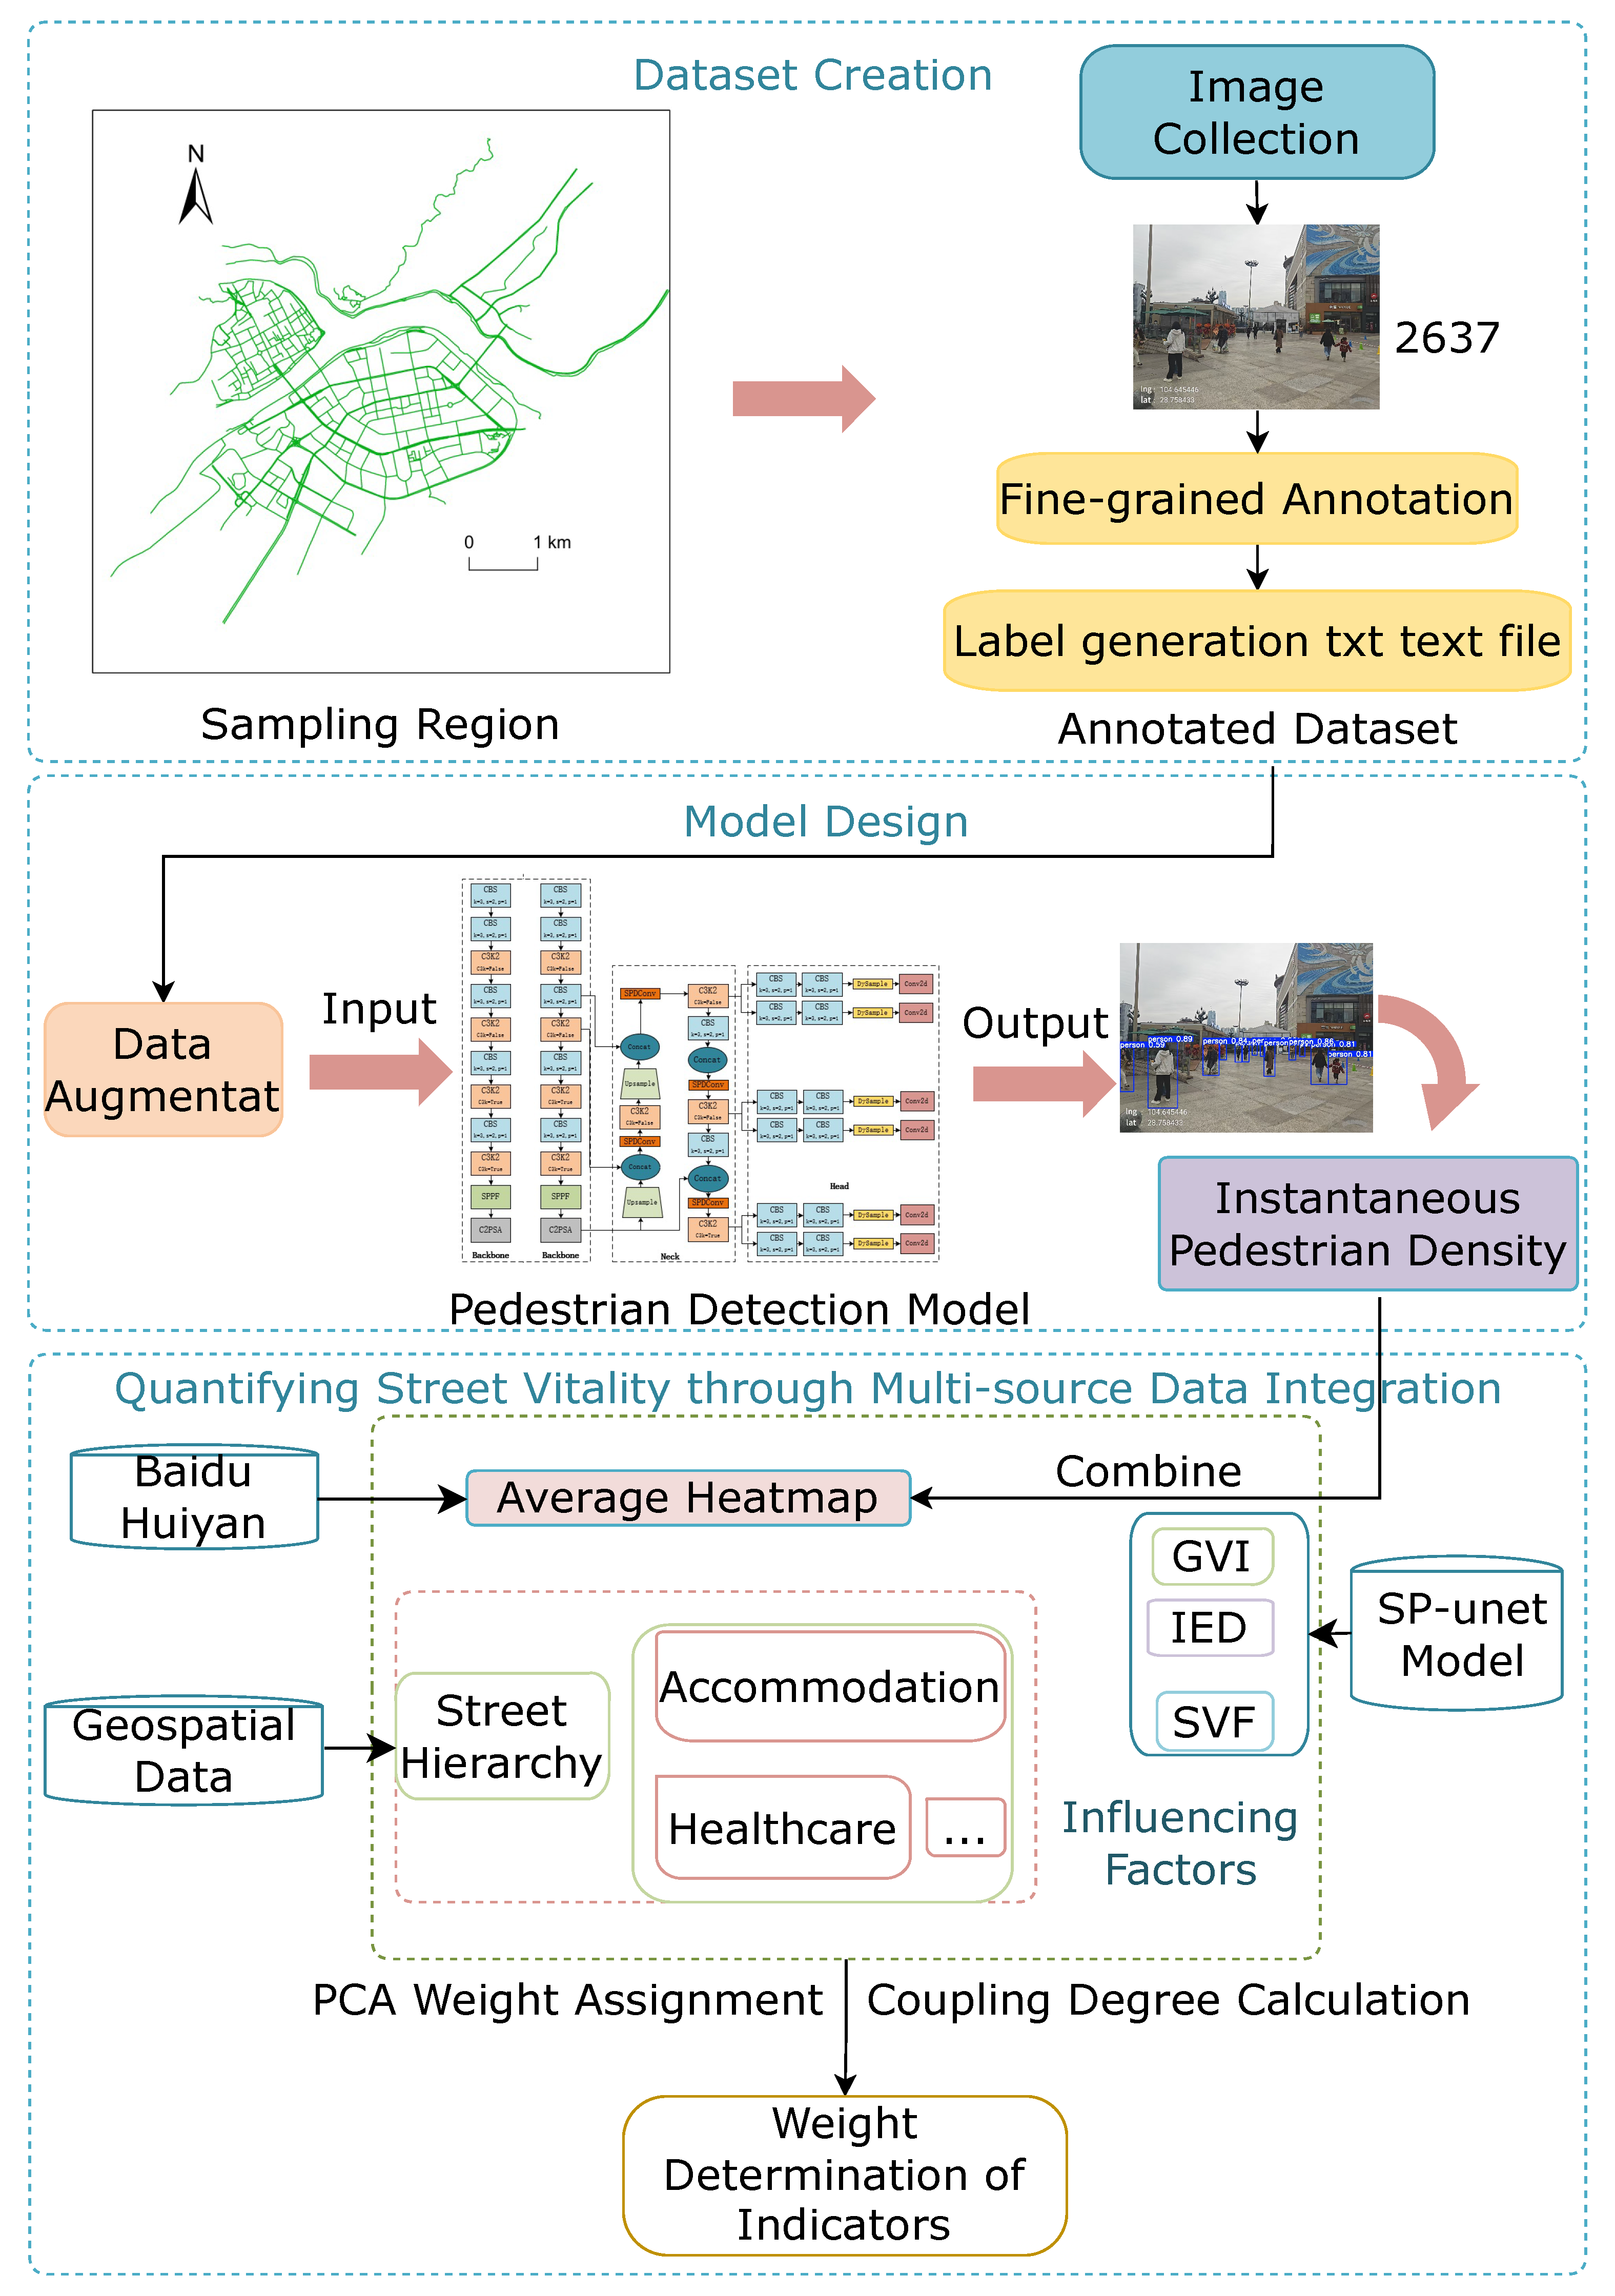
Figure 5.
Improve the YOLOv11 network architecture.
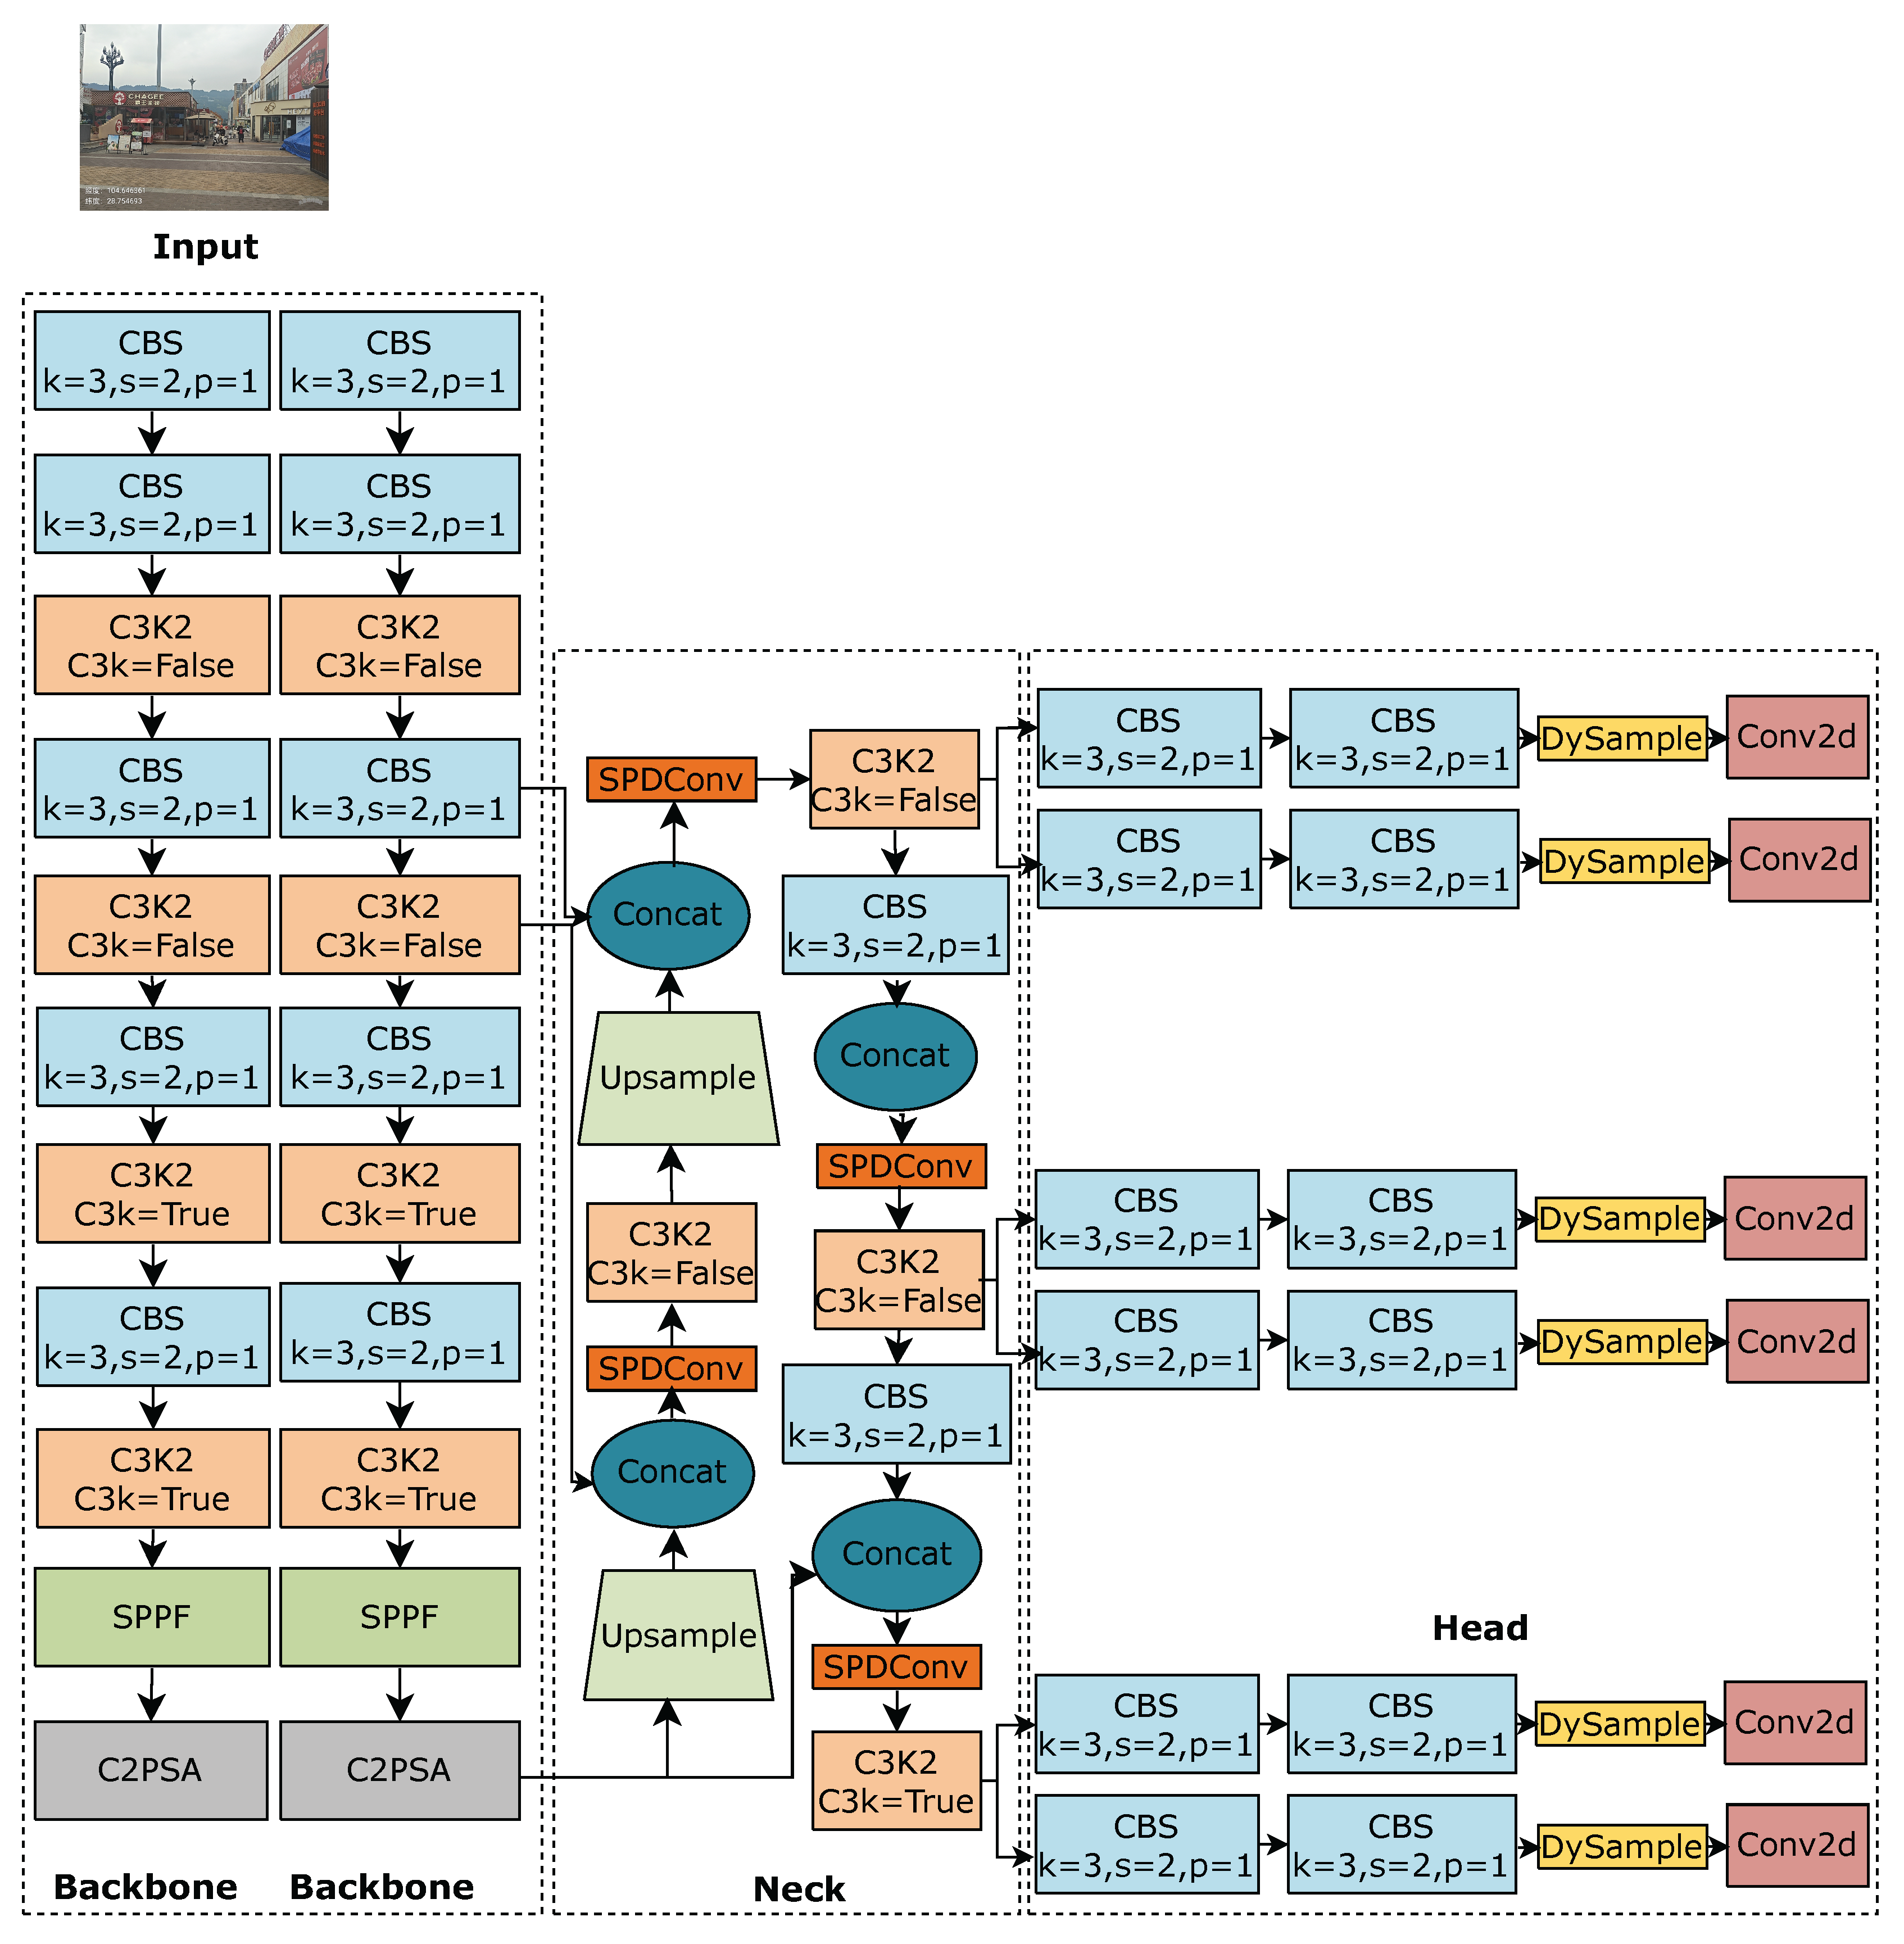
Figure 6.
Two-backbone network architecture.
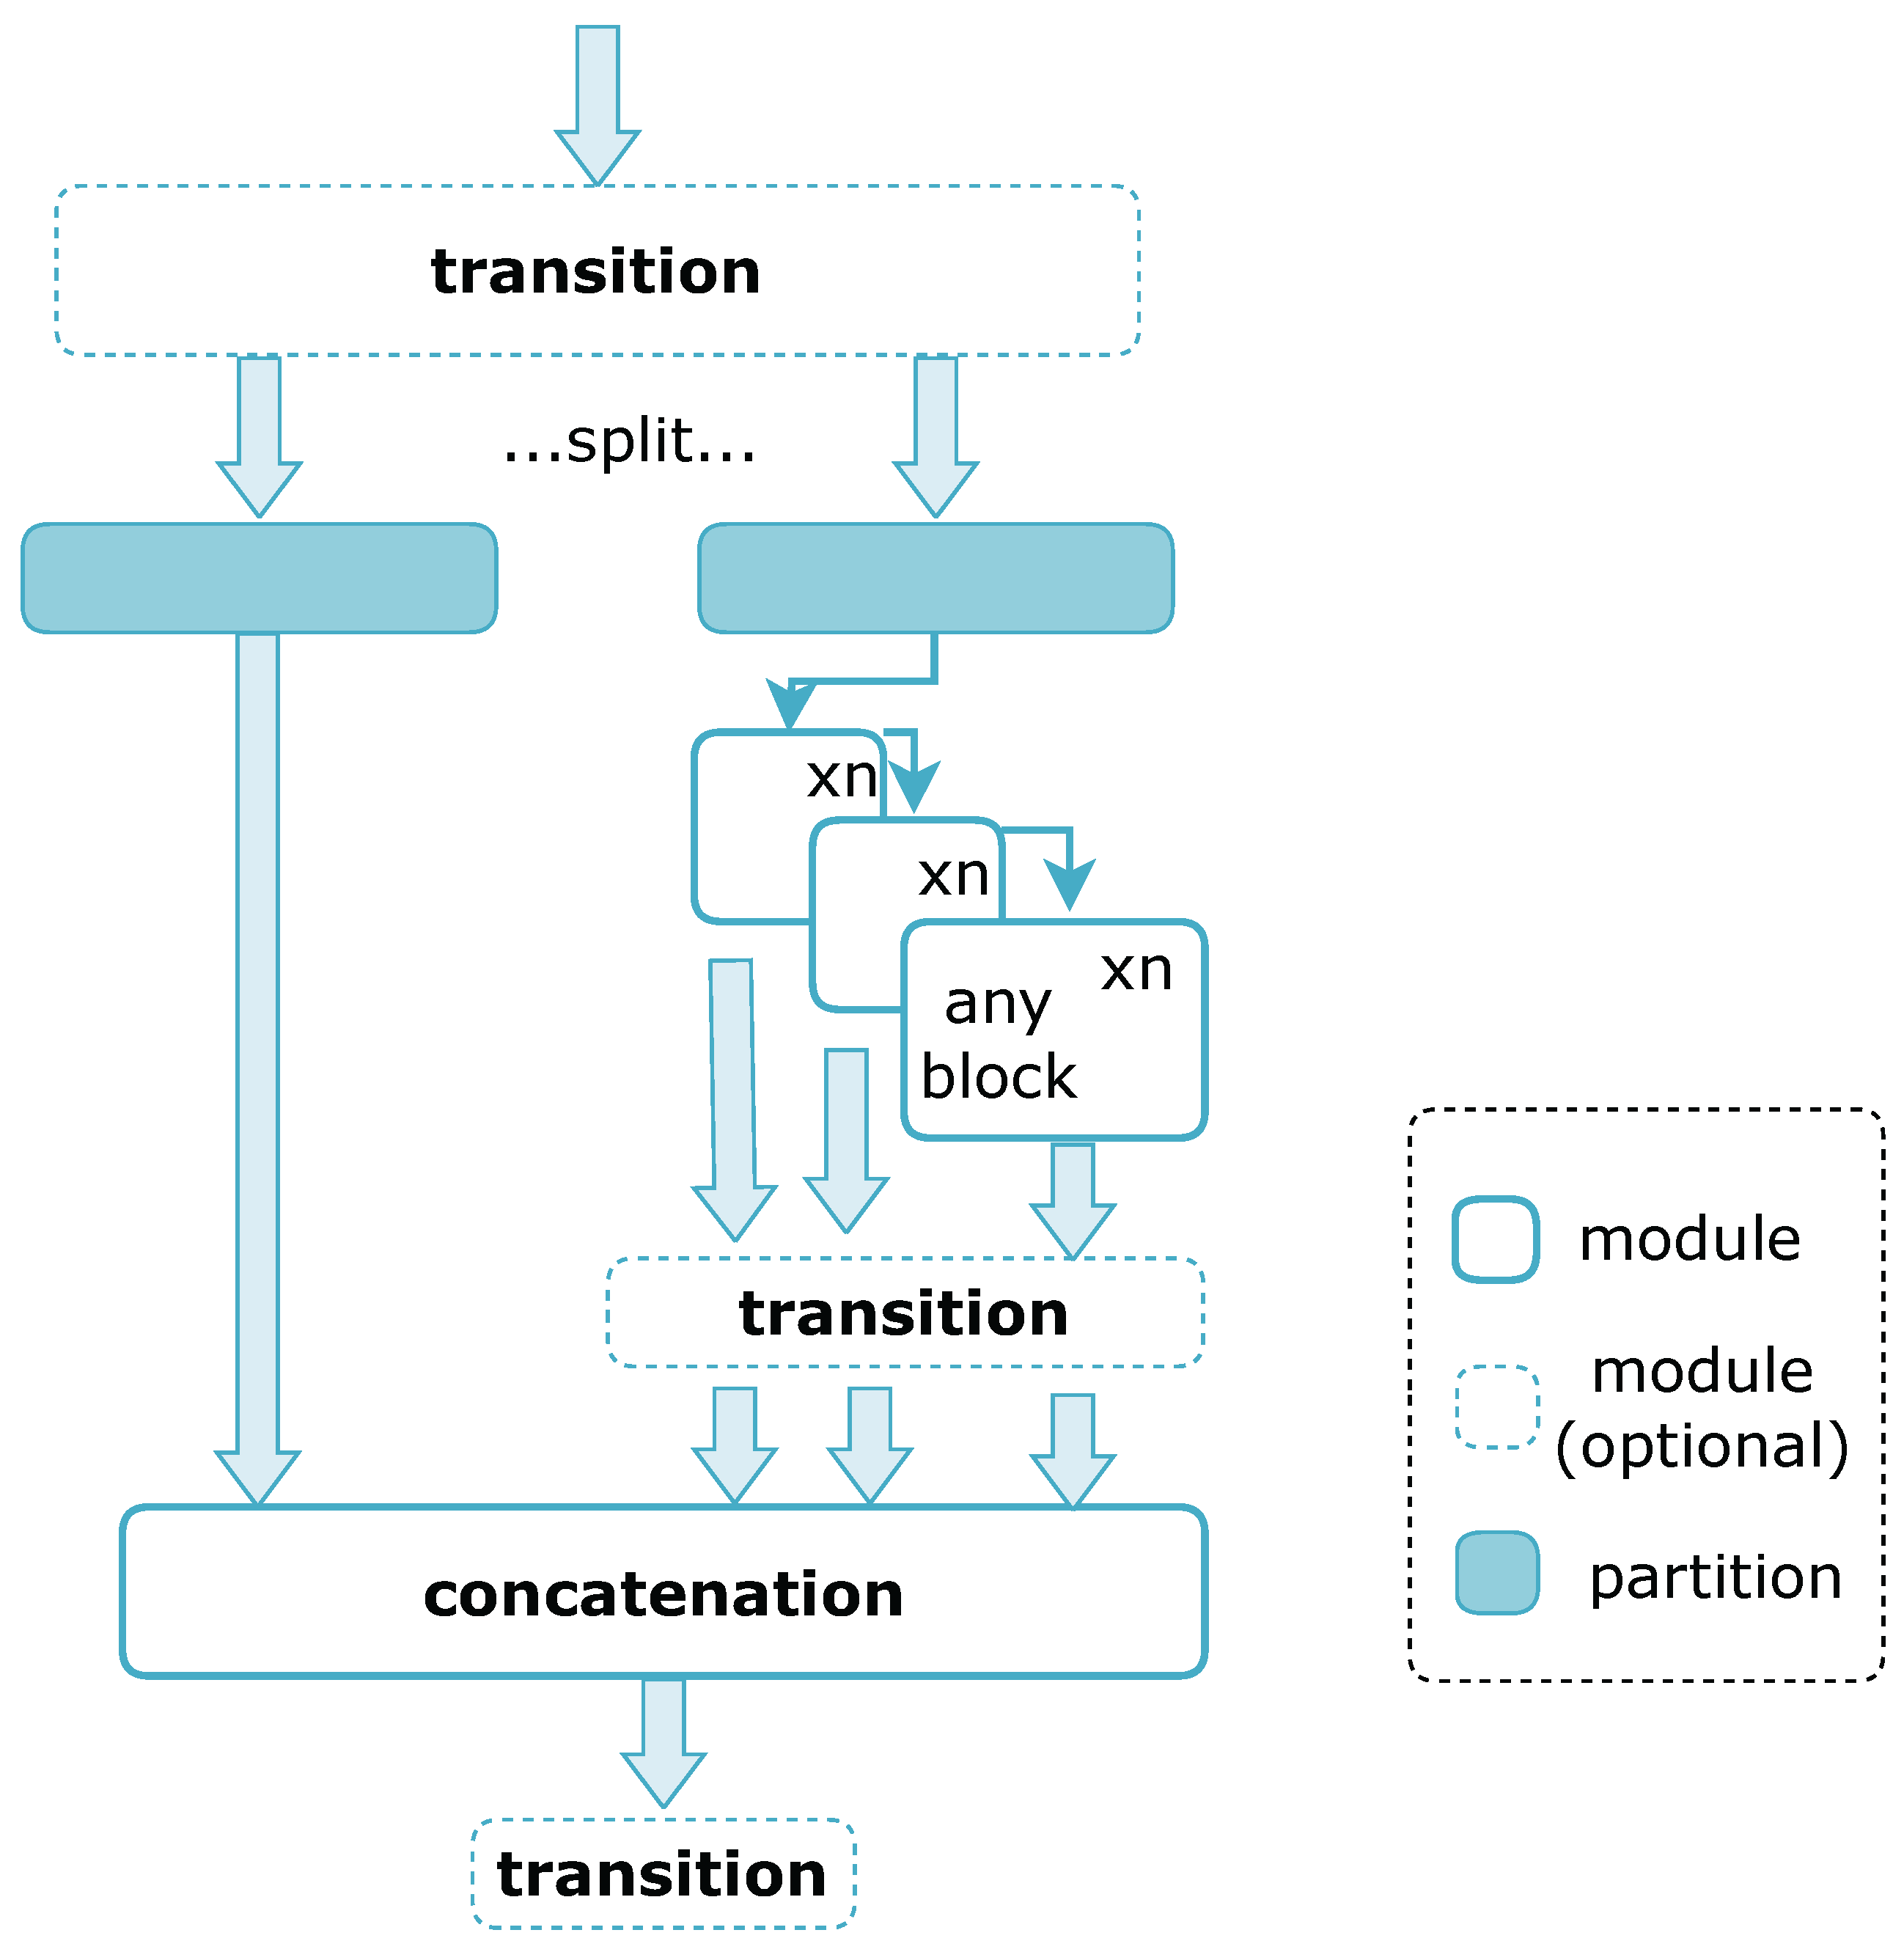
Figure 7.
SPDConv network architecture.
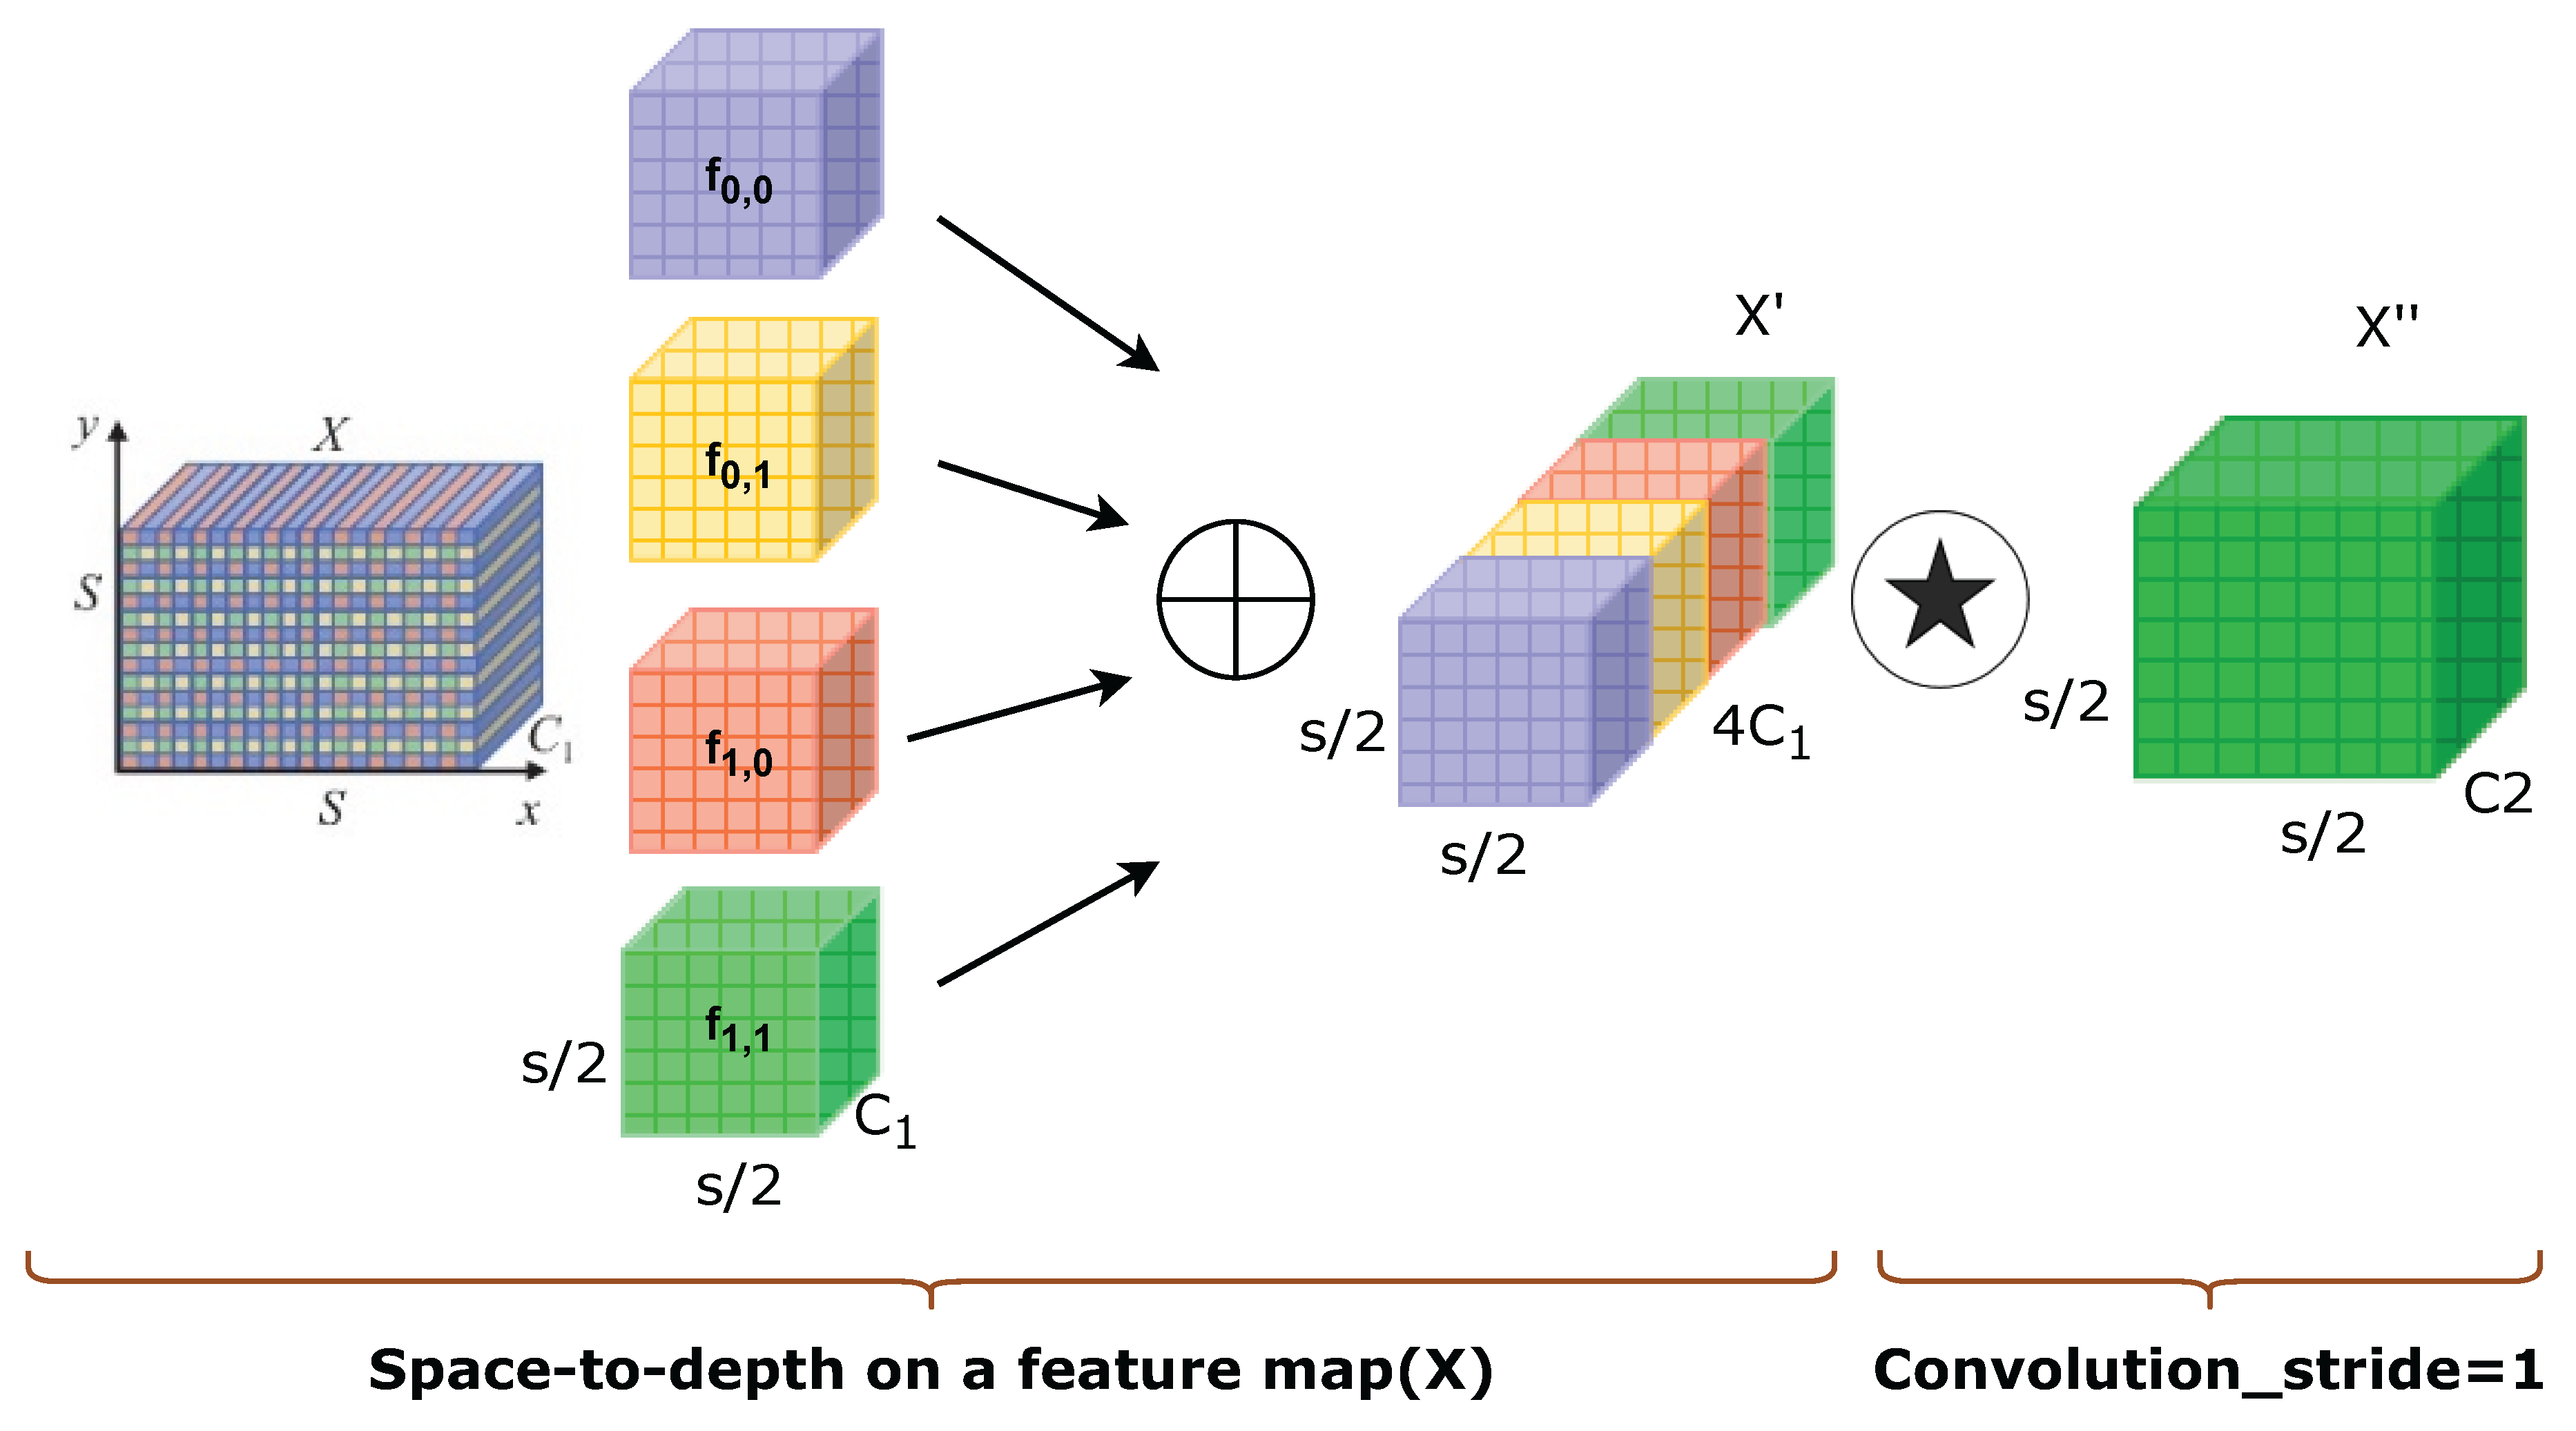
Figure 8.
dysample network architecture.
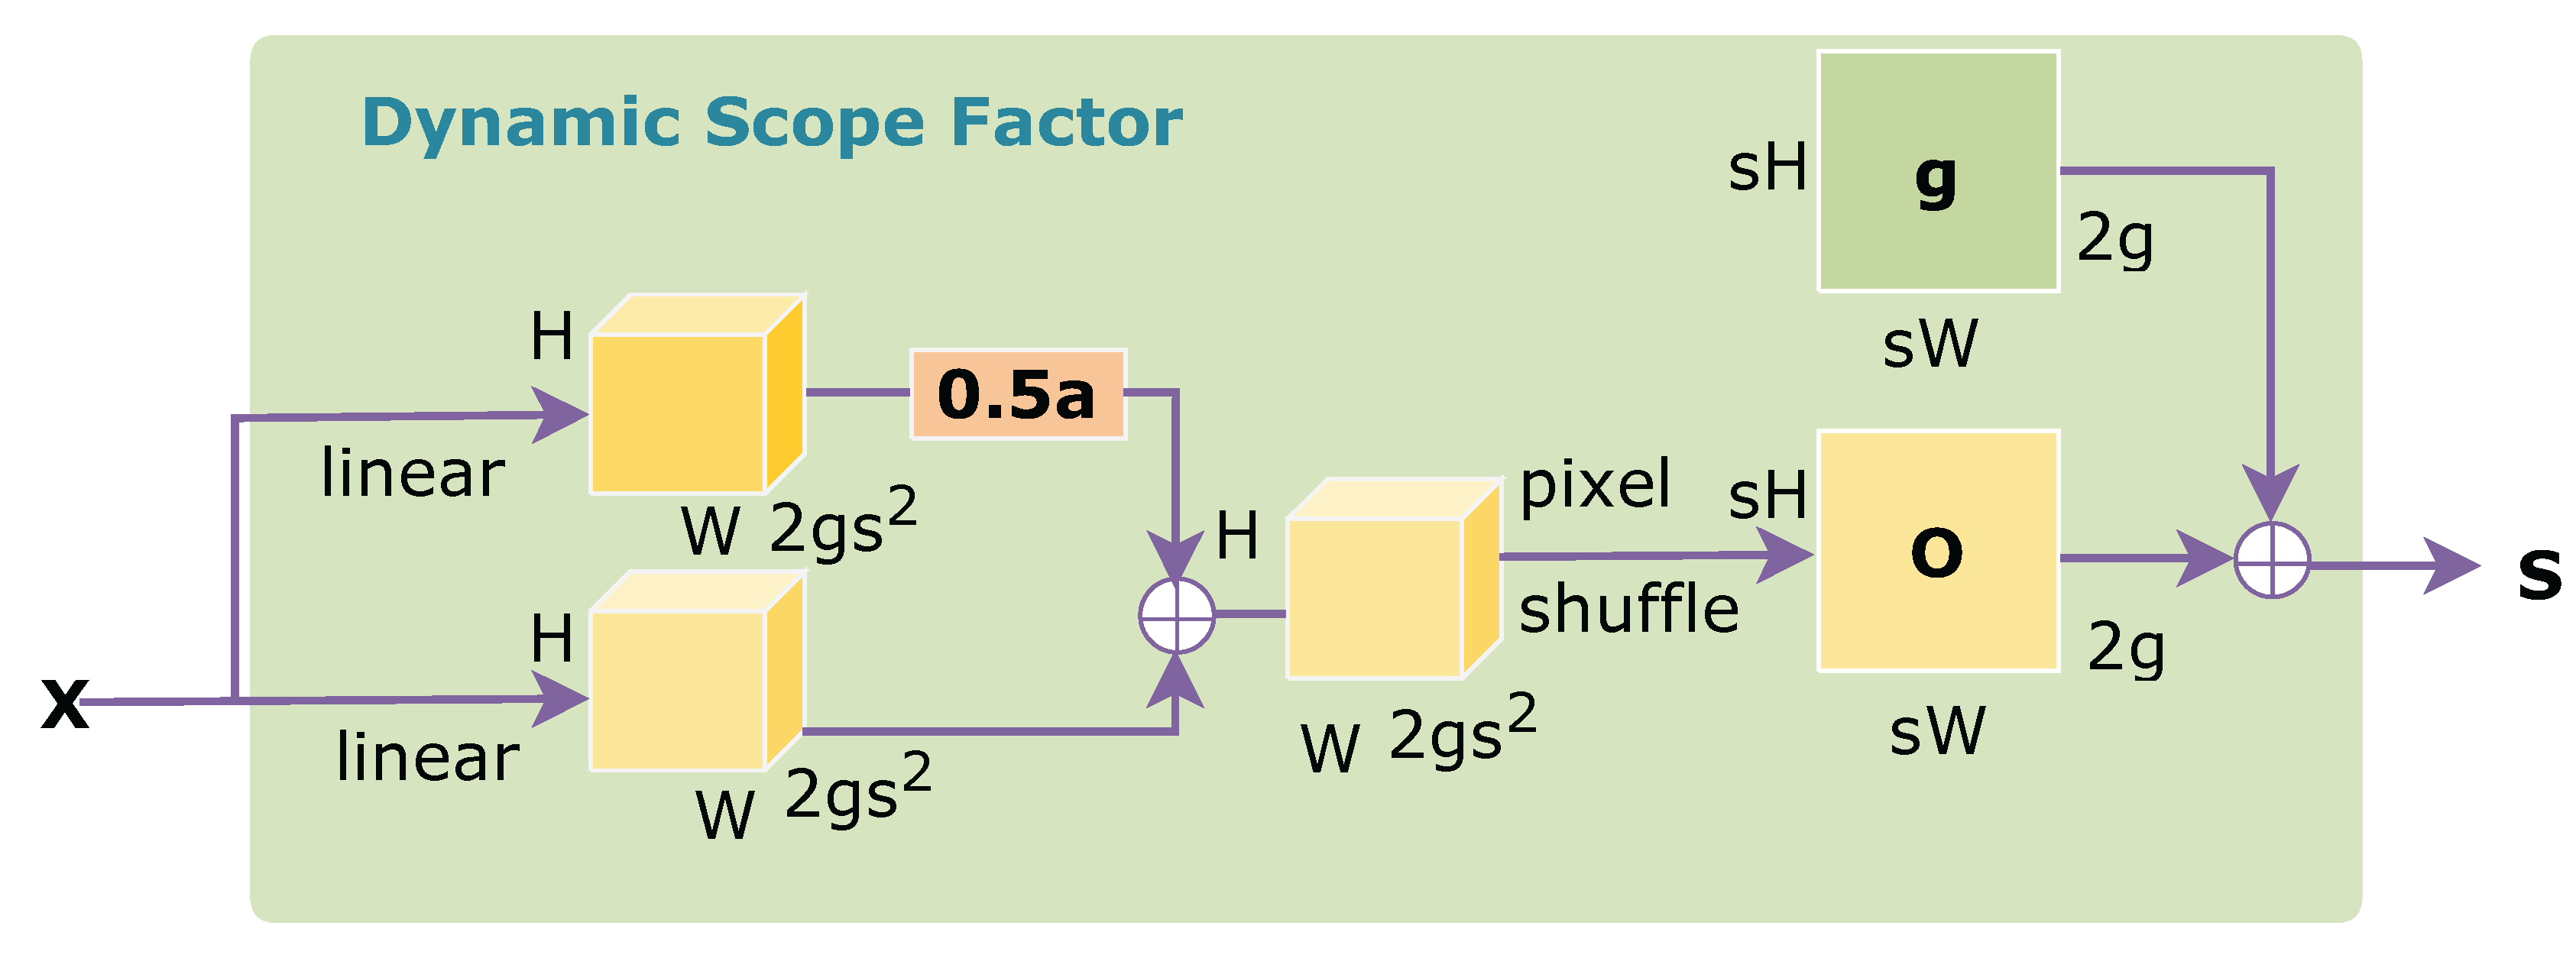
Figure 9.
Pedestrian Detection:(a) Original Image;(b) Result Image.
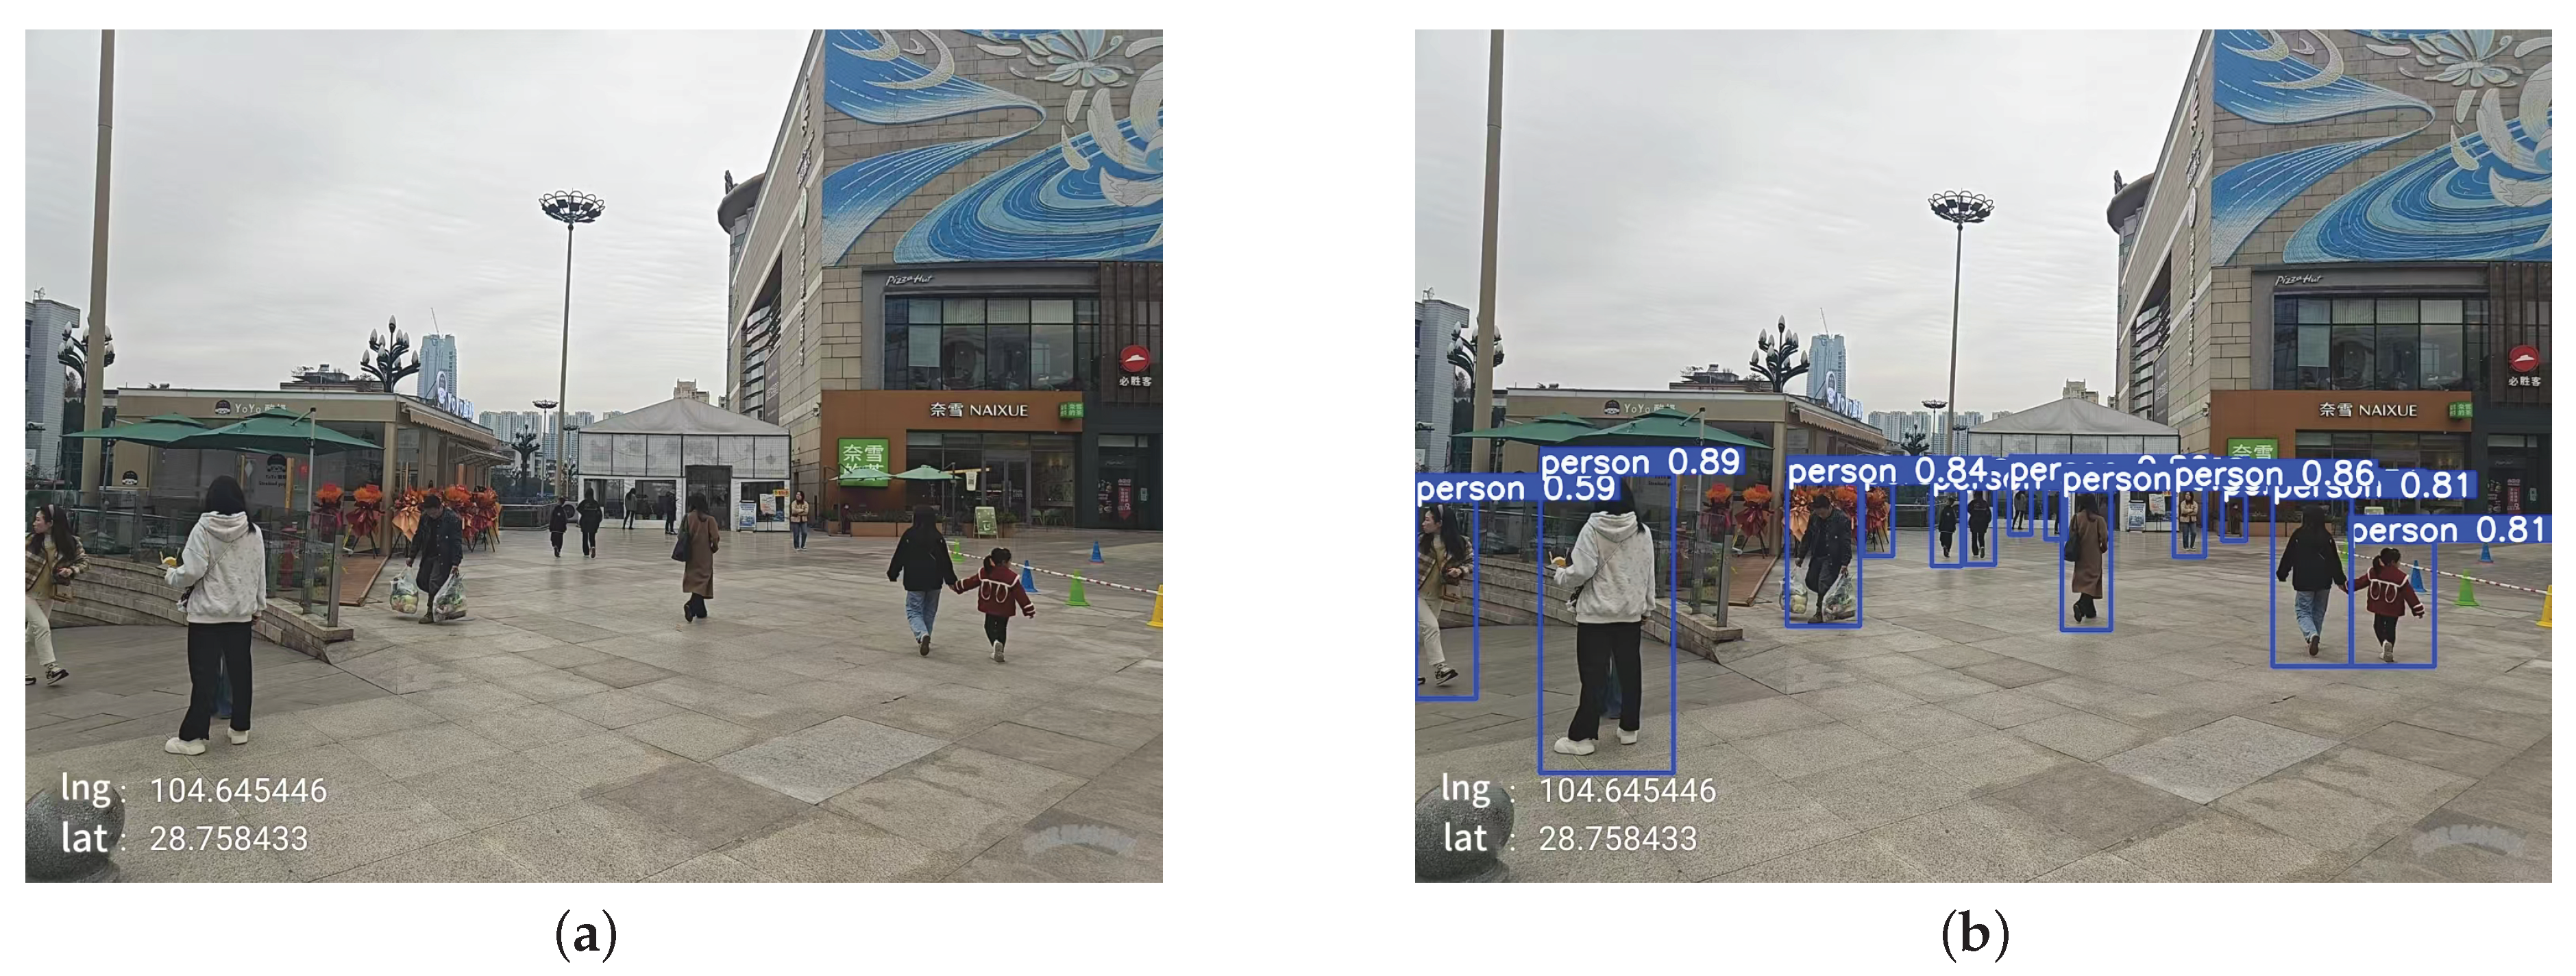
Figure 10.
Spatial Distribution of Various Influencing Factors:(a) poi density;(b) bus stop density;(c) intersection density;(d) sky openness;(e) green view index;(f) interface enclosure degree;(g) instantaneous vitality intensity;(h) average vitality intensity
Figure 10.
Spatial Distribution of Various Influencing Factors:(a) poi density;(b) bus stop density;(c) intersection density;(d) sky openness;(e) green view index;(f) interface enclosure degree;(g) instantaneous vitality intensity;(h) average vitality intensity
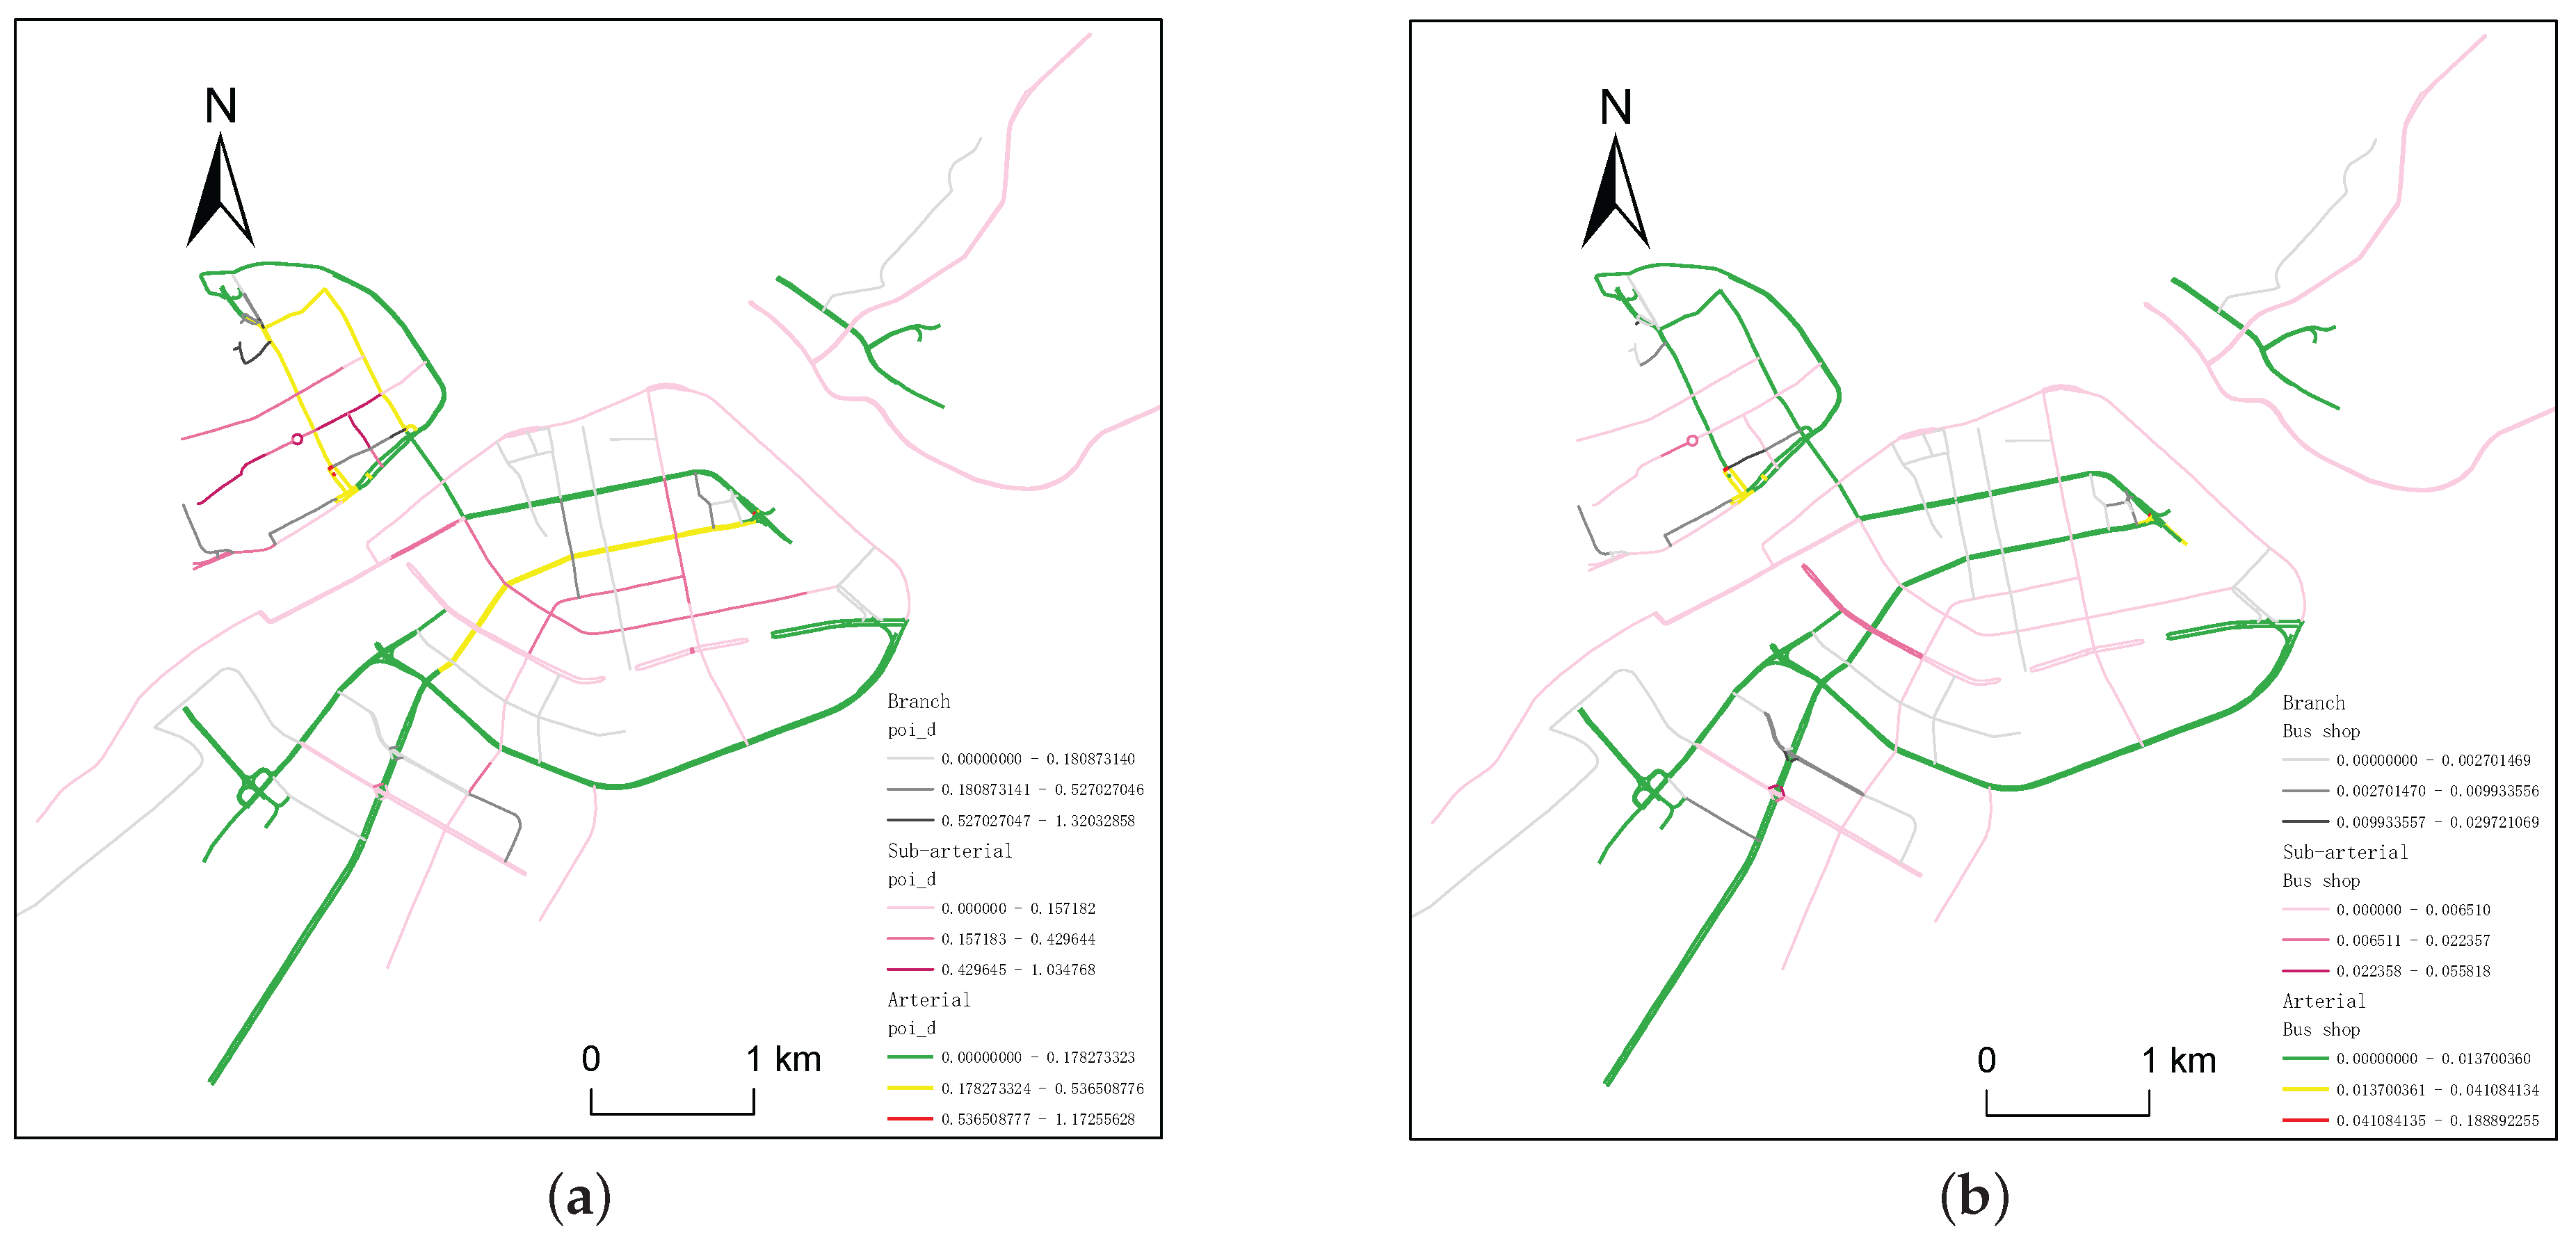
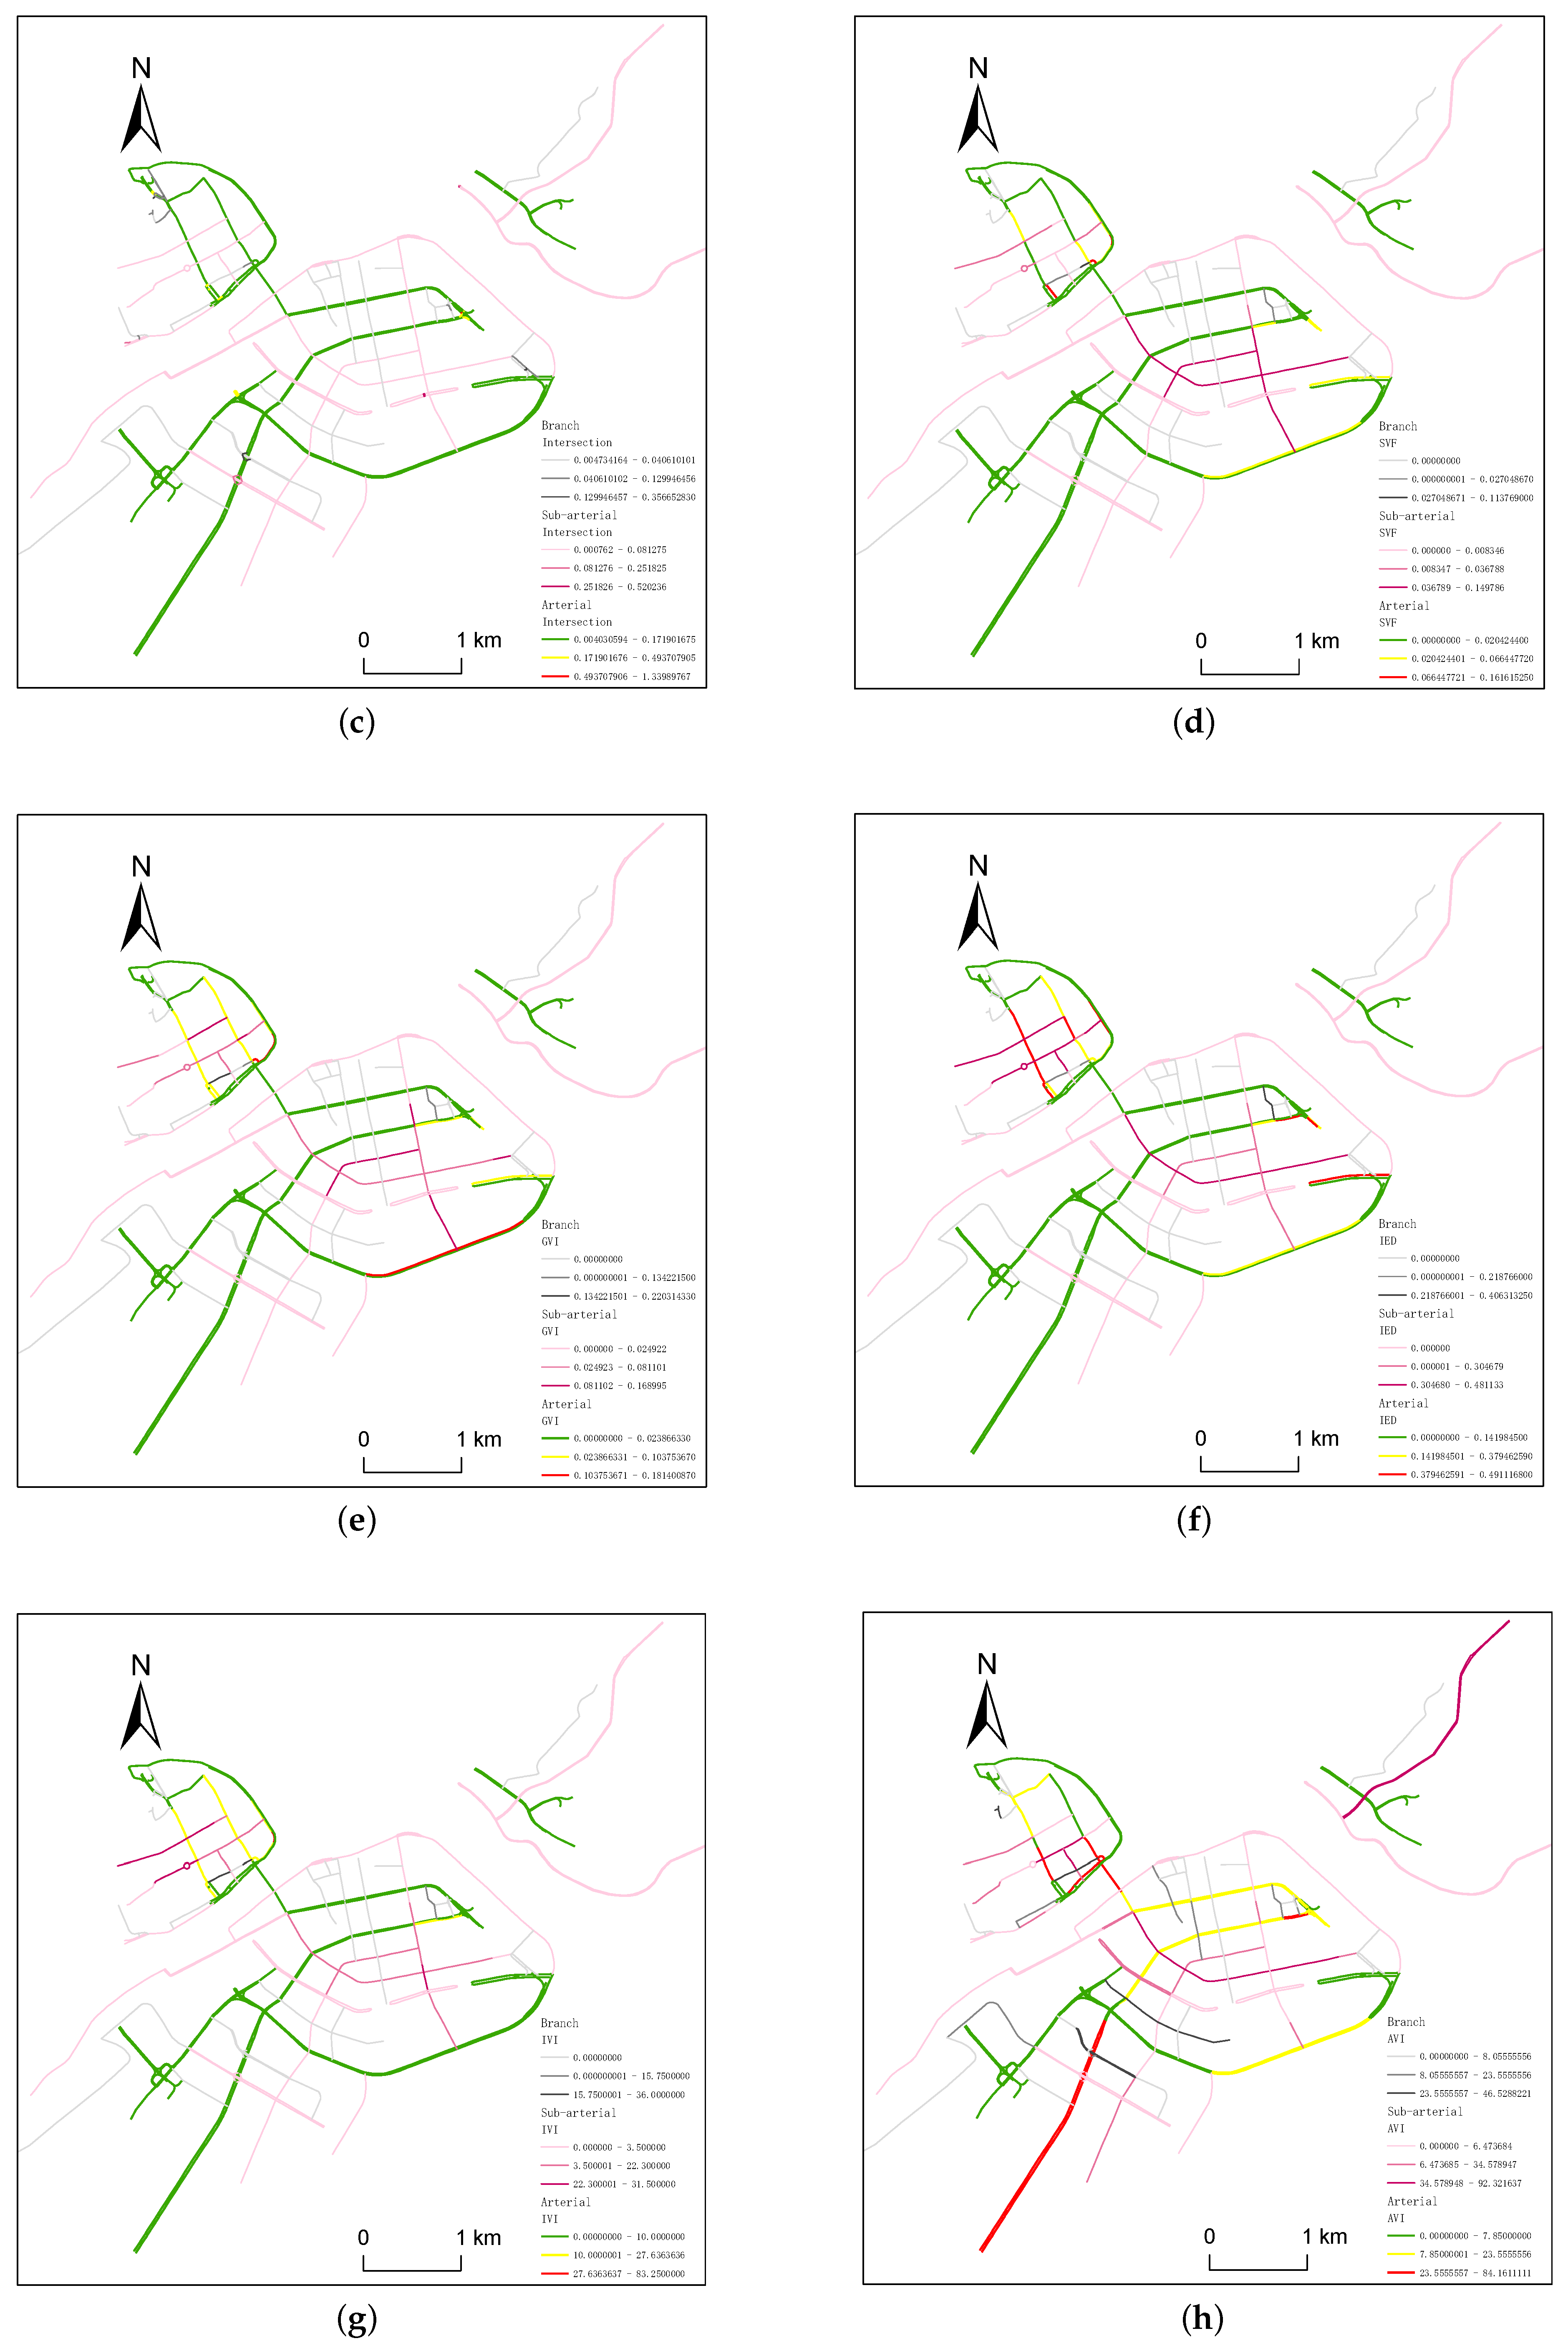
Figure 11.
Street Comprehensive Score.
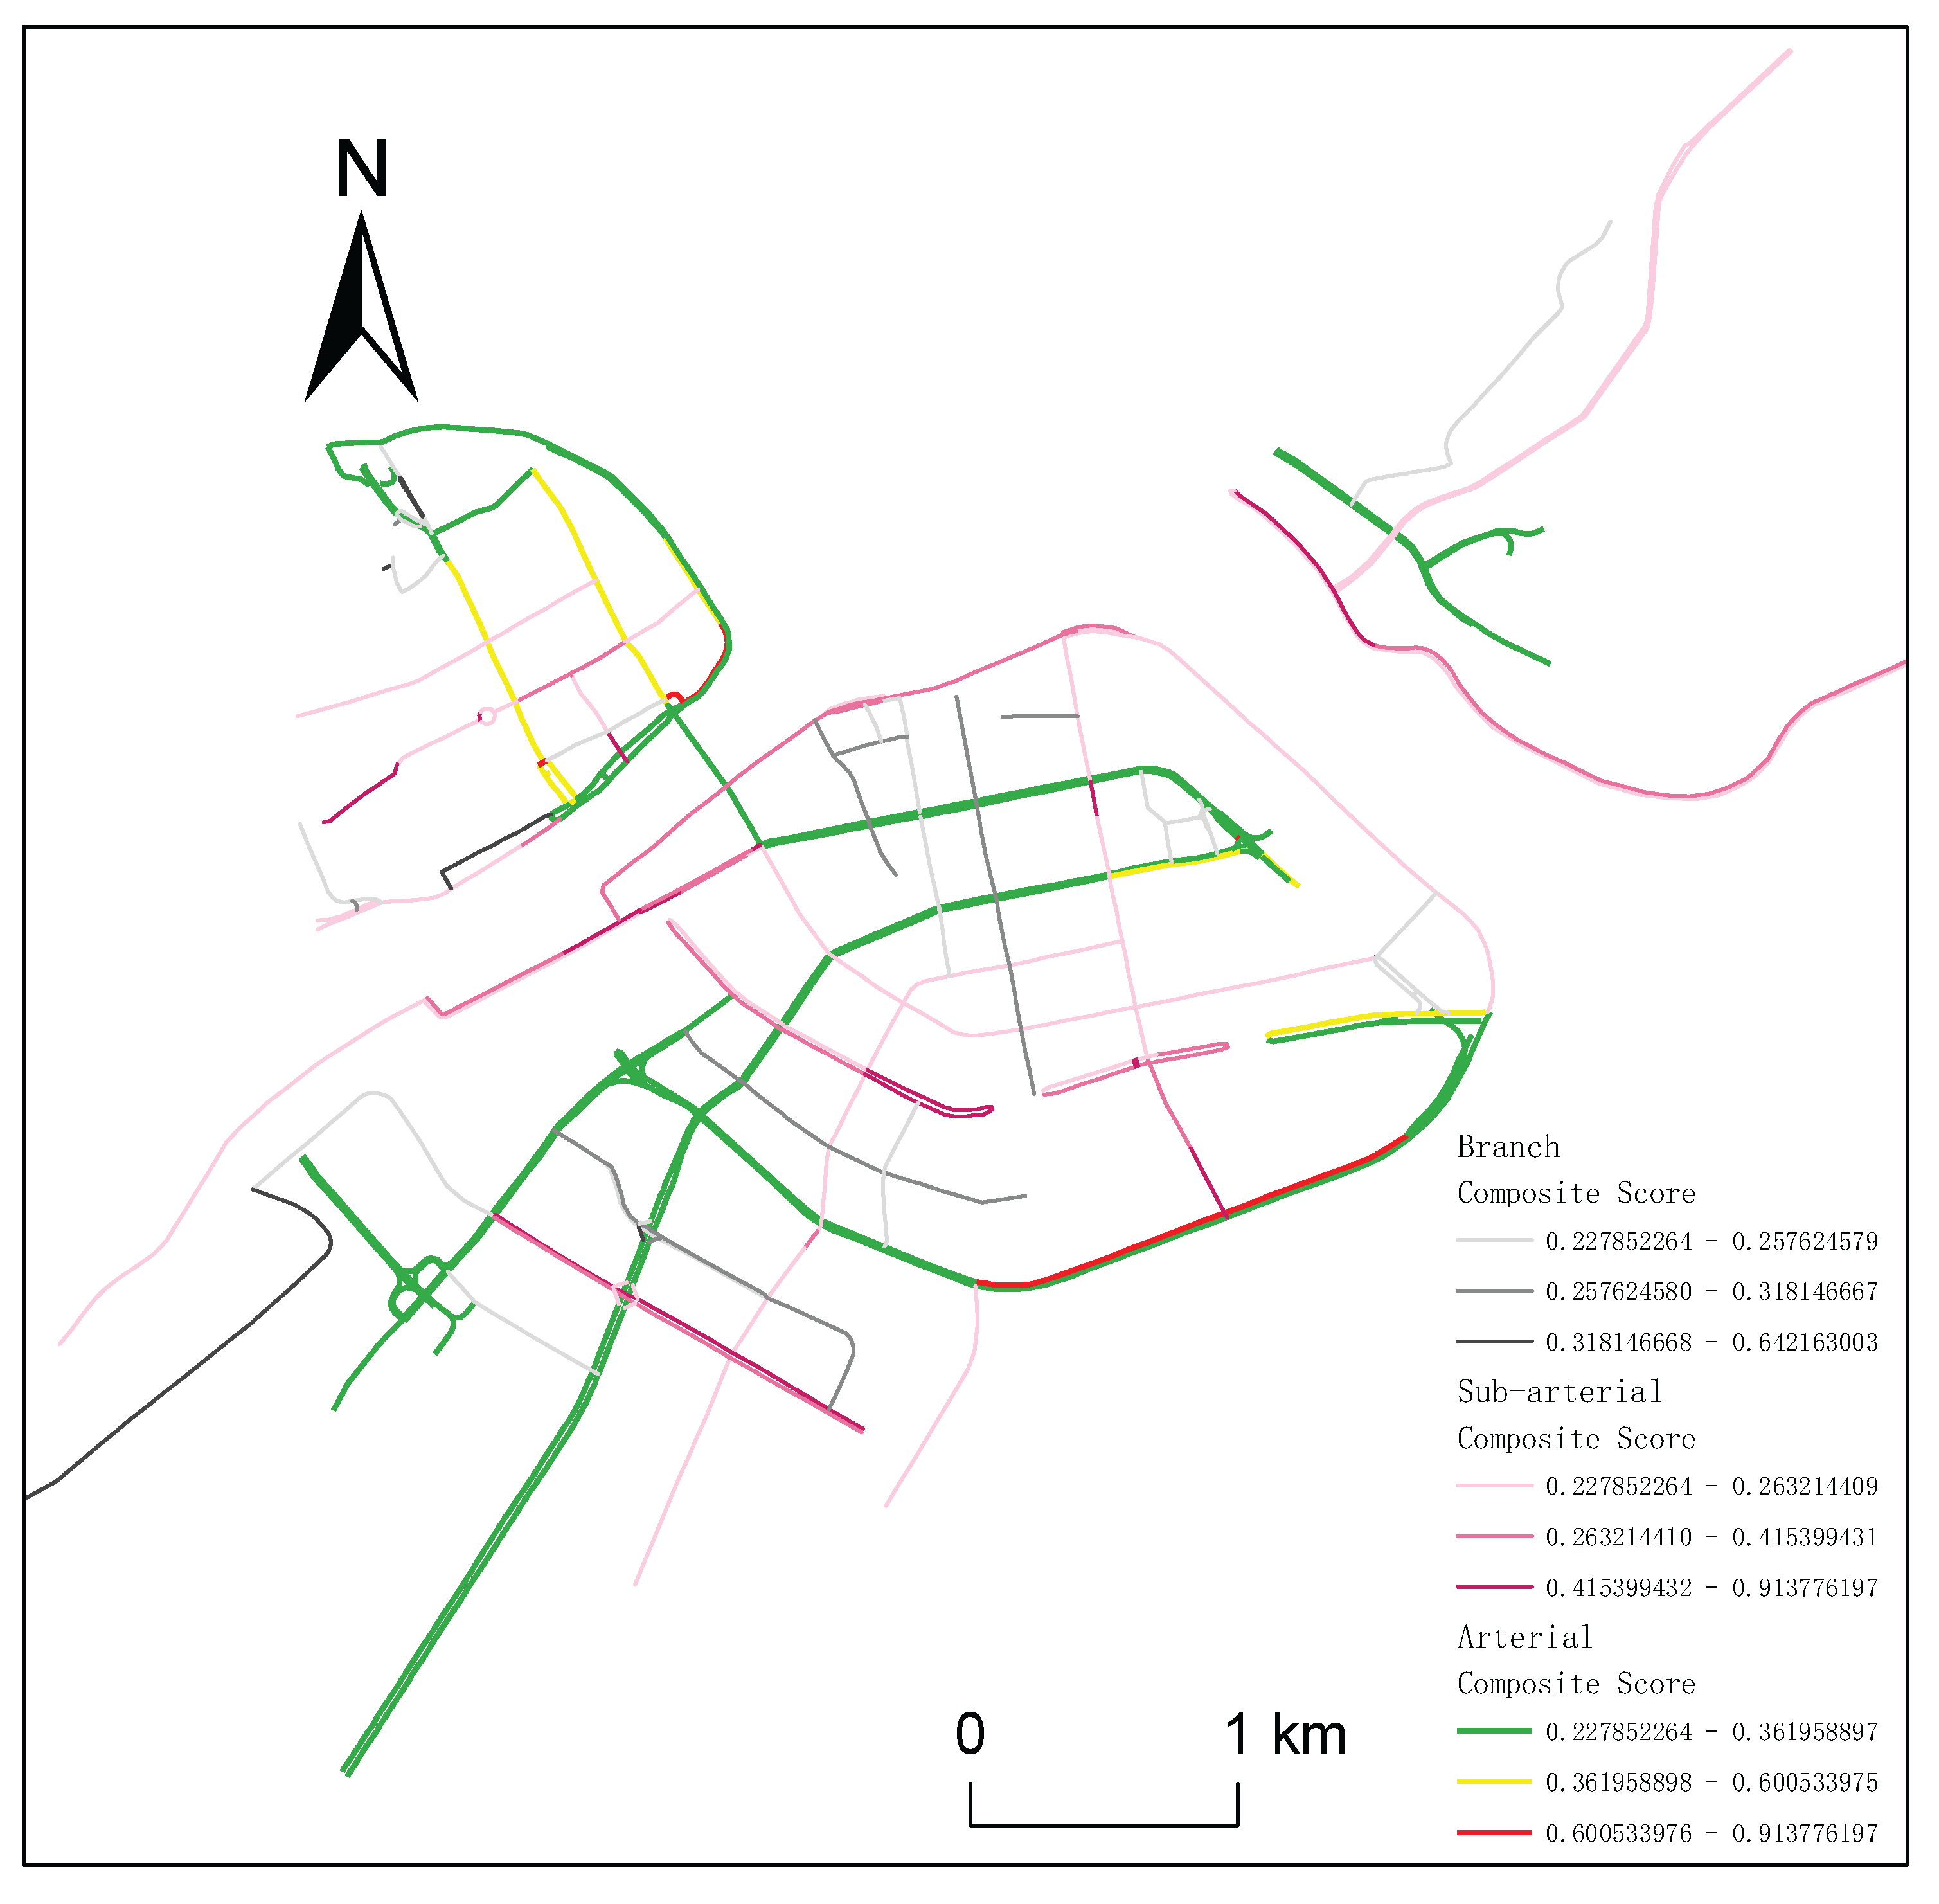
Table 1.
POI Statistics.
| Category | Transportation | Accommodation | Catering | Shopping | Healthcare |
|---|---|---|---|---|---|
| Count | 676 | 1,170 | 10,631 | 23,534 | 3,547 |
Table 3.
Composite Scores of Selected Streets.
| Fid | Composite Score |
|---|---|
| 0 | 0.263214 |
| 1 | 0.230591 |
| 2 | 0.234090 |
| 3 | 0.252188 |
| 4 | 0.231865 |
| 5 | 0.294571 |
Table 5.
Performance Comparison of Different Algorithms.
| Model | Precision (P) | Recall (R) | mAP50 |
|---|---|---|---|
| YOLOv11 | 83.9 | 62.0 | 72.1 |
| YOLOv8 | 82.8 | 64.0 | 71.7 |
| YOLOv6 | 81.7 | 60.0 | 70.3 |
| YOLO10n | 82.1 | 61.3 | 71.5 |
| YOLOv3-tiny | 81.0 | 59.9 | 66.4 |
Disclaimer/Publisher’s Note: The statements, opinions and data contained in all publications are solely those of the individual author(s) and contributor(s) and not of MDPI and/or the editor(s). MDPI and/or the editor(s) disclaim responsibility for any injury to people or property resulting from any ideas, methods, instructions or products referred to in the content. |
© 2025 by the authors. Licensee MDPI, Basel, Switzerland. This article is an open access article distributed under the terms and conditions of the Creative Commons Attribution (CC BY) license (http://creativecommons.org/licenses/by/4.0/).
Copyright: This open access article is published under a Creative Commons CC BY 4.0 license, which permit the free download, distribution, and reuse, provided that the author and preprint are cited in any reuse.


