
Submitted:
18 September 2025
Posted:
19 September 2025
You are already at the latest version
Abstract
Spatial metabolomics is a rapidly advancing field offering powerful insights into metabolic heterogeneity in biological tissues. However, its widespread adoption is hindered by fragmented tools and the lack of comprehensive, open-source GUI software covering the full analytical workflow (quality control, preprocessing, identification, pattern, and differential analysis). To address this, we developed SManalyst, an open-source, integrated web-based platform. SManalyst consolidates core functionalities, including multi-dimensional data quality assessment (background consistency, noise, intensity, missing values), a comprehensive metabolite annotation scoring system (mass accuracy, isotopic similarity, adduct evidence), and dual-dimension spatial pattern discovery (metabolite co-expression and pixel clustering). It also offers flexible differential analysis (cluster- or user-defined regions). With its intuitive GUI and modular workflow, SManalyst significantly lowers the analysis barrier. Tested with a mouse brain dataset, SManalyst efficiently handles large-scale data (e.g., >14,000 pixels, >3,000 ion peaks), effectively filling a critical gap in integrated analytical solutions for spatial metabolomics. The platform is freely accessible at https://metax.genomics.cn/app/smanalyst.
Keywords:
spatial metabolomics
; metabolite annotation
; web-based platform
; quality control
; spatial pattern discovery
; differential analysis
1. Introduction
Spatial metabolomics is a rapidly advancing interdisciplinary field that integrates metabolite information with its spatial distribution within tissue samples, offering a powerful approach to elucidate the heterogeneity of metabolic processes in complex biological systems [1,2,3]. Mass Spectrometry Imaging (MSI) techniques, such as Matrix-Assisted Laser Desorption/Ionization (MALDI) [1,4] Desorption Electrospray Ionization (DESI)[5] and Secondary Ion Mass Spectrometry (SIMS) [6], are core technologies driving this field’s development. However, the inherent complexity and vastness of spatial metabolomics data [7], pose significant challenges in areas like data preprocessing, quality control, metabolite annotation, and statistical analysis [8,9]. Therefore, developing user-friendly, functionally comprehensive data analysis platforms is crucial for fully leveraging the scientific potential of this technology and advancing the field.
Despite some progress in certain aspects of spatial metabolomics data analysis, particularly in peak detection and extraction, existing tools still show notable deficiencies in crucial downstream analytical processes, including systematic data preprocessing, comprehensive quality control, and in-depth statistical analysis [17,18]. Table 1 summarizes the functional features of currently used software. While mainstream open-source tools like Cardinal [10], SmartGate [19] can perform basic data preprocessing, visualization, and clustering, they generally lack robust data quality control modules and powerful metabolite annotation capabilities. Conversely, some more feature-rich tools, such as MSImage [20], MSiReader [12], are commercial softwares. Furthermore, although specialized tools exist for specific stages like data preprocessing [21,22,23], visualization [24,25], pattern analysis [26,27], or identification [13,28], their fragmented functionalities significantly raise the barrier to entry, especially for researchers without a strong computational background. These limitations of current open-source tools severely impede the field’s progress, highlighting an urgent need for an open-source platform that integrates core functionalities such as data quality control, preprocessing, statistical analysis, and metabolite annotation.
To address these challenges, we developed SManalyst (Spatial Metabolomics Data Analyst), an innovative open-source spatial metabolomics analysis software implemented in R. SManalyst provides a complete analytical workflow, spanning from data visualization and rigorous quality control to diverse statistical analysis and in-depth metabolite annotation. Its core features include: (1) a systematic data quality control module that comprehensively assesses dataset quality across multiple dimensions, such as background signal consistency, noise ion proportion, ion intensity distribution, and missing value patterns; (2) a comprehensive metabolite annotation and scoring system that assigns reliability scores to identification results by combining multiple lines of evidence, including mass matching precision, adduct ion forms, and isotopic distribution matching. (3) multi-dimensional pattern discovery capabilities that support exploring expression patterns based on both spatial pixel clustering and metabolite molecular spatial expression profiles; (4) flexible differential analysis strategies, allowing users to delineate regions of interest (ROIs) manually or automatically generate them based on clustering results for differential metabolite analysis; and By integrating these advanced functionalities into an open-source platform, SManalyst significantly enhances the efficiency and depth of spatial metabolomics data analysis, empowering researchers to delve deeper into metabolic regulatory mechanisms within the tissue microenvironment and accelerate scientific discovery. The software also offers an intuitive user interface and extensive documentation, ensuring its ease of use and accessibility.
2. Materials and Methods
2.1. Workflow of SManalyst
The SManalyst analysis workflow is illustrated in Figure 1A. It commences with the uploading of compliant spatial metabolomics data, as detailed in Section 2.2. Upon upload, the system performs a comprehensive data quality assessment, encompassing background region spectral consistency (QC1), noise ion ratio (QC2), pixel and ion median intensity distribution (QC3), and missing value patterns (QC4), with specific methodologies described in Section 2.3. Based on these quality control results, the software executes crucial data preprocessing steps, involving the removal of pixels identified as background and ions determined to be noise. The preprocessed data then proceeds to the metabolite annotation module (Section 2.4), where isotopic peaks and adduct ions are first identified. Subsequently, these are matched against a selected metabolite database, and the matching results are comprehensively scored based on mass accuracy, isotopic peak similarity, and adduct form presence. Following identification, the data enters the core analysis module, which includes pattern analysis and differential analysis. The pattern analysis module offers two dimensions: at the metabolite level, it identifies metabolic ion clusters exhibiting similar spatial expression patterns; at the spatial pixel level, it integrates four clustering algorithms to group pixels, thereby discovering tissue regions with similar molecular characteristics (Section 2.5). Differential analysis supports two strategies: first, it enables comparisons between groups defined by pixel clustering results; second, it allows users to manually delineate multiple regions of interest (ROIs) on the tissue imaging map, assign group labels, and then perform inter-group comparisons (Section 2.6). Users can also conduct exploratory data visualization (Section 2.7), including single-ion imaging, multi-ion imaging, and ion co-localization analysis.
2.2. Implemention of SManalyst
SManalyst is a web-based graphical user interface (GUI) application developed using the R Shiny framework, providing a platform for spatial metabolomics analysis. Users can access its online version via a web browser (https://metax.genomics.cn/app/SManalyst, accessed 16 September 2025). This version is deployed on a cloud server equipped with 128 CPU cores and 1000GB of RAM, enabling users to directly upload their data or utilize built-in example datasets for analysis. The interface is designed with user-friendliness as a core principle, employing an intuitive, step-by-step workflow to guide users through analytical tasks. For users requiring local deployment, the source code for SManalyst v1.0 is open source on GitHub (https://github.com/mzlab-research/SManalyst.git, accessed 16 September 2025), facilitating independent installation and extension. SManalyst requires input data in a Feature Matrix format. The first two columns of this matrix must represent the X and Y spatial coordinates for each pixel, respectively. Subsequent columns correspond to different m/z values (i.e., detected ion peaks), with the numerical values within the matrix cells representing the intensity of the corresponding ion at that pixel (Supplementary Figure S1). This standardized format ensures SManalyst’s compatibility with data generated from various spatial mass spectrometry imaging platforms. Detailed guidelines on how to correctly format input data are available in the software’s tutorial panel (Supplementary Figure S2).
2.3. Data Processing and Quality Assessment
Upon data upload (Supplementary Figure S3), data quality control is initiated. SManalyst’s data processing and quality assessment workflow inherits methodologies from our previously developed quality control software, SMQVP [29]. Initially, based on the total intensity distribution map of pixels, users can interactively delineate pixel sets representing tissue regions and background regions. The software then visualizes the spectra of the selected background regions to compare spectral consistency across different background areas and calculates the correlation coefficients between spectra to evaluate the spatial consistency of background signals (QC1, Supplementary Figure S4). Next, the average expression levels of each ion in tissue regions versus background regions are compared, ions enriched in tissue (Fold Change > 1) are identified, and a total intensity map of pixels is generated based on these ions. Users can set an intensity threshold, according to which the software classifies all pixels as “tissue” or “background” and automatically removes pixels categorized as background (Supplementary Figure S5).
Noise ion identification employs spatial statistical methods. The quadrat test from the spatstat package[27] is used to assess whether each ion’s spatial distribution conforms to Complete Spatial Randomness (CSR). A “noise score” (defined as the negative logarithm base 10 of the test’s p-value) is calculated for each ion. Ions with a noise score below a user-defined threshold are identified as potential noise ions. The proportion of identified noise ions among all ions constitutes the QC2 metric (Supplementary Figure S6). These noise ions will be removed in subsequent analyses.
QC3 evaluates signal intensity distribution by generating a spatial distribution map displaying the median ion intensity of each pixel within the sample and a spectral distribution map illustrating the overall pattern of median intensities across all ions (Supplementary Figure S7). QC4 focuses on the issue of missing values, calculating and visualizing two key metrics: (1) the pixel missing ratio (the proportion of undetected ions in each pixel); and (2) the ion missing ratio (the proportion of pixels where each ion was undetected). This helps to identify areas or ions with sparse data coverage (Supplementary Figure S7).
2.4. Metabolite Annotation
SManalyst’s metabolite annotation workflow (Figure 1B) comprises two core steps: 1) ion peak relationship identification and 2) database matching and scoring. First, the software identifies isotopic peaks and adduct ions within the m/z list. For isotopic identification, the isotopologues function from the MetaboCoreUtils package [30] searches for peak pairs conforming to theoretical isotopic mass differences within a user-specified mass error tolerance (ppm). The moran_bv function from the spdep package [31] then further calculates the spatial correlation of these candidate peak pairs across spatial pixels; if the correlation exceeds a user-defined threshold, they are confirmed as true isotopic peaks (Supplementary Figure S8). Non-monoisotopic peaks are removed and adduct ion identification is performed on the remaining monoisotopic ions. This involves an initial screening for ion pairs matching predefined common adduct mass differences, followed by calculation of their spatial correlation, with final confirmation of adduct ion pairs based on a correlation threshold. For identified isotopic and adduct ion pairs, users can select any pair for visualization (Supplementary Figure S8).
In the database matching phase, the first step is to define the metabolite database. Users can upload their own databases according to SManalyst’s format requirements (specific format details are in Supplementary Figure S9), typically LC-MS/MS annotation results from the same sample type as the spatial metabolomics data. SManalyst also incorporates built-in open-source metabolite databases such as HMDB [32], KEGG [33] and LIPIDMAPS [34] for selection. Regarding database selection, we recommend prioritizing self-built databases derived from identical sample types; in the absence of such, public open-source databases can be used. The matching process differentiates based on whether an ion has a clearly identified adduct form: for ions with a clear adduct form, the calculated neutral mass is directly matched against molecular masses in the database; for ions without a clearly identified adduct form, the neutral mass is calculated sequentially according to a user-specified list of possible adduct forms with mz2mass function in MetaboCoreUtils package [30] and then matched against the database. The check_ded function from the enviPat package [35] is used to check the possibility of the matched molecular formula’s adduct form, eliminating impossible identification results (e.g., a molecule like C7H3F5, lacking oxygen, cannot have an adduct form like [M+H-H2O]+). For ions with isotopic peaks, the isopattern function from the enviPat package calculates the theoretical isotopic pattern for the matched molecular formula, and then the msentropy_similarity method from the msentropy package [36] calculates the similarity between the theoretical and actual isotopic patterns. If an ion peak has multiple matching results, the software retains all candidate results for user reference. All matching results are comprehensively scored based on parent ion mass matching accuracy, isotopic peak distribution similarity, and the presence of a clear adduct form. Finally, the number and proportion of ions with identification results, as well as the distribution of m/z values corresponding to multiple identification results, are summarized (Supplementary Figure S10).
2.5. Pattern Analysis
SManalyst’s pattern analysis module offers two complementary strategies to reveal spatial structures within the data. The first strategy operates at the metabolite dimension, utilizing the SpaGene [37] algorithm for spatial expression pattern clustering analysis of metabolic ions (Supplementary Figure S11). This analysis identifies clusters of metabolic ions exhibiting highly similar spatial expression patterns and outputs a list of specific ions contained within each cluster, aiding in the discovery of functionally related metabolite groups. The second strategy operates at the spatial pixel dimension, integrating four clustering methods based on the Seurat package [38,39]: Seurat-LV (original Louvain algorithm), Seurat-LM (Louvain algorithm with multilevel refinement), Seurat-SLM (Smart Local Moving algorithm), and UMAP-kmeans (Supplementary Figure S12). Users can select any of these algorithms to cluster pixels, aiming to group adjacent pixels with similar overall metabolic profiles into the same category, thereby revealing potential functionally heterogeneous regions within the tissue sample.
2.6. Differential Analysis
SManalyst supports two flexible strategies for differential metabolite analysis. The first strategy is based on the pixel clustering results from Section 2.5. Users can assign the clustered spatial regions to different biological groups, and the software then compares the expression differences of each metabolic ion between these groups (Supplementary Figure S12). The second strategy is based on user-defined regions of interest (ROIs). Users can interactively delineate multiple spatial regions directly on the tissue imaging map and assign group labels to these regions, after which the software performs inter-group comparisons (Supplementary Figure S13). Both differential analysis strategies utilize Seurat’s[38,39]FindMarkers function to identify differentially expressed metabolites: all pixels belonging to the same group are treated as “samples” for that group, and the average expression fold change and significance of difference for each metabolic ion between groups are calculated. After analysis, users can online select differential ions of interest and instantly view their spatial distribution maps, facilitating result validation and biological interpretation.
2.7. Data Visualization
SManalyst also supports various forms of visualization exploration, including generating spatial distribution maps for single ions (single-ion imaging), simultaneously visualizing 2-3 ions (by mapping their intensity values to RGB color channels to create composite pseudocolor images), and performing ion co-localization analysis (for selected ions, the software automatically calculates and displays images of the six ions with the strongest positive and negative spatial expression correlations, respectively) (Supplementary Figure S14). These visualization features provide users with insights into the spatial distribution characteristics of their data.
2.8. Test Data
To demonstrate SManalyst’s functionality and performance, this study utilized spatial metabolomics data of a 7-week-old male mouse brain coronal section collected using the AFAD-ESI platform [5] (positive ion mode) (anatomical structures shown in Figure 2A H&E staining results). Data acquisition parameters included: spray solvent of acetonitrile and water (80:20 v/v), AFADESI extraction gas flow rate of 45 L/min. Spatial resolution was 100 micrometers, and mass spectrometry detection was performed using a Q Exactive mass spectrometer (Thermo Fisher) with a primary resolution of 70,000. Raw data were processed using Cardinal [10] software, ultimately generating a feature matrix containing 14,260 spatial pixels and 3,044 unique ion peaks as analytical input. For reproducibility, this example peak table matrix is available via SManalyst’s tutorial panel.
To support ion peak annotation in spatial metabolomics, we obtained LC-MS/MS annotation results from an adjacent mouse brain slice by collecting untargeted metabolomics data using the following method: 25 mg of mouse brain was weighed, precipitant (methanol: acetonitrile: water = 2:2:1) was added. After tissue homogenization, precipitation occurred at -20°C, and the supernatant was collected by centrifugation and freeze-dried. It was then reconstituted with 50% methanol, and the supernatant was collected after centrifugation for analysis. Chromatographic separation was performed using an ACQUITY UPLC system (Waters) with a BEH C18 column (1.7 μm, 2.1×100 mm). Mobile phase: for positive ion mode, water/methanol containing 0.1% formic acid; for negative ion mode, water/95% methanol containing 10 mM ammonium formate. Gradient elution (0–12 min: 2–98% organic phase) was used, with a flow rate of 0.35 mL/min, column temperature of 45°C, and injection volume of 5 μL. Mass spectrometry detection was performed using a Q Exactive mass spectrometer (Thermo Fisher), with spray voltages of 3.80/3.20 kV for positive modes. Primary MS resolution was 70,000, secondary resolution was 17,500, and stepped collision energy (20/40/60 eV) was applied. Data were processed with Compound Discoverer 3.3 (parent ion mass deviation < 5 ppm), and metabolites were identified through a combined approach using the BGI Metabolome Database, mzCloud, and HMDB, KEGG, and LIPIDMAPS databases.
3. Results and Discussion
To systematically evaluate SManalyst’s analytical capabilities and integrated workflow, we used a spatial metabolomics dataset of mouse brain coronal sections for demonstration. This section sequentially showcases the tool’s performance in core aspects, including data preprocessing and quality control, metabolite annotation, spatial pattern discovery, and differential analysis and visualization.
3.1. Data Quality Control and Preprocessing
SManalyst developed a multi-dimensional visualization strategy to comprehensively assess data quality and completeness. The workflow begins with evaluating background signal stability. Using the software’s lasso tool, multiple background and tissue regions were selected (Figure 2B). Visual comparison of the mass spectra (Figure 2D) revealed high similarity across different background regions, with no signs of polymer contaminants. Further quantitative analysis using a spectral similarity heatmap (Figure 2E) showed correlation coefficients above 0.99 among background regions, confirming high consistency in background areas and stability of the instrument during data acquisition. For precise removal of background pixels, SManalyst first identifies ions significantly enriched in tissue regions (tissue/background Fold Change > 1) and constructs a total intensity image of pixels based on these ions. By setting a total ion intensity threshold of 107.45, background pixels were clearly identified and effectively removed (Supplementary Figure S5).
A core aspect of quality control is identifying and filtering noise ions (i.e., ions with random spatial distributions). The noise score distribution for all ions is shown in Figure 2C. To validate the effectiveness of the noise score, we visualized the spatial distribution of representative ions near the noise threshold. Results showed that ions with a score of approximately 10 lacked any recognizable spatial patterns, consistent with noise characteristics (Supplementary Figure S15A); whereas ions with scores of 30 and 50 exhibited clear, non-random spatial aggregation patterns (Supplementary Figure S15B,C). Based on this observation, we set the noise score threshold at 30, successfully filtering out randomly distributed noise ions and ultimately retaining 61% of ions for downstream in-depth analysis (Supplementary Figure S6).
Further quality control focused on the overall characteristics and completeness of the data. Visualization of ion intensity distribution (Figure 2F) and pixel total intensity distribution (Figure 2G) revealed that the total pixel cumulative intensity reached approximately 7×10⁷, with generally high individual ion intensities (>10⁴). However, signal intensity decreased in the high m/z region (> 800), possibly related to lower abundance of lipid metabolites. Finally, QC4 assessed the distribution of missing values within the dataset. At the pixel level, the missing rate for most pixels was below 10% (Figure 2H). At the ion level, the missing rate for most ions across the entire dataset was below 5% (Figure 2I). This information provides crucial insights for understanding data limitations and guiding subsequent analysis strategies.
3.2. Metabolite Annotation
Metabolite annotation forms the foundation for subsequent biological interpretation. The first step in metabolite annotation is the identification of isotopic peaks and adduct ions in the mass spectrometry data. Identified isotopic peaks accounted for 5.92% of the total ion peaks (Supplementary Figure S8). Figure 3A displays a typical isotopic peak cluster, where the monoisotopic intensity is higher than non-monoisotopic peaks, and their spatial distributions are similar. Figure 3C further shows that high-intensity ions generally possess isotopic peak clusters. For adduct ion identification, we considered common adduct forms ([M+H]⁺, [M+K]⁺, [M+Na]⁺, [M+NH4]⁺, [M+H-H2O]⁺), identifying adduct ions comprising 4.19% of the total ions (Supplementary Figure S8). Figure 3B illustrates a typical adduct ion peak, while Figure 3D shows the distribution of ion numbers with different adduct forms. Besides [M+H]⁺, the proportions of [M+Na]⁺ and [M+NH4]⁺ were also relatively high, a pattern consistent with typical spatial metabolomics data [40].
During the data identification phase, LC-MS/MS annotation results from mouse brain (comprising 1269 metabolites with identification levels 1–3) were selected as a self-built library for metabolite annotation (Supplementary Figure S10). By matching the neutral mass of spatial metabolomics ions with the self-built library and integrating similarity scores for isotopic distribution and adduct information for comprehensive scoring, we successfully identified 669 ions (Figure 3E). Among these, 374 ions had a single annotation result, 148 ions had two annotation results, and 147 ions had three or more annotation results (Figure 3F).
3.3. Spatial Pattern Discovery
Elucidating the spatial distribution patterns of metabolites within tissues is a core objective of spatial metabolomics. SManalyst achieves this through two analytical modules. First, metabolite spatial co-expression pattern analysis revealed eight major metabolite spatial expression patterns within mouse brain tissue (Figure 3A, Supplementary Figure S11). These patterns clearly demonstrate the synergistic enrichment and regional specificity of metabolites in different brain regions. For instance, Pattern 4 showed high expression primarily in the cerebral cortex and low expression in the midbrain; Pattern 5 was complementary to Pattern 6; Pattern 8 was similar to Pattern 4 but lower in the Entorhinal area; and Pattern 7 displayed unique enrichment characteristics in the tissue edge regions. These synergistic or complementary metabolite expression patterns strongly suggest specific metabolic network activities in different functional brain regions.
Second, the UMAP-kmeans algorithm identified 25 spatially heterogeneous categories at the pixel level (Figure 3B). Comparison of the clustering results with the Allen Mouse Brain Atlas [41] revealed high consistency with known anatomical structures. Major anatomical divisions, such as the cerebral cortex, hippocampus, midbrain, hindbrain, and fiber tracts, were clearly mapped in the clustering results. However, some fine nuclear structures, like the Periaqueductal gray and Superior colliculus, were grouped together in cluster 1 and could not be distinguished.
3.4. Spatial Differential Analysis
Identifying region-specific metabolites is crucial for a deeper understanding of brain region function. SManalyst provides flexible analytical tools for this purpose, supporting spatial metabolic differential analysis based on clustering results or manually defined regions of interest (ROI). To explore metabolic feature differentiation between different functional systems, we compared the midbrain (MB), composed of clusters 6, and 1, with the hippocampal region (HIP), composed of clusters 23 and 12 (Figure 4C, Supplementary Figure S12). HIP plays a central role in cognitive functions such as spatial memory and navigation learning, while the selected MB regions primarily involve MBmot for motor output and coordination, and MBsen for sensory signal reception and processing. Differential results (Figure 4D) showed that 76 metabolites were significantly upregulated in the MB group, with 27 annotated and 17 uniquely annotated; while 82 metabolites were significantly upregulated in the HIP group, with 29 annotated and 16 uniquely annotated.
Pathway enrichment analysis of uniquely identified differential metabolites using Metaboanalyst [42] revealed that these metabolic features were highly consistent with regional functions. Metabolites upregulated in HIP (e.g., taurine and sphingolipids) were enriched in pathways such as taurine metabolism, sphingolipid metabolism, and glycerophospholipid metabolism. These pathways are involved in neuroprotection, antioxidant stress, and cell membrane stability, which aligns with the cognitive functional demands of the HIP. Conversely, metabolites upregulated in MBmot and MBsen (e.g., glycerophospholipids and linoleic acid derivatives) were enriched in pathways such as glycerophospholipid metabolism, linoleic acid metabolism, and pyruvate metabolism. These pathways emphasize energy production and cell membrane fluidity, consistent with the high energy consumption in motor regions and rapid signal transmission in sensory regions. Overall, the enrichment patterns of metabolites and pathways validated the biological basis of regional functions.
In addition to automated region selection based on clustering, SManalyst also supports manual definition of specific anatomical regions for targeted research. For example, by manually outlining the entorhinal cortex and primary visual cortex (Supplementary Figure S13: Primary visual cortex: regions 1 and 2; Entorhinal cortex: regions 3 and 4) and performing differential analysis, we successfully identified 9 significantly upregulated metabolites in the entorhinal cortex and 20 significantly upregulated metabolites in the primary visual cortex. This integrated analytical workflow fully demonstrates SManalyst’s powerful utility in flexibly addressing scientific research questions within a single environment.
4. Conclusions
SManalyst, as an innovative open-source platform, offers the first complete solution for spatial metabolomics research, integrating data quality control, preprocessing, spatial pattern analysis, differential comparison, and metabolite annotation. It effectively addresses analytical bottlenecks in this field caused by fragmented tools and a lack of standardized workflows. Its core value lies in: pioneering a multi-dimensional systematic data quality assessment and visualization; providing metabolite annotation based on multi-evidence scoring; and offering complementary perspectives for spatial heterogeneity analysis by integrating metabolite spatial expression pattern analysis with pixel clustering, which, combined with flexible differential analysis strategies, enhances analytical depth and reliability. Compared to existing tools that focus on single steps, SManalyst seamlessly connects key analytical steps through a user-friendly web interface, significantly improving analytical efficiency and accessibility, especially benefiting researchers without computational backgrounds. The open-source nature of the tool ensures its extensibility and potential for community-driven development. Future versions will focus on integrating more clustering algorithms and pattern recognition methods, addressing batch effects in multi-section analysis, and incorporating more suitable differential analysis methods and MS/MS spectral annotation capabilities to continuously meet the evolving analytical needs of the spatial metabolomics field.
Supplementary Materials
The following supporting information can be downloaded at the website of this paper posted on Preprints.org. Figure S1: Data Upload Format Requirements for SManalyst Software; Figure S2: SManalyst Tutorial Interface; Figure S3: Data Upload and Visualization Interface; Figure S4: QC1. Background Region Consistency Interface; Figure S5: Process1. Background Pixel Removal Interface; Figure S6: QC2. Noise Ion Proportion Interface; Figure S7: QC3&4. Signal Intensity and Missing Value Assessment Interface; Figure S8: Isotope Peak and Adduct Ion Peak Identification Interface; Figure S9: Format Requirements for Uploading Custom Library Files; Figure S10: Metabolite Identification Interface; Figure S11: Metabolite Spatial Pattern Analysis Interface; Figure S12: Spatial Metabolic Clustering and Cluster-Based Differential Analysis Interface; Figure S13: Differential Metabolic Analysis Interface Based on Manual Selection; Figure S14: Visualization Interface; Figure S15: Spatial Distribution of Ions Under Different Noise Scores. Imaging of Ions with Noise Scores of 10 (A), 30 (B), and 50 (C).
Author Contributions
Zhanlong Mei developed the metabolite identification codes and drafted the manuscript. Xiaolian Ning designed the overall analysis software and implemented the graphical interface. Haoke Deng performed data testing and maintained the online web server. Lingyun Chen collected the LC–MS/MS data and provided the final identification tables. Yun Zhao collected the AFADESI data. Jin Zi provided project guidance and revised the manuscript. All authors have read and agreed to the published version of the manuscript.
Funding
This research was funded by the National Key R&D Program of China, grant number 2021YFA0805100, and the Sustainable Development Program of Shenzhen Science and Technology Major Program, grant number KCXFZ20240903093925033.
Institutional Review Board Statement
The animal study protocol was approved by the Institutional Review Board of BGI (protocol code BGI-IRB A25004 and date of approval 21 February 2025).
Informed Consent Statement
Not applicable.
Data Availability Statement
All resources described in this study are publicly available. The raw spatial metabolomics data and processed peak intensity tables derived from the mouse brain tissue have been deposited in the OMIX database of the National Genomics Data Center. The AFADESI dataset is available under accession number OMIX011615 (https://ngdc.cncb.ac.cn/omix/release/OMIX011615, accessed on 27 Aug 2025), while the LC-MS/MS raw data are accessible via accession number OMIX011615 (https://ngdc.cncb.ac.cn/omix/release/OMIX011616, accessed on 27 Aug 2025).
Acknowledgments
During the preparation of this manuscript, the authors used Gemini 2.5 Flash to polish the language. The authors have reviewed and edited the output and take full responsibility for the content in this publication.
Conflicts of Interest
The authors declare no conflicts of interest.
Abbreviations
The following abbreviations are used in this manuscript:
| SManalyst | Spatial Metabolomics Data Analyst |
| AFADESI | Air Flow-Assisted Desorption Electrospray Ionization |
| GUI | Graphical User Interface |
| ROI | Region of Interest |
| HIP | Hippocampus |
| MB | Midbrain |
| H&E | Hematoxylin and Eosin |
References
- Fujimura, Y.; Miura, D. MALDI Mass Spectrometry Imaging for Visualizing In Situ Metabolism of Endogenous Metabolites and Dietary Phytochemicals. Metabolites 2014, 4, 319–346. [CrossRef]
- Chen, K.; Baluya, D.; Tosun, M.; Li, F.; Maletic-Savatic, M. Imaging Mass Spectrometry: A New Tool to Assess Molecular Underpinnings of Neurodegeneration. Metabolites 2019, 9.
- He, M.J.; Pu, W.; Wang, X.; Zhang, W.; Tang, D.; Dai, Y. Comparing DESI-MSI and MALDI-MSI Mediated Spatial Metabolomics and Their Applications in Cancer Studies. Front Oncol 2022, 12. [CrossRef]
- F.E. Hendriks, T.; K. Krestensen, K.; Mohren, R.; Vandenbosch, M.; De Vleeschouwer, S.; M.A. Heeren, R.; Cuypers, E. MALDI-MSI-LC-MS/MS Workflow for Single-Section Single Step Combined Proteomics and Quantitative Lipidomics. Anal Chem 2024, 96, 4266–4274. [CrossRef]
- Luo, Z.; He, J.; Chen, Y.; He, J.; Gong, T.; Tang, F.; Wang, X.; Zhang, R.; Huang, L.; Zhang, L.; et al. Air Flow-Assisted Ionization Imaging Mass Spectrometry Method for Easy Whole-Body Molecular Imaging under Ambient Conditions. Anal Chem 2013, 85, 2977–2982. [CrossRef]
- Anderton, C.R.; Gamble, L.J. Secondary Ion Mass Spectrometry Imaging of Tissues, Cells, and Microbial Systems. Micros Today 2016, 24, 24–31. [CrossRef]
- Alexandrov, T. Spatial Metabolomics and Imaging Mass Spectrometry in the Age of Artificial Intelligence. Annu Rev Biomed Data Sci 2020, 3, 61–87. [CrossRef]
- Zuo, C.; Zhu, J.; Zou, J.; Chen, L. Unravelling Tumour Spatiotemporal Heterogeneity Using Spatial Multimodal Data. Clin Transl Med 2025, 15. [CrossRef]
- Zemaitis, K.J.; Paša-Tolić, L. Challenges in Spatial Metabolomics and Proteomics for Functional Tissue Unit and Single-Cell Resolution. Semin Nephrol 2024, 44. [CrossRef]
- Bemis, K.D.; Harry, A.; Eberlin, L.S.; Ferreira, C.; van de Ven, S.M.; Mallick, P.; Stolowitz, M.; Vitek, O. Cardinal: An R Package for Statistical Analysis of Mass Spectrometry-Based Imaging Experiments. Bioinformatics 2015, 31, 2418–2420. [CrossRef]
- He, J.; Huang, L.; Tian, R.; Li, T.; Sun, C.; Song, X.; Lv, Y.; Luo, Z.; Li, X.; Abliz, Z. MassImager: A Software for Interactive and in-Depth Analysis of Mass Spectrometry Imaging Data. Anal Chim Acta 2018, 1015, 50–57. [CrossRef]
- Bokhart, M.T.; Nazari, M.; Garrard, K.P.; Muddiman, D.C. MSiReader v1.0: Evolving Open-Source Mass Spectrometry Imaging Software for Targeted and Untargeted Analyses. J Am Soc Mass Spectrom 2018, 29, 8–16. [CrossRef]
- Palmer, A.; Phapale, P.; Chernyavsky, I.; Lavigne, R.; Fay, D.; Tarasov, A.; Kovalev, V.; Fuchser, J.; Nikolenko, S.; Pineau, C.; et al. FDR-Controlled Metabolite Annotation for High-Resolution Imaging Mass Spectrometry. Nat Methods 2016, 14, 57–60. [CrossRef]
- Bi, S.; Wang, M.; Pu, Q.; Yang, J.; Jiang, N.; Zhao, X.; Qiu, S.; Liu, R.; Xu, R.; Li, X.; et al. Multi-MSIProcessor: Data Visualizing and Analysis Software for Spatial Metabolomics Research. Anal Chem 2024, 96, 339–346. [CrossRef]
- Cordes, J.; Enzlein, T.; Marsching, C.; Hinze, M.; Engelhardt, S.; Hopf, C.; Wolf, I. M2aia—Interactive, Fast, and Memory-Efficient Analysis of 2D and 3D Multi-Modal Mass Spectrometry Imaging Data. Gigascience 2021, 10, giab049. [CrossRef]
- Xiao, K.; Wang, Y.; Dong, K.; Zhang, S. SmartGate Is a Spatial Metabolomics Tool for Resolving Tissue Structures 2022.
- Song, X.; Li, C.; Meng, Y. Mass Spectrometry Imaging Advances and Application in Pharmaceutical Research. Acta Materia Medica 2022, 1, 507–533.
- Veselkov, K.; Sleeman, J.; Claude, E.; Vissers, J.P.C.; Galea, D.; Mroz, A.; Laponogov, I.; Towers, M.; Tonge, R.; Mirnezami, R.; et al. BASIS: High-Performance Bioinformatics Platform for Processing of Large-Scale Mass Spectrometry Imaging Data in Chemically Augmented Histology. Sci Rep 2018, 8. [CrossRef]
- Xiao, K.; Wang, Y.; Dong, K.; Zhang, S. SmartGate Is a Spatial Metabolomics Tool for Resolving Tissue Structures 2022.
- He, J.; Huang, L.; Tian, R.; Li, T.; Sun, C.; Song, X.; Lv, Y.; Luo, Z.; Li, X.; Abliz, Z. MassImager: A Software for Interactive and in-Depth Analysis of Mass Spectrometry Imaging Data. Anal Chim Acta 2018, 1015, 50–57. [CrossRef]
- Del Castillo, E.; Sementé, L.; Torres, S.; Ràfols, P.; Ramírez, N.; Martins-Green, M.; Santafe, M.; Correig, X. RMsikeyion: An Ion Filtering r Package for Untargeted Analysis of Metabolomic LDI-MS Images. Metabolites 2019, 9. [CrossRef]
- Ràfols, P.; Heijs, B.; Del Castillo, E.; Yanes, O.; McDonnell, L.A.; Brezmes, J.; Pérez-Taboada, I.; Vallejo, M.; García-Altares, M.; Correig, X. RMSIproc: An R Package for Mass Spectrometry Imaging Data Processing. Bioinformatics 2020, 36, 3618–3619. [CrossRef]
- Inglese, P.; Correia, G.; Takats, Z.; Nicholson, J.K.; Glen, R.C. SPUTNIK: An R Package for Filtering of Spatially Related Peaks in Mass Spectrometry Imaging Data. Bioinformatics 2019, 35, 178–180. [CrossRef]
- Ràfols, P.; Torres, S.; Ramírez, N.; Del Castillo, E.; Yanes, O.; Brezmes, J.; Correig, X. RMSI: An R Package for MS Imaging Data Handling and Visualization. Bioinformatics 2017, 33, 2427–2428. [CrossRef]
- Paschke, C.; Leisner, A.; Hester, A.; Maass, K.; Guenther, S.; Bouschen, W.; Spengler, B. Mirion - A Software Package for Automatic Processing of Mass Spectrometric Images. J Am Soc Mass Spectrom 2013, 24, 1296–1306. [CrossRef]
- Bemis, K.D.; Harry, A.; Eberlin, L.S.; Ferreira, C.; van de Ven, S.M.; Mallick, P.; Stolowitz, M.; Vitek, O. Cardinal: An R Package for Statistical Analysis of Mass Spectrometry-Based Imaging Experiments. Bioinformatics 2015, 31, 2418–2420. [CrossRef]
- Baddeley, A.; Turner, R. Spatstat: An R Package for Analyzing Spatial Point Patterns. J Stat Softw 2005, 12, 1–42. [CrossRef]
- Sementé, L.; Baquer, G.; García-Altares, M.; Correig-Blanchar, X.; Ràfols, P. RMSIannotation: A Peak Annotation Tool for Mass Spectrometry Imaging Based on the Analysis of Isotopic Intensity Ratios. Anal Chim Acta 2021, 1171. [CrossRef]
- Mei, Z.; Sun, W.; Zhao, Y.; Deng, H.; Ning, X.; Feng, C.; Zi, J. SMQVP: A Web Application for Spatial Metabolomics Quality Visualization and Processing. Metabolites 2025, 15, 354. [CrossRef]
- Rainer, J.; Vicini, A.; Salzer, L.; Stanstrup, J.; Badia, J.M.; Neumann, S.; Stravs, M.A.; Hernandes, V.V.; Gatto, L.; Gibb, S.; et al. A Modular and Expandable Ecosystem for Metabolomics Data Annotation in R. Metabolites 2022, 12. [CrossRef]
- Bivand, R.S.; Wong, D.W.S. Comparing Implementations of Global and Local Indicators of Spatial Association. TEST 2018, 27, 716–748. [CrossRef]
- Wishart, D.S.; Guo, A.C.; Oler, E.; Wang, F.; Anjum, A.; Peters, H.; Dizon, R.; Sayeeda, Z.; Tian, S.; Lee, B.L.; et al. HMDB 5.0: The Human Metabolome Database for 2022. Nucleic Acids Res 2022, 50, D622–D631. [CrossRef]
- Kanehisa, M.; Goto, S. KEGG: Kyoto Encyclopedia of Genes and Genomes; 2000; Vol. 28.
- Conroy, M.J.; Andrews, R.M.; Andrews, S.; Cockayne, L.; Dennis, E.A.; Fahy, E.; Gaud, C.; Griffiths, W.J.; Jukes, G.; Kolchin, M.; et al. LIPID MAPS: Update to Databases and Tools for the Lipidomics Community. Nucleic Acids Res 2024, 52, D1677–D1682. [CrossRef]
- Loos, M.; Gerber, C.; Corona, F.; Hollender, J.; Singer, H. Accelerated Isotope Fine Structure Calculation Using Pruned Transition Trees. Anal Chem 2015, 87, 5738–5744. [CrossRef]
- Yuanyue Li Msentropy: Spectral Entropy for Mass Spectrometry Data Available online: https://CRAN.R-project.org/package=msentropy (accessed on 11 July 2025).
- Liu, Q.; Hsu, C.Y.; Shyr, Y. Scalable and Model-Free Detection of Spatial Patterns and Colocalization. Genome Res 2022, 32, 1736–1745. [CrossRef]
- Stuart, T.; Butler, A.; Hoffman, P.; Hafemeister, C.; Papalexi, E.; Mauck, W.M.; Hao, Y.; Stoeckius, M.; Smibert, P.; Satija, R. Comprehensive Integration of Single-Cell Data. Cell 2019, 177, 1888-1902.e21. [CrossRef]
- Hao, Y.; Stuart, T.; Kowalski, M.H.; Choudhary, S.; Hoffman, P.; Hartman, A.; Srivastava, A.; Molla, G.; Madad, S.; Fernandez-Granda, C.; et al. Dictionary Learning for Integrative, Multimodal and Scalable Single-Cell Analysis. Nat Biotechnol 2024, 42, 293–304. [CrossRef]
- Zhu, Y.; Zang, Q.; Luo, Z.; He, J.; Zhang, R.; Abliz, Z. An Organ-Specific Metabolite Annotation Approach for Ambient Mass Spectrometry Imaging Reveals Spatial Metabolic Alterations of a Whole Mouse Body. Anal Chem 2022, 94, 7286–7294. [CrossRef]
- Wang, Q.; Ding, S.L.; Li, Y.; Royall, J.; Feng, D.; Lesnar, P.; Graddis, N.; Naeemi, M.; Facer, B.; Ho, A.; et al. The Allen Mouse Brain Common Coordinate Framework: A 3D Reference Atlas. Cell 2020, 181, 936-953.e20. [CrossRef]
- Chong, J.; Soufan, O.; Li, C.; Caraus, I.; Li, S.; Bourque, G.; Wishart, D.S.; Xia, J. MetaboAnalyst 4.0: Towards More Transparent and Integrative Metabolomics Analysis. Nucleic Acids Res 2018, 46, W486–W494. [CrossRef]
Figure 1.
SManalyst Software Workflow. Overall workflow (A); Metabolite annotation workflow (B).
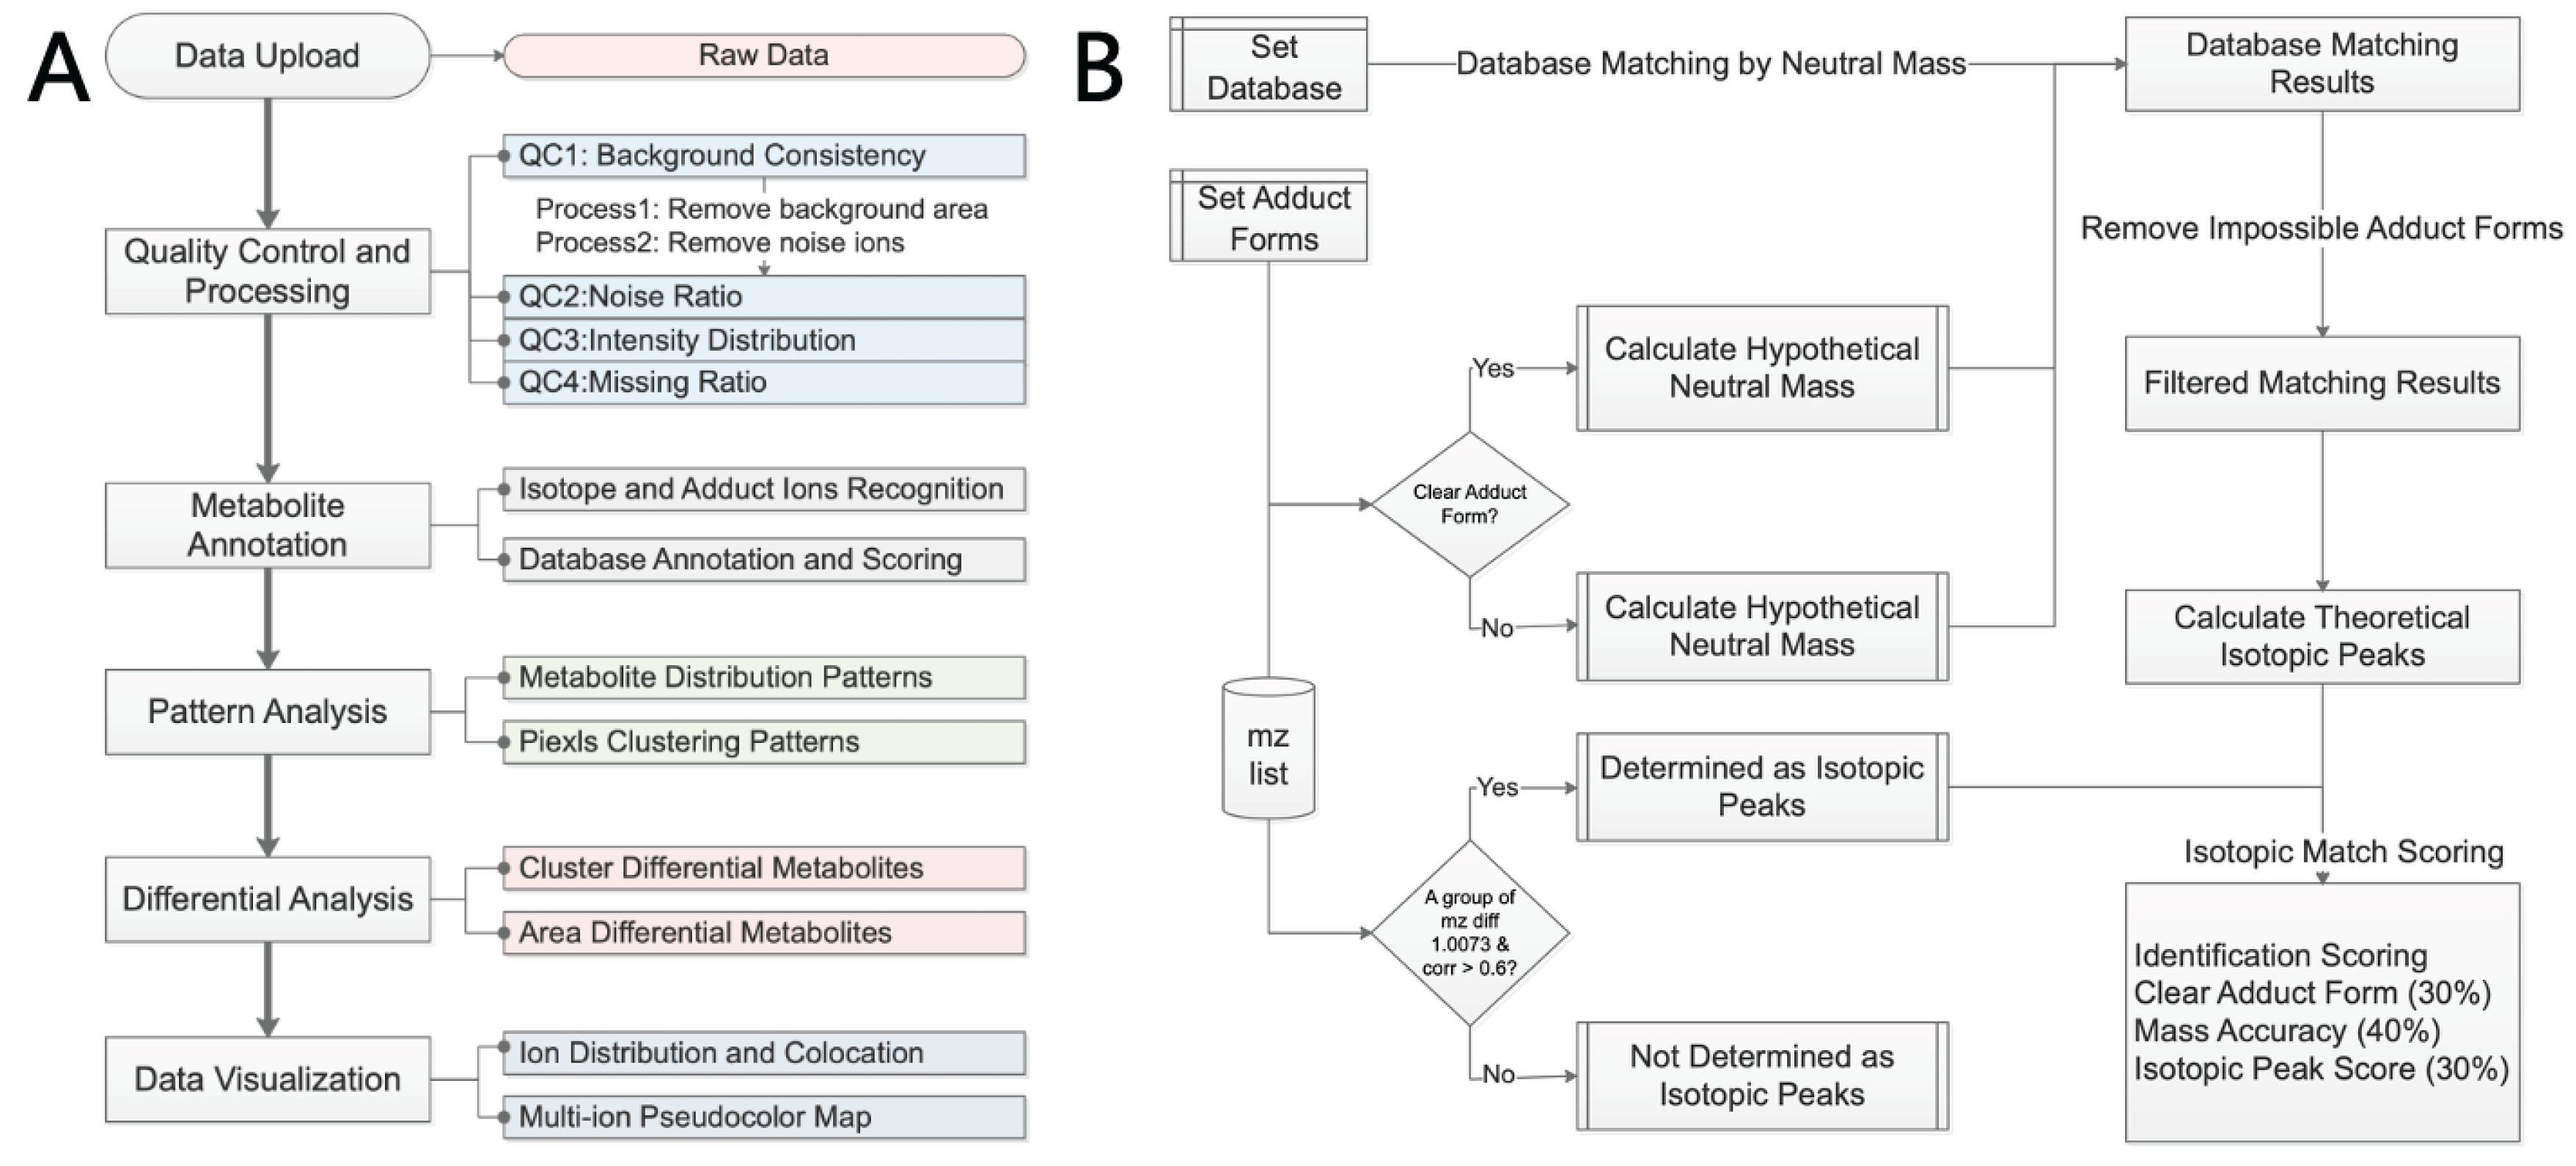
Figure 2.
Mouse brain spatial metabolomics data quality control. H&E staining image (A); Selection of background and tissue regions (B); QC2: Noise ion distribution (C); QC1: Background region consistency: spectra of background regions (D); QC1: correlation of background spectra (E); QC3: m/z intensity distribution (F); Pixel intensity distribution (G); QC4: m/z missing rate distribution (H); QC4: Pixel missing value distribution (I).
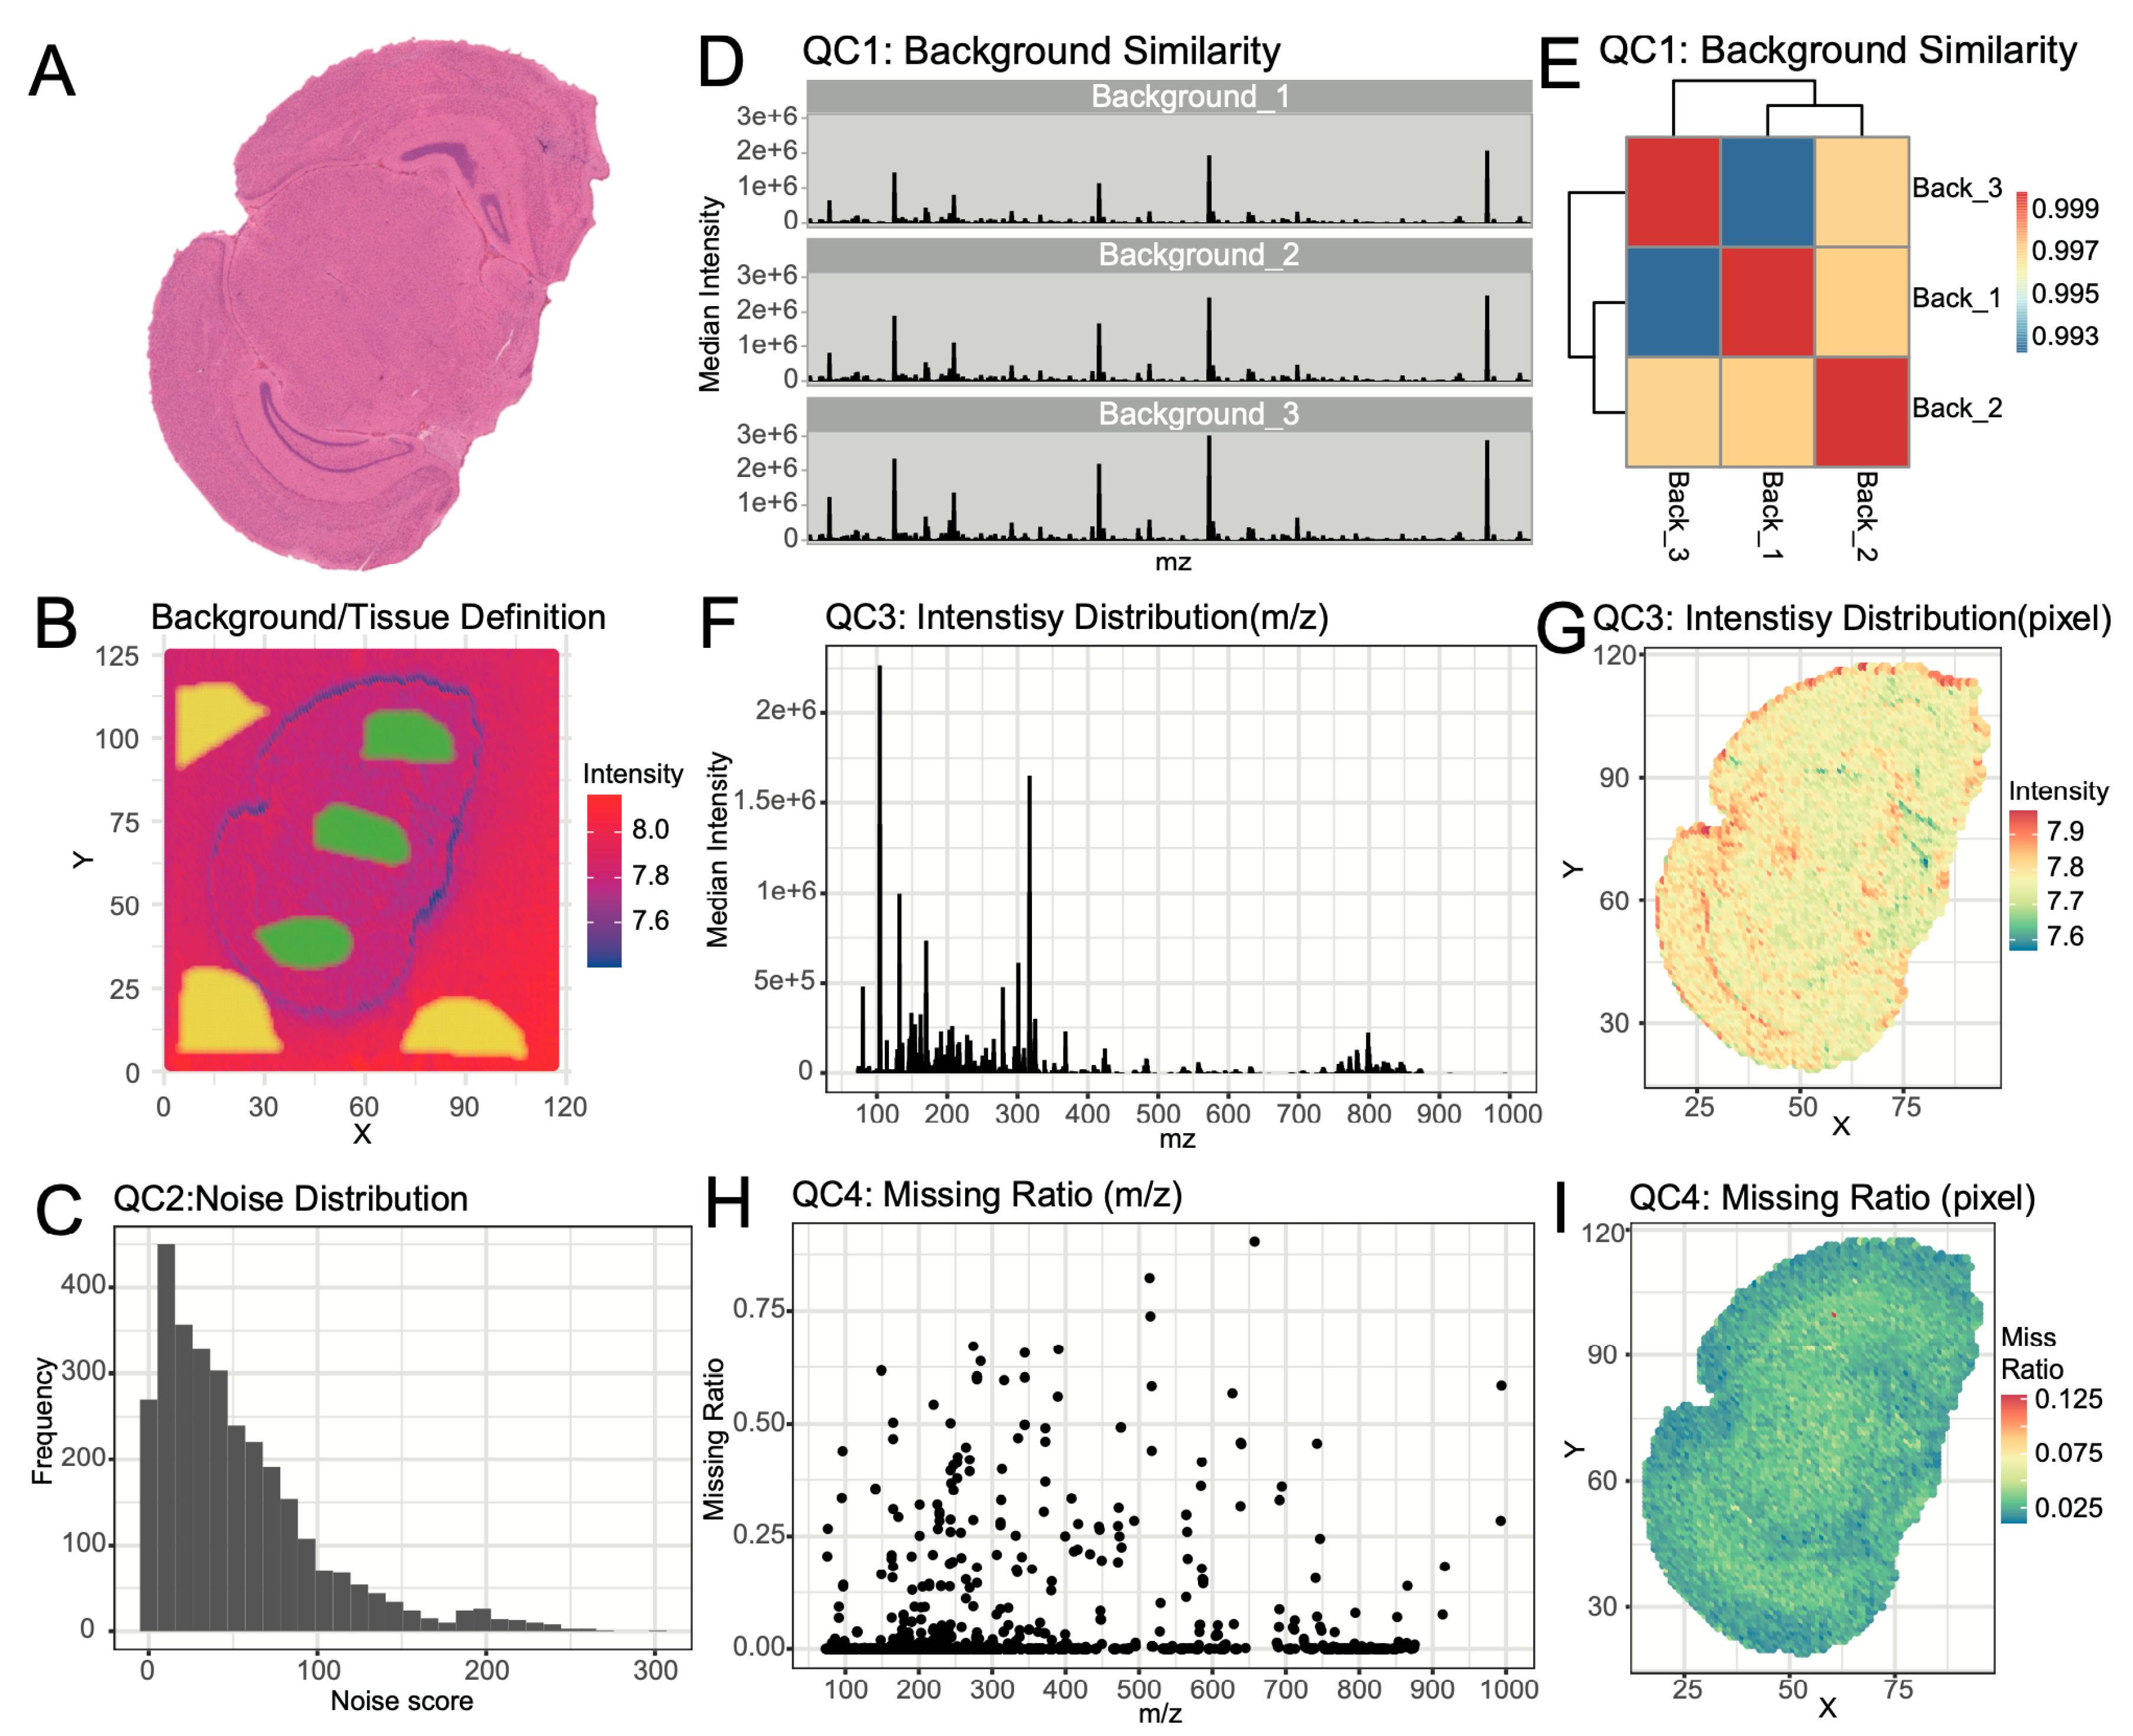
Figure 3.
Spatial metabolomics ion annotation. Typical identified isotopic peak pairs (A); Overall isotopic peak distribution (B); Typical identified adduct ion pairs (C); Overall distribution of adduct ion forms (D); Proportion of ion peaks with annotation results (E); Distribution of one-to-many matching results for ion peaks (F).
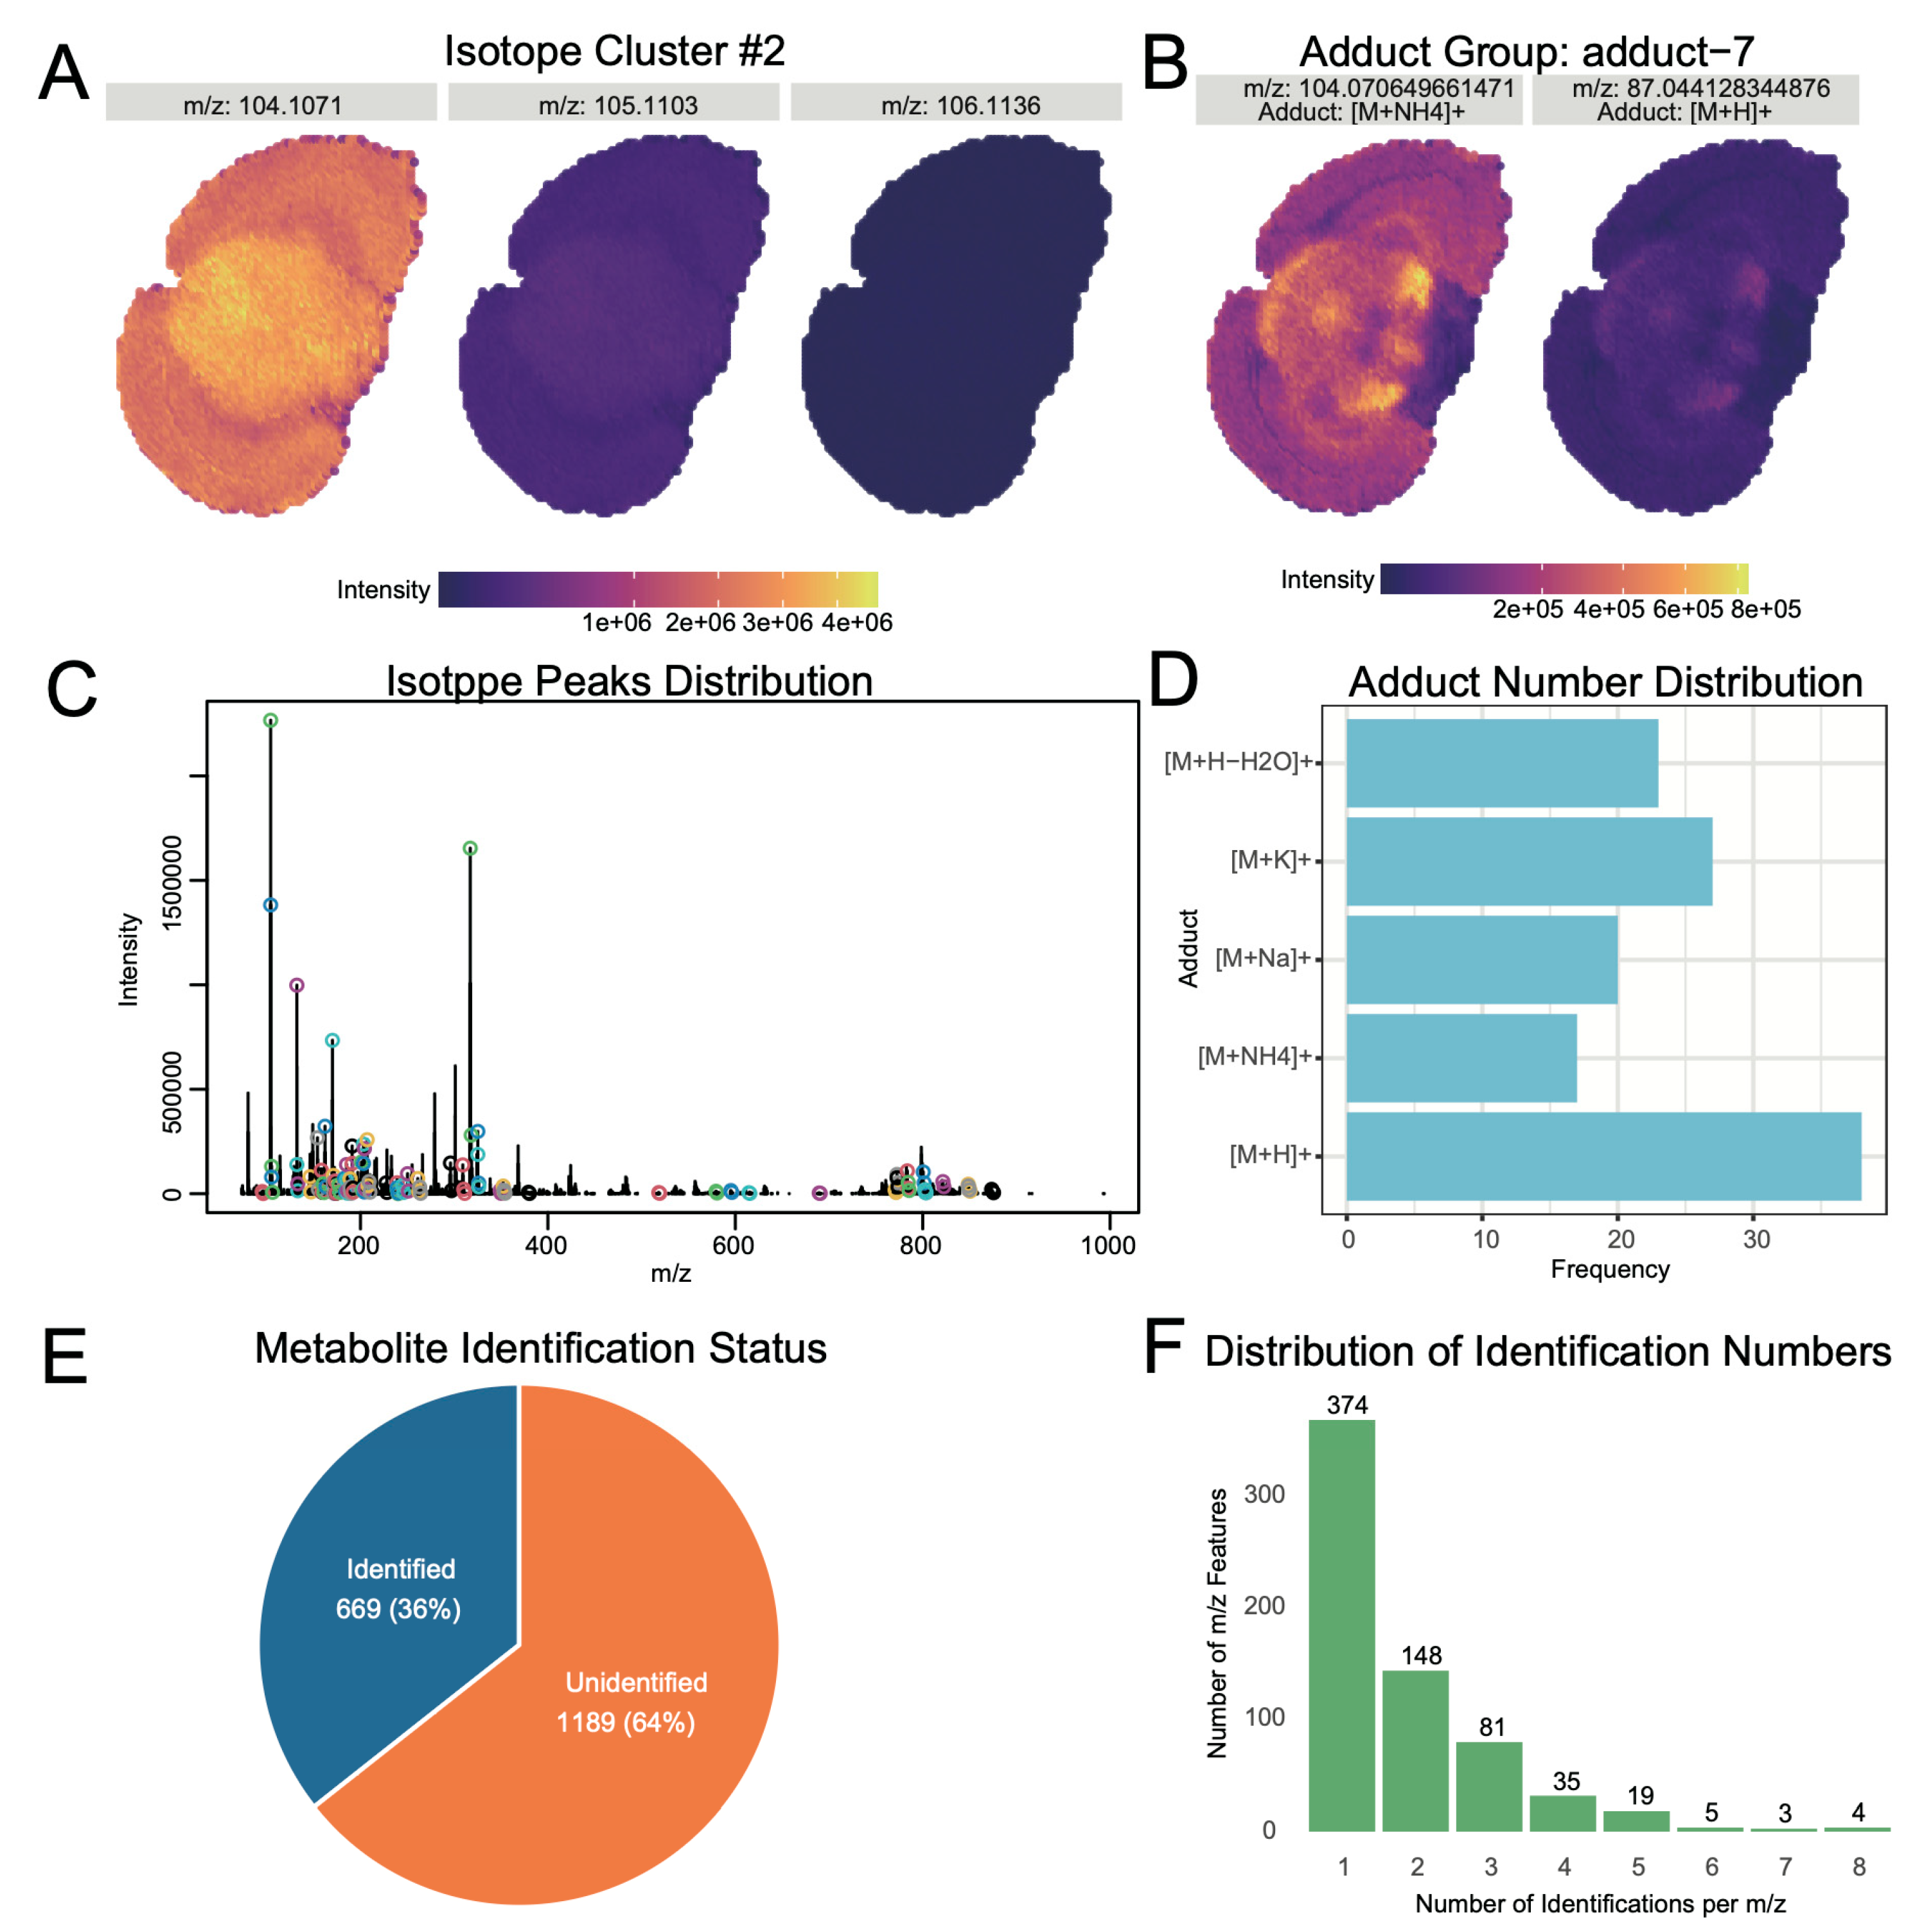
Figure 4.
Spatial pattern identification and differential analysis of mouse brain data. Metabolite spatial expression patterns (A); Pixel clustering patterns (B); Selection of comparison regions based on clustering results (C); Differential volcano plot (D); Functional enrichment analysis for differential results (E).
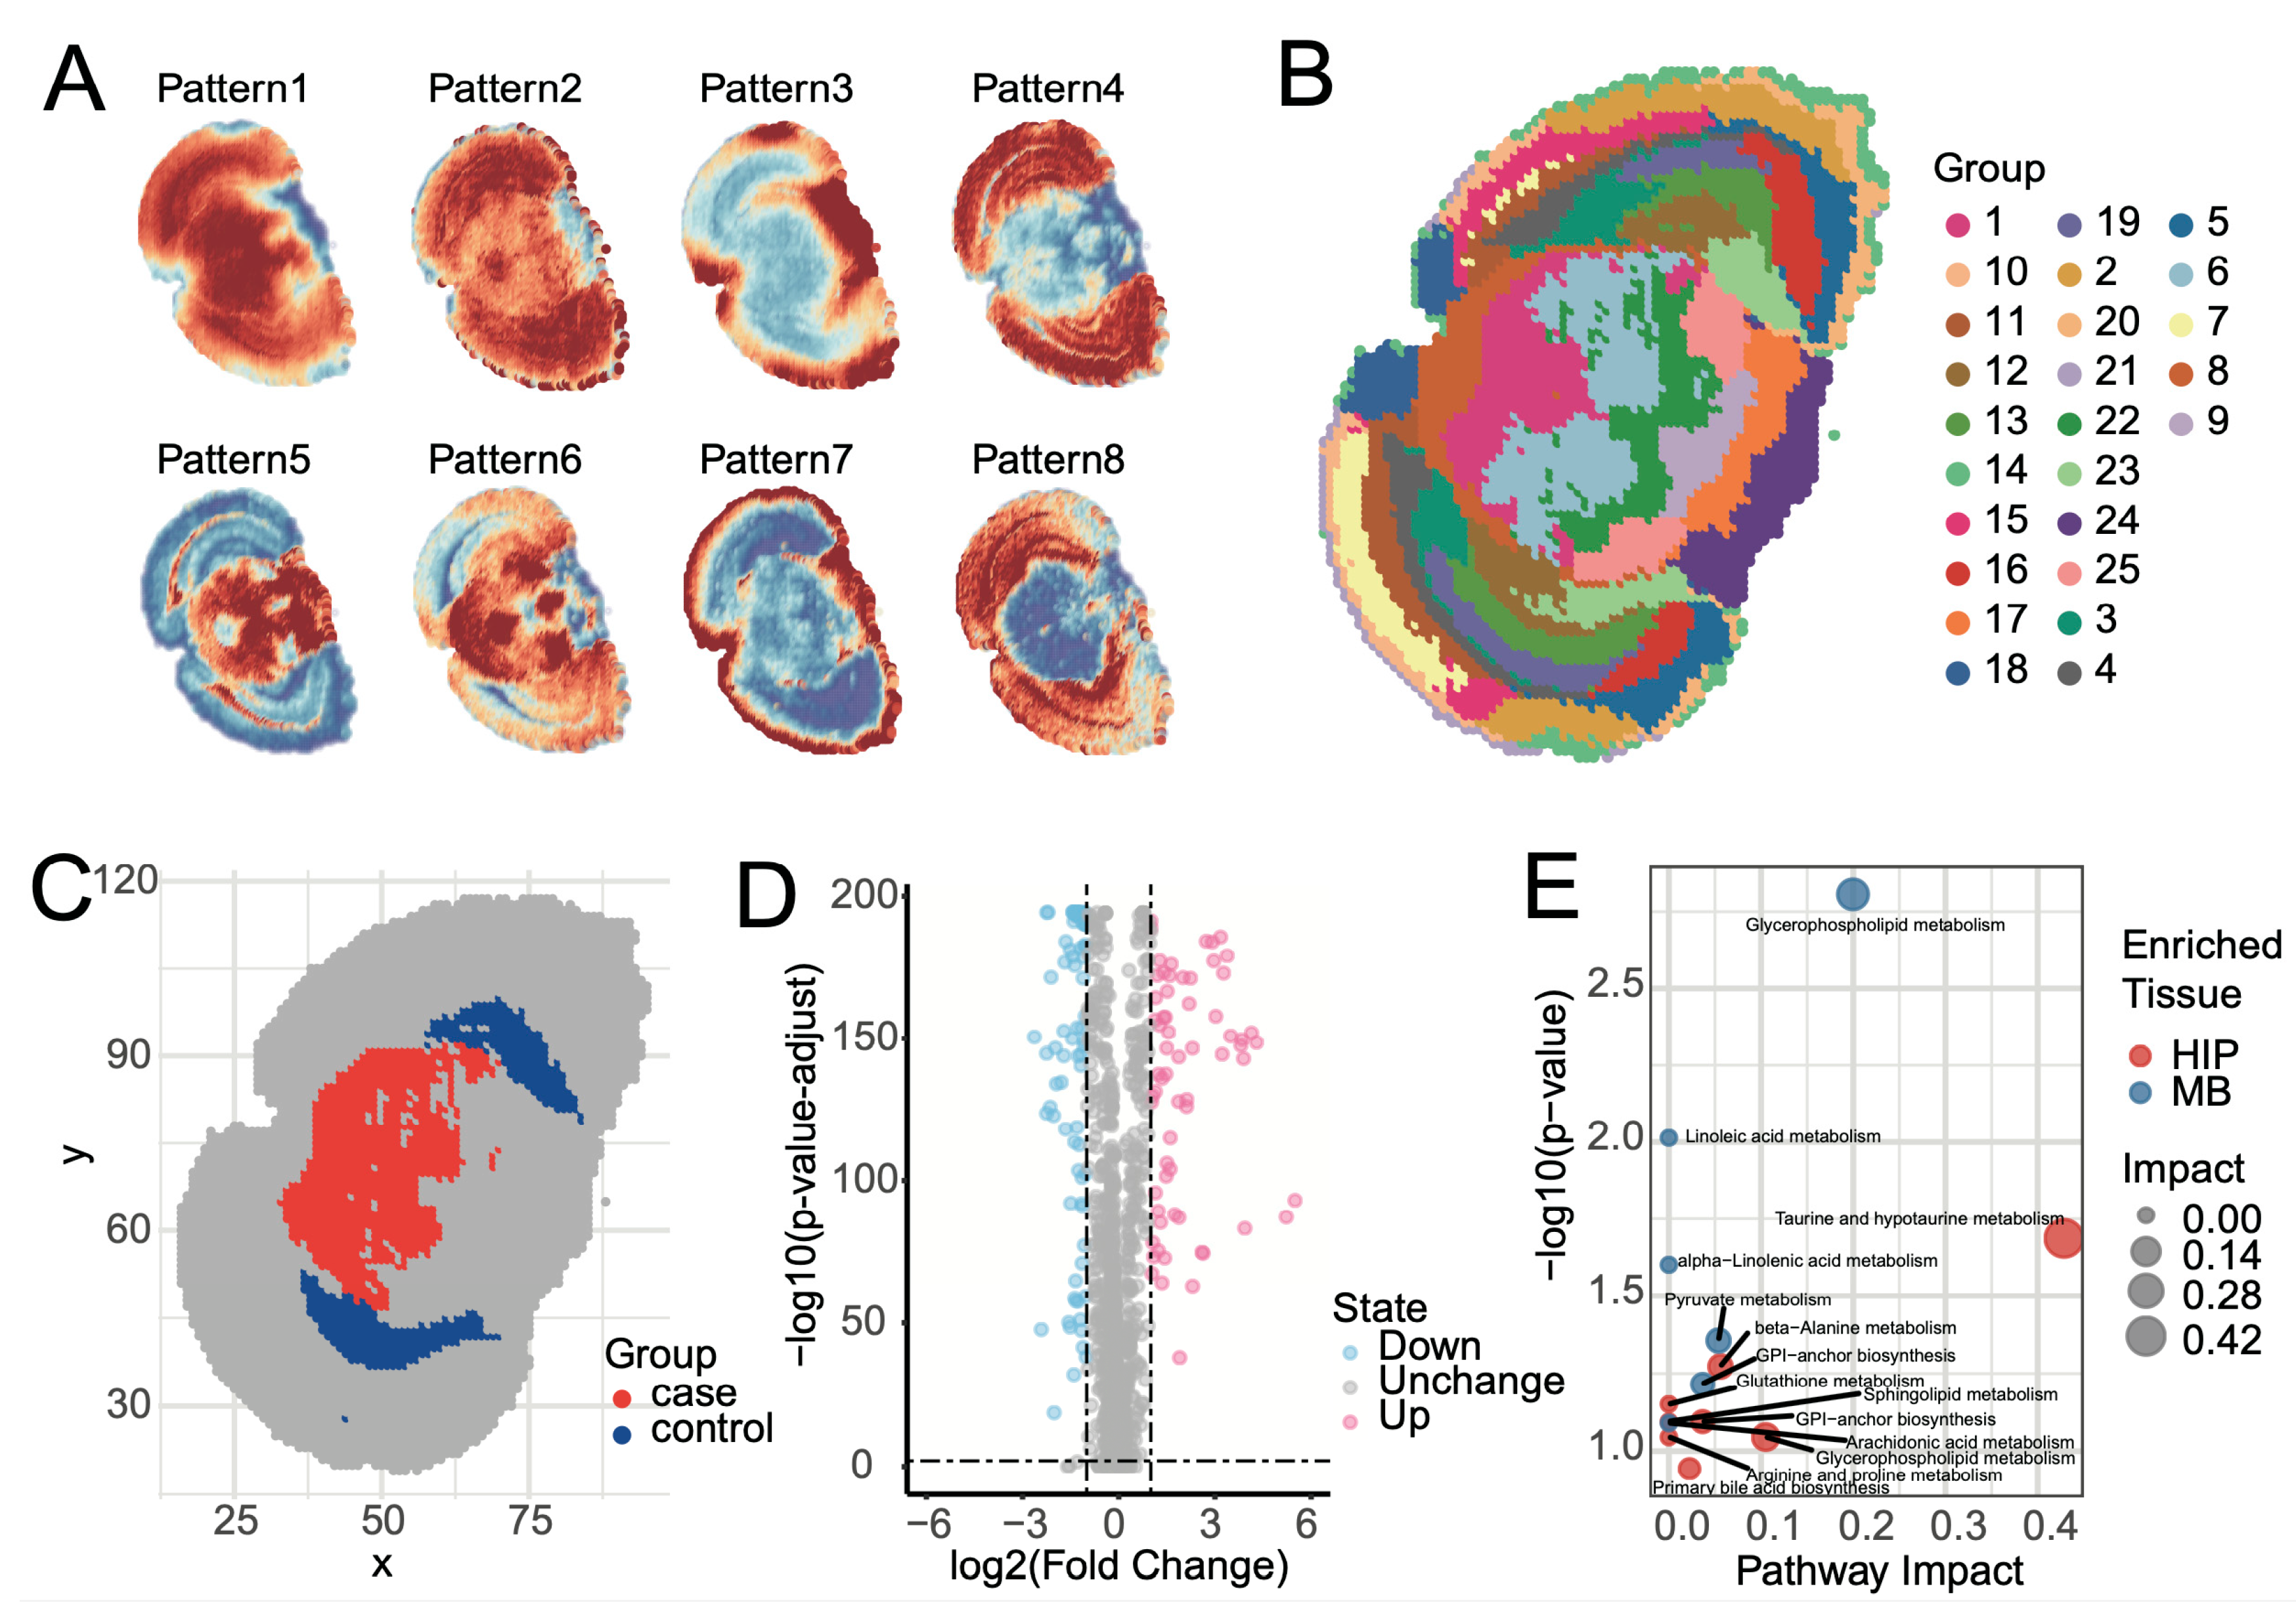

Table 1.
Comparison of Common Spatial Metabolomics Software.
| Category | Specific Comparison Item | SManalyst | Cardinal [10] | MassImager[11] | MSiReader[12] | METASPACE[13] | Multi-MSIProcessor[14] | M2aia[15] | SmartGate[16] |
|---|---|---|---|---|---|---|---|---|---|
| Visualization | Single-ion Imaging |  |
|
|
|
|
|
|
|
| Colocalization Analysis | |
 |
|
|
|
|
|
|
|
| Multi-ion Imaging | |
|
|
|
|
|
|
|
|
| Quality Control | Background Consistency | |
|
|
|
|
|
|
|
| Intensity | |
|
|
|
|
|
|
|
|
| Missing Values | |
|
|
|
|
|
|
|
|
| Noise Ions | |
|
|
|
|
|
|
|
|
| Pattern Analysis | Pixel Clustering Patterns | |
|
|
|
|
|
|
|
| Ion Spatial Expression Patterns | |
|
|
|
|
|
|
|
|
| Differential Analysis | Differential Analysis Based on Manual Region Selection | |
|
|
|
|
|
|
|
| Differential Analysis Based on Clustered Regions | |
|
|
|
|
|
|
|
|
| Metabolite Identification | Isotope Recognition | |
|
|
|
|
|
|
|
| Adduct Ion Recognition | |
|
|
|
|
|
|
|
|
| Identification Result Scoring | |
|
|
|
|
|
|
|
|
| Others | Open Source | |
|
|
|
|
|
|
|
| Graphical User Interface (GUI) | |
|
|
|
|
|
|
|
|
| Year of Last Update | 2025 | 2023 | 2024 | 2018 | 2016 | 2023 | 2021 | 2023 |
Disclaimer/Publisher’s Note: The statements, opinions and data contained in all publications are solely those of the individual author(s) and contributor(s) and not of MDPI and/or the editor(s). MDPI and/or the editor(s) disclaim responsibility for any injury to people or property resulting from any ideas, methods, instructions or products referred to in the content. |
© 2025 by the authors. Licensee MDPI, Basel, Switzerland. This article is an open access article distributed under the terms and conditions of the Creative Commons Attribution (CC BY) license (http://creativecommons.org/licenses/by/4.0/).
Copyright: This open access article is published under a Creative Commons CC BY 4.0 license, which permit the free download, distribution, and reuse, provided that the author and preprint are cited in any reuse.


