
Submitted:
17 September 2025
Posted:
17 September 2025
You are already at the latest version
Abstract
The importance of GIS-models to monitor the spread of infectious diseases and support emergency response has been underlined by a large body of literature and strengthened with the Covid-19 pandemic to identify possible geotechnological solutions able to recognise clusters and patterns, evaluate the presence of speed up factors and define specific actions. In order to implement the state of the art concerning perspectives of health geography and geography of safety, this work discusses the main aims of the project “Integrated revealing GIS-models to monitor, understand and foresee the spread of diseases and support emergency response” and shows some illustrative applications. The basic assumption of the project is to elaborate revealing models, both to monitor the spread of communicable diseases and support strategical first aid measures, that is in the case of cardiac arrest. Particularly: the first aim is to elaborate GIS models able to understand the spread of Covid-19 in some study areas relating the geocalizations of the cases with some specific variables; the second aim – which is tied to the first one – is to program a system of auto-implementation able to auto-update and auto-upgrade on the basis of new data; the third aim is to find optimal geolocalizations of new semiautomatic external defibrillators (AEDs) in unequipped areas to speed up access to community devices and increase survival from cardiac arrest; the fourth aim is to develop some 3D models of buildings able to support indoor space management and decision-making in the case of ordinary and extraordinary situations. In this paper the attention is focused on the first aim and a number of targeted elaborations focused on data regarding Covid-19 according to sex and age and healthcare facilities in the Rome municipality (Italy) are presented as examples, also replicable for precision preparedness.
Keywords:
health geography
; geography of safety
; GIS-models
; infectious diseases
; cardiac arrest
; 3D models
1. Introduction and international framing
A work entitled Why Public Health Needs GIS: A Methodological Overview (Wang, 2020) has underlined the key role played by geographical approach and GIS applications for public health research and policy and particularly in different thematic areas and aspects concerning:
- – modeling geographic heterogeneity in health behavior and outcome;
- – measuring spatial accessibility for patients and potential crowdedness for facilities;
- – from area-based to individualized neighborhood effects;
- – constructing geographic areas for health data dissemination and analysis;
- – delineating hospital service areas;
- – spatial optimization towards a balance in efficiency and equality.
Some years before this, E.K. Cromley and S.L. McLafferty, in 2012, had evidenced the importance of spatial databases and the mapping of health information i.e., to analyse space-time clustering of diseases, to support exposure modelling, evaluate the risk and spread of infectious diseases, calculate shortest paths in the case of emergency, draw buffer zones to identify areas with different levels of exposure, provide a decision support system (DSS) to locate health services, study disparities through effective geovisualization and measure area characteristics.
Back in 2003 (p. 57), C.M. Croner affirmed that “Internet access and use of georeferenced public health information for GIS application will be an important and exciting development […] in this new millennium”.
Therefore, during the Covid-19 pandemic various literary reviews (Franch-Pardo et al., 2020, 2021; Fatima et al., 2021; Ahasan et al., 2022; Pranzo et al., 2022) have underlined how GIS models can be produced for example: to relate Covid-19 to socio-economic variables or to study the potential influence of air and land pollution; to analyse Covid-19 diffusion on the basis of population mobility or effectiveness of health services; to provide disease, exposure and web-based mapping. Other works (Naudé, 2020; Vaishya et al., 2020) have shown how geotechnologies and AI techniques can be useful to support data tracking, the detection of clusters, prediction of areas which may be affected and the creation of an early warning and alert system.
According to these directions:
- – a web-based analytical framework for the detection space-time clusters of Covid-19 has been proposed in the United States which integrates specific “methods and a various of novel interactive visualization features in 2D and 3D within an open-source web-based GIS environment” (Lan, Delmelle, 2024, p. 327);
- – a dynamic space-time diffusion simulator in a GIS environment to analyse the Covid-19 spread in Rome (Italy) has been tested, where the cases are dynamically geolocated and geovisualized on satellite imagery after geocoding (Pesaresi et al., 2021, 2023a).
Different works have therefore “sought to explore the innovative and impactful ways in which geovisualization techniques”, methodological applications and geospatial-temporal analysis “have been employed to confront and elucidate the complexities” of the Covid-19 emergency, looking into perspectives of reproducible elaborations (Delmelle et al., 2024, p. 193); and epidemic digital maps, which integrate outbreak characteristics and visually efficaciously show the data, have become fundamental means for the institutions and population to monitor and understand risk insights (Fang et al., 2024, p. 142).
Moreover, some examples have been also provided by connecting retrospective data and improved algorithms to support predictive hypothesis through a Geospatial AI and satellite-based Earth observation cognitive system (Atek et al., 2022, 2023; Pesaresi et al., 2022); and in these cases, data and algorithms have provided territorial scenarios able to support a concrete geovisualization of geographical-probabilistic information. Therefore, on the basis of the numerous applications developed during the COVID-19 pandemic, the potential function of AI for science, in integrating and enhancing traditional methodologies, has been discussed, both considering multiple strength points which can facilitate proactive responses to possible outbreaks and needs of ad hoc refinement and precaution (Zhao et al., 2024).
A systematic review focused on space-time cluster detection techniques for infectious diseases has then evidenced that, with a notable acceleration during the Covid-19 emergency, public health units “have increasingly harnessed geospatial technologies for disease surveillance, health services allocation, and targeting place-based health promotion initiatives” (Lan, Delmelle, 2023, p. 1); and spatial analysis, based on watchful criterion of data provenance and supported by a rigorous investigation approach, can play “a crucial role in many aspects of research about the COVID-19 pandemic” (Goodchild, 2022, p. 29).
In recent years the essential role of GIS mapping and analysis has been further evidenced by the (United States) National Center for Chronic Disease Prevention and Health Promotion (NCCDPHP), which has planned a series of tools for heart disease and stroke surveillance, as for example an Interactive Atlas of heart disease and stroke (Division for Heart Disease and Stroke Prevention; https://www.cdc.gov/heart-disease-stroke-atlas/about/index.html), and generally for various chronic disease topics (https://www.cdc.gov/chronic-disease/data-surveillance/index.html).
In this framework, Hacker and Kaufmann (2024, p. 1) have affirmed: “Helping communities, state and local partners, and all interested parties understand the prevalence of chronic disease is always a challenge. Over the last few decades, visualization has become enormously helpful. Mapping information that helps people literally see where conditions disproportionately affect specific areas and groups has proved enlightening. Maps created by using geographic information systems — GIS — provide the public with clear, easy-to-understand information on patterns, relationships, and levels of disease or behavior within specific geographic areas. […]. Animated maps can also depict changes over time. Take for example maps of the obesity epidemic, which provided a stark understanding of the epidemic’s expansion. […]. More recently, maps of COVID-19 morbidity linked with maps of chronic disease helped local communities direct vaccination and other mitigation efforts”.
And various examples have been made to underline the added value of GIS mapping and analysis in terms of public health research, practice and policy, with reference to:
- – mapping the overlap of poverty level and prevalence of diagnosed chronic kidney disease (Han et al., 2024);
- – finding optimal locations for implementing innovative hypertension management approaches (Fujii et al., 2024);
- – analizing stroke mortality and stroke hospitalizations at the light of cultural differences and similarities in the geographic patterns (Evans et al., 2024);
- – identifying priority geographic locations for diabetes self-management education and support services (Wittman et al., 2024);
- – promoting a behavioral risk factor surveillance system after having identified people who have never been screened for (colorectal) cancer (Richardson et al., 2024);
- – studying ethnic disparities in adult obesity to support local action (Petersen et al., 2024).
But the importance of putting chronic diseases on the maps enhancing GIS tools was already discussed some years ago (Miranda et al., 2013) and other contributions contextualized the added values of GIS in evaluating the relationships between road-distance to primary care facilities, ischemic heart disease and stroke mortality (Saijo et al., 2017) and in better organising and planning emergency medical service systems (Sepehrvand et al., 2020). Recently (Bentué-Martínez et al., 2023, p. 1), GIS mapping has then been applied to “identify spatially varying relationships between the multi-morbidity of hypertension and diabetes and the sociodemographic settings” in Aragon (Spain).
In the field of chronic diseases, with reference to cardiovascular disease and systems able to reduce situations of avoidable deaths, a webMap prototype has been devised to speed up the access to the Sapienza University of Rome defibrillators and increase survival from out-of-hospital cardiac arrest (Pesaresi et al., 2023b). This webMap provides: AED geolocalization on a satellite imagery or digital street with interactive pop-up information; calculation and display of the route to reach each AED; the possibility to be visualized online by any mobile devices. And the importance of a similar AEDs network is notable in a Campus like the Sapienza University (founded in 1303) which is the largest in Europe with 122,000 students (in the 2022-2023 academic year), 3,576 professors, 2,320 employees, technicians and librarians, 1,260 administrative staff in the University hospital structures (https://www.uniroma1.it/en/pagina/about-us).
To record progress beyond the state of the art, the project “Integrated revealing GIS-models to monitor, understand and foresee the spread of diseases and support emergency response” (funded by the Sapienza University of Rome, in the category “Large research projects” 2024) has been devised by considering some main aims both to monitor the spread of communicable diseases and support strategical measures in the case of cardiac arrest. From a geotechnological point of view, these aims can be perceived to enhance the GIS equipment of the GeoCartographic Laboratory (Pesaresi, 2022) and this project represents an answer to some requests of “absolute relevance and great impact for the University […] in order to achieve excellent results for the benefit of the entire Sapienza community” advanced by the Special Office for Prevention, Protection and High Supervisory (Prot. N. 0047665 – 18/05/2022).
2. Objectives and Applied Proposals
From an interdisciplinary and applied point of view, the project here presented pursues a number of objectives linked to the following.
The first objective is to elaborate (Arc)GIS models able to understand the rapid spread of Covid-19 in some study areas relating the geocalizations of the cases with some socio-demographic and (co)morbidity aspects and the presence of vulnerable facilities. The involvement of similar variables in the models also helps to better understand territorial differences recorded in terms of infection and lethality. Moreover, it makes it possible to create a link between the past pandemic and possible future emergencies. On the basis of specific sources, that is provided by Local Health Units (ASLs) and undergoing data cleaning and quality, the data – geolocated on satellite imagery through accurate geocoding – are studied in relation to the presence of some factors that can face the emergency (hospitals) and have an important position for medicine supply (pharmacies), or hold a delicate role (nursing homes) and even accelerate the diffusion and represent particularly susceptible places (elderly healthcare residences). This information would be mapped in detail based on official sources such as the open data portals of the Ministry of Health, after being recorded in geodatabases and overlaid as integrative layers. Moreover, the geolocated data provided by ASLs are analysed in relation to specific variables, for example regarding population age structure and sex, and can also be studied considering tobacco smoking and other behaviors-related threats, indicators of deprivation i.e., evaluated per census sections on the basis of the quantitative and administrative data first of all of the National Statistics Institute (ISTAT). In this way it is possible to move from animation surveillance models which cartographically represent the data to revealing GIS models which highlight territorial elements, relations, possible weak points or strategical factors. Furthermore, it makes it possible to: integrate the dynamic space-time diffusion simulator in a GIS environment to analyse the Covid-19 spread in Rome in terms of new cases, deaths and different outcomes (Pesaresi et al., 2021, 2023a); produce replicable models for precision preparedness.
The second objective, strictly related to the previous one, is to program a system of auto-implementation able to auto-update and auto-upgrade on the basis of new data. The base programming language to develop the above-mentioned system is Python, for its wide compatibility and integration with ArcGIS Pro and ArcMap (Pimpler, 2015, 2017; Zandbergen, 2020a, 2020b), which will become essential for ad hoc solutions and the following spatial analysis. A similar system can be a decision support tool able to monitor the evolution of any airborne infectious diseases. The data provided by the ASLs would be recorded and organised in a single geodatabase in cloud computing, able to join and automatically map the data in order to feed an effective real-time geotechnological system. A test system would therefore be developed and be particularly useful at the beginning of an epidemic (or a pandemic) to quickly identify areas potentially affected by the spread of disease and in the subsequent phases to organise specific measures and actions, meeting and disclosing a series of needs which came to light during the Covid-19 emergency.
The third objective is to find optimal geolocalizations of new AEDs in unequipped areas in order to speed up access to community defibrillators. With regard to this goal, in May 2022 the GeoCartographic Laboratory received a request from the Special Office for Prevention, Protection and High Supervisory (SOPPHS) for a collaboration aimed, among other, at the geolocalization of the Sapienza University AEDs and the development of a system for navigation with mobile devices able to reach the nearest defibrillator in a short time. In fact, the Sapienza University considers it very important to create a wide and profitable network able to reduce the time necessary to reach these devices as much as possible, in the case of heart attacks. Therefore, a webMap prototype was produced (Pesaresi et al., 2023b) to speed up the first-aid operations and increase the possibility to save human lives. From an operative point of view, the work synthetically moved according to the following steps: - acquisition of information and geographical coordinates recorded in the University management system (based on LIFELINK central) for each AED; - development of a new database functional to geolocation; integration of information organised in the new database with further specific data; - geolocation of AEDs in the Google MyMaps environment; - graphic representation on digital maps through specific symbols; publication of the webMap through the University High Supervisory Board account. Moreover, thanks to the passing to an ArcGIS environment, a webApp was produced (Pesaresi, Pavia, 2023, pp. 177-180) in order to: search for the AED closest to a starting point that can be entered manually or by using the GNSS sensor installed on devices; - geovisualize the AEDs in ascending order of distance from a given point; - calculate the minimum routes based on a custom road graph. Currently, it is required a spatial analysis aimed at identifying the areas that are not covered by AEDs in the estimated time of four minutes to reach the nearest device and come back to people having a cardiac arrest. Detailed digital maps will be elaborated using buffer zones, for a first analysis, and then service areas to painstakingly recognize empty spaces and the strategical locations of new defibrillators.
The fourth objective is to develop some 3D models of buildings able to support indoor space management and decision-making in the case of ordinary and extraordinary situations. To pursue this goal, it is possible to start from the first ArcGIS model developed for the Faculty of Letters and Philosophy building of the Sapienza University. In fact, again in May 2022 the GeoCartographic Laboratory received a request from the SOPPHS for further collaborations aimed at: the georeferencing of the Sapienza University buildings as part of the implementation of the Sapienza Spaces Integrated Management System (with a request for a feasibility evaluation and methodological-operational proposals); geolocation of Covid-19 cases reported in the Sapienza University classrooms/buildings, for the purpose of stratified graphic rendering (according to a proposal by the Department of Public Health and Infectious Diseases). These elaborations require a rigorous and extended process of georeferencing of single buildings. Using ArcGIS Pro, the Faculty of Letters and Philosophy building as sample was georeferenced on a satellite imagery and a proof of a 3D model subdivided into the different floors of the chosen buildings with its rooms, library, laboratories etc. was produced through extrusion (Pesaresi, Pavia, 2023, pp. 183-188). By using ad hoc tools, functionalities and applications, available from the GeoCartographic Laboratory, the goal is to create some realistic 3D scenes and models in an interoperable, unified and cross-functional system moving in the direction of a whole three-dimensional Campus elaborated in an ArcGIS 3D global scene according to the procedure developed. It would provide notable starting points to support ordinary planning and emergency management, and to help spread awareness of the Campus spaces and routes. The importance of similar initiatives has been also evidenced in the Republic of Korea where hospital digital twins have been developed to satisfy the growing demand of models finalized to the strategic management of indoor spaces, also to monitor the diffusion and transmission of epidemics (starting from Covid-19) in fragile places (Lee et al., 2025).
In the perspectives of these four objectives, the combination between the geographical thinking (Brooks et al., 2017; Chang, 2020, p. 33; van der Schee, 2020, p. 25) and GIS, in the direction of the interdisciplinary approach , creates added values and innovation (Steinert, 2023; Karhulahti, 2024), which spill over and materialise on the methodological-operational and educational-scientific levels. This makes it possible to build an applied bridge and a virtuous connection for the production-analysis of technical-operational maps, revealing diffusion simulators, three-dimensional models and problem-solving solutions. And then, it makes it possible to concretely show how geographical thinking and GIS applications can support public health policy (Dummer, 2008) and safety planning (Bansal, 2011).
“The local impacts of global hazards highlight the necessity to enhance geographic skill sets in order to build community resilience” (Morri, 2020, p. 5) and interdisciplinary planning makes it possible to achieve “common purposes of different subject fields” (Sicherl-Kafol, Denac, 2010, p. 4695).
3. Some Applied Examples, Discussion and First Results
In order to provide some illustrative examples, targeted elaborations have been produced with ArcGIS Pro and they are here presented and discussed. Some examples focused on the Rome municipality chosen as study area are therefore shown regarding:
- – the mapping of Covid-19 through geocoding processes, for the period from February 25 to September 26 2020, with distinctions according to sex, and the digital choropleth maps, derived from the previous elaborations and based on quantitative data obtained from the aggregation of geocoding per sub-municipal areas (SCAs);
- – the mapping of Covid-19 through geocoding processes, for the same period, with distinctions according to age, and particularly focused on people aged 65 or more with a consequent specific subdivision in people aged 65-74, 75-84, 85 or more.
- – the mapping of the healthcare facilities through geocoding processes based on the recent official data, with reference to hospitals, nursing homes and pharmacies.
3.1. Materials and Methods
As far as concern the punctual mapping of the data concerning Covid-19 in an exemplifying study area, the elaborations here shown are based on the data provided by the UOC Hygiene and Public Health Service – Local Health Unit Rome 1. These data have been subject to a specific process of data cleaning and they have been represented and displayed on Dark/Light Gray Canvas template through geocoding and then aggregated i.e., per sub-municipal areas on satellite imagery.
Particularly, the geocoding has been based on the domicile and residence address of the people who were positive to Covid-19 according to the data sets received and optimised with the data quality.
In fact, many works have evidenced the importance of methods and techniques able to improve the accuracy and the spatial representation of the data in the case of geocoding and connected analysis (Freestone et al., 2012; Salinas et al., 2022; Lafontaine et al., 2024). Errors or duplications can derive from different situations: missing or incomplete data concerning patients or their addresses; replication of records; cases of coincidence of names common to different areas; wrong settings of the geocoder’s parameters (e.g., input address fields; country or region of reference) etc.
In this way, after accurate data cleaning, 3,055 cases have been geolocalized. If compared with previous works (Pesaresi et al., 2021, 2023a), the current results of geocoding show slight differences since the geocoder used to perform the operation (i.e., “Esri World Geocoder”) has increased its overall performance by the extension of its coverage and the update of the toponyms connected to its features.
In order to provide additional information able to predispose a harmonic system useful for the monitoring and strategical planning in ordinary situations and for territorial screening and detailed analysis in extraordinary situations, a series of layers have been organised regarding i.e., hospitals, nursing homes and pharmacies in the municipality of Rome. The open data have been obtained from the official source of the Italian Ministry of Health and processed through geocoding function . These layers can be also overlayed and analysed together with the ones concerning the spread of diseases and in this case with the maps which show the distribution of Covid-19 cases in the period considered.
3.2. Mapping the Covid-19 Data According to Sex Through Punctual Geocoding and Digital Choropleth Maps
Figure 1 and Figure 2 show a subdivision in 1,648 males and 1,407 females in order to provide a distinction according to sex. These elaborations provide detailed distributive data which are functional to geographical screening and territorial diagnostic imaging, revealing first information also in terms of notable crowding.
In fact, in a recent work, Jordan Tyris et al. (2024, p. 293) have affirmed that: “Beyond visualization, geocoding helps advance cartography (conception, production, dissemination, and study of maps), geostatistics (analyzing and predicting spatial and spatiotemporal phenomena), and spatial analysis (evaluating and modeling spatial data). Geocoded data importantly visualizes the distribution of diseases over time and throughout space, as well as the density of resources in communities and their proximity to a specific patient. By facilitating the identification of geographic clusters of disease and assessing the effectiveness of public health interventions, geocoding has become an important tool for understanding the complex associations between the environment (both physical and social) and health outcomes”.
From a distributive point of view, the digital choropleth maps in Figure 3 and Figure 4, which derive from Figure 1 and Figure 2, underline some critical situations since they are the result of the aggregation of cases per sub-municipal areas. Methodologically, three classes have been built with the same values, taking the cue from the quantile method in an integrated perspective between data related to male and female cases, and using two chromatic scales. Figure 3, regarding males, shows high values recorded by the “centroid” (made by two SCA) and North-West area, medium values of the horizontal East sector and one SCA of the West sector, and low values of the South-West sector. A tripartition is evident according to the following tendential distinction: SCAs in the North area and the “centroid” have high values; SCAs in the Central zone have medium values, with heavy crowding in the East sector; SCAs in the South zone have low values. Figure 4, regarding females, shows high values recorded by the “centroid” and the same North-West area, medium values in a more limited East sector and in the extreme South-West SCA, and low values in the South-West sector and in the extreme East SCA. A little more interspersed situation therefore appears.
3.3. Mapping the Covid-19 Data According to Age Through Punctual Geocoding
In Figure 5 the geocoding has been made by extracting only people aged 65 or more from the whole, since people become more fragile and could probably have comorbidities with the increase in age. The elaboration shows the results of punctual geocoding and cartographically gives back 976 cases (32% of the total) who constitute the potentially more vulnerable “slice” of the population. Figure 5 is therefore focused on a group of people who require particular attention because the outcomes could be characterised by severe conditions or deaths.
Figure 6, derived from Figure 5, shows a subdivision into three classes: 65-74 years, 75-84 and 85 or more so as to provide a distinction considering a social-demographic criterion to which some specific needs could be related. In fact, the lower level of positive reaction to the illness can depend on the older age and related co-morbidity. Therefore, the punctual digital map reveals the distribution of the 976 cases of people aged 65 or more, subdivided into: 352 cases for people aged 65-74; 255 cases for people aged 75-84; 369 cases for people aged 85 or more. The integration with the data contained in the medical record can provide a series of useful information to spatially frame the areas characterised by situations with the greatest severity.
Currently, the organisation of a similar multilevel geodatabase, able to make it possible to overlay thematic layers and data aggregations, is supporting a cascade production of digital maps for a relational geospatial analysis of different variables in order to dynamically analyse and geovisualize the Covid-19 spread in Rome and with a view to possible applications of territorial healthcare.
In a recent work, Samany et al. (2022, p. 11) have in fact affirmed that spatio-temporal models and GIS-based solutions can provide notable support to analytically investigate the medical geography “relations between the intensity of COVID-19 outbreak and any environmental, socio-demographic, and infrastructural characteristics”.
3.4. Mapping the Healthcare Facilities as Complementary Layers and in a Perspective of Preparedness
Figure 7 shows (on a Light Gray Canvas template) the geolocation of the hospitals recorded in the official dataset (referred to 2023) and puts in evidence a concentration in the centre of the city and along an “alignment” directed to the West side. Moreover, some sub-municipal areas contain more than one hospital, while some others have no inner structures and people must inevitably resort to the facilities of other sub-municipal areas. This is for example the case of sub-municipal areas III, VII and VIII. From a geographical point of view, the difference is also evident between centre and periphery, and only three hospitals are outside the Great Ring Road and two of these are very nearby in the South-West sub-municipal area X, while the third one is present on the East side (sub-municipal area VI). The Figure also highlights the possibility to query the map and obtain the data referred to the different hospitals in a pop-up with some general information which in a perspective of social utility and preparedness would be integrated with other ad hoc data as for example: hospital wards, number of beds, presence of paediatric emergency department etc.
Figure 8 shows (on a Light Gray Canvas template) the geolocation of the nursing homes recorded in the official dataset (referred to 2023) and a concentration in the centre of the city is evident. All the nursing homes are present inside the Great Ring Road, with the exception of two in the South-West sector, particularly in the sub-municipal area X. All the sub-municipal areas contain almost one nursing home, but while some sub-municipal areas have several nearby nursing homes, first of all number II, other contexts have only one facility, and this is the case of sub-municipal areas IV (in the East side) and IX (in the South zone), the latter having a very large extension; in addition also the sub-municipal area VI, at the East extremity, contains two nursing homes, but they are very near each other and for the remaining surface there are no nursing homes. In the Figure, a table frame shows the number of nursing homes per sub-municipal areas providing a synthetic report.
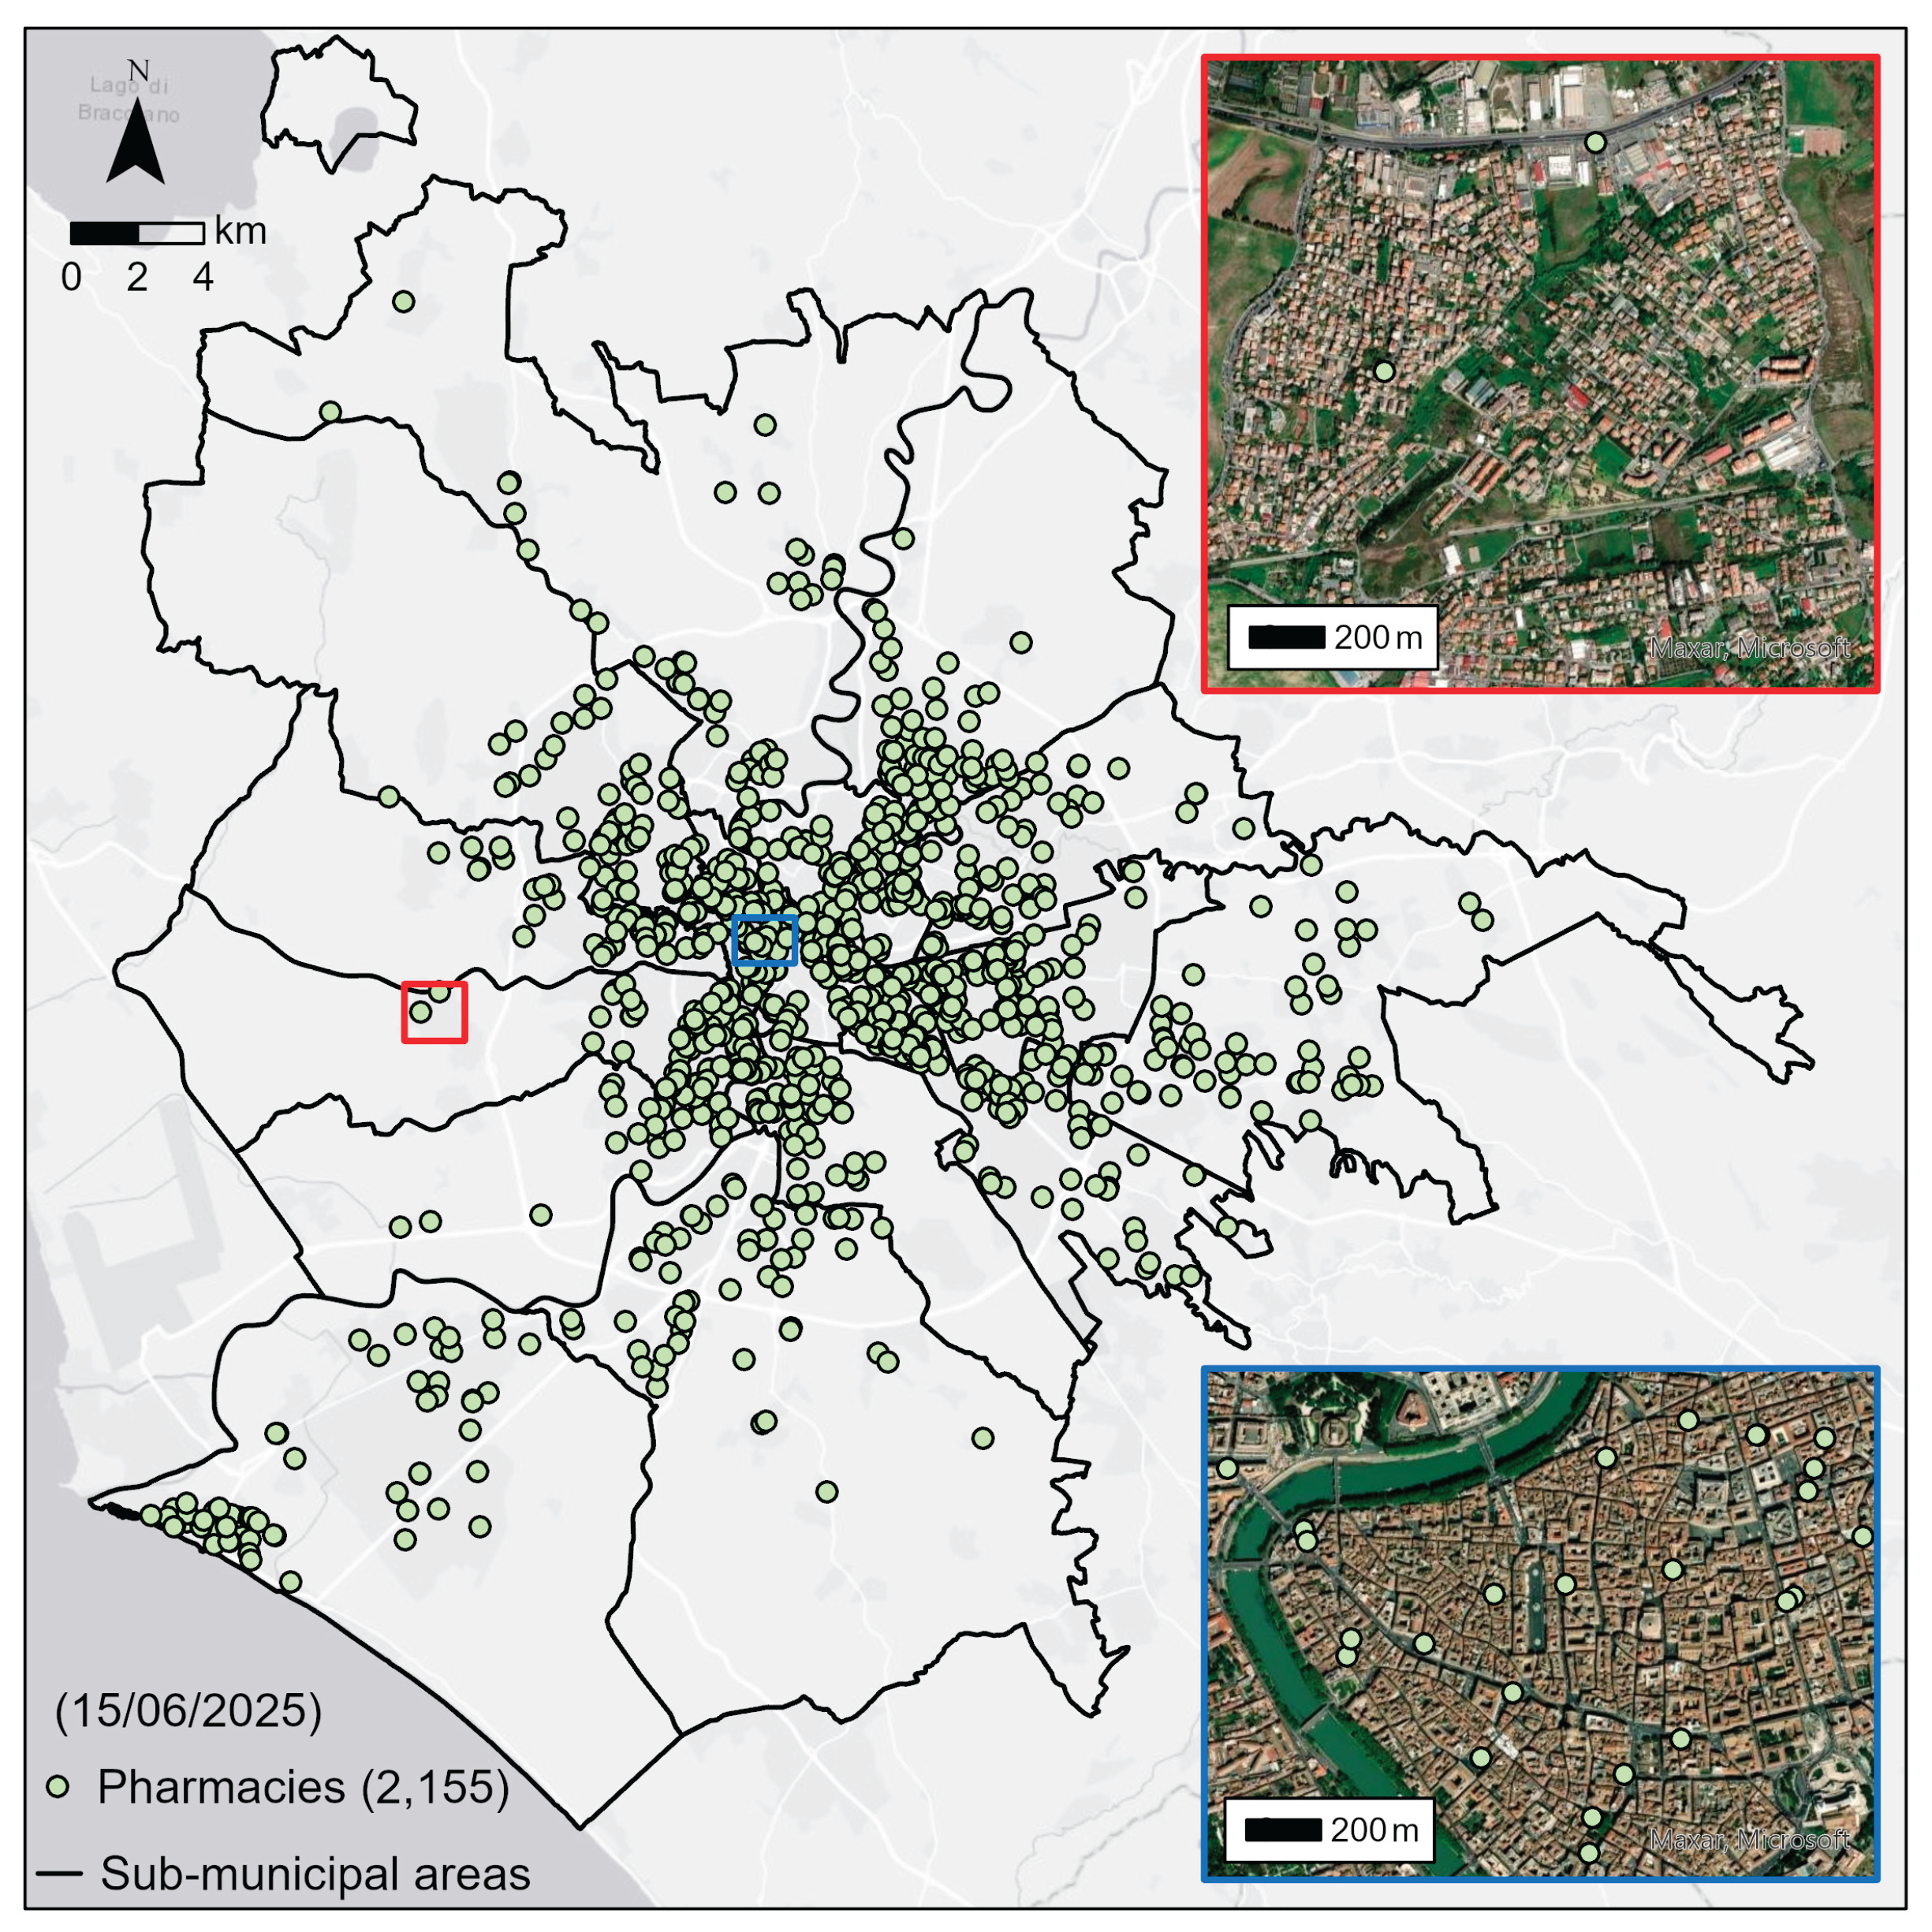
Figure 9 shows (on a Light Gray Canvas template) the geolocation of the pharmacies recorded in the official dataset (referred to 2025) and puts in evidence a notable number in the city centre and however inside the Great Ring Road, even if upon careful examination, supported by dynamic zoom in, some zones seem empty, i.e., in a wide surface of sub-municipal VIII. The presence of pharmacies on the territory plays a crucial social role because they provide medicine and some health services, also referring to (Covid-19 or other) swabs.
As recently affirmed with reference to the situation related to the Covid-19 pandemic: “Uninterrupted supply of essential medicine is the backbone of health care system. An effective plan and appropriate strategies are vital to combat such future emergencies” (Ramakrishnan et al., 2023, p. 1). And moreover: “Resilient pharmaceutical systems and supply chains are critical in the control” of impactful diseases able to scatter public health systems (Tirivangani et al., 2021, p. 1).
By changing the template and using satellite imagery (Figure 9), a certain correspondence tendentially appears between built-up areas and pharmacies, that is to say that where there are many buildings (and residents) there is also a notable number of pharmacies. Nevertheless in some cases this relation is not satisfied and inset maps which provide specific zoom can highlight critical situations with potential difficulties, amplified in the case of extraordinary situations.
4. Conclusion. Thinking of the Possible Progress Beyond the State of the Art
This research is devised to shed some light on the progress made beyond the state of the art in various directions of social utility, enhancing the possibility to make interdisciplinary approaches and GIS applications a profitable union for social improvement and effective preparedness.
At the beginning of the Covid-19 pandemic, a contribution regarding the geographical tracking and mapping of SARS-CoV-2 showed the notable added value which can be provided by GIS to support the global fight against outbreaks (Kamel Boulos, Geraghty, 2020). While the situation unfolded in all its criticality, the possibility to effectively geolocalize and geovisualize the data on contagions and deaths was evidenced. A joint discussion about the possible benefits obtainable by using GIS elaborations and dashboards also took place, showing a set of applications developed in the United States and planned in Italy (Dangermond et al., 2020). Moreover, other works have: discussed the effectiveness of animated choropleth and proportional symbol cartograms in order to avoid visual biases and make clearly communicative epidemiological dashboards (Kronenfeld, Yoo, 2024); analysed some design frameworks which provide promising perspectives to characterize geotechnological applications “in terms of elements of vivid cartography and techniques of map-based storytelling” and they have strengthened the state of the targeted knowledge by proposing “new story map techniques and suggesting avenues of refinement” (Prestby, 2024, p. 222). A number of geotechnological proposals to tackle health emergencies were also advanced in the perspective of replicable applications concerning (Pesaresi et al., 2020): ArcGIS Pro models of spatial and temporal spread in digital dot maps derived from geocoding; digital flow maps – with Tracker for ArcGIS and Tracking Analyst – which show the routes that paucisymptomatic Covid-19 cases could have covered on foot after leaving their home; smart surveys for the identification of possible Covid-19 positives based on a confidential geolocalized online questionnaire to be submitted with ArcGIS Survey123.
After all, some years before this, the importance was underlined of the opportunities related “to apply spatial analytic methods in epidemiologic research, focusing on methodologies involving geocoding, distance estimation, residential mobility, record linkage and data integration, spatial and spatio-temporal clustering, small area estimation, and […] applications to disease mapping” (Kirby et al., 2017, p. 1). Furthermore, in recent years Kim et al. (2022, p. 1) have evidenced how GIS can be used to tackle health issues and define actions “focusing on determinants of health and health equity at the community […] level, highlight relationships between place and health, and encourage participation from […] communities in health-decision making”. New modeling methods based on GIS and geographical analysis can therefore provide crucial capabilities to understand territorial predisposing factors and target suitable prevention measures (Wieczorek, Hanson, 1997).
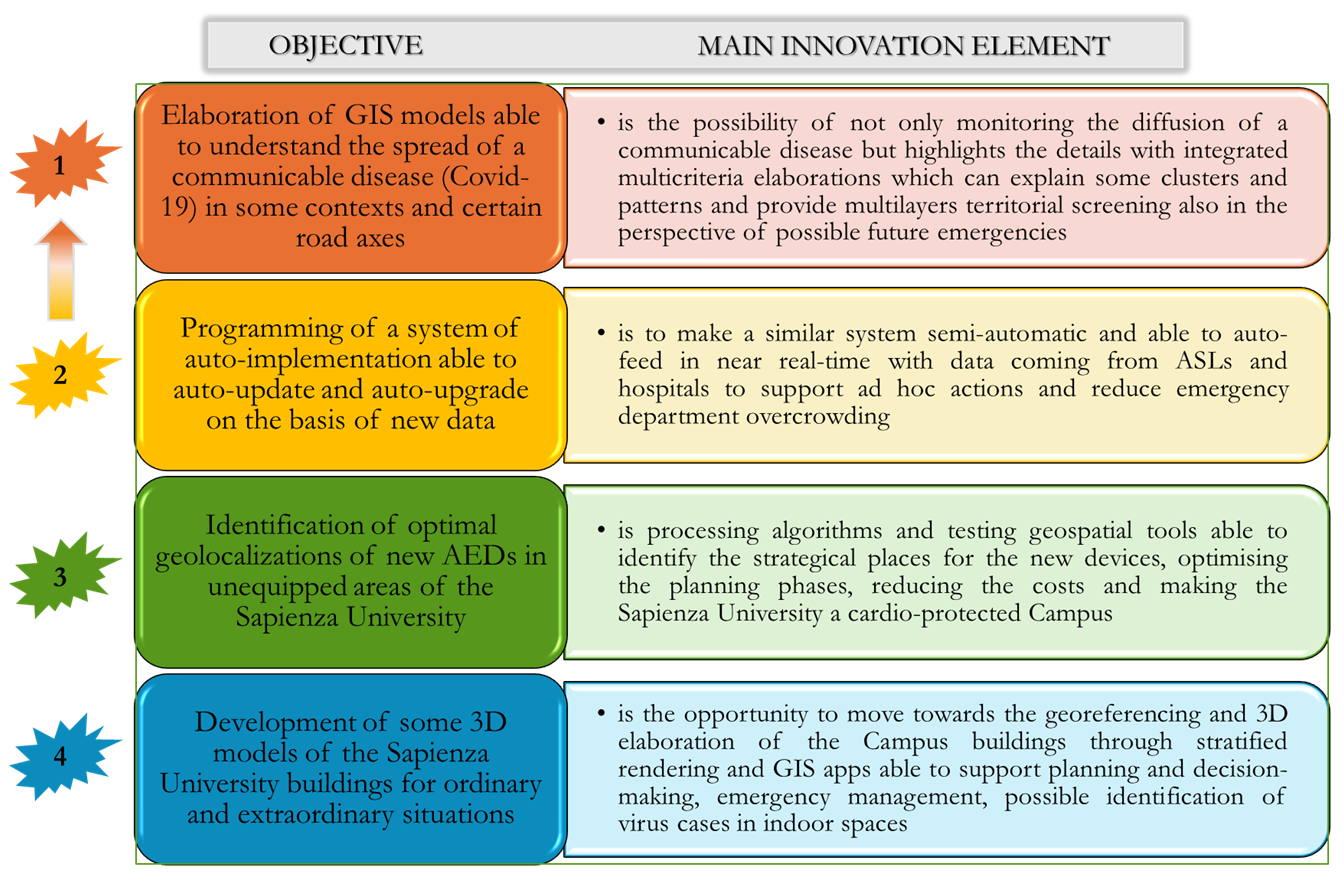
This work provides a framework of the main aims of the project “Integrated revealing GIS-models to monitor, understand and foresee the spread of diseases and support emergency response” and some demonstrative applications have been shown. Particularly, the main innovation elements of the project briefly concern the following four objectives finalized to achieve possible progress beyond the state of the art and reach goals of social utility: - elaboration of GIS models able to understand the spread of a communicable disease (here Covid-19 which is taken as an example) in some contexts and certain road axes; - programming of a system of auto-implementation able to auto-update and auto-upgrade on the basis of new data; - identification of optimal geolocalizations of new AEDs in unequipped areas of the Sapienza University; - development of some 3D models of the Sapienza University buildings for ordinary and extraordinary situations.
In this framework the present paper shows and discusses some elaborations produced with reference to the first aim and it moves towards perspectives of organisation of a multilevel system able to provide a wide number of harmonic layers for surveillance, predictive hypothesis, precision preparedness. In particular, these targeted elaborations regard: - the mapping of Covid-19 through geocoding processes (on data provided by the UOC Hygiene and Public Health Service – Local Health Unit Rome 1), for the period between February 25 and September 26 2020, with distinctions according to sex, and the digital choropleth maps based on the data derived from the aggregation per sub-municipal areas of the results of geocoding; - the mapping of Covid-19 through geocoding processes (on data provided by the UOC Hygiene and Public Health Service – Local Health Unit Rome 1), for the same period, with distinctions according to age, and centred on people aged 65 or more with a further subdivision in people aged 65-74, 75-84, 85 or more; - the mapping of the healthcare facilities through geocoding processes (on the recent open data from the Ministry of Health), with reference to hospitals, nursing homes and pharmacies.
That is a multiple answer to common needs, since: “Given the increasing availability of spatial data and visualization tools, we have an opportunity to overcome traditionally siloed fields and practice settings to advance knowledge and more appropriately respond to emerging public health crises” (Eberth et al., 2021, p. 41); and we must count on rigorous planning and ad hoc tools for the re-thinking of territories and implementational strategies (Casti, Riggio, 2022, pp. 15-16), also taking inspiration from the lessons of the Covid-19 pandemic (Palagiano et al., 2025), which – in spite of its gravity – has paradoxically provided a fruitful opportunity for meaningful inputs in the value of analytical mapping and GIS functions (Geraghty, Kerski, 2020, p. 53).
During the trauma of the pandemic, Joop van der Schee (2020, p. 21) said: “Scientists are working hard to find out more about the new virus, especially to get vaccines to stop it. Geography offers knowledge and tools to help to visualize and analyze the diffusion of the virus and its effects on society at different scales”.
Geotechnologies can therefore be enhanced to actually help in monitoring evolutive situations, increasing safety conditions, thus reducing avoidable deaths.
Author Contributions
“Conceptualization”, Cristiano Pesaresi; methodology, Cristiano Pesaresi; software, Cristiano Pesaresi, Davide Pavia; validation, Cristiano Pesaresi, Davide Pavia; formal analysis, Cristiano Pesaresi, Davide Pavia; investigation, Cristiano Pesaresi, Davide Pavia; resources, Cristiano Pesaresi, Davide Pavia; data curation, Cristiano Pesaresi, Davide Pavia; writing—original draft preparation, Cristiano Pesaresi, Davide Pavia; writing—review & editing, Cristiano Pesaresi, Davide Pavia; visualization, Cristiano Pesaresi, Davide Pavia; supervision, Cristiano Pesaresi; project administration, Cristiano Pesaresi; funding acquisition, Cristiano Pesaresi. All authors have read and agreed to the published version of the manuscript.”
Funding
“The project ‘Integrated revealing GIS-models to monitor, understand and foresee the spread of diseases and support emergency response’ was funded by Sapienza University of Rome, in the category ‘Large research projects’ 2024, protocol number RG124190D55D4B34”.
Data Availability Statement
Data regarding Covid-19 used for the elaborations have been provided by UOC Hygiene and Public Health Service – Local Health Unit Rome 1 (Rome), thanks to Vito Cerabona and Enrico Di Rosa. Data regarding healthcare facilities have been obtained by Italian Ministry of Health at the following links: https://www.dati.salute.gov.it/it/dataset/farmacie/; https://www.salute.gov.it/portale/documentazione/p6_2_8_1_1.jsp?lingua=italiano&id=13.
Acknowledgments
This paper was devised together by the authors, but particularly: Cristiano Pesaresi wrote Section 1, Section 2, Section 3, Section 3.2, Section 4. Davide Pavia wrote Section 3.1, Section 3.3, Section 3.4. The authors thank Corrado De Vito for his support and suggestions and for the contacts provided.”
Conflicts of Interest
“The authors declare no conflicts of interest.”
References
- Ahasan, R.; Alam, M.S.; Chakraborty, T.; Hossain, M.M. Applications of GIS and geospatial analyses in COVID-19 research: A systematic review. F1000Research 2022, 9, 1379, pp. 1-14. [Google Scholar] [CrossRef]
- Atek, S.; Bianchini, F.; De Vito, C.; Cardinale, V.; Novelli, S.; Pesaresi, C.; Eugeni, M.; Mecella, M.; Rescio, A.; Petronzio, L.; Vincenzi, A.; Pistillo, P.; Giusto, G.; Pasquali, G.; Alvaro, D.; Villari, P.; Mancini, M.; Gaudenzi, P. A predictive decision support system for coronavirus disease 2019 response management and medical logistic planning. Digital Health 2023, 9, pp. 1-20. [Google Scholar] [CrossRef] [PubMed]
- Atek, S.; Pesaresi, C.; Eugeni, M.; De Vito, C.; Cardinale, V.; Mecella, M.; Rescio, A.; Petronzio, L.; Vincenzi, A.; Pistillo, P.; Bianchini, F.; Giusto, G.; Pasquali, G.; Gaudenzi, P. A Geospatial Artificial Intelligence and satellite-based earth observation cognitive system in response to COVID-19. Acta Astronautica 2022, 197, pp. 323-335. [Google Scholar] [CrossRef] [PubMed]
- Bansal, V.K. Application of geographic information systems in construction safety planning. International Journal of Project Management 2011, 29, pp. 66-77. [Google Scholar] [CrossRef]
- Bentué-Martínez, C.; Mimbrero, M.R.; Zúñiga-Antón, M. Spatial patterns in sociodemographic factors explain to a large extent the prevalence of hypertension and diabetes in Aragon (Spain). Frontiers in Medicine 2023, 10, pp. 1-11. [Google Scholar] [CrossRef] [PubMed]
- Brooks, C.; Butt, G.; Fargher, M. (Eds.) The Power of Geographical Thinking, Springer, 2017.
- Casti, E.; Riggio, A. Prefazione. Le tre Italie, le molte Italie. In Atlante COVID-19 Geografie del contagio in Italia; Casti E., Riggio A., Eds.; Collana Atlanti, A.Ge.I.: Rome, 2022, pp. 9-16.
- Chang, C.-H. Teaching and Learning Geography in pandemic and post-pandemic realities. J-READING (Journal of Research and Didactics in Geography) 2020, 2, 9, pp. 31-39. [Google Scholar]
- Cromley, E.K.; McLafferty, S.L. GIS and Public Health, The Guilford Press: NY-London, 2012.
- Croner, C.M. Public health, GIS, and the Internet. Annual Review of Public Health 2003, 24, pp. 57-82. [Google Scholar] [CrossRef]
- Dangermond, J.; De Vito, C.; Pesaresi, C. Using GIS in the Time of the COVID-19 Crisis, casting a glance at the future. A joint discussion. J-READING (Journal of Research and Didactics in Geography) 2020, 1, 9, pp. 195-205. [Google Scholar] [CrossRef]
- Delmelle, E.; Bearman, N.; Yao, X.A. Developing geospatial analytical methods to explore and communicate the spread of COVID19. Cartography and Geographic Information Science 2024, 51, 2, pp. 193-199. [Google Scholar] [CrossRef]
- Dummer, T.J.B. Health geography: supporting public health policy and planning. Canadian Medical Association Journal 2008, 178, 9, pp. 1177-1180. [Google Scholar] [CrossRef]
- Eberth, J.M.; Kramer, M.R.; Delmelle, E.M.; Kirby, R.S. What is the place for space in epidemiology? Annals of Epidemiology 2021, 64, pp. 41-46. [Google Scholar] [CrossRef]
- Evans, K.; Casper, M.; Schieb, L.; DeLara, D.; Vaughan, A.S. Stroke Mortality and Stroke Hospitalizations: Racial Differences and Similarities in the Geographic Patterns of High Burden Communities Among Older Adults. Preventing Chronic Disease 2024, 21, pp. 1-5. [Google Scholar] [CrossRef]
- Fatima, M.; O’Keefe, K.J.; Wei, W.; Arshad, S.; Gruebner, O. Geospatial Analysis of COVID-19: A Scoping Review. International Journal of Environmental Research and Public Health 2021, 18, 2336, pp. 1-14. [Google Scholar] [CrossRef]
- Fang, H.; Du, X.; Sun, Y.; Yang, N. Risk perception evaluation of epidemic maps using event-related potentials. Cartography and Geographic Information Science 2024, 52, 2, pp. 142-159. [Google Scholar] [CrossRef]
- Franch-Pardo, I.; Desjardins, M.R.; Barea-Navarro, I.; Cerdà, A. A review of GIS methodologies to analyze the dynamics of COVID-19 in the second half of 2020. Transactions in GIS 2021, 25, pp. 2191-2239. [Google Scholar] [CrossRef] [PubMed]
- Franch-Pardo, I.; Napoletano, B.M.; Rosete-Verges, F.; Billa, L. Spatial analysis and GIS in the study of COVID-19. A review. Science of the Total Environment 2020, 739, pp. 1-10. [Google Scholar] [CrossRef] [PubMed]
- Freestone, D.; Williamson, D.; Wollersheim, D. Geocoding coronial data: tools and techniques to improve data quality. Health Information Management Journal 2012, 41, 3, pp. 4-12. [Google Scholar] [CrossRef]
- Fujii, Y.; Streeter, T.E.; Schieb, L.; Casper, M.; Wall, H.K. Finding Optimal Locations for Implementing Innovative Hypertension Management Approaches Among African American Populations: Mapping Barbershops, Hair Salons, and Community Health Centers. Preventing Chronic Disease 2024, 21, pp. 1-3. [Google Scholar] [CrossRef]
- Geraghty, E.; Kerski, J. The Impact of COVID-19 on Geography, GIS, and Education. J-READING (Journal of Research and Didactics in Geography) 2020, 2, 9, pp. 53-66. [Google Scholar]
- Goodchild, M.F. COVID-19 and the Science of Where. In COVID-19 and a World of Ad Hoc Geographies; Brunn, S.D.; Gilbreath, D., Eds.; Springer, 2022, pp. 29-41.
- Hacker, K.; Kaufmann, R. Chronic Disease Mapping, an Important Strategy and Tool for Health Promotion. Preventing Chronic Disease 2024, 21, pp. 1-4. [Google Scholar] [CrossRef]
- Han, Y.; Xu, F.; Morgenstern, H.; Bragg-Gresham, J.; Gillespie, B.W.; Steffick, D.; Herman, W.H.; Pavkov, M.E.; Veinot, T.; Saran, R. Mapping the Overlap of Poverty Level and Prevalence of Diagnosed Chronic Kidney Disease Among Medicare Beneficiaries in the United States. Preventing Chronic Disease 2024, 21, pp. 1-5. [Google Scholar] [CrossRef] [PubMed]
- Jackson, P. Thinking geographically. Geography 2006, 91, 3, pp. 199-204. [Google Scholar] [CrossRef]
- Kamel Boulos, M.N.; Geraghty, E.M. Geographical Tracking and Mapping of Coronavirus Disease COVID-19/severe Acute Respiratory Syndrome Coronavirus 2 (SARS-CoV-2) Epidemic and Associated Events Around the World: How 21st Century GIS Technologies Are Supporting the Global Fight Against Outbreaks and Epidemics. International Journal of Health Geographics 2020, 19, 8. [Google Scholar]
- Karhulahti, V.-M. Interdisciplinary Value. Meta-Psychology 2024, 8, pp. 1-4. [Google Scholar] [CrossRef]
- Kim, J.; Kim, D.H.; Lee, J.; Cheon, Y.; Yoo, S. A scoping review of qualitative geographic information systems in studies addressing health issues. Social Science & Medicine 2022, 314, pp. 1-17. [Google Scholar] [CrossRef]
- Kirby, R.S.; Delmelle, E.; Eberth, J.M. Advances in spatial epidemiology and geographic information systems. Annals of Epidemiology 2017, 27, 1, pp. 1-9. [Google Scholar] [CrossRef] [PubMed]
- Kronenfeld, B.J.; Yoo, K. il. Effectiveness of animated choropleth and proportional symbol cartograms for epidemiological dashboards. Cartography and Geographic Information Science 2024, 51, 2, pp. 330-346. [Google Scholar] [CrossRef]
- Lafontaine, A.; Lee, S.; Jacquemin, B.; Glorennec, P.; Le Bot, B.; Verrey, D.; Goldberg, M.; Zins, M.; Lequy, E.; Villanueva, C.M. Chronic exposure to drinking water nitrate and trihalomethanes in the French CONSTANCES cohort. Environmental Research 2024, 259, pp. 1-12. [Google Scholar] [CrossRef]
- Lan, Y.; Delmelle, E. Space-time cluster detection techniques for infectious diseases: A systematic review. Spatial and Spatio-temporal Epidemiology 2023, 44, pp. 1-14. [Google Scholar] [CrossRef]
- Lan, Y.; Delmelle, E. A web-based analytical framework for the detection and visualization space-time clusters of COVID-19. Cartography and Geographic Information Science 2024, 51, 2, pp. 311-329. [Google Scholar] [CrossRef]
- Lee, Y.; Choi, M.H.; Song, Y.-S.; Lee, J.-G.; Park, J.Y.; Li, K.-J. Building an Indoor Digital Twin – A Use-Case for a Hospital Digital Twin to Analyze COVID-19 Transmission. ISPRS International Journal of Geo-Information 2025, 13, 460, pp. 1-23. [Google Scholar] [CrossRef]
- Miranda, M.L.; Casper, M.; Tootoo, J.; Schieb, L. Putting Chronic Disease on the Map: Building GIS Capacity in State and Local Health Departments. Preventing Chronic Disease 2013, 10, pp. 1-7. [Google Scholar] [CrossRef] [PubMed]
- Morri, R. A Question of Geography Literacy: Geographical Studies on Covid Sars 2 and Lifelong Education. J-READING (Journal of Research and Didactics in Geography) 2020, 2, 9, pp. 5-9. [Google Scholar]
- Naudé, W. Artificial Intelligence against COVID-19: An Early Review. DP N. 13110, IZA (Institute of Labor Economics): Bonn, 2020, pp. 1-14.
- Palagiano, C.; Pesaresi, C.; Pavia, D.; De Vito, C.; di Masi, A.; Simonetti, O.; Di Rosa, E. Lessons from COVID-19 Pandemic for Future Preparedness. Examples of GIS and Geocoding Applications in Rome. In Covid-19: Impacts on Health and Health Systems; Akhtar, R., Ed.; Springer, 2025, pp. 221-237.
- Pesaresi, C. InDAGIS-MODE&APP. Modelli Operativi Dinamici con Elaborazioni GIS Interattive Avanzate a n Dimensioni e Applicazioni per la Preparedness e la Patrimonializzazione. Semestrale di Studi e Ricerche di Geografia 2022, 1, pp. 69-89. [Google Scholar]
- Pesaresi, C.; Atek, S.; De Vito, C.; Cardinale, V.; Bianchini, F.; Novelli, S.; Eugeni, M.; Mecella, M.; Rescio, A.; Petronzio, L.; Vincenzi, A.; Pistillo, P.; Giusto, G.; Pasquali, G.; Alvaro, D.; Gaudenzi, P.; Mancini, M.; Villari, P. The ECO4CO project among retrospective data, improving of algorithms, predictive hypothesis and future perspectives to tackle health emergencies. J-READING (Journal of Research and Didactics in Geography) 2022, 1, 11, pp. 27-48. [Google Scholar]
- Pesaresi, C.; Pavia, D. InDAGIS-MODE&APP project. A first assessment after one year in the field of medical geography, public health, precision preparedness through some applied demonstrations. J-READING (Journal of Research and Didactics in Geography) 2023, 1, 12, pp. 167-191. [Google Scholar]
- Pesaresi, C.; Pavia, D.; De Vito, C. Three geotechnological proposals to tackle health emergencies and the monitoring of infectious diseases. Inputs from the COVID-19 pandemic for future preparedness. Bollettino della Associazione Italiana di Cartografia 2020, 170, Special Issue, pp. 58-75.
- Pesaresi, C.; Pavia, D.; De Vito, C. Upgrading of a Dynamic Space-Time Diffusion Simulator in a GIS Environment developed to analyse the COVID-19 spread in Rome. A replicable exemplification. Bollettino della Associazione Italiana di Cartografia 2023a, 175, pp. 54-74.
- Pesaresi, C.; Pavia, D.; Casini, L.; Renzi, E.; Failla, G.; Kerr, M.; Villari, P.; De Vito, C. The Sapienza University of Rome network of automated external defibrillators: a prototype webMap developed to speed access to community defibrillators and increase survival from out-of-hospital cardiac arrest. European Review for Medical and Pharmacological Sciences 2023b, 27, pp. 9363-9374.
- Pesaresi, C.; Pavia, D.; De Vito, C.; Barbara, A.; Cerabona, V.; Di Rosa, E. Dynamic Space-Time Diffusion Simulator in a GIS Environment to tackle the Covid-19 emergency. Testing a geotechnological application in Rome. Geographia Technica 2021, 16, Special Issue, pp. 82-99.
- Petersen, R.; Pan, L.; Blanck, H.M. Racial and Ethnic Disparities in Adult Obesity in the United States: CDC’s Tracking to Inform State and Local Action. Preventing Chronic Disease 2024, 21, pp. 1-6. [Google Scholar] [CrossRef]
- Pimpler, E. Programming ArcGIS with Python Cookbook, Packt: Birmingham, 2015.
- Pimpler, E. Programming ArcGIS Pro with Python. Automate Your ArcGIS Pro Geoprocessing Tasks with Python, Geospatial Training Services, 2017.
- Pranzo, A.M.R.; Dai Prà, E.; Besana, A. Epidemiological geography at work: An exploratory review about the overall findings of spatial analysis applied to the study of CoViD-19 propagation along the first pandemic year. GeoJournal 2022, pp. 1-23.
- Prestby, T. Design Techniques for COVID-19 Story Maps: A Quantitative Content Analysis. Cartography and Geographic Information Science 2024, 51, 2, pp. 222-241. [Google Scholar] [CrossRef]
- Ramakrishnan, M.; Poojari, P.G.; Rashid, M.; Nair, S.; Pulikkel Chandran, V.; Thunga, G. Impact of COVID-19 pandemic on medicine supply chain for patients with chronic diseases: Experiences of the community pharmacists. Clinical Epidemiology and Global Health 2023, 20, 101243, pp. 1-8. [Google Scholar] [CrossRef] [PubMed]
- Richardson, L.C.; King, J.B.; Thomas, C.C.; Richards, T.B.; Dowling, N.F.; Coleman King, S. Adults Who Have Never Been Screened for Colorectal Cancer, Behavioral Risk Factor Surveillance System, 2012 and 2020. Preventing Chronic Disease 2024, 21, pp. 1-4. [Google Scholar] [CrossRef]
- Saijo, Y.; Yoshioka, E.; Kawanishi, Y.; Nakagi, Y.; Hanley, S.J.B.; Yoshida, T. Relationships between road-distance to primary care facilities and ischemic heart disease and stroke mortality in Hokkaido, Japan: A Bayesian hierarchical approach to ecological count data. Journal of General and Family Medicine 2017, 19, 1, pp. 4-8. [Google Scholar] [CrossRef] [PubMed]
- Salinas, J.J.; Sheen, J.; Shokar, N.; Wright, J.; Vazquez, G.; Alozie, O. An electronic medical records study of population obesity prevalence in El Paso, Texas. BMC Medical Informatics and Decision Making 2022, 22, 46, pp. 1-7. [Google Scholar] [CrossRef] [PubMed]
- Samany, N.N.; Liu, H.; Aghataher, R.; Bayat, M. Ten GIS-Based Solutions for Managing and Controlling COVID-19 Pandemic Outbreak. SN Computer Science 2022, 3, 269, pp. 1-15. [Google Scholar] [CrossRef]
- 57. Sepehrvand, N.; Alemayehu, W.; Kaul, P.; Pelletier, R.; Bello, A.K.; Welsh, R.C.; Armstrong, P.W.; Ezekowitz, J.A. Ambulance use, distance and outcomes in patients with suspected cardiovascular disease: a registry-based geographic information system study. European Heart Journal – Acute Cardiovascular Care 2020, 9, 1 supplement, pp. 45-58.
- Sicherl-Kafol, B.; Denac, O. The importance of interdisciplinary planning of the learning process. Procedia Social and Behavioral Sciences 2010, 2, pp. 4695-4701. [Google Scholar] [CrossRef]
- Steinert, S. Interdisciplinary Value Theory, Palgrave Macmillan: Cham, 2023.
- Tirivangani, T.; Alpo, B.; Kibuule, D.; Gaeseb, J.; Adenuga, B.A. Impact of COVID-19 pandemic on pharmaceutical systems and supply chain - a phenomenological study. Exploratory Research in Clinical and Social Pharmacy 2021, 2, 100037, pp. 1-5. [Google Scholar] [CrossRef]
- Tyris, J.; Dwyer, G.; Parikh, K.; Gourishankar, A.; Patel, S. Geocoding and Geospatial Analysis: Transforming Addresses to Understand Communities and Health. Hospital Pediatrics 2024, 14, 6, pp. 292-297. [Google Scholar] [CrossRef] [PubMed]
- Vaishya, R.; Javaid, M.; Khan, I.H.; Haleem, A. Artificial Intelligence (AI) applications for COVID-19 pandemic. Diabetes & Metabolic Syndrome: Clinical Research & Reviews 2020, 14, pp. 337-339. [Google Scholar] [CrossRef]
- van der Schee, J. Thinking through geography in times of the COVID-19 pandemic. J-READING (Journal of Research and Didactics in Geography) 2020, 2, 9, pp. 21-30. [Google Scholar]
- Wang, F. Why Public Health Needs GIS. Annals of GIS 2020, 26, 1, pp. 1-12. [Google Scholar]
- Wieczorek, W.F.; Hanson, C.E. New modeling methods: geographic information systems and spatial analysis. Alcohol Health and Research World 1997, 21, pp. 331-339. [Google Scholar]
- Wittman, J.T.; Alexander, D.S.; Bing, M.; Montierth, R.; Xie, H.; Benoit, S.R.; McKeever Bullard, K. Identifying Priority Geographic Locations for Diabetes Self-Management Education and Support Services in the Appalachian Region. Preventing Chronic Disease 2024, 21, pp. 1-4. [Google Scholar] [CrossRef] [PubMed]
- Zandbergen, P.A. Python scripting for ArcGIS Pro, Esri Press: Redlands, 2020a.
- Zandbergen, P.A. Advanced Python scripting for ArcGIS Pro, Esri Press: Redlands, 2020b.
- Zhao, A.P.; Li, S.; Cao, Z.; Hu, P.J.-H.; Wang, J.; Xiang, Y.; Xie, D.; Lu, X. AI for science: Predicting infectious diseases. Journal of Safety Science and Resilience 2024, 5, 2, pp. 130-146. [Google Scholar] [CrossRef]
Figure 1.
The male cases of Covid-19 (according to the geocoding process) on 26 September 2020 (cumulative data for the whole period between February 25 and September 26 2020). Elaboration by D. Pavia, C. Pesaresi and C. De Vito on data by UOC Hygiene and Public Health Service – Local Health Unit Rome 1.
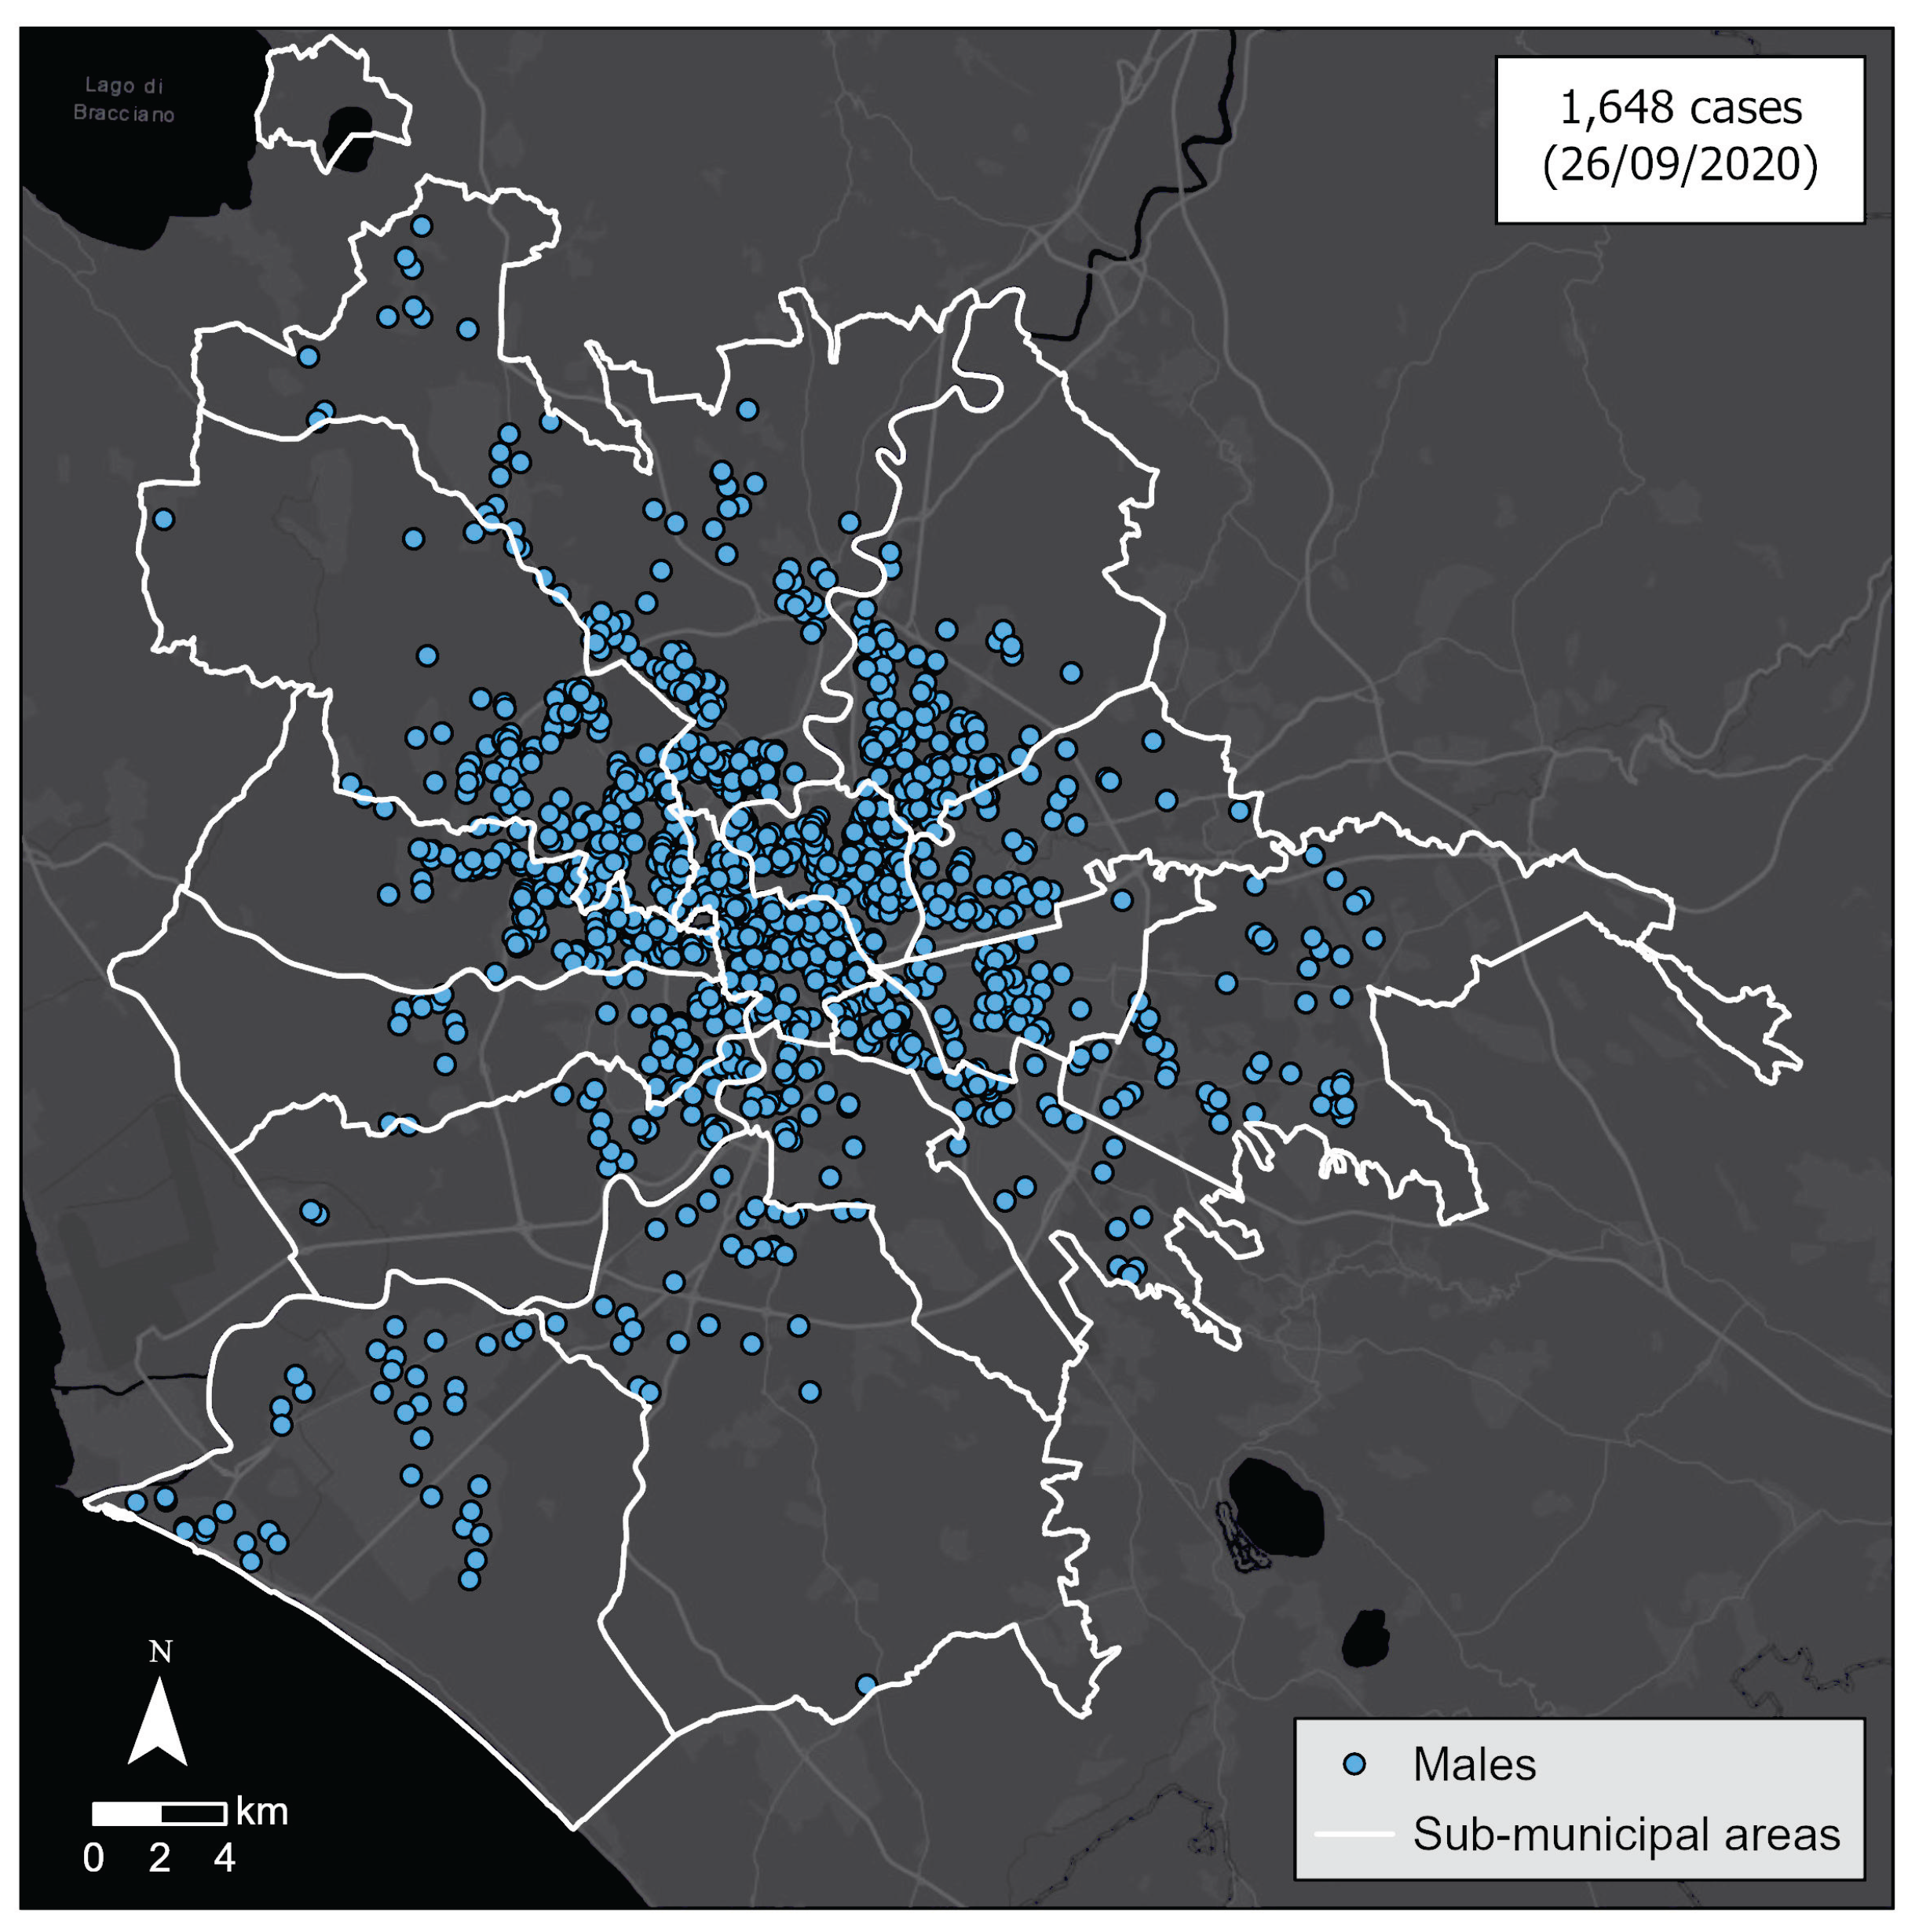
Figure 2.
The female cases of Covid-19 (according to the geocoding process) on 26 September 2020 (cumulative data). Elaboration by D. Pavia, C. Pesaresi and C. De Vito on data by UOC Hygiene and Public Health Service – Local Health Unit Rome 1.
Figure 2.
The female cases of Covid-19 (according to the geocoding process) on 26 September 2020 (cumulative data). Elaboration by D. Pavia, C. Pesaresi and C. De Vito on data by UOC Hygiene and Public Health Service – Local Health Unit Rome 1.
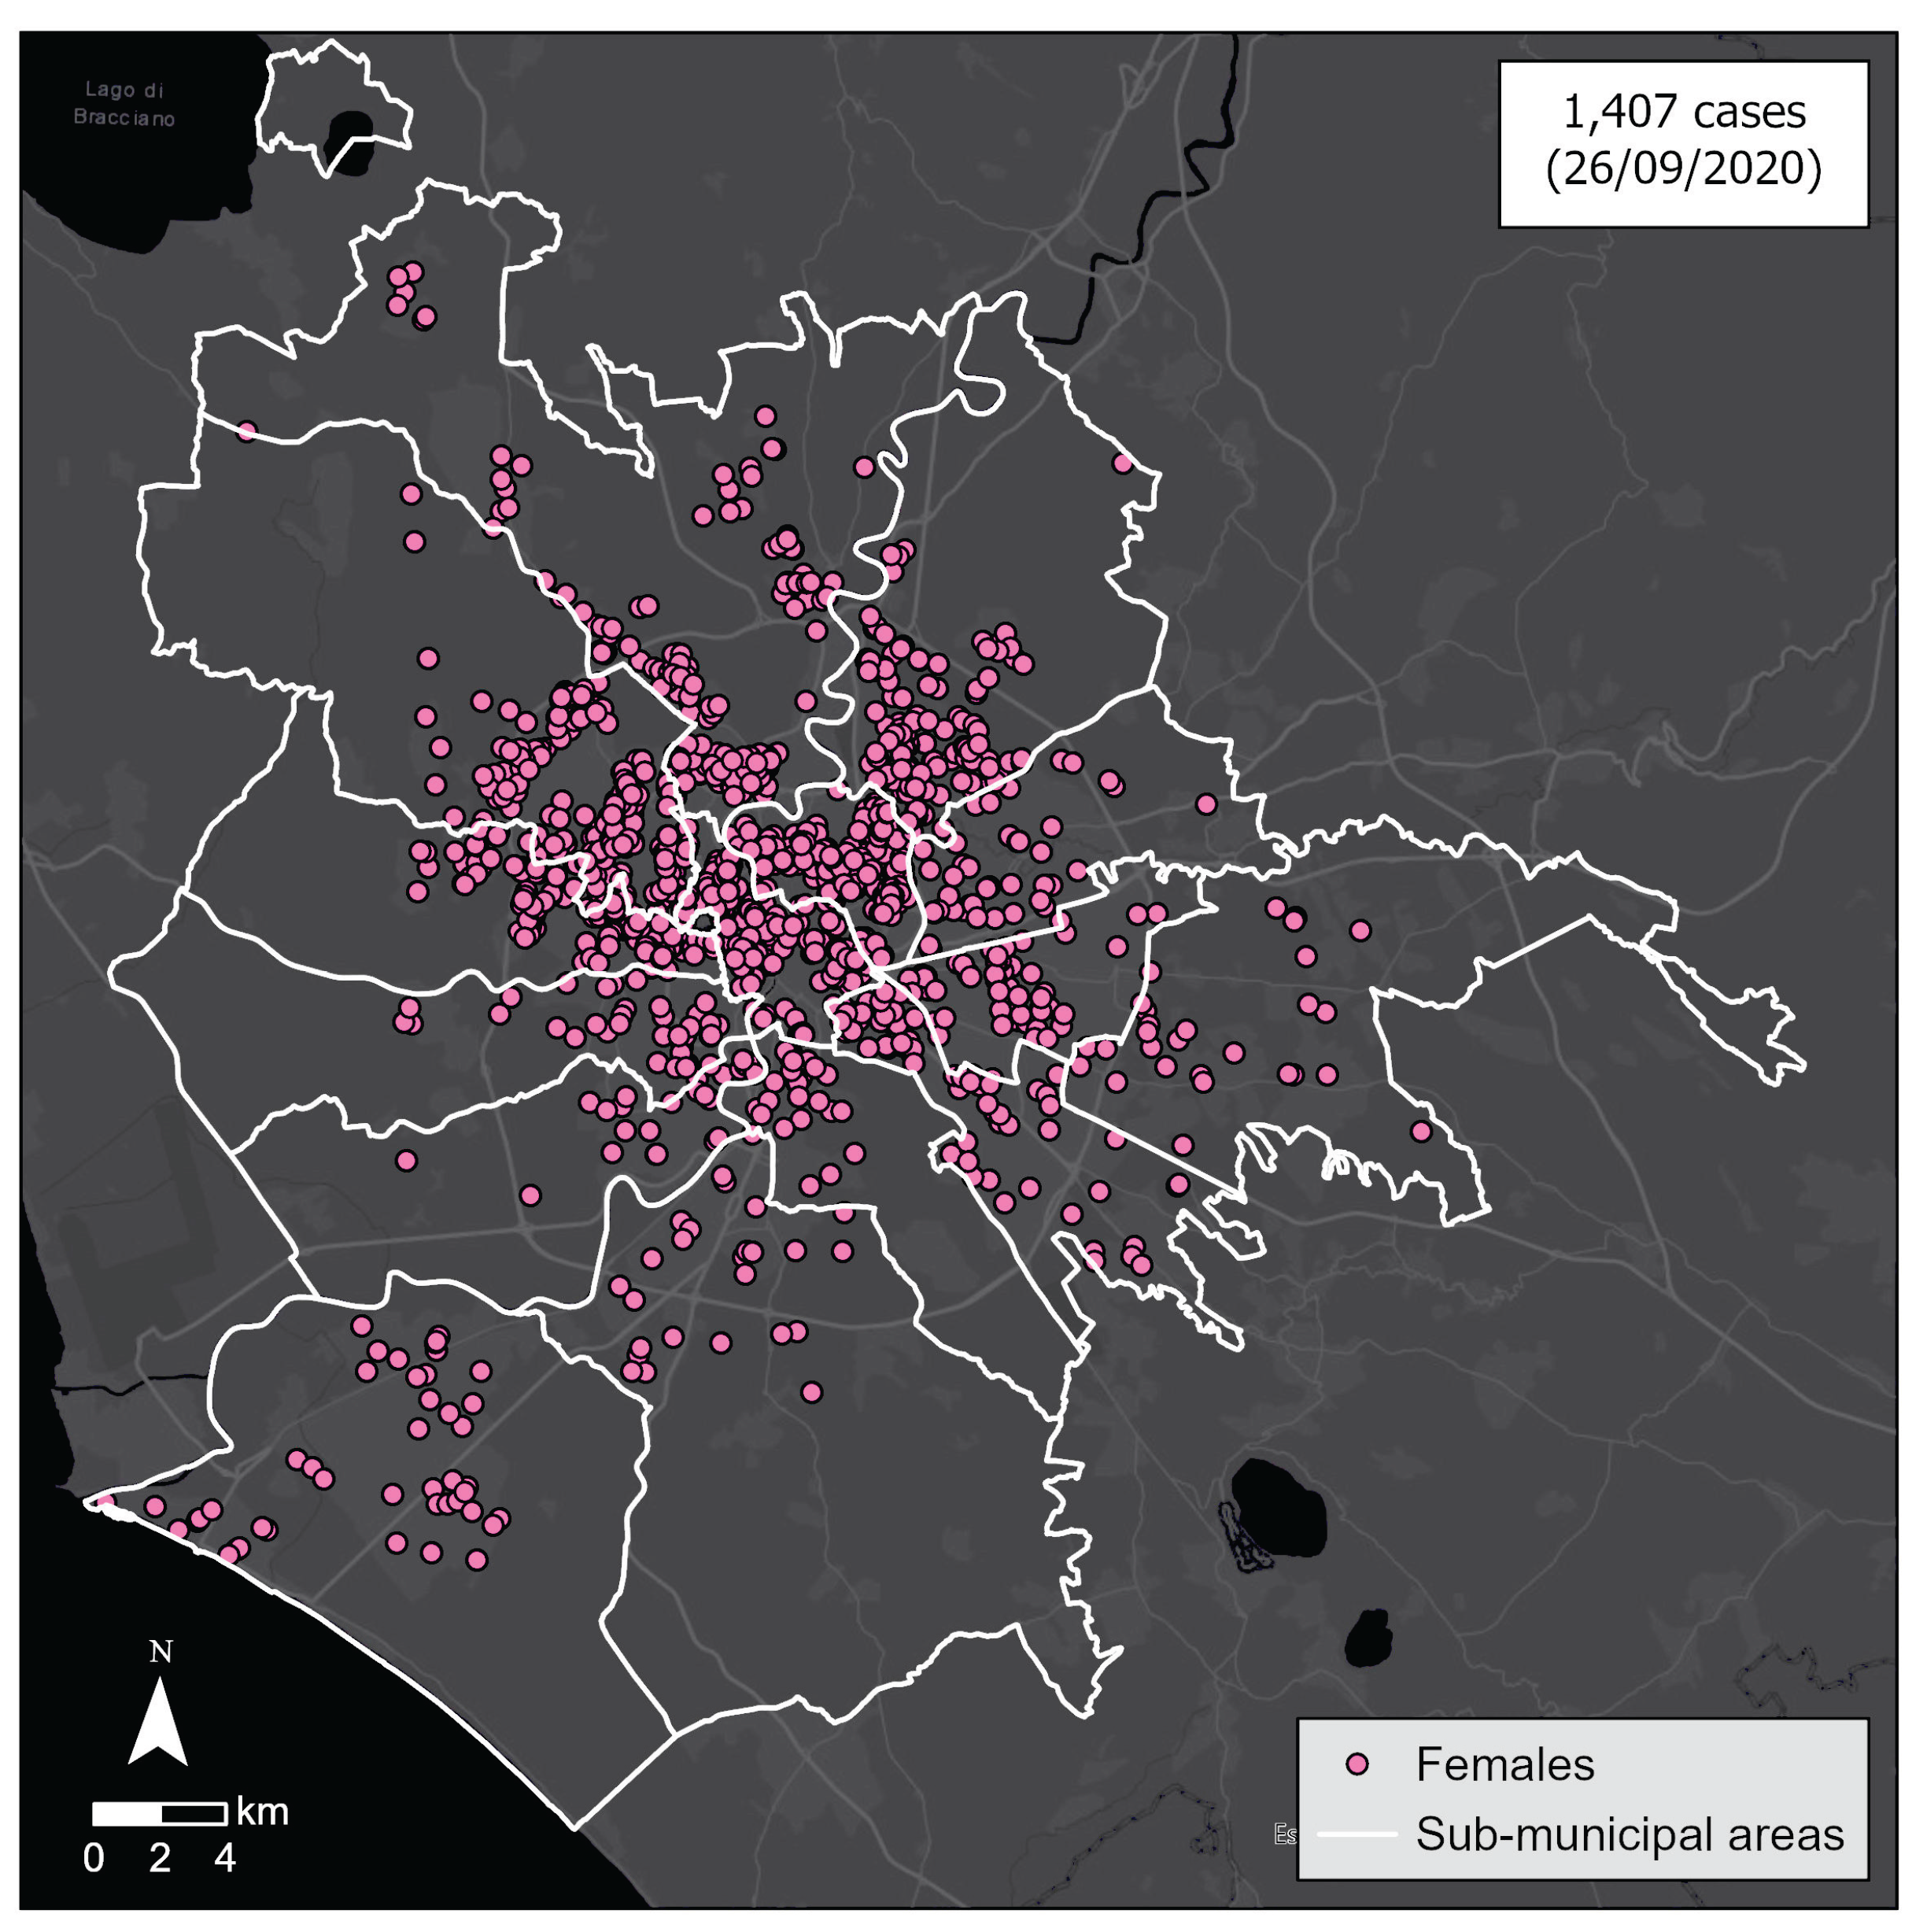
Figure 3.
The male cases of Covid-19 on 26 September 2020 aggregated per SCA (cumulative data). Elaboration by D. Pavia, C. Pesaresi and C. De Vito on data by UOC Hygiene and Public Health Service – Local Health Unit Rome 1.
Figure 3.
The male cases of Covid-19 on 26 September 2020 aggregated per SCA (cumulative data). Elaboration by D. Pavia, C. Pesaresi and C. De Vito on data by UOC Hygiene and Public Health Service – Local Health Unit Rome 1.
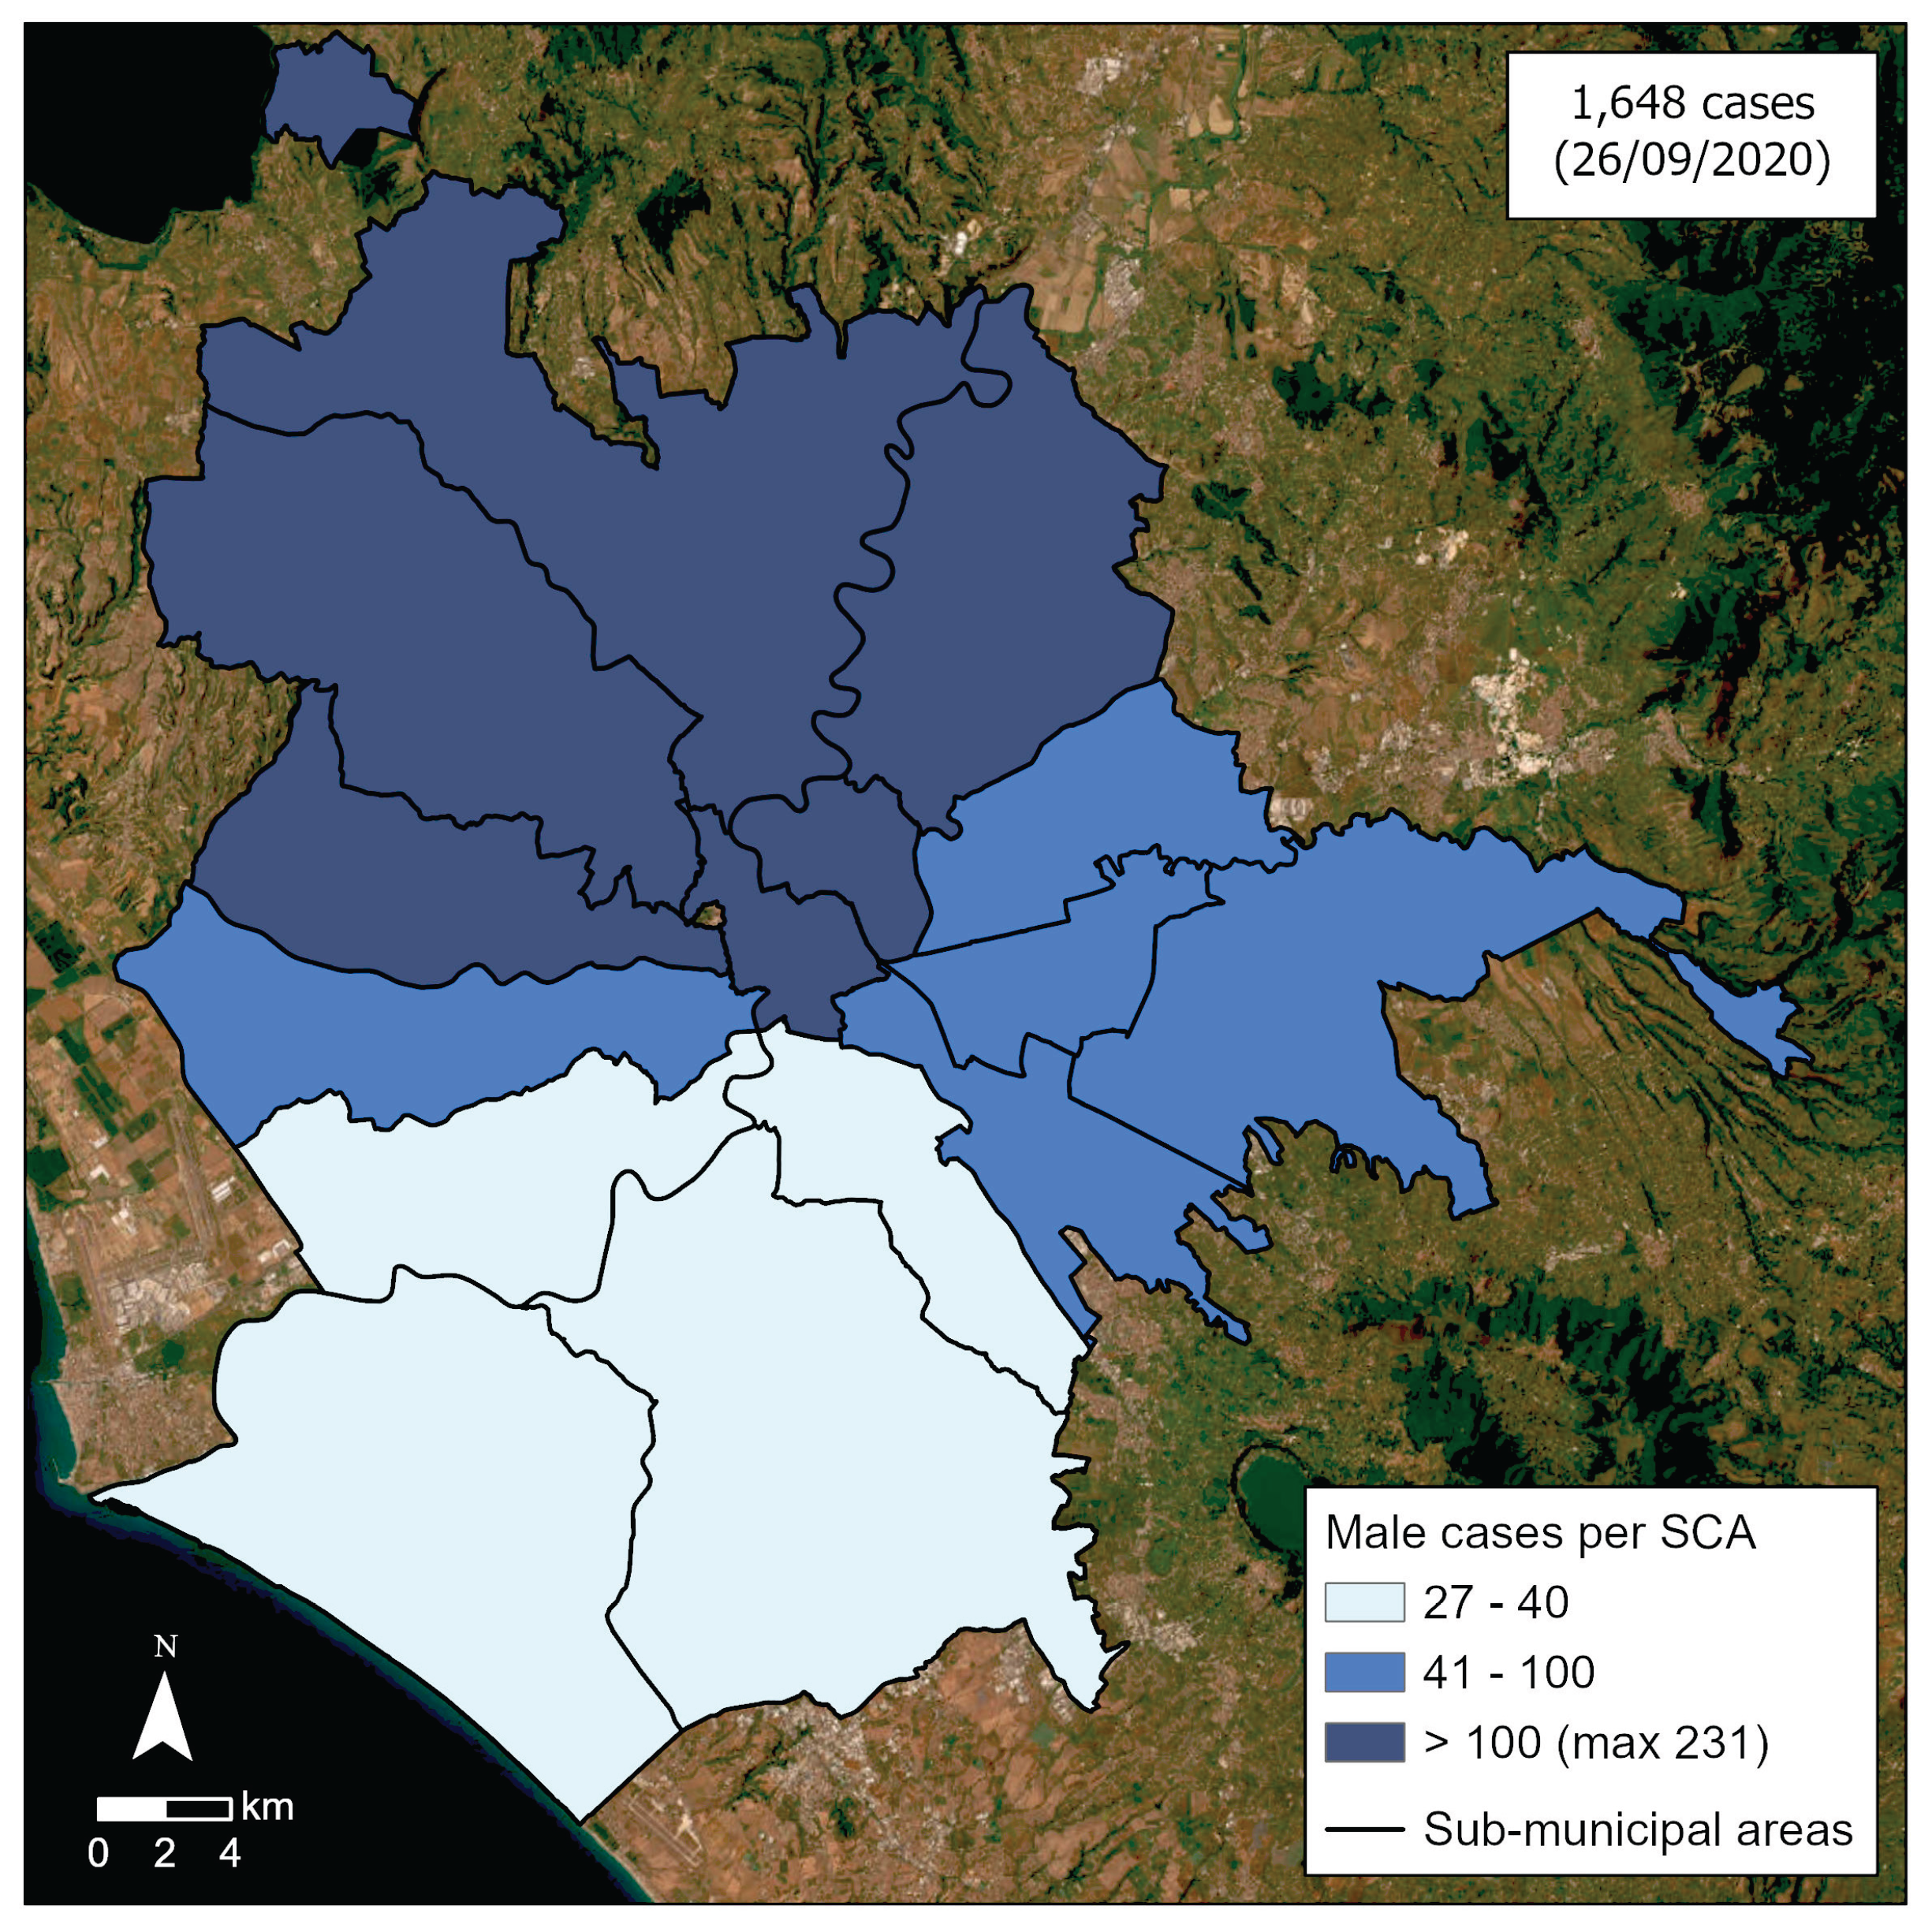
Figure 4.
The female cases of Covid-19 on 26 September 2020 aggregated per SCA (cumulative data). Elaboration by D. Pavia, C. Pesaresi and C. De Vito on data by UOC Hygiene and Public Health Service – Local Health Unit Rome 1.
Figure 4.
The female cases of Covid-19 on 26 September 2020 aggregated per SCA (cumulative data). Elaboration by D. Pavia, C. Pesaresi and C. De Vito on data by UOC Hygiene and Public Health Service – Local Health Unit Rome 1.
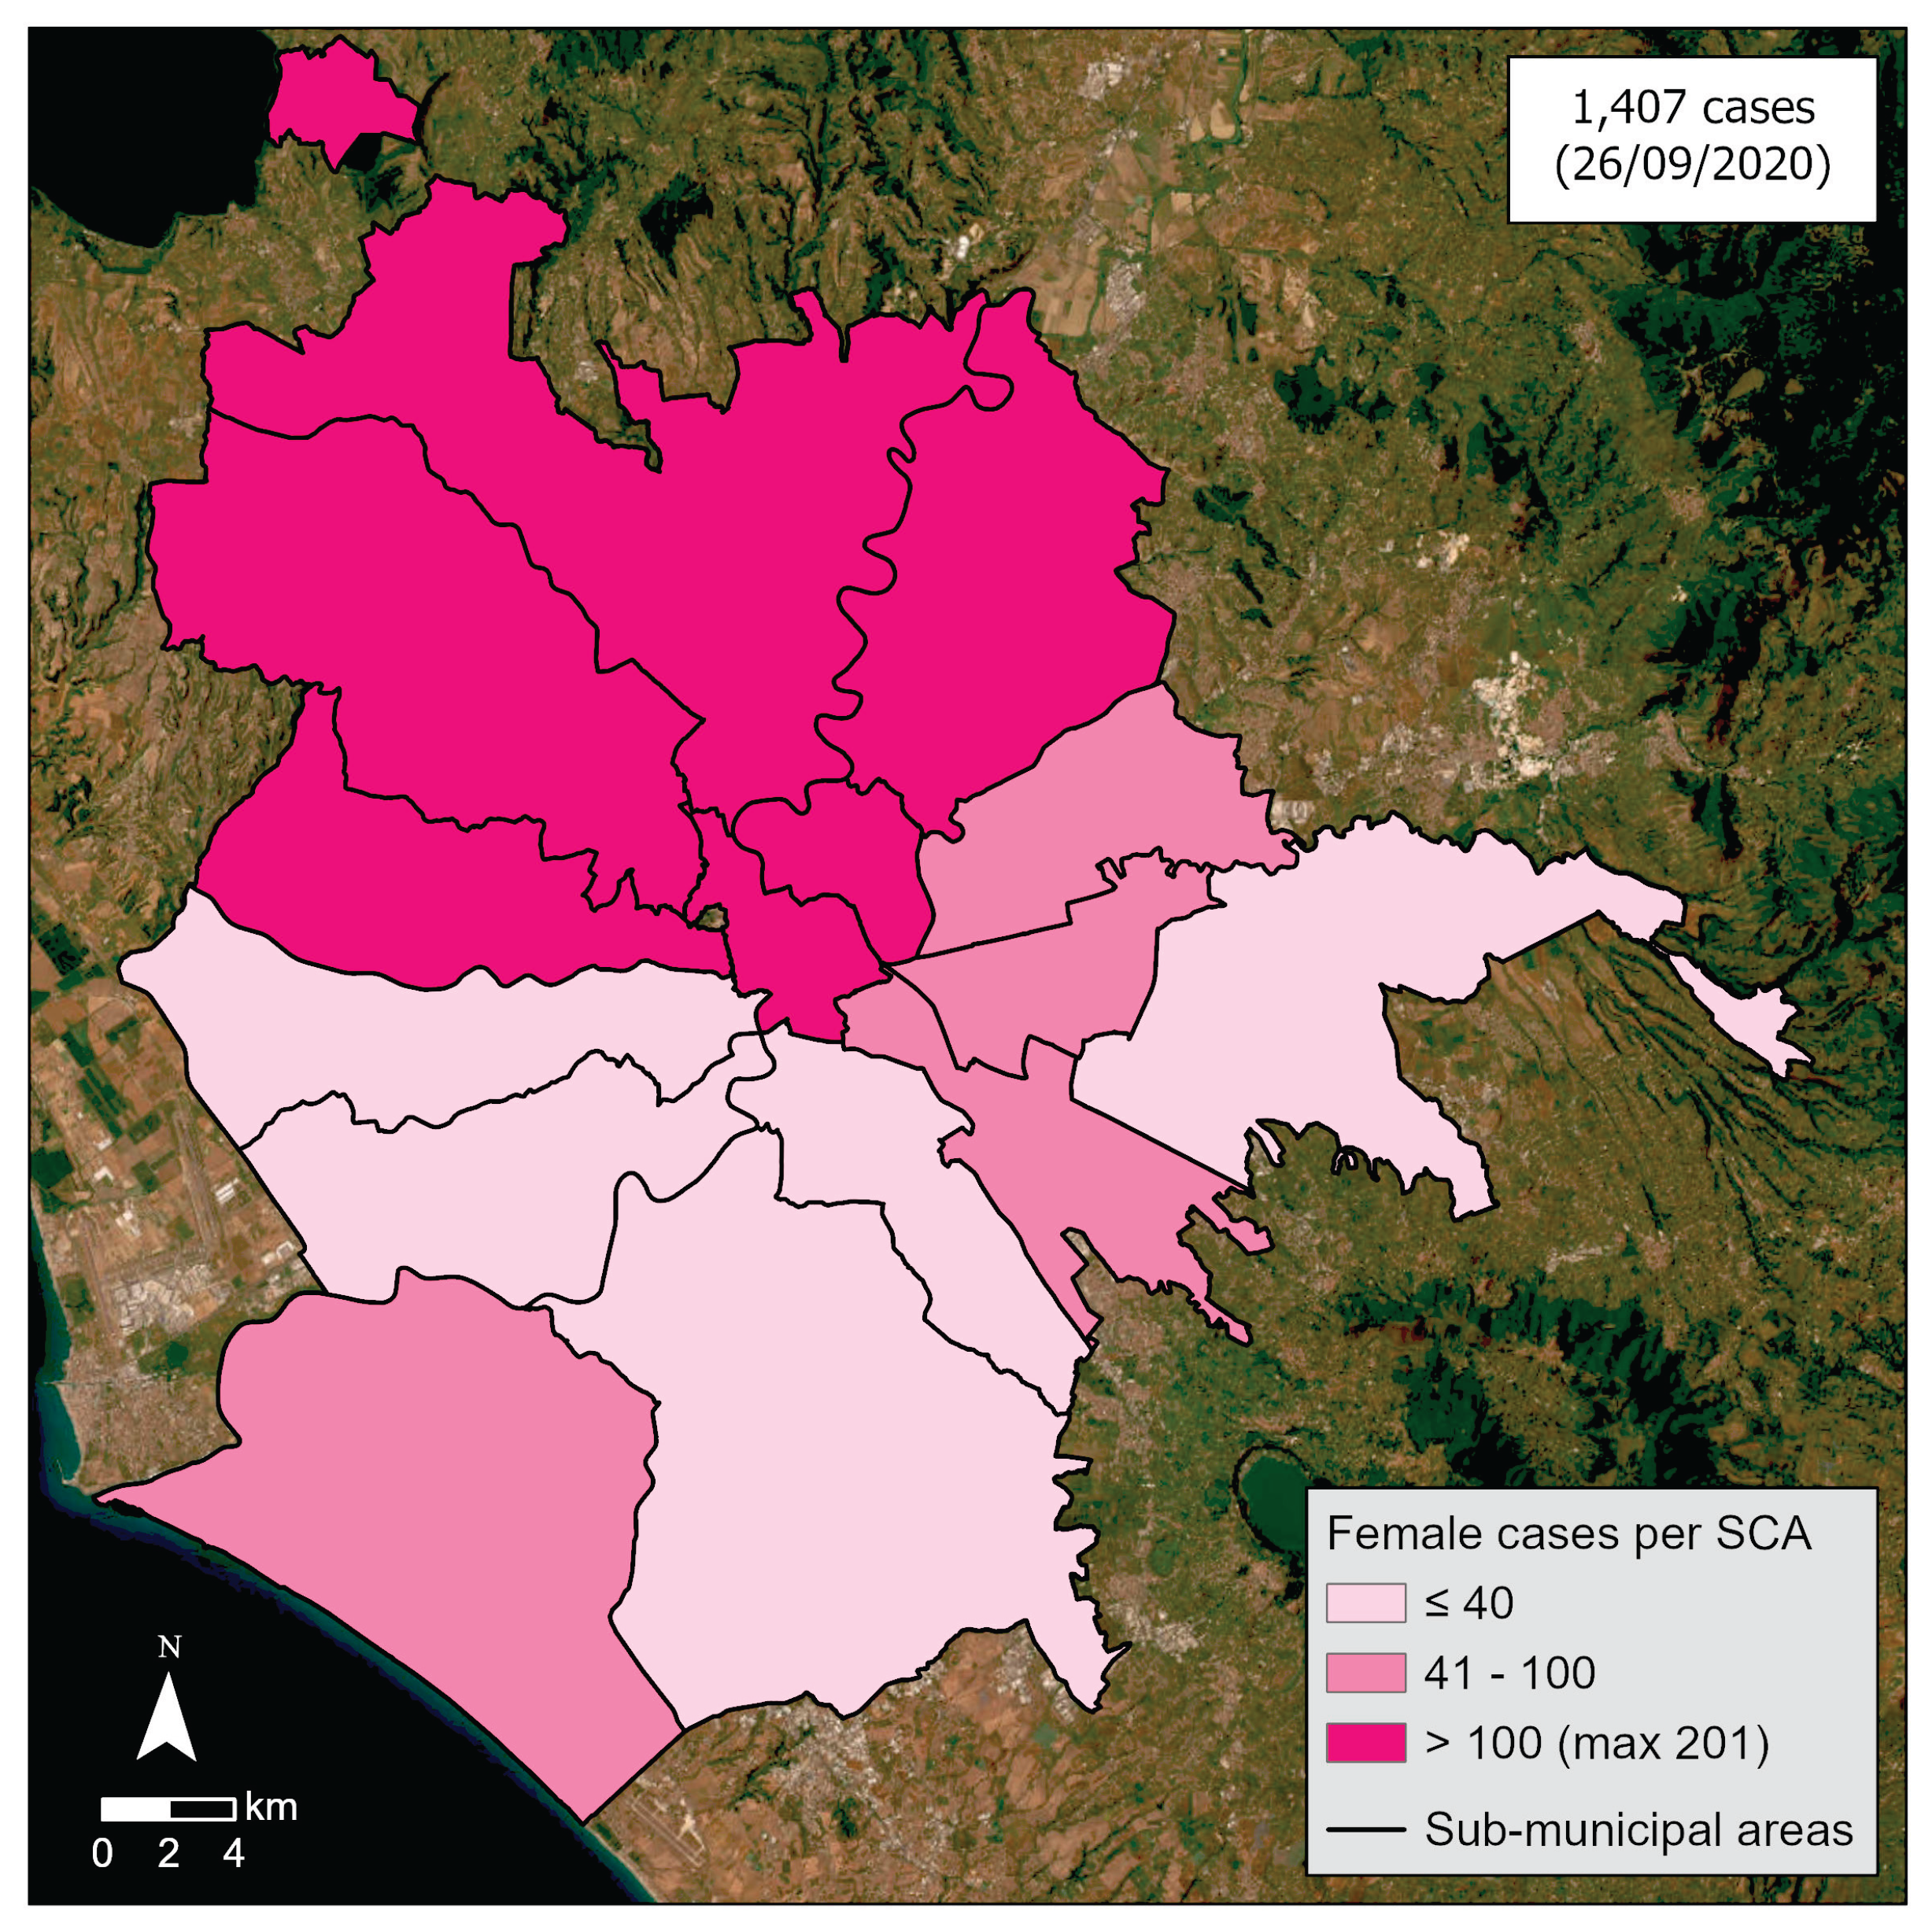
Figure 5.
The cases of Covid-19 (according to the geocoding process) on 26 September 2020 in people aged 65 or more (cumulative data). Elaboration by D. Pavia, C. Pesaresi and C. De Vito on data by UOC Hygiene and Public Health Service – Local Health Unit Rome 1.
Figure 5.
The cases of Covid-19 (according to the geocoding process) on 26 September 2020 in people aged 65 or more (cumulative data). Elaboration by D. Pavia, C. Pesaresi and C. De Vito on data by UOC Hygiene and Public Health Service – Local Health Unit Rome 1.
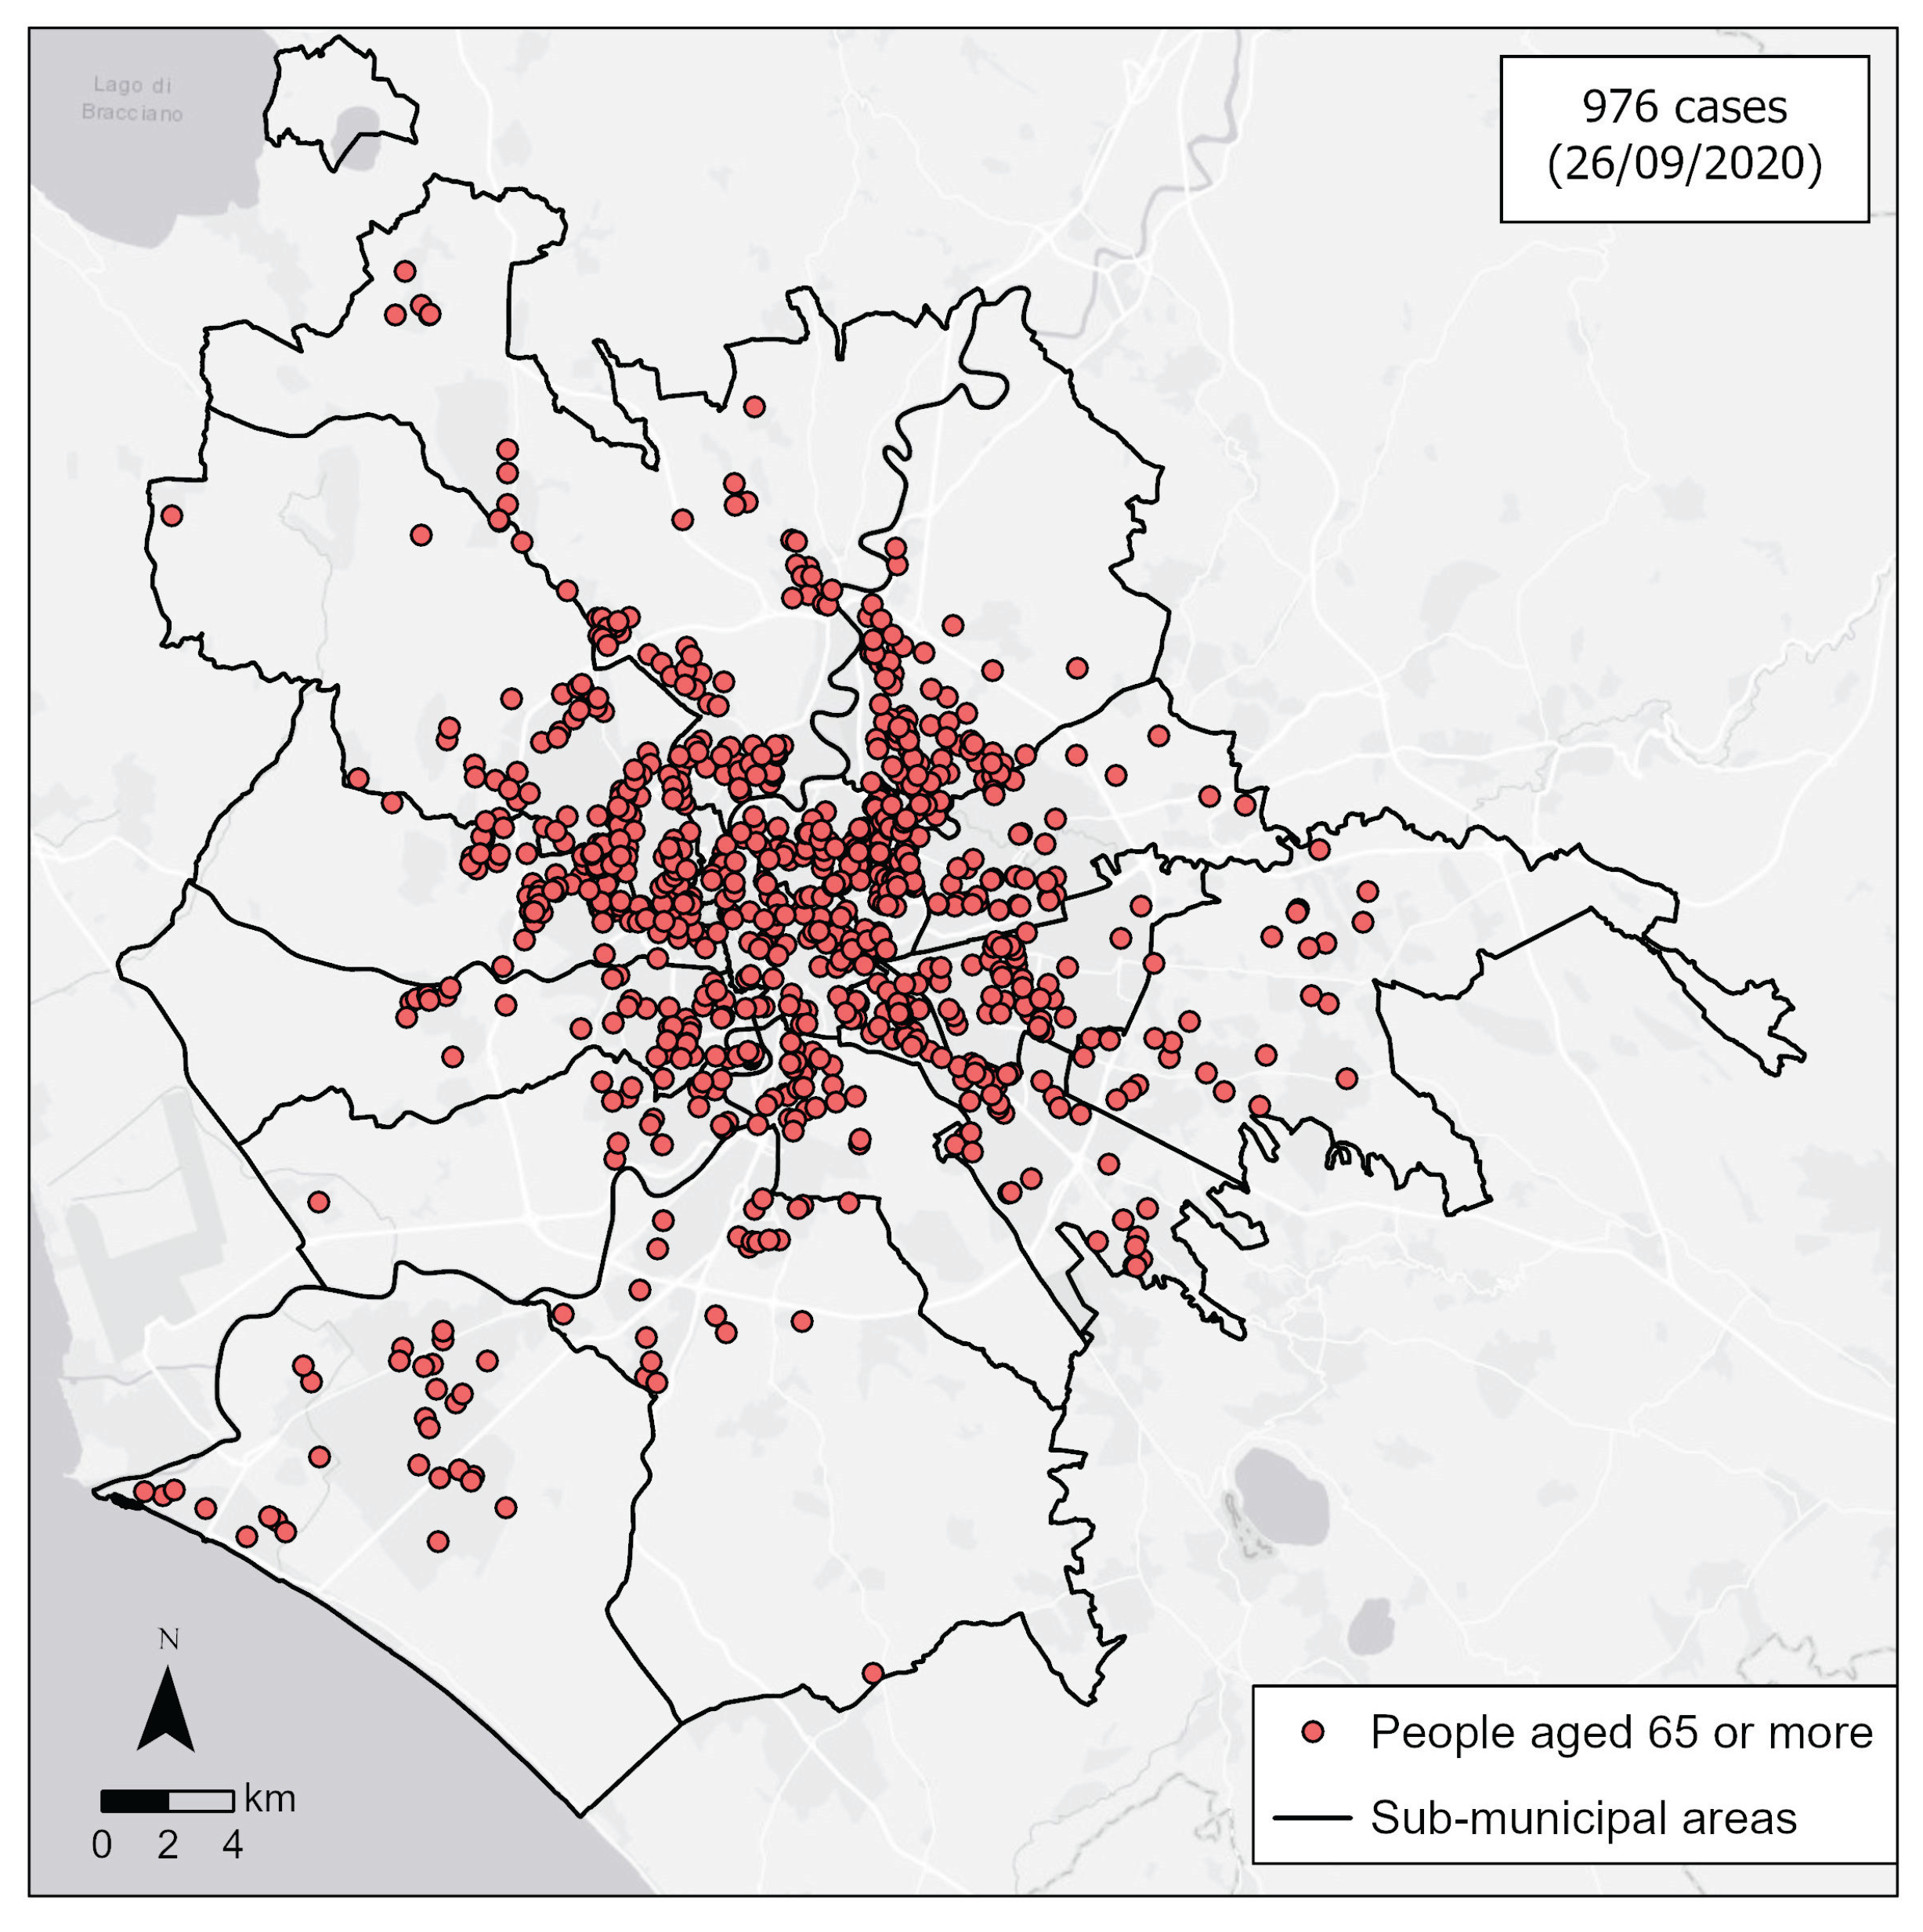
Figure 6.
The cases of Covid-19 (according to the geocoding process) on 26 September 2020 in people aged 65-74, 75-84, 85 or more (cumulative data). Elaboration by D. Pavia, C. Pesaresi and C. De Vito on data by UOC Hygiene and Public Health Service – Local Health Unit Rome 1.
Figure 6.
The cases of Covid-19 (according to the geocoding process) on 26 September 2020 in people aged 65-74, 75-84, 85 or more (cumulative data). Elaboration by D. Pavia, C. Pesaresi and C. De Vito on data by UOC Hygiene and Public Health Service – Local Health Unit Rome 1.
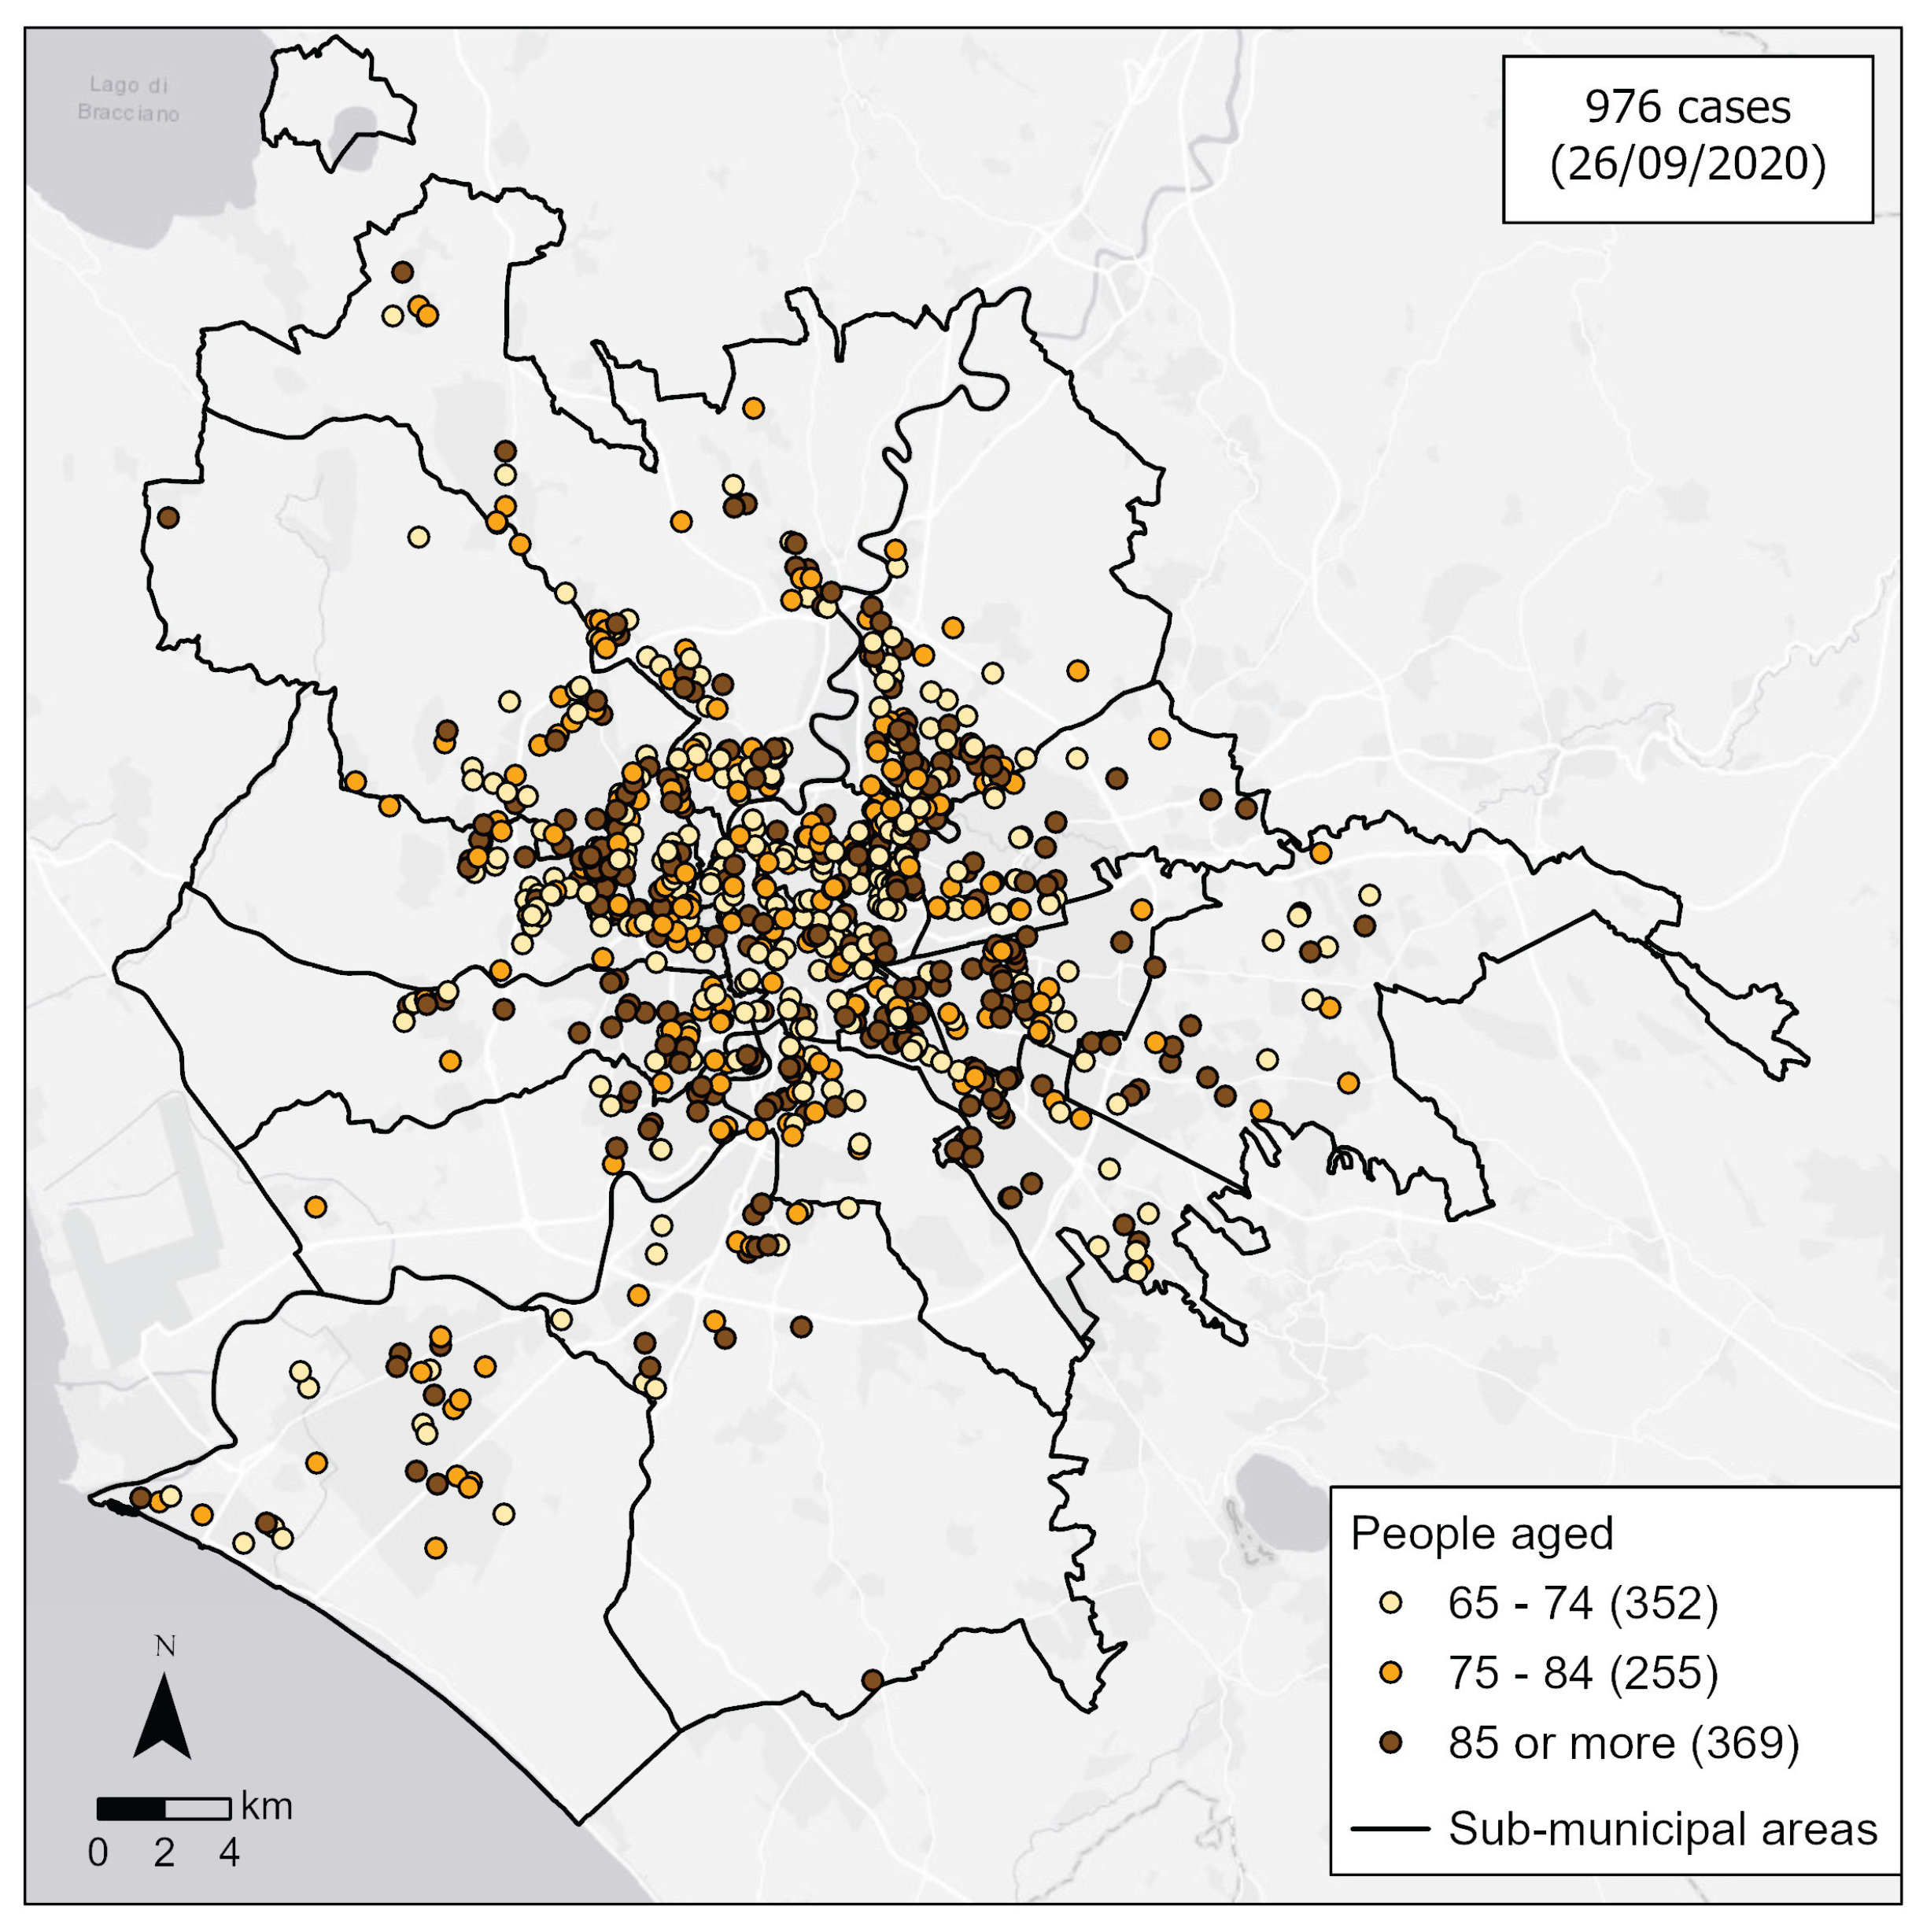
Figure 7.
The hospitals geolocated (through the geocoding process) into the Rome municipality. An exemplificative pop-up provides some general information on the Policlinico Umberto I hospital. Authors’ elaboration on data by Italian Ministry of Health.
Figure 7.
The hospitals geolocated (through the geocoding process) into the Rome municipality. An exemplificative pop-up provides some general information on the Policlinico Umberto I hospital. Authors’ elaboration on data by Italian Ministry of Health.
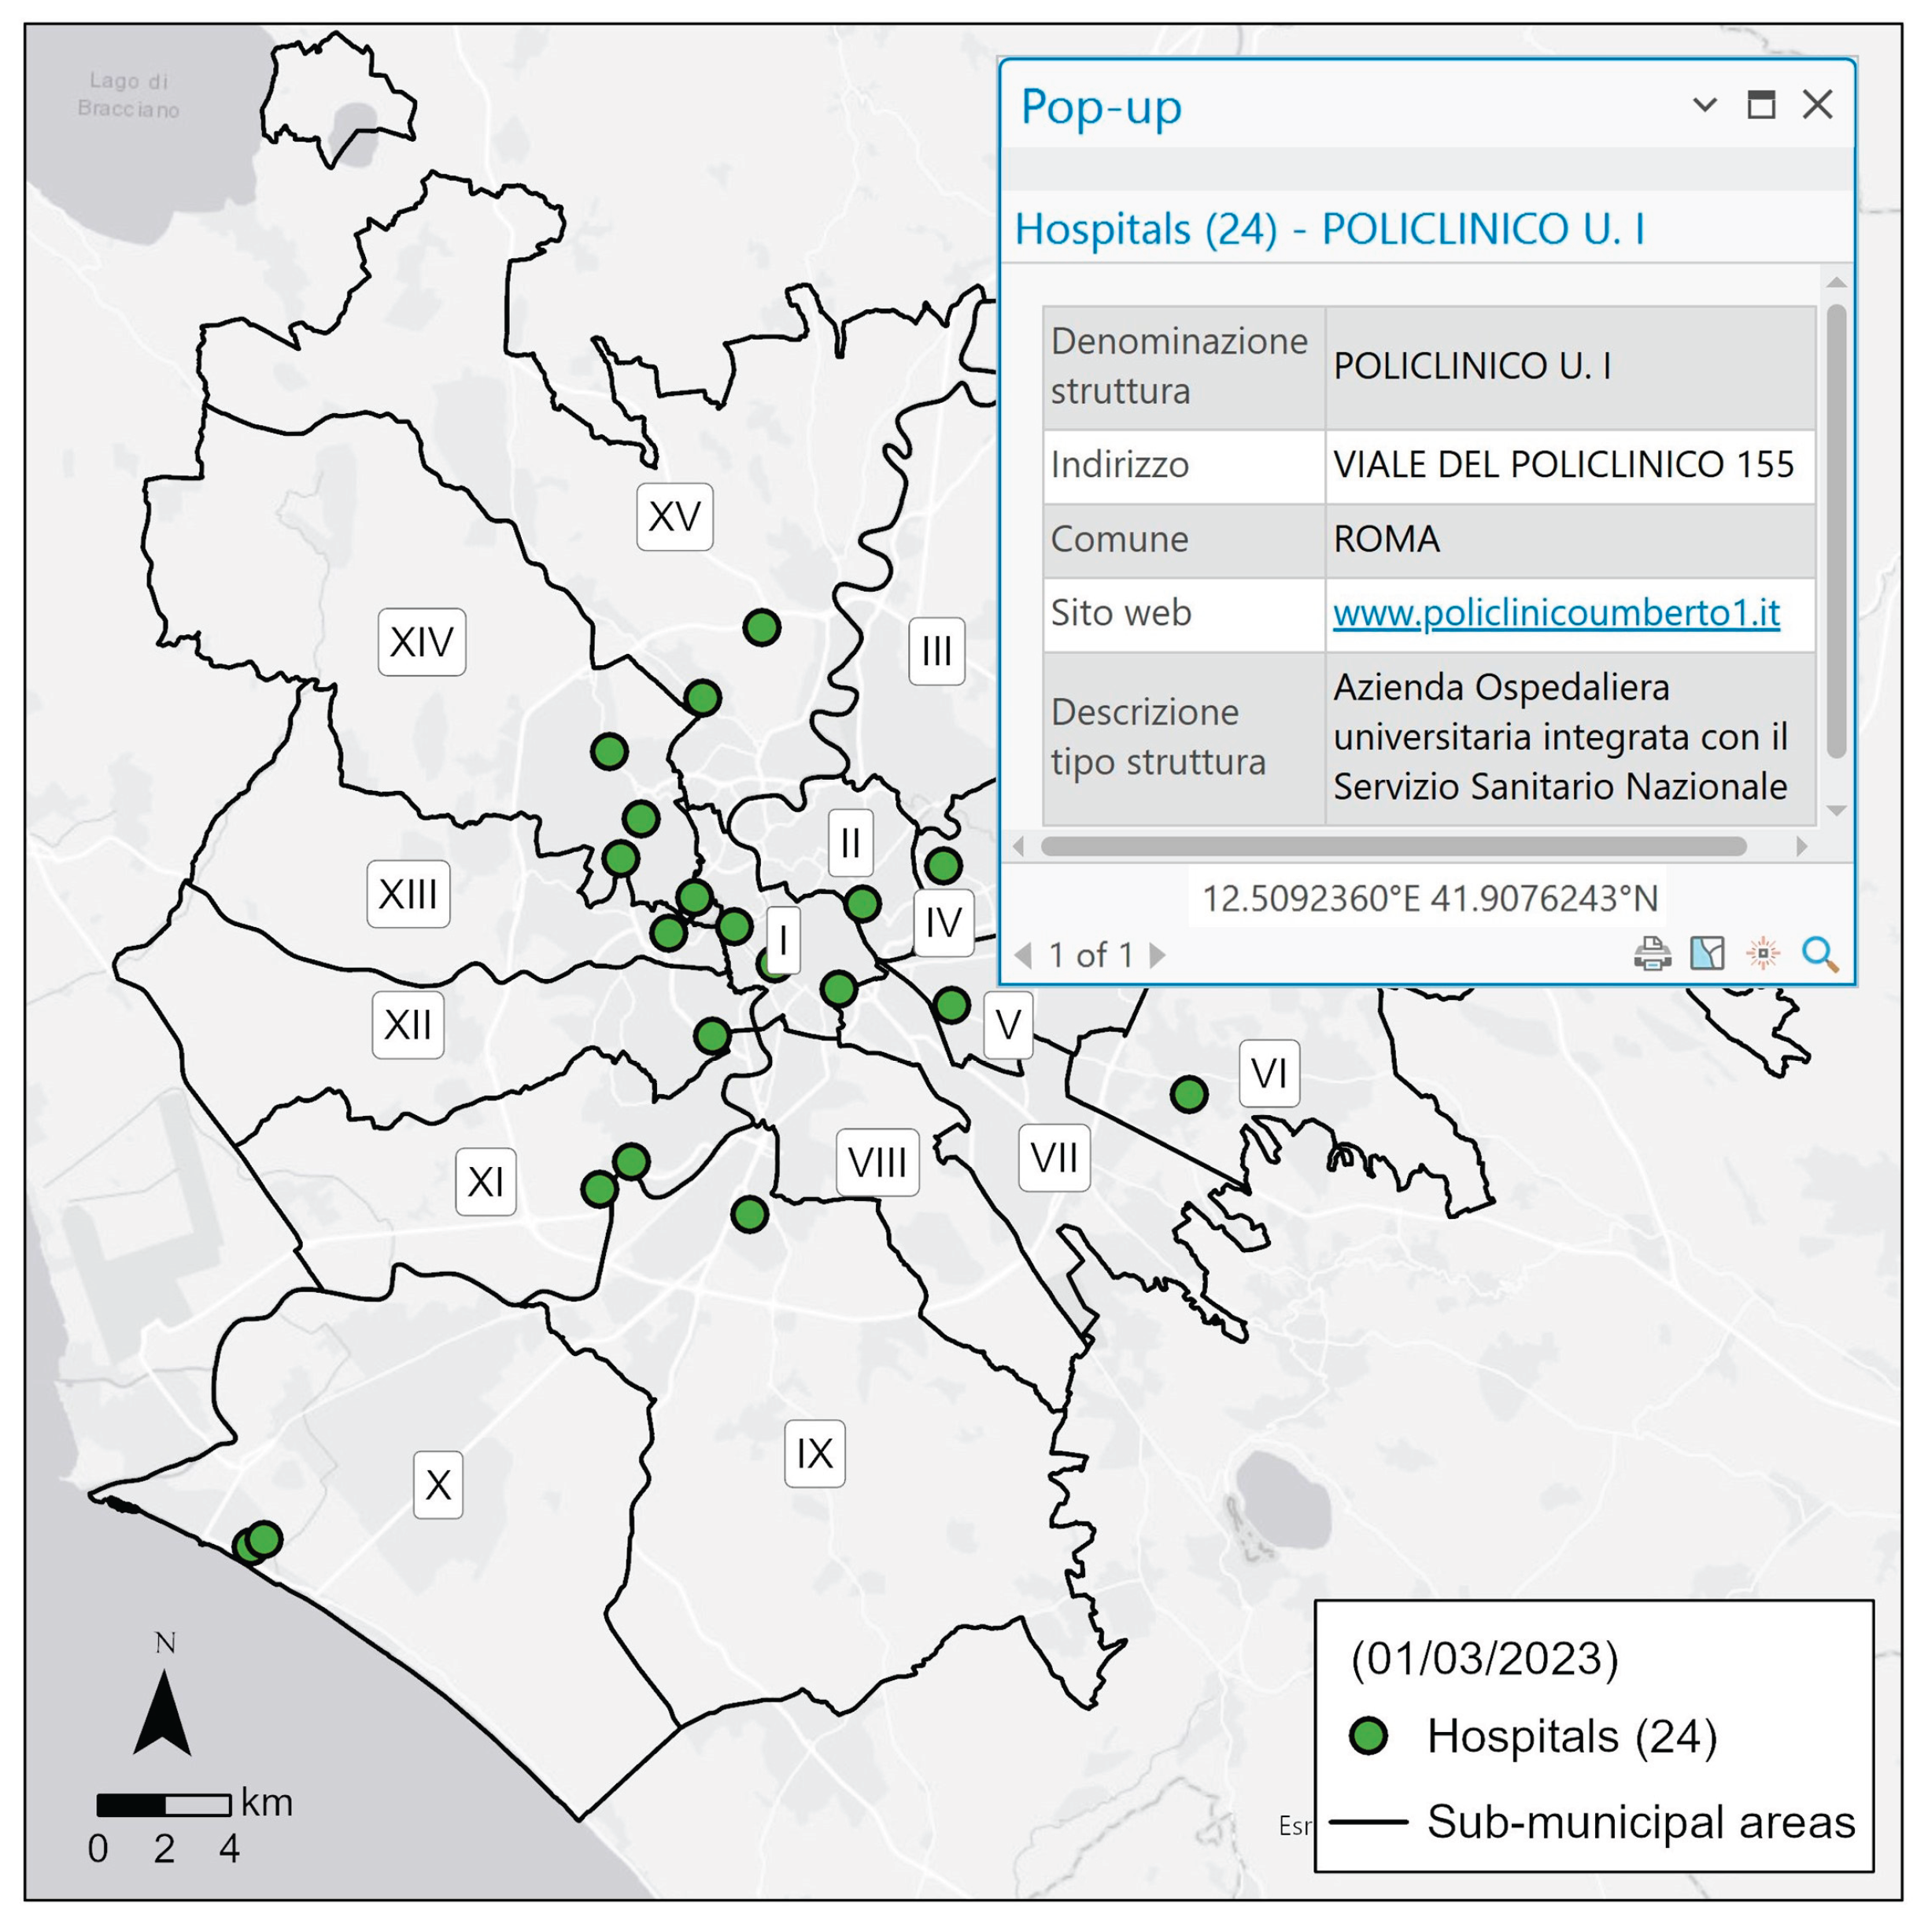
Figure 8.
The nursing homes geolocated (through the geocoding process) in the Rome municipality. A table frame shows the number of nursing homes per sub-municipal areas. Authors’ elaboration on data by Italian Ministry of Health.
Figure 8.
The nursing homes geolocated (through the geocoding process) in the Rome municipality. A table frame shows the number of nursing homes per sub-municipal areas. Authors’ elaboration on data by Italian Ministry of Health.
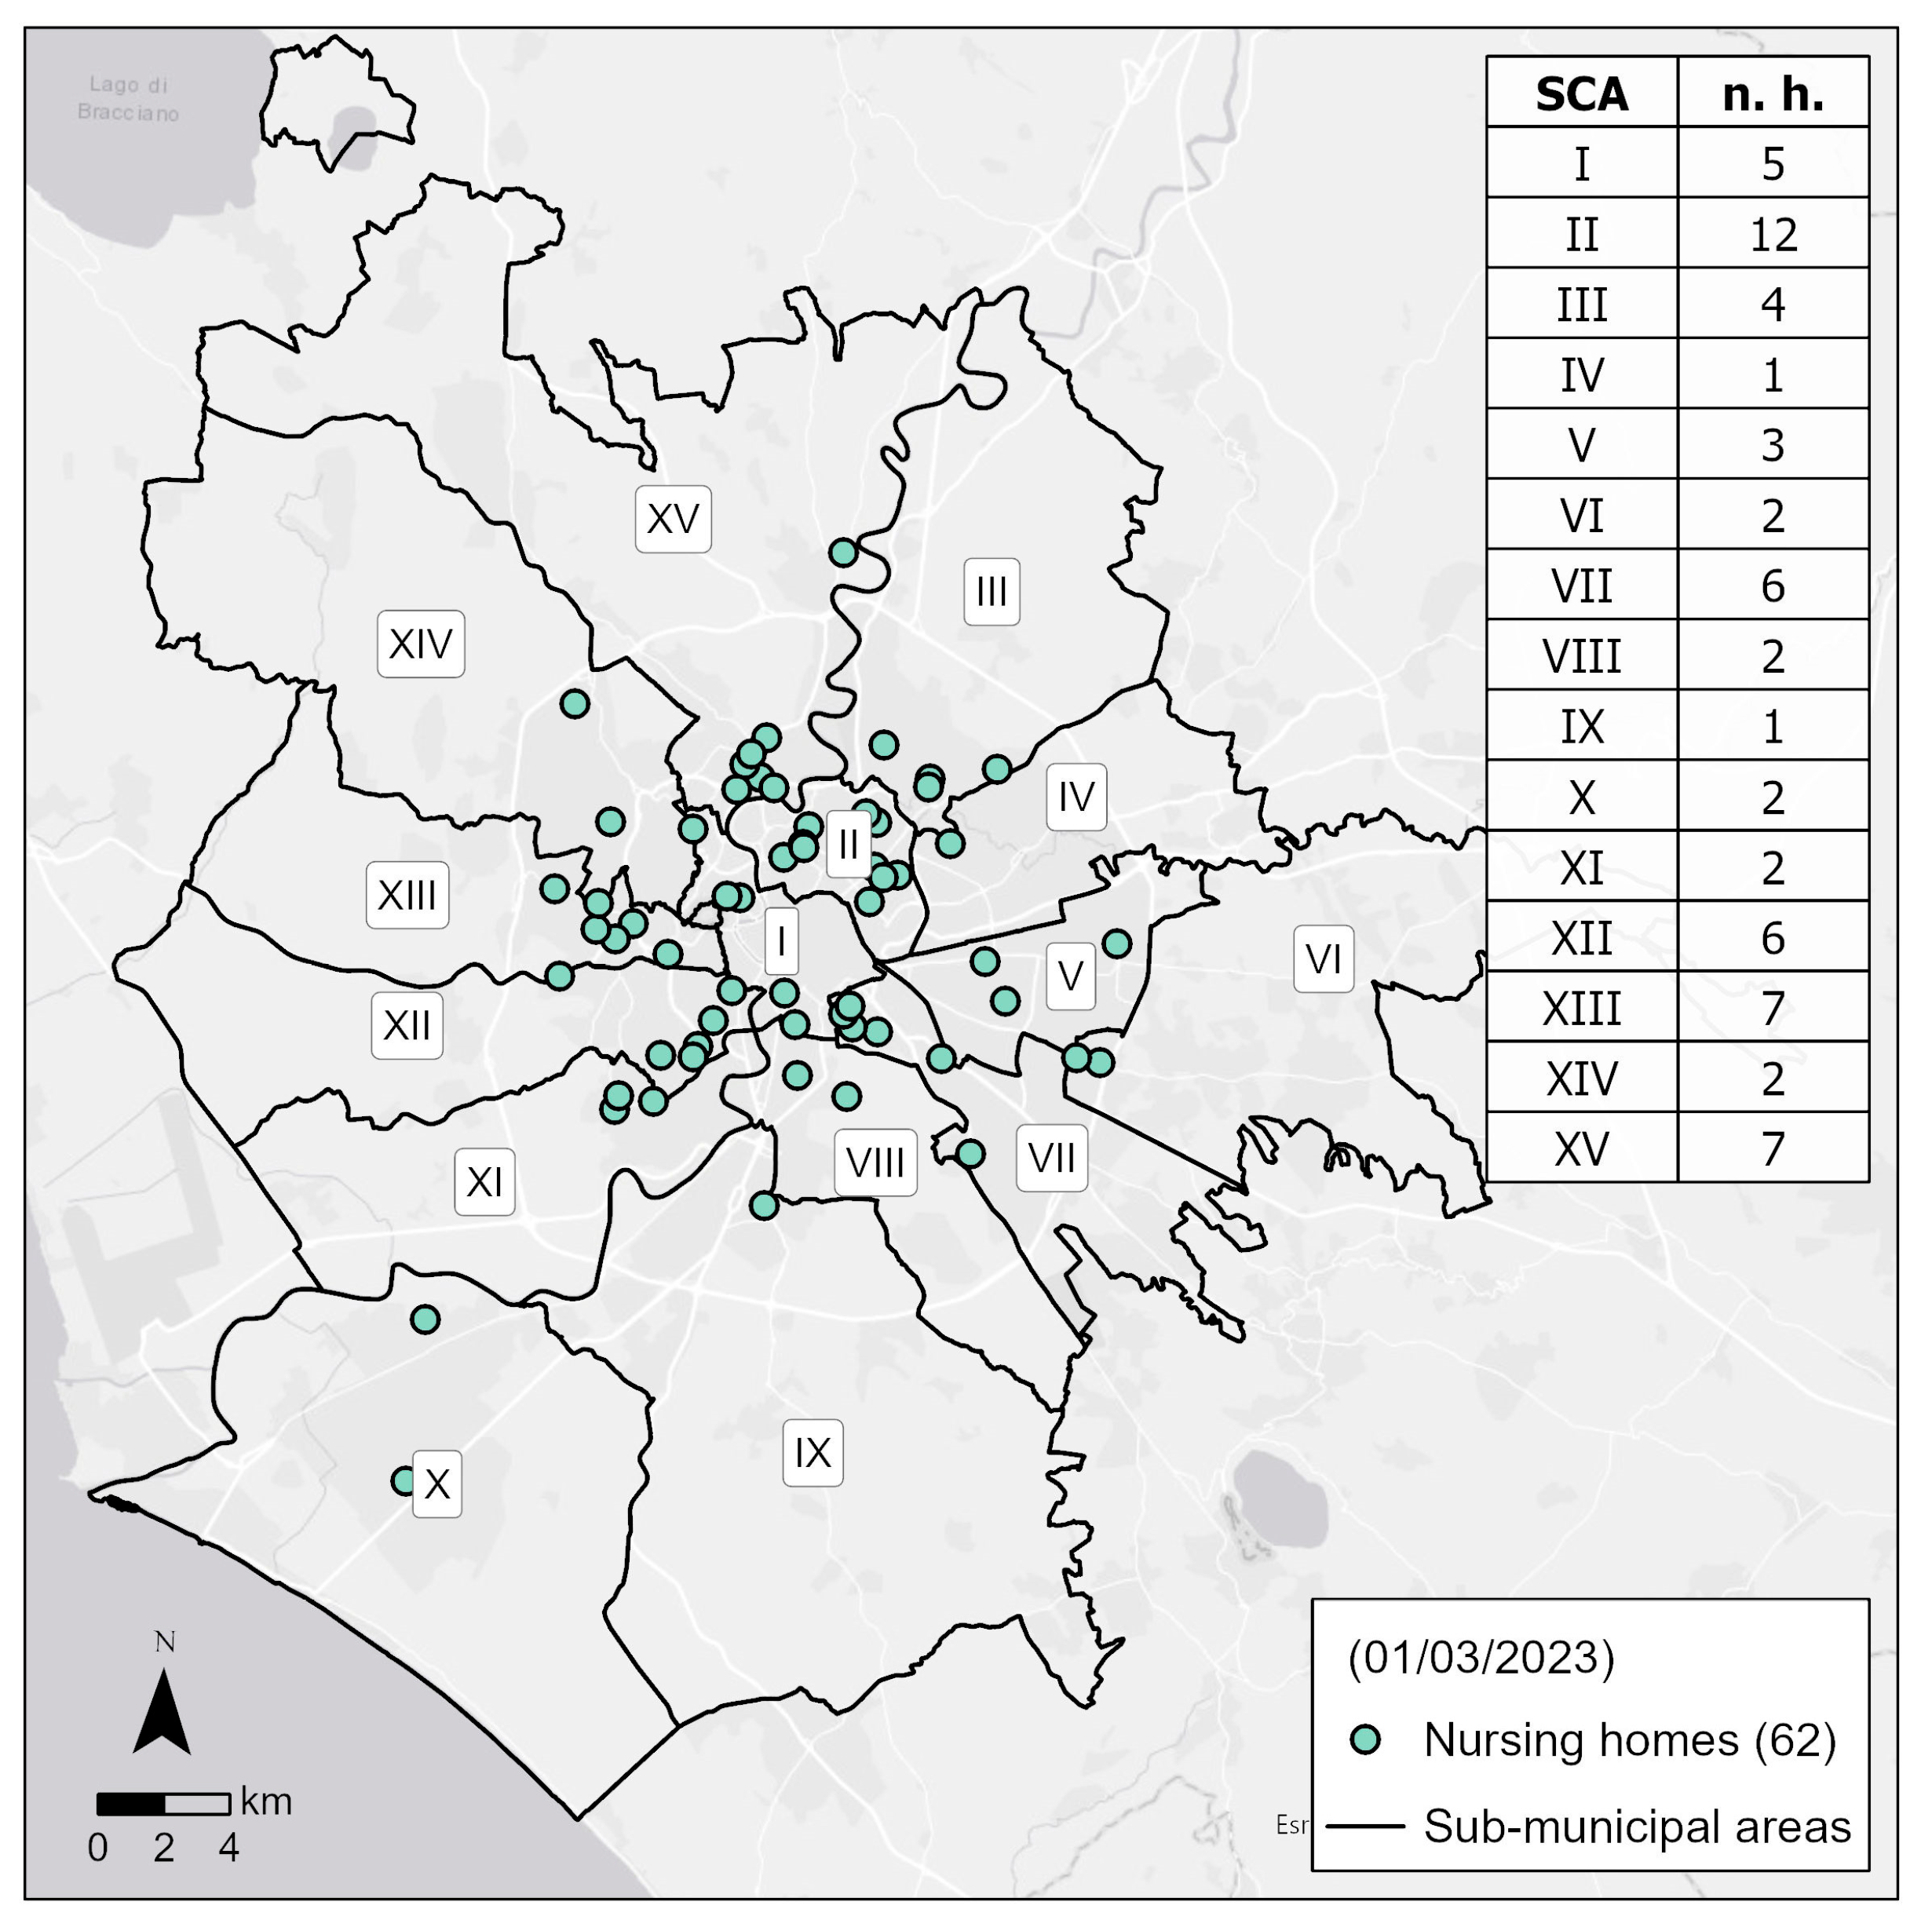
Figure 9.
The pharmacies geolocated (through the geocoding process) in the Rome municipality. An inset map, with red framework, provides a zoom on an area (in the West side) where there are many buildings (and residents) and few pharmacies; another inset map, with blue framework, on the contrary provides a zoom on an area (in the centre of Rome) where there are many buildings (and residents) and many pharmacies. Authors’ elaboration on data by Italian Ministry of Health.
Disclaimer/Publisher’s Note: The statements, opinions and data contained in all publications are solely those of the individual author(s) and contributor(s) and not of MDPI and/or the editor(s). MDPI and/or the editor(s) disclaim responsibility for any injury to people or property resulting from any ideas, methods, instructions or products referred to in the content. |
© 2025 by the authors. Licensee MDPI, Basel, Switzerland. This article is an open access article distributed under the terms and conditions of the Creative Commons Attribution (CC BY) license (http://creativecommons.org/licenses/by/4.0/).
Copyright: This open access article is published under a Creative Commons CC BY 4.0 license, which permit the free download, distribution, and reuse, provided that the author and preprint are cited in any reuse.


