
Submitted:
16 September 2025
Posted:
18 September 2025
You are already at the latest version
Abstract
In this study, NiO nanoparticle–reinforced PMMA nanocomposites were fabricated by melt blending, and the influence of extrusion mixing time on structural and thermal properties was examined. Mixing durations of 6 and 12 minutes were applied, and the materials were characterized by X-ray diffraction (XRD) and scanning electron mi-croscopy (SEM). These analyses confirmed the presence of NiO within the PMMA ma-trix and indicated that prolonged mixing promoted particle agglomeration. Thermal behavior was assessed by thermogravimetric analysis (TGA) at heating rates of 5, 10, 15, and 20 °C·min⁻¹, and activation energies of decomposition were calculated using the Kissinger, Tachor, and Augis–Bennett methods. The results showed that extended mixing reduced composite homogeneity and adversely affected thermal stability. In-corporation of NiO nanoparticles decreased both the onset decomposition temperature and the activation energy compared to pure PMMA, facilitating earlier degradation. At 620 K, pure PMMA exhibited an 8% mass loss, whereas the 12-minute blend displayed a 12% loss. These findings highlight the importance of nanoparticle dispersion and processing parameters in governing the degradation behavior of PMMA/NiO nano-composites.

Keywords:
poly (methyl methacrylate)
; thermal analyses
; NiO
; activation energy
; mixing time
; nanoparticle dispersion
; thermal stability
; polymer nanocomposites
1. Introduction
Polymeric nanocomposites are an emerging class of multifunctional materials that combine the favorable mechanical flexibility and ease of processing of organic polymers with the superior physical, chemical, and functional properties of inorganic nanofillers [1]. The incorporation of nanoscale reinforcements into polymer matrices has opened new pathways for designing materials with tailored properties for specific applications, including electronics, photonics, coatings, packaging, sensors, and biomedical devices [2,3]. Among the various types of nanofillers, metal oxide nanoparticles have drawn considerable attention due to their unique electrical, optical, thermal, and catalytic characteristics.
Poly(methyl methacrylate) (PMMA) is a transparent thermoplastic polymer widely used in industrial and scientific applications owing to its excellent optical clarity, dimensional stability, rigidity, weather resistance, and ease of processing [4]. It also possesses good abrasion resistance and ultraviolet (UV) shielding properties, making it ideal for optical lenses, medical devices, and structural components [5]. However, like many thermoplastics, PMMA has low thermal stability and poor impact resistance. To overcome these drawbacks and extend its applicability, researchers have focused on enhancing PMMA's performance through the incorporation of functional nanoparticles.
Among various inorganic fillers, nickel oxide nanoparticles (NiO NPs) have emerged as promising candidates due to their high dielectric constant, ionic conductivity, chemical stability, and semiconducting nature [6]. As a p-type semiconductor and a transition metal oxide, NiO exhibits a wide band gap and excellent thermal resistance, making it suitable for applications in catalysis, gas sensing, batteries, and optoelectronics [7]. When used as a filler in polymer matrices, NiO NPs have shown the potential to significantly improve thermal, mechanical, and electrical properties of the resulting nanocomposites.
Several previous studies have demonstrated the effectiveness of NiO NPs in enhancing the performance of polymer systems. Cerda et al. synthesized PMMA/NiO nanocomposites via in situ bulk polymerization using NiO nanoparticles prepared through the Pechini method. Their findings revealed that the inclusion of NiO NPs restricted the mobility of PMMA chains, resulting in increased thermal stability [1]. Similarly, Soleimani and Niavarzi employed emulsion polymerization and oleic acid-modified NiO NPs to produce PMMA-based nanocomposites, observing an improvement of approximately 30 °C in thermal degradation temperature and a 10 °C increase in glass transition temperature (Tg) [8]. In another study, Sayed and El-Gamal introduced NiO and La₂O₃ nanoparticles into a PVAc/PMMA blend via solution casting, reporting enhanced optical, dielectric, and mechanical properties that rendered the materials suitable for energy storage and supercapacitor applications [9]. Basappa et al. investigated PVC/PMMA/NiO nanocomposite films and found that NiO loading at 3% provided a synergistic enhancement in electrochemical properties, making the films promising candidates for electronic devices [10]. These studies collectively highlight the critical influence of filler type, dispersion quality, and processing conditions on the final properties of polymer nanocomposites [11].
A critical factor influencing the properties of polymer nanocomposites is the degree of dispersion and distribution of nanoparticles within the polymer matrix. It has been widely reported that agglomeration of nanoparticles leads to heterogeneous microstructures, which adversely affect mechanical strength, thermal stability, and electrical conductivity [11]. Surface modification of nanoparticles or optimized mixing techniques are often employed to achieve homogeneous dispersion and strong interfacial adhesion between filler and matrix, thereby enhancing composite performance.
Thermal analysis techniques such as thermogravimetric analysis (TGA), differential thermal analysis (DTA), and differential scanning calorimetry (DSC) are essential for characterizing the thermal behavior of polymer nanocomposites [12,13]. These techniques measure heat flow, phase transitions, and degradation temperatures, and provide insight into crystallization and degradation kinetics. Calculation of activation energy (Ea) for thermal degradation is particularly important to understand the thermal stability and degradation mechanisms of polymers and their composites. Various methods have been developed to estimate activation energy from thermal analysis data. The Kissinger method [14], Takhor method [15], and Augis–Bennett method [16] are widely used for analyzing weight loss and phase transition kinetics. These methods involve plotting temperature-dependent parameters and calculating Ea from the slopes of linearized forms of the Arrhenius equation based on heating rate and peak temperatures obtained from thermal analysis.
The Avrami model is frequently applied to study thermal transition or degradation kinetics and nucleation mechanisms during thermal transitions. The Avrami exponent (n) gives information about nucleation type and growth dimensions, with values of 1–4 corresponding to superficial or volumetric nucleation and one-, two-, or three-dimensional growth [17,18]. Understanding these parameters helps correlate microstructure evolution with thermal behavior.
Several studies have highlighted the importance of processing conditions such as mixing time and temperature on the dispersion of nanoparticles in polymer matrices. Prolonged mixing times can lead to nanoparticle agglomeration, resulting in uneven dispersion and degradation of thermal and mechanical properties [11]. Hence, optimizing processing parameters is crucial for fabricating nanocomposites with uniform microstructure and enhanced performance. Despite these advances, challenges remain in achieving uniform nanoparticle dispersion and fully understanding the effects of nanofiller incorporation on polymer thermal stability. The balance between improved mechanical reinforcement and the risk of agglomeration-induced thermal instability continues to drive research in polymer nanocomposite fabrication and characterization.
In the present study, PMMA/NiO nanocomposites were fabricated via melt blending using two different mixing durations: 6 minutes and 12 minutes. The objective was to systematically investigate the effect of mixing time on nanoparticle dispersion, structural homogeneity, and thermal stability. Comprehensive characterization was conducted using X-ray diffraction (XRD) to analyze phase composition, scanning electron microscopy (SEM) to observe morphological features, and thermogravimetric analysis (TGA) and differential thermal analysis (DTA) to evaluate thermal behavior. The activation energy of thermal decomposition was further calculated using model-free kinetic approaches, including Kissinger, Takhor, and Augis–Bennett methods. The findings aim to provide insights into optimizing processing parameters for the development of thermally stable and structurally uniform PMMA-based nanocomposites.
2. Materials and Methods
2.1. Materials
Polymethylmethacrylate (PMMA) with an average molecular weight of 35,000 g/mol was procured from Acros Organics. Nickel oxide (NiO) nanoparticles, with a CAS number of 1313-99-1, were purchased from Sigma-Aldrich (Germany). All reagents were of analytical grade and used without further purification.
2.2. Preparation of PMMA/NiO Nanocomposites
Pure PMMA and NiO-reinforced PMMA nanocomposite films were fabricated using a melt-blending technique [19]. In a typical process, 4 g of PMMA and 0.1 g of NiO nanoparticles (corresponding to 2.5 wt%) were premixed and fed into a twin-screw extruder. The extrusion was performed at a temperature of approximately 480 K and a screw speed of 100 rpm. To investigate the effect of processing time, the melt blending was conducted for two different durations: 6 minutes and 12 minutes. The resulting films were labeled as follows: PMMA (pure polymer), PMMA-6 (nanocomposite blended for 6 minutes), and PMMA-12 (nanocomposite blended for 12 minutes).
2.3. Characterization Techniques
2.3.1. X-Ray Diffraction (XRD):
Phase composition and structural changes of the prepared samples were analyzed using a Bruker D8 Advance X-ray diffractometer equipped with CuKα radiation (λ = 0.154056 nm). Scans were recorded in the 2θ range of 5°–80° with a step size of 0.013° to ensure high-resolution pattern acquisition.
2.3.2. Scanning Electron Microscopy (SEM):
The surface morphology and dispersion of NiO nanoparticles within the PMMA matrix were examined using a JEOL JSM-6064LV scanning electron microscope operated at an accelerating voltage of 10 kV.
2.3.3. Differential Thermal Analysis (DTA):
Thermal degradation kinetics and stability of the nanocomposites were evaluated using the Kissinger Takhor, and Augis–Bennett methods. These approaches were applied to calculate activation energy (Ea) values based on non-isothermal DTA/TGA data.
Differential thermal analysis (DTA) and thermogravimetric analysis (TGA) were performed with a Hitachi Exstar SII 7300 thermal analyzer to investigate phase transitions and degradation behavior. Powder samples (10–20 mg) were sealed in aluminum pans and heated under a nitrogen atmosphere (flow rate: 50 mL·min⁻¹) at a constant heating rate of 10 K·min⁻¹ up to 1000 K.
Pure PMMA was used as the reference material to enable direct comparison of thermal stability. Calibration of the instrument was carried out using standard alumina crucibles. To ensure reproducibility and accuracy, all thermal measurements were repeated three times for each sample.
2.4. Theoretical Background
Polymers are widely recognized as solid materials exhibiting diverse thermal behaviors depending on their structure, composition, and application environments. To evaluate these behaviors, thermal analysis techniques are essential, providing detailed information on phase transitions, degradation processes, and thermal stability across varying temperature conditions [12,21]. These techniques measure the heat exchanged between the material and its surroundings during controlled heating or cooling cycles. From these measurements, values such as heat capacity, melting enthalpy, and transition temperatures are obtained. These thermal parameters help to elucidate important phenomena including crystallization, glass transitions, and thermal degradation behavior.
A key thermal parameter derived from such analyses is the thermal activation energy (Ea), which represents the minimum energy required for degradation or transformation processes to occur within the polymer or nanocomposite matrix. Ea serves as a vital indicator of thermal stability and can be determined using several model-based methods. Among the most widely adopted methods are the Kissinger, Takhor, and Augis–Bennett methods, all of which are based on the non-isothermal kinetic analysis derived from the general Ozawa equation [13].
The activation energy of the prepared samples was calculated using the Kissinger method [14],
where Ea; activation energy and R; gas constant (R=8.314 J/mol.K). According to the crystallization temperature peaks obtained in DTA; When ln (β/Tx2) is plotted against 1000/ Tx, activation energy is calculated from the slope of the line.
Another method for calculating activation energy is the Takhor method, in which the activation energy is determined as follows [22],
The terms are the same as in the Kissinger method, and when lnβ is plotted against 1000/Tx, activation energy is calculated from the slope of the line according to the Takhor method.
Another activation energy calculation method is the Augis-Bennett method. Activation energy according to this method is calculated as [16],
where T0 is the absolute temperature and C is constant. The activation energy is calculated from the slope of the line obtained from the ln (β/Tx-T0) graph against 1000/Tx.
The expressions used in the Figure 1 for evaluation of DTA graphic are T0; the starting temperature of the crystallization peak, Ty; partial temperature, Tx; crystallization peak temperature, Tf; peak end temperature, Ax; partial area of the peak, A; the entire area of the peak (crystallization enthalpy). Rate of reaction is calculated by.
x values are calculated using equation 4 using the temperature values selected from crystallization peaks at different heating rates in order to obtain the Avrami parameter (n), which is an important expression in determining the nucleation mechanism of the samples. Avrami parameter is obtained as,
where β is taken as the heating rate and a graph of versus ln β is drawn. The slope of the nearest passing line returns the value –n [22]. From the studies in the literature, it is understood that the n values can be 1, 2, 3 and 4. The n values to be obtained indicate different crystallization mechanisms. The meanings of the values that n can receive are as follows.
From the surface to the interior, is known to defy growth [18]
n=1; superficial nucleation and single dimension,
n=2; volumetric nucleation and single size,
n=3; volumetric nucleation and two dimensions,
n=4; volumetric nucleation and three-dimensional,
Displacements in exothermic and endothermic peak temperatures resulting from heating rates are also used in activation energy calculations.
3. Results
3.1. XRD Characterization
Figure 2 presents the XRD patterns of pure PMMA, NiO nanoparticles, and PMMA/NiO nanocomposites (PMMA-6 and PMMA-12). The NiO pattern exhibits distinct peaks at 2θ ≈ 37.2°, 43.3°, and 62.9°, corresponding to the (111), (200), and (220) planes of the cubic spinel structure, in agreement with JCPDS card no. 73-1523 [23]. These sharp reflections confirm the crystalline nature of the NiO nanoparticles. In contrast, the pure PMMA sample shows a broad diffraction halo centered around 2θ ≈ 13°–20°, consistent with its amorphous character, as identified in JCPDS card no. 13-0835.
For the PMMA-6 and PMMA-12 nanocomposites, the amorphous PMMA background is retained; however, additional diffraction peaks corresponding to NiO planes are evident, indicating successful incorporation of the nanoparticles into the polymer matrix. The visibility of NiO reflections in both nanocomposites confirms the presence and dispersion of crystalline NiO within the amorphous PMMA.
3.2. Morphology of PMMA and Nanocomposites
SEM micrographs of pure PMMA, PMMA-6, and PMMA-12 samples are presented in Figure 3 (a–c) to evaluate the dispersion of NiO nanoparticles within the PMMA matrix. The pure PMMA surface (Figure 3a) appears smooth and featureless, typical of an amorphous polymer. In PMMA-6 (Figure 3b), NiO nanoparticles are visible as bright spots; however, their distribution is not entirely uniform, and localized agglomeration is evident.
3.3. Differential Thermal Analysis (DTA)
The DTA curves of pure PMMA, PMMA-6, and PMMA-12 at various heating rates (5, 10, 15, and 20 K/min) are shown in Figure 4 (a–c). All samples exhibit prominent endothermic peaks, indicating thermal decomposition behavior associated with polymer degradation. For the pure PMMA sample (Figure4a), the onset of thermal degradation begins around 600 K and shifts progressively to higher temperatures with increasing heating rate, a typical kinetic response of thermally activated processes.
Similar thermal behavior is observed in PMMA-6 (Figure 4b) and PMMA-12 (Figure 4c), although the decomposition onset occurs slightly earlier than in pure PMMA, suggesting that the addition of NiO nanoparticles slightly reduces the thermal stability of the matrix. Notably, the endothermic peaks remain well-defined in all nanocomposite samples, confirming that degradation is a single-stage process dominated by polymer chain scission.
The DTA data summarized in Table 1 reveal a consistent decrease in the crystallization peak temperature (Tx) for the nanocomposite samples compared to pure PMMA, with reductions ranging from 2 to 5 K at equivalent heating rates. For example, at a heating rate of 5 K/min, the pure PMMA sample exhibited a Tx of 651 K, whereas PMMA-6 and PMMA-12 recorded slightly lower values of 648 K and 646 K, respectively. This trend persists across all examined heating rates.
The glass transition temperature (Tg) is a critical parameter for polymer characterization, as it governs the macroscopic thermal and mechanical behavior of the material [24]. Tg marks the temperature at which the amorphous regions of the polymer undergo significant changes in molecular mobility, leading to altered thermal properties. Importantly, Tg often correlates with the onset of thermal degradation, as polymers tend to exhibit isotropic expansion once this temperature is exceeded. As shown in Figure 4, the DTA curve indicates that pure PMMA exhibits a Tg around 380 K, consistent with previously reported values in the literature [25]. This confirms the reliability of the current measurements and establishes a baseline for comparing the thermal behavior of PMMA nanocomposites [26].
3.4. Thermal Activation Calculations
The activation energies of the samples were calculated from the DTA curves by analyzing the mass loss occurring at various stages of the degradation process. Additionally, the Avrami parameter (n) was determined from the degradation peaks, providing important insights into microstructural changes within the nanocomposites. According to the literature, the Avrami parameter helps characterize the nucleation and growth mechanism, indicating whether these processes occur superficially or volumetrically, as well as the dimensionality of growth from the surface inward. The Avrami parameters were derived from the slopes of the linear fits based on the Ozawa equation, as described in Equation 5 [27]. Figure 5 illustrates the plots of ln[-ln(1-φ)] versus lnβ for PMMA, PMMA-6, and PMMA-12 samples, calculated in accordance with the Ozawa method.
By analyzing the peaks on the DTA curve, it was determined that the Avrami parameter for as-prepared samples is approximately 1. This suggests that there was unidirectional superficial nucleation and growth.
The results of activation energy calculations made with Kissinger, Takhor and Augis Bennett methods as shown in the Table 2. The Kissinger method is typically employed for estimating the activation energy of a chemical reaction or a phase transition. It is particularly useful for analyzing weight loss processes, such as thermal degradation or decomposition. The graph of 1000/Tx versus ln (β/Tx2)obtained from DTA measurements by the Kissinger method is given in Figure 6. The slope of the line calculated for each sample gives the activation energy [28].
We compared the activation energies of transformations in PMMA, PMMA-6, and PMMA-12 samples subjected to heating rates of 5, 10, 15, and 20 K/min. The Kissinger method showed that the activation energy of PMMA/NiO (2.5%) prepared with 6 min mixing time was 230 kJ/mol, and 207 kJ/mol with 12 min mixing time.
The lnβ-1000/Tx graph for PMMA, PMMA-6 and PMMA-12 samples according to the Takhor Formula is given in Figure 7. Based on the Takhor Formula, the activation energies were calculated for PMMA, PMMA-6 and PMMA-12 samples subjected to heating rates of 5, 10, 15 and 20 K/min. The obtained activation energy was 200 kJ/mol for PMMA, 241 kJ/mol for PMMA-6 and 218 kJ/mol for PMMA-12.
According to the Augis-Bennett formula, the ln (β/Tx2)-1000/Tx plot for PMMA, PMMA-6 and PMMA-12 is presented in Figure 8. The activation energies calculated PMMA, PMMA-6 and PMMA-12 were 162 kJ/mol 241 kJ/mol and 230 kJ/mol, respectively. Similar to Kissinger and Takhor methods, the activation energy value of the PMMA-6 increased compared to the PMMA sample, and of PMMA-12 sample decreased relative to PMMA-6.
Activation energy calculations showed that the presence of NiO nanoparticles lowered the degradation onset temperature and decreased the activation energy compared to pure PMMA. Notably, the 6-minute blend exhibited slightly higher activation energies and improved thermal stability than the 12-minute blend, underscoring the negative impact of nanoparticle agglomeration on heat resistance. To further validate these results, the calculated activation energies were compared with literature values reported for pure PMMA under different conditions, as summarized in Table 3 [29,30,31].
4. Discussion
The structural and thermal characterization results collectively highlight the critical role of mixing time in determining the dispersion of NiO nanoparticles within the PMMA matrix. Slightly more intense peaks in PMMA-6 suggest better dispersion compared to PMMA-12, likely due to reduced agglomeration at shorter mixing times. These results demonstrate that NiO NPs are structurally embedded in the PMMA matrix without altering its amorphous nature, providing the first indication that processing time directly affects the uniformity of nanoparticle distribution.
Morphological analyses further support this finding. When the mixing time was increased to 12 minutes (Figure 3c), the degree of agglomeration also increased, suggesting that extended mixing may promote nanoparticle clustering due to particle–particle interactions outweighing polymer–particle interactions. Despite this agglomeration, no interfacial voids or gaps were observed between NiO particles and the surrounding PMMA matrix, indicating strong interfacial adhesion and good compatibility between filler and polymer. The encapsulation of NiO NPs by a thin PMMA layer suggests the formation of multiple particle–polymer interfaces, which likely contribute to enhanced structural integrity and play a decisive role in defining the thermal behavior of the nanocomposites.
Although only two mixing times (6 and 12 min) were investigated, the results clearly demonstrate the adverse effect of prolonged processing on nanoparticle dispersion. Future studies may explore intermediate or longer durations to identify the optimal processing window for NiO/PMMA nanocomposites.
Thermal analysis results are consistent with these structural observations. PMMA-6 exhibited slightly higher decomposition temperatures than PMMA-12, indicating better thermal resistance, most likely due to improved nanoparticle dispersion at shorter mixing times. This correlates with SEM findings, where increased agglomeration in PMMA-12 may have disrupted the thermal shielding effect of the nanoparticles. Moreover, the DTA curves revealed thermal instability near the initial degradation temperature, independent of the heating rate. This instability is attributed to the presence of NiO nanoparticles within the polymer matrix. The non-uniform dispersion and localized agglomeration of nanoparticles created heterogeneous regions in the composite, leading to thermal fluctuations during heating. Such uneven particle distribution likely influenced the degradation pathways, causing subtle mass losses and contributing to deviations observed in the DTA curves of PMMA-6 and PMMA-12.
Activation energy calculations further support this trend. Longer mixing times reduced nanoparticle homogenization and decreased the thermal stability of the nanocomposites. Uniform dispersion of particles within the polymer matrix is essential to enhance the thermal stability of composites [28]. As observed, the activation energy for PMMA-6 was slightly higher than for PMMA-12. This result from the Takhor method is consistent with the Kissinger calculation and is attributed to the inability to achieve homogeneous distribution at longer mixing times. Homogenization ensures that heat absorbed by the nanoparticles is evenly distributed within the polymer, whereas agglomeration creates localized instabilities. These results are in agreement with previous studies, which reported that uniform dispersion is crucial for enhancing the thermal resistance of polymer nanocomposites [29,30,31].
Overall, the findings confirm that effective nanoparticle dispersion—achieved through optimized mixing time—is the key factor controlling both the structural integrity and thermal stability of NiO/PMMA nanocomposites.
5. Conclusions
This study investigated the incorporation of NiO nanoparticles into a PMMA matrix and examined how extrusion mixing time governs the resulting nanocomposites’ structural and thermal properties. XRD and SEM analyses confirmed that NiO nanoparticles were embedded in the polymer matrix without altering its amorphous character, while highlighting the critical role of mixing duration in dispersion quality. At shorter mixing times (6 min), the nanofillers were more uniformly distributed, whereas prolonged mixing (12 min) promoted agglomeration and reduced structural homogeneity.
Thermal analyses performed at different heating rates showed that NiO incorporation decreased both the onset decomposition temperature and the overall thermal stability of PMMA. Activation energy calculations using Kissinger, Takhor, and Augis–Bennett methods revealed that PMMA-6 exhibited slightly higher activation energies and improved stability compared to PMMA-12, underscoring the negative impact of agglomeration on thermal resistance. Pure PMMA, by contrast, demonstrated superior stability relative to all composites, suggesting that nanoparticle reinforcement requires careful optimization to avoid adverse effects.
Overall, these findings emphasize that nanoparticle dispersion quality—rather than nanoparticle presence alone—is the key factor governing the performance of NiO/PMMA nanocomposites. Future studies should investigate surface modification of NiO nanoparticles, advanced dispersion techniques, and the influence of varying filler concentrations and processing parameters to identify the optimal design window for high-performance PMMA-based nanocomposites.
Author Contributions
Conceptualization, methodology, investigation, writing—original draft preparation, writing—review and editing, visualization, supervision, project administration, [Aytekin Ulutaş]. The author has read and agreed to the published version of the manuscript.
Funding
This research received no external funding.
Data Availability Statement
Data is available on request from the corresponding author.
Conflicts of Interest
The authors declare no conflict of interest.
Abbreviations
The following abbreviations are used in this manuscript:
| PMMA | Poly(methyl methacrylate) |
| NiO | Nickel Oxide |
| NPs | Nanoparticles |
| XRD | X-ray Diffraction |
| SEM | Scanning Electron Microscopy |
| DTA | Differential Thermal Analysis |
| DSC | Differential Scanning Calorimetry |
| TGA | Thermogravimetric Analysis |
| UV | Ultraviolet |
| Ea | Activation Energy |
| Tx | Crystallization Peak Temperature |
| Tg | Glass Transition Temperature |
| β (Beta) | Heating Rate |
| JCPDS | Joint Committee on Powder Diffraction Standards |
| JEOL | Japan Electron Optics Laboratory |
| JSM | JEOL Scanning Microscope |
| MWCNT | Multi-Walled Carbon Nanotubes |
| PVC | Polyvinyl Chloride |
| DFT | Density Functional Theory |
| CAS | Chemical Abstracts Service |
References
- García-Cerda, L.A.; Romo-Mendoza, L.; Quevedo-López, M.A. Synthesis and characterization of NiO nanoparticles and their PMMA nanocomposites obtained by in situ bulk polymerization. Journal of Materials Science 2009, 44, 4553–4561. [Google Scholar] [CrossRef]
- Bel, T.; Arslan, C.; Baydoğan, N.G. PMMA/Mikroküre/Montmorillonit Nanokompozit ve PMMA/Mikroküre/Halloysite Nanokompozitin Atom Transfer Radikal Polimerizasyon Tekniği ile Üretilmesi ve Mekanik Özelliklerinin Karşılaştırmalı Olarak İncelenmesi. Gazi Üniversitesi Mühendislik Mimarlık Fakültesi Dergisi 2019, 34, 687–700. [Google Scholar] [CrossRef]
- Çankaya, N.; et al. First report of the synthesis, characterization, DFT calculations of the new oxoethyl methacrylate and o-acetamide and evaluation of antimicrobial, antibiofilm and antioxidant effect. Polycyclic Aromatic Compounds 2023, 43, 5139–5157. [Google Scholar] [CrossRef]
- Sudhakar, Y.; Anandan, V.; Sukumar, M.; Kannan, T.; Tatha, G.; Bandyopadhyay, S. Investigations on thermo-mechanical properties of organically modified polymer clay nanocomposites for packaging application. Polymers & Polymer Composites 2021, 29, 1191–1199. [Google Scholar] [CrossRef]
- Kroschwitz, J.I.; Mark, H.F. (Eds.) Encyclopedia of Polymer Science and Technology; 3rd ed.; Wiley-Interscience: Hoboken, NJ, USA, 2003.
- Khutia, M.; Joshi, G.M.; Thomas, P. Dielectric relaxation of nano perovskite SrTiO3 reinforced polyester resin/styrene blend for electronic applications. Journal of Materials Science: Materials in Electronics 2016, 27, 7685–7692. [Google Scholar] [CrossRef]
- Li, Y.; Xu, B.; Xu, H.; Duan, H.; Li, C.; Zhao, C.; Xu, J. Li7La3Zr2O12 ceramic nanofiber-incorporated composite polymer electrolytes for lithium metal batteries. Journal of Materials Chemistry A 2019, 7, 3391–3398. [Google Scholar] [CrossRef]
- Soleimani, E.; Niavarzi, F.B. Preparation, characterization and properties of PMMA/NiO polymer nanocomposites. Journal of Materials Science: Materials in Electronics 2018, 29, 2392–2405. [Google Scholar] [CrossRef]
- El Sayed, A.M.; El-Gamal, S. Influence of NiO and La2O3 nanoparticles on the optical, mechanical and electrical properties of PVAc–PMMA blend: a comparative study. Physica Scripta 2022, 97, 055814. [Google Scholar] [CrossRef]
- Basappa, M.; Yelmewad, M.; Patil, S.; Kerekoppa, R.; Desai, V.; Naik, J. Investigate the Optical, Structural and Electrochemical Properties of PVC/PMMA/NiO Blend Films. IOP Conference Series: Materials Science and Engineering 2022, 1221, 012059. [Google Scholar] [CrossRef]
- Ninjbadgar, T.; Yamamoto, S.; Fukuda, T. Synthesis and magnetic properties of the γ-Fe2O3/poly(methyl methacrylate) core/shell nanoparticles. Solid State Sciences 2004, 6, 879–885. [Google Scholar] [CrossRef]
- Genieva, S.; Vlaev, L.; Atanassov, A. Study of the thermooxidative degradation kinetics of poly(tetrafluoroethene) using iso-conversional calculation procedure. Journal of Thermal Analysis and Calorimetry 2010, 99, 551–561. [Google Scholar] [CrossRef]
- Koralay, H.; Çelikbilek, M.; Uslu, İ.; Akbulut, H. Crystallization kinetics of Bi1.7V0.3Sr2Ca2Cu3Ox glass-ceramic. Physica B: Condensed Matter 2005, 355, 64–71. [Google Scholar] [CrossRef]
- Kissinger, H.E. Variation of peak temperature with heating rate in differential thermal analysis. Journal of Research of the National Bureau of Standards 1956, 57, 217–221. [Google Scholar] [CrossRef]
- Starink, M.J. Comments on “Precipitation kinetics of Al–1.12 Mg2Si–0.35 Si and Al–1.07 Mg2Si–0.33 Cu alloys”. Journal of Alloys and Compounds 2007, 433, L4–L6. [Google Scholar] [CrossRef]
- Augis, J.A.; Bennett, J.E. Calculation of the Avrami parameters for heterogeneous solid state reactions using a modification of the Kissinger method. Journal of Thermal Analysis 1978, 13, 283–292. [Google Scholar] [CrossRef]
- Ozturk, O.; Boyraz, T.; Alver, U.; Koralay, H. A study on nucleation, crystallization kinetics, microstructure and mechanical properties of Ru–Bi partial substituted BSCCO glass ceramics. Journal of Thermal Analysis and Calorimetry 2016, 123, 1073–1082. [Google Scholar] [CrossRef]
- Xie, X.; Gao, H. Calorimetric studies on the crystallization of Li2S–B2O3 glasses. Journal of Non-Crystalline Solids 1998, 240, 166–176. [Google Scholar] [CrossRef]
- Sakharov, A.; Niyazov, R.; Sabirov, I.; Arinshtein, A.; Popov, Y. Modeling of polymer melting processes in screw extruder channels. Theoretical Foundations of Chemical Engineering 2013, 49, 357–363. [Google Scholar] [CrossRef]
- Li, S.; Huang, S.; Jing, L.; Jiang, Y.; Zhan, H.; Yuan, X. Nanocomposites of polymer and inorganic nanoparticles for optical and magnetic applications. Nano Reviews 2010, 1, 5214. [Google Scholar] [CrossRef]
- Gikarakis, T.; Pappas, I.; Arvanitaki, P.; Pantazi, E.; Mitsoni, E.; Roka, N.; Pitsikalis, M. Thermal Stability and Kinetics of Thermal Decomposition of Statistical Copolymers of N-Vinylpyrrolidone and Alkyl Methacrylates Synthesized via RAFT Polymerization. Journal of Chemistry 2021, 2021, 6633052. [Google Scholar] [CrossRef]
- Hench, L.L.; Freiman, S.W. (Eds.) . Advances in Nucleation and Crystallization in Glasses; American Ceramic Society: Columbus, OH, USA, 1971. [Google Scholar]
- Cheng, G.; Yan, Y.; Chen, R. From Ni-based nanoprecursors to NiO nanostructures: morphology-controlled synthesis and structure-dependent electrochemical behavior. New Journal of Chemistry 2015, 39, 676–682. [Google Scholar] [CrossRef]
- Ayanoğlu, Z.G.; Doğan, M. Characterization and thermal kinetic analysis of PMMA/modified-MWCNT nanocomposites. Diamond and Related Materials 2020, 108, 107950. [Google Scholar] [CrossRef]
- Lee, J.K.Y.; Chen, N.; Peng, S.; Li, L.; Tian, L.; Thakor, N.; Ramakrishna, S. Polymer-based composites by electrospinning: Preparation & functionalization with nanocarbons. Progress in Polymer Science 2018, 86, 40–84. [Google Scholar] [CrossRef]
- Campo, E.A. Selection of Polymeric Materials: How to Select Design Properties from Different Standards; William Andrew: Norwich, NY, USA, 2008. [Google Scholar]
- Ozawa, T. Kinetic analysis of derivative curves in thermal analysis. Journal of Thermal Analysis 1970, 2, 301–324. [Google Scholar] [CrossRef]
- Ul-Haq, Y.; Murtaza, I.; Mazhar, S.; Ullah, R.; Iqbal, M.; Zeeshan-ul-Huq; Qarni, A.A.; Amin, S. Dielectric, thermal and mechanical properties of hybrid PMMA/RGO/Fe2O3 nanocomposites fabricated by in-situ polymerization. Ceramics International 2020, 46, 5828–5840. [CrossRef]
- Salgansky, E.A.; Salganskaya, M.V.; Glushkov, D.O. Kinetics of thermal decomposition of polymethylmethacrylate in a carbon dioxide environment. Russ. J. Phys. Chem. B 2024, 18, 918–923. [Google Scholar] [CrossRef]
- Holland, B.J.; Hay, J.N. The effect of polymerisation conditions on the kinetics and mechanisms of thermal degradation of PMMA. Polym. Degrad. Stab. 2002, 77, 435–439. [Google Scholar] [CrossRef]
- Zeng, W.R.; Li, S.F.; Chow, W.K. Chemical kinetics on thermal oxidative degradation of PMMA. Chin. J. Chem. Phys. 2003, 16, 64–68. [Google Scholar]
Figure 1.
Representation of the values specified on the DTA chart.
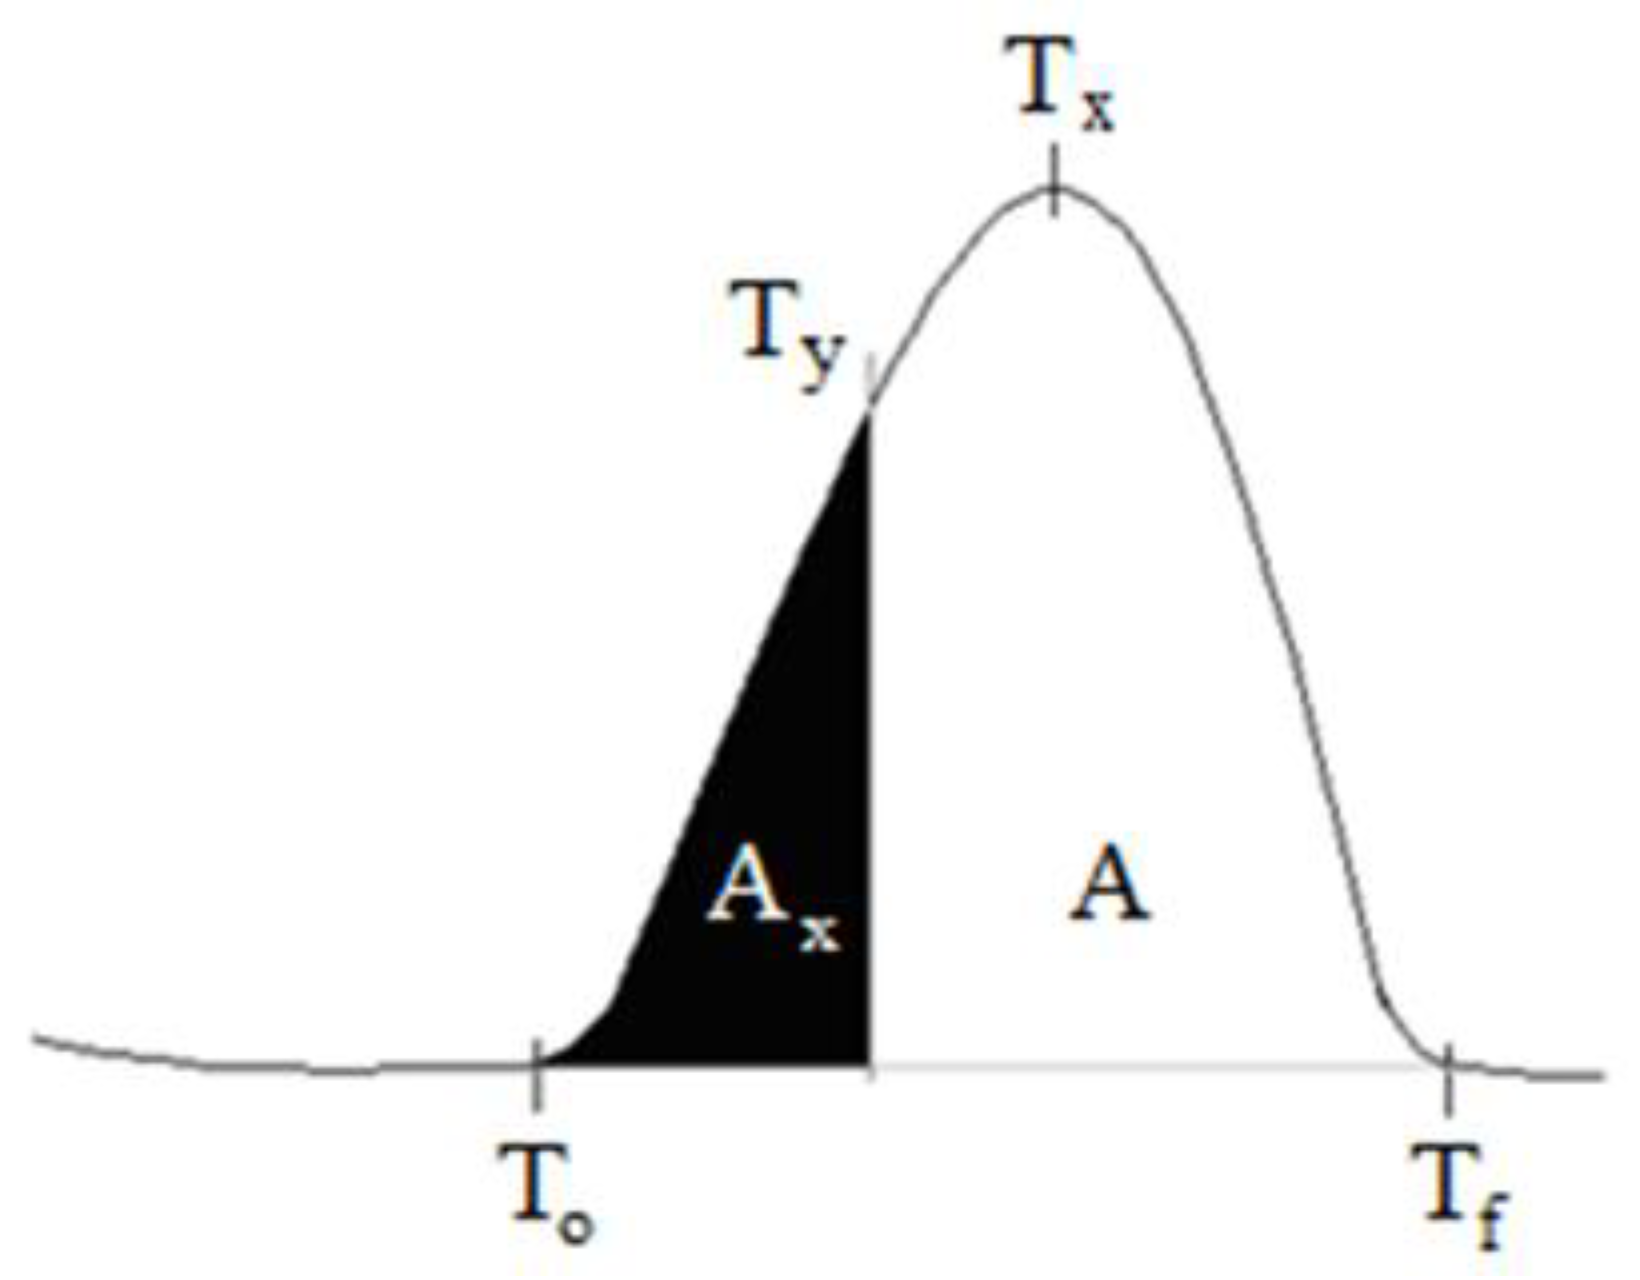
Figure 2.
XRD patterns for NiO NPs, PMMA, PMMA-6 and PMMA-12 samples.
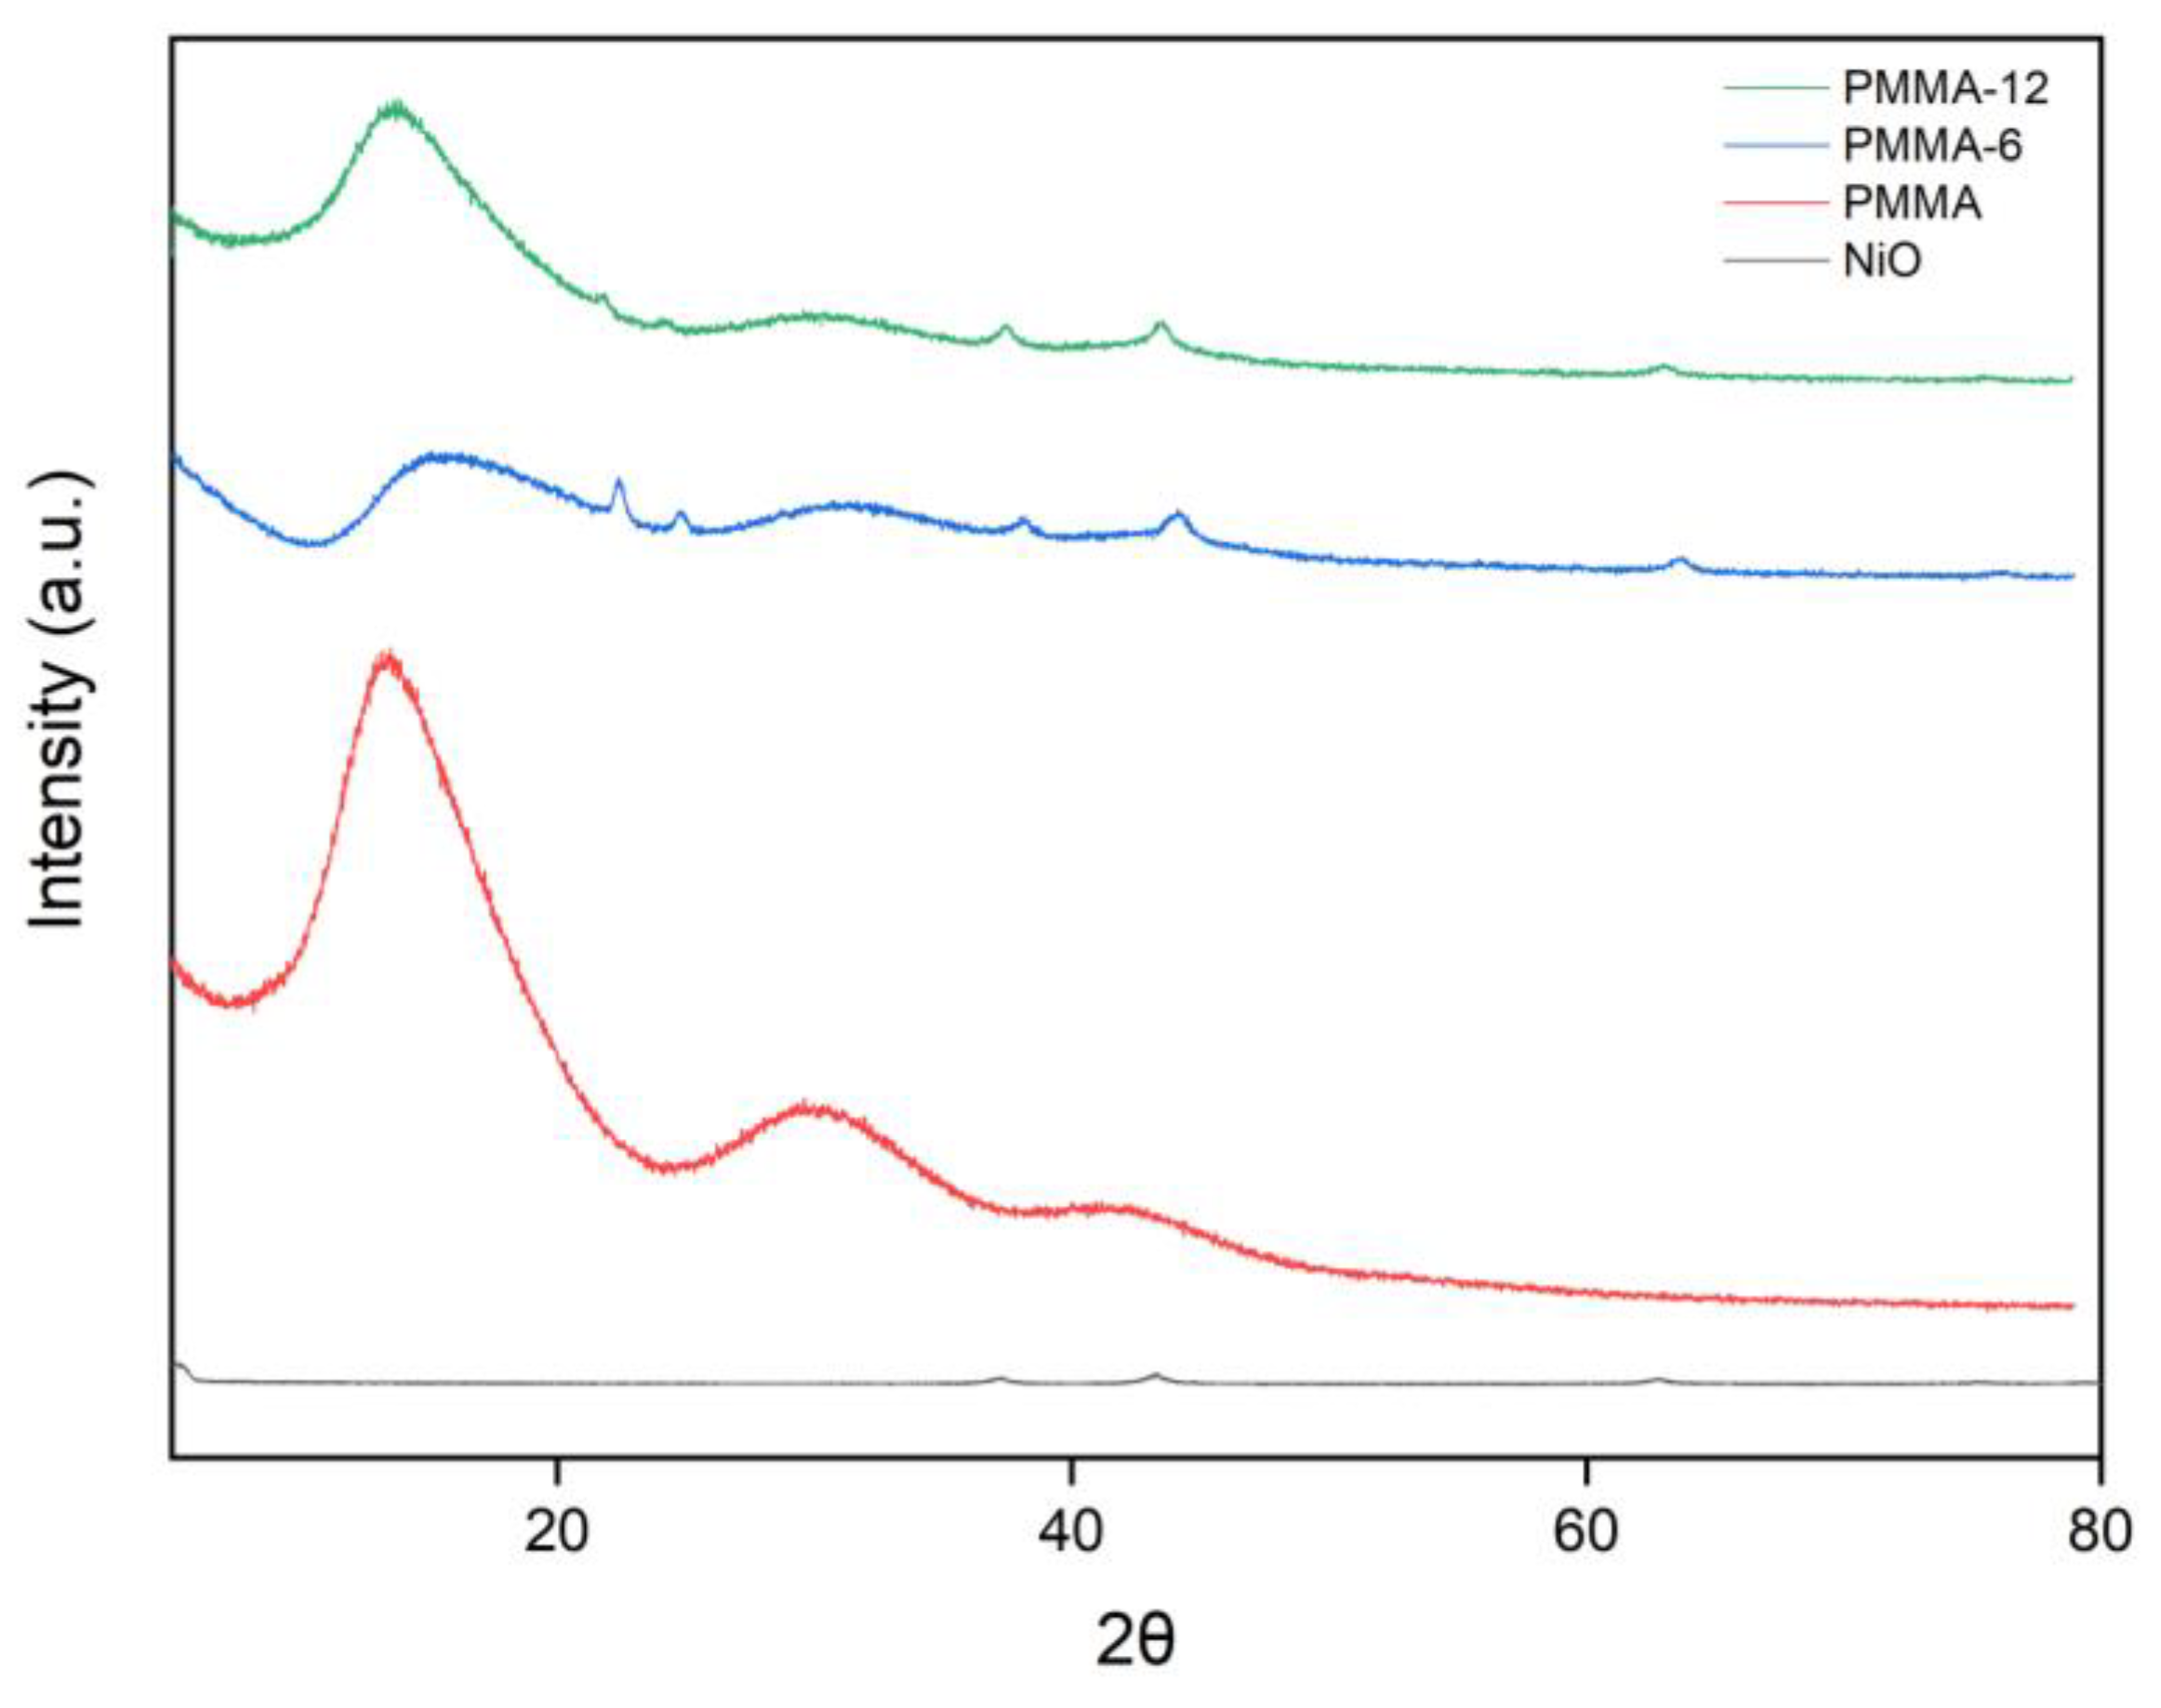
Figure 3.
SEM micrographs of PMMA and nanocomposites: (a) PMMA, (b) PMMA-6, (c) PMMA-12.
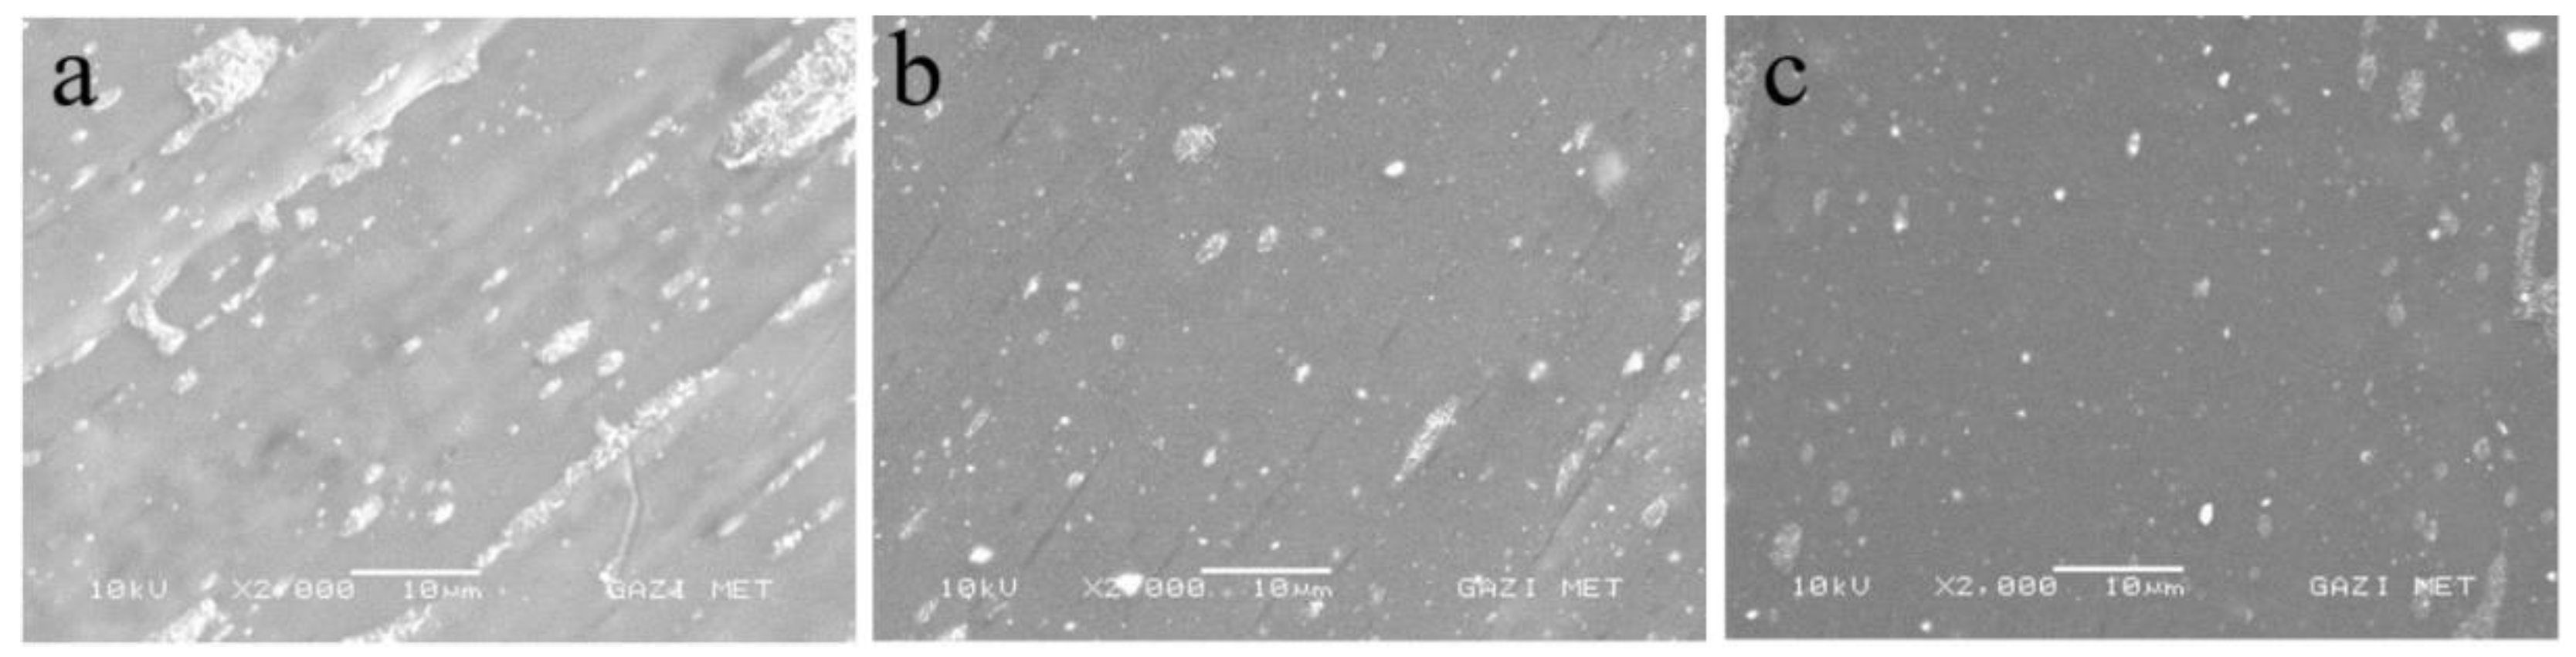
Figure 4.
DTA graphics of the samples (a) PMMA, (b) PMMA-6 and (c) PMMA-12.
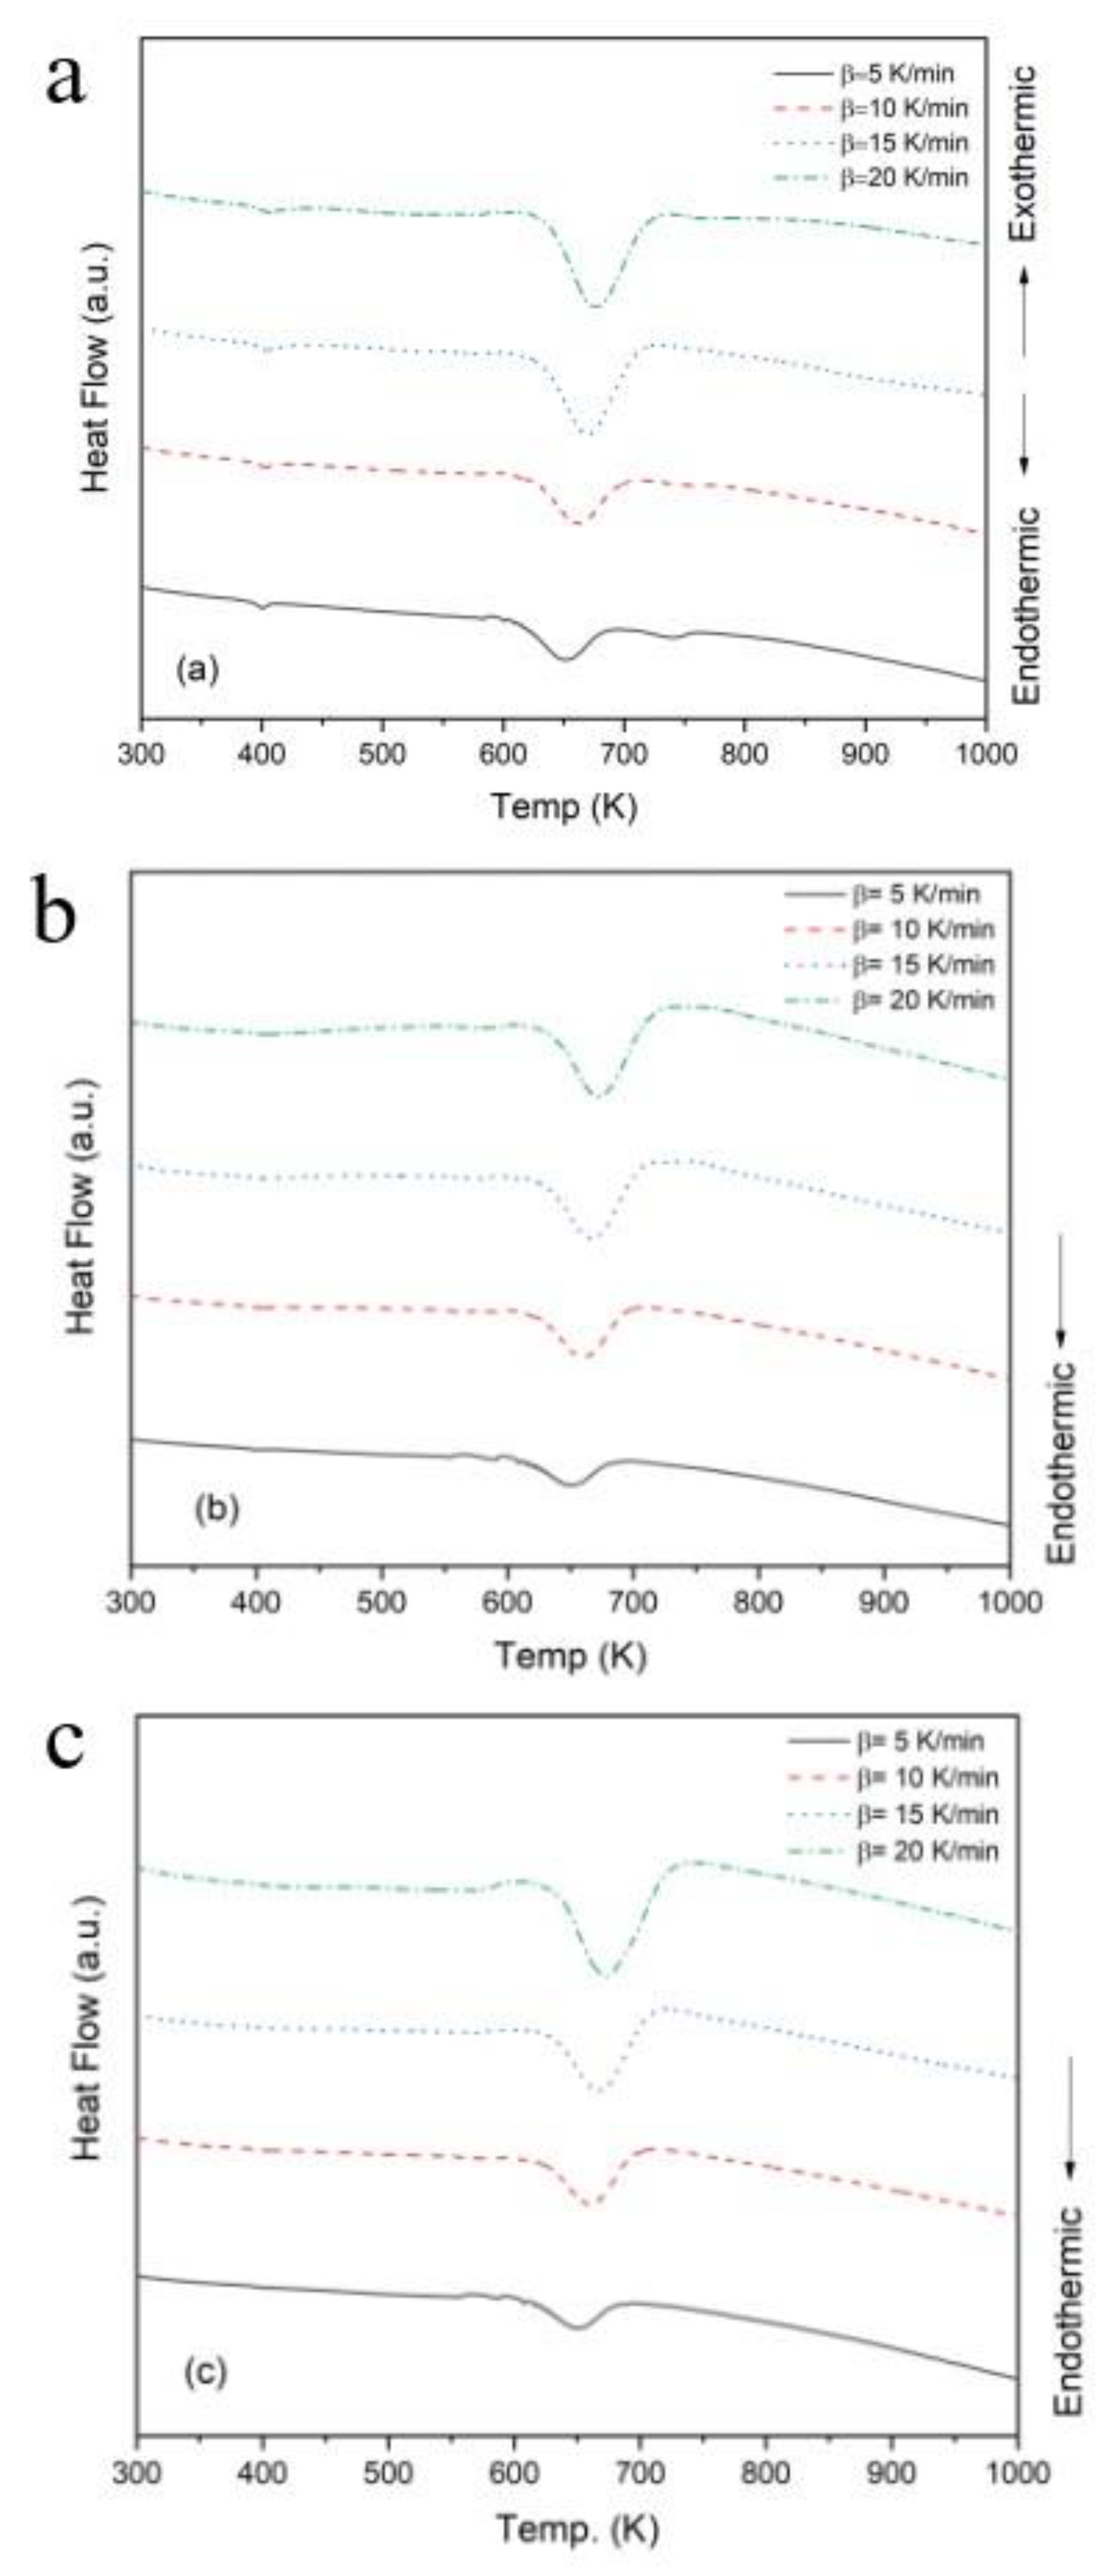
Figure 5.
Ozawa plots for PMMA, PMMA-6 and PMMA-12 samples.
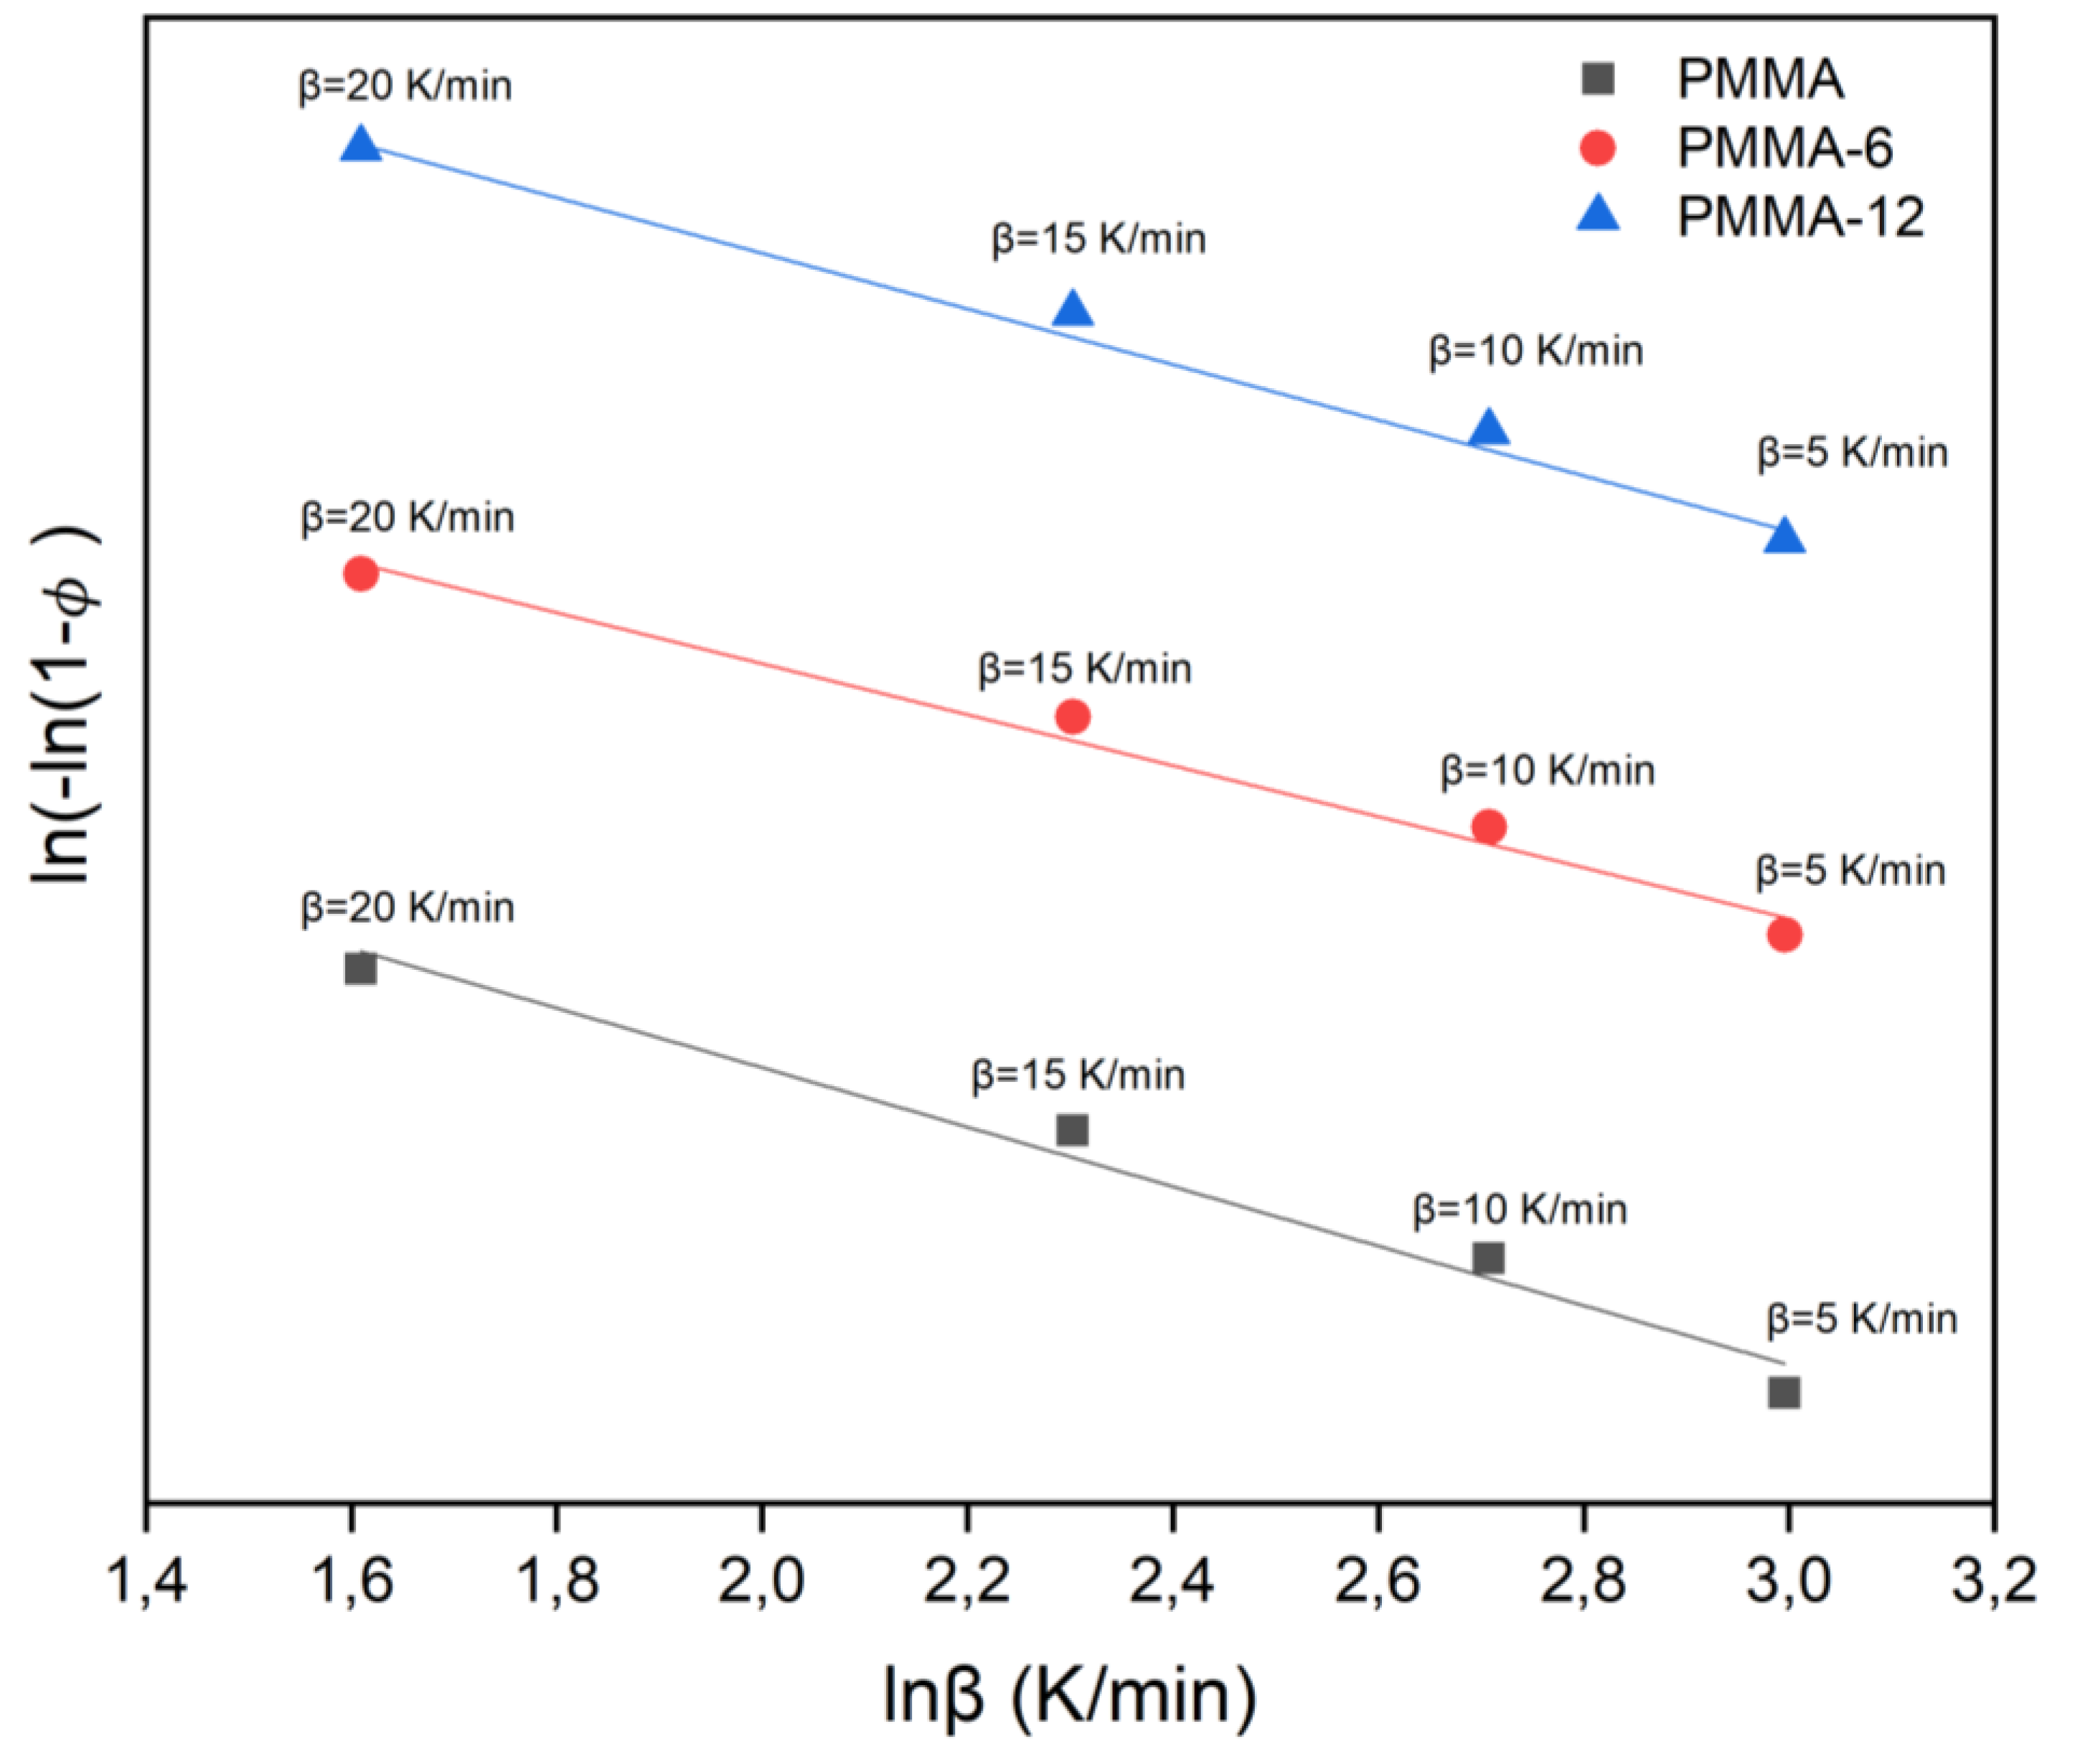
Figure 6.
ln(β/Tx2)-1000/Tx plot for PMMA, PMMA-6 and PMMA-12 samples according to Kissinger Formula.
Figure 6.
ln(β/Tx2)-1000/Tx plot for PMMA, PMMA-6 and PMMA-12 samples according to Kissinger Formula.

Figure 7.
lnβ-1000/Tx graph for PMMA, PMMA-6, and PMMA-12 samples according to Takhor Formula.
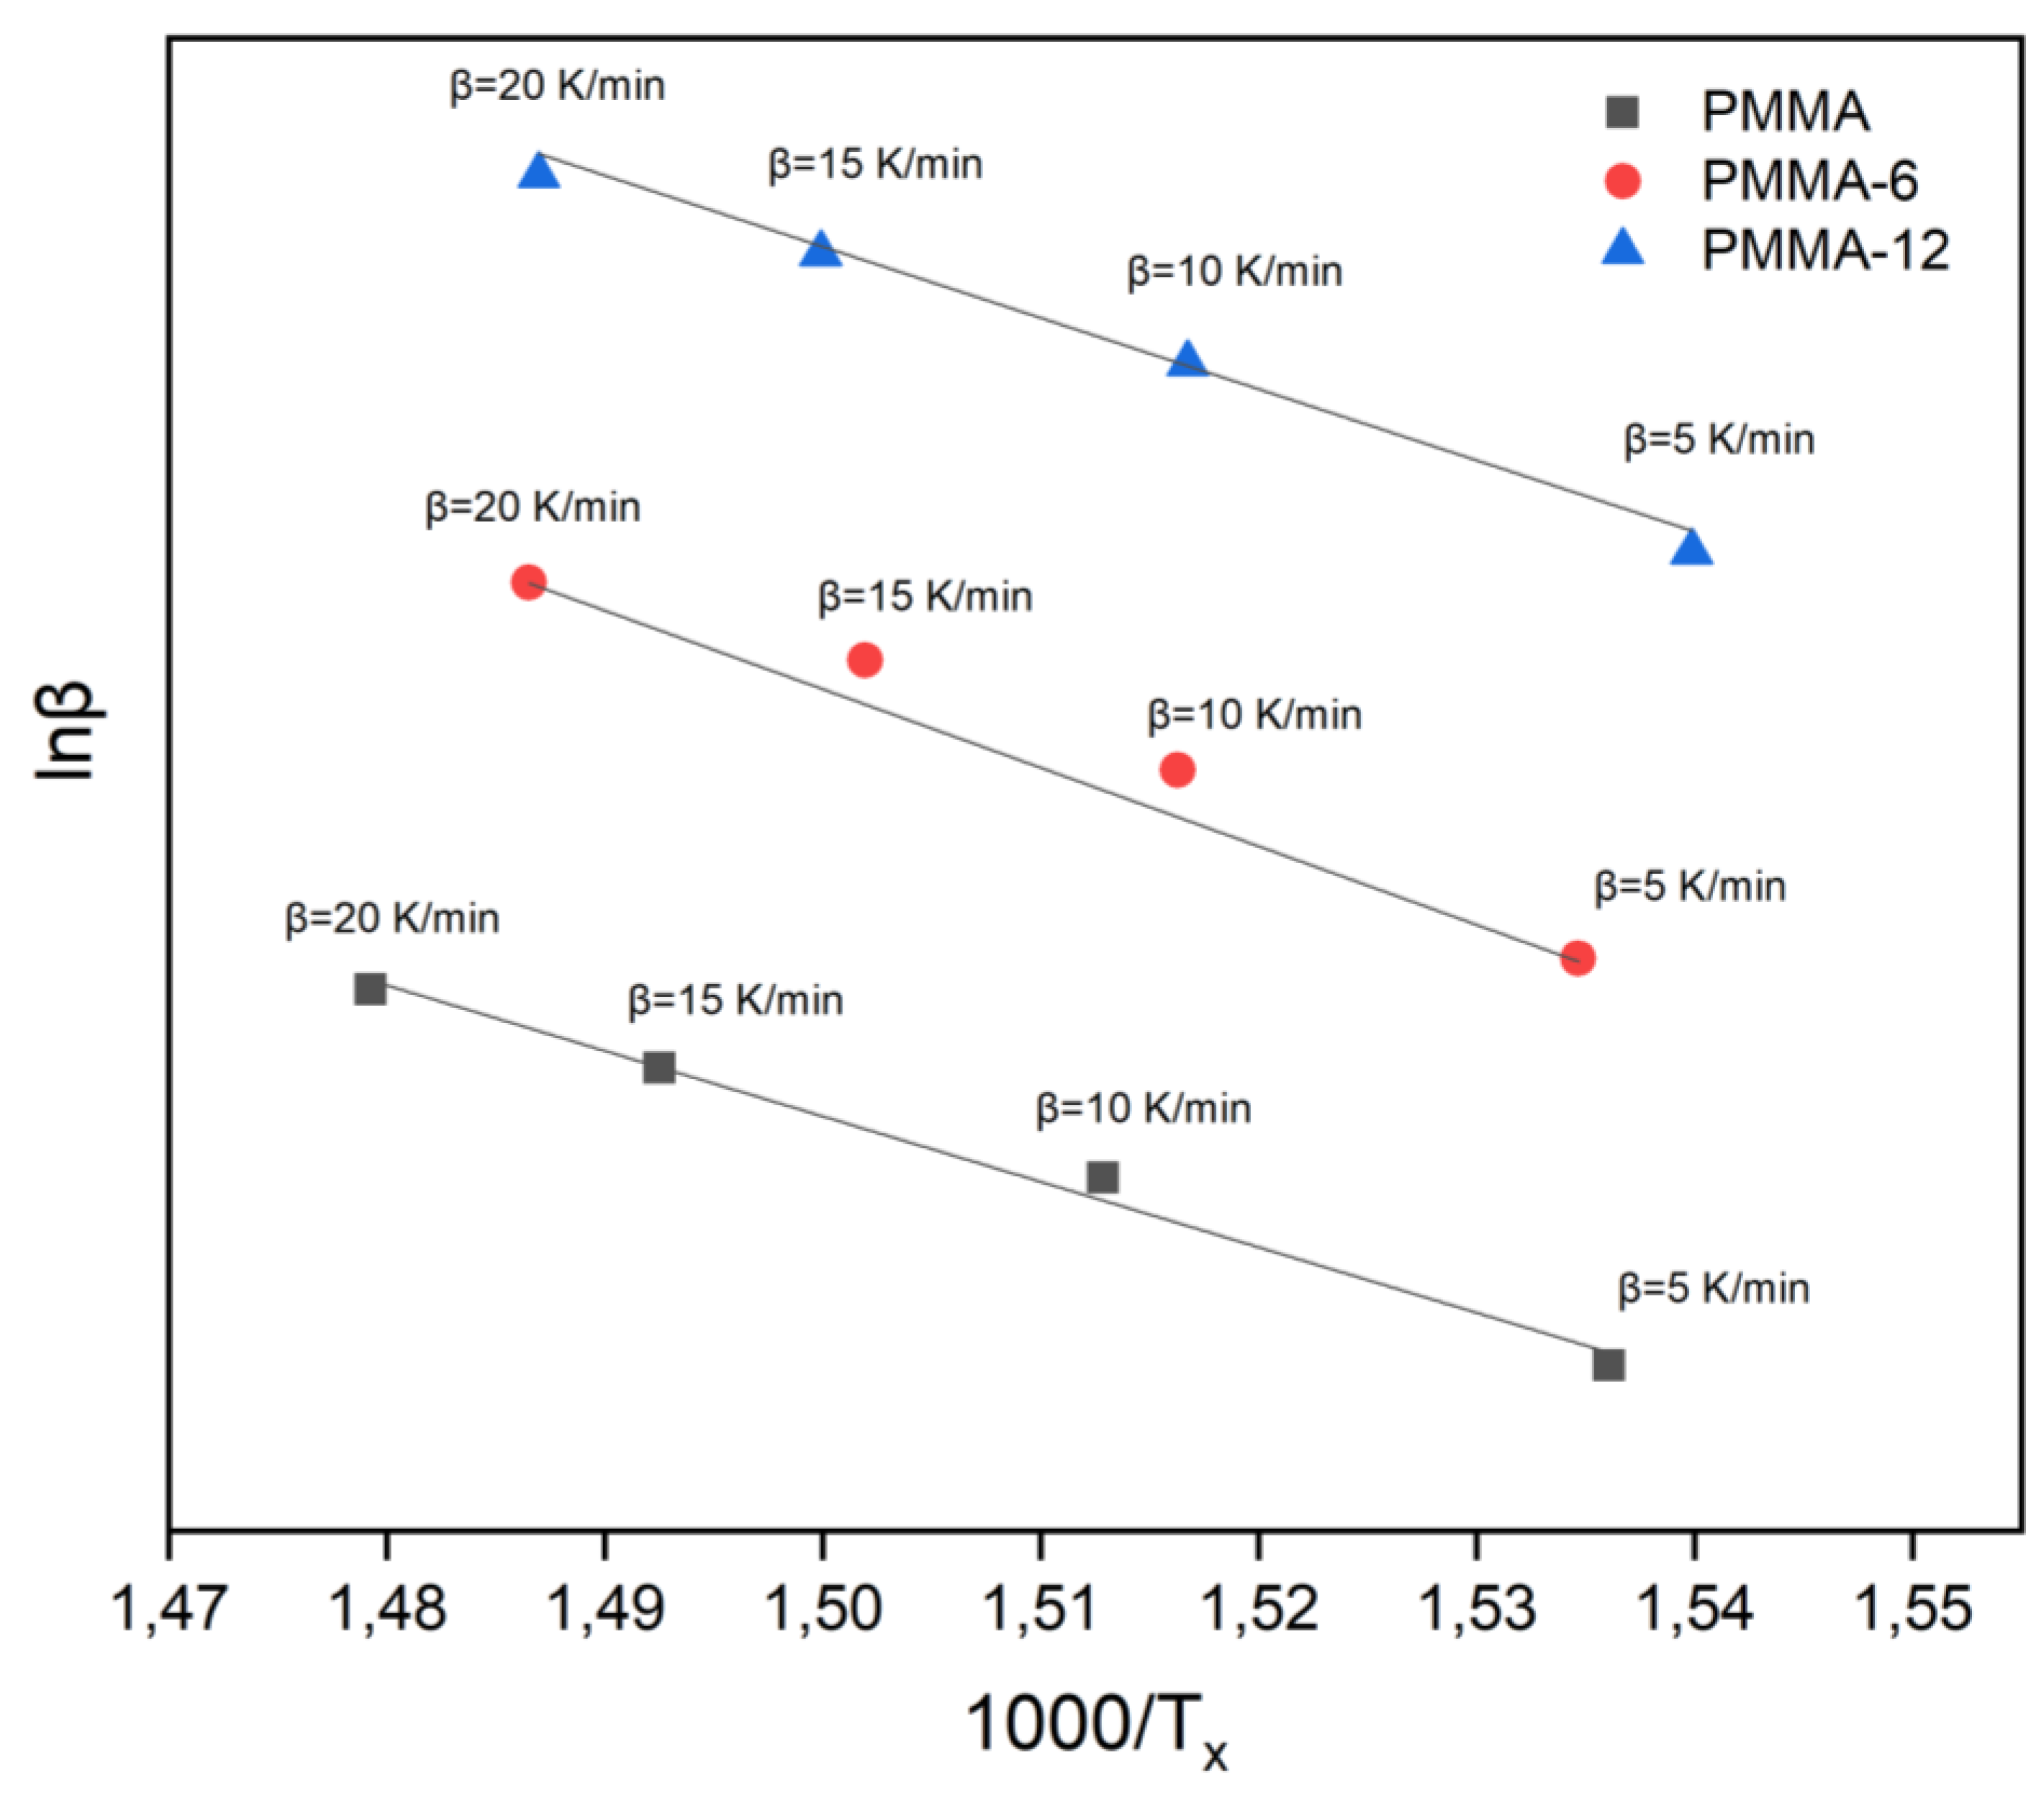
Figure 8.
ln(β/Tx-To)-1000/Tx chart for samples according to Augis-Bennett Formula.
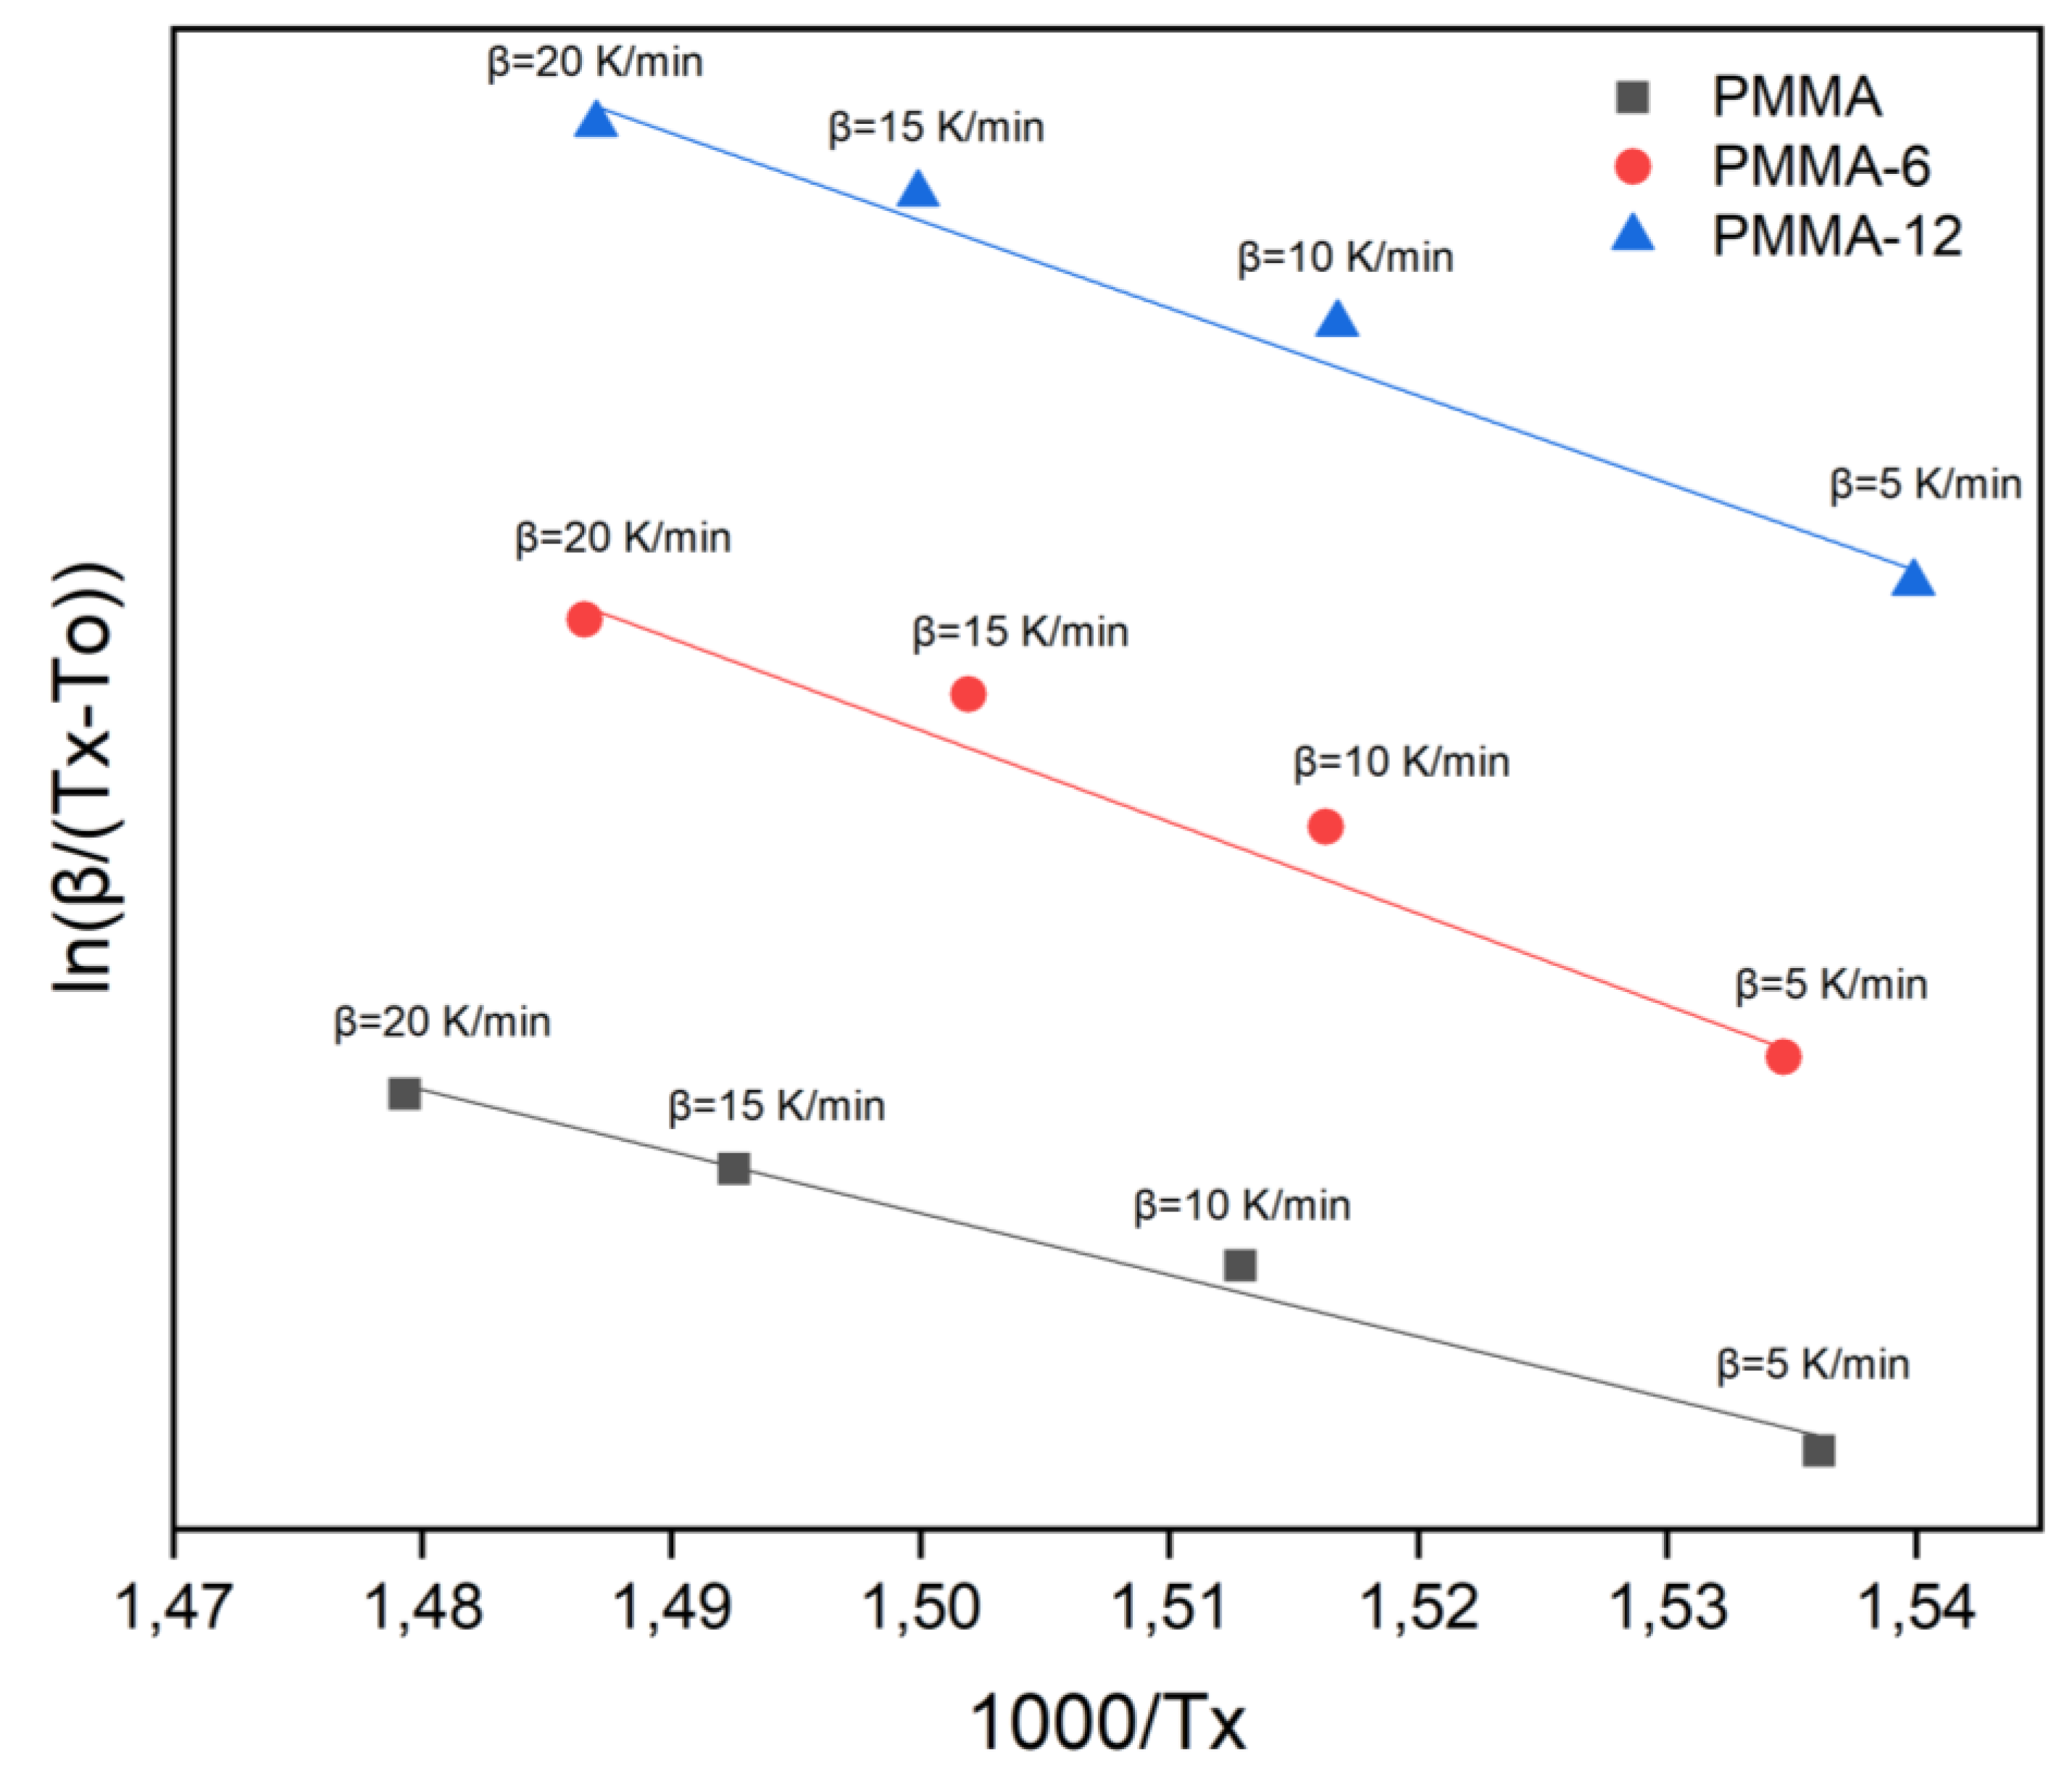

Table 1.
Thermal analysis results of PMMA and NiO/PMMA nanocomposites obtained by DTA.
| Samples | Temp. Rate β (K/min) | To (K) |
Tx (K) |
A | Ax | ΔT (Tx-To) (K) |
| PMMA | 5 | 627 | 651 | 266 | 213 | 24 |
| 10 | 593 | 661 | 279 | 164 | 68 | |
| 15 | 595 | 670 | 311 | 132 | 75 | |
| 20 | 597 | 676 | 281 | 80,2 | 79 | |
| PMMA-6 | 5 | 594 | 652 | 332 | 276 | 58 |
| 10 | 604 | 660 | 310 | 201 | 56 | |
| 15 | 611 | 666 | 321 | 161 | 55 | |
| 20 | 615 | 673 | 292 | 109 | 58 | |
| PMMA-12 | 5 | 570 | 649 | 346 | 286 | 79 |
| 10 | 590 | 659 | 316 | 194 | 69 | |
| 15 | 597 | 667 | 323 | 148 | 70 | |
| 20 | 598 | 673 | 380 | 128 | 75 |
Table 2.
Activation energies calculated from the values of the samples as a result of DTA.
| Samples | Avrami Parameter | Kissinger Method (Kj/Mol) | Takhor Method (Kj/Mol) |
Augis-Bennett Method (Kj/Mol) |
|---|---|---|---|---|
| PMMA | 1 | 189 | 200 | 162 |
| PMMA-6 | 1 | 230 | 241 | 241 |
| PMMA-12 | 1 | 207 | 218 | 230 |
Table 3.
Activation energies of NiO/PMMA nanocomposites and literature values for pure PMMA.
| System / Study | Mixing Time | Activation Energy (kJ/mol) | Notes |
| This Work (PMMA + NiO Nanocomposites) | 6 min | 230 | Higher dispersion, improved thermal stability |
| This Work (PMMA + NiO Nanocomposites) | 12 min | 210–220 | Agglomeration, reduced stability |
| Pure PMMA (in CO₂, inert atmosphere) [29]. | – | ~206 | Average Ea using isoconversional methods in CO₂ flow |
| Pure PMMA (radical polymerization) [30]. | – | ~200 | Two-step degradation under inert conditions |
| Pure PMMA (oxidative/air atmosphere) [31]. | – | 158.5 / 214.8 | Oxidative degradation—two mechanisms reported |
1 Reported literature values vary depending on the degradation atmosphere, experimental method, and conversion model used; the comparisons here are provided for general reference only.
Disclaimer/Publisher’s Note: The statements, opinions and data contained in all publications are solely those of the individual author(s) and contributor(s) and not of MDPI and/or the editor(s). MDPI and/or the editor(s) disclaim responsibility for any injury to people or property resulting from any ideas, methods, instructions or products referred to in the content. |
© 2025 by the authors. Licensee MDPI, Basel, Switzerland. This article is an open access article distributed under the terms and conditions of the Creative Commons Attribution (CC BY) license (http://creativecommons.org/licenses/by/4.0/).
Copyright: This open access article is published under a Creative Commons CC BY 4.0 license, which permit the free download, distribution, and reuse, provided that the author and preprint are cited in any reuse.


