
Submitted:
16 September 2025
Posted:
17 September 2025
You are already at the latest version
Abstract
The 15-minute city (15MC) model has gained increasing attention as a framework for promoting sustainable urban living by ensuring that essential services and infrastructures, including urban green spaces (UGS), are accessible within short walking or cycling distances. UGS play a vital role in public health, social interaction, and environmental resilience, yet questions remain about how equitably they are distributed and accessed in cities. This study assesses proximity and accessibility to UGS in Porto, Portugal, through the lens of the 15MC. The methodology combined a GIS-based spatial analysis of walking and cycling catchments with a questionnaire survey to capture user perceptions and travel behaviors. Results show that while 84% and 100% of residents live within a 15-minute walking and cycling distance of a UGS, respectively, accessibility remains uneven. Large peripheral parks contribute significantly to provision but remain less accessible to central neighborhoods, and cycling to UGS is marginal due to fragmented and insufficient infrastructure, and residual cycling use. Subjective findings mirrored the spatial analysis, highlighting dissatisfaction with cycling conditions and only moderate satisfaction with pedestrian environments. The study emphasizes the need for integrated planning that improves local connectivity, infrastructure quality, and spatial equity to fully realize the 15MC vision.
Keywords:
Active mobility
; Sustainable urban planning
; Urban greening
; Urban mobility
1. Introduction
The 15-minute city (15MC) has emerged as a transformative model for sustainable and equitable urban development, emphasizing accessibility to essential services within a short timeframe through active transportation modes such as walking and cycling [1,2]. Proposed by Carlos Moreno in 2016 [3], the concept builds upon earlier planning paradigms, namely the: i) Clarence Perry’s neighborhood unit (1929), which defined compact residential neighborhoods where the proximity between services and homes fostered a sense of community belonging [4]; and ii) Ebenezer Howard’s garden city model (1898), which aimed to create livable, mixed-use communities that merged the urbanism of the city with the greenery of the countryside [5,6]. The 15MC relies on principles of urban proximity, densification, diversification, and digitalization, achieved through the spatial redistribution of six key urban functions: living, working, commerce, healthcare, education, and entertainment [3,7]. In recent years, this concept has garnered significant attention as a model for sustainable and equitable urban development, addressing two major global challenges: climate change and the COVID-19 pandemic [1,2].
Walking and cycling are the primary travel modes that define the 15MC [8]. Both are free of carbon emissions, do not produce air pollutants or noise, and require minimal consumption of non-renewable resources, with limited spatial and infrastructural impact. In addition, they are active modes of transportation that offer significant health benefits by mitigating the effects of sedentary lifestyles [9,10]. The popularity of the 15MC increased substantially during the COVID-19 pandemic, which dramatically altered travel habits [11]. Fear of contagion, lockdowns, and mobility restrictions led to a marked shift toward private and active modes of transport, while demand for public transportation declined sharply [12]. In response, governments worldwide implemented measures to support active travel, such as pedestrianizing streets and expanding cycle lanes [13] thereby accelerating interest in the 15MC as urban planners sought to create self-sufficient neighborhoods where residents could meet their daily needs locally through active travel [1,14]. Cities including Barcelona, Paris, Utrecht, Montreal, Shanghai, and Melbourne, among many others, have actively pursued implementation of the 15MC model [1,2].
Urban green spaces (UGS) are considered essential amenities within the 15MC concept [15]. Their provision is part of two key urban functions (living and entertainment) and represents an ecological dimension of the 15MC that enhances urban sustainability and quality of life [3,14,16]. UGS offer a wide range of environmental, social, and economic benefits, making them vital for the development of sustainable cities [17]. Environmentally, they help regulate urban climate by mitigating the heat island effect through shade and evapotranspiration, thereby moderating temperatures and contributing to energy savings [18]. They also play a crucial role in carbon sequestration, air purification, and noise reduction, while supporting biodiversity and ecosystem services such as flood and erosion control [17,19]. Socially, UGS foster interactions and strengthen community ties by providing recreational and aesthetic value [12,16]. They also promote physical and mental well-being by encouraging exercise and reducing stress, benefits that, alongside improved environmental quality, support healthier lifestyles and overall public health [20,21]. For instance, a recent study on the role of UGS during the COVID-19 pandemic demonstrated their importance in promoting mental and physical well-being, reducing stress, and enhancing urban resilience [22]. Economically, UGS can increase property values and generate indirect savings in healthcare and energy costs [23]. These combined benefits underscore the need for equitable access to UGS, in line with the 15MC principle of ensuring active travel access to essential services, including green areas, within a short distance of residences. Ensuring such equitable and convenient access is therefore crucial for reducing social disparities and strengthening cities’ preparedness for future public health crises [22].
UGS is a component of green infrastructure that encompasses various types of spaces differing in size, structure, and use, including both formal and informal areas such as street greenery, private and public gardens, urban parks, sports grounds, cemeteries, burial sites, urban forests, road verges, and horticultural areas, among others [17,24,25]. This study focuses on public UGS, as they are free of charge, accessible to all citizens, and used for a wide range of purposes. Public UGS are defined as openly accessible areas that may include individual trees, small designed sites, or larger nature-like settings connected to built-up areas [26]. They are typically classified by size into: small green spaces, including pocket parks with less than 2 hectares (ha); medium-sized green spaces (2–10 ha); and large green spaces (>10 ha), which may be further categorized into district parks (up to 20 ha) and regional parks (>60 ha) [27,28]. While there is no universal consensus in the literature regarding the optimal size of UGS [29], the generally accepted Western standard suggests that city residents should have access to UGS of at least 2 ha located within the buffered urban built-up area [30,31]. Larger UGS (>2 ha) are particularly important due to their enhanced environmental, social, and health benefits, and are often regarded as the smallest size that people are regularly willing to visit [32,33]. There is also evidence of a positive association between UGS size and levels of physical activity [34-36]. For example, Schipperijn et al. [34] reported that green spaces between 5 and 10 ha significantly increase the likelihood of being physically active compared to smaller UGS (<1 ha). Environmentally, studies have shown that UGS under 2 ha generally lack cooling effects and may even be warmer than surrounding areas [37].
Distance to UGS is another critical parameter influencing their accessibility [38]. Research has consistently shown that shorter distances to UGS are associated with greater levels of physical activity and higher visitation frequency [30,39]. These findings align with international recommendations from the World Health Organization (WHO) [40] and the European Environment Agency, which suggest that residents should have access to UGS within a 15-minute walk, approximately 900–1,000 m [41]. Such guidelines are consistent with the principles of the 15MC, which emphasize ensuring that UGS are accessible within a short walk or cycle for all citizens, thereby promoting spatial equity, health and well-being [11]. For example, Cardinali et al. [39] found that green spaces and green corridors within 800–1,000 m were significantly associated with higher physical activity and indirect health benefits, while Ståhle [42] also proposed 1,000 m as a reasonable walking distance threshold. Proximity strongly influences visitation rates too. For instance, Grahn and Stigsdotter [38] observed that UGS within 300 m were visited an average of 2.7 times per week, whereas those at 1,000 m were visited only once weekly. Nonetheless, a recent study in three European cities reported that people often travel beyond these recommended distances, with median travel distances ranging from 1.4 to 1.9 km [34]. Several guidelines consider both size and accessibility: the WHO recommends that small UGS (0.5–1 ha) be located within 300 m of all residences, equivalent to about a 5-minute walk [43]; in Berlin, planning guidelines specify 500 m (5–10 minutes on foot) to UGS of at least 0.5 ha, and 1–1.5 km to larger UGS [44]. It should be noted, however, that optimal distances can vary depending on multiple UGS characteristics, including size, tree coverage, and available facilities.
Despite the growing interest in the 15MC as a planning model, several research gaps persist. First, the number of 15MC initiatives is continuously increasing, which makes existing overview studies quickly outdated. Consequently, there remains a significant lack of clarity about the complex global landscape of how the 15MC is defined and implemented in practice, including its strategies, tools, policy applications, and the emerging research and innovation challenges associated with its development [45]. This gap is particularly evident in Portugal, where scientific research on the 15MC remains scarce and fragmented, largely due to a delayed adoption of the concept, driven by the absence of national strategic guidelines [7]. Further, it is recognized that policymakers, urban planners, and communities must focus on concrete actions to effectively implement the 15MC model [46]. This is especially relevant for promoting urban green equity and sustainable urban development, given the persistent inequities in access to green spaces within the 15MC framework [1,47]. Furthermore, applying the 15MC as a planning tool requires considering the quality of active mobility infrastructure, often overlooked in proximity analyses, as well as local preferences, since people have diverse priorities and needs. Individuals do not perceive the built environment identically, but the role of these preferences and perceptions in the context of the 15MC has yet to be disentangled [48]. Finally, in the case of Porto, the applicability of the 15MC model remains largely underexplored [49].
To address these research gaps, this study assesses the availability and accessibility of UGS in Porto, Portugal, for both walking and cycling, through the lens of the 15MC model. Methodologically, it adopts a mixed approach that integrates objective and subjective components. The objective component consists of a Geographic Information Systems (GIS) analysis using the road network to delineate service areas around each UGS within a 15-minute travel time. The subjective component involves a questionnaire distributed to residents and commuters to capture perceptions of green space availability and the adequacy of walking and cycling conditions for accessing these spaces in the city. By combining these perspectives, the study not only addresses key gaps in the literature but also offers a practical tool to guide the implementation of the 15MC concept in Porto, identifying priority areas for improving UGS access through active travel.
2. Materials and Methods
This study adopts a mixed-methods approach to assess the availability of UGS larger than 2 ha in the city of Porto, as well as their proximity, and accessibility by walking and cycling, in line with the 15MC concept. This section describes the methodological steps undertaken in both the objective and subjective components to achieve these aims.
2.1. The Case of Porto
With 231,800 residents [50], Porto is the largest city of the North of Portugal. Its historic core, classified as a UNESCO World Heritage site, features narrow, winding streets and dense urban fabric. The city’s hilly topography and temperate Atlantic climate shape not only walking and cycling conditions, but also urban greenery. Over the last century, various studies have documented a substantial decrease (about 60%) in the city’s green areas, which have also become increasingly fragmented due to urbanization [51,52].
According to the Municipal Master Plan, and as shown in Figure 1, the city’s existing ecological system comprises: (i) publicly accessible UGS, including major parks such as Parque da Cidade (the largest in the country), riverside promenades, and smaller pocket parks dispersed across neighborhoods. The city currently has 91 publicly accessible UGS [53], totaling 233 ha.
However, when including proposed and currently parks in requalification, this figure increases to 379 ha; and ii) other green areas of ecological value (191 ha), including private properties and green spaces within public facilities (e.g., hospitals and schools). Therefore, the existing city’s ecological system sums 424 ha, corresponding to approximately 10% of the urban area. Of the 91 publicly accessible UGS, the 18 shown in Figure 1 are larger than 2 ha and were included in this study's analysis.
The infrastructure dedicated to active mobility in Porto is shown in Figure 2. It comprises the street network, which includes arterial and collector roads, as well as local access streets, and the network of bike lanes. As pedestrians and cyclists are not permitted to use arterial and collector roads, these were excluded from the analysis. Local access streets were included, as they allow pedestrian movement via sidewalks and bicycle use in traffic lanes. In recent years, the city has created bike lanes to enhance cyclist safety and comfort, connecting specific facilities, including UGS such as Parque da Cidade. However, these lanes do not yet form an integrated cycling network. Their current total length (32 km) remains significantly shorter than the length of local access roads in the city (665 km). For commuting, Porto’s population primarily relies on private motorized vehicles (55%), followed by public transport (22%). Among active modes, 22% of commuters walk, while only about 1% cycle [50]. Given this minimal cycling modal share and the current extent of infrastructure, Porto can be classified as a “starter cycling city” [10].
In terms of transport policies, Porto has been promoting active modes of travel to reduce the impact of motorized traffic, particularly in the city center. Through initiatives such as “Zonas XXI,” the city aims to enhance public spaces and encourage multimodal transport in key areas. Measures include widening sidewalks, often by removing car parking in high-footfall locations, creating pedestrian-only or shared streets in the city center, and restricting car access in certain zones. New bike lanes are being constructed to connect residential areas with major hubs, and bicycle parking facilities are being expanded.
Porto currently lacks a formal plan to adopt the 15MC framework, although the concept is already being pursued in other Portuguese cities, such as Lisbon through the project “There’s Life in My Neighbourhood” [45]. Nevertheless, this study illustrates how 15MC principles can provide a valuable analytical lens for assessing and guiding improvements in the proximity and accessibility of UGS by active modes in Porto, where comparable goals are being pursued through different planning approaches.
2.2. Objective Approach
The objective component of this study involved spatial and geostatistical analyses using GIS, specifically ArcGIS 10.5. Most geographic data were sourced from Porto’s open geodata portals (https://opendata.porto.digital, https://mapas.cm-porto.pt/). UGS were digitized as polygons by georeferencing the Porto Municipal Ecological Map against high-resolution online satellite imagery. Only publicly accessible UGS larger than 2 ha were considered, given their greater environmental, social, and health benefits. These UGS were then visited in the field to record the coordinates of all formal access points (entrances/exits). In the absence of formal entries, as in the case of open spaces, the polygon centroid was used as the trip origin.
Proximity and accessibility to UGS were assessed using the network distance method. As noted by Papadopoulos et al. [55], network analysis is the most widely used approach for evaluating accessibility within the 15MC framework, as it produces more realistic and accurate results than straight-line methods. Because mobility follows the street network rather than direct paths, network distance better reflects the actual distances people must walk or cycle to reach their destinations [56]. As previously mentioned, street network data, including walking and cycling infrastructure, were obtained from Porto’s open geodata portals. These data underwent topological validation and repair to ensure the geometry was free from errors, such as duplicate lines or segments that do not properly connect, which can lead to incomplete or inaccurate network analyses. All corrections were performed using ArcGIS’s Topology tool. Next, UGS access points and centroids were set as trip origins in ArcGIS Network Analyst. Service areas were generated using network distances to identify all locations reachable within a 15-minute walk or bike ride from each UGS. These service areas were further classified into three travel-time bands: under 5 minutes, 5–10 minutes, and 10–15 minutes. Following previous studies, travel times were calculated using average speeds of 4.5 km/h for walking [57,58] and 15 km/h for cycling [59,60]. For the street network, it was assumed that pedestrians and cyclists could use all streets except where access is explicitly prohibited, such as highways, expressways, and their associated ramps, such as the A20/VCI and its accesses.
The population living within 15-minute walking and cycling service areas was estimated using the most detailed and recent Census data (statistical tract level, 2021) [50]. In ArcGIS, service-area polygons were overlaid on statistical tracts using the “Select by Location” tool to identify those intersecting each service area. The populations of these tracts were then summed to determine the number of residents living within a 15-minute walk or bike ride of a UGS. Based on these totals, we calculated the city’s overall service-to-population ratio.
2.3. Subjective Approach
The subjective component complements the objective analysis by capturing citizens’ perceptions of green space availability and the quality of walking and cycling routes to UGS in Porto. To this end, a questionnaire was administered, an approach widely recognized as effective for assessing pedestrians’ and cyclists’ experiences with active mobility infrastructure [61]. Participation was open to individuals aged 15 and older who either reside in or commute to Porto.
The questionnaire combined single-choice, multiple-choice, ranking, and open-ended questions, structured into four main sections. The first section collected demographic information, including gender, age, education level, and place of residence. The second section asked respondents to identify the green spaces they visit in Porto, their frequency of visits, reasons for visiting, and modes of transportation used. Non-regular visitors were also invited to suggest measures that could encourage more frequent use in the future. The third and fourth sections focused on evaluating walking and cycling conditions to UGS, respectively. Participants rated these conditions on a five-point Likert scale (1 = “very bad,” 2 = “bad,” 3 = “neither bad nor good,” 4 = “good,” and 5 = “very good”). The evaluation covered attributes known to influence safety and comfort, such as infrastructure quality, traffic safety, personal security, environmental conditions, and other relevant factors [9,10].
Prior to administering the questionnaire, a pilot test was conducted with a small group to identify confusing or ambiguous wording, comprehension issues, and unclear instructions. Feedback from these participants was used to refine and improve the instrument before full deployment. The stated-preference data were then collected through an online and in-person survey administered between May 13 and August 12, 2024.
Data collection was carried out in two stages. In the first stage, the online questionnaire was disseminated via social media, university mailing lists (University of Minho and University of Porto), and QR codes displayed at UGS entrances. This format offered several advantages, including broad accessibility, the convenience for respondents to complete it at their own pace, and the potential to engage participants with strong opinions on the topic. However, older individuals are often harder to reach through online surveys [62]. To address this limitation and ensure adequate representation of older age groups, the second stage involved in-person surveys conducted in areas adjacent to UGS. In total, 18 paper surveys were collected, complementing 119 valid online responses, for a total of 137 valid questionnaires.
3. Results
3.1. Objective Evaluation
This section presents the results of the objective ArcGIS-based evaluation, assessing the accessibility of Porto’s UGS within a 15-minute walking or cycling distance and estimating the population residing within these service areas.
3.1.1. Pedestrian Accessibility to Urban Green Spaces
Pedestrian accessibility to the 18 UGS measuring ≥ 2 ha was evaluated using the Service Area tool in ArcGIS Network Analyst. Isochrone maps were generated with each UGS serving as an origin point, calculating the travel “cost” for each segment of the pedestrian network. Three benchmark travel times (5, 10, and 15 minutes) were used to delineate catchment areas. Accordingly, each network-based service area represents the portions of the street network reachable within a 5, 10, or 15-minute walk from the respective UGS. The resulting accessibility patterns are presented in Figure 3.
The results show that 74% of the urban area lies within a 15-minute walking distance of a UGS larger than 2 ha. However, as illustrated in Figure 3, accessibility varies notably across the city. In particular, some residential areas, especially in the northern sectors such as Paranhos, Bonfim, and Ramalde, as well as parts of the downtown, are located beyond a 15-minute walking distance from the nearest UGS.
To estimate the number of residents living within this range, a new spatial analysis was carried out by overlaying the pedestrian service areas with the 2021 Census blocks. The results of this analysis are shown in Table 1. The results indicate that 84% of Porto’s population lives within a 15-minute walking distance of a UGS larger than 2 ha. However, the breakdown across the three time intervals reveals significant variation. Only 14.1% of residents are within a 5-minute walk, indicating that immediate proximity to UGS is limited for most of the population. The largest share (42.4%) lives within 10–15 minutes, suggesting that access for many requires a longer walk, while 27.2% reside within 5–10 minutes, reflecting moderate accessibility. Notably, 16.3% of residents (represented by the white sectors in Figure 3) live outside the 15-minute walking service areas, a considerable proportion of the population. These findings highlight spatial inequalities in pedestrian access to UGS and underscore the need for targeted planning interventions, particularly in underserved residential areas such as Paranhos, Bonfim, and Ramalde.
3.1.2. Cycling Accessibility to Urban Green Spaces
Cycling accessibility to the 18 UGS was assessed using ArcGIS Network Analyst, considering travel times of 5, 10, and 15 minutes along the general street network. The resulting isochrone map, illustrating areas reachable by bicycle within these timeframes, is presented in Figure 4.
The analysis reveals that the entire city lies within a 15-minute cycling distance of a UGS larger than 2 ha. Notably, 76% of the urban area can access a UGS within just 5 minutes by bicycle, while only 1.7%, primarily in neighborhoods such as Paranhos, Bonfim, and Ramalde, require between 10 and 15 minutes. Compared with pedestrian access, cycling access shows markedly fewer spatial inequalities. However, these service areas were calculated using the general street network rather than dedicated cycling infrastructure. As shown in Figure 2, Porto’s bike lane network is fragmented, with only a few disconnected segments totaling 32 km, and just five UGS connected to them. Thus, it was not feasible to compute service areas based solely on dedicated cycling infrastructure. While urban areas fall within a 15-minute cycling distance of a UGS, cyclists must rely on the general road network, raising concerns about safety and comfort.
To estimate the population living within a 15-minute cycling distance of UGS, the cycling service areas were overlaid with the 2021 Census blocks. The results show that 78% of residents are within a 5-minute cycling distance of a UGS, 21.5% live within 5–10 minutes, and only 0.5% are between 10 and 15 minutes away (Table 1). Overall, cycling accessibility performs better than walking accessibility, largely due to higher travel speeds. However, as noted in subsection 2.1 and confirmed by the subjective assessment described below, cycling maintains only a marginal modal share in the city.
3.2. Subjective Evaluation
To complement the objective analysis, this section presents the results of the questionnaire survey, which was designed to capture citizens’ views on green space provision and the conditions for accessing these spaces on foot or by bicycle in Porto.
3.2.1. Sample Description
Table 2 presents the demographic profile of the participants. In total, 137 individuals participated in the questionnaire. This sample yields a confidence level of approximately 95% with a margin of error of ±8.5%, which is considered acceptable for exploratory research [61]. Most respondents were women, aged either 15–24 or 25–64 years, and were employed or studying in the city.
3.2.2. Usage of Urban Green Spaces and Preferences
Based on the questionnaire results, this section examines the frequency of visits to UGS, the main reasons for these visits, the most frequently visited spaces, and participants’ suggestions for encouraging greater future use.
When asked about visit frequency, the largest share of respondents (41.6%) reported visiting UGS weekly. Smaller proportions reported visiting daily (10.9%), every two weeks (14.6%), monthly (16.8%), or more rarely (16.1%). These figures suggest that most participants engage with UGS on a regular basis.
As shown in Table 3, walking emerged as the most frequently reported reason for visiting UGS (27%), followed by resting or relaxing (19%), spending time with friends or family (17%), and enjoying the view (13%), among others. These findings highlight the importance of UGS as spaces for physical activity, leisure, and social interaction, underscoring their multifaceted role in urban life.
According to the questionnaire, the three most frequently visited UGS in Porto are Parque da Cidade, Palácio de Cristal, and Rotunda da Boavista, which together account for 50% of all responses. These are followed by Jardim da Cordoaria, Parque do Covelo, Parque de Serralves, and Jardim Botânico, each mentioned by 5–10% of respondents. The remaining green spaces were cited by fewer than 4%, suggesting more occasional or localized use. This concentration of visits in a small number of sites points to potential disparities in proximity, accessibility, or overall attractiveness across the UGS network.
Respondents who do not visit UGS regularly (i.e., less than weekly) were also asked to identify measures that could encourage more frequent use. As shown in Table 3, the most frequently cited factor was improved proximity to green spaces (23.6%), underscoring the importance of spatial distribution and its alignment with the 15MC concept. Other commonly mentioned measures included organizing more events (16.8%) and adding facilities (14.0%), reflecting the influence of functional and social enhancements in attracting users.
3.2.3. Travel Experiences and Perceptions
This section examines the modes of transport used to reach UGS, perceived travel times, and respondents’ evaluation of walking and cycling conditions.
When considering transport modes, walking emerged as the most frequently reported option (42.3%), followed by private cars (30.0%) and public transport (20.5%). Other modes, such as cycling (2.9%), combined modes (3.6%), and alternatives like e-scooters, were reported by only a small share of respondents. Although the objective analysis showed that all residents can access a UGS within 15 minutes by bicycle, the questionnaire confirmed that cycling remains among the least used options. In contrast, walking stands out as the most common choice, even though not all areas of the city provide access to UGS within a 15-minute walk.
Regarding perceived travel times, the majority of respondents (57.7%) indicated that they can reach a UGS within 15 minutes, which aligns with the core principle of the 15MC. However, a substantial share (42.3%) reported longer travel times, highlighting challenges to the 15MC goal of equitable access to green spaces. Among respondents who walk to a UGS, 67% reported travel times of up to 15 minutes, while all those who cycle indicated travel times between 5 and 10 minutes.
Another key objective of the questionnaire was to evaluate the conditions experienced by pedestrians and cyclists when traveling to UGS. Respondents rated various attributes affecting the comfort and safety of walking and cycling using a 5-point Likert scale. To aid interpretation, a weighted average was calculated for each parameter. The assessed attributes, along with their corresponding average scores and variability, are presented in Table 4.
Overall, participants rated the walking conditions to UGS positively, with most attributes scoring slightly above 3 on a 5-point scale. Notably, environmental quality, which includes factors such as noise, fumes, and air pollution at sidewalk level, was the only attribute with an average score below 3, indicating a common concern among respondents. In contrast, traffic safety and sidewalk continuity received the highest ratings, both exceeding 3.3. Although all attributes were rated across the full 1–5 scale, the relatively low standard deviations suggest a moderate consistency in participants’ perceptions.
Regarding cycling conditions, participants rated them significantly lower than walking conditions. All cycling attributes received average scores below 3, highlighting notable limitations in the city’s cycling infrastructure and overall conditions. The lowest-rated attribute was the continuity of cycle lanes, closely followed by the availability and quality of the lanes themselves, indicating that fragmentation and inadequate infrastructure are perceived as key barriers to cycling. Bicycle parking and environmental quality received relatively higher, though still modest, ratings. Despite some variability in responses, standard deviations were relatively low, suggesting consistent perceptions among participants, particularly regarding traffic safety and cycle lane continuity.
4. Discussion
This section presents a comprehensive discussion of the findings, focusing on the results obtained with the objective and subjective evaluations and on the relationship between them along with extent to which Porto is a 15MC.
4.1. Objective Evaluation
The results from the GIS spatial analysis reveal interesting insights. Firstly, the analysis reveals that around 10% of the city surface (424 ha) is covered by green areas. Although the amount of green space in Porto has decreased by about 60% over the last century due to urbanization [51], the current figure corresponds to a ratio of 18.3 m² of green space per capita. This is well above the World Health Organization’s minimum target of 9 m² per inhabitant, yet still far from the ideal value of 50 m² per capita [63,64]. However, the ratio found in Porto is higher than the typically low values reported in southern European cities [41], exceeding those observed in other 15MC cities such as Paris, Milan, and Berlin, and comparable to values in Barcelona and Amsterdam [63,64], which are renowned for their urban livability and green infrastructure.
While the overall provision of green space in Porto appears quantitatively adequate by international standards, this metric alone does not capture how equitably or effectively these spaces are distributed or accessed within the city [65]. Therefore, the pedestrian and cycling accessibility analysis conducted in this study provides a more detailed perspective on whether the provision of UGS truly supports the principles of spatial equity and proximity, which are central to the 15MC concept. The pedestrian catchment areas revealed that 84% of residents live within a 15-minute walking distance of a UGS, a figure that aligns reasonably well with the 15MC goal. However, a substantial share (16.3%) remains outside the 15-minute threshold, particularly in the residential neighborhoods of Paranhos, Bonfim, and Ramalde. Moreover, only 14.1% of residents live within a 5-minute walk, equivalent to approximately 300 m. Some authors recommend that all residents should live within 300 m of a UGS ≥ 2 ha [66], and other studies indicate that people living within this distance visit UGS nearly three times more often than those living farther away [56]. Furthermore, as noted by Hwang et al. [67], the 15MC defines walking time limits based on people with normal mobility. However, the maximum walking distance for elderly individuals and people with disabilities tends to be shorter, leading some authors to propose the concepts of 5-minute and 10-minute cities. Notably, the 5-minute city concept has been applied in studies focusing on elderly urban residents and their accessibility to green spaces. This approach is particularly relevant in aging societies such as Portugal, which, with 23.4% of its population over 65 [50], is the second most aged country in the EU. Although Porto provides a per capita green space coverage similar to or exceeding some northern European cities, the travel distance to these spaces is relatively greater. For instance, in Berlin, approximately 59% of residents live within 300 m of a green space and 82% within 500 m [41], while in Barcelona a survey indicated that 62% of residents live within 300 m of a UGS [68]. The performance of Porto can be attributed to the presence of large UGS with peripheral locations, such as Parque da Cidade (80 ha) and Parque Oriental (20 ha), which are difficult to access on foot from the city center or most residential neighborhoods due to the distances involved. Although studies in other European cities have shown that people are willing to travel well beyond 300–500 m to reach UGS, this often leads to the use of motorized transport [69]. These findings highlight spatial inequalities in pedestrian access to UGS across the city, emphasizing the need for strategic planning interventions to improve coverage, particularly in residential areas like Paranhos, Bonfim, and Ramalde. Reducing these inequalities should be a priority, in line with SDG 11.7, which calls for universal access to safe, inclusive, and accessible green and public spaces in urban areas by 2030. Despite Porto’s compact and dense urban structure, creating new UGS and expanding existing ones, especially in residential areas currently outside catchment zones, combined with improved pedestrian infrastructure, could play a crucial role in promoting more equitable and inclusive access to green spaces.
The analysis also showed that the entire city is within a 15-minute cycling distance of a UGS, which aligns well with the principles of the 15MC. However, data from the most recent Census [50] indicate that cycling accounts for only 1% of commuting trips in Porto, confirming that bicycle use in the city remains very limited. Like many Portuguese cities, Porto can be classified as a ‘starter’ cycling city [10] or a city with low cycling maturity [70]. Unlike walking, cycling is not universally adopted, and uptake varies significantly across age and gender groups. For instance, studies show that women are less likely to cycle due to socio-cultural and safety concerns [71]. The generally low uptake in Porto likely results from a combination of interrelated factors, including fragmented cycling infrastructure, safety concerns, steep topography, and a historically car-oriented urban culture typical of southern European cities, coupled with political skepticism about cycling as a viable mode of transport [72]. As shown in Figure 2, the existing cycling infrastructure in Porto is limited both in total length and spatial coverage. The lanes along the Douro River and the Atlantic front on the western side are primarily recreational, while the central and eastern parts of the city largely lack cycling infrastructure. The absence of continuous lanes and the associated risk of sharing roads with motorized traffic are key deterrents, as highlighted in other studies in Portugal [70]. Additionally, the hilly terrain, particularly in the central and eastern areas, further reduces cycling’s attractiveness [73]. Nonetheless, Porto has significant potential to expand cycling, thanks to its compact urban form, high population density, mixed land use, and planned infrastructure, which could serve a larger share of residents [74]. To make cycling a viable mode for accessing UGS, Porto must implement a substantial shift in both culture and policy. This includes educational and communication initiatives to raise awareness and encourage behavioral change, as well as financial incentives to promote bicycle use [15]. On the infrastructure side, the municipality needs a clear and decisive commitment to prioritizing cycling, particularly by expanding the network in the central, eastern, and northern areas and providing adequate support facilities, such as secure bicycle parking near UGS and key transport nodes. These infrastructural changes should be developed in close articulation with communities, ensuring that policies are perceived as supportive rather than restrictive. This is particularly relevant given recent misinterpretations of the 15MC model, which in some public debates has been portrayed as anti-car or limiting personal freedom [75]. In reality, the 15MC framework is intended to expand opportunities for residents by integrating multiple transport modes and improving local accessibility, thereby promoting inclusive and sustainable mobility.
4.2. Subjective Evaluation
The subjective evaluation based on the questionnaire also provided valuable insights. Participants reported that they regularly visit UGS, with 42% indicating weekly visits. This visitation rate is comparable to previous studies conducted in Porto, which range from 37% to 56% [76,77], but remains lower than rates observed in Lisbon [77] or in northern European cities [78,79]. Differences in visitation frequency may be partly explained by the proximity of green spaces. For instance, in countries such as Denmark and Germany, 67% [79] and 74% [20] of residents, respectively, live within 300 meters of a UGS. Evidence suggests that individuals living within 50 meters of a UGS tend to visit it 3–4 times per week, those residing 300 meters away visit approximately 2.7 times weekly, and visits drop to just once per week at a distance of 1,000 meters [38,80].
Overall, participants value UGS for physical activity, social interaction, and contact with the surrounding landscape. Consistent with previous studies [20,80],. walking was the main reason for visiting UGS. Other frequent motives, such as relaxing, socializing, and enjoying the view, also match the literature on key drivers for using these spaces [81,82]. With few exceptions (Jardim da Cordoaria and Rotunda da Boavista), participants preferred UGS > 4 ha, which tend to offer more activities, amenities, and opportunities for events. This is consistent with literature indicating that larger green spaces are positively correlated with higher frequencies of walking, exercising, and relaxing [83].
Distance was the most frequently reported barrier to regularly visiting UGS, a challenge partly rooted in the city’s compact urban structure, which limits the availability of large green spaces. Creating a network of community or pocket parks could help provide more accessible, nearby options while also mitigating potential gentrification issues associated with large-scale parks [25,27]. Other barriers, such as the lack of events and facilities, highlight the importance of functional and social enhancements in attracting visitors. Overall, these findings underscore the need to address spatial equity, programming, and qualitative improvements in the city’s UGS.
Regarding travel experiences and perceptions, 42% of participants accessed UGS on foot. Although walking was the most preferred mode, this share is lower than reported in other studies in Portugal and abroad. For example, in Lisbon, Viebrantz and Fernandes-Jesus [81] found that at least 60% of participants usually reached parks on foot, while only 11% used a car. In Spain, 79% accessed UGS by walking [84], and in Bucharest, the figure was 50% [85]. In Porto, however, reliance on cars is higher (30%), likely due to factors such as the uneven distribution of green spaces (particularly larger ones), the persistently high use of private vehicles for daily mobility, and individual preferences. Cycling accounted for just 2.9% of access modes, slightly above local commuting averages, but remains a marginal option, far below the levels reported in other European cities [86,87].
In this study, 58% of participants reported being able to access a UGS within 15 minutes. This aligns with the objective analysis, which indicates that most residents live within a 15-minute walking or cycling distance of such spaces. Notably, this proportion is higher than in Lisbon, where only 35% of participants reported the same [81]. The difference may be explained by Porto’s smaller size and more compact urban structure.
Finally, the evaluation of pedestrian and cycling conditions for accessing UGS revealed a substantially lower perception of cycling conditions, with an average score of 2.27 on the 5-point Likert scale. Availability and continuity of cycling lanes, along with traffic safety, received the lowest ratings. This perception aligns with the objective GIS analysis, which showed the cycle lane network to be both limited in extent and discontinuous. Previous research indicates that such deficiencies not only deter cycling in general—by forcing riders onto streets, which can be intimidating [10,86], but also specifically discourage cycling to UGS [85]. The perceived lack of safety and overall poor quality of Porto’s cycling infrastructure may help explain the minimal share of cycling trips to UGS. These findings highlight the need for substantial investment in cycling infrastructure, particularly by connecting UGS to key urban hubs and residential areas. Evidence shows that cyclists prefer routes near green spaces, offering attractive landscapes and reduced exposure to pollution and noise [85]. Respondents expressed slightly higher satisfaction with pedestrian access conditions (average score of 3.19), indicating a basic adequacy for walking. However, there remains room for improvement, especially regarding sidewalk surface quality, street trees, shaded pathways, and overall environmental conditions—factors crucial for pedestrian safety and comfort [88]. These perceptions align with Madureira et al. [77], who found moderate satisfaction levels with the quantity and quality of green spaces in Porto.
4.3. Future Research and Limitations
This study provided a comprehensive assessment of access to UGS in Porto by walking and cycling within the framework of the 15MC, combining spatial analysis with a user questionnaire. Despite its contributions, some limitations highlight opportunities for future research.
First, the objective analysis did not account for the quality of UGS, such as available facilities, which can strongly influence use and visitation frequency. Similarly, the attributes influencing the safety and comfort of walking and cycling, such as slope and surface conditions, were not evaluated. Future research could integrate these qualitative factors to provide a more nuanced understanding of accessibility.
Second, the subjective evaluation relied on a relatively modest sample (137 responses), which may not fully represent the city’s population. Expanding the sample size and ensuring a balanced distribution by age, gender, and other relevant factors would enhance representativeness and the generalizability of results. Additionally, the questionnaire was conducted in spring and summer, meaning participants’ perceptions may reflect seasonal conditions rather than year-round experiences. Longitudinal studies covering different seasons and times of day would help capture temporal variations in UGS access. Further, self-reported data inherently carries the risk of biases related to individual interpretations and recall errors.
Finally, this study focused exclusively on Porto. While the methodology is reproducible, applying it in other urban contexts would allow for cross-city comparisons, identification of best practices, and insights into structural patterns that facilitate equitable and active access to UGS under the 15MC framework.
5. Conclusions
Ensuring environmental quality and urban livability requires that all residents have close and equitable access to UGS. As one of the key infrastructures that support public health, social interaction, and environmental resilience, UGS are a fundamental element of the 15MC model. This study examined proximity and accessibility to UGS in Porto through the lens of the 15MC, integrating objective spatial analysis with subjective user perceptions. The findings highlight both opportunities and challenges in achieving equitable access to UGS. While the city has relatively good spatial provision of green areas, accessibility is uneven. Large peripheral parks such as Parque da Cidade and Parque Oriental contribute significantly to overall provision but remain difficult to reach on foot from central and residential neighborhoods, reinforcing spatial inequalities. While a significant proportion of the population (84%) resides within a 15-minute walking distance of UGS, and the entire city resides within a 15-minute cycling range, these positive results are counterbalanced by notable gaps in infrastructure and spatial equity. Cycling in particular and despite the city’s compact urban structure, remains marginal due to fragmented infrastructure, safety concerns, and steep topography. Subjective perceptions mirrored the objective analysis, underscoring dissatisfaction with cycling conditions and only moderate satisfaction with pedestrian environments. These findings have important implications for urban planning in the city. Local planning instruments, such as the Municipal Master Plan, should integrate the core principles of the 15MC as part of broader spatial planning strategies aligned with sustainable development objectives. It is vital to ensure that these principles (proximity along with diversity, density, and digitalization) are implemented in a way that avoids spatially selective benefits and genuinely helps to reduce existing inequalities in access to UGS through active modes of transport. To achieve this, policy and planning efforts should focus on enhancing local connectivity, expanding existing UGS, creating new green spaces in underserved neighborhoods, and investing in safe, continuous cycling and walking green corridors that link UGS across the city. Achieving this vision requires moving beyond quantitative provision of green space towards a more holistic approach that considers spatial equity, infrastructure quality, and user perceptions. Strengthening these dimensions could ensure that UGS contribute more effectively to urban livability, inclusivity, and sustainability, in line with the goals of SDG 11.7.
Author Contributions
Conceptualization, M.J.A. and F.F.; methodology, M.J.A.; software, M.J.A.; validation, M.J.A. and F.F.; formal analysis, M.J.A.; investigation, M.J.A.; resources, M.J.A. and F.F.; data curation, M.J.A.; writing—original draft preparation, M.J.A. and F.F.; writing—review and editing, F.F.; visualization, M.J.A.; supervision, F.F. All authors have read and agreed to the published version of the manuscript.
Funding
This research received no external funding.
Data Availability Statement
The data supporting this study’s findings are available from the corresponding author upon reasonable request. Due to privacy restrictions, the data are not publicly available.
Acknowledgments
The authors gratefully acknowledge the staff from their respective organizations who contributed to this work, as well as all participants who voluntarily took part in the questionnaire survey.
Conflicts of Interest
The authors declare no conflicts of interest. The funders had no role in the design of the study; in the collection, analyses, or interpretation of data; in the writing of the manuscript; or in the decision to publish the results.
Abbreviations
The following abbreviations are used in this manuscript:
| 15MC | 15-minute city |
| GIS | Geographic Information Systems |
| SDG | Sustainable Development Goals |
| UGS | Urban Green Space |
| WHO | World Health Organization |
References
- Shakeri, S.; Motieyan, H.; Azmoodeh, M. Comparative analysis of 15-minute neighborhoods through different cumulative-based accessibility measures. GeoJournal 2024, 89. [Google Scholar] [CrossRef]
- Liu, D.; Kwan, M.; Wang, J. Developing the 15-minute city: A comprehensive assessment of the status in Hong Kong. Travel Behav. Soc. 2024, 34. [Google Scholar] [CrossRef]
- Moreno, C.; Allam, Z.; Chabaud, D.; Gall, C.; Pratlong, F. Introducing the “15-minute city”: Sustainability, resilience and place identity in future post-pandemic cities. Smart Cities 2021, 4, 93–111. [Google Scholar] [CrossRef]
- Gaglione, F.; Gargiulo, C.; Zucaro, F.; Cottrill, C. Urban accessibility in a 15-minute city: a measure in the city of Naples, Italy. Transp. Res. Proc. 2022, 60, 378–385. [Google Scholar] [CrossRef]
- Caprotti, F.; Duarte, C.; Joss, S. The 15-minute city as paranoid urbanism: Ten critical reflections. Cities 2024, 155. [Google Scholar] [CrossRef]
- Khavarian-Garmsir, A.; Sharifi, A.; Hajian Hossein Abadi, M.; Moradi, Z. From garden city to 15-minute city: A historical perspective and critical assessment. Land 2023, 12. [Google Scholar] [CrossRef]
- Pinto, B.; Chamusca, P. The 15-minute city in Portugal: Reality, aspiration, or utopia? Urban Sci. 2025, 9, 330. [Google Scholar] [CrossRef]
- Mouratidis, K. Time to challenge the 15-minute city: Seven pitfalls for sustainability, equity, livability, and spatial analysis. Cities 2024, 153, 105274. [Google Scholar] [CrossRef]
- Fonseca, F.; Ribeiro, P.; Conticelli, E.; Jabbari, M.; Papageorgiou, G.; Tondelli, S.; Ramos, R. Built environment attributes and their influence on walkability. Int. J. Sustain. Transp. 2022, 16, 660–679. [Google Scholar] [CrossRef]
- Fonseca, F.; Ribeiro, P.; Neiva, C. A planning practice method to assess the potential for cycling and to design a bicycle network in a starter cycling city in Portugal. Sustainability 2023, 15. [Google Scholar] [CrossRef]
- Iqbal, A.; Nazir, H.; Qazi, A. Exploring the 15-minutes city concept: Global challenges and opportunities in diverse urban contexts. Urban Sci. 2025, 9, 252. [Google Scholar] [CrossRef]
- Tapiador, L.; Gomez, J.; Vassallo, J. Exploring the relationship between public transport use and COVID-19 infection: A survey data analysis in Madrid Region. Sustain. Cities Soc. 2024, 104. [Google Scholar] [CrossRef]
- Hunter, R.; Akaraci, S.; Wang, R.; Reis, R.; Hallal, P.; Pentland, S.; Millett, C.; Garcia, L.; Thompson, J.; Nice, K. , et al. City mobility patterns during the COVID-19 pandemic: analysis of a global natural experiment. Lancet Public Health 2024, 9, e896–e906. [Google Scholar] [CrossRef] [PubMed]
- Akrami, M.; Sliwa, M.; Rynning, M. Walk further and access more! Exploring the 15-minute city concept in Oslo, Norway. J. Urban Mobil. 2024, 5. [Google Scholar] [CrossRef]
- Dias, C. Accessibility and availability of urban green areas within the 15-minute city scope: Lisbon case study. Universidade Nova de Lisboa, 2023.
- Jeon, Y.; Jung, S. Spatial equity of urban park distribution: Examining the floating population within urban park catchment areas in the context of the 15-minute city. Land 2024, 13. [Google Scholar] [CrossRef]
- Silva, L.; Fonseca, F.; Pires, M.; Mendes, B. SAUS: A tool for preserving urban green areas from air pollution. Urban For. Urban Green. 2019, 46. [Google Scholar] [CrossRef]
- Fonseca, F.; Silva, L.; Martins, S.; Almeida, M.; Reis, C.; Lopes, H. The role of vegetation in attenuating the urban heat island (UHI): A case study in Guimarães, Portugal. In Studies in Systems, Decision and Control, 2025; Vol. 230, pp. 497-510. [CrossRef]
- Silva, L.; Lopes, H.; Silva, J.; Reis, C.; Fonseca, F. The nexus of nature-based solutions and sustainability in cities: Vegetation’s impact on particulate matter capture and traffic noise reduction. In Studies in Systems, Decision and Control, 2025; Vol. 230, pp. 411-422. [CrossRef]
- Silva, R.; Zanocco, C. Assessing public attitudes towards urban green spaces as a heat adaptation strategy: Insights from Germany. Landsc. Urban Plan. 2024, 245, 105013. [Google Scholar] [CrossRef]
- Ma, F. Spatial equity analysis of urban green space based on spatial design network analysis (sDNA): A case study of central Jinan, China. Sustain. Cities Soc. 2020, 60. [Google Scholar] [CrossRef]
- González-Marín, A.; Garrido-Cumbrera, M. Did the COVID-19 pandemic influence access to green spaces? Results of a literature review during the first year of pandemic. Landsc. Ecol. 2024, 39. [Google Scholar] [CrossRef]
- Kolimenakis, A.; Solomou, A.; Proutsos, N.; Avramidou, E.; Korakaki, E.; Karetsos, G.; Maroulis, G.; Papagiannis, E.; Tsagkari, K. The socioeconomic welfare of urban green areas and parks; a literature review of available evidence. Sustainability 2021, 13. [Google Scholar] [CrossRef]
- Taylor, L.; Hochuli, D. Defining greenspace: Multiple uses across multiple disciplines. Landsc. Urban Plan. 2017, 158, 25–38. [Google Scholar] [CrossRef]
- Kabisch, N.; Qureshi, S.; Haase, D. Human-environment interactions in urban green spaces - A systematic review of contemporary issues and prospects for future research. Environ. Impact Assess. Rev. 2015, 50, 25–34. [Google Scholar] [CrossRef]
- Fors, H.; Molin, J.; Murphy, M.; van den Bosch, C. User participation in urban green spaces–For the people or the parks? Urban For. Urban Green. 2015, 14, 722–734. [Google Scholar] [CrossRef]
- Pinto, L.V.; Pereira, P. Relevant landscape components in a large urban green space in Oporto (Portugal). Urban For. Urban Green. 2024, 99, 128421. [Google Scholar] [CrossRef]
- Liu, Y.; Fagerholm, N.; Skov-Petersen, H.; Beery, T.; Wagner, A.; Olafsson, A. Shortcuts in urban green spaces: an analysis of incidental nature experiences associated with active mobility trips. Urban For. Urban Green. 2023, 82, 127873. [Google Scholar] [CrossRef]
- Van Den Bosch, M.; Egorov, A.; Mudu, P.; Uscila, V.; Barrdahl, M.; Kruize, H.; Kulinkina, A.; Staatsen, B.; Swart, W.; Zurlyte, I. Development of an urban green space indicator and the public health rationale. Scand. J. Public Health 2016, 44, 159–167. [Google Scholar] [CrossRef]
- Fan, P.; Xu, L.; Yue, W.; Chen, J. Accessibility of public urban green space in an urban periphery: The case of Shanghai. Landsc. Urban Plan. 2017, 165, 177–192. [Google Scholar] [CrossRef]
- Comber, A.; Brunsdon, C.; Green, E. Using a GIS-based network analysis to determine urban greenspace accessibility for different ethnic and religious groups. Landsc. Urban Plan. 2008, 86, 103–114. [Google Scholar] [CrossRef]
- Tian, Y.; Jim, C.; Wang, H. Assessing the landscape and ecological quality of urban green spaces in a compact city. Landsc. Urban Plan. 2014, 121, 97–108. [Google Scholar] [CrossRef]
- Mears, M.; Brindley, P.; Maheswaran, R.; Jorgensen, A. Understanding the socioeconomic equity of publicly accessible greenspace distribution: The example of Sheffield, UK. Geoforum 2019, 103, 126–137. [Google Scholar] [CrossRef]
- Schipperijn, J.; Bentsen, P.; Troelsen, J.; Toftager, M.; Stigsdotter, U. Associations between physical activity and characteristics of urban green space. Urban For. Urban Green. 2013, 12, 109–116. [Google Scholar] [CrossRef]
- Giles-Corti, B.; Broomhall, M.; Knuiman, M.; Collins, C.; Douglas, K.; Ng, K.; Lange, A.; Donovan, R. Increasing walking: how important is distance to, attractiveness, and size of public open space? Am. J. Prev. Med. 2005, 28, 169–176. [Google Scholar] [CrossRef]
- Kaczynski, A.; Potwarka, L.; Saelens, P. Association of park size, distance, and features with physical activity in neighborhood parks. Am. J. Public Health 2008, 98, 1451–1456. [Google Scholar] [CrossRef] [PubMed]
- Cao, X.; Onishi, A.; Chen, J.; Imura, H. Quantifying the cool island intensity of urban parks using ASTER and IKONOS data. Landsc. Urban Plan. 2010, 96, 224–231. [Google Scholar] [CrossRef]
- Grahn, P.; Stigsdotter, U. Landscape planning and stress. Urban For. Urban Green. 2003, 2, 1–18. [Google Scholar] [CrossRef]
- Cardinali, M.; Beenackers, M.; van Timmeren, A.; Pottgiesser, U. The relation between proximity to and characteristics of green spaces to physical activity and health: a multi-dimensional sensitivity analysis in four European cities. Environ. Res. 2024, 241, 117605. [Google Scholar] [CrossRef]
- World Health Organization. Healthy cities for building back better. Political statement of the WHO European Healthy Cities Network. WHO Regional Office for Europe: Copenhagen, 2021.
- Kabisch, N.; Strohbach, M.; Haase, D.; Kronenberg, J. Urban green space availability in European cities. Ecol. Indic. 2016, 70, 586–596. [Google Scholar] [CrossRef]
- Ståhle, A. More green space in a denser city: Critical relations between user experience and urban form. Urban Des. Int. 2010, 15, 47–67. [Google Scholar] [CrossRef]
- World Health Organization. Urban green spaces: A brief for action; WHO: Copenhagen, 2017. [Google Scholar]
- European Environment Agency. Who benefits from nature in cities? Social inequalities in access to urban green and blue spaces across Europe (Briefing no. 15/2021). EEA: Copenhagen, 2022.
- Büttner, B.; Seisenberger, S.; McCormick, B.; Silva, C.; Teixeira, J.; Papa, E.; Cao, M. Mapping of 15-minute city practices overview on strategies, policies and implementation in Europe and beyond. In Report from DUT’s 15-minute City Transition Pathway, Driving Urban Transitions: 2024.
- Shoina, M.; Voukkali, I.; Anagnostopoulos, A.; Papamichael, I.; Stylianou, M.; Zorpas, A. The 15-minute city concept: The case study within a neighbourhood of Thessaloniki. Waste Manag. Res. 2024, 42, 694–710. [Google Scholar] [CrossRef]
- Luo, J.; Zhai, S.; Song, G.; He, X.; Song, H.; Chen, J.; Liu, H.; Feng, Y. Assessing inequity in green space exposure toward a “15-minute city” in Zhengzhou, China: Using deep learning and urban big data. Int. J. Env. Res. Public Health 2022, 19. [Google Scholar] [CrossRef]
- Guzman, L.; Oviedo, D.; Cantillo-Garcia, V. Is proximity enough? A critical analysis of a 15-minute city considering individual perceptions. Cities 2024, 148. [Google Scholar] [CrossRef]
- Rocha, H.; Ferreira, S. Advancing sustainable urban mobility: An empirical travel time analysis of the 15-minute city model in Porto. Case Stud. Transp. Policy 2025. [Google Scholar] [CrossRef]
- Statistics Portugal. Census 2021. Statistics Portugal: Lisbon, 2021.
- Lopes, H.; Vidal, D.; Cherif, N.; Silva, L.; Remoaldo, P. Green infrastructure and its influence on urban heat island, heat risk, and air pollution: A case study of Porto (Portugal). J. Environ. Manage. 2025, 376, 124446. [Google Scholar] [CrossRef]
- Madureira, H.; Andresen, T.; Monteiro, A. Green structure and planning evolution in Porto. Urban For. Urban Green. 2011, 10, 141–149. [Google Scholar] [CrossRef]
- Marques, P.; Alves, P.; Fernandes, C.; Guilherme, F.; Gonçalves, C. Revision of the Municipal Master Plan of Porto: Biophysical Support and Environment. Ecological Structure and Biodiversity. Characterization and Diagnosis Report (in Portuguese). Municipality of Porto: Porto, 2018.
- Municipality of Porto. Municipal Master Plan of Porto. Municipality of Porto: Porto, 2021.
- Papadopoulos, E.; Sdoukopoulos, A.; Politis, I. Measuring compliance with the 15-minute city concept: State-of-the-art, major components and further requirements. Sustain. Cities Soc. 2023, 99. [Google Scholar] [CrossRef]
- Martins, B.; Pereira, A. Index for evaluation of public parks and gardens proximity based on the mobility network: A case study of Braga, Braganza and Viana do Castelo (Portugal) and Lugo and Pontevedra (Spain). Urban For. Urban Green. 2018, 34, 134–140. [Google Scholar] [CrossRef]
- Ferrer-Ortiz, C.; Marquet, O.; Mojica, L.; Vich, G. Barcelona under the 15-minute city lens: Mapping the accessibility and proximity potential based on pedestrian travel times. Smart Cities 2022, 5, 146–161. [Google Scholar] [CrossRef]
- Alves, F.; Cruz, S.; Ribeiro, A.; Silva, A.; Martins, J.; Cunha, I. Walkability index for elderly health: A proposal. Sustainability 2020, 12. [Google Scholar] [CrossRef]
- Ribeiro, P.; Fonseca, F. Students’ home-university commuting patterns: A shift towards more sustainable modes of transport. Case Stud. Transp. Policy 2022, 10, 954–964. [Google Scholar] [CrossRef]
- Goel, R.; Goodman, A.; Aldred, R.; Nakamura, R.; Tatah, L.; Garcia, L.; Zapata-Diomedi, B.; de Sa, T.; Tiwari, G.; de Nazelle, A. , et al. Cycling behaviour in 17 countries across 6 continents: levels of cycling, who cycles, for what purpose, and how far? Transp. Rev. 2022, 42, 58–81. [Google Scholar] [CrossRef]
- Fonseca, F.; Rodrigues, A.; Silva, H. Pedestrian perceptions of sidewalk paving attributes: Insights from a pilot study in Braga. Infrastructures 2025, 10. [Google Scholar] [CrossRef]
- Fonseca, F.; Papageorgiou, G.; Conticelli, E.; Jabbari, M.; Ribeiro, P.; Tondelli, S.; Ramos, R. Evaluating attitudes and preferences towards walking in two European cities. Future Transp. 2024, 4, 475–490. [Google Scholar] [CrossRef]
- Aboulnaga, M.; Ashour, F.; Elsharkawy, M.; Lucchi, E.; Gamal, S.; Elmarakby, A.; Haggagy, S.; Karar, N.; Khashaba, N.; Abouaiana, A. Urbanization and drivers for dual capital city: Assessment of urban planning principles and indicators for a ‘15-minute city’. Land 2025, 14, 382. [Google Scholar] [CrossRef]
- Badiu, D.; Iojă, C.; Pătroescu, M.; Breuste, J.; Artmann, M.; Niță, M.; Grădinaru, S.; Hossu, C.; Onose, D. Is urban green space per capita a valuable target to achieve cities’ sustainability goals? Romania as a case study. Ecol. Indic. 2016, 70, 53–66. [Google Scholar] [CrossRef]
- Psara, O.; Fonseca, F.; Nisiforou, O.; Ramos, R. Evaluation of urban sustainability based on transportation and green spaces: The case of Limassol, Cyprus. Sustainability 2023, 15, 10563. [Google Scholar] [CrossRef]
- Handley, J.; Pauleit, S.; Slinn, P.; Barber, A.; Baker, M.; Jones, C.; Lindley, S. Accessible natural green space standards in towns and cities: a review and toolkit for their implementation. English Nature Res. Rep. 2003, 526, 98. [Google Scholar]
- Hwang, B.; Ko, C.; Im, D.; Kang, W. Network-based assessment of urban forest and green space accessibility in six major cities: London, New York, Paris, Tokyo, Seoul, and Beijing. Urban For. Urban Green. 2025, 107, 128781. [Google Scholar] [CrossRef]
- Nieuwenhuijsen, M.; Dadvand, P.; Márquez, S.; Bartoll, X.; Barboza, E.; Cirach, M.; Borrell, C.; Zijlema, W. The evaluation of the 3-30-300 green space rule and mental health. Environ. Res. 2022, 215, 114387. [Google Scholar] [CrossRef]
- Schindler, M.; Le Texier, M.; Caruso, G. How far do people travel to use urban green space? A comparison of three European cities. Appl. Geogr. 2022, 141. [Google Scholar] [CrossRef]
- Félix, R.; Moura, F.; Clifton, K. Maturing urban cycling: Comparing barriers and motivators to bicycle of cyclists and non-cyclists in Lisbon, Portugal. J. Transp. Health 2019, 15, 100628. [Google Scholar] [CrossRef]
- Fraboni, F.; Prati, G.; Casu, G.; De Angelis, M.; Pietrantoni, L. A cluster analysis of cyclists in Europe: Common patterns, behaviours, and attitudes. Transportation 2022, 49, 591–620. [Google Scholar] [CrossRef]
- Silva, C.; Teixeira, J.; Proença, A. Revealing the cycling potential of starter cycling cities. Transp. Res. Proc. 2019, 41, 637–654. [Google Scholar] [CrossRef]
- Cruz, R.; Bandeira, J.; Vilaça, M.; Rodrigues, M.; Fernandes, J.; Coelho, M. Introducing new criteria to support cycling navigation and infrastructure planning in flat and hilly cities. Transp. Res. Proc. 2020, 47, 75–82. [Google Scholar] [CrossRef]
- Silva, C.; Teixeira, J.; Proença, A.; Bicalho, T.; Cunha, I.; Aguiar, A. Revealing the cycling potential of starter cycling cities: Usefulness for planning practice. Transp. Policy 2019, 81, 138–147. [Google Scholar] [CrossRef]
- Vlahov, D.; Kurth, A. The “15-Minute City” Concept in the Context of the COVID-19 Pandemic and Climate Change. J. Urban Health 2024, 101, 669–671. [Google Scholar] [CrossRef]
- Madureira, H.; Nunes, F.; Oliveira, J.; Cormier, L.; Madureira, T. Urban residents’ beliefs concerning green space benefits in four cities in France and Portugal. Urban For. Urban Green. 2015, 14, 56–64. [Google Scholar] [CrossRef]
- Madureira, H.; Nunes, F.; Oliveira, J.; Madureira, T. Preferences for urban green space characteristics: A comparative study in three Portuguese cities. Environments 2018, 5, 23. [Google Scholar] [CrossRef]
- Korcz, N.; Kamińska, A.; Ciesielski, M. Is the level of quality of life related to the frequency of visits to natural areas? Forests 2024, 15, 2257. [Google Scholar] [CrossRef]
- Schipperijn, J.; Ekholm, O.; Stigsdotter, U.; Toftager, M.; Bentsen, P.; Kamper-Jørgensen, F.; Randrup, T. Factors influencing the use of green space: Results from a Danish national representative survey. Landsc. Urban Plan. 2010, 95, 130–137. [Google Scholar] [CrossRef]
- Neuvonen, M.; Sievänen, T.; Tönnes, S.; Koskela, T. Access to green areas and the frequency of visits–A case study in Helsinki. Urban For. Urban Green. 2007, 6, 235–247. [Google Scholar] [CrossRef]
- Viebrantz, P.; Fernandes-Jesus, M. Visitors' perceptions of urban green spaces: A study of Lisbon's Alameda and Estrela Parks. Front. Sustain. Cities 2021, 3, 755423. [Google Scholar] [CrossRef]
- Romelli, C.; Anderson, C.; Fagerholm, N.; Hansen, R.; Albert, C. Why do people visit or avoid public green spaces? Insights from an online map-based survey in Bochum, Germany. Ecosyst. People 2025, 21, 2454252. [Google Scholar] [CrossRef]
- Gozalo, G.; Morillas, J.; González, D. Perceptions and use of urban green spaces on the basis of size. Urban For. Urban Green. 2019, 46, 126470. [Google Scholar] [CrossRef]
- Egea-Cariñanos, P.; Calaza-Martínez, P.; Roche, D.; Cariñanos, P. Uses, attitudes and perceptions of urban green spaces according to the sociodemographic profile: An exploratory analysis in Spain. Cities 2024, 150, 104996. [Google Scholar] [CrossRef]
- Stoia, N.; Niţă, M.; Popa, A.; Iojă, I. The green walk—An analysis for evaluating the accessibility of urban green spaces. Urban For. Urban Green. 2022, 75, 127685. [Google Scholar] [CrossRef]
- Žlender, V.; Thompson, C. Accessibility and use of peri-urban green space for inner-city dwellers: A comparative study. Landsc. Urban Plan. 2017, 165, 193–205. [Google Scholar] [CrossRef]
- Jalón, S.; Chiabai, A.; Mc Tague, A.; Artaza, N.; Ayala, A.; Quiroga, S.; Kruize, H.; Suárez, C.; Bell, R.; Taylor, T. Providing access to urban green spaces: A participatory benefit-cost analysis in Spain. Int. J. Env. Res. Public Health 2020, 17, 2818. [Google Scholar] [CrossRef]
- Silva, H.; Fonseca, F.; Rodrigues, A.; Palha, C. Engineering-based evaluation of sidewalk pavement materials: Implications for pedestrian safety and comfort. Int. J. Pavement Res. Technol. 2025. [Google Scholar] [CrossRef]
Figure 1.
Green ecological infrastructure of Porto. Source: Municipal Master Plan of Porto [54].
Figure 1.
Green ecological infrastructure of Porto. Source: Municipal Master Plan of Porto [54].
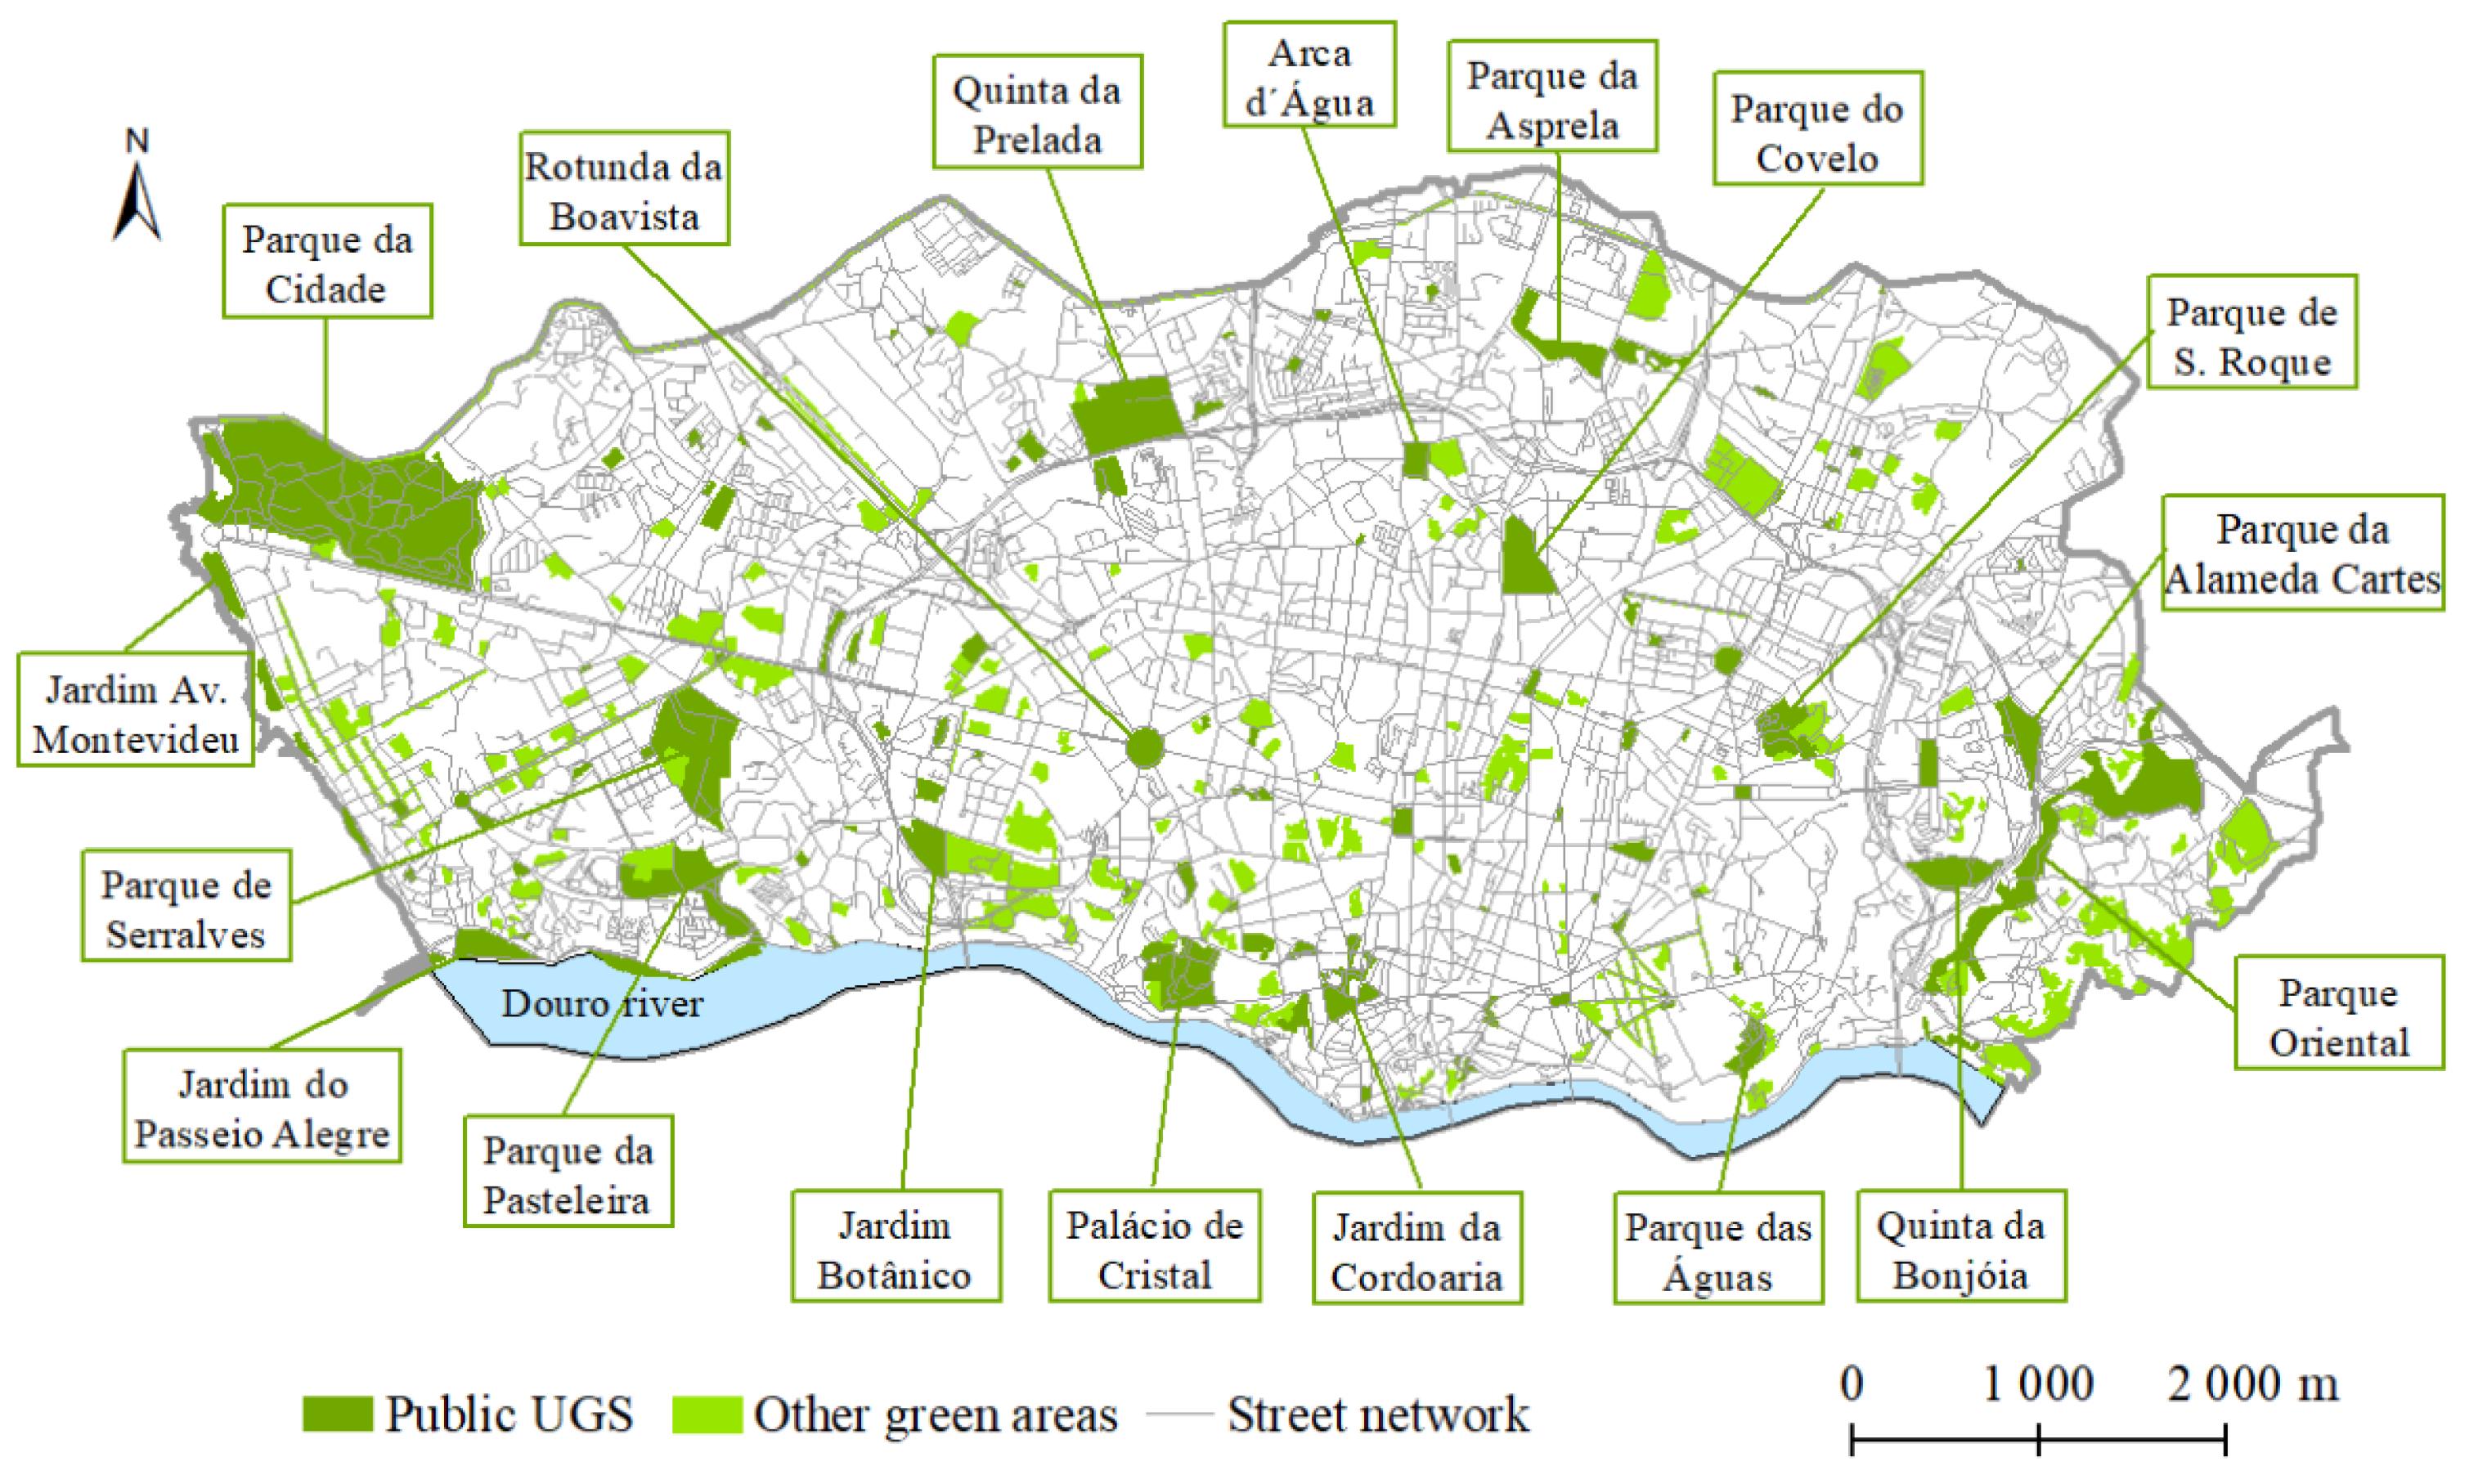
Figure 2.
Street network and cycling infrastructure in Porto. Source: Municipal Master Plan of Porto [54].
Figure 2.
Street network and cycling infrastructure in Porto. Source: Municipal Master Plan of Porto [54].
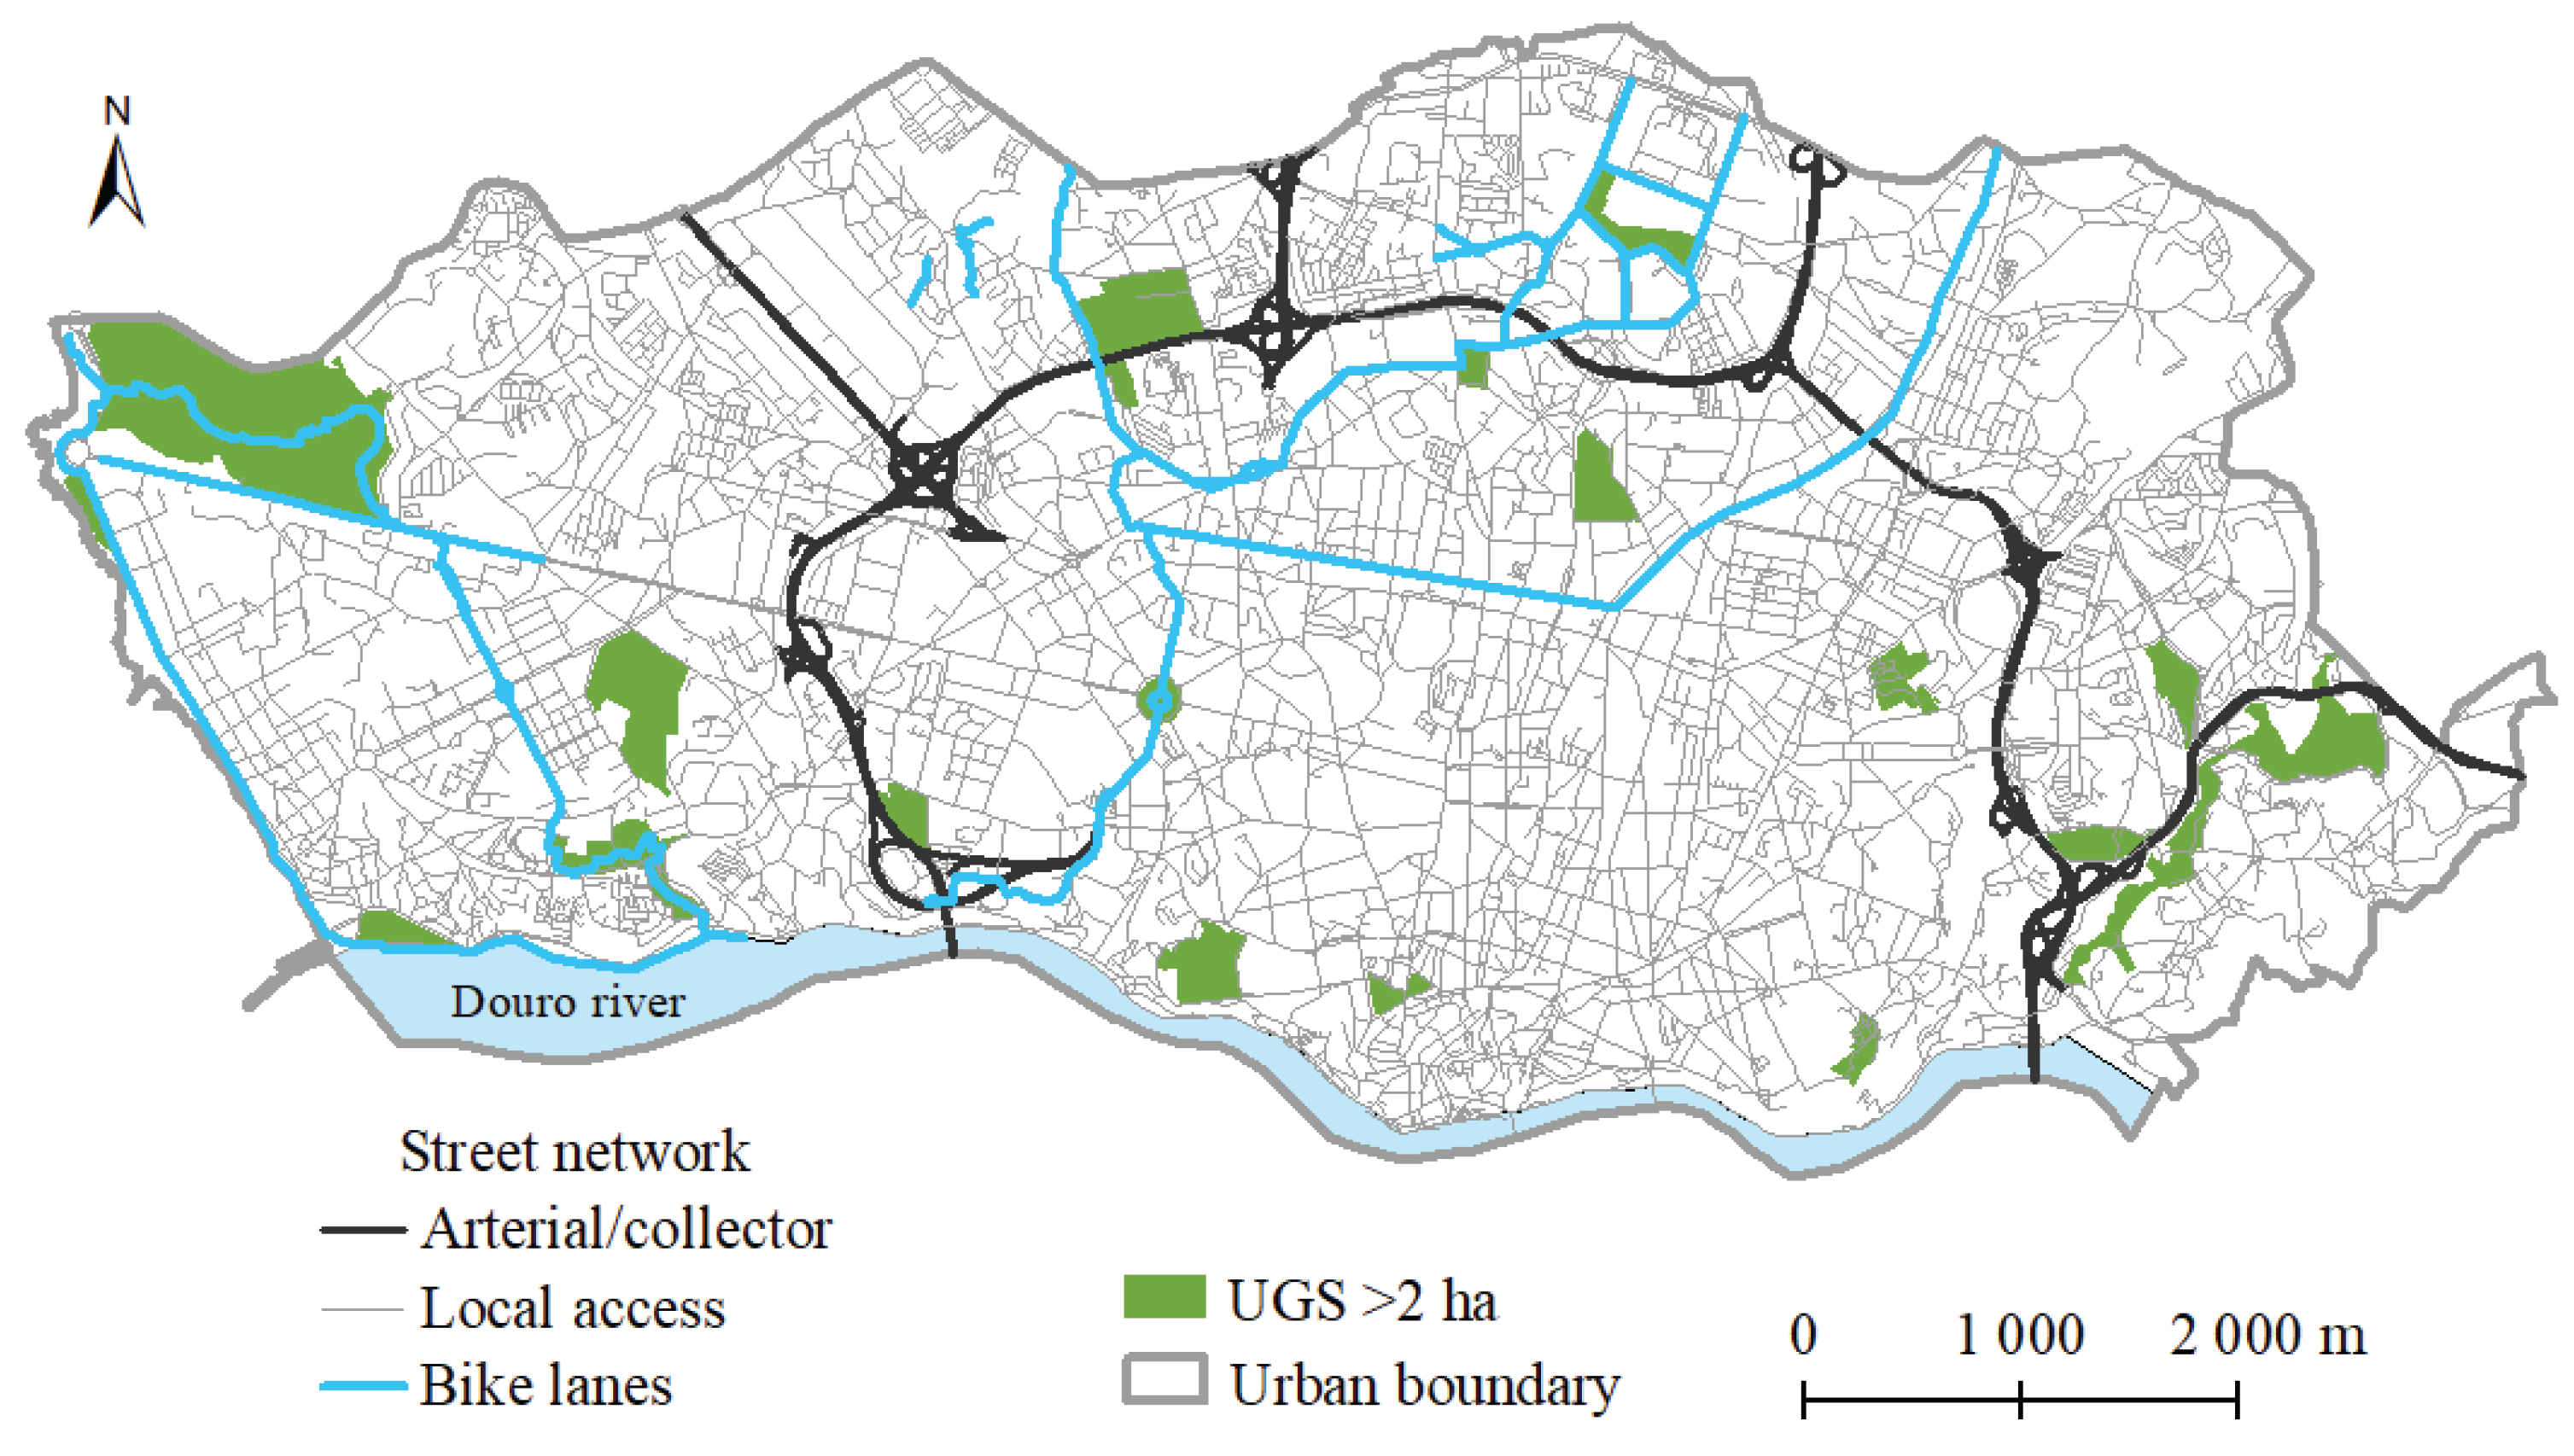
Figure 3.
15-minute walking accessibility to urban green spaces in Porto.
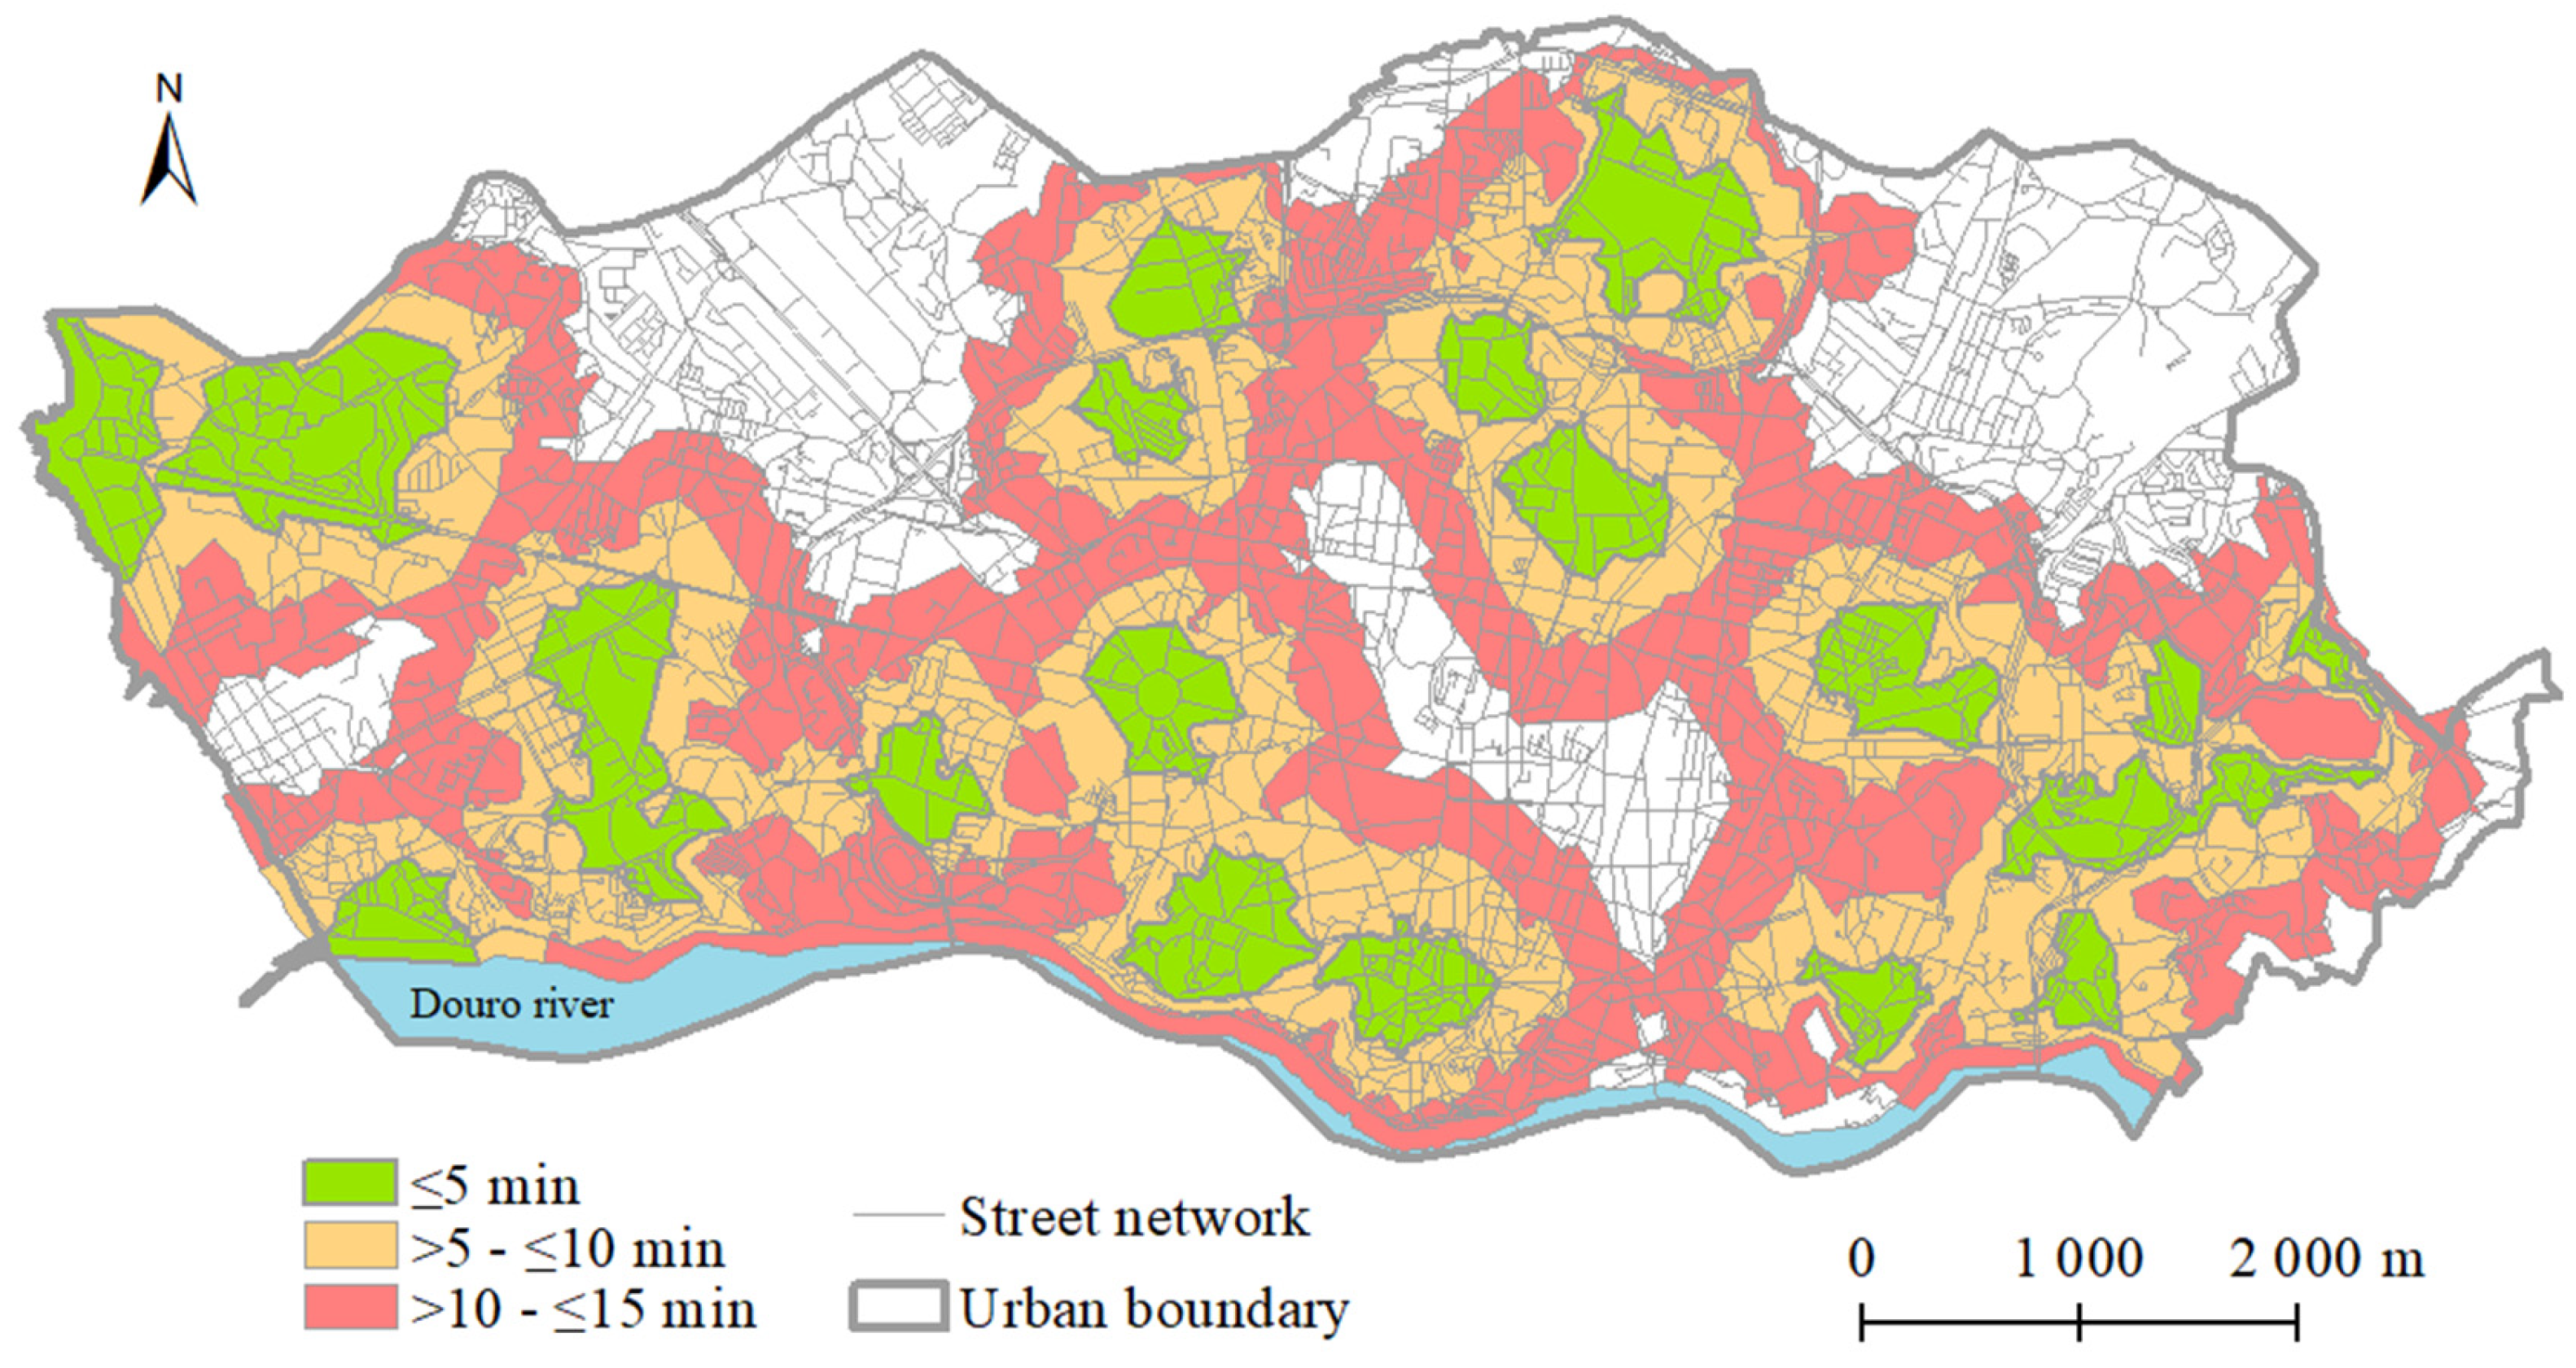
Figure 4.
15-minute cycling accessibility to urban green spaces in Porto.
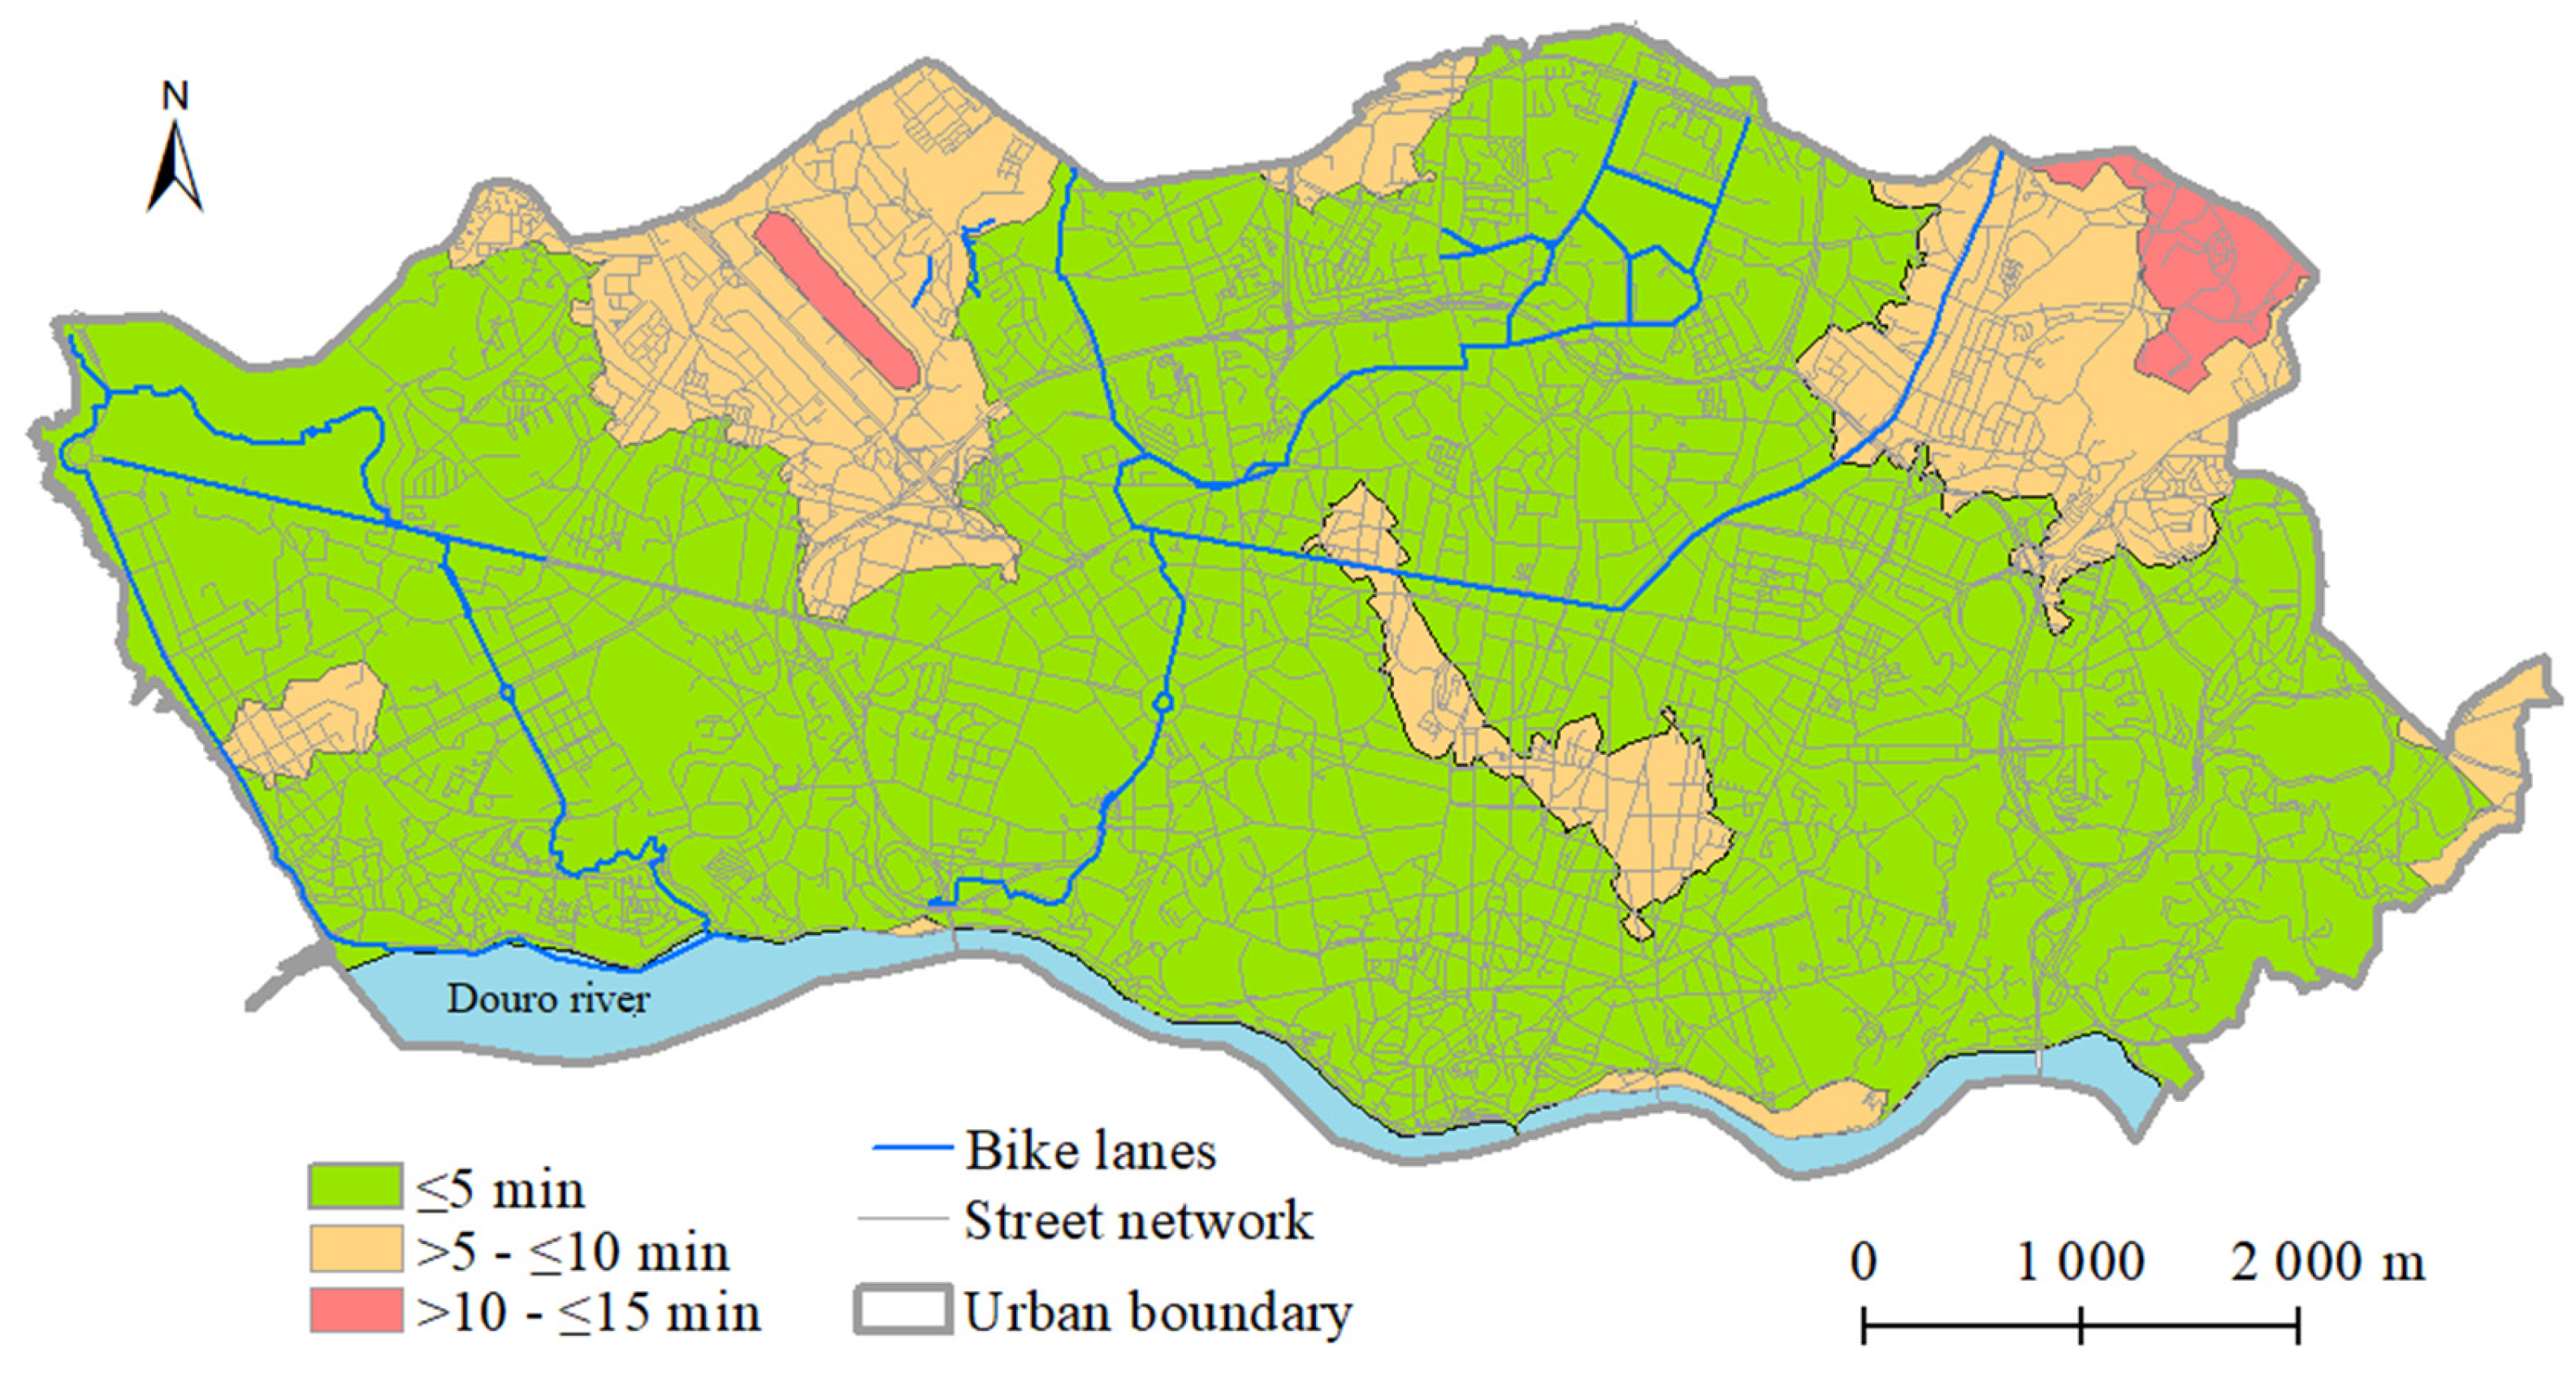

Table 1.
Percentage of residents living within 15-minute walking and cycling distance of UGS.
| Time Intervals | Walking | Cycling | ||
|---|---|---|---|---|
| Total Inhabitants | % of Total Population | Total Inhabitants | % of Total Population | |
| <5 min | 32774 | 14.1 | 180745 | 78.0 |
| 5-10 min | 63038 | 27.2 | 49886 | 21.5 |
| 10-15 min | 98230 | 42.4 | 1169 | 0.5 |
| Total | 194042 | 83.7 | 231800 | 100.0 |
Table 2.
Socio-demographic characteristics of respondents.
| Variables | Attributes | Total | Percentage |
|---|---|---|---|
| Gender | Female | 103 | 75.2 |
| Male | 34 | 24.8 | |
| Age | 15-24 | 63 | 46.0 |
| 25-64 | 55 | 40.1 | |
| 65 or more | 19 | 13.9 | |
| Activity | Employed | 66 | 48.2 |
| Student | 52 | 37.9 | |
| Retirees | 16 | 11.7 | |
| Unemployed | 3 | 2.2 |
Table 3.
Reasons for visiting green spaces and actions to increase more regular use.
| Reasons | % | Actions | % |
|---|---|---|---|
| Walking | 27.0 | Increased proximity | 27.1 |
| Resting/Relaxing | 18.6 | More events | 17.8 |
| Spending time with friends | 17.1 | Additional facilities | 14.8 |
| Enjoying the view | 12.5 | Improved maintenance | 14.4 |
| Being with nature | 11.0 | Improved access | 13.6 |
| Exercising | 5.9 | Increased safety | 12.3 |
| Walking a dog | 4.6 | ||
| Using the children’s playground | 2.8 | ||
| Other | 0.5 |
Table 4.
Evaluation of walking and cycling accessibility to urban green spaces.
| Transport Mode | Walking Attributes | Average Evaluation | Max. Score | Min. Score | SD |
|---|---|---|---|---|---|
| Walking | Sidewalk width and layout | 3.23 | 5 | 1 | 1.17 |
| Sidewalk surface quality | 3.04 | 5 | 1 | 1.08 | |
| Sidewalk continuity | 3.31 | 5 | 1 | 1.19 | |
| Connectivity with public transport | 3.26 | 5 | 1 | 1.15 | |
| Street trees and shade | 3.19 | 5 | 1 | 1.15 | |
| Traffic safety | 3.37 | 5 | 1 | 1.04 | |
| Personal security | 3.20 | 5 | 1 | 1.08 | |
| Environmental quality | 2.93 | 5 | 1 | 1.03 | |
| Cycling | Availability of cycle lanes | 2.12 | 5 | 1 | 1.09 |
| Quality of cycle lanes | 2.21 | 5 | 1 | 1.07 | |
| Continuity of cycle lanes | 2.01 | 5 | 1 | 1.00 | |
| Bicycle parking | 2.50 | 5 | 1 | 1.14 | |
| Traffic safety | 2.20 | 5 | 1 | 0.98 | |
| Environmental quality | 2.56 | 5 | 1 | 1.06 |
Disclaimer/Publisher’s Note: The statements, opinions and data contained in all publications are solely those of the individual author(s) and contributor(s) and not of MDPI and/or the editor(s). MDPI and/or the editor(s) disclaim responsibility for any injury to people or property resulting from any ideas, methods, instructions or products referred to in the content. |
© 2025 by the authors. Licensee MDPI, Basel, Switzerland. This article is an open access article distributed under the terms and conditions of the Creative Commons Attribution (CC BY) license (http://creativecommons.org/licenses/by/4.0/).
Copyright: This open access article is published under a Creative Commons CC BY 4.0 license, which permit the free download, distribution, and reuse, provided that the author and preprint are cited in any reuse.


