
Submitted:
16 September 2025
Posted:
18 September 2025
You are already at the latest version
Preprints on COVID-19 and SARS-CoV-2
Abstract
For Machine Learning (ML) analysis, we utilized a dataset comprising 226 observations with 68 clinical, biochemical, and genetic features collected from 257 patients with confirmed COVID-19 (197 with moderate-to-severe disease and 60 with mild disease). The feature set included demographic variables (age, sex), genetic markers (single-nucleotide polymorphisms (SNPs) in FGB (rs1800790), NOS3 (rs2070744), and TMPRSS2 (rs12329760)), biochemical indicators (IL-6, endothelin-1, D-dimer, fibrinogen, among others), and clinical parameters (blood pressure, body mass index, comorbidities). The target variable was disease severity. To identify the most effective predictive models for COVID-19 severity, we systematically evaluated multiple supervised learning algorithms, including logistic regression, k-nearest neighbors, decision trees, random forest, gradient boosting, bagging, naïve Bayes, and support vector machines. Model performance was assessed using accuracy and the area under the receiver operating characteristic curve (AUC-ROC). Among the predictors, IL-6, presence of depression/pneumonia, LDL cholesterol, AST, platelet count, lymphocyte count, and ALT showed the strongest correlations with severity. The highest predictive accuracy, with negligible error rates, was achieved by ensemble-based models such as ExtraTreesClassifier, HistGradientBoostingClassifier, BaggingClassifier, and GradientBoostingClassifier. Notably, decision tree models demonstrated high classification precision at terminal nodes, many of which yielded a 100% probability for a specific severity class.
Keywords:
COVID-19
; machine learning models/artificial intelligence
; classifiers
; correlations
; accuracy
1. Introduction
The coronavirus disease 2019 (COVID-19) pandemic, caused by severe acute respiratory syndrome coronavirus 2 (SARS-CoV-2), has resulted in substantial morbidity, mortality, and profound socioeconomic disruption worldwide. COVID-19 elicits an immune–inflammatory response of variable severity, ranging from asymptomatic infection to acute respiratory failure and death [1,2]. While the respiratory system remains the most frequent site of early manifestations, accumulating evidence indicates that SARS-CoV-2 can affect multiple organ systems. Consequently, the heterogeneity in symptom severity translates into diverse health, economic, and societal consequences [3,4].
One of the most pressing areas of contemporary research in infectious diseases is the prediction of infection risk and mortality associated with COVID-19, as well as the development of classification models to stratify patients on the basis of their clinical profiles [5,6]. Accurate prediction of disease severity is critical for optimizing clinical care, ensuring appropriate allocation of hospital resources, prioritizing patients at highest risk, and supporting physicians in making timely, evidence-based decisions that improve outcomes [7]. Recent studies have highlighted numerous patient-related factors—including demographic, clinical, immunological, hematological, biochemical, and radiological variables—that may assist clinicians in predicting disease severity and mortality [8]. Increasingly, research has focused on designing novel screening methods for infected patients across different stages of disease to uncover associations between clinical features and the likelihood of adverse outcomes [9,10].
Machine learning (ML), as an emerging paradigm, has the potential to enhance policy development, forecasting, screening, drug discovery, and risk stratification. Artificial intelligence (AI) can support equitable decision-making by minimizing inter-observer variability and bridging the gap between healthcare demands and human workload [11]. In medical diagnostics, AI-driven approaches such as fuzzy logic, genetic algorithms, decision trees, support vector machines, artificial neural networks, and deep learning have gained popularity for identifying, classifying, and assessing a wide spectrum of health conditions [12,13]. ML has already demonstrated clinical utility in diverse fields, including diabetes [14], cardiovascular disease [15], cancer [16,17], sepsis [18], and depression [19], yielding favorable results. Moreover, ML has been employed for diagnostic and prognostic modeling in COVID-19 with encouraging findings [20,21,22].
Current evidence underscores that AI- and ML-based methods may play a pivotal role in mitigating the impact of SARS-CoV-2 on population health and life expectancy. Traditional manual risk assessments of disease severity and mortality, based on initial screening and laboratory testing, remain challenging and subject to human bias [23,24,25,26,27,28]. Although several prognostic models have been proposed for early identification of high-risk COVID-19 patients, a critical gap persists in the development of interpretable ML algorithms and high-performance quantitative systems capable of isolating the most selective prognostic biomarkers of mortality. Identifying and prioritizing individuals at elevated risk is crucial both for effective resource planning and for optimizing therapeutic strategies [29].
2. Materials and Methods
The study methodology comprised the following sequential stages:
1. Data acquisition and preprocessing — construction of the feature set, imputation of missing values, and reduction of redundancy through the elimination of highly correlated variables.
2. Correlation analysis — application of statistical methods to assess associations among variables and preliminary selection of the most relevant predictors of COVID-19 severity.
3. Model development and testing — implementation of multiple machine learning classification algorithms, including ensemble methods, naïve Bayes, logistic regression, and others, to address the multiclass classification task of COVID-19 severity.
4. Model optimization and feature importance assessment — hyperparameter tuning of classifiers and estimation of each variable’s contribution to the final predictive decision.
5. Interpretation of results — visualization of model performance using receiver operating characteristic (ROC) curves and explanation of classification logic derived from decision tree structures.
The overall methodology is illustrated in Figure 1, which depicts the workflow and interrelationships among the analytical stages.
The adoption of this workflow not only ensured high predictive accuracy but also provided transparency of the modeling process, which is essential in clinical practice.
2.1. Data Acquisition and Preprocessing
This cohort study enrolled 257 patients with confirmed COVID-19, of whom 197 had moderate-to-severe disease and 60 presented with mild disease. For machine learning analysis, a dataset of 226 observations comprising 68 features was generated; data from 31 patients were excluded due to incompleteness identified by automated classifiers.
The mild COVID-19 group (n = 60) included non-hospitalized patients managed by primary care physicians, all with diagnoses confirmed by PCR according to established protocols. Within this group, 40.0% (n = 24) were male and 60.0% (n = 36) female, with a mean age of 56.77 ± 5.67 years. A total of 66.7% (n=40) were vaccinated and 33.3% (n = 20) unvaccinated; 20 patients were active smokers. Age and sex distribution did not significantly differ from those in the moderate-to-severe COVID-19 group (p > 0.05).
The moderate-to-severe group (n = 197) comprised hospitalized patients at the Infectious Disease Department of Uman Central City Hospital with community-acquired COVID-19 pneumonia. Of these, 21.97% (n=55) had moderate disease, while 78.03% (n = 142) had severe disease. Diagnostic evaluation, laboratory testing, and treatment adhered to the Ukrainian Ministry of Health protocols on COVID-19 management [30,31], as well as WHO, CDC, and international standards for COVID-19 diagnosis, treatment, and prevention [32].
Across both groups, patients with moderate disease did not differ significantly from those with severe disease in terms of age, systolic and diastolic blood pressure, or body mass index, although trends toward worse values were noted in the severe group. Sex distribution was balanced (97 men, 100 women); however, women were more frequently represented in the severe group, while men predominated in the moderate group by 17.45% (χ² = 4.83; p = 0.028). The proportion of unvaccinated individuals was nearly double that of vaccinated patients in both groups, with no statistically significant difference between them (χ² = 0.4; p = 0.527).
The dataset included demographic features (age, sex), genetic markers [polymorphisms in FGB, NOS3, and TMPRSS2], biochemical indicators (IL-6, endothelin-1, D-dimer, fibrinogen, among others), and clinical parameters (blood pressure, BMI, comorbidities). The target variable was disease severity, coded as a categorical variable (0 = mild, 1 = moderate, 2 = severe). The use of routine laboratory markers for COVID-19 risk stratification has been previously demonstrated [33].
The study complied with international standards of biomedical ethics, including ICH/GCP guidelines, the Declaration of Helsinki (1964), and the Council of Europe Convention on Human Rights and Biomedicine (1997), as well as national legislation. Approval was granted by the Ethics Committee of Bukovinian State Medical University (Protocol No. 7, April 2025). Written informed consent was obtained from all participants prior to enrollment.
Categorical variables included sex, vaccine type, FGB genotype, NOS3 genotype, TMPRSS2 genotype, and severity status. Missing values (< 1%) in the following variables—family history of pulmonary disease (Fam.Pulmo), family history of cardiovascular disease (Fam.Cardio), family history of collagenosis (Fam.Collagenosis), myocardial infarction (MI), comorbid nephrological pathology (Compl.Nephro), comorbid gastroenterological pathology (Compl.Gastro), and peripheral artery disease (PAD)—were imputed using median substitution.
2. Correlation Analysis
To identify interdependencies among variables and mitigate multicollinearity, thereby reducing data redundancy prior to the application of machine learning models, we performed a comprehensive correlation analysis. For continuous variables, we employed Pearson’s correlation coefficient; for categorical variables, we applied Cramér’s V coefficient, which is derived from the chi-square statistic. For mixed pairs of continuous and categorical variables, we used the correlation ratio (η), which quantifies the extent to which a continuous variable is explained by a categorical factor.
Here, SSbetween—denotes the sum of squares between groups (defined by categorical variables), SStotal—represents the total sum of squares. The value of η ranges between 0 and 1, with higher values indicating stronger dependence.
3. Model Development and Evaluation
To identify the most effective classifiers for predicting COVID-19 severity, we conducted an extensive benchmarking of all available classifiers from the Scikit-learn library under default hyperparameter settings. Model performance was assessed using two primary metrics: overall accuracy (the proportion of correctly classified samples) and the area under the receiver operating characteristic curve (AUC-ROC), which reflects the model’s discriminative ability. To ensure robust estimates, we applied stratified five-fold cross-validation, whereby the dataset was partitioned into five folds; in each iteration, the model was trained on four folds and tested on the remaining one. This process was repeated until every fold served as a test set once. Stratification preserved class proportions across folds, which was particularly critical given our imbalanced dataset, where the outcome variable Severity comprised three classes (0, 1, and 2) with 142, 54, and 30 samples, respectively.
For multiclass classification of COVID-19 severity, we constructed ROC curves using the one-vs-rest (OvR) strategy. Specifically, the target variable Severity encompassed three categories, making the task inherently multiclass. In OvR, a binary classifier is trained for each class against all others, while the alternative one-vs-one (OvO) approach trains classifiers for every pair of classes. In this study, we adopted OvR, as it is the standard approach in most of the algorithms tested and scales effectively when the number of classes is limited.
All models were evaluated under default hyperparameter settings to provide an unbiased estimate of their baseline performance. Given the pronounced class imbalance, accuracy was complemented with AUC-ROC, a more informative metric under uneven class distributions. Stratified cross-validation further ensured that all classes were proportionally represented in both training and test sets, enhancing the reliability of performance estimates.
3. Results
Correlation analysis revealed several pairs of features with high correlation coefficients (absolute values). Certain variables were excluded from further analysis for the following reasons:
Vaccine type ↔ Vaccination (r = 0.98): The strong correlation arises because vaccine type is directly linked to the vaccination status. The variable Vaccination was excluded, as Vaccine type provided more detailed information.
Lymphocytes ↔ Segmented Neutrophils (r = –0.98): The strong negative correlation reflects a well-known biological relationship, where an increase in segmented neutrophils is typically accompanied by a decrease in lymphocytes. Segmented Neutrophils was removed due to its lower clinical relevance in the context of COVID-19 severity.
LDL-C ↔ Total Cholesterol (r = 0.95): The strong correlation is expected, as LDL-C constitutes a major component of total cholesterol. LDL-C was excluded to avoid redundancy.
DBP ↔ SBP (r = 0.92): The strong correlation between diastolic (DBP) and systolic (SBP) blood pressure reflects their physiological dependence. DBP was removed because SBP carries greater prognostic value in COVID-19 outcomes.
GFR.1 ↔ GFR (r = 0.90): The strong correlation between estimated glomerular filtration rate (GFR) by Cockcroft–Gault (GFR.1) and by CKD-EPI is attributable to their near identity or duplication in the dataset. GFR.1 was removed as redundant.
Urea ↔ Creatinine (r = 0.87): Both are markers of renal function. Creatinine was retained due to its broader clinical application in estimating kidney injury (GFR).
Atherogenic Index (AI) ↔ LDL-C (r = 0.86): AI largely depends on LDL-C levels; therefore, AI was removed.
AI ↔ Total Cholesterol (r = 0.84): Similarly, AI was excluded due to dependence on total cholesterol.
Depression ↔ Pneumonia (r = 0.84): This correlation may reflect shared clinical or psychosomatic factors; however, both features were retained due to their distinct clinical significance.
LDL-C ↔ HDL-C (r = 0.80).
After excluding highly correlated variables (Vaccination, Segmented Neutrophils, LDL-C, DBP, GFR.1, AI), the dataset was optimized for machine learning analysis. The final dataset comprised 226 records and the following variables: Age (years), Sex (0 = female, 1 = male), Vaccine type (0 = unvaccinated, 1 = vaccinated, 2 = partially vaccinated, 3 = booster dose), Genetic variants: FGB (rs1800790; AA, AG, GG), NOS3 (rs2070744; CC, CT, TT), TMPRSS2 (rs12329760; CC, CT, TT), Protein concentrations: TMPRSS2 (ng/mL), Endothelin-1 (ET-1, pg/mL), Interleukin-6 (IL-6, pg/mL), BMI (kg/m²), Smoking status (0 = no, 1 = yes), Depression (0 = no, 1 = yes), Prothrombin index (PI, %), Fibrinogen (g/L), D-dimer (µg/mL), Triglycerides (mmol/L), ALT (U/L), AST (U/L), GFR (mL/min/1.73 m²), Lymphocytes (%), Platelet count (×10⁹/L), Severity of COVID-19 (0 = mild, 1 = moderate, 2 = severe).
To examine the associations between the target variable Severity (disease severity) and the predictor variables, an additional association analysis was performed. The lower-triangular correlation matrix, summarizing relationships across all variables, is presented in Figure 2. A correlation threshold of 0.80 was applied to identify strongly collinear pairs. The analysis revealed no variable pairs exceeding this threshold, indicating the absence of substantial multicollinearity among the predictors.
Associations between the target variable Severity and each predictor were analyzed separately and are summarized in Table 1. The table is ranked by the absolute value of the correlation coefficient, enabling the identification of variables exerting the strongest influence on disease severity.
The strongest correlations with the target variable Severity were observed for IL-6 (0.838), Depression (0.739), LDL-H (0.663), AST (0.663), Platelets (–0.628), Lymphocytes (0.627), and ALT (0.612). These findings highlight the relevance of inflammatory markers (IL-6), mental health status (depression), lipid profile (LDL-H, triglycerides), liver enzymes (AST, ALT), and hematological parameters (lymphocytes, platelets) in shaping the severity of COVID-19.
Moderate correlations were identified for Fibrinogen (0.329), BMI (0.324), D-dimer (0.319), and TMPRSS2 (0.253), indicating a less pronounced yet still notable association with disease severity.
By contrast, weak correlations were observed for Smoking (–0.206), Age (0.176), Vaccination (–0.169), ET-1 (0.142), as well as for the genetic markers (FGB, TMPRSS2, NOS3) and Sex, suggesting only minor contributions to severity variance. The variable PI,% showed virtually no correlation with the target (–0.002).
To systematically evaluate predictive performance, the entire spectrum of classifiers was tested, including logistic regression, k-nearest neighbors, decision trees, ensemble methods (random forest, gradient boosting, bagging), naïve Bayes, and support vector machines. Model performance was assessed using 5-fold stratified cross-validation, and the top 10 classifiers ranked by accuracy are presented below.
The predictive performance of the models was systematically assessed using 5-fold stratified cross-validation. The results for the top ten classifiers ranked by overall accuracy are summarized in Table 2.
Best-performing models: The highest predictive accuracy was achieved with the ExtraTreesClassifier (Accuracy: 0.974 ± 0.022), an ensemble method based on decision trees with additional randomization. Its superior performance can be attributed to its capacity to efficiently capture complex, non-linear relationships within the dataset. This finding is consistent with the correlation analysis, in which variables such as IL-6, depression, and LDL-C demonstrated strong associations with disease severity. The Random Forest Classifier and Histogram-based Gradient Boosting Classifier also yielded high accuracies (0.960), underscoring the utility of ensemble methods in this predictive context.
Model stability: Algorithms with lower standard deviations, including Logistic RegressionCV (0.934 ± 0.020) and Linear Discriminant Analysis (0.929 ± 0.029), exhibited more stable performance across folds. This consistency is particularly advantageous when working with relatively small or imbalanced clinical datasets.
AUC-ROC performance: All of the top 10 models achieved an apparently perfect AUC-ROC value (1.000), suggesting excellent class discrimination. However, such uniformly high values may also reflect potential overfitting or limited variability within the cross-validation folds. Independent external validation is therefore essential to confirm the robustness of these findings.
Simpler models: Notably, more parsimonious algorithms such as Bernoulli Naïve Bayes (0.956 ± 0.037) and the Decision Tree Classifier (0.938 ± 0.043) performed well despite their relative simplicity. Naïve Bayes classifiers are particularly effective in scenarios where predictor variables are approximately independent, whereas decision trees capture non-linear dependencies but may be less stable due to sensitivity to noise.
Recommendations: Ensemble-based approaches, particularly the ExtraTreesClassifier, RandomForestClassifier, and HistGradientBoostingClassifier, emerge as the most promising candidates for further hyperparameter optimization, given their combination of high accuracy and resilience to data noise. Logistic RegressionCV also warrants consideration owing to its stability and interpretability, both of which are highly relevant in clinical decision-making contexts.
Feature importance analysis, derived via permutation importance, enabled the identification of key predictors of COVID-19 severity. The normalized importances for each model are visualized in Figure 3 as a heatmap, illustrating the relative contribution of each variable to model performance.
Analysis of normalized feature importance (Figure 3) revealed the following:
- Most influential predictors:
- IL-6: Consistently emerged as the single most important feature across all classifiers, with normalized importance values of ~1.0. This is concordant with its strong correlation with severity (r = 0.838), reinforcing its central role as a systemic inflammatory marker in COVID-19 pathogenesis.
- Depression: Assigned high importance by several models, including BernoulliNB (1.0), CalibratedClassifierCV (1.0), BaggingClassifier (0.632), ExtraTreesClassifier (0.683), and DecisionTreeClassifier (0.555). This finding mirrors its correlation coefficient (r = 0.739) and underscores the psychosomatic contribution of depression to disease progression.
- Lymphocytes: Particularly important for the HistGradientBoostingClassifier (1.0), RandomForestClassifier (0.581), CalibratedClassifierCV (0.623), and ExtraTreesClassifier (0.554), aligning with its correlation (r = 0.627) with severity.
- LDL-C, AST, ALT, and triglycerides: These biochemical indicators demonstrated moderate-to-high importance in ensemble methods such as RandomForestClassifier (0.480–0.687) and ExtraTreesClassifier (0.308–0.340), consistent with their correlations (0.663, 0.663, 0.612, and 0.602, respectively).
- Platelets: Retained predictive value in RandomForestClassifier (0.197), ExtraTreesClassifier (0.219), and CalibratedClassifierCV (0.038), in agreement with its negative correlation with severity (r = –0.628).
- Less influential predictors:
- Sex, vaccination status, and genetic markers (FGB, NOS3, TMPRSS2), PI%: These variables had minimal or no importance in most models, reflecting their weak correlations with severity (<0.1). For instance, sex contributed marginal importance (0.008–0.025) in only a few classifiers, while genetic variants often showed zero contribution.
- Age and BMI: Despite a moderate correlation for BMI (r = 0.324), both features demonstrated low importance (0.0–0.067), suggesting that their effects may be mediated through other covariates.
- Fibrinogen, D-dimer, ET-1, and GFR: These markers displayed modest importance in some ensemble models (e.g., RandomForestClassifier, ExtraTreesClassifier), but their contributions were consistently lower than those of IL-6 or depression.
- Model-specific patterns:
- Ensemble methods (ExtraTreesClassifier, RandomForestClassifier, BaggingClassifier) captured a broad spectrum of influential features, reflecting their ability to model non-linear interactions. For example, RandomForestClassifier assigned substantial weight to LDL-C (0.480), AST (0.510), and triglycerides (0.298).
- HistGradientBoostingClassifier focused almost exclusively on IL-6 (0.828) and lymphocytes (1.0), which may reflect either strong regularization or sensitivity to class imbalance.
- BernoulliNB and CalibratedClassifierCV prioritized depression (1.0), likely due to their sensitivity to categorical or binary predictors.
- LogisticRegressionCV and Linear Discriminant Analysis emphasized a narrower set of variables (IL-6, lymphocytes, depression), consistent with their linear structure and more limited capacity to account for complex feature interactions.
Negative feature importance. Some models, such as BernoulliNB (Sex: –0.0098) and Linear Discriminant Analysis (Age, yo: –0.0077, TMPRSS2: –0.0077), demonstrated negative feature importance for certain variables. This phenomenon may indicate that shuffling these predictors slightly improves model performance, which is uncommon and may be related to noise in the dataset or the weak contribution of these variables.
Figure 4 presents a decision tree constructed to predict the probability of COVID-19 outcomes. The primary predictor at the root node is the interleukin-6 (IL-6) level. Subsequent branching is determined by clinical and biochemical parameters such as alanine aminotransferase (ALT), lymphocyte count (Lympho), depressive status (Depress), fibrinogen concentration, glomerular filtration rate (GFR), and the genetic marker (Gene N). Each node of the tree displays the splitting condition, the target class (0—negative outcome, 1—positive outcome, 2—recovery or mild course), probability, and the number of samples within the node. For example, when IL-6 ≤ 54.72 pg/ml, the presence of depression emerges as the next critical factor, followed by lymphocyte levels. Conversely, when IL-6 > 54.72 pg/ml, the decisive variable becomes ALT, suggesting hepatic involvement in the disease process.
The tree demonstrates a high degree of classification accuracy at terminal nodes, with the majority showing 100% probability of a specific class. This underscores the importance of multiparametric analysis in predicting the course of COVID-19.
4. Discussion
In this study, a comprehensive approach was applied to analyze the interplay between genetic, biochemical, clinical, and demographic features of COVID-19 patients and disease severity. The primary objective was to identify the most informative predictors, construct accurate machine learning models for severity prediction, and develop interpretable solutions applicable in clinical practice. A review of recent publications [34] indicates the increasing adoption of ML approaches in COVID-19 research since 2020.
Strong positive correlations identified in our analysis (IL-6, Depression, LDL-H, AST) suggest that elevated levels of these markers are associated with increased severity, while negative correlations for Platelets and GFR indicate reductions in these parameters during severe COVID-19 [35]. The impact of IL-6,-reactive protein (CRP), and procalcitonin on clinical status has also been investigated in previous studies [36].
Moderate correlations observed for Fibrinogen, BMI, D-dimer, and TMPRSS2 may highlight their secondary role in COVID-19 progression, particularly through coagulation pathways (Fibrinogen, D-dimer) and metabolic processes (BMI).
By contrast, weak correlations for Smoking, Age, Vaccination, ET-1, as well as genetic markers (FGB, TMPRSS2, NOS3) and Sex, suggest a limited impact on disease severity in this dataset. Notably, the negative correlation of Vaccination may indicate a potential protective effect, albeit weak. The absence of contribution for PI, % (zero correlation) further supports its minimal relevance in severity prediction. These findings emphasize the importance of inflammatory biomarkers, liver enzymes, and hematological indicators for severity assessment, whereas genetic markers and demographic factors, such as sex and vaccination status, appear less influential in the current cohort.
The critical role of immunological markers is consistent with findings from other studies [37], where IL-6, LDL-H, and lymphocyte count were highlighted as key predictors. The influence of genetic markers in COVID-19 modeling has been systematically reviewed in [38]. Furthermore, laboratory markers such as ALT, AST, and platelets have demonstrated strong prognostic significance [39]. IL-6 has been identified not only as a biomarker but also as a therapeutic target [40]. AI-driven models further validate the predictive value of LDH, IL-6, and D-dimer [41]. Confirmation of our modeling strategy is supported by findings from [42], where similar biomarkers enabled robust severity prediction.
Among the ten classifiers evaluated, the decision tree represents the only model capable of providing direct visual interpretability through a hierarchical set of if–then rules. Unlike “black-box” models—such as ensemble methods that aggregate multiple trees or rely on complex computations, thereby obscuring interpretability—the decision tree offers transparent logic, allowing each step of the classification process to be traced. This feature facilitates the identification of the most influential predictors, such as IL-6, D-dimer, and Age,yo, which play a critical role in clinical decision-making. The value of explainable AI in this context is underscored by prior work [43], which successfully applied transparent interpretability frameworks in biomedical modeling.
Interpretability is particularly vital in medicine, where clinicians and researchers require not only accurate predictions but also comprehensible explanations to support informed decision-making. For example, a simple rule such as “If IL-6 > 5.0 pg/ml and Age > 50 years, then the probability of severe disease is high” provides an intuitive rationale for identifying high-risk patients and tailoring therapeutic strategies accordingly. While ensemble-based classifiers (e.g., ExtraTreesClassifier) achieved near-perfect accuracy (up to 100%), they inherently lack this explanatory transparency, rendering them less suitable for medical settings in which trust and interpretability are paramount. The decision tree, in contrast, strikes a balance between predictive accuracy (99.12%, with 224 correct classifications out of 226) and the capacity to deliver interpretable outputs, making it especially valuable for clinical applications. Importantly, our findings align with international evidence on the use of biomarkers to predict COVID-19 severity [44].
5. Conclusions
Our analysis demonstrated that the variables most strongly correlated with the target outcome Severity included IL-6, Depression/Pneumonia, LDL-H, AST, Platelets, Lymphocytes, and ALT. This highlights the central role of inflammatory markers (IL-6), clinical status (Depression/Pneumonia), lipid metabolism (LDL-H, Triglycerides), hepatic enzymes (AST, ALT), and hematological indices (Lymphocytes, Platelets) in disease progression. Positive correlations indicate that higher levels of these parameters are associated with more severe disease, whereas negative correlations for Platelets and GFR suggest a reduction in these values during severe COVID-19.
Machine learning models such as ExtraTreesClassifier, HistGradientBoostingClassifier, BaggingClassifier, and GradientBoostingClassifier achieved the highest accuracy with no classification errors, underscoring the strength of ensemble methods in capturing nonlinear dependencies and mitigating potential class imbalance. Nevertheless, among all classifiers, the decision tree remains unique in offering an interpretable, rule-based framework that complements predictive performance with clinical transparency.
Author Contributions
Conceptualization and writing—original draft preparation, M.S., L.S. and M. Sk.; writing—review and editing, Y.V., R.S., L.S. and D.M.; supervision, M.Sk., and Y.V.; project administration, M.Sk. and Y.V.; visualization, A.S, D.M.; funding acquisition, M.S. and L.S. All authors have read and agreed to the published version of the manuscript.
Funding
This research received no external funding.
Data Availability Statement
Data is contained within the article.
Conflicts of Interest
The authors declare no conflicts of interest.
Abbreviations
The following abbreviations are used in this manuscript:
| SNP | single-nucleotide polymorphisms |
| ML | machine learning |
| ROC | receiver operating characteristic |
| WHO | World Health Organization |
| CDC | Centers for Disease Control and Prevention |
| BMI | body mass index |
| IL | interleukin |
| MI | myocardial infarction |
| PAD | peripheral artery disease |
| BP | blood pressure |
| GFR | glomerular filtration rate |
| SNP | single-nucleotide polymorphisms |
| SNP | single-nucleotide polymorphisms |
References
- Chan, J.F.-W.; Yuan, S.; Chu, H.; Sridhar, S.; Yuen, K.-Y. COVID-19 drug discovery and treatment options. Nat. Rev. Microbiol. 2024, 22, 391–407. [Google Scholar] [CrossRef]
- Zhao, H.; To, K.K.W.; Lam, H.; Zhou, X.; Chan, J.F.-W.; Peng, Z.; Lee, A.C.Y.; Cai, J.; Chan, W.-M.; Ip, J.D.; et al. Cross-linking peptide and repurposed drugs inhibit both entry pathways of SARS-CoV-2. Nat. Commun. 2021, 12, 1–9. [Google Scholar] [CrossRef]
- Wu, Y.; Xu, X.; Chen, Z.; Duan, J.; Hashimoto, K.; Yang, L.; Liu, C.; Yang, C. Nervous system involvement after infection with COVID-19 and other coronaviruses. Brain, Behav. Immun. 2020, 87, 18–22. [Google Scholar] [CrossRef]
- Sokolenko, M.; Sydorchuk, L.; Sokolenko, L.; Sokolenko, A. General immunologic reactivity of patients with COVID-19 and its relation to gene polymorphism, severity of clinical course of the disease and combination with comorbidities. Medicni Perspekt. (Medical Perspect. 2024, 29, 108–117. [Google Scholar] [CrossRef]
- Chowdhury, M.E.H.; Rahman, T.; Khandakar, A.; Al-Madeed, S.; Zughaier, S.M.; Doi, S.A.R.; Hassen, H.; Islam, M.T. An Early Warning Tool for Predicting Mortality Risk of COVID-19 Patients Using Machine Learning. Cogn. Comput. 2021, 16, 1778–1793. [Google Scholar] [CrossRef]
- Nemati, M.; Ansary, J.; Nemati, N. Machine-Learning Approaches in COVID-19 Survival Analysis and Discharge-Time Likelihood Prediction Using Clinical Data. Patterns 2020, 1, 100074–100074. [Google Scholar] [CrossRef]
- Sayed, S.A.-F.; Elkorany, A.M.; Mohammad, S.S. Applying Different Machine Learning Techniques for Prediction of COVID-19 Severity. IEEE Access 2021, 9, 135697–135707. [Google Scholar] [CrossRef] [PubMed]
- Marin, B.G.; Aghagoli, G.; Lavine, K.; Yang, L.; Siff, E.J.; Chiang, S.S.; Salazar-Mather, T.P.; Dumenco, L.; Savaria, M.C.; Aung, S.N.; et al. Predictors of COVID -19 severity: A literature review. Rev. Med. Virol. 2021, 31, 1–10. [Google Scholar] [CrossRef] [PubMed]
- Gazzaruso, C.; Paolozzi, E.; Valenti, C.; Brocchetta, M.; Naldani, D.; Grignani, C.; Salvucci, F.; Marino, F.; Coppola, A.; Gallotti, P. Association between antithrombin and mortality in patients with COVID-19. A possible link with obesity. Nutr. Metab. Cardiovasc. Dis. 2020, 30, 1914–1919. [Google Scholar] [CrossRef] [PubMed]
- Malki, Z.; Atlam, E.-S.; Hassanien, A.E.; Dagnew, G.; Elhosseini, M.A.; Gad, I. Association between weather data and COVID-19 pandemic predicting mortality rate: Machine learning approaches. Chaos, Solitons Fractals 2020, 138, 110137–110137. [Google Scholar] [CrossRef]
- Lalmuanawma, S.; Hussain, J.; Chhakchhuak, L. Applications of machine learning and artificial intelligence for Covid-19 (SARS-CoV-2) pandemic: A review. Chaos, Solitons Fractals 2020, 139, 110059–110059. [Google Scholar] [CrossRef]
- Cobianchi, L.; Piccolo, D.; Dal Mas, F.; et al. Surgeons’ perspectives on artificial intelligence to support clinical decision-making in trauma and emergency contexts: results from an international survey. World J Emerg Surg 2023, 18, 1. [Google Scholar] [CrossRef] [PubMed]
- De Simone, B.; Abu-Zidan, F.M.; Saeidi, S.; Deeken, G.; Biffl, W.L.; Moore, E.E.; Sartelli, M.; Coccolini, F.; Ansaloni, L.; Di Saverio, S.; et al. Knowledge, attitudes and practices of using Indocyanine Green (ICG) fluorescence in emergency surgery: an international web-based survey in the ARtificial Intelligence in Emergency and trauma Surgery (ARIES)—WSES project. Updat. Surg. 2024, 76, 1969–1981. [Google Scholar] [CrossRef] [PubMed]
- De Silva, K.; Lee, W.K.; Forbes, A.; Demmer, R.T.; Barton, C.; Enticott, J. Use and performance of machine learning models for type 2 diabetes prediction in community settings: A systematic review and meta-analysis. Int. J. Med Informatics 2020, 143, 104268. [Google Scholar] [CrossRef] [PubMed]
- Krittanawong, C.; Virk, H.U.H.; Bangalore, S.; Wang, Z.; Johnson, K.W.; Pinotti, R.; Zhang, H.; Kaplin, S.; Narasimhan, B.; Kitai, T.; et al. Machine learning prediction in cardiovascular diseases: a meta-analysis. Sci. Rep. 2020, 10, 1–11. [Google Scholar] [CrossRef]
- Castaldo, R.; Cavaliere, C.; Soricelli, A.; Salvatore, M.; Pecchia, L.; Franzese, M. Radiomic and Genomic Machine Learning Method Performance for Prostate Cancer Diagnosis: Systematic Literature Review. J. Med Internet Res. 2021, 23, e22394. [Google Scholar] [CrossRef]
- Lu, W.; Fu, D.; Kong, X.; Huang, Z.; Hwang, M.; Zhu, Y.; Chen, L.; Jiang, K.; Li, X.; Wu, Y.; et al. FOLFOX treatment response prediction in metastatic or recurrent colorectal cancer patients via machine learning algorithms. Cancer Med. 2020, 9, 1419–1429. [Google Scholar] [CrossRef] [PubMed]
- Fleuren, L.M.; Klausch, T.L.T.; Zwager, C.L.; Schoonmade, L.J.; Guo, T.; Roggeveen, L.F.; Swart, E.L.; Girbes, A.R.J.; Thoral, P.; Ercole, A.; et al. Machine learning for the prediction of sepsis: a systematic review and meta-analysis of diagnostic test accuracy. Intensiv. Care Med. 2020, 46, 383–400. [Google Scholar] [CrossRef]
- Lee, Y.; Ragguett, R.-M.; Mansur, R.B.; Boutilier, J.J.; Rosenblat, J.D.; Trevizol, A.; Brietzke, E.; Lin, K.; Pan, Z.; Subramaniapillai, M.; et al. Applications of machine learning algorithms to predict therapeutic outcomes in depression: A meta-analysis and systematic review. J. Affect. Disord. 2018, 241, 519–532. [Google Scholar] [CrossRef]
- Li, W.T.; Ma, J.; Shende, N.; Castaneda, G.; Chakladar, J.; Tsai, J.C.; Apostol, L.; Honda, C.O.; Xu, J.; Wong, L.M.; et al. Using machine learning of clinical data to diagnose COVID-19: a systematic review and meta-analysis. BMC Med Informatics Decis. Mak. 2020, 20, 1–13. [Google Scholar] [CrossRef]
- Wu, G.; Yang, P.; Xie, Y.; Woodruff, H.C.; Rao, X.; Guiot, J.; Frix, A.-N.; Louis, R.; Moutschen, M.; Li, J.; et al. Development of a clinical decision support system for severity risk prediction and triage of COVID-19 patients at hospital admission: an international multicentre study. Eur. Respir. J. 2020, 56, 2001104. [Google Scholar] [CrossRef] [PubMed]
- Wynants, L.; Van Calster, B.; Collins, G.S.; Riley, R.D.; Heinze, G.; Schuit, E.; Bonten, M.M.J.; Dahly, D.L.; Damen, J.A.; Debray, T.P.A.; et al. Prediction models for diagnosis and prognosis of covid-19: Systematic review and critical appraisal. BMJ 2020, 369, m1328. [Google Scholar] [CrossRef]
- Albahri, A.S.; Hamid, R.A.; Alwan, J.K.; Al-Qays, Z.; Zaidan, A.A.; Zaidan, B.B.; Albahri, A.O.S.; AlAmoodi, A.H.; Khlaf, J.M.; Almahdi, E.M.; et al. Role of biological Data Mining and Machine Learning Techniques in Detecting and Diagnosing the Novel Coronavirus (COVID-19): A Systematic Review. J. Med Syst. 2020, 44, 1–11. [Google Scholar] [CrossRef]
- De Simone, B.; Abu-Zidan, F.M.; Kasongo, L.; Moore, E.E.; Podda, M.; Sartelli, M.; Isik, A.; Bala, M.; Coimbra, R.; Balogh, Z.J.; et al. COVID-19 infection is a significant risk factor for death in patients presenting with acute cholecystitis: a secondary analysis of the ChoCO-W cohort study. World J. Emerg. Surg. 2025, 20, 1–11. [Google Scholar] [CrossRef]
- Barough, S.S.; Safavi-Naini, S.A.A.; Siavoshi, F.; Tamimi, A.; Ilkhani, S.; Akbari, S.; Ezzati, S.; Hatamabadi, H.; Pourhoseingholi, M.A. Generalizable machine learning approach for COVID-19 mortality risk prediction using on-admission clinical and laboratory features. Sci. Rep. 2023, 13, 1–11. [Google Scholar] [CrossRef]
- Patel, D.; Kher, V.; Desai, B.; Lei, X.; Cen, S.; Nanda, N.; Gholamrezanezhad, A.; Duddalwar, V.; Varghese, B.; A Oberai, A. Machine learning based predictors for COVID-19 disease severity. Sci. Rep. 2021, 11, 1–7. [Google Scholar] [CrossRef]
- Reichert, M.; Sartelli, M.; Weigand, M.A.; Hecker, M.; Oppelt, P.U.; Noll, J.; Askevold, I.H.; Liese, J.; Padberg, W.; Coccolini, F.; et al. Two years later: Is the SARS-CoV-2 pandemic still having an impact on emergency surgery? An international cross-sectional survey among WSES members. World J. Emerg. Surg. 2022, 17, 1–17. [Google Scholar] [CrossRef]
- Alotaibi, A.; Shiblee, M.; Alshahrani, A. Prediction of Severity of COVID-19-Infected Patients Using Machine Learning Techniques. Computers 2021, 10, 31. [Google Scholar] [CrossRef]
- Sokolenko, M.; Sydorchuk, L.; Sokolenko, A.; Sydorchuk, R.; Kamyshna, I.; Sydorchuk, A.; Sokolenko, L.; Sokolenko, O.; Oksenych, V.; Kamyshnyi, O. Antiviral Intervention of COVID-19: Linkage of Disease Severity with Genetic Markers FGB (rs1800790), NOS3 (rs2070744) and TMPRSS2 (rs12329760). Viruses 2025, 17, 792. [Google Scholar] [CrossRef] [PubMed]
- Protocol “Provision of medical assistance for the treatment of coronavirus disease (COVID-19)”. Approved by the Order of the Ministry of Health of Ukraine of April 2, 2020 No. 762 (as amended by the Order of the Ministry of Health of Ukraine of May 17, 2023 No. 913 [in Ukrainian]. Available online: https://www.dec.gov.ua/wp-content/uploads/2023/05/protokol-covid2023.pdf (accessed on day month year).
- National medical care standard “Coronavirus disease (COVID-19)”. Approved by Order No. 722 of the Ministry of Health of Ukraine dated March 28, 2020 [in Ukrainian]. Available online: https://www.dec.gov.ua/wp-content/uploads/2021/10/2020_722_standart_covid_19.pdf (accessed on day month year).
- CDC 24/7: saving lives, protecting people. Prevention Actions to Use at All COVID-19 Community Levels [Internet]. Center for Disease Control and Prevention. 2023. Available online: https://www.cdc.gov/covid/prevention/index.html (accessed on day month year).
- Hu, C.; Liu, Z.; Jiang, Y.; Shi, O.; Zhang, X.; Xu, K.; Suo, C.; Wang, Q.; Song, Y.; Yu, K.; et al. Early prediction of mortality risk among patients with severe COVID-19, using machine learning. Leuk. Res. 2020, 49, 1918–1929. [Google Scholar] [CrossRef] [PubMed]
- Lv, H.; Liu, Y.; Yin, H.; Xi, J.; Wei, P. Machine Learning Applications in Prediction Models for COVID-19: A Bibliometric Analysis. Information 2024, 15, 575. [Google Scholar] [CrossRef]
- Han, H.; Ma, Q.; Li, C.; Liu, R.; Zhao, L.; Wang, W.; Zhang, P.; Liu, X.; Gao, G.; Liu, F.; et al. Profiling serum cytokines in COVID-19 patients reveals IL-6 and IL-10 are disease severity predictors. Emerg. Microbes Infect. 2020, 9, 1123–1130. [Google Scholar] [CrossRef]
- De Simone, B.; Abu-Zidan, F.M.; Chouillard, E.; Di Saverio, S.; Sartelli, M.; Podda, M.; Gomes, C.A.; Moore, E.E.; Moug, S.J.; Ansaloni, L.; et al. The ChoCO-W prospective observational global study: Does COVID-19 increase gangrenous cholecystitis? World J. Emerg. Surg. 2022, 17, 1–16. [Google Scholar] [CrossRef] [PubMed]
- Tulu, T.W. ; T, Wan, T. K.; Chan, C.L.; et al. ML-based prediction of COVID-19 mortality using immunological-metabolic biomarkers. BMC Digit Health 2023, 1, 6. [Google Scholar]
- Sekaran, K.; Gnanasambandan, R.; Thirunavukarasu, R.; Iyyadurai, R.; Karthik, G.; Doss, C.G.P. A systematic review of artificial intelligence-based COVID-19 modeling on multimodal genetic information. Prog. Biophys. Mol. Biol. 2023, 179, 1–9. [Google Scholar] [CrossRef] [PubMed]
- Statsenko, Y.; Al Zahmi, F.; Habuza, T.; Gorkom, K.N.-V.; Zaki, N. Prediction of COVID-19 severity using laboratory findings on admission: informative values, thresholds, ML model performance. BMJ Open 2021, 11, e044500. [Google Scholar] [CrossRef]
- Liang, P.; Li, Y.; Meng, L.; Li, Y.; Mai, H.; Li, T.; Ma, J.; Ma, J.; Wang, J.; Zhuan, B.; et al. Prognostic significance of serum interleukin-6 in severe/critical COVID-19 patients treated with tocilizumab: a detailed observational study analysis. Sci. Rep. 2024, 14, 1–11. [Google Scholar] [CrossRef]
- Li, Y.; Shang, K.; Bian, W.; He, L.; Fan, Y.; Ren, T.; Zhang, J. Prediction of disease progression in patients with COVID-19 by artificial intelligence assisted lesion quantification. Sci. Rep. 2020, 10, 1–10. [Google Scholar] [CrossRef]
- Nguyen, H.T.T.; Le-Quy, V.; Van Ho, S.; Thomsen, J.H.D.; Stoico, M.P.; Van Tong, H.; Nguyen, N.-L.; Krarup, H.B.; Nguyen, S.H.; Tran, V.Q.; et al. Outcome prediction model and prognostic biomarkers for COVID-19 patients in Vietnam. ERJ Open Res. 2023, 9. [Google Scholar] [CrossRef]
- Pourhomayoun, M.; Shakibi, M. Predicting mortality risk in patients with COVID-19 using machine learning to help medical decision-making. Smart Heal. 2021, 20, 100178–100178. [Google Scholar] [CrossRef]
- Laatifi, M.; Douzi, S.; Bouklouz, A.; et al. ML approaches in COVID-19 severity risk prediction in Morocco. J Big Data 2022, 9, 5. [Google Scholar] [CrossRef] [PubMed]
Figure 1.
Study methodology visualized using Orange flow diagrams.
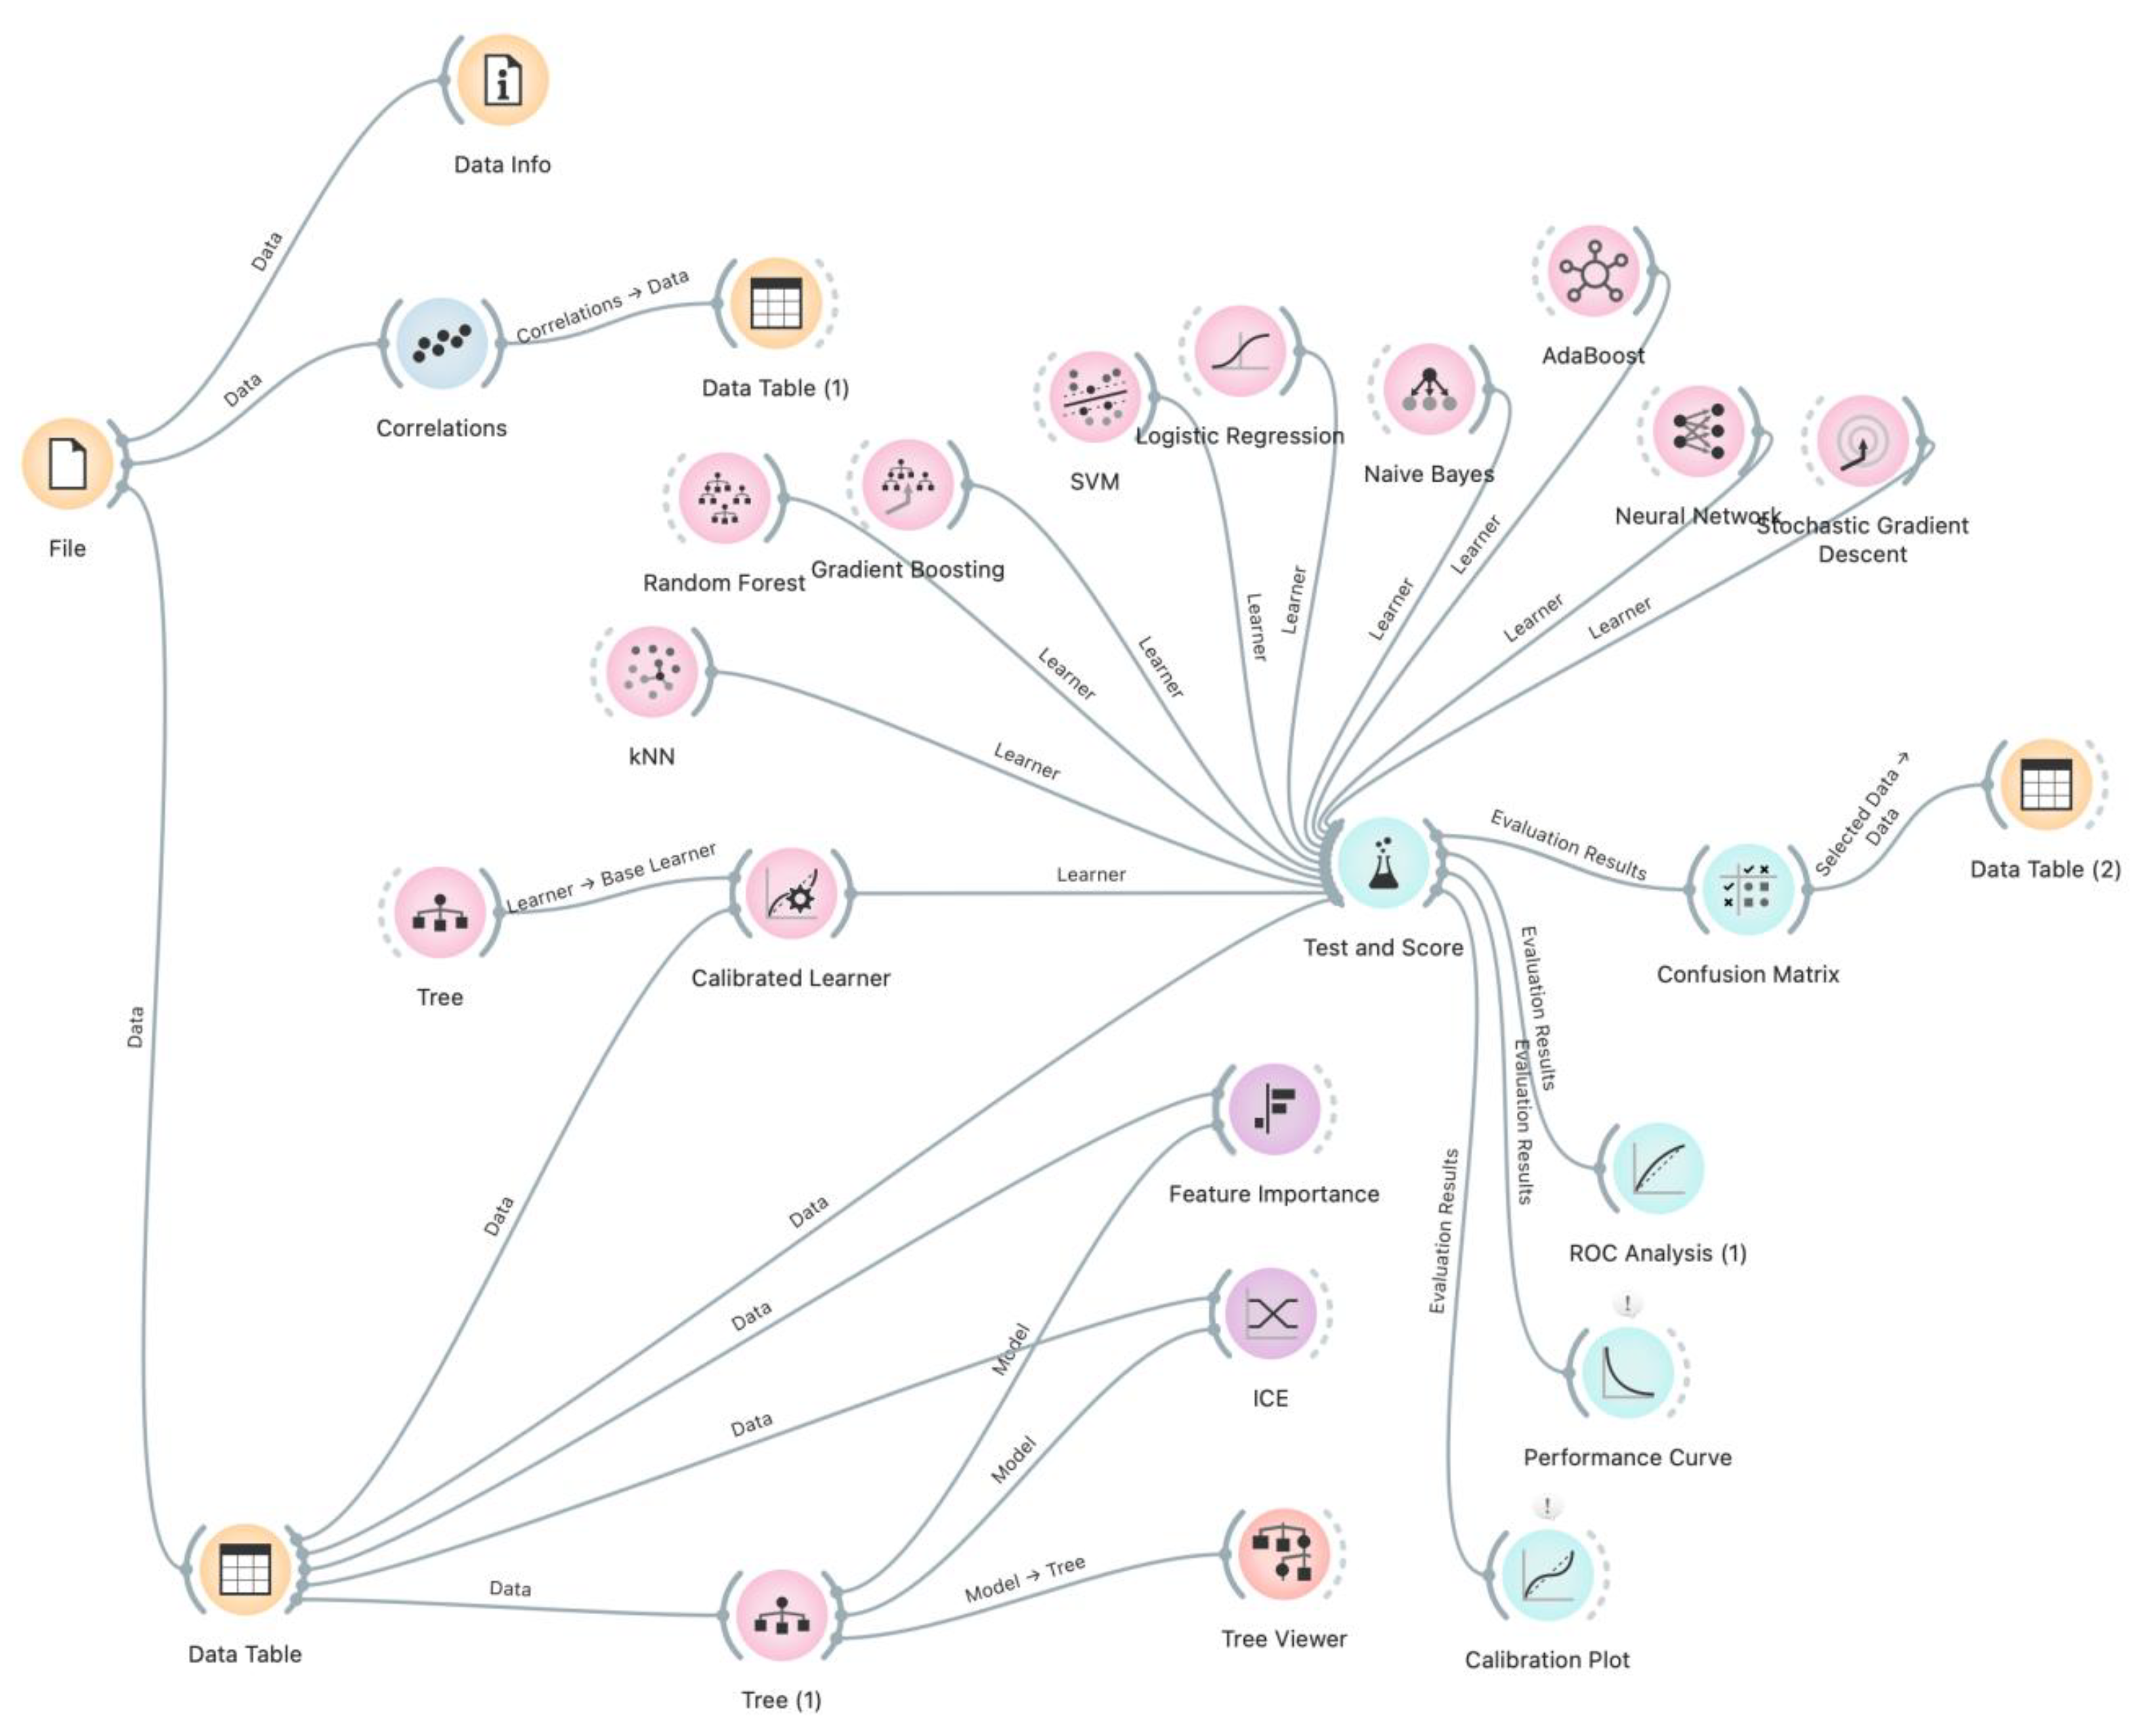
Figure 2.
Correlation matrix of predictor variables.
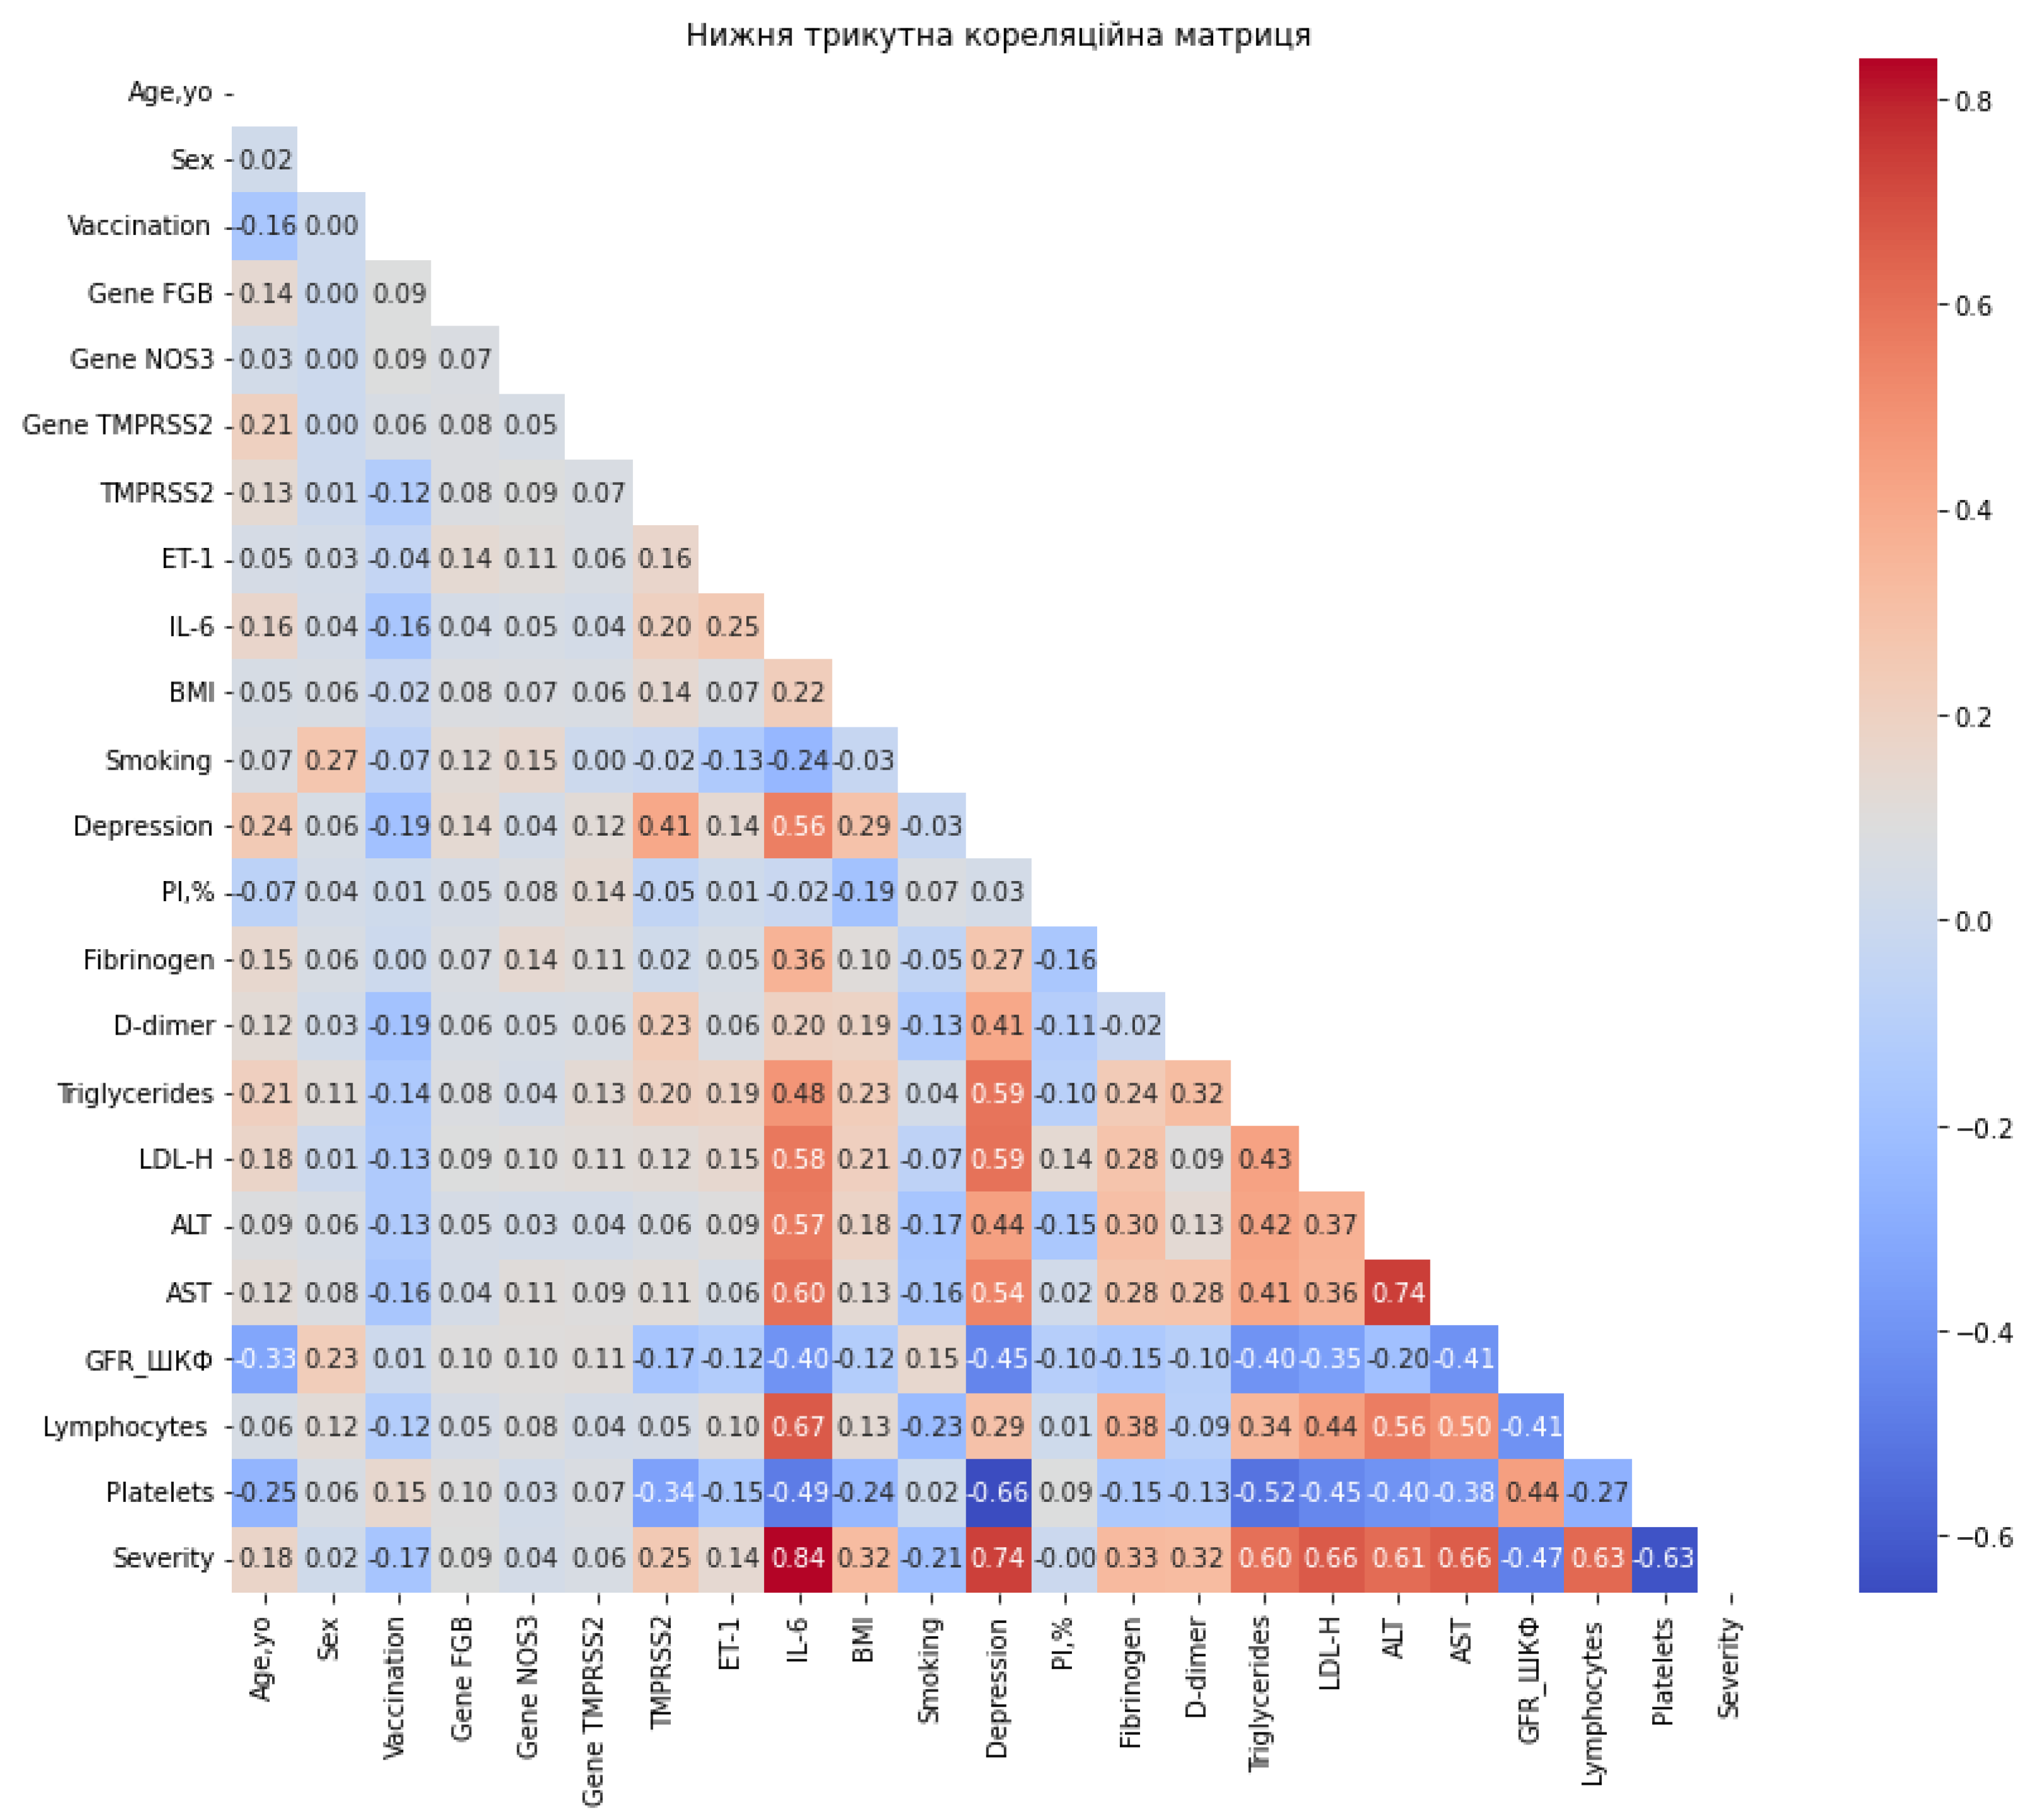
Figure 3.
Heatmap of normalized feature importance across the top 10 classifiers for multiclass prediction of COVID-19 severity, computed using permutation importance with 5-fold stratified cross-validation.
Figure 3.
Heatmap of normalized feature importance across the top 10 classifiers for multiclass prediction of COVID-19 severity, computed using permutation importance with 5-fold stratified cross-validation.
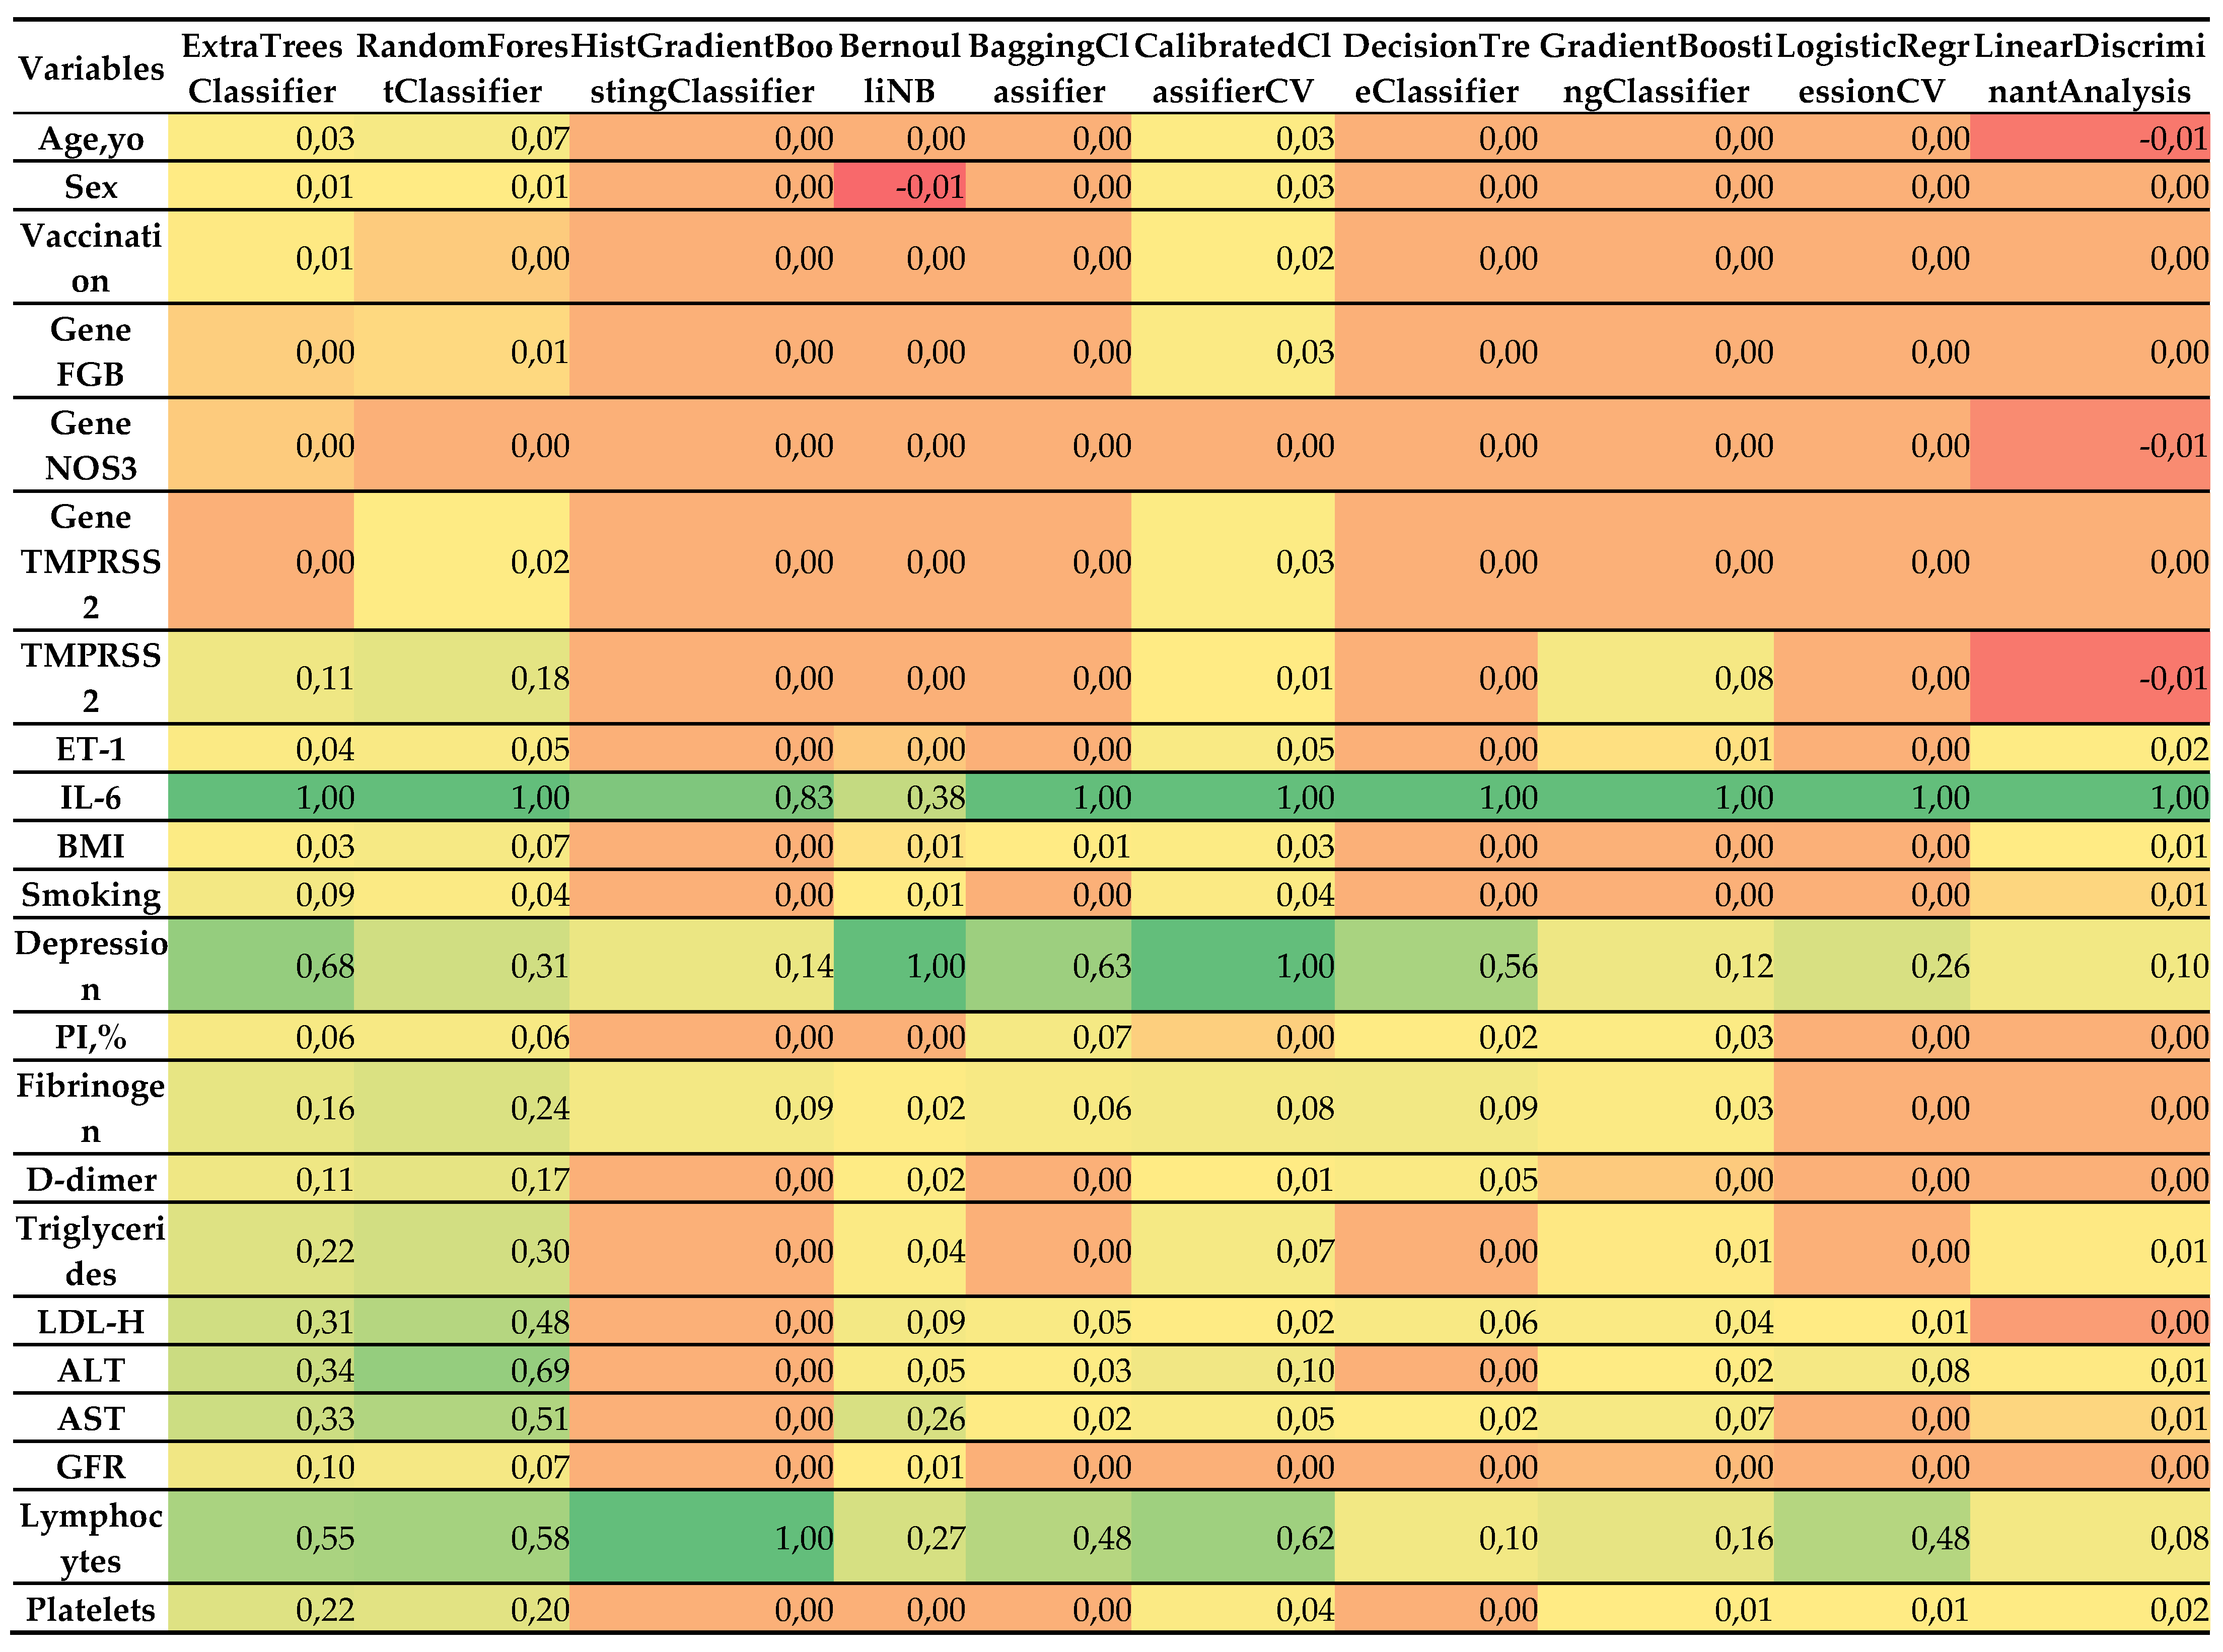
Figure 4.
Decision tree for patient category determination.
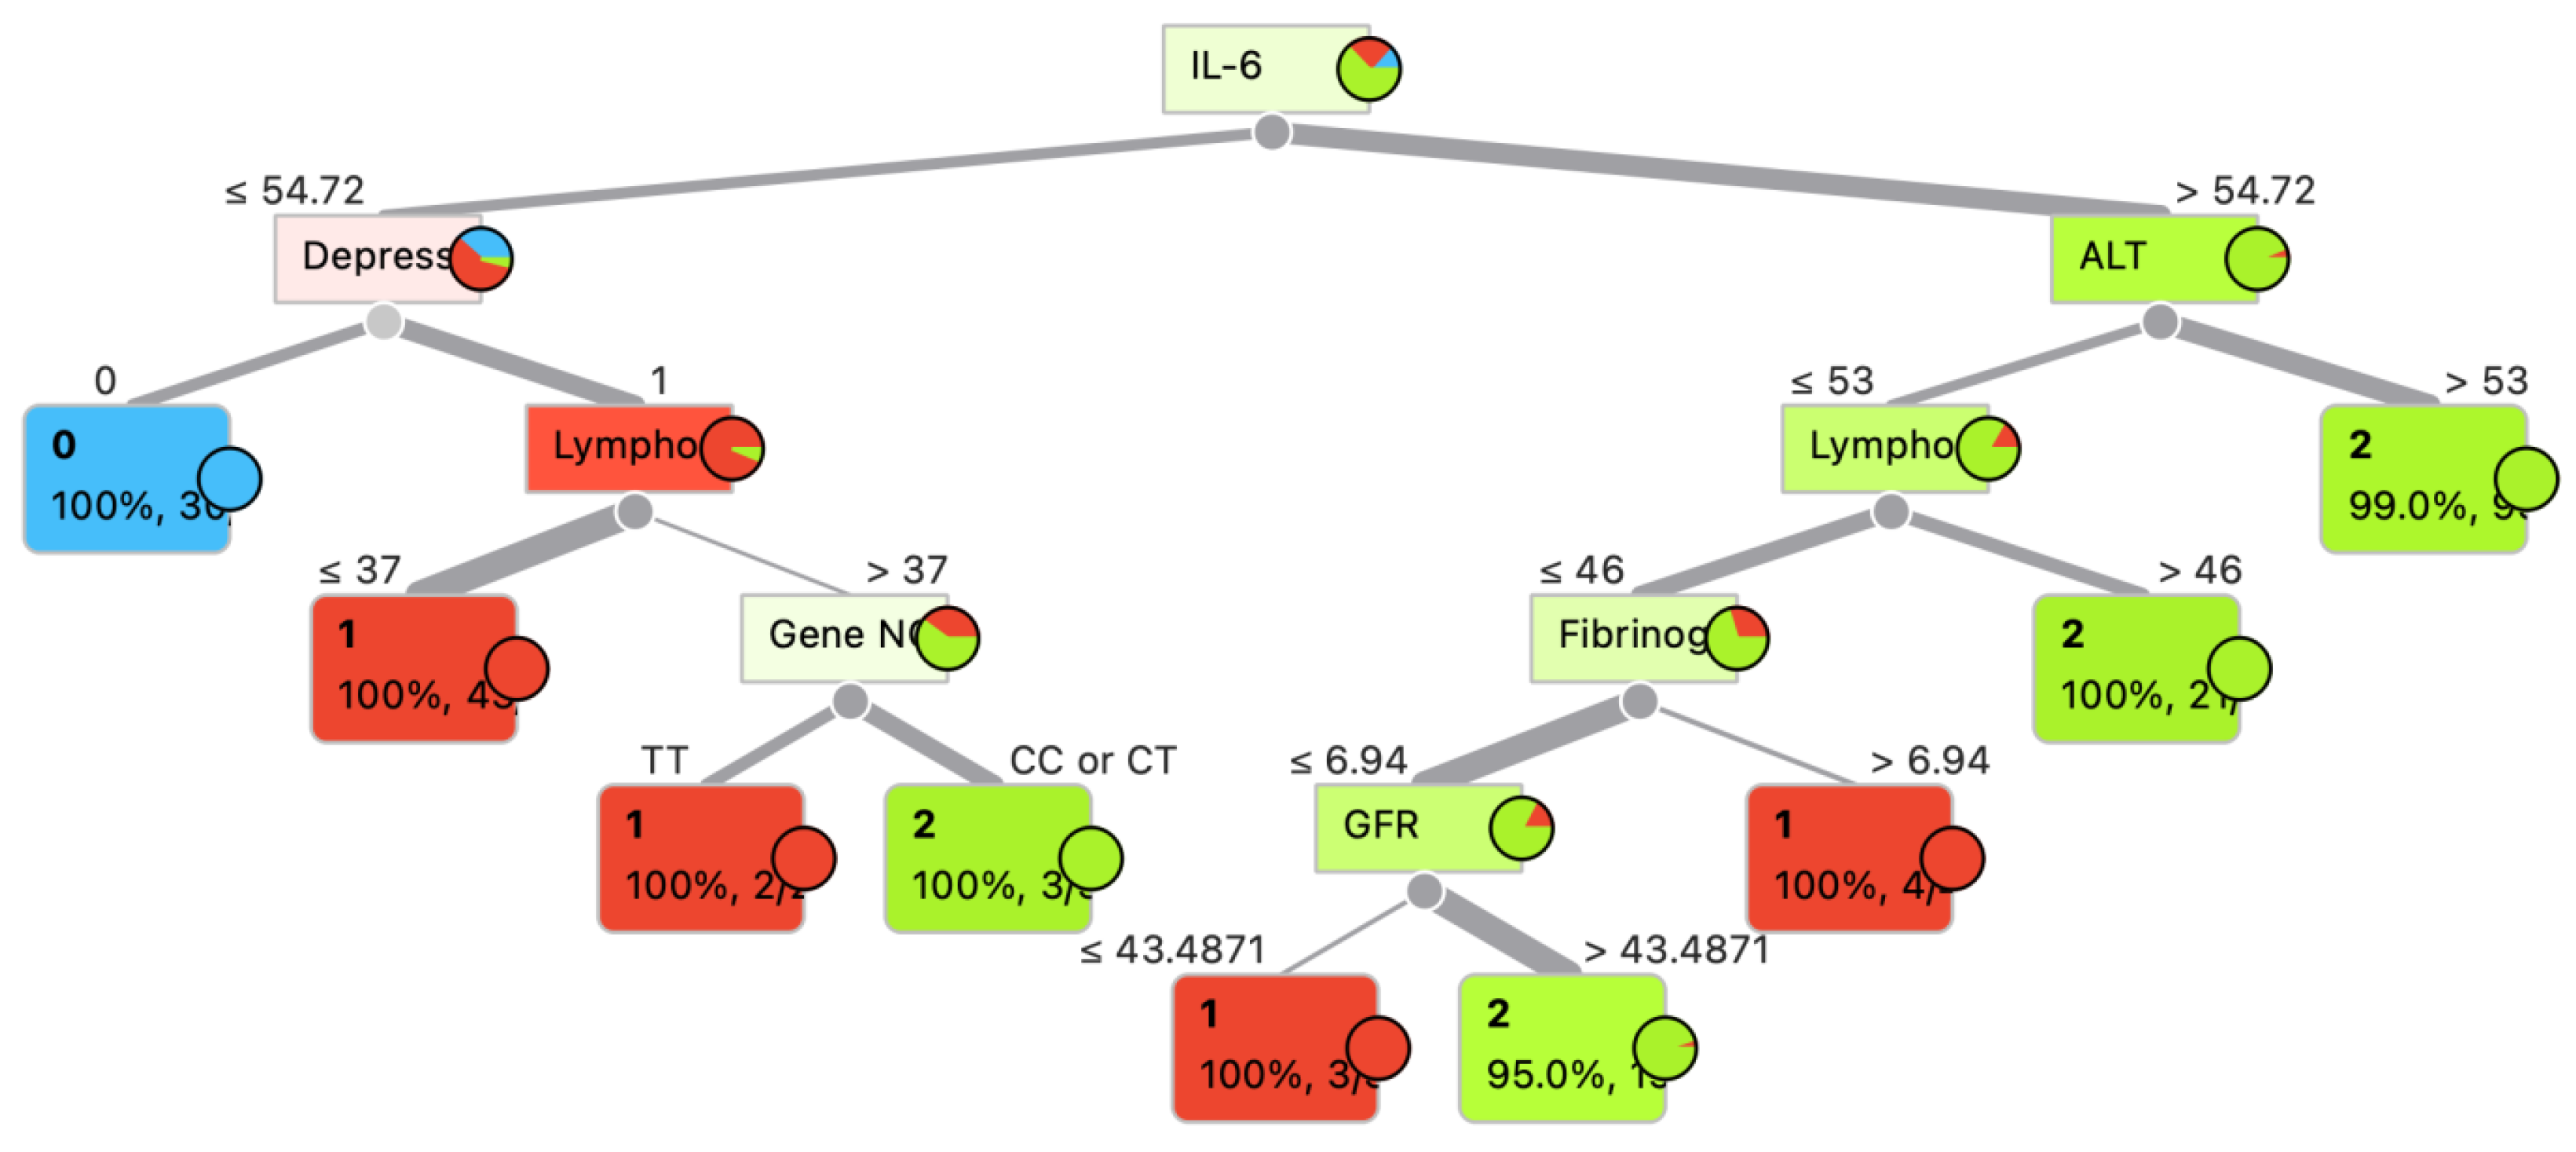

Table 1.
Correlation coefficients between the target variable (Severity) and predictor variables.
| Variable | Correlation |
| IL-6 | 0.838 |
| Depression | 0.738 |
| LDL-H | 0.663 |
| AST | 0.662 |
| Platelets | -0.628 |
| Lymphocytes | 0.627 |
| ALT | 0.611 |
| Triglycerides | 0.602 |
| GFR | -0.471 |
| Fibrinogen | 0.329 |
| BMI | 0.324 |
| D-dimer | 0.319 |
| TMPRSS2 | 0.252 |
| Smoking | -0.205 |
| Age, yo | 0.176 |
| Vaccination | -0.168 |
| ET-1 | 0.141 |
| Gene FGB | 0.087 |
| Gene TMPRSS2 | 0.056 |
| Gene NOS3 | 0.037 |
| Sex | 0.018 |
| PI,% | -0.002 |
Table 2.
Top 10 classifiers ranked by predictive accuracy.
| Model | Accuracy (mean ± SD) | AUC-ROC |
| ExtraTreesClassifier | 0.974 (± 0.022) | 1.000 |
| RandomForestClassifier | 0.960 (± 0.035) | 1.000 |
| HistGradientBoostingClassifier | 0.960 (± 0.038) | 1.000 |
| BernoulliNB | 0.956 (± 0.037) | 1.000 |
| BaggingClassifier | 0.951 (± 0.036) | 1.000 |
| CalibratedClassifierCV | 0.943 (± 0.030) | 1.000 |
| DecisionTreeClassifier | 0.938 (± 0.043) | 1.000 |
| GradientBoostingClassifier | 0.934 (± 0.046) | 1.000 |
| LogisticRegressionCV | 0.934 (± 0.020) | 1.000 |
| LinearDiscriminantAnalysis | 0.929 (± 0.029) | 1.000 |
Disclaimer/Publisher’s Note: The statements, opinions and data contained in all publications are solely those of the individual author(s) and contributor(s) and not of MDPI and/or the editor(s). MDPI and/or the editor(s) disclaim responsibility for any injury to people or property resulting from any ideas, methods, instructions or products referred to in the content. |
© 2025 by the authors. Licensee MDPI, Basel, Switzerland. This article is an open access article distributed under the terms and conditions of the Creative Commons Attribution (CC BY) license (http://creativecommons.org/licenses/by/4.0/).
Copyright: This open access article is published under a Creative Commons CC BY 4.0 license, which permit the free download, distribution, and reuse, provided that the author and preprint are cited in any reuse.


