
Submitted:
27 February 2025
Posted:
03 March 2025
You are already at the latest version
Preprints on COVID-19 and SARS-CoV-2
Abstract
Introduction: This study aims to construct a predictive model that classifies the severity of coronavirus disease 2019 (COVID-19) in cancer patients by analyzing clinical, radiological, and demographic data. The goal is to assist healthcare providers in identifying high-risk patients and ensuring optimal resource allocation. Materials and methods: Data from 237 cancer patients diagnosed with COVID-19 was utilized to forecast disease severity based on various predictors. Key factors included cancer type and stage, intensive care unit admission, radiological assessments, ventilation status, obesity, and systemic inflammatory response syndrome (SIRS). The performance of multiple machine learning (ML) models, including Error-Correcting Output Codes (ECOC) frameworks built on Support Vector Machines (SVM), Decision Trees, K-Nearest Neighbors (KNN), Naive Bayes, Discriminant Analysis and an ensemble bagging method, was evaluated using 10-fold cross-validation. Model accuracy and receiver operating characteristic (ROC) curve scores served as the primary evaluation metrics. Results: KNN and ensemble bagging emerged as the most effective models, achieving accuracy rates of 100% and 98.3%, respectively, along with high area under the curve (AUC) values. These models excelled at identifying severe cases associated with intensive care unit (ICU) admission, ventilation, and metastatic cancer. Decision Trees demonstrated satisfactory performance with an accuracy of 82.55%, while SVM and Discriminant Analysis yielded moderate accuracy (64.26% and 65.11%). Naive Bayes underperformed, achieving only 40% accuracy, largely due to its assumption of feature independence. Conclusions: KNN and ensemble bagging models successfully predicted severe COVID-19 outcomes in cancer patients by capturing intricate relationships between factors such as ICU stays and ventilator support. Decision Trees also showed promise, but Naive Bayes was less reliable due to its simplified approach. The findings underscore the importance of non-linear models for predicting complex clinical outcomes. Despite robust evaluation through 10-fold cross-validation, the possibility of overfitting—particularly with KNN’s flawless accuracy—remains a concern. Additionally, the absence of external validation constrains the broader applicability of these findings to different patient populations.
Keywords:
machine learning
; oncological
; covid-19
; predictive models
; artificial intelligence
1. Introduction
Coronavirus disease 2019 (COVID-19) is caused by the virus known as severe acute respiratory syndrome coronavirus 2 (SARS-CoV-2), identified initially in December 2019 and continuing until present, spreading globally and triggering a pandemic. The surge in cases has overwhelmed healthcare systems in many countries, leading to their subside. Recognizing patients at high risk of developing severe illness is essential to ensure adequate preparation and the provision of supportive care. Infected individuals exhibit a broad spectrum of symptoms and variations in blood profiles, leading to disease severity ranging from mild cases requiring no medical intervention to severe outcomes necessitating mechanical ventilation, intensive care unit (ICU) admission, or even resulting in death [1,2].
Particularly vulnerable are high-risk groups such as older patients and individuals with pre-existing conditions, including oncological patients. These patients are particularly susceptible to severe complications and tend to experience higher mortality rates, underscoring the need for a personalized approach to infection control in this group [3].
Providing the best possible care in hospitals requires the early identification of patients at risk for severe disease progression. Developing accurate and user-friendly prediction models is crucial to help healthcare providers anticipate outcomes and make timely decisions. These models can enable effective patient stratification, ensuring that those who may require more intensive care are identified promptly and managed appropriately within routine clinical workflows [2].
Machine learning (ML) has evolved into a transformative technology used across various fields, with applications in diverse, including advancing healthcare and biotechnology. In healthcare, AI and ML have introduced tools that enhance accuracy, predictions, and overall quality of medical care while easing the workload on physicians, having significant impacts anticipated in the future [4]. As healthcare integrates more with modern technology, innovations in AI and ML are propelling progress, along with their inherent advantages and drawbacks.
AI is increasingly transforming the medical field, offering advancements that range from digitization of medical records, appointment scheduling, and medication management to the integration of health trackers that monitor vital signs and provide actionable insights. AI-powered tools enhance primary care by analyzing patient data, aiding physicians in diagnosing conditions, and personalizing treatment protocols. Nations like the Netherlands use AI to optimize healthcare workflows and minimize unnecessary hospitalizations. Despite its potential, AI adoption raises concerns about job displacement and the loss of human-centric skills such as empathy and critical thinking, which machines cannot replicate. As AI becomes integral to medicine, it is crucial to equip medical professionals with the skills to work effectively alongside AI, balancing technological efficiency with human judgment to maximize patient care outcomes [5].
AI in medicine encompasses both virtual and physical applications, offering innovative solutions to complex challenges. The virtual aspect is driven by ML, including deep learning, which employs algorithms to improve through experience. ML is categorized into unsupervised learning (pattern recognition), supervised learning (systematization and prediction built on prior examples), and reinforcement learning (developing strategies through rewards and penalties). The physical component includes AI-integrated healthcare gadgets and advanced robots that contribute directly to patient care. With ongoing advancements in computational capabilities and cybernetics, AI holds significant promise for transforming healthcare delivery [6].
Particularly through ML and deep learning, AI is poised to revolutionize the medical system. Unlike traditional programming, which relies on explicit instructions, ML enables programs to improve through experience, with deep learning leveraging artificial neural networks (ANNs) inspired by the human brain. These networks learn by processing large datasets, identifying patterns, and refining their understanding through labeled training data. Recent advancements in AI have been driven by access to vast digital datasets, increased computational power, and a growing pool of computer scientists. While AI shows immense potential, its effectiveness depends on the availability of comprehensive training data and continued innovation. Familiarity with AI concepts is essential for fostering collaboration and driving advancements in multiple medical fields and beyond [7]. Recent years have witnessed significant advancements in cancer research alongside a surge in the application of ML within the field of oncology [8]. Before ML algorithms can be applied to patient care, they must typically undergo regulatory approval, which involves more stringent clinical trials and validation processes than those outlined in academic publications. Consequently, only a limited number of ML algorithms reach deployment in clinical settings. Those that do are often effective in specific tasks, such as detection and triage, and show consistency and adaptability across diverse patient groups [9].
AI, powered by ML, is playing a transformative role in cancer prevention and management. ML serves as the core technology driving AI advancements in diagnostics and outcome prediction, particularly through the analysis of electronic health records [10]. Numerous studies have explored AI applications in oncology, including cancer risk stratification, diagnosis, drug development, and molecular tumor profiling. ML's ability to analyze pathology data, interpret imaging studies, and transform visual information into mathematical models highlights its potential to improve cancer prediction and diagnostic accuracy significantly [11,12].
Our study seeks to leverage machine learning techniques and to create a reliable predictive model by examining a combination of clinical, imaging, and demographic data from cancer patients hospitalized during the COVID-19 pandemic. The primary goal is to categorize the severity of their illness accurately. Such a tool is invaluable for healthcare professionals, as it allows them to identify high-risk patients early, enabling better prioritization of care. Furthermore, it aids in optimizing resource allocation, ensuring that limited medical resources, such as ICU beds and ventilators, are directed where they are needed most, driving advancements in personalized care and contributing to the progression of healthcare innovation.
2. Materials and Methods
This study leverages a dataset comprising 237 cancer patients with different histopathological types of malignant neoplasms (e.g. gynecologic, lung, gastrointestinal, hepatobiliary, prostate breast and blood cancers) diagnosed with COVID-19, to predict the severity of their disease. They were admitted between March 2020 and July 2023 to the coronavirus care unit of the "Victor Babeş" Infectious Disease Hospital in Craiova, Romania. Admissions were based on the World Health Organization (WHO) criteria for COVID-19 diagnosis and management [13].
The selected patients were undergoing treatment for an active oncological condition at the time of hospitalization. The study excluded individuals with benign or borderline tumors, as well as those whose cancer was deemed cured and who had no significant cancer-related health complications, given their prognosis aligns closely with that of non-cancer patients. For patients with malignant tumors, no exclusions were made regarding tumor type, location, stage, or treatment approach, ensuring a comprehensive analysis of this group.
By analyzing a variety of predictors, including clinical indicators (such as symptoms and treatment requirements), demographic data (age, gender), and cancer-specific factors (stage and type of cancer), we aimed to classify cases as mild, moderate, or severe.
Severity classification criteria:
- Mild cases: characterized by non-critical symptoms and signs, with no need for supplemental oxygen and no radiological evidence of pneumonia;
- Moderate cases: include non-critical symptoms and signs, but are distinguished by the presence of pneumonia detected through imaging, without the requirement for supplemental oxygen;
- Severe cases: defined by critical and potentially life-threatening symptoms, including respiratory distress, oxygen saturation below 93% (SpO2 < 93%), or abnormal blood gas levels (PaO2 < 60 mmHg and PaCO2 > 50 mmHg).
Additional variables such as ICU admissions, radiological imaging findings, ventilation requirements, obesity, and the presence of Systemic Inflammatory Response Syndrome (SIRS) were also incorporated into the analysis. The inclusion of these comprehensive factors reflects the complex interplay between cancer, COVID-19, and other health conditions that influence patient outcomes. Identifying severity early allows clinicians to tailor care strategies, better manage hospital resources, and improve outcomes for high-risk populations.
To ensure robust and reliable predictions, the study employed ML models using a 10-fold cross-validation technique to evaluate performance. This method splits the dataset into ten subsets, repeatedly training and testing the models to reduce overfitting and improve generalizability. Various algorithms were tested, including Error-Correcting Output Codes (ECOC) frameworks built on Support Vector Machines (SVM), Decision Trees, K-Nearest Neighbors (KNN), Naive Bayes, and Discriminant Analysis, along with an ensemble bagging method. These models were assessed using metrics like accuracy and the area under the curve (AUC), which indicate how well the models distinguish between severity levels. The diverse range of algorithms and validation methods highlights the study's focus on achieving accurate and practical predictions for integration into clinical workflows.
Before study inclusion, all patients signed an informed consent form, which was performed in accordance with the Helsinki Declaration and authorized by the ethics committee of The University of Medicine and Pharmacy of Craiova (no. 18828/01.06.2024).
Creating an advanced predictive model capable of accurately classifying the severity of COVID-19 in cancer patients, we seek to provide a clear stratification of disease severity into the three categories that were previously mentioned, helping to identify high-risk patients who may require intensive care or specific interventions.
By leveraging a diverse range ML algorithms and rigorous validation techniques, the study ensures the development of an accurate and practical predictive tool that can be seamlessly integrated into clinical workflows.
3. Results
We conducted a detailed analysis of the data collected from the 237 cancer patients who were diagnosed with SARS-CoV-2. This process involved examining a range of clinical, radiological, and demographic variables to gain insights into the interplay between their oncological conditions and the progression of COVID-19. By focusing on this specific cohort, we aimed to identify patterns and factors that contribute to the severity of the disease in these high-risk patients, providing a foundation for predictive modeling and improved clinical decision-making.
The study evaluated the performance of various ML models in predicting disease severity in this category of patients. The results highlighted the effectiveness of KNN and ensemble bagging methods as the top-performing models, achieving exceptionally high accuracy rates of 100% and 98.3%, and high AUC scores. (Figure 1, Figure 2)
ECOC represents a technique that handles multi-class classification by breaking it down into multiple binary classification tasks and combining the results. KNN is a classification algorithm that predicts the label of a sample based on the labels of its nearest neighbors in the feature space.
In the confusion matrix, rows represent the ‘True Classes’ of the samples, columns represent the ‘Predicted Classes’ by the model, diagonal values represent correctly classified instances for each class and off-diagonal values represent misclassifications.
Below we depicted a comprehensive breakdown of the matrix:
1. Class 0: 14 instances of Class 0 were correctly predicted as Class 0. No instances of Class 0 were misclassified as other classes.
2. Class 1: 51 instances of Class 1 were classified as Class 1. No instances of Class 1 were misclassified. The model successfully distinguished these instances from other classes.
3. Class 2: 94 instances of Class 2 were correctly classified as Class 2. No instances of Class 2 were misclassified as any other class, which suggests that the model performed well in identifying Class 2.
4. Class 3: 76 instances of Class 3 were classified as Class 3. Similar to the other classes, suggesting the model identified correctly all of the classes.
This further supports the model's accuracy and reliability in distinguishing between the defined severity levels.
The results from the ECOC with KNN model demonstrate its exceptional performance in classifying all instances correctly across all defined categories (Class 0, Class 1, Class 2, and Class 3). The results from the ECOC with KNN model demonstrate its exceptional performance in classifying all instances correctly across all defined categories (Class 0, Class 1, Class 2, and Class 3).
These results indicate that the ECOC framework combined with the KNN algorithm is highly effective for this dataset. KNN, being a non-parametric model, classifies data based on proximity to training examples in feature space. The lack of misclassification across all classes suggests the dataset’s features are well-separated, and the model successfully captures the relationships between them.
Such flawless performance, while impressive, also calls for scrutiny. Perfect accuracy could point to potential overfitting, especially if the dataset is relatively small or lacks external validation. However, within the scope of the study, these results highlight the model's suitability for clinical applications where precision in predicting disease severity is crucial.
Both models demonstrated superior ability to correctly identify severe cases, which were characterized by factors such as ICU admission, the need for mechanical ventilation, and the presence of metastatic cancer. These findings underscore the capability of these advanced algorithms to capture complex relationships between multiple clinical and demographic variables, making them valuable tools for critical decision-making in healthcare.
The Decision Tree model also showed promising results, with an accuracy of 82.55%. While not as precise as KNN or ensemble bagging, it still effectively classified patient outcomes. Decision Trees offer the advantage of interpretability, providing clinicians with a transparent understanding of how predictions are made. This feature makes them an attractive choice for integrating ML tools into clinical workflows, where explainability is often as important as predictive accuracy. (Figure 3)
In this case, the model correctly predicted ‘Class 0’ (mild severity) for 7 patients. It correctly predicted ‘Class 1’ for 40 patients. The model did well for ‘Class 2’ (85 correct predictions) and ‘Class 3’ (62 correct predictions). Regarding the errors that occurred, the model made wrong predictions. For example, it predicted ‘Class 0’ when the true class was ‘Class 1’ three times, or it predicted ‘Class 2’ instead of ‘Class 3’ 11 times. The model performs well overall and misclassifications are relatively rare.
The receiver operating characteristic (ROC) curve measures how well the model distinguishes between severity levels (Classes 0, 1, 2, 3) and AUC measures how good the model is at distinguishing between classes. Here, AUC is high for all classes: Class 0: 0.95, Class 1: 0.96, Class 2: 0.93, Class 3: 0.95. This indicates the model performs well across all severity levels. The model also has high sensitivity (True Positive Rate) and low errors. (Figure 4)
The Decision Tree model performed well, especially for ‘Class 2’ and ‘Class 3’, but had some misclassifications between neighboring classes. The model has strong predictive ability for all severity levels, with high AUC scores close to 1.
In contrast, the performance of SVM and Discriminant Analysis was moderate, with accuracy rates of 64.26% and 65.11%, respectively. These models struggled to match the predictive precision of the top performers, likely due to limitations in handling the non-linear relationships inherent in the dataset. While they provided some utility, their lower accuracy and AUC scores suggest they may be less suitable for tasks requiring high reliability in identifying severe cases.
The performance of the ECOC model employing a SVM classifier in predicting disease severity across four distinct classes highlights the model's proficiency in identifying intermediate and severe cases, but shows room for improvement in minimizing misclassification between adjacent severity levels. (Figure 5)
The matrix presents the true versus predicted classifications, providing an insight into the model's strengths and limitations:
1. Class 0 (Mild cases): Out of all actual mild cases, six were classified as Class 1, an equal number (6) were misclassified as Class 2, and two as Class 3. These results suggest a low level of precision in identifying Class 0, with a degree of confusion between adjacent classes.
2. Class 1 (Moderate cases): For Class 1, 22 instances were correctly predicted as belonging to this category. However, a significant portion (28) was misclassified as Class 2, while one was classified as Class 3. This confusion indicates that features separating mild and moderate cases might overlap, leading to classification challenges.
3. Class 2 (Severe cases): The model excelled in identifying severe cases, with 83 instances correctly classified as Class 2. Nevertheless, some overlap occurred, with seven cases being underestimated as Class 1 and four as Class 3. This suggests that while the model distinguishes severe cases well, there is a tendency to confuse them with adjacent categories.
4. Class 3 (Critical cases): Class 3 had 46 correct predictions, but a notable 29 instances were misclassified as Class 2, and one as Class 1. This indicates that while the model is adept at identifying critical cases, it occasionally struggles with the distinction between severe and moderate ones.
The AUC values from ROC Curve Analysis collectively validate the ECOC-SVM framework's robust discriminatory capacity. However, the classification of boundary classes (e.g., between moderate and severe, or severe and critical) requires further optimization to reduce overlap and enhance predictive precision. (Figure 6)
Class 0 (AUC = 0.82): indicates a reasonable ability to identify mild cases, consistent with the confusion matrix results. Class 1 (AUC = 0.83): Slightly higher AUC reflects better performance in predicting moderate cases compared to mild ones. Class 2 (AUC = 0.81): This score highlights the model's overall reliability in identifying severe cases, despite occasional misclassification with neighboring classes. Class 3 (AUC = 0.88): The highest AUC value demonstrates the model's strength in recognizing critical cases, aligning with its ability to identify most ICU-level patients accurately.
The findings highlight the potential of the ECOC-SVM model in addressing critical challenges of severity classification in healthcare. While the high AUC scores confirm its applicability, the misclassification patterns suggest areas for refinement. Adjusting features, incorporating additional clinical parameters, or experimenting with alternative encoding schemes within the ECOC framework may further enhance performance.
These results underscore the importance of leveraging ML models in medical decision-making. By reliably predicting severity levels, this approach could support clinicians in prioritizing high-risk patients and allocating resources more effectively, contributing to better outcomes in a high-stakes clinical setting.
Concerning Discriminant Analysis, the model demonstrates strong performance for Class 2, evidenced by its high number of correct predictions and minimal misclassifications. There is noticeable confusion between neighboring classes (e.g., Class 0, misclassified as Class 1 and vice versa, as well as Class 1 being misclassified as Class 3). These misclassifications may stem from overlapping features between adjacent severity classes. (Figure 7)
1. Class 0: The model incorrectly classified 7 instances as Class 1, 6 instances as Class 2, and 1 instance as Class 3, suggesting that misclassifications are notable.
2. Class 1: Among Class 1, the model correctly classified 25 cases, but misclassified 25 instances as Class 2 and 1 instance as Class 3. This balanced accuracy for Class 1 highlights some confusion in distinguishing it from Class 2.
3. Class 2: The model showed strong performance for Class 2, correctly classifying 82 instances. Only 9 cases were incorrectly labeled as Class 1, and 3 as Class 3. This consistency demonstrates the model's ability to identify Class 2 effectively.
4. Class 3: Class 3 had 46 instances correctly predicted. However, 1 instance was misclassified as Class 1, and 29 cases were labeled as Class 2. These errors highlight a difficulty in discerning Class 3 from Class 2.
Regarding the ROC Curve Analysis, the overall AUC values (ranging from 0.80 to 0.88) demonstrate the ECOC model with Discriminant Analysis has reasonable discriminatory power across all classes. Class 3 is the best-predicted category based on its high AUC score, but its confusion with Class 1 in the matrix suggests further refinement is necessary. (Figure 8)
1. Class 0: AUC = 0.84. This indicates the model has a good, though not perfect, ability to distinguish Class 0 from other classes.
2. Class 1: AUC = 0.84. Similar to Class 0, the model has decent discrimination for Class 1, despite the confusion noted in the confusion matrix.
3. Class 2: AUC = 0.80. Although Class 2 had strong results in the confusion matrix, its slightly lower AUC reflects challenges in consistently distinguishing it from other classes in certain scenarios.
4. Class 3: AUC = 0.88. The highest AUC among the four classes, indicating the model is most effective in identifying Class 3 compared to other classes.
The ECOC model with Discriminant Analysis exhibits strong capabilities, particularly for Class 2 and Class 3 predictions. While the overall accuracy is commendable, certain misclassifications, especially between neighboring classes, highlight areas for potential improvement. The relatively high AUC values across all classes underscore the model’s reliability, but adjustments to better differentiate between closely related classes could further enhance performance.
Naive Bayes was the poorest-performing model, achieving an accuracy of only 40%. This outcome can be attributed to the model’s assumption of feature independence, which does not align with the complex, interdependent nature of the clinical, radiological, and demographic factors influencing disease severity in cancer patients with COVID-19. The poor performance highlights the limitations of overly simplistic approaches when applied to multifaceted datasets. (Figure 9)
1. Class 0: misclassified - 14 instances were classified as Class 2, indicating a poor precision for Class 0.
2. Class 1: incorrectly predicted 51 instances of Class 1 as Class 2, underlining another class confusion, as depicted in previous cases.
3. Class 2: correctly predicted - 94 instances of Class 2 were correctly identified as Class 2. No misclassification occurred, highlighting a strong model performance for Class 2.
4. Class 3: misclassified - 76 instances of Class 3 were incorrectly classified as Class 2.
The model heavily favors Class 2, with all misclassifications from other classes (0, 1, and 3) being assigned to Class 2. While Class 2's precision and recall are perfect, this suggests overfitting to Class 2 or poorly defined decision boundaries for the other classes. The inability to predict Classes 0, 1, and 3 correctly (complete misclassification for Class 0 and Class 3, and significant confusion for Class 1) indicates weaknesses in feature representation or the Naive Bayes assumptions for these classes.
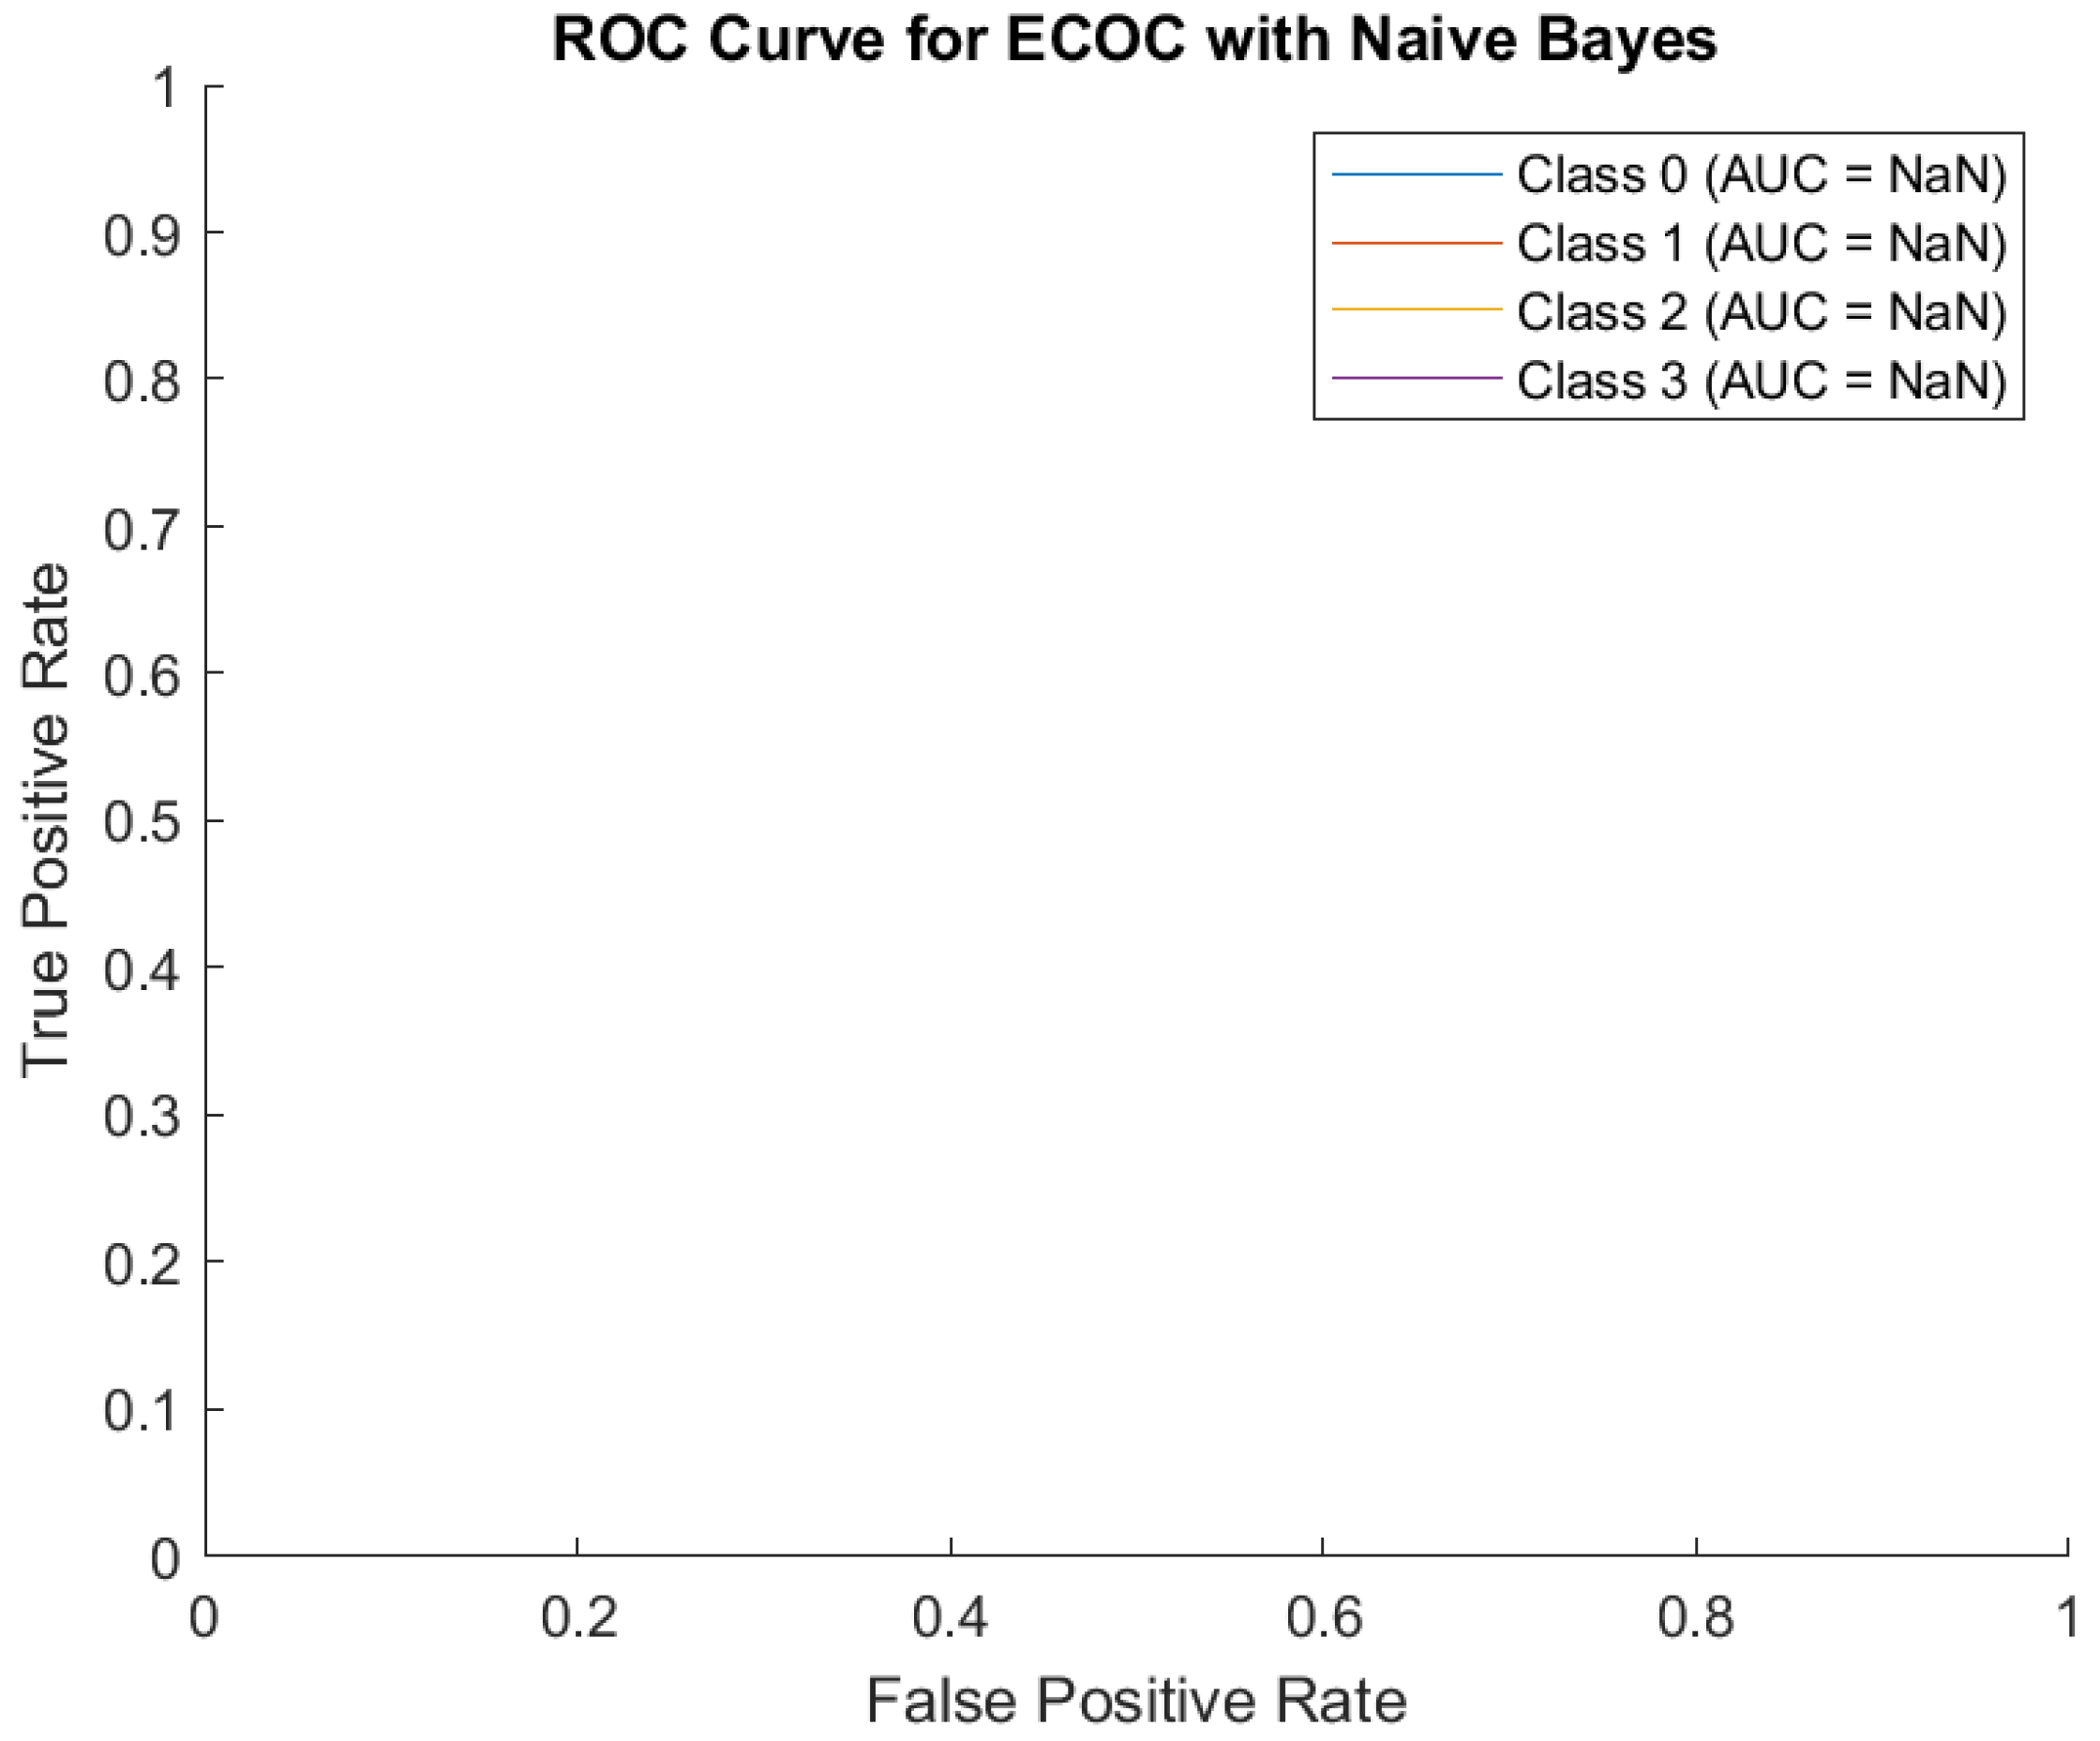
Regarding the ROC Curve, it shows flat lines, and the AUC values are marked as NaN (Not a Number).
The classifier outputs for Naive Bayes may not generate meaningful probability estimates for each class and the dataset may have issues, such as imbalanced classes, leading to an inability to compute meaningful True Positive Rate and False Positive Rate. (Figure 10)
Concisely, the confusion matrix suggests that the Naive Bayes model heavily predicts Class 2 regardless of the input data. This overgeneralization reduces the performance for other classes, especially Classes 0, 1, and 3. A significant portion of the predictions are skewed toward Class 2. This could point to a class imbalance in the data or the inability of Naive Bayes to distinguish features for other classes in the dataset. Classes 0, 1, and 3 are almost entirely misclassified as Class 2, indicating that the model struggles to identify meaningful patterns for these classes. The flat ROC curve and NaN AUC values highlight that the model's predictions are not probabilistically calibrated or meaningful, likely due to poor feature separability under the Naive Bayes assumption. The ECOC with Naive Bayes approach appears inadequate in this case, especially for multi-class tasks, and calls for a re-evaluation of the underlying assumptions and preprocessing steps.
In summary, the study demonstrates the potential of advanced ML models, particularly KNN and ensemble bagging, to effectively predict disease severity in cancer patients with COVID-19. These results provide critical insights into the selection of ML tools for clinical applications, emphasizing the importance of choosing models capable of handling complex relationships to ensure accurate and reliable predictions.
4. Discussion
The impact of severe viral infections on the human body, such as COVID-19, can be profound and multifaceted, potentially leading to critical health complications. These effects include severe acute respiratory syndrome (SARS) and multi-organ failure [14]. Without prompt and intensive medical intervention, these conditions can rapidly escalate, resulting in death within a short time frame. The severity and speed of progression underscore the critical need for early detection and targeted treatment strategies to mitigate such life-threatening outcomes [15].
Cancer patients are at greater risk of severe COVID-19 and higher mortality due to weakened immune systems from the disease or treatments like chemotherapy and radiation, which can hinder the body’s response to SARS-CoV-2. While anticancer drugs show potential for dual antiviral and antineoplastic functions, managing cancer care in the current context remains particularly challenging. Cytotoxic therapies, such as those causing leukopenia, increase susceptibility to infections, emphasizing the need for vigilant monitoring and adaptable strategies to address both conditions effectively [16,17]. Predicting outcomes in cancer patients is particularly challenging due to the uncertainty surrounding cancer-specific risk factors. Physicians must carefully navigate the dual risks posed by untreated malignancies and the potential for severe infections triggered by certain anti-cancer therapies [18].
With the advent of digital technologies and the rise of big data, AI algorithms have become deeply embedded in healthcare systems, surpassing traditional statistical methods. These advancements enable more sophisticated analysis, leveraging vast datasets to deliver insights that classical approaches are unable to achieve [19,20]. ML, a key aspect of AI, involves algorithms that improve from data, and as data quality and quantity increase, these models enhance their ability to detect patterns and make accurate projections. In oncology, ML is instrumental in utilizing extensive medical datasets to forecast disease outcomes and tailor therapies [21].
ML algorithms rely on an iterative process of learning through experimentation, where the system adjusts and improves its predictions based on feedback from errors. This approach contrasts with traditional programming methods, which operate strictly according to predefined rules and logical structures, such as "if-else" statements. Rather than being explicitly programmed with step-by-step instructions, ML models identify patterns and relationships within data autonomously, adapting their behavior as they process new information. This trial-and-error process enables ML to handle complex and dynamic problems that are difficult to address with conventional algorithmic logic [22,23].
ML algorithms have shown significant potential in various aspects of COVID-19 management. They aid in predicting disease severity, ICU admission, and mortality risk, while also evaluating treatment responses and assisting in drug discovery. Deep learning models complement these efforts, contributing to outbreak prediction, tracking virus spread, and supporting vaccine and drug research [24,25,26].
Several prior studies have employed ML algorithms to predict COVID-19 outcomes using a variety of data inputs, such as patient sociodemographic details, vital signs, laboratory results, medication history, and comorbidities [27,28,29].
Operating these kinds of parameters, another study concluded that the developed and validated suite of risk assessment tools predicts poor outcomes in COVID-19 patients based on routinely collected hospital admission data. These tools performed well in identifying low-risk patients and showed promise for identifying high-risk individuals, though careful consideration of false positives and negatives is necessary. While additional validation in prospective settings is required to confirm their utility, these tools offer a rapid, data-driven approach to guide prognosis, optimize resource allocation, inform treatment decisions, and support enrollment in clinical trials. The methods could also be adapted for future viral outbreaks, enhancing preparedness and care strategies [30].
Different ML algorithms demonstrate varying strengths when it comes to predicting outcomes across different classes, highlighting their unique suitability for specific tasks. The performance of these models is closely tied to the quantity of data available for training. As the size of the dataset increases, models are able to learn more effectively, resulting in significant improvements in accuracy and reliability. This relationship underscores the importance of large, high-quality datasets in optimizing ML predictions and achieving robust outcomes in diverse applications [31,32].
Our study assessed the performance of various ML models for predicting disease severity in cancer patients with COVID-19. Using data available at hospital admission, a ML-based clinical decision support system was developed and validated to predict the outcomes for oncological COVID-19 patients (mild, moderate, severe).
Among the models evaluated, KNN and ensemble bagging demonstrated exceptional performance, with accuracy rates of 100% and 98.3%, respectively, alongside high AUC scores. The ECOC framework with KNN achieved flawless classification, correctly identifying all instances across four severity categories. This result reflects the model's ability to capture the relationships between well-separated features in the dataset. However, such perfect accuracy, while promising, warrants caution as it could indicate overfitting, particularly if the dataset lacks external validation. Despite this, the results highlight the potential for KNN and ensemble bagging to be used in high-precision clinical decision-making where accurate prediction of severe outcomes is essential.
The Decision Tree model also showed good performance, achieving an accuracy of 82.55%. Despite not matching the precision of KNN or ensemble bagging, the Decision Tree’s inherent interpretability makes it a valuable tool for clinical workflows. Its transparency allows clinicians to better understand how predictions are made, which is crucial for integrating ML into healthcare settings where explainability is often as critical as accuracy.
Models like SVM and Discriminant Analysis demonstrated moderate performance, with accuracy rates of 64.26% and 65.11%, respectively. Both models struggled with the dataset’s non-linear relationships, which likely limited their predictive precision. Although these models were functional, their lower performance indicates that they may not be ideal for tasks requiring high reliability, especially in identifying severe cases.
Naive Bayes emerged as the poorest-performing model, with an accuracy of only 40%. Its assumption of feature independence likely hindered its ability to handle the complex and interdependent nature of clinical, radiological, and demographic factors in this dataset. This finding underscores the limitations of simplistic approaches in addressing multifaceted medical prediction tasks and highlights the necessity of using more sophisticated algorithms to capture nuanced relationships among features.
5. Conclusions
Overall, our study demonstrates the potential of advanced ML models, particularly KNN and ensemble bagging, to provide accurate predictions of disease severity in cancer patients with COVID-19. These findings emphasize the importance of selecting robust and reliable models capable of handling complex, non-linear datasets to support critical healthcare decisions. While simpler models like Naive Bayes may not meet the requirements for such tasks, models that balance predictive accuracy with interpretability, such as Decision Trees, offer promising directions for practical clinical integration. Further external validation of these models will be essential to ensure their generalizability and long-term reliability in diverse clinical settings.
While the use of 10-fold cross-validation offered a rigorous approach to evaluating the ML models, certain limitations should be addressed to ensure broader applicability. The exceptionally high accuracy observed in the KNN model, including perfect classification in some scenarios, raises concerns about potential overfitting. This occurs when a model becomes too tailored to the specific dataset used for training and validation, capturing noise or peculiarities rather than generalizable patterns. Overfitting can significantly reduce a model's performance when applied to new, unseen data. Moreover, the absence of external validation constrains the generalizability of the findings. Without testing the models on independent datasets from diverse patient populations, it is challenging to determine whether the observed performance metrics would hold in real-world clinical settings or across varying demographic and clinical profiles. External validation is critical to ensure that the models are not overly dependent on the characteristics of the original dataset and can reliably predict outcomes in broader, heterogeneous groups of patients. Addressing these concerns through further validation and testing will be essential for the models to achieve practical clinical utility.
Author Contributions
Elena-Victoria Manea (Carneluti) and Carmen Duta have equally contributed to this work. Conceptualization, E.V.M.C., C.D. and S.O.P.; methodology, S.A.A. and L.G.T.; formal analysis, M.S.S., I.G., S.A.A. and C.P.; investigation, E.V.M.C. and C.D.; data curation, S.A.A., M.S.S., A.D.H. and C.P.; writing—original draft preparation, E.V.M.C., S.O.P. and A.D.; writing—review and editing, C.D., I.A.M.S. and L.G.T.; visualization, I.G., A.D.H. and I.A.M.S.; supervision, S.O.P. and A.D.. All authors have read and agreed to the published version of the manuscript.
Funding
This research received no external funding.
Institutional Review Board Statement
The study was conducted in accordance with the Declaration of Helsinki, and approved by the Ethics Committee of The University of Medicine and Pharmacy of Craiova (no. 18828/01.06.2024).
Informed Consent Statement
Informed consent was obtained from all subjects involved in the study.
Conflicts of Interest
The authors declare no conflicts of interest.
References
- Tabata; Sakiko; et al. Clinical characteristics of COVID-19 in 104 people with SARS-CoV-2 infection on the Diamond Princess cruise ship: a retrospective analysis. The Lancet Infectious Diseases 2020, Volume 20, Issue 9, 1043 – 1050. [CrossRef]
- Philipp Wendland; Vanessa Schmitt; Jörg Zimmermann; et al. Machine learning models for predicting severe COVID-19 outcomes in hospitals. Informatics in Medicine Unlocked, Volume 37, 2023, 101188, ISSN 2352-9148. [CrossRef]
- Al-Shamsi HO; Alhazzani W; Alhuraiji A; et al. A Practical Approach to the Management of Cancer Patients During the Novel Coronavirus Disease 2019 (COVID-19) Pandemic: An International Collaborative Group. Oncologist 2020 Jun;25(6):e936-e945. [CrossRef]
- Habehh H; Gohel S. Machine Learning in Healthcare. Curr Genomics, 2021 Dec 16;22(4):291-300. [CrossRef]
- Amisha; Malik P; Pathania M; et al. Overview of artificial intelligence in medicine. J Family Med Prim Care. 2019 Jul;8(7):2328-2331. [CrossRef]
- Hamet P.; Tremblay, J.. Artificial intelligence in medicine. Metabolism, 69, S36–S40, (2017). [CrossRef]
- Mayo R. C.; Leung J.. Artificial intelligence and deep learning – Radiology’s next frontier?. Clinical Imaging, 49, 87–88, (2018). [CrossRef]
- Kourou K; Exarchos TP; Exarchos KP; et al. Machine learning applications in cancer prognosis and prediction. Comput Struct Biotechnol J, 2014 Nov 15;13:8-17. [CrossRef]
- Kyle Swanson; Eric Wu; Angela Zhang; et al. From patterns to patients: Advances in clinical machine learning for cancer diagnosis, prognosis, and treatment. Cell, Volume 186, Issue 8, 2023, Pages 1772-1791, ISSN 0092-8674. [CrossRef]
- Zhang B; Shi H; Wang H. Machine Learning and AI in Cancer Prognosis, Prediction, and Treatment Selection: A Critical Approach. J Multidiscip Healthc, 2023 Jun 26;16:1779-1791. [CrossRef]
- Kumar Y ; Gupta S ; Singla R ; et al. A systematic review of artificial intelligence techniques in cancer prediction and diagnosis. Arch Comput Methods Eng, 2021;2021:1–28. [CrossRef]
- Yu C; Helwig EJ. The role of AI technology in prediction, diagnosis and treatment of colorectal cancer. Artif Intell Rev. 2022;55(1):323–343. [CrossRef]
- Wang Y; Lu X; Li Y; et al. Clinical Course and Outcomes of 344 Intensive Care Patients with COVID-19. Am J Respir Crit Care Med, 2020, 201:1430-4. [CrossRef]
- van der Hoek L.; Pyrc K.; Jebbink M.F.; et al. Identification of a new human Coronavirus. Nature Med, vol. 10, no. 4, pp. 368-373, 2004. [CrossRef]
- Shing Hui Reina Cheong; Yu Jie Xavia Ng; Ying Lau; et al. Wearable technology for early detection of COVID-19: A systematic scoping review. Preventive Medicine, Volume 162, 2022, 107170, ISSN 0091-7435. [CrossRef]
- Georgescu I; Artene SA; Giubelan LI; et al. Evaluation of the Demographics, Clinical Laboratory Parameters, and Outcomes of Hospitalized Oncological Versus Non-oncological COVID-19 Patients. Cureus, 2024 Nov 9;16(11):e73313. [CrossRef]
- Purcaru OS; Artene SA; Barcan E; et al. The Interference between SARS-CoV-2 and Tyrosine Kinase Receptor Signaling in Cancer. Int J Mol Sci, 2021 May 2;22(9):4830. [CrossRef]
- Robilotti EV; Babady NE; Mead PA; et al. Determinants of COVID-19 disease severity in patients with cancer. Nat Med, 2020;26(8):1218–1223. [CrossRef]
- Jamshidi E; Asgary A; Tavakoli N; et al. Symptom prediction and mortality risk calculation for COVID-19 using machine learning. Front Artif Intell. 2021 Jun 22;4:673527. [CrossRef]
- Basu K; Sinha R; Ong A; Basu T. Artificial intelligence: How is it changing medical sciences and its future? Indian J. Dermatol. 65(5), 365–370 (2020). [CrossRef]
- Georgescu I; Dricu A; Artene S-A; et al. Digital-Focused Approaches in Cancer Patients’ Management in the Post-COVID Era: Challenges and Solutions. Appl. Sci. 2024, 14, 8097. [CrossRef]
- Makridakis S; Spiliotis E; Assimakopoulos V. Statistical and machine learning forecasting methods: Concerns and ways forward. PLoS One. 2018 Mar 27;13(3):e0194889. [CrossRef]
- Alballa N; Al-Turaiki I. Machine learning approaches in COVID-19 diagnosis, mortality, and severity risk prediction: a review. Inform. Med. Unlocked 24, 100564 (2021). [CrossRef]
- Bhattacharya S; Maddikunta P; Pham Q; et al. Deep learning and medical image processing for coronavirus (COVID-19) pandemic: a survey. Sustain Cities Soc. 2021 Feb;65:102589. [CrossRef]
- Kafieh R.; Arian R.; Saeedizadeh N.; et al. COVID-19 in Iran: a deeper look into the future. medRxiv (2020). [CrossRef]
- Chowdhury M.E.H.; Rahman T.; Khandakar A.; et al. An early warning tool for predicting mortality risk of COVID-19 patients using machine learning. Cognit. Comput. 11, 1–16 (2021). [CrossRef]
- Castro V.M.; McCoy T.H.; Perlis R.H. Laboratory Findings Associated With Severe Illness and Mortality Among Hospitalized Individuals With Coronavirus Disease 2019 in Eastern Massachusetts. JAMA Netw. Open. 2020;3(10). [CrossRef]
- Wu G., Yang P., Xie Y., et al. Development of a clinical decision support system for severity risk prediction and triage of COVID-19 patients at hospital admission: an international multicenter study. Eur. Respir. J. 2020;56:2001104. [CrossRef]
- Wang S; Zha Y; Li W; et al. A fully automatic deep learning system for COVID_19 diagnostic and prognostic analysis. Eur. Respir. J. 2020;56:2000775. [CrossRef]
- Campbell TW; Wilson MP; Roder H; et al. Predicting prognosis in COVID-19 patients using machine learning and readily available clinical data. Int J Med Inform. 2021 Nov;155:104594. [CrossRef]
- Rustam F; Reshi AA; Mehmood A; et al. COVID-19 Future Forecasting Using Supervised Machine Learning Model. IEEE Access, vol. 8, pp. 101489-101499, 2020. [CrossRef]
- Navlakha S; Morjaria S; Perez-Johnston R; et al. Projecting COVID-19 disease severity in cancer patients using purposefully-designed machine learning. BMC Infect Dis. 2021 May 4;21(1):391. [CrossRef]
Figure 1.
Confusion Matrix for a classification model using Error-Correcting Output Codes (ECOC) with K-Nearest Neighbors (KNN).
Figure 1.
Confusion Matrix for a classification model using Error-Correcting Output Codes (ECOC) with K-Nearest Neighbors (KNN).
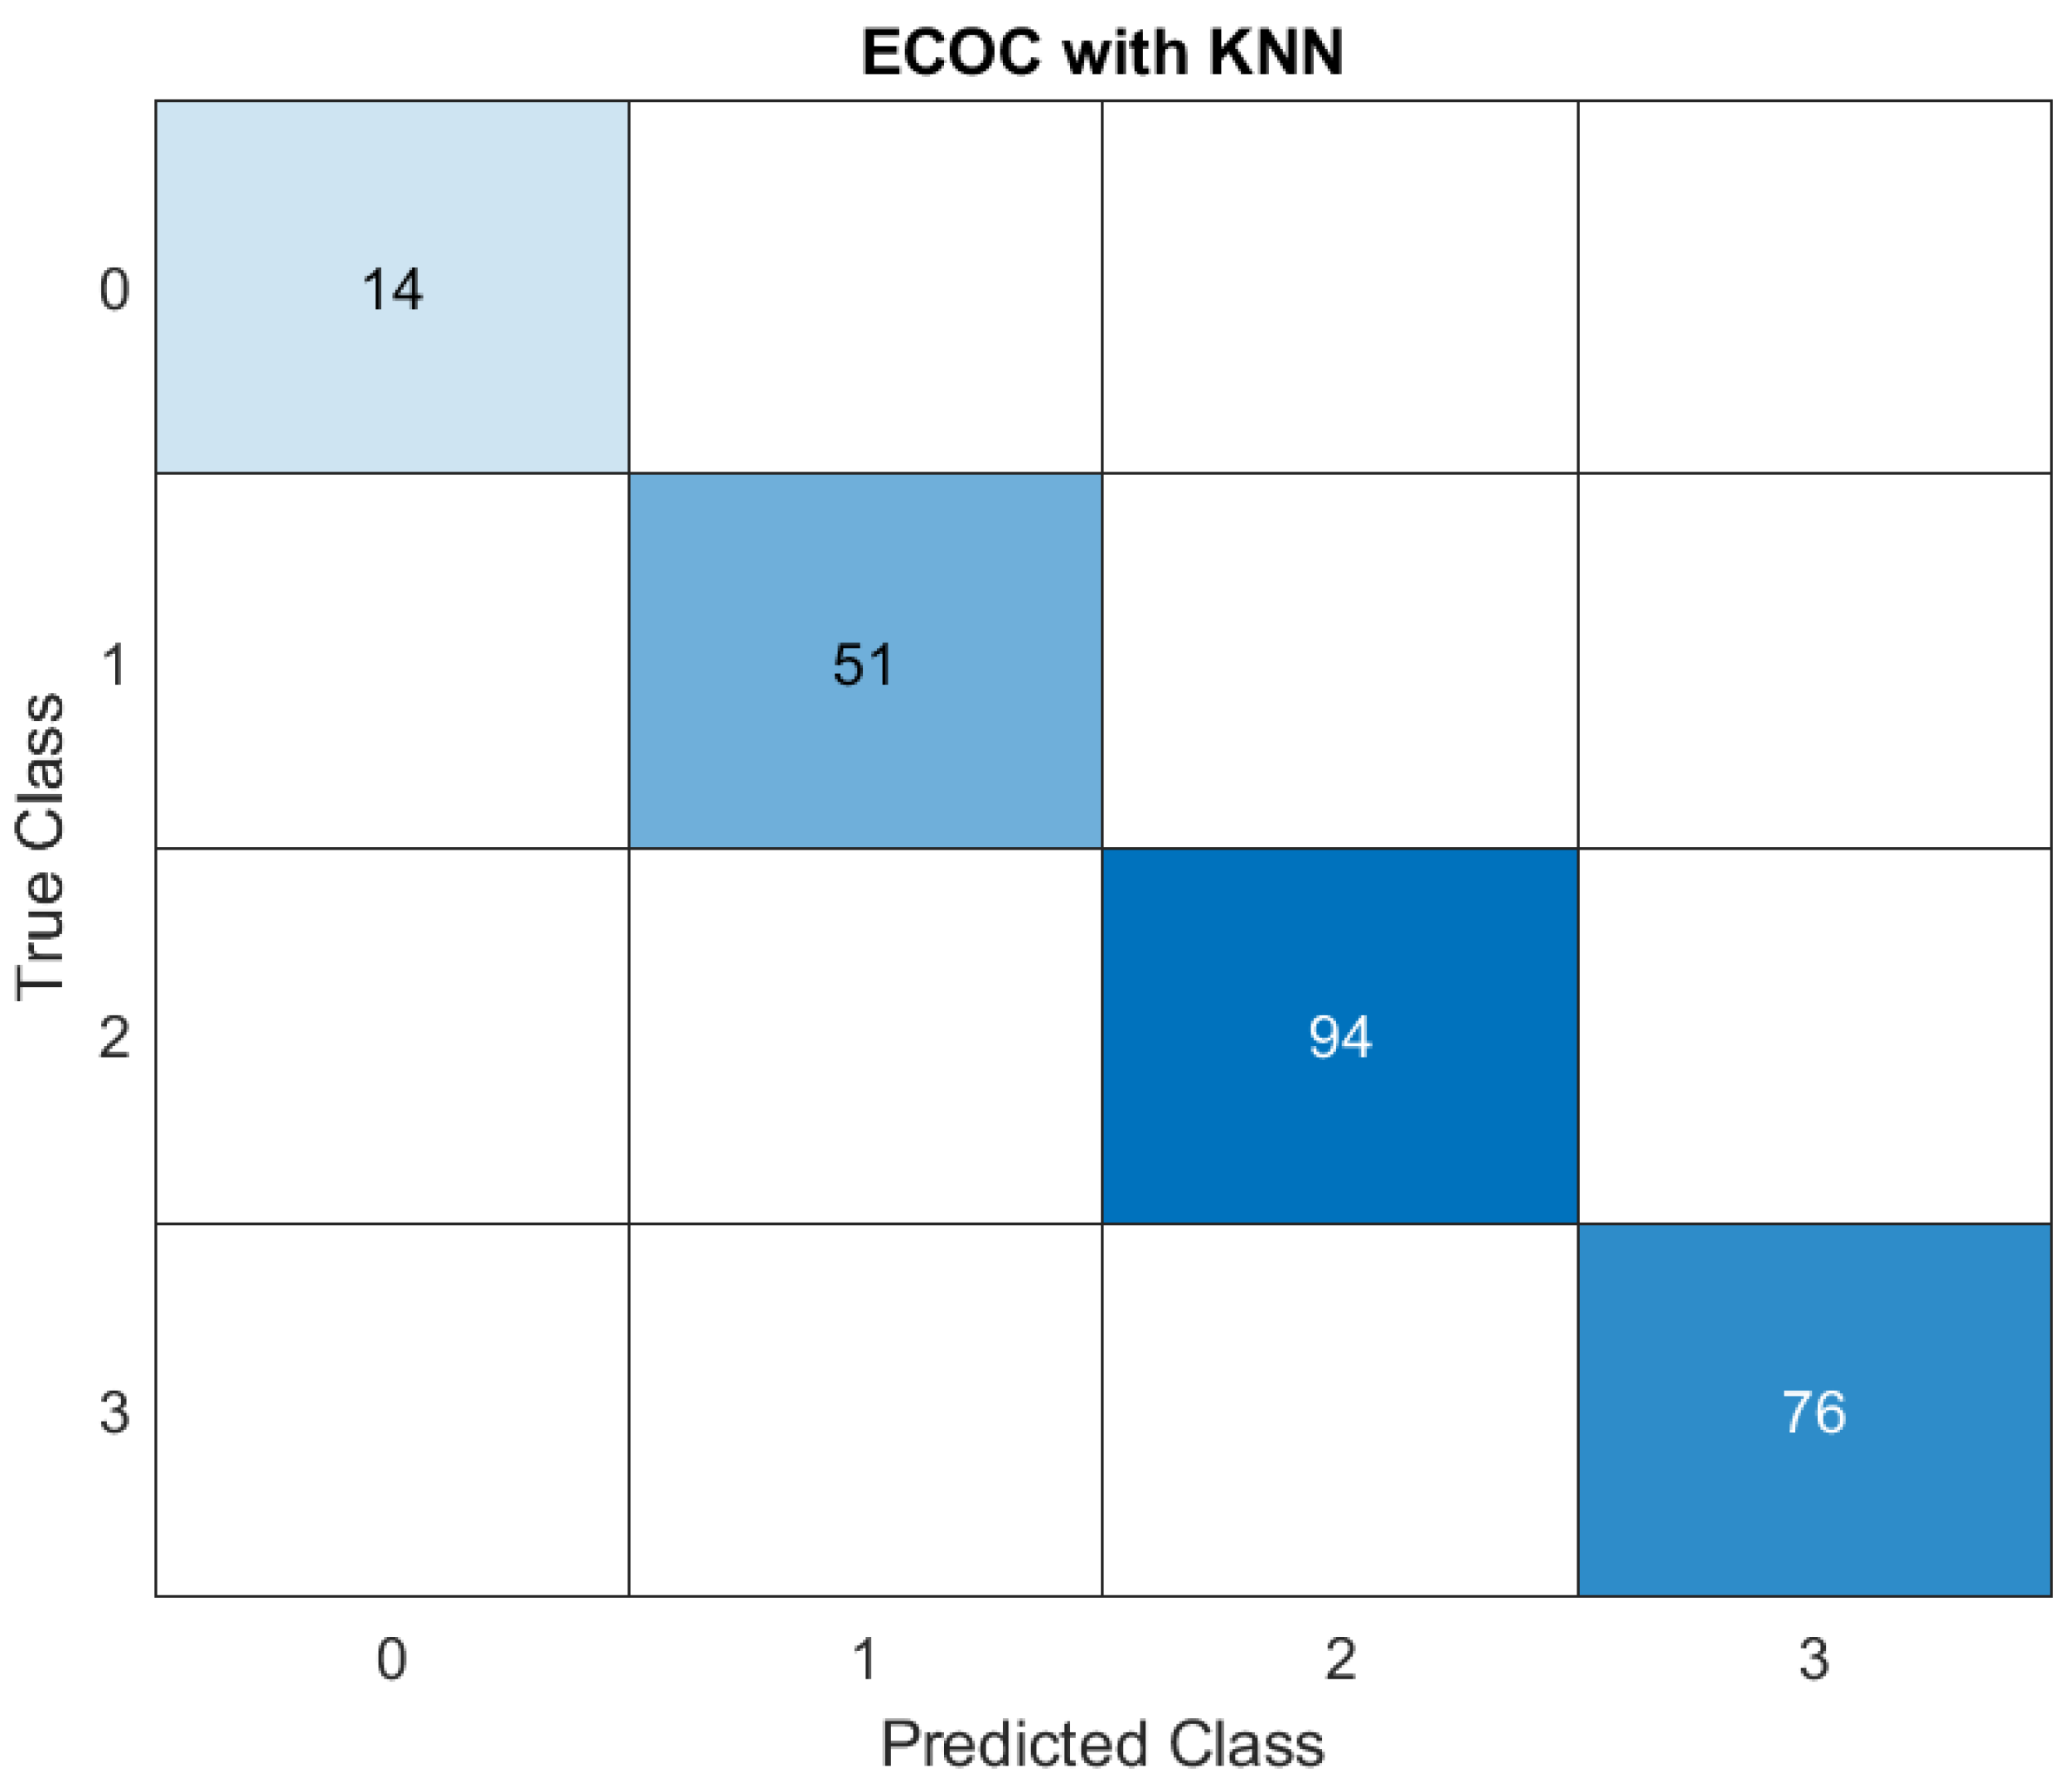
Figure 2.
Receiver operating characteristic (ROC) curve for ECOC with KNN.
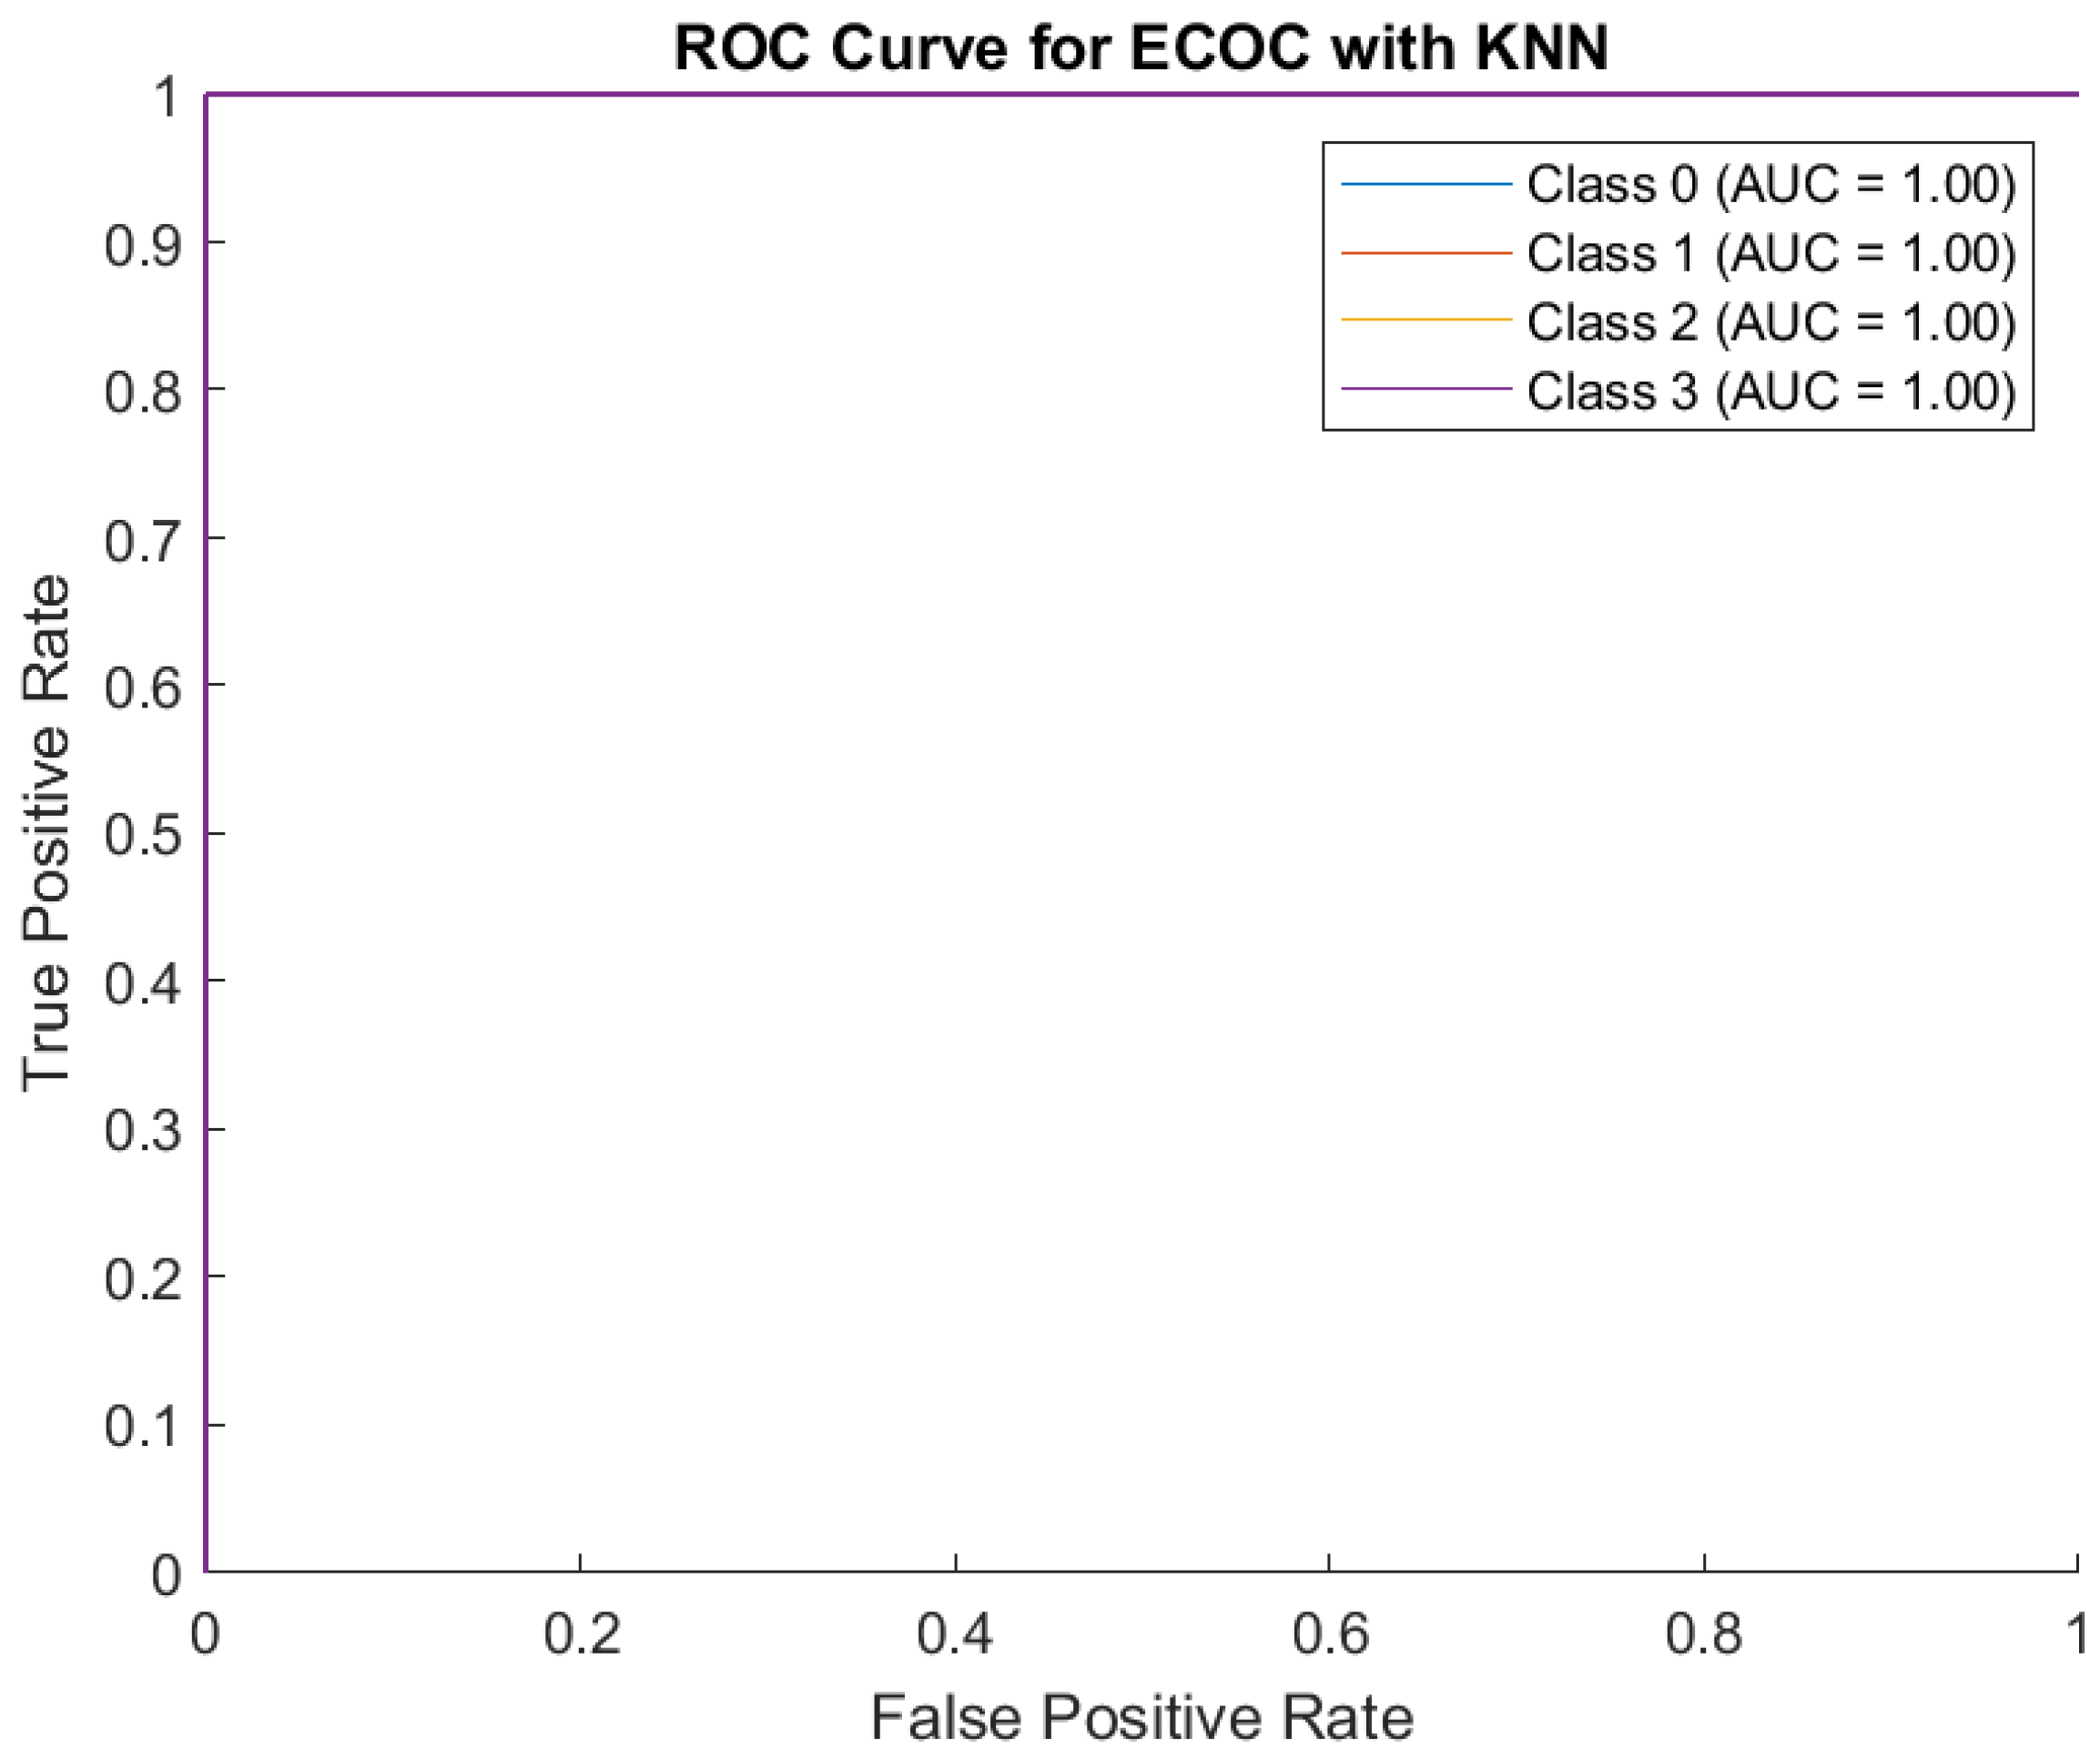
Figure 3.
Confusion Matrix for ECOC with Decision Tree.
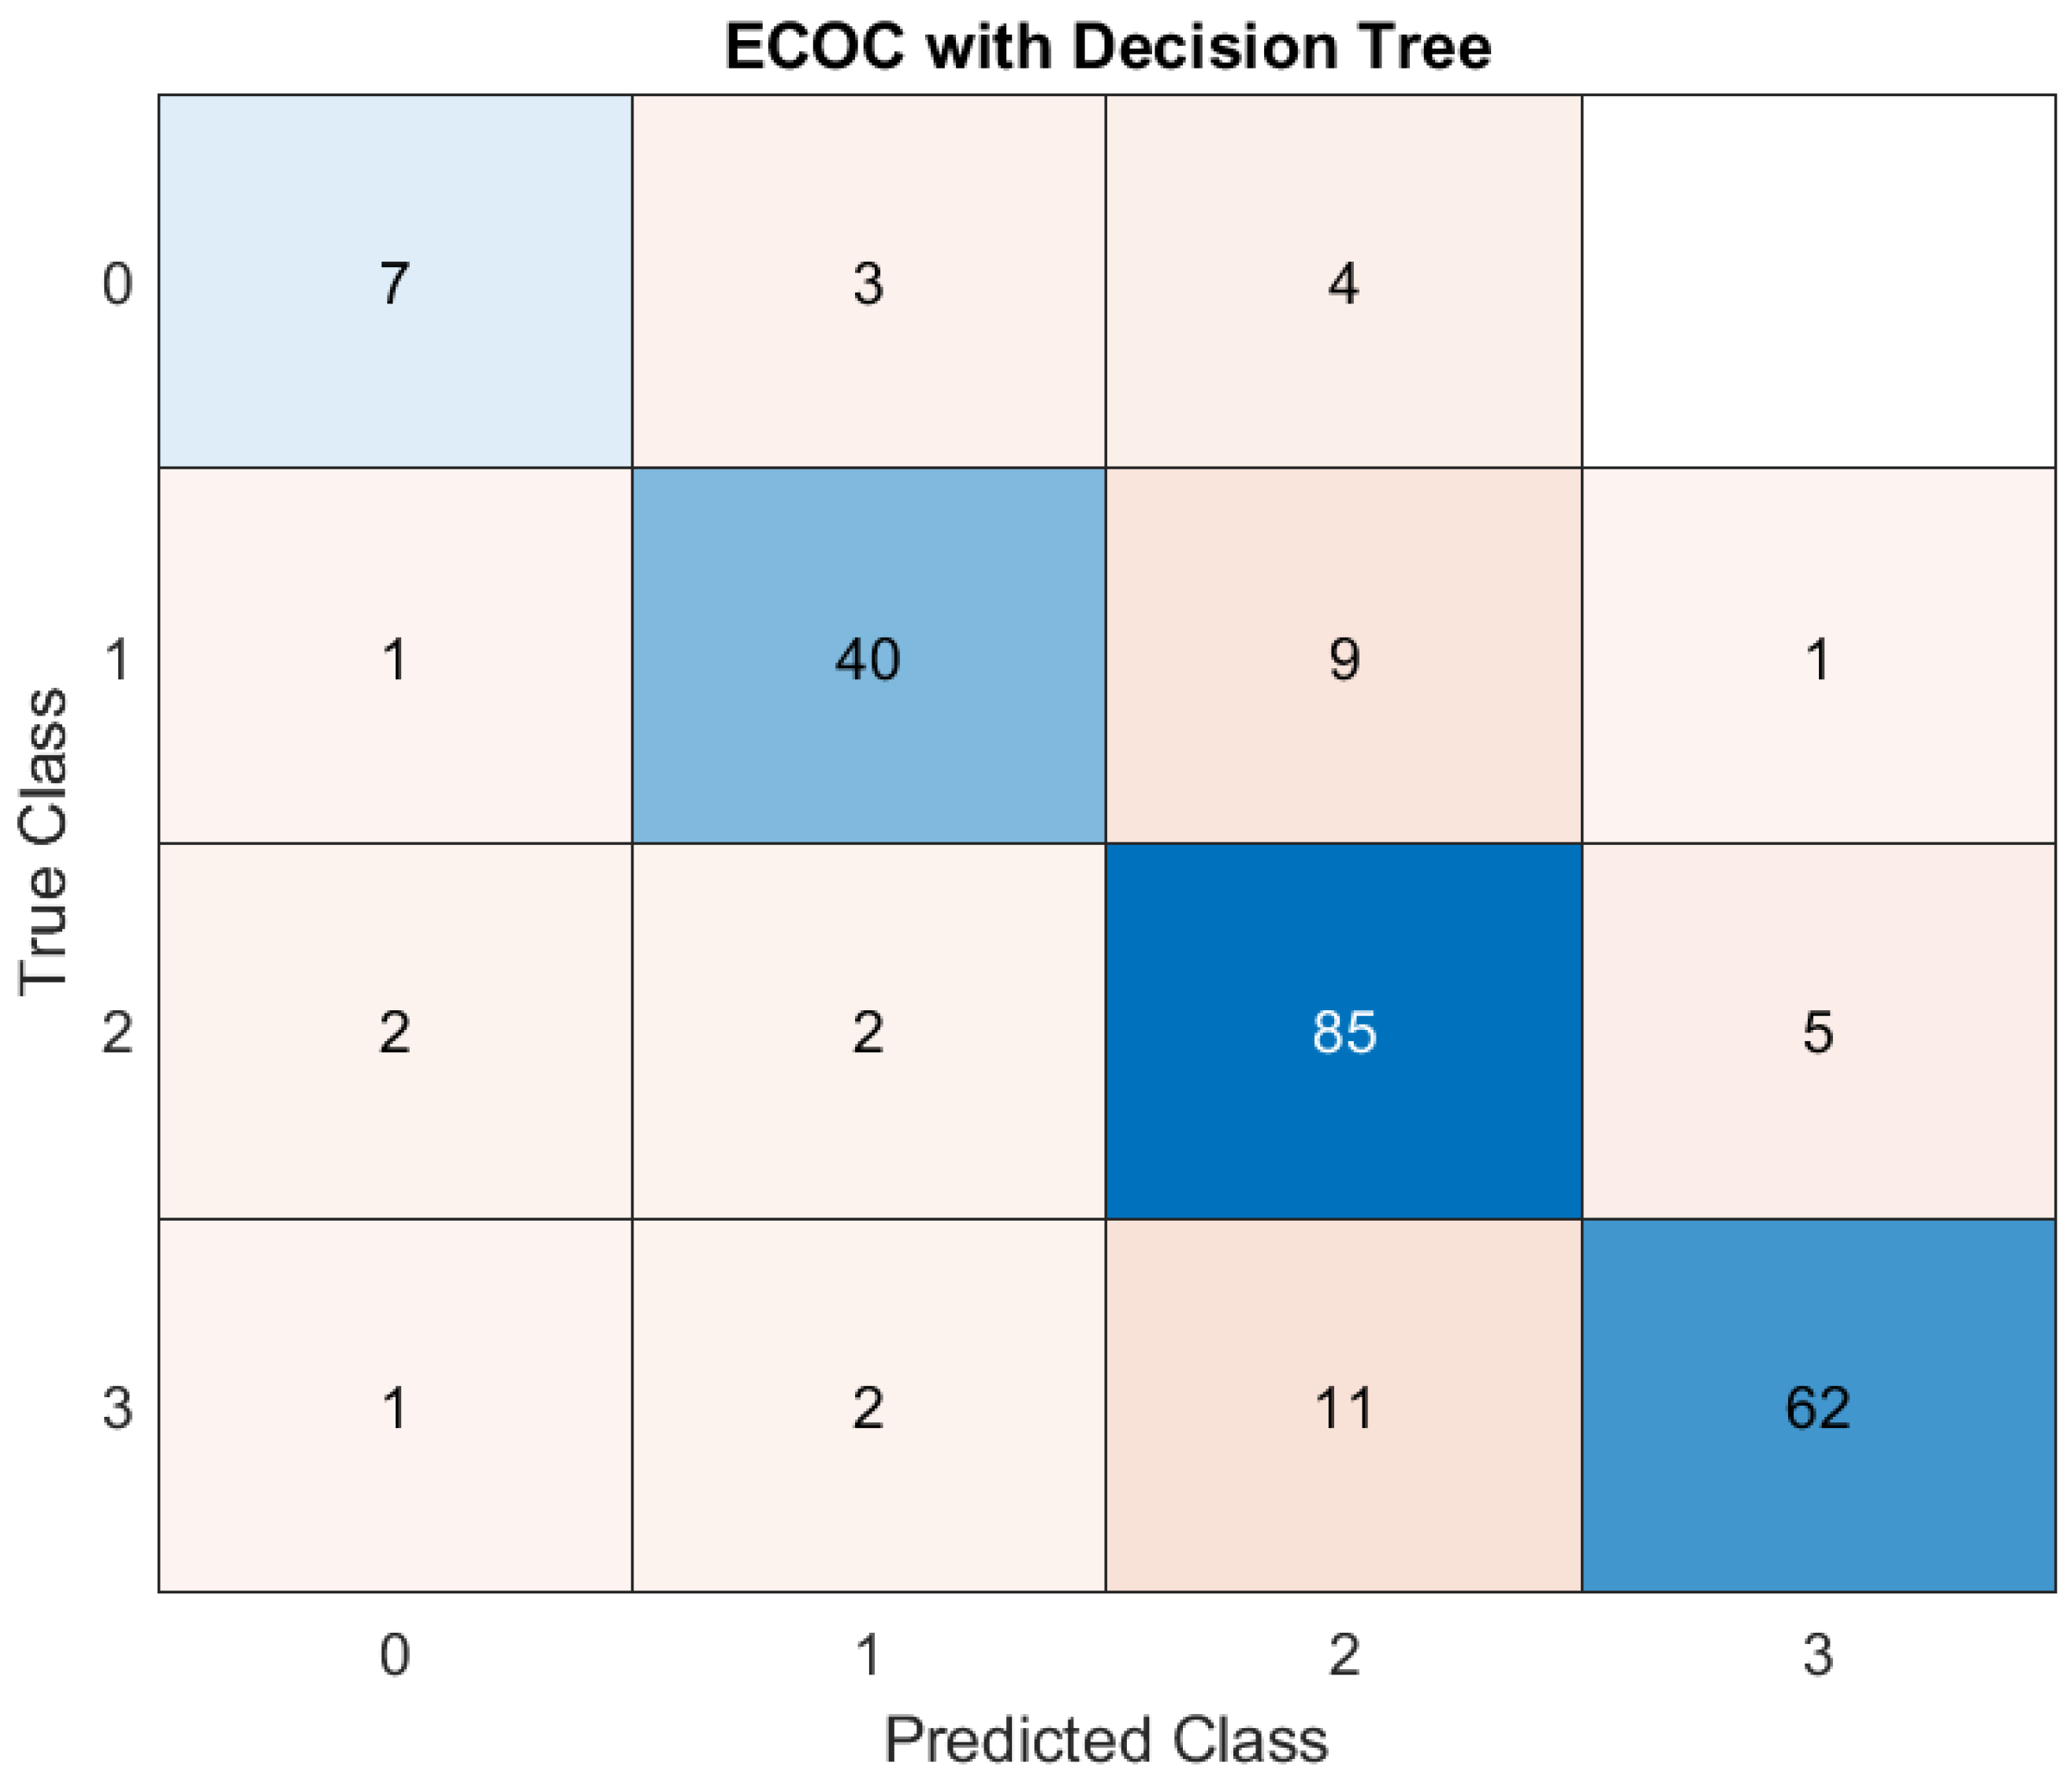
Figure 4.
ROC curve for ECOC with Decision Tree.
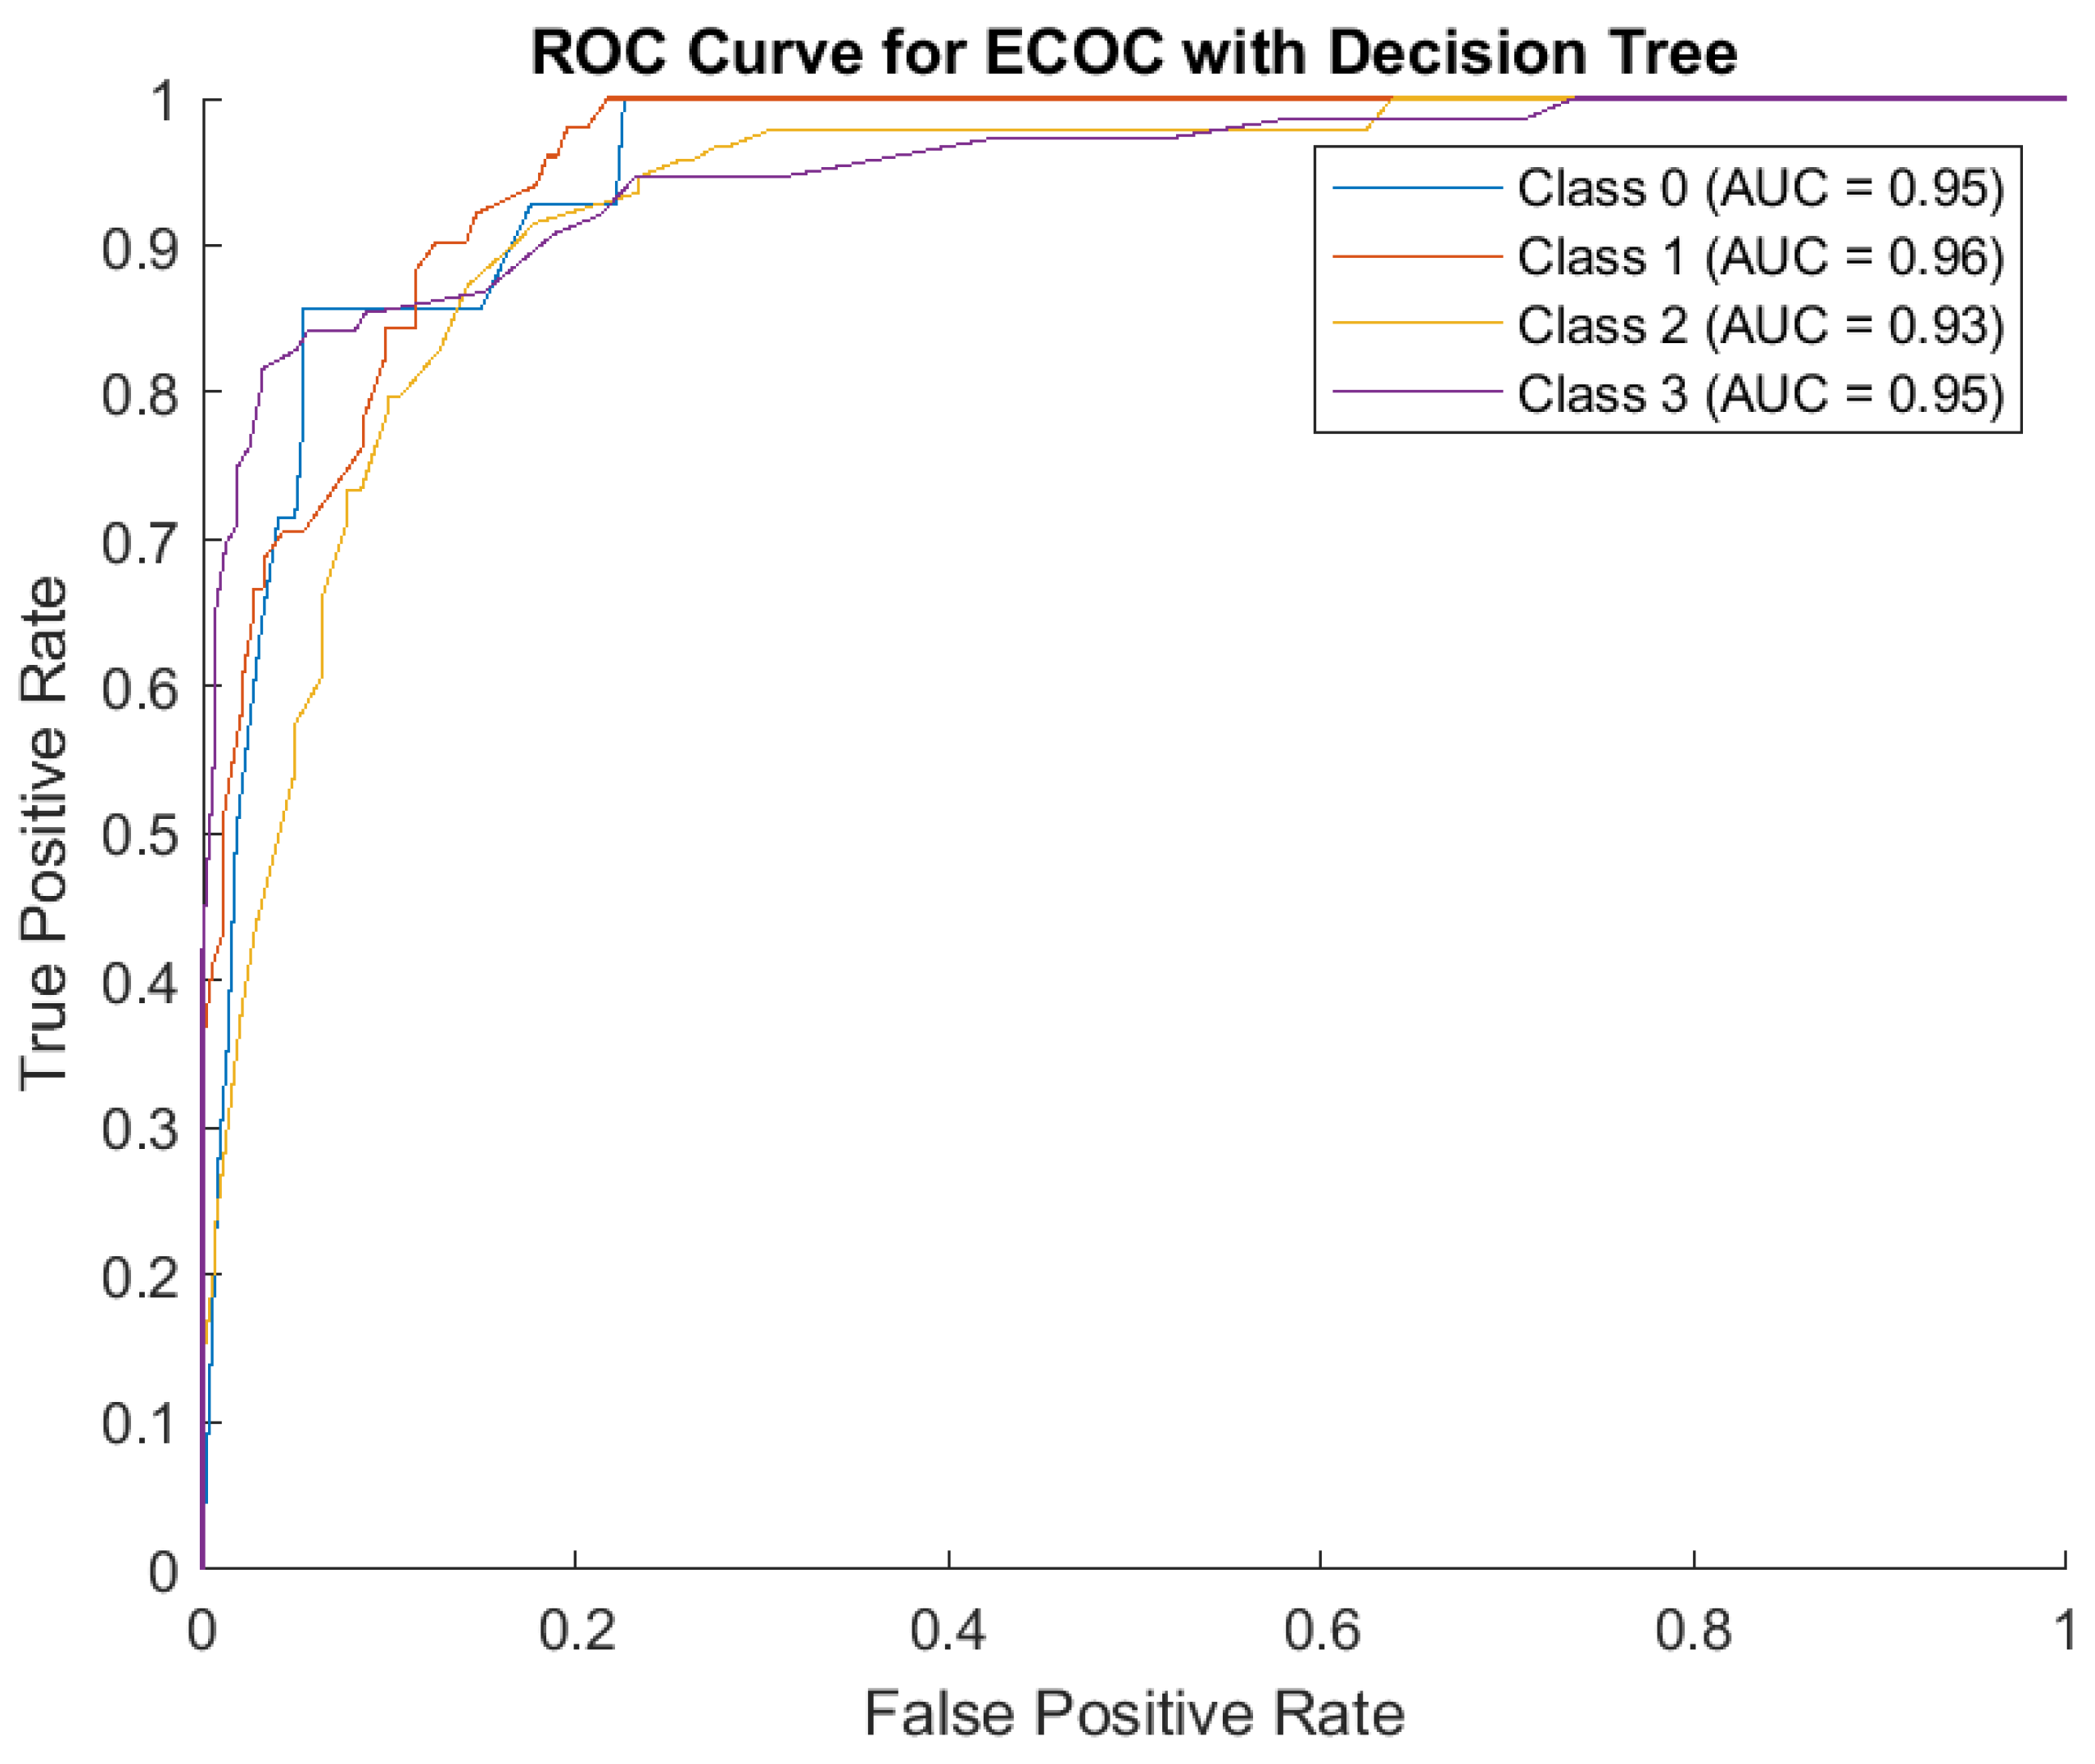
Figure 5.
Confusion Matrix for ECOC with Support Vector Machines (SVM).
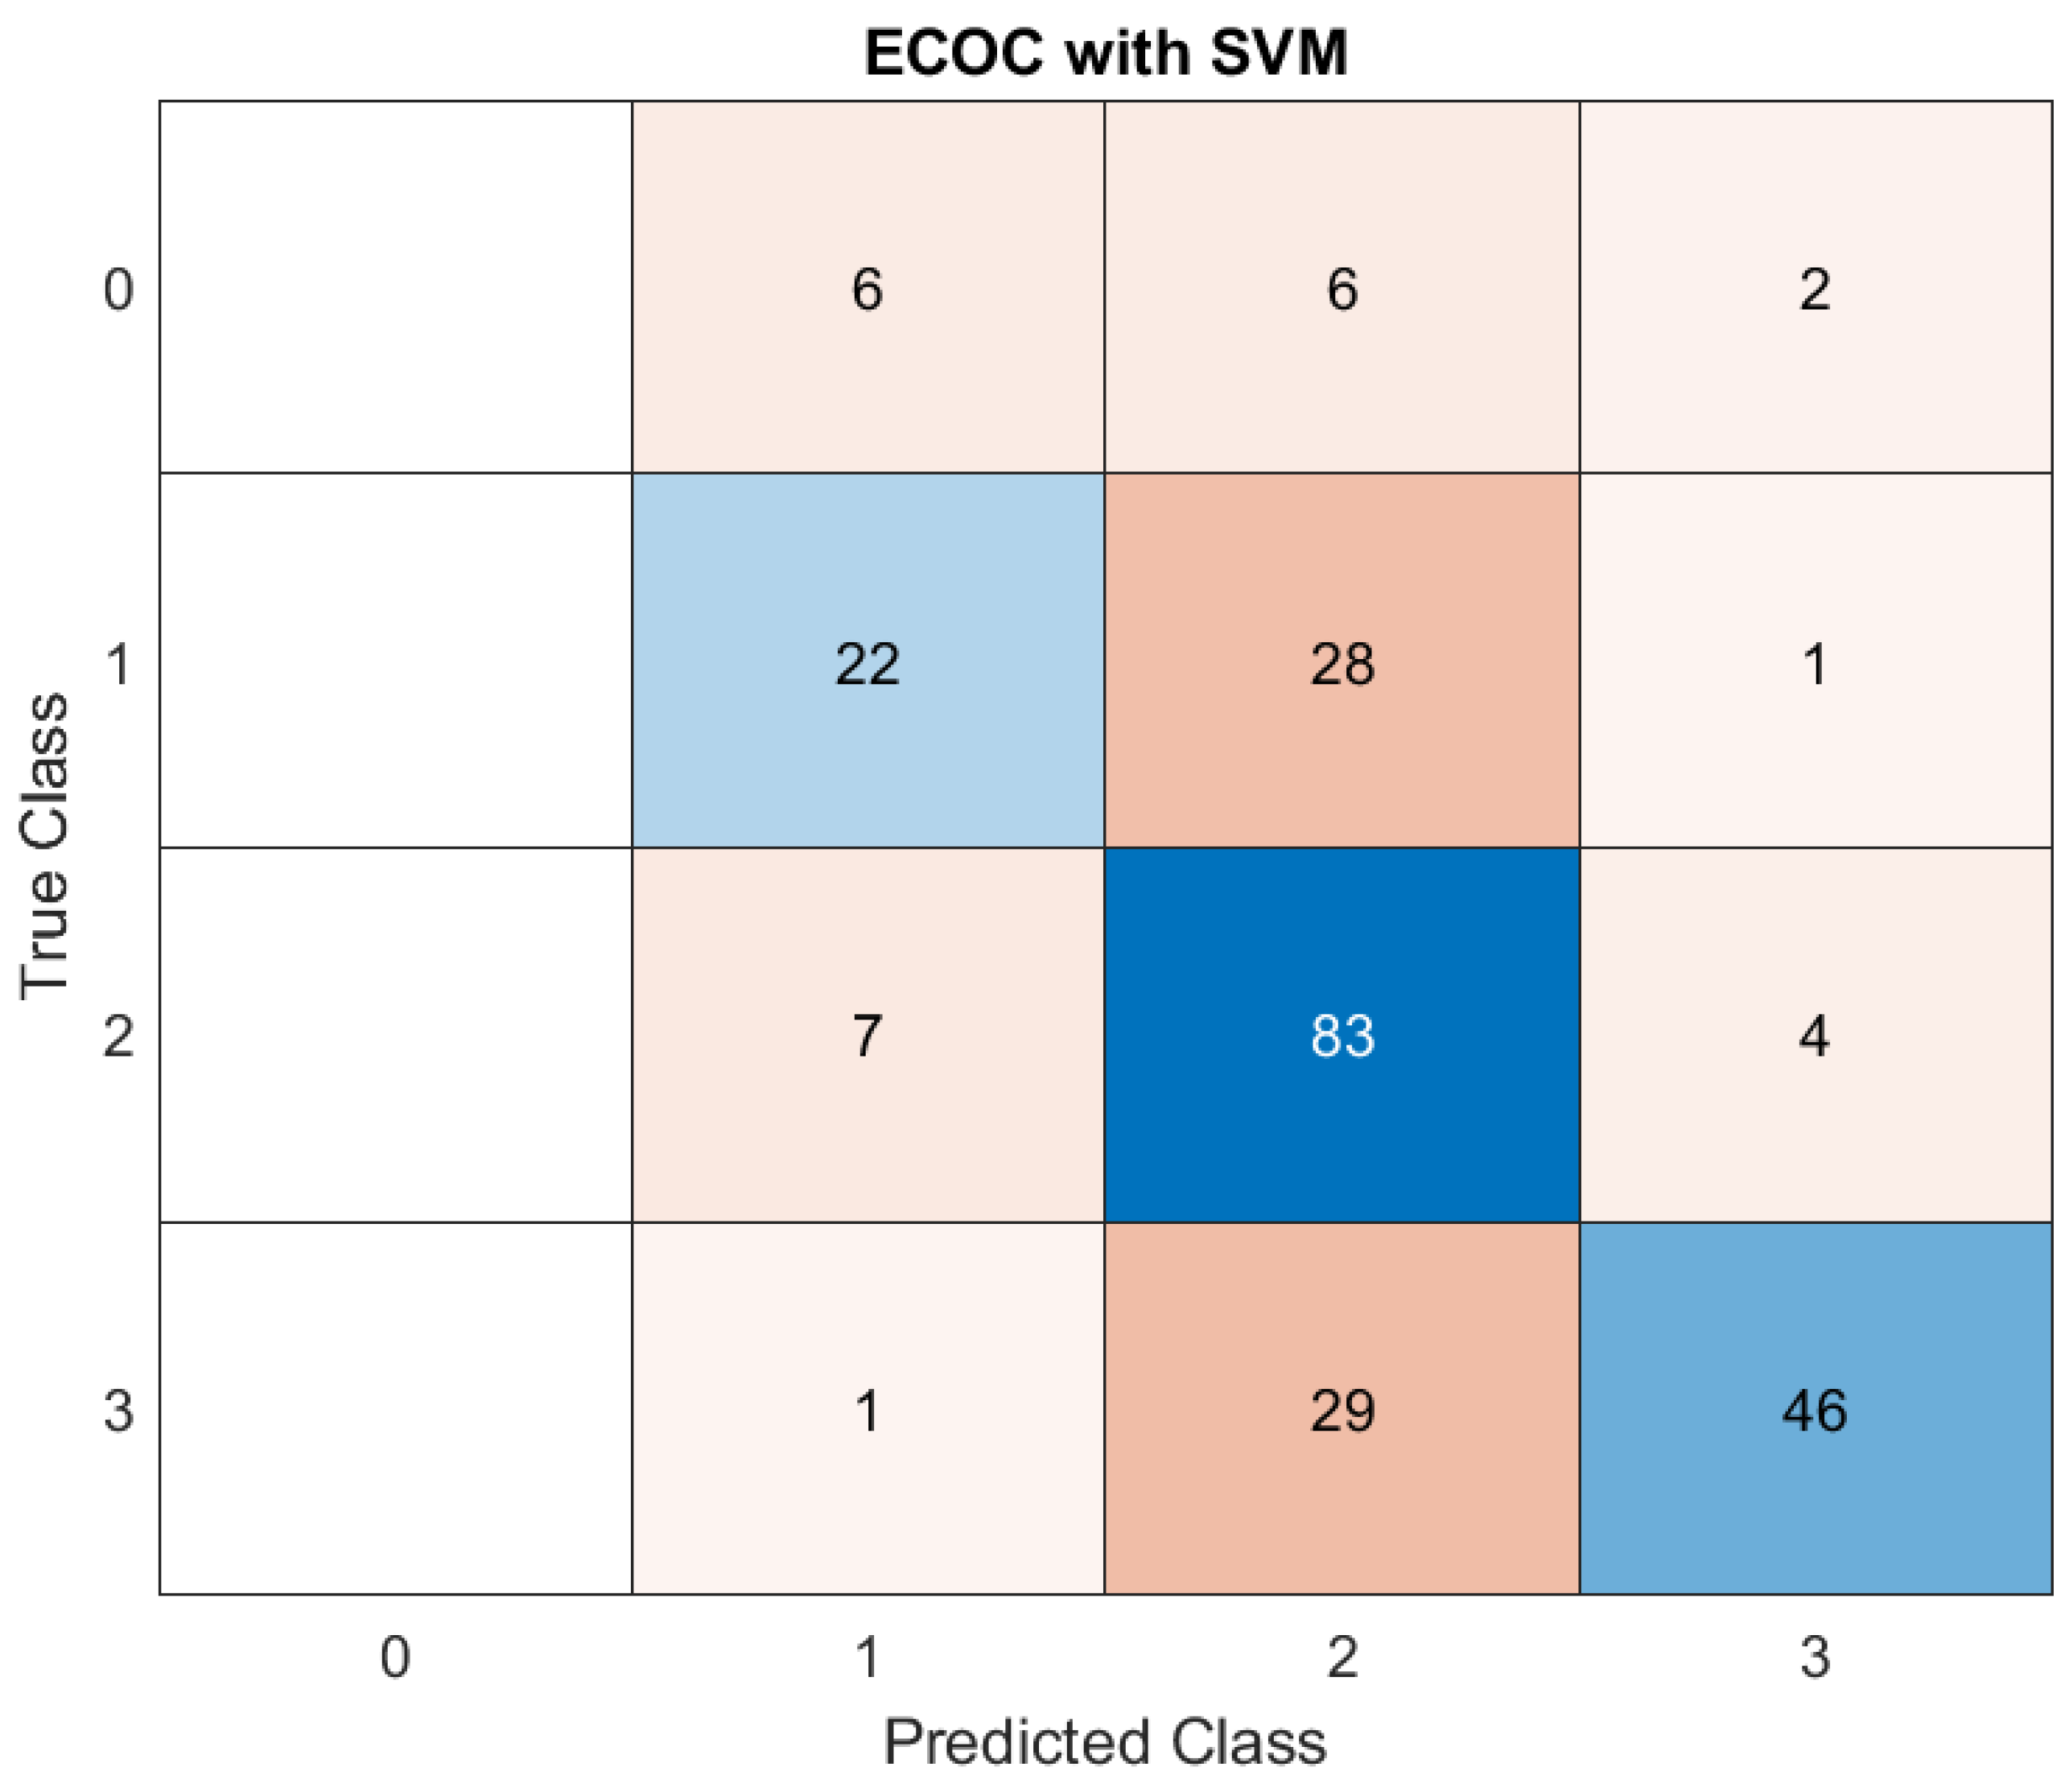
Figure 6.
ROC Curve Analysis for ECOC with SVM.
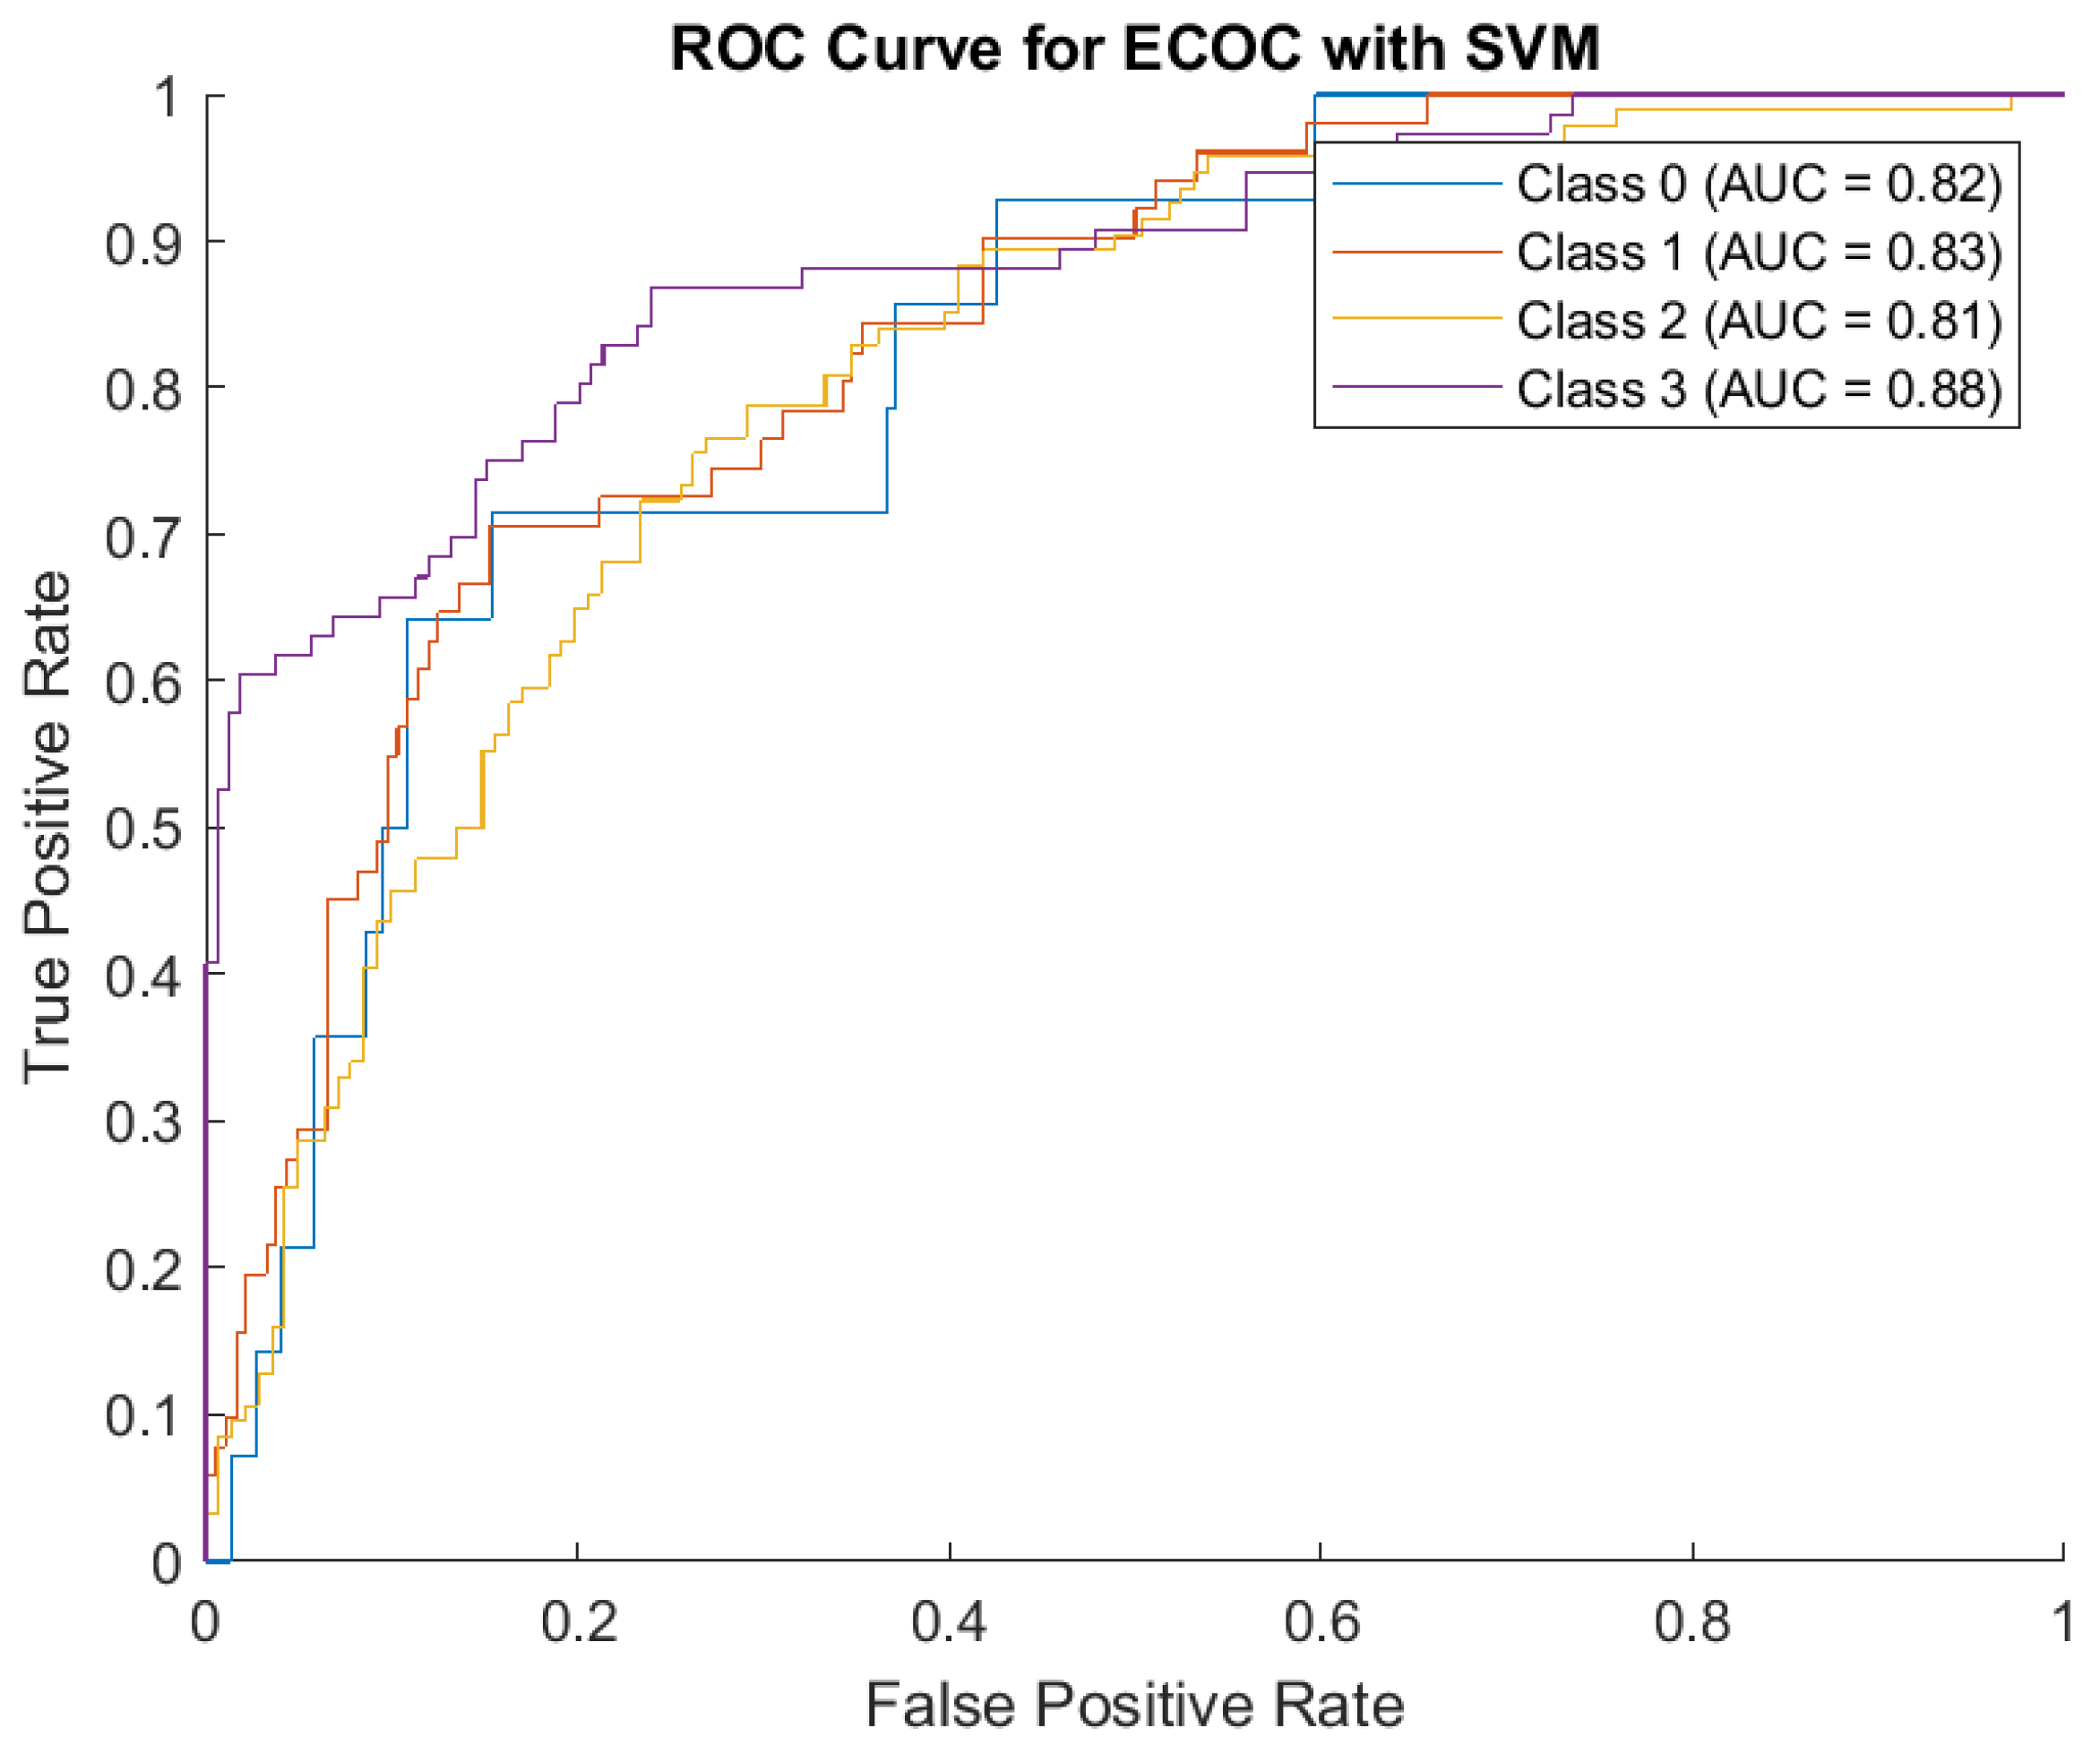
Figure 7.
Confusion Matrix for ECOC with Discriminant Analysis.
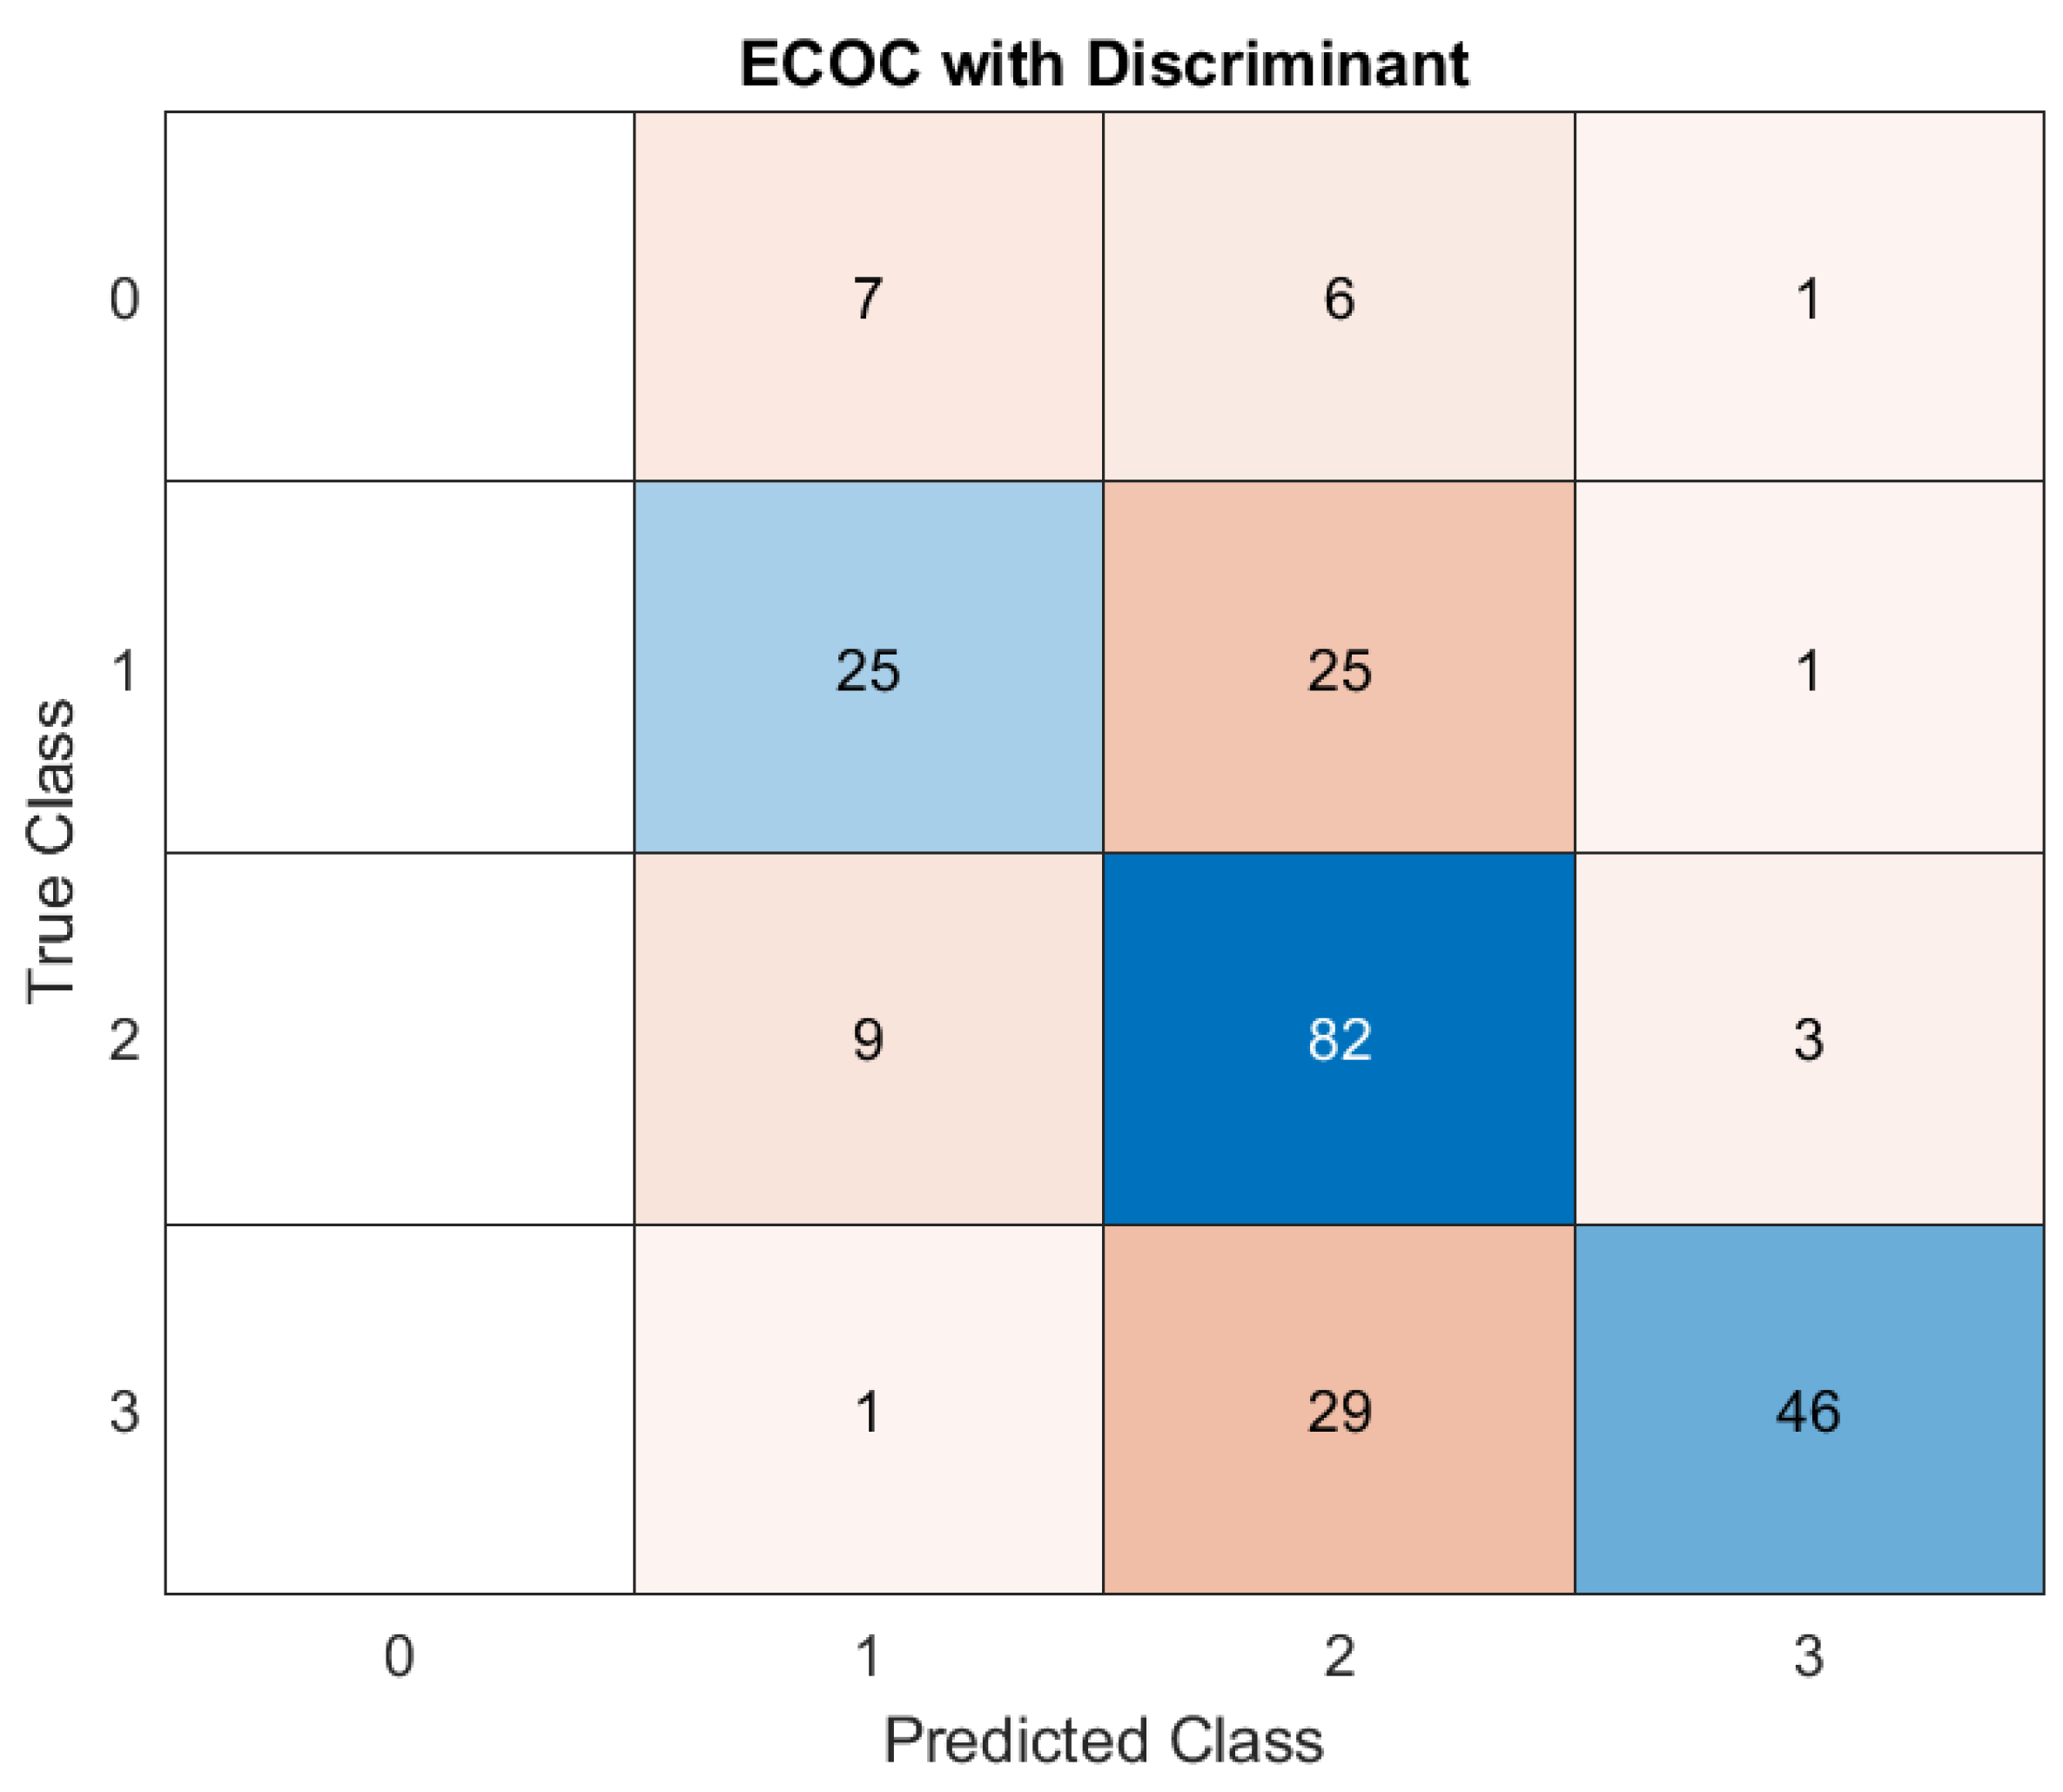
Figure 8.
ROC Curve Analysis for ECOC with Discriminant Analysis.
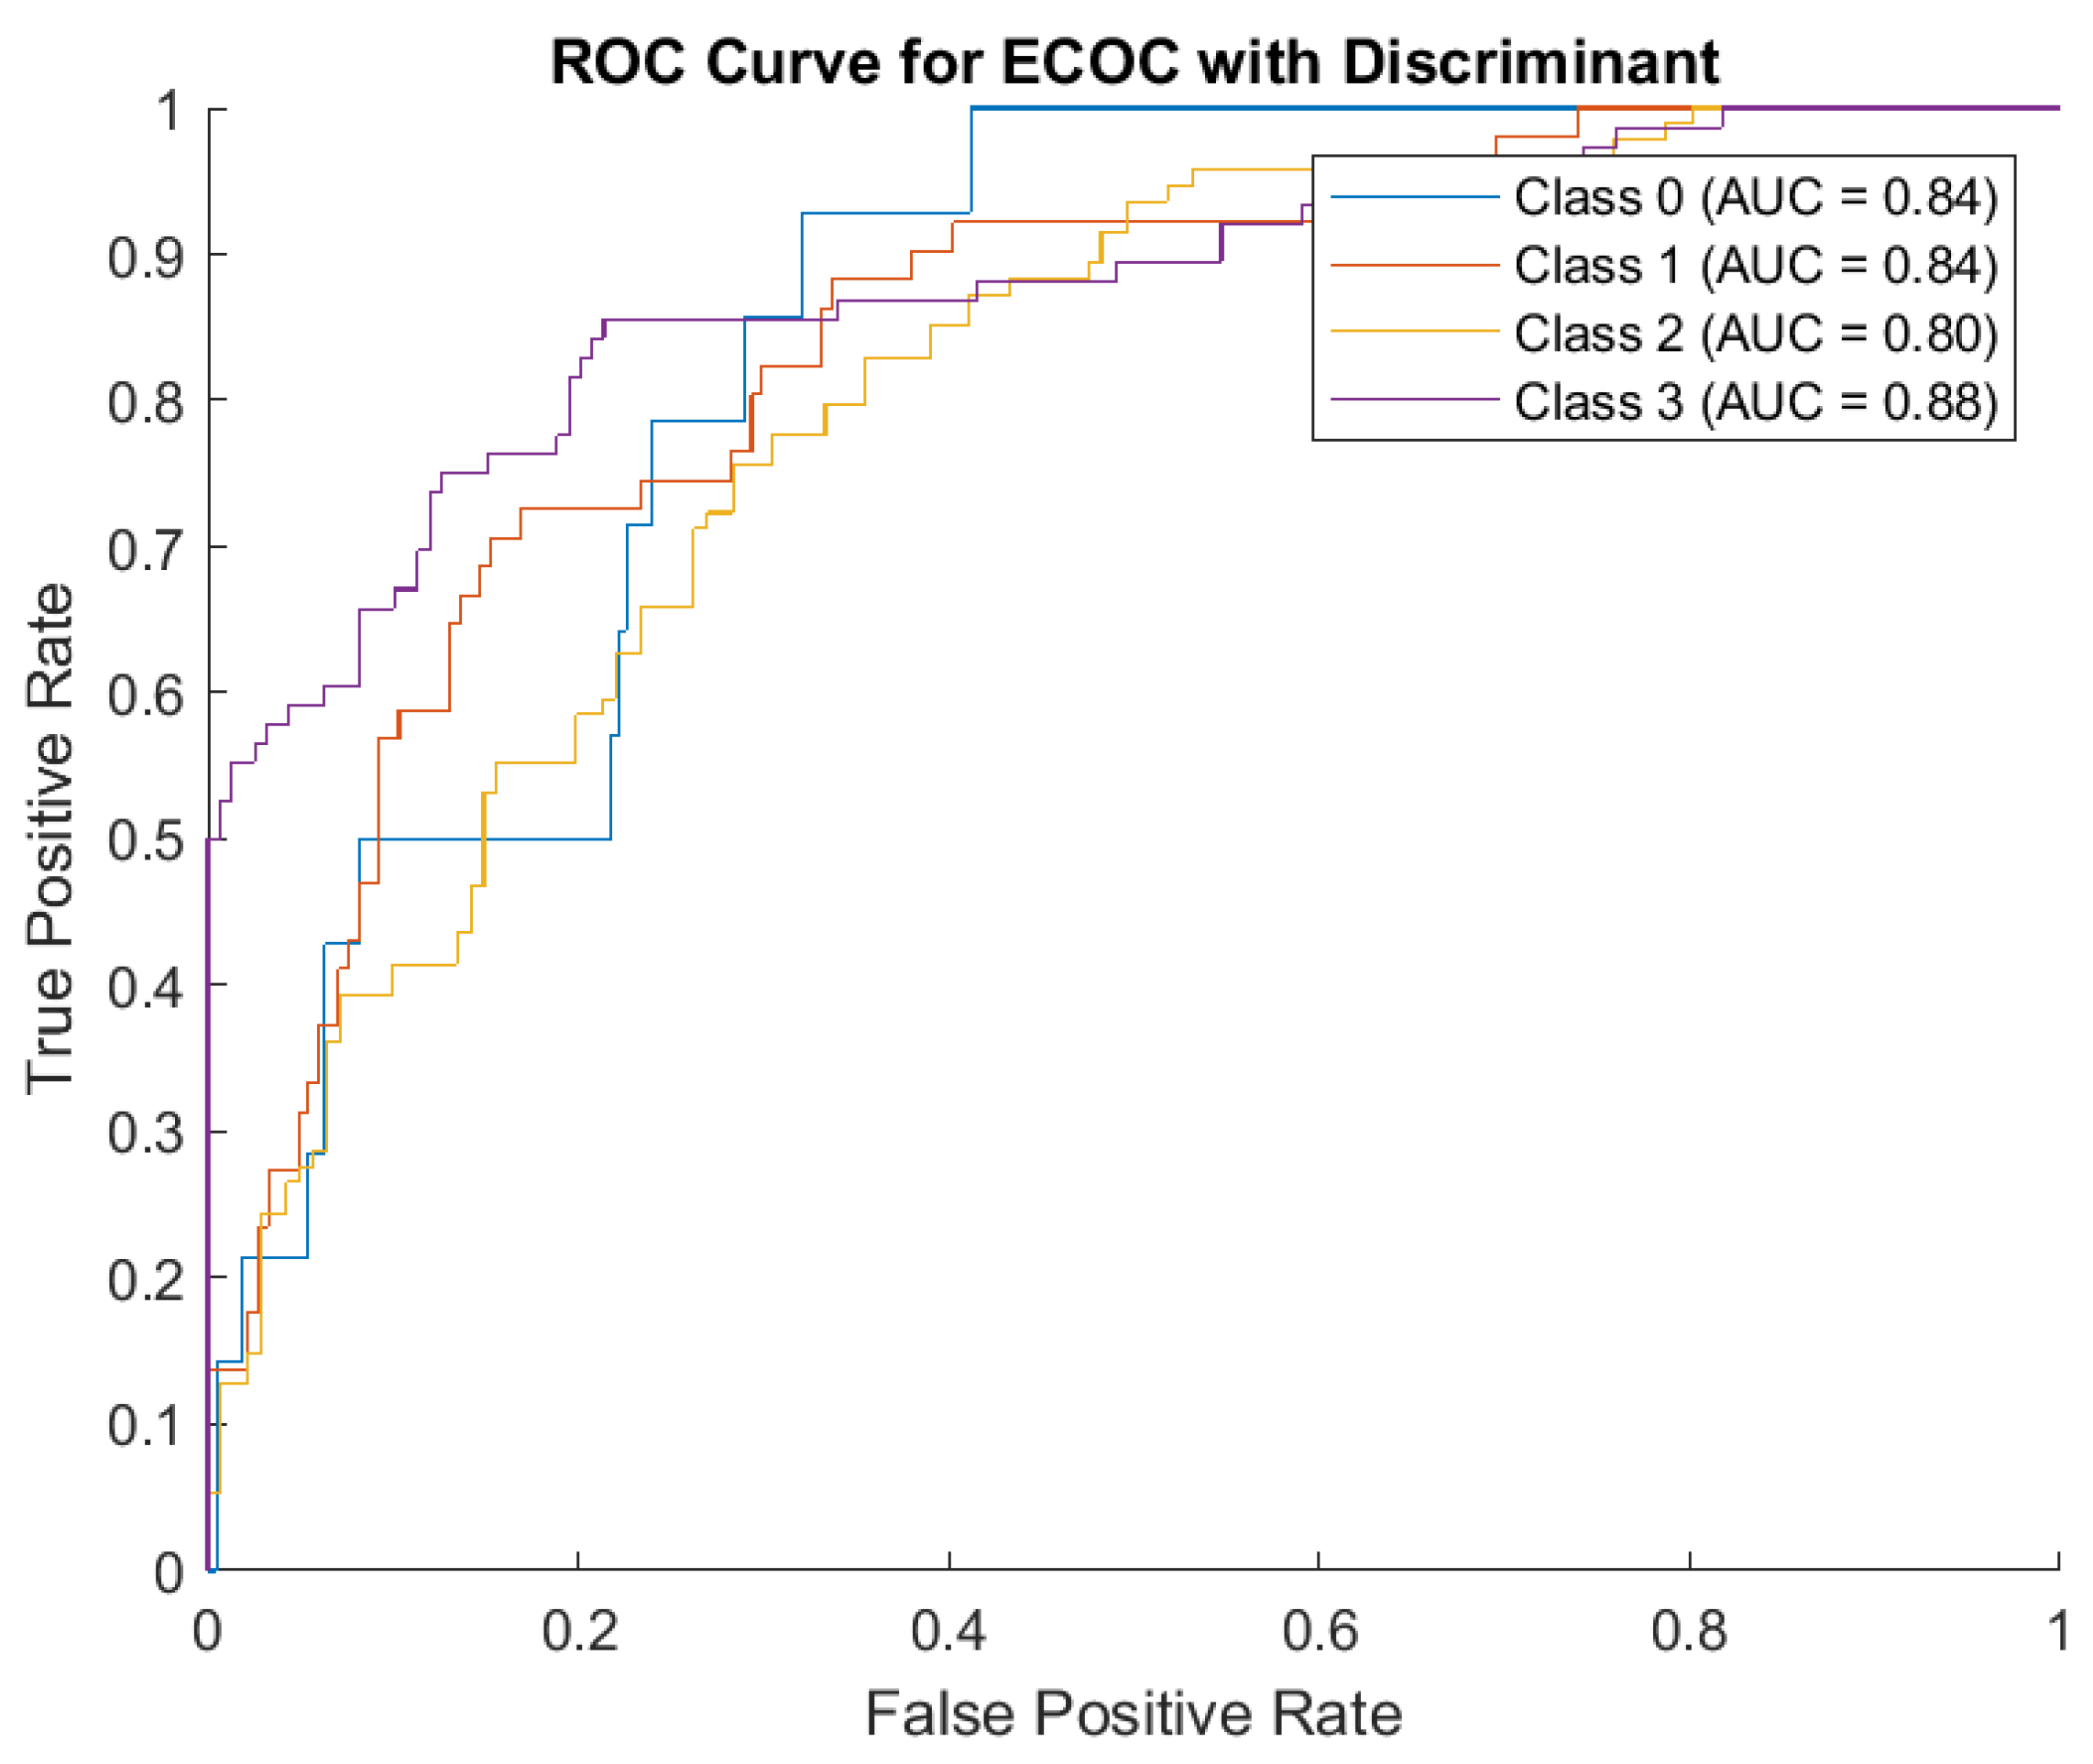
Figure 9.
Confusion Matrix for ECOC with Naive Bayes.
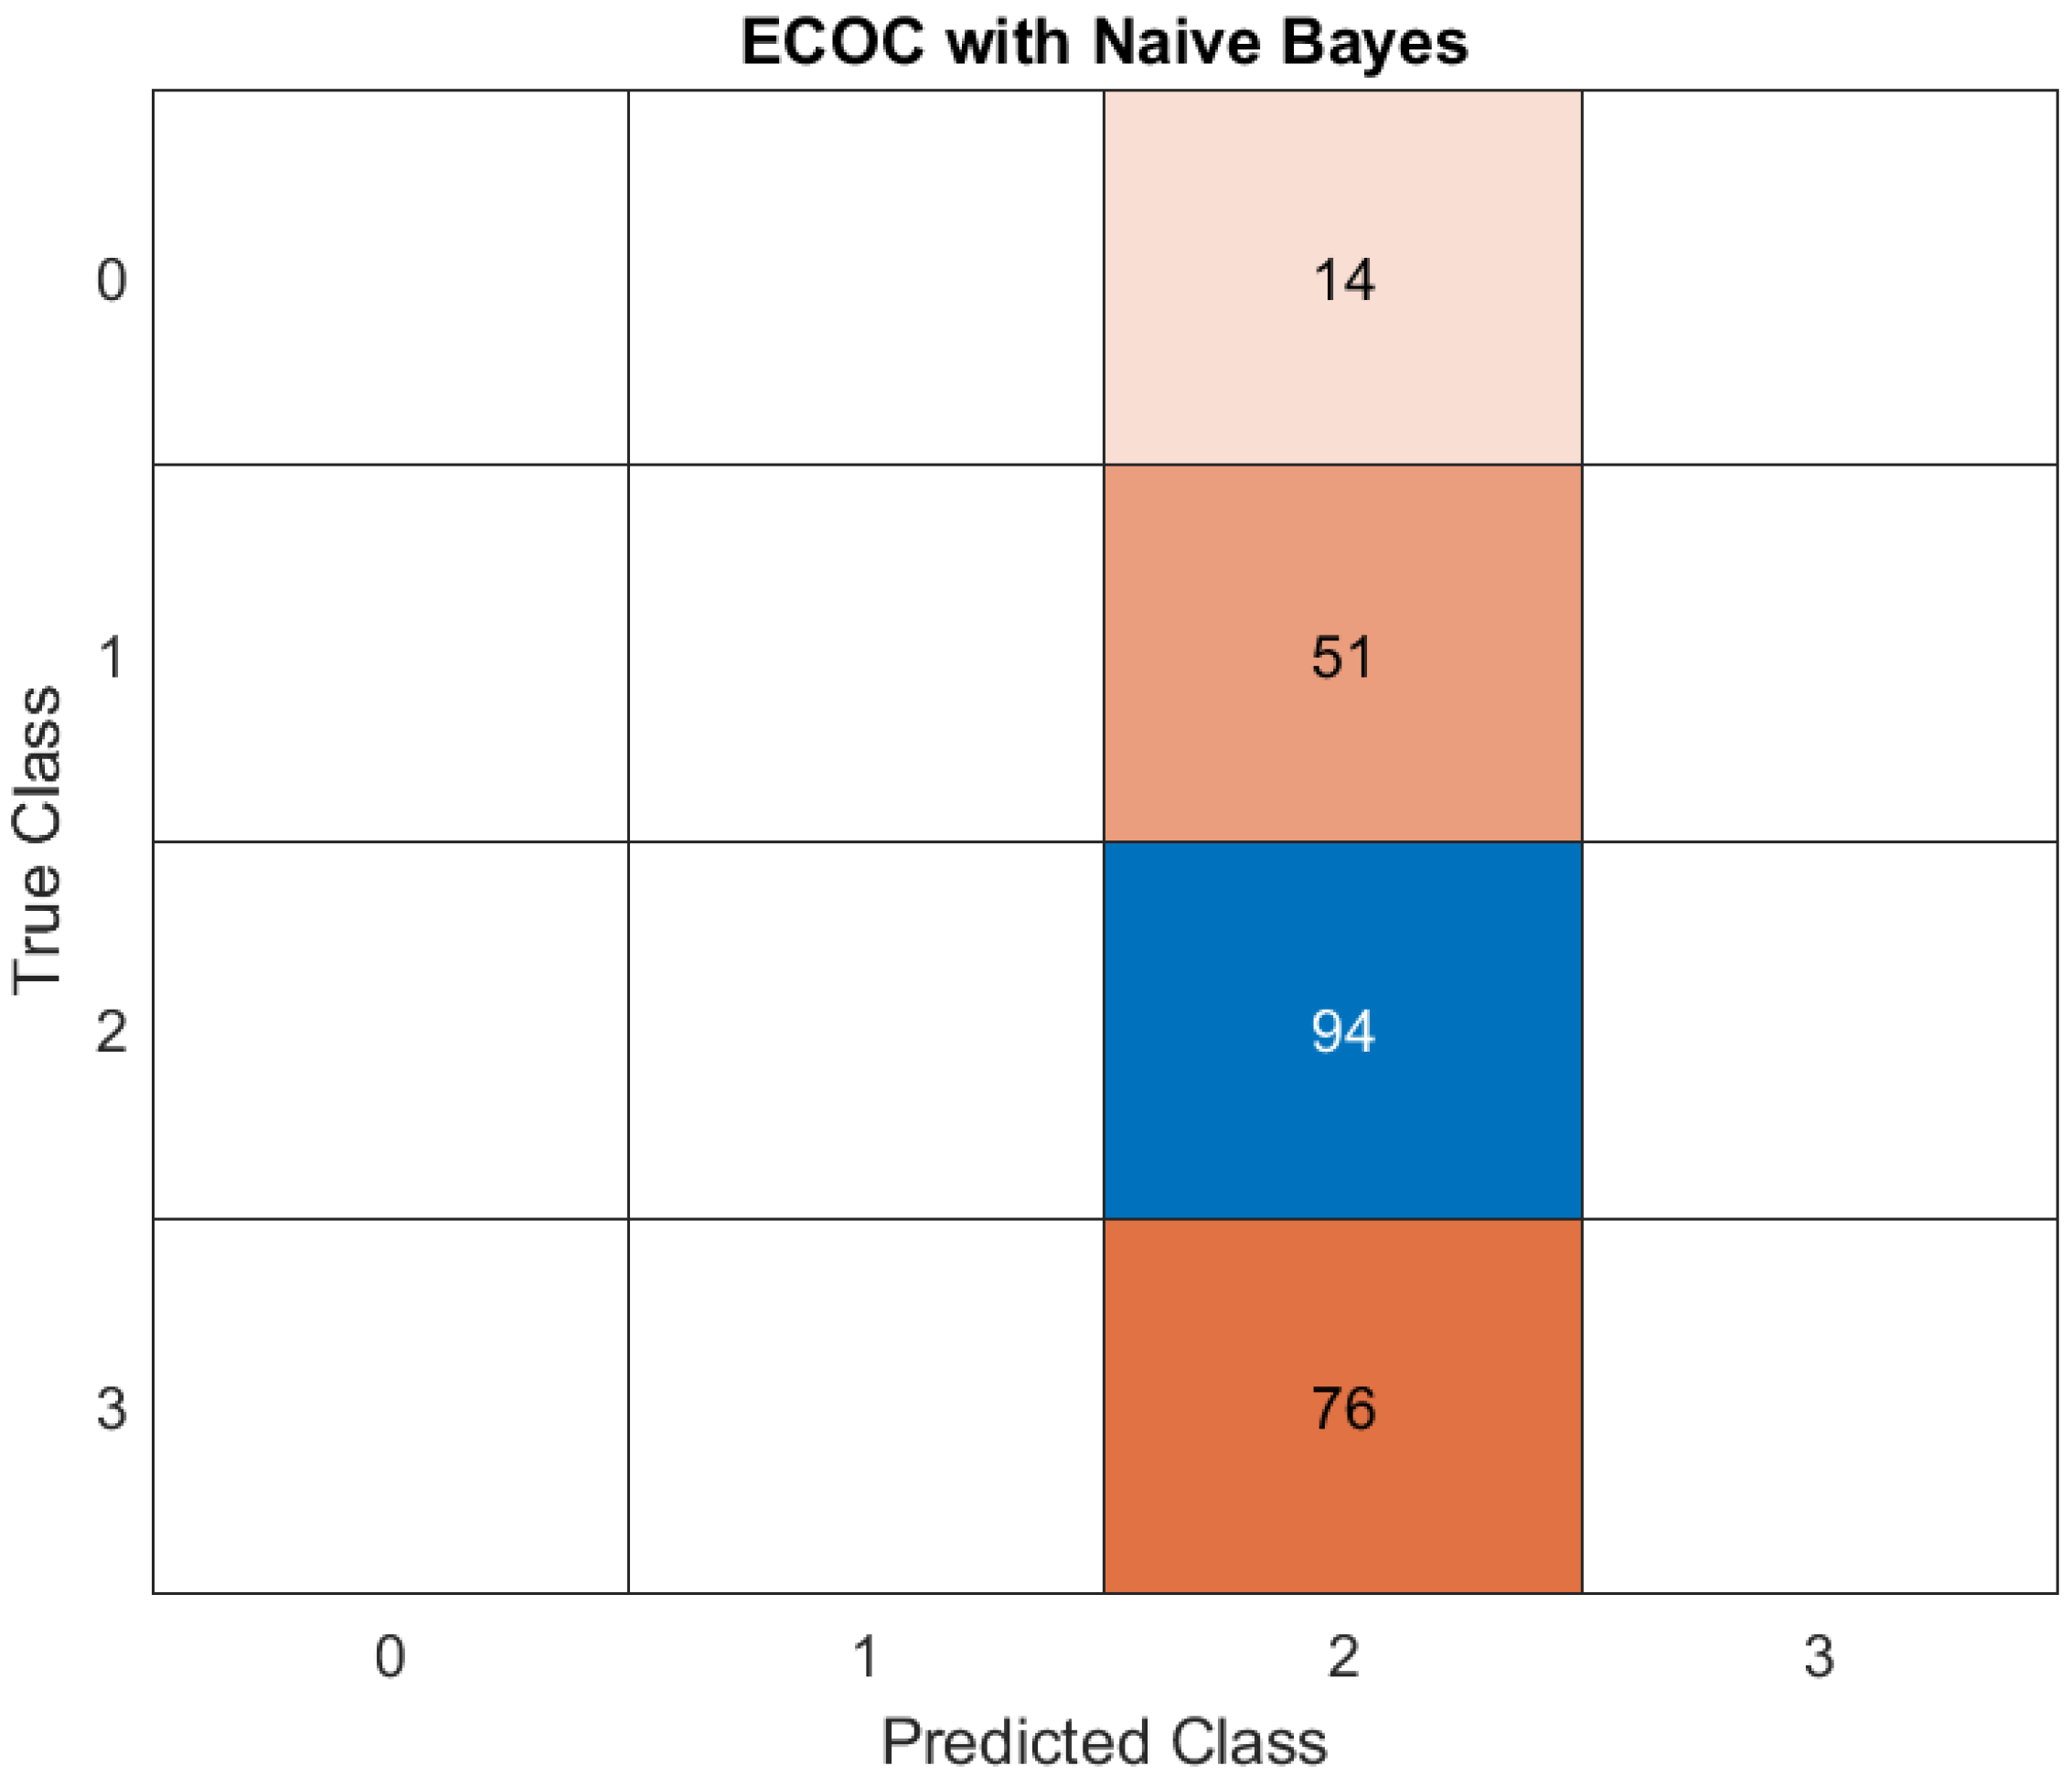
Figure 10.
ROC Curve Analysis for ECOC with Naive Bayes.
Disclaimer/Publisher’s Note: The statements, opinions and data contained in all publications are solely those of the individual author(s) and contributor(s) and not of MDPI and/or the editor(s). MDPI and/or the editor(s) disclaim responsibility for any injury to people or property resulting from any ideas, methods, instructions or products referred to in the content. |
© 2025 by the authors. Licensee MDPI, Basel, Switzerland. This article is an open access article distributed under the terms and conditions of the Creative Commons Attribution (CC BY) license (http://creativecommons.org/licenses/by/4.0/).
Copyright: This open access article is published under a Creative Commons CC BY 4.0 license, which permit the free download, distribution, and reuse, provided that the author and preprint are cited in any reuse.


