
Submitted:
15 September 2025
Posted:
16 September 2025
You are already at the latest version
Abstract
In recent decades, the urban population of Ecuador has grown, increasing the need for wastewater sanitation in cities. Wastewater treatment in this country generates sewage sludge (SS), which is mainly deposited on land near wastewater treatment plants or in sanitary landfills, generating significant environmental impacts. In view of this, composting or vermicomposting of SS can be suitable treatments for this waste, and the final materials obtained can be used as or-ganic amendments. The objective of this study was to compare the agronomic and economic aspects of composting and vermicomposting using the same SS mixtures with different plant residues. For this purpose, the evolution of various physicochemical and biological parameters of both processes, the quality of the materials obtained, and the costs of their production were evaluated. The results revealed that all the amendments presented organic matter with an ade-quate degree of maturity and levels of heavy metals and pathogenic microorganisms suitable for safe agricultural use. The vermicomposts had significantly lower levels of salts and higher levels of most macro- and micronutrients than the composts, thus increasing their economic value. However, the average production cost of composts was lower than that of vermicomposts. Thus, the choice of the most advisable method of SS treatment (composting/vermicomposting) should consider the agronomic and economic value of the nutrients in the compost and vermicompost, as well as the operating costs.
Keywords:
sewage sludge
; plant residues
; vermicomposting
; composting
; plant nutrient
; economic value of nutrients
; production costs
1. Introduction
In recent decades (2000-2023), the urban population in Latin America and the Caribbean has grown from 75% to 82% of the total population. In this same period, the average urban population in Ecuador was 62.8% of the total population [1]. This high percentage of the population in urban areas has increased the need for wastewater sanitation in cities. However, only 24.6% of total wastewater effluents were treated in Ecuador in 2023. Although the percentage of municipalities with implementation of wastewater treatment processes was 74.4% in this same year, these processes did not cover the treatment of all municipal wastewater [2]. Thus, most of the wastewater was discharged into surface water bodies as a consequence of this country's limited technical and financial capacity [3]. These discharges lead to an increase in organic and inorganic pollutants and pathogens in the receiving ecosystems and pose a risk to public health [4]. Therefore, improved wastewater treatment is necessary to protect water resources in Ecuador.
Wastewater treatment generates SS, a by-product that is difficult to manage and involves added costs in wastewater treatment. In Ecuador, SS is generally dewatered and then deposited on land adjacent to wastewater treatment plants or sent to sanitary landfills for final disposal [5]. These practices have environmental impacts, such as greenhouse gas emissions [6] and groundwater and soil contamination due to the presence in sludge of pathogenic microorganisms [7], potentially toxic organic compounds (polycyclic aromatic hydrocarbons, polychlorinated naphthalenes, polychlorinated biphenyls, nonylphenols, etc.) [8], antibiotic resistant bacteria and antibiotic resistance genes [9], microplastics [10], and heavy metals [11].
Also, dewatered SS has an organic matter content of 50-70% and mineral components of 30-50%, among which N accounts for 3.4-4.0% and P accounts for 0.5-2.5%. Significant amounts of micronutrients are also contained in SS [12]. Treating this waste by composting or vermicomposting to obtain organic fertilizers would contribute to the recovery of these constituents and their introduction into the agricultural production cycle. This would reduce the need for inorganic fertilizers and lower the costs and environmental impacts associated with their production. In addition, the use of these waste valorization techniques can reduce the risks of untreated sewage sludge land application by degrading potentially toxic organic compounds [13], reducing antibiotic content and the abundance of antibiotic resistance genes [14,15], and inactivating the load of pathogenic bacteria [13]. Composting and vermicomposting techniques have proven highly efficient in treating organic waste, with low technology and cost [16,17], which makes them feasible for implementation in developing countries such as Ecuador. In composting, the organic matter of the waste undergoes exothermic oxidation performed by different bacteria and fungi under controlled conditions. This includes a thermophilic stage, where a sanitized final material free of phytotoxins with a stabilized and humified organic matter (compost) is obtained [18]. In vermicomposting, the organic fraction of the waste is ingested by worms, producing its fragmentation and conditioning for subsequent degradation by microorganisms, which convert the waste into a humified and stabilized material [16].
Several studies have been conducted comparing composting and vermicomposting as techniques for the reuse of SS. Dume et al. [19] studied the technological feasibility and final product quality of composting and vermicomposting SS and pelleted straw at different ratios to produce differing initial C/N ratios (C/N ratios of 6:1, 18:1, 28:1, and 38:1). These authors observed that the initial C/N ratio of the residue mixture is a determining factor in the characteristics of the final compost and vermicompost products, finding that the agrochemical characteristics of the vermicompost resulting from the initial mixture with a C/N ratio of 18:1 were the best of all the treatments tested and significantly outperformed those of the compost. However, Rékási et al. [20] found no significant differences in organic matter quality and macronutrient content between the vermicompost and compost resulting from a mixture of SS digestate with different plant residues, spent mushroom substrate, and biochar, observing only a higher concentration of plant growth hormones in the case of the vermicompost. Differences in certain enzyme activities during composting and vermicomposting of SS mixed with straw pellets have also been investigated, with lower enzyme activity during the vermicomposting process, probably because some processes take place in the digestive tract of the earthworm [21]. Lv et al. [22] found that the type of process for treating SS mixed with livestock manure (composting or vermicomposting) can be a decisive factor affecting the abundance and diversity of microbial communities. The different physicochemical properties of the substrate caused by transformations of the initial waste produced during composting or vermicomposting also played an important role in the bacterial community and its composition. Regarding the reduction of contaminants present in SS, it has been found that composting is more effective in reducing potentially toxic organic compounds, and both techniques were effective in inactivating pathogenic microorganisms [13]. Włóka et al. [23] also observed that both the composting and vermicomposting processes removed a large part of the polycyclic aromatic hydrocarbons present in SS, reducing the phytotoxic effects of untreated sludge on seed germination and seedling growth of Brassica napus L. However, vermicomposting obtained the best results.
According to the above information, it can be observed that numerous comparative studies have been carried out on the processes of composting and vermicomposting SS, focusing on the technological feasibility of these processes, the capacity of these techniques to reduce the pollutant load of the sludge, and the quality of the final compost and vermicompost. However, no joint studies have been found comparing both techniques using the same waste mixtures to valorize the SS, where the evolution of both processes, the quality of the materials obtained, and the economic aspects of these processes are studied.
Therefore, the objective of this study was to compare composting and vermicomposting of the same SS mixtures with different vegetable wastes to evaluate the evolution of the principal physicochemical and biological parameters in both processes, the agronomic and economic value of the compost and vermicompost obtained, and the costs of these processes to determine which of them is the most recommendable for the reuse of SS in the studied area.
2. Materials and Methods
2.1. Experimental Procedure of the Composting and Vermicomposting Processes
The composting and vermicomposting processes were carried out during the months of January to June 2022, at the El Prado farm facilities belonging to the Faculty of Agricultural Engineering, University of the Armed Forces in Sangolquí (Pichincha-Ecuador, 0° 23' 20" S; 78° 24' 44" W). The wastes used were barley residue (BR), garden waste (GW), and SS. The SS came from the wastewater treatment plant located in Cochauco (Pichincha-Ecuador), with an aerobic activated sludge treatment system. The vegetable residues came from local gardens and barley crops and were ground to a particle size of 1-5 cm prior to composting or vermicomposting with SS. A representative sample of these wastes was taken to determine their main characteristics, which are shown in Table 1.
Two waste mixtures were made from the above wastes in the following proportions on a fresh weight basis:
- Mixture 1: 35% SS + 65% GW
- Mixture 2: 45% SS + 55% BR
The proportions of the waste mixture were determined by their suitable free air space (30-50% [18]) to achieve optimal gas diffusion during composting, not on their chemical properties, so they were not adjusted to the recommended ideal initial C/N ratio (25-35 [18]) (Table 2). Both waste mixtures were replicated, maintaining the same proportions, for composting and vermicomposting.
The waste mixtures prepared for the composting experiment were piled in a trapezoidal shape, weighing 1000 kg each and measuring 2 x 3 m at the base and 1.5 m in height. These mixtures were composted using a turning aeration system. Turnings were performed when the temperature was below thermophilic values (< 40ºC), which at the beginning of the process indicates a lack of oxygen and homogenization of the waste to be composted. The temperature was measured daily in the center of the pile using a temperature probe, taking the average value of the measurements at five points along the longitudinal section of the mixture and at the same time of day. The ambient temperature was also recorded daily. When the temperature of the piles was similar to the ambient temperature and no reheating occurred after turning, the bio-oxidative phase was considered to be finished, and the piles were left to mature for one month without aeration. During the bio-oxidative and maturing phases, the moisture was controlled by sprinkler irrigation within the 40-60% range. The piles were sampled four times: at the beginning of the process, during the thermophilic phase, at the end of the bio-oxidative phase, and at the end of the maturity phase. Sampling was carried out by taking seven subsamples from different random points of the pile covering the entire pile profile. These subsamples were mixed to obtain a representative sample of 2 kg., then dried at 60°C, ground, and sieved at 0.5 mm for further analysis. All determinations were performed in triplicate.
For the vermicomposting experiment, the above waste mixtures were pre-composted for approximately 25 days by forming trapezoidal piles with the same weight and dimensions as the piles designed for the composting experiment. On day 13 of composting, a turning was performed for the oxygenation and homogenization of the waste mixture. Moisture was also controlled during the pre-composting process in the same way as in the composting experiment. The pre-composting phase is essential to degrade the most labile compounds, thus reducing the concentration of toxic compounds and lowering the high temperatures resulting from this initial process of decomposition, which is harmful to earthworms [19]. After pre-composting, the waste mixtures were placed in the vermicomposters, and an average of 115 adult Eisenia andrei earthworms/kg of waste mixture, with an average worm weight of 0.3 g, were added. Before adding the worms, their weight was determined. Moisture was maintained within the 70-80% range throughout the process using a sprinkler system. The duration of the vermicomposting process was the same as that of the bio-oxidative stage of the composting process (around 100 days). The vermicompost obtained was then left to mature for one month without worms; the humidity was maintained at between 40-60%. Throughout the vermicomposting process, six samples were taken, of which only four corresponded to the same sampling periods performed in the composting experiment (initial, around days 25 and 100, and at the end of the maturity period). In all the periods, sampling was carried out by taking seven subsamples throughout the vermicomposter, which were thoroughly mixed, and a single sample of approximately 5 kg was obtained. In this representative sample, the worms were separated for counting and weighing and then returned to the vermicomposter. In this way, the number and weight of worms per mass of material were determined. Once the worms were counted and weighed, the sample was returned to the vermicomposter. Only in the case of samples taken during the same periods as in the composting process, 2 kg of material without worms were taken for drying, grinding, and sieving before the studied parameters were analyzed. All analyses were performed in triplicate.
2.2. Compost and Vermicompost Production Costs and Economic Value of the Nutrients Contained in These Final Materials
The economic evaluation of the macronutrients present in the compost and vermicompost was performed by calculating the cost of the fertilizer units of commercial inorganic fertilizers, following the procedure described by Idrovo-Novillo et al. [24]. The fertilizers used were urea, diammonium phosphate (DAP), and potassium chloride (KCl). Their prices for the year 2024 in the province of Pichincha (Ecuador) were 634.2, 913.4, and 665.2 US dollars per ton for urea, DAP, and KCl, respectively [25]. The economic value of the fertilizer units of these agrochemicals was calculated from their percentages (46% N, 46% P₂O₃, and 60% K₂O for urea, DAP, and KCl, respectively), resulting in US$13.8, US$45.1, and US$13.4 per ton for N, P₂O₃, and K₂O, respectively. This value for each fertilizer unit was applied to the nutrients contained in the final compost and vermicompost, considering a moisture content of 45 % (average value of the range recommended by the US Composting Council [26]: 40-50%, for various applications of composts and different field conditions).
For the economic analysis of the production costs of the composts and vermicomposts, the following costs were considered: raw material for composting and vermicomposting (transportation of all waste and shredding of vegetable waste) and preparation and control of the waste mixtures during the composting and vermicomposting process (labor to prepare the waste mixture, turning, irrigation, and control of the process and water used in both processes to control moisture). These costs were shown in US dollars per ton of compost or vermicompost obtained. The quantities produced of these materials were 300, 420, 595, and 665 kg for compost 1, compost 2, vermicompost 1, and vermicompost 2, respectively.
2.3. Analytical and Statistical Methods
In the raw materials and samples taken throughout the composting and vermicomposting processes, the parameters of pH, electrical conductivity (EC), organic matter (OM), total organic carbon (Corg), total nitrogen (Nt), germination index (GI), macro- and micronutrients, and potentially toxic elements were determined following the techniques described in the work of Idrovo-Novillo et al. [24]. To determine the pathogenic microorganisms Escherichia coli and Salmonella spp, the official methods ISO 7251 [27] and ISO 6579 [28] were used, respectively.
Regarding the statistical methods used, the significant differences in the mean values of each parameter analyzed during the composting and vermicomposting processes were determined using the least significant difference (LSD) test. Confidence intervals were calculated for all the data shown in the figures to compare the effect of the different residue mixtures studied. In addition, a one-way analysis of variance (ANOVA) was applied to determine the differences in agronomic and economic value between the final composts and vermicomposts, and a Tukey-b test was employed to separate the mean values. The significance level of these statistical tests was set at P < 0.05. The IBM SPSS 27 statistical program was used for these statistical data analyses (IBM Software, Armonk, NY, USA).
3. Results and Discussion
3.1. Temperature During Composting
The temperature evolution showed that mixture 1 reached thermophilic values (temperature > 40°C) during the first 2 days of composting, while in mixture 2, these values were not achieved until day 8 of composting (Figure 1). These results could be due to the higher value of the Corg/Nt ratio of mixture 2 compared to mixture 1 (Table 2), which slows decomposition due to an excess of organic carbon in relation to nitrogen for the microorganisms. In these cases, the composting microbiota must go through numerous life cycles using the only available nitrogen, which is that of the microorganisms that have died, oxidizing part of the excess C, and converting it into recalcitrant residues that degrade more slowly [18]. Thermophilic temperatures were maintained for approximately 23 and 4 days until the first turning in mixtures 1 and 2, respectively. When the temperature dropped below 40°C, turnings were performed to supply oxygen and non-degraded materials. This favored the temperature increase, which was above 40°C for 15 and 4 days after the first turning and 0 and 5 days after the second turning in mixtures 1 and 2, respectively. No thermophilic temperature values were observed after the third turning in any of the mixtures studied. Therefore, the bio-oxidative phase was considered finished after approximately 100 days of composting. The maximum process temperatures were very similar in both mixtures: 53.8°C and 53.2°C for mixtures 1 and 2, respectively.
Regarding the sanitization of the composted waste mixtures, none of the piles studied met the requirement established by the EPA [29] for the sanitization of composted materials in piles with aeration by turning (temperatures ≥ 55 °C for at least 15 consecutive days) (Figure 1). However, both composts presented values of pathogenic microbial populations (Salmonella spp and Escherichia coli) well below the maximum limit established by the EPA [29] for sanitized compost, as will be seen later in Table 4. Thus, it was observed that high temperatures for a given period to sanitize the waste mixtures were not decisive in this study. Other factors may have contributed to the inactivation of pathogenic microorganisms during the composting process, such as the presence of certain compounds resulting from organic matter degradation (ammonia, hydroxide anions, dissolved solids, etc.) [30], or antagonism or competition with other indigenous microorganisms present in the process [31].
3.2. Evolution of the Principal Physicochemical and Chemical Parameters of the Mixtures During Composting and Vermicomposting
Differences in pH evolution were found between the composting and vermicomposting processes studied (Table 2). During the composting process, the pH increased from 6.6-6.8 to a value of 7.4, observed in both composts. According to Bernal et al. [18], the degradation of acidic compounds and organic nitrogen to ammonia is mainly responsible for this increase in pH observed during composting. However, this parameter decreased during the vermicomposting process, reaching final values below those obtained during composting, especially in the case of vermicompost 2. Dume et al. [19] also observed a pH reduction during the vermicomposting process of SS with different proportions of wheat straw, which obtained lower pH values at the end of the process than in the case of the same composted waste mixtures. These authors attributed these results to the transformation of nitrogen and phosphorus into acidic compounds such as ammonium, nitrites/nitrates, and orthophosphates, as well as to the production of humic acids as intermediate products of organic matter decomposition during vermicomposting.
The EC increased significantly during composting, from 2.79-3.34 dS/m to 3.49-5.57 dS/m (Table 2), probably due to the mineralization of OM and an ion concentration effect due to mass loss of the pile [32]. Other authors have also observed this increase in soluble salts throughout the SS composting process with plant residues [19]. In contrast, a reduction of this parameter was observed in the vericomposting process, which could be due to the immobilization of soluble ions by the earthworms or their precipitation in the form of non-soluble salts [33].
OM content decreased over time in all the mixtures studied in the composting and vermicomposting processes, reaching a total loss at the end of these processes of 28%, 29%, 27%, and 28% for composting mixes 1 and 2 and vermicomposting mixes 1 and 2, respectively (Table 2). Analogous to OM, the Corg content also decreased in all the mixtures during composting and vermicomposting. The final Corg content was 16.8%, 25.4%, 27.8%, and 29.8% for composting mixes 1 and 2 and for vermicomposting mixes 1 and 2, respectively. In the composts, the final percentage of Corg was lower than in the vermicomposts. This result was also observed by Fornes et al. [33] and Dume et al. [19] during the composting and vermicomposting of similar mixtures of tomato crop residues with almond shells and SS with pelletized wheat straw, respectively. The transformation of Corg into CO2 during the OM degradation and mineralization processes occurring in composting and vermicomposting contributed to a loss of mass and thus to an increase of Nt in all the mixtures studied. The rise in Nt levels during vermicomposting may also come from the nitrogenous excretory substances of earthworms in the form of mucus [16]. In this study, the increase in Nt was greater for the composted than vermicomposted waste mixtures, probably due to the higher Corg loss observed during the composting processes. This was also found in the comparison studies between composting and vermicomposting processes carried out by Fornes et al. [33] and Dume et al. [19]. The degradation of OM and rise in Nt resulted in a reduction of the Corg/Nt ratio of 65% and 84% in compost mixes 1 and 2, respectively, and in vermicompost mixes 1 and 2 of 20% and 64%, respectively. This reduction in the Corg/Nt ratio reflects the rate of stabilization and mineralization of OM, indicating the maturity of the composts and vermicomposts [18,34].
3.3. Evolution of Earthworm Population and Biomass
The evolution of the earthworm population and biomass in the vermicomposting process was directly influenced by the composition of the substrates used. As shown in Figure 2a, the worm production decreased during the first 23 days in mixture 1 and up to 67 days in mixture 2. The maximum numbers of 126 worms/kg and 120 worms/kg were recorded on days 44 and 81 of vermicomposting in mixtures 1 and 2, respectively. From these days onward, the number of worms decreased again in both mixtures until registering values below the initial ones. Mixture 2 showed fewer worms throughout the vermicomposting compared to mixture 1, with the lowest number of worms recorded on day 65: 75 worms/kg. This low number of earthworms observed in mixture 2 could be due to the barley residue in its composition, as other authors have observed that cereal residues are not an ideal substrate for epigeic earthworm reproduction [20].
The increase in earthworm population did not correlate with the rise in earthworm biomass (Figure 2a and b). In mixture 1, the weight of worm/kg substrate was below the initial value throughout the vermicomposting process, and in mixture 2, the initial value was only exceeded from days 24 to 65. These results could be related to the higher number of juveniles compared to adult worms, the inverse ratio of the population density to the increase in mass of individual worms, and the scarce availability of nutrients for optimal worm development [20,35].
3.4. Agronomic Value of the Final Materials
As evidenced by the comparative study of composts and vermicomposts, notable differences were observed in several key parameters for plant growth (Table 3). The pH values were significantly higher in the final composts than in the vermicomposts, with vermicompost 2 presenting the lowest value of this parameter (pH = 5.9). However, all the amendments had pH values within or very close to the range recommended by the US Composting Council [26] for various compost applications and average field conditions (pH = 6.0-7.5). EC was markedly higher in composts than in vermicomposts, especially in the case of compost 1 (EC = 5.57 dS/m), which exceeded the limit value of the United States guidelines (EC < 5 dS/m). Despite this, no compost or vermicompost presented phytotoxicity problems, as evidenced by GI values > 50%, indicating an absence of high concentrations of compounds detrimental to plant development [36]. This result shows that both processes, composting and vermicomposting, were effective in reducing the phytotoxic compounds present in SS, as was also observed by Włóka et al. [23] in a study evaluating changes in the phytotoxicity of SS during its composting and vermicomposting with green wastes and an organic fraction of municipal wastes.
Regarding OM content, compost 2 and vermicompost 1 presented the highest and lowest values statistically for this parameter, respectively (Table 3). Furthermore, all the materials obtained, except vericompost 1, had an OM percentage within the range of values preferred by the US Composting Council [26] for agricultural use of composts (OM = 50-60%). All the final composts and vermicomposts reached an adequate degree of stabilization and maturity of their OM, since the evolution of the Corg/Nt ratio was adequate (Table 2) and the final value of this ratio was < 12 [37]. In relation to macronutrient content, compost 1 had the highest Nt content, while the vermicomposts had significantly higher concentrations of P and K than the composts. Khwairakpam and Bhargava [38] also observed a higher increase in P and K during vermicomposting of SS with sawdust and different types of worms compared to the control without worms. These authors attributed this to phosphorus mineralization by the bacterial and intestinal phosphatase activity of the earthworms and potassium solubilization through the production of acidic compounds by the microflora present in the earthworm gut. The minimum Nt and P contents established by the American guidelines for composts intended for agricultural use (Nt and P ≥ 1.0% [26]) were exceeded by all the amendments only for Nt, so the final composts and vermicomposts showed a low phosphorus fertilizer capacity. On the other hand, Fe and Mn contents were higher in the amendments obtained from the mixture of SS and GW (compost 1 and vermicompost 1), while Cu and Zn concentrations were markedly higher in the vermicomposts than in the composts. The higher content of most macro- and micronutrients in the vermicomposts than in the composts is in line with the study by Dume et al. [19], who highlighted the high availability of nutrients in vermicomposts obtained from different mixtures of SS and wheat straw compared to the final composts from the same waste mixtures.
Regarding heavy metals, all the amendments under consideration satisfied the safety standards set by the US Composting Council [26] (Table 3). The levels of Hg and Pb were found to be well below the permitted limits, indicating a low risk of toxicity. However, significant variability was observed in the concentrations of metals such as Cu, Zn, Cd, and Cr. The vermicomposts presented higher Cu and Zn contents than the composts, as discussed above, and compost 1 exhibited the highest levels of Cd and Cr (Cd = 0.24 mg/kg and Cr = 38.5 mg/kg), although these remained within safe limits. Additionally, the presence of pathogenic bacteria, such as E. coli and Salmonella spp., was completely eliminated following the sanitization of the final materials. The population load of these pathogens was well below the maximum limit established by the EPA [29] for sanitized compost (Salmonella < 3 MPN/g; E. coli < 1000 MPN/g). Therefore, the composting and vermicomposting processes were effective in inactivating pathogenic microorganisms. This result was also observed by Hrčka et al. [13] in a comparative study of composting and vermicomposting SS with molded pulp. In composting, pathogen inactivation is achieved through different factors such as maintaining high temperatures for a given period, producing compounds with suppressive capacity resulting from the degradation of organic matter, and competition/antagonism with other indigenous microorganisms present in the process, as indicated in section 3.1. In vermicomposting, pathogen elimination is mainly achieved by worms through their intestinal action, the suppressive activity of the intestinal fluids, the release of coelomic fluid secretions with antibacterial properties, and the stimulation of certain bacteria by the activity of the worms, which have competitive/antagonistic interactions with pathogenic populations [39].
3.5. Economic Value of the Final Materials and Compost and Vermicompost Production Costs
Table 4 shows the economic evaluation of the macronutrients present in the compost and vermicompost. The combined total value of the vermicomposts was higher than that of the composts due to the higher P and K content of the vermicomposts (Table 3). Therefore, vermicomposting could be a more recommendable SS treatment technique than composting in terms of the commercial value of the compost obtained.
Regarding the contribution of each nutrient to the total combined value of the amendments obtained, N, P2O5, and K2O were in the range of 30-46%, 23-28%, and 31-42%, respectively. In this study, nitrogen and potassium were the nutrients that contributed most to the combined value of the composts and vermicomposts, unlike what was found by other authors in composts made from plant residues and manures, where phosphorus was the nutrient with the highest contribution to the total combined economic value of the nutrients [24,40]. This could be due to the higher P content in the composts obtained by these authors (P = 0.59-1.15%) compared to the final materials of this study (P = 0.26-0.35%) (Table 3). When comparing the composts and vermicomposts prepared with the same wastes, the commercial value was higher in the final materials prepared with SS and BR (compost 2 and vermicompost 2), mainly due to the higher Nt content of these materials than that obtained with SS and GW (Table 3). The economic value and plant nutrient content of the composts and vermicomposts indicate they could be promising agricultural inputs to partly replace chemical fertilizers and thus reduce the environmental impacts associated with their production and use.
Table 5 shows the production costs of the compost and vermicomposts obtained. This economic evaluation includes the costs of transporting the raw materials (SS and plant residues) and shredding the plant residues, as well as the cost of the labor required for preparing the mixtures, turning and controlling the process, and the cost of the water applied during the composting and vermicomposting processes. In the case of the vermicomposting process, the costs of the worms were also included. In the costs of labor for preparing the waste mixture, turning, and irrigation, the costs included operations carried out in the pre-composting process, the pre-conditioning of the substrate for the worms, and the vermicomposting process.
The production costs of the amendments increased in the following order: compost 2 < vermicompost 2 < compost 1 < vermicompost 1 (Table 5). The differences in the costs of the same operations carried out on the composts and vermicomposts were mainly due to the different final quantities obtained of these materials (300, 420, 595, and 665 kg for compost 1, compost 2, vermicompost 1, and vermicompost 2, respectively). Among the costs associated with compost production, labor was the main component, while worms were a significant cost for vermicompost production. The costs derived from water and energy used during both processes were the lowest. This was because the cost of water use for industry is very low in Ecuador (0.0010 US$/m3 [41]), and electricity consumption was low due to the low technology of the operations. The average cost for the compost was US$124/ton, and for vermicompost, US$141/ton. These costs were well below the selling prices of compost (150 US$/ton [42]) and vermicompost (200-358 US$/ton [43]) in Ecuador, which are generally imported due to the scarcity of composting and vermicomposting plants in this country. The results indicate that the choice of method for SS treatment (composting/vermicomposting) should consider not only its agronomic efficiency and benefits, but also its operational costs and resource availability, as well as the specific objectives of the organic waste management project.
4. Conclusions
Under the conditions in which this study was conducted, it can be concluded that composting and vermicomposting SS with plant residues are effective alternatives for the treatment of these residues. Both methods produced high-quality composts and vermicomposts that met the standards of sanitation, stability, and maturity of the OM, an absence of phytotoxicity, and low content of heavy metals, which positions them as efficient and sustainable techniques for agricultural applications of these materials. However, differences were found between these techniques, since composting achieved a faster stabilization of OM (without the need for a 25-day conditioning stage of the initial waste mixture) and a higher OM and Nt content in the final materials obtained. Vermicomposting generated final materials with lower salinity and higher contents of most macro- and micronutrients (K, P, Cu, and Zn), the latter result contributing to the higher economic value associated with the nutrients in the vermicomposts than those in the composts. Regarding the production costs of composts and vermicomposts, vermicomposting required an initial investment in worms, while composting had higher operating costs. However, the latter method was more efficient in rapidly stabilizing OM, which underlines the importance of selecting the method according to specific needs.
Therefore, both processes contribute to the circular economy by transforming SS into safe organic fertilizers that meet international standards. However, more studies are needed to validate the composts and vermicomposts obtained from crops. This will provide more results on which technique is recommended for the reuse of SS in the studied area.
Author Contributions
Conceptualization, C.P. and I.G.-T.; Methodology, F.V.A.-V., I.G.-T., J.I.-N., B.S.-A., M.A. and C.P.; Data curation, C.P., J.I.-N. and F.V.A.-V.; Validation, C.P. and I.G.-T.; Formal analysis, F.V.A.-V., I.G.-T., J.I.-N. and C.P.; Investigation, C.P. and I.G.-T.; Writing—original draft preparation, F.V.A.-V., C.P. and I.G.-T.; Writing—review and editing, C.P.; Visualization, C.P., I.G.-T. and J.I.-N.; Supervision, C.P. and I.G.-T. All authors have read and agreed to the published version of the manuscript.
Funding
This research received no external funding. This work is part of a doctoral thesis research plan on the composting and vermicomposting of sludge from wastewater treatment and its use for the recovery of degraded soils.
Institutional Review Board Statement
Not applicable.
Data Availability Statement
The data and original contributions presented in this study are included in the article. Any additional information beyond that presented in the article is available upon request from the corresponding author.
Acknowledgments
The authors would like to thank the Faculty of Agricultural Engineering, University of the Armed Forces (Sangolquí, Pichincha-Ecuador) for carrying out the practical aspects of this experiment, and the Group in Biotechnology, Environment and Chemistry (GAIBAQ) of the Higher Polytechnic School of Chimborazo (Ecuador) and the Environmental Research Group of Agrochemistry and Environment (GIAAMA) of the Miguel Hernández University of Elche (Spain) for their scientific and technical support.
Conflicts of Interest
The authors declare no conflicts of interest.
References
- World Bank. Urban Development Indicators. Available online: https://data.worldbank.org/topic/urban-development?view=chart (accessed on 20 March 2025).
- INEC. 2023. Available online: https://www.ecuadorencifras.gob.ec/documentos/web-inec/Encuestas_Ambientales/Municipios/2023/Agua_potable_alcantarillado/Boletin_Tecnico_APA_2023_VF.pdf (accessed on 20 March 2025).
- Wingfield, S.; Martínez-Moscoso, A.; Quiroga, D.; Ochoa-Herrera, V. Challenges to Water Management in Ecuador: Legal Authorization, Quality Parameters, and Socio-Political Responses. Water 2021, 13, 1017. [Google Scholar] [CrossRef]
- Borja-Serrano, P.; Ochoa-Herrera, V.; Maurice, L.; Morales, G.; Quilumbaqui, C.; Tejera, E.; Machado, A. Determination of the Microbial and Chemical Loads in Rivers from the Quito Capital Province of Ecuador (Pichincha)—A Preliminary Analysis of Microbial and Chemical Quality of the Main Rivers. Int. J. Environ. Res. Public Heal. 2020, 17, 5048. [Google Scholar] [CrossRef]
- Sánchez-Vela, P. Estudio de factibilidad para el aprovechamiento de los lodos provenientes de la Planta de Tratamiento de Aguas Residuales, de la parroquia Nono, cantón Quito, provincia de Pichincha, para su posterior uso en cultivos del sector. Bachelor Thesis, . Universidad Central del Ecuador, Quito, 2019. Available online: http://www.dspace.uce.edu.ec/handle/25000/18898. Available online: http://www.dspace.uce.edu.ec/handle/25000/18898 (accessed on 21 March 2025).
- Temireyeva, A.; Zhunussova, K.; Aidabulov, M.; Venetis, C.; Sarbassov, Y.; Shah, D. Greenhouse Gas Emissions-Based Development and Characterization of Optimal Scenarios for Municipal Solid and Sewage Sludge Waste Management in Astana City. Sustainability 2022, 14, 15850. [Google Scholar] [CrossRef]
- Ye, L.; Zhang, T. Pathogenic Bacteria in Sewage Treatment Plants as Revealed by 454 Pyrosequencing. Environ. Sci. Technol. 2011, 45, 7173–7179. [Google Scholar] [CrossRef]
- Roig, N.; Sierra, J.; Nadal, M.; Martí, E.; Navalón-Madrigal, P.; Schuhmacher, M.; Domingo, J.L. Relationship between pollutant content and ecotoxicity of sewage sludges from Spanish wastewater treatment plants. Sci. Total. Environ. 2012, 425, 99–109. [Google Scholar] [CrossRef]
- Yu, R.; Li, P.; Shen, R. Collaborative removal of microplastics, bacteria, antibiotic resistance genes, and heavy metals in a full-scale wastewater treatment plant. Water Sci. Technol. 2025, 91, 438–452. [Google Scholar] [CrossRef] [PubMed]
- Repinc, S.K.; Bizjan, B.; Budhiraja, V.; Dular, M.; Gostiša, J.; Humar, B.B.; Kaurin, A.; Kržan, A.; Levstek, M.; Arteaga, J.F.M.; et al. Integral analysis of hydrodynamic cavitation effects on waste activated sludge characteristics, potentially toxic metals, microorganisms and identification of microplastics. Sci. Total. Environ. 2022, 806, 151414. [Google Scholar] [CrossRef]
- Balkrishna, A.; Ghosh, S.; Kaushik, I.; Arya, V.; Joshi, D.; Semwal, D.; Saxena, A.; Singh, S. Sequential distribution, potential sources, and health risk assessment of persistent toxic substances in sewage sludge used as organic fertilizer in Indo-Gangetic region. Environ. Sci. Pollut. Res. 2025, 32, 2324–2358. [Google Scholar] [CrossRef]
- Kacprzak, M.; Neczaj, E.; Fijałkowski, K.; Grobelak, A.; Grosser, A.; Worwag, M.; Rorat, A.; Brattebo, H.; Almås, Å.; Singh, B.R. Sewage sludge disposal strategies for sustainable development. Environ. Res. 2017, 156, 39–46. [Google Scholar] [CrossRef]
- Hrčka, M.; Hřebečková, T.; Hanč, A.; Grasserová, A.; Cajthaml, T. Changes in the content of emerging pollutants and potentially hazardous substances during vermi/composting of a mixture of sewage sludge and moulded pulp. Environ. Pollut. 2024, 348, 123736. [Google Scholar] [CrossRef] [PubMed]
- Huang, K.; Xia, H.; Wu, Y.; Chen, J.; Cui, G.; Li, F.; Chen, Y.; Wu, N. Effects of earthworms on the fate of tetracycline and fluoroquinolone resistance genes of sewage sludge during vermicomposting. Bioresour. Technol. 2018, 259, 32–39. [Google Scholar] [CrossRef] [PubMed]
- Wang, J.; Xu, S.; Zhao, K.; Song, G.; Zhao, S.; Liu, R. Risk control of antibiotics, antibiotic resistance genes (ARGs) and antibiotic resistant bacteria (ARB) during sewage sludge treatment and disposal: A review. Sci. Total. Environ. 2023, 877, 162772. [Google Scholar] [CrossRef]
- Ali, U.; Sajid, N.; Khalid, A.; Riaz, L.; Rabbani, M.M.; Syed, J.H.; Malik, R.N. A review on vermicomposting of organic wastes. Environ. Prog. Sustain. Energy 2015, 34, 1050–1062. [Google Scholar] [CrossRef]
- Ayilara, M.S.; Olanrewaju, O.S.; Babalola, O.O.; Odeyemi, O. Waste Management through Composting: Challenges and Potentials. Sustainability 2020, 12, 4456. [Google Scholar] [CrossRef]
- Bernal, M.P.; Sommer, S.G.; Chadwick, D.; Qing, C.; Guoxue, L.; Michel, F.C. Current Approaches and Future Trends in Compost Quality Criteria for Agronomic, Environmental, and Human Health Benefits. In Advances in Agronomy; Academic Press Inc.: Cambridge, MA, USA, 2017; Volume 144, pp. 143–233. [Google Scholar] [CrossRef]
- Dume, B.; Hanc, A.; Svehla, P.; Michal, P.; Chane, A.D.; Nigussie, A. Composting and vermicomposting of sewage sludge at various C/N ratios: Technological feasibility and end-product quality. Ecotoxicol. Environ. Saf. 2023, 263, 115255. [Google Scholar] [CrossRef]
- Rékási, M.; Mazsu, N.; Draskovits, E.; Bernhardt, B.; Szabó, A.; Rivier, P.-A.; Farkas, C.; Borsányi, B.; Pirkó, B.; Molnár, S.; et al. Comparing the agrochemical properties of compost and vermicomposts produced from municipal sewage sludge digestate. Bioresour. Technol. 2019, 291, 121861. [Google Scholar] [CrossRef]
- Hanc, A.; Dume, B.; Hrebeckova, T. Differences of Enzymatic Activity During Composting and Vermicomposting of Sewage Sludge Mixed With Straw Pellets. Front. Microbiol. 2022, 12, 801107. [Google Scholar] [CrossRef]
- Lv, B.; Xing, M.; Yang, J.; Zhang, L. Pyrosequencing reveals bacterial community differences in composting and vermicomposting on the stabilization of mixed sewage sludge and cattle dung. Appl. Microbiol. Biotechnol. 2015, 99, 10703–10712. [Google Scholar] [CrossRef] [PubMed]
- Włóka, D.; Rorat, A.; Kacprzak, M.; Smol, M. The assessment of sewage sludge phytotoxicity changes during the processes of composting and vermicomposting. Desalination Water Treat. 2020, 199, 119–127. [Google Scholar] [CrossRef]
- Idrovo-Novillo, J.; Gavilanes-Terán, I.; Bustamante, M.A.; Paredes, C. Composting as a method to recycle renewable plant resources back to the ornamental plant industry: Agronomic and economic assessment of composts. Process. Saf. Environ. Prot. 2018, 116, 388–395. [Google Scholar] [CrossRef]
- Ministry of Agriculture and Livestock. 2024. Available online: http://sinagap.mag.gob.ec/sina/PaginasCGSIN/Rep_Precios_Insumos_Agropecuarios.aspx (accessed on 23 May 2025).
- US Composting Council. 2001. Available online: http://www.mncompostingcouncil.org/uploads/1/5/6/0/15602762/fgcu.pdf (accessed on 23 May 2025).
- ISO 7251. 2005. Available online: https://www.iso.org/standard/83209.html (accessed on 23 May 2025).
- ISO 6579-1:2017—Microbiology of the Food Chain—Horizontal Method for the Detection, Enumeration and Serotyping of Salmonella—Part 1: Detection of Salmonella spp. [WWW Document], n.d. Available online: https://www.iso.org/standard/56712.html (accessed on day month year).
- EPA, United States Environment Protection Agency. Environmental Regulations and Technology Control of Pathogens and Vector Attraction in Sewage Sludge; EPA625-/R-92/-103; EPA: Cincinnati, OH, USA, 2003. [Google Scholar]
- Arthurson, V. Proper Sanitization of Sewage Sludge: a Critical Issue for a Sustainable Society. Appl. Environ. Microbiol. 2008, 74, 5267–5275. [Google Scholar] [CrossRef] [PubMed]
- Hanajima, D.; Aoyagi, T.; Hori, T. Dead bacterial biomass-assimilating bacterial populations in compost revealed by high-sensitivity stable isotope probing. Environ. Int. 2019, 133, 105235. [Google Scholar] [CrossRef]
- Onwosi, C.O.; Igbokwe, V.C.; Odimba, J.N.; Eke, I.E.; Nwankwoala, M.O.; Iroh, I.N.; Ezeogu, L.I. Composting technology in waste stabilization: On the methods, challenges and future prospects. J. Environ. Manag. 2017, 190, 140–157. [Google Scholar] [CrossRef]
- Fornes, F.; Mendoza-Hernández, D.; García-De-La-Fuente, R.; Abad, M.; Belda, R.M. Composting versus vermicomposting: A comparative study of organic matter evolution through straight and combined processes. Bioresour. Technol. 2012, 118, 296–305. [Google Scholar] [CrossRef]
- Srivastava, V.; Goel, G.; Thakur, V.K.; Singh, R.P.; de Ferreira Araujo, A.S.; Singh, P. Analysis and advanced characterization of municipal solid waste vermicompost maturity for a green environment. J. Environ. Manag. 2020, 255, 109914. [Google Scholar] [CrossRef]
- Yadav, A.; Garg, V.K. Influence of stocking density on the vermicomposting of an effluent treatment plant sludge amended with cow dung. Environ. Sci. Pollut. Res. 2016, 23, 13317–13326. [Google Scholar] [CrossRef]
- Zucconi, F.; Pera, A.; Forte, M.; de Bertoldi, M. Evaluating toxicity of immature compost. Biocycle 1981, 22, 54–57. [Google Scholar]
- Bernai, M.; Paredes, C.; Sánchez-Monedero, M.; Cegarra, J. Maturity and stability parameters of composts prepared with a wide range of organic wastes. Bioresour. Technol. 1998, 63, 91–99. [Google Scholar] [CrossRef]
- Khwairakpam, M.; Bhargava, R. Vermitechnology for sewage sludge recycling. J. Hazard. Mater. 2009, 161, 948–954. [Google Scholar] [CrossRef] [PubMed]
- Soobhany, N.; Mohee, R.; Garg, V.K. Inactivation of bacterial pathogenic load in compost against vermicompost of organic solid waste aiming to achieve sanitation goals: A review. Waste Manag. 2017, 64, 51–62. [Google Scholar] [CrossRef]
- Valverde-Orozco, V.; Gavilanes-Terán, I.; Idrovo-Novillo, J.; Carrera-Beltrán, L.; Basantes-Cascante, C.; Bustamante, M.A.; Paredes, C. Agronomic, Economic and Environmental Comparative of Different Aeration Systems for On-Farm Composting. Agronomy 2023, 13, 929. [Google Scholar] [CrossRef]
- BIOFIN. 2020. Available online: https://www.biofin.org/knowledge-product/manualde-operativizacion-del-marco-legal-vigente-para-la-tarifa-de-agua-cruda (accessed on 31 July 2025).
- Jara-Samaniego, J.; Murcia, P.; Bustamante, M.; Pérez-Espinosa, A.; Paredes, C.; López, M.; López-Lluch, D.; Gavilanes-Terán, I.; Moral, R. Composting as sustainable strategy for municipal solid waste management in the Chimborazo Region, Ecuador: Suitability of the obtained composts for seedling production. J. Clean. Prod. 2017, 141, 1349–1358. [Google Scholar] [CrossRef]
- Calvopiña Morales, L.P.; Proyecto para la creación de una microempresa dedicada a la producción y comercialización de vermicompost, enriquecidos con microorganismos promotores del crecimiento vegetal en el Cantón Rumiñahui - Sangolquí. Master's tesis. Universidad Politécnica Salesiana, Cuenca, 2022. Available online: http://dspace.ups.edu.ec/handle/123456789/22676 (accessed on 31 July 2025).
Figure 1.
Temperature evolution during the composting process. The arrows indicate the days on which turnings were performed.
Figure 1.
Temperature evolution during the composting process. The arrows indicate the days on which turnings were performed.
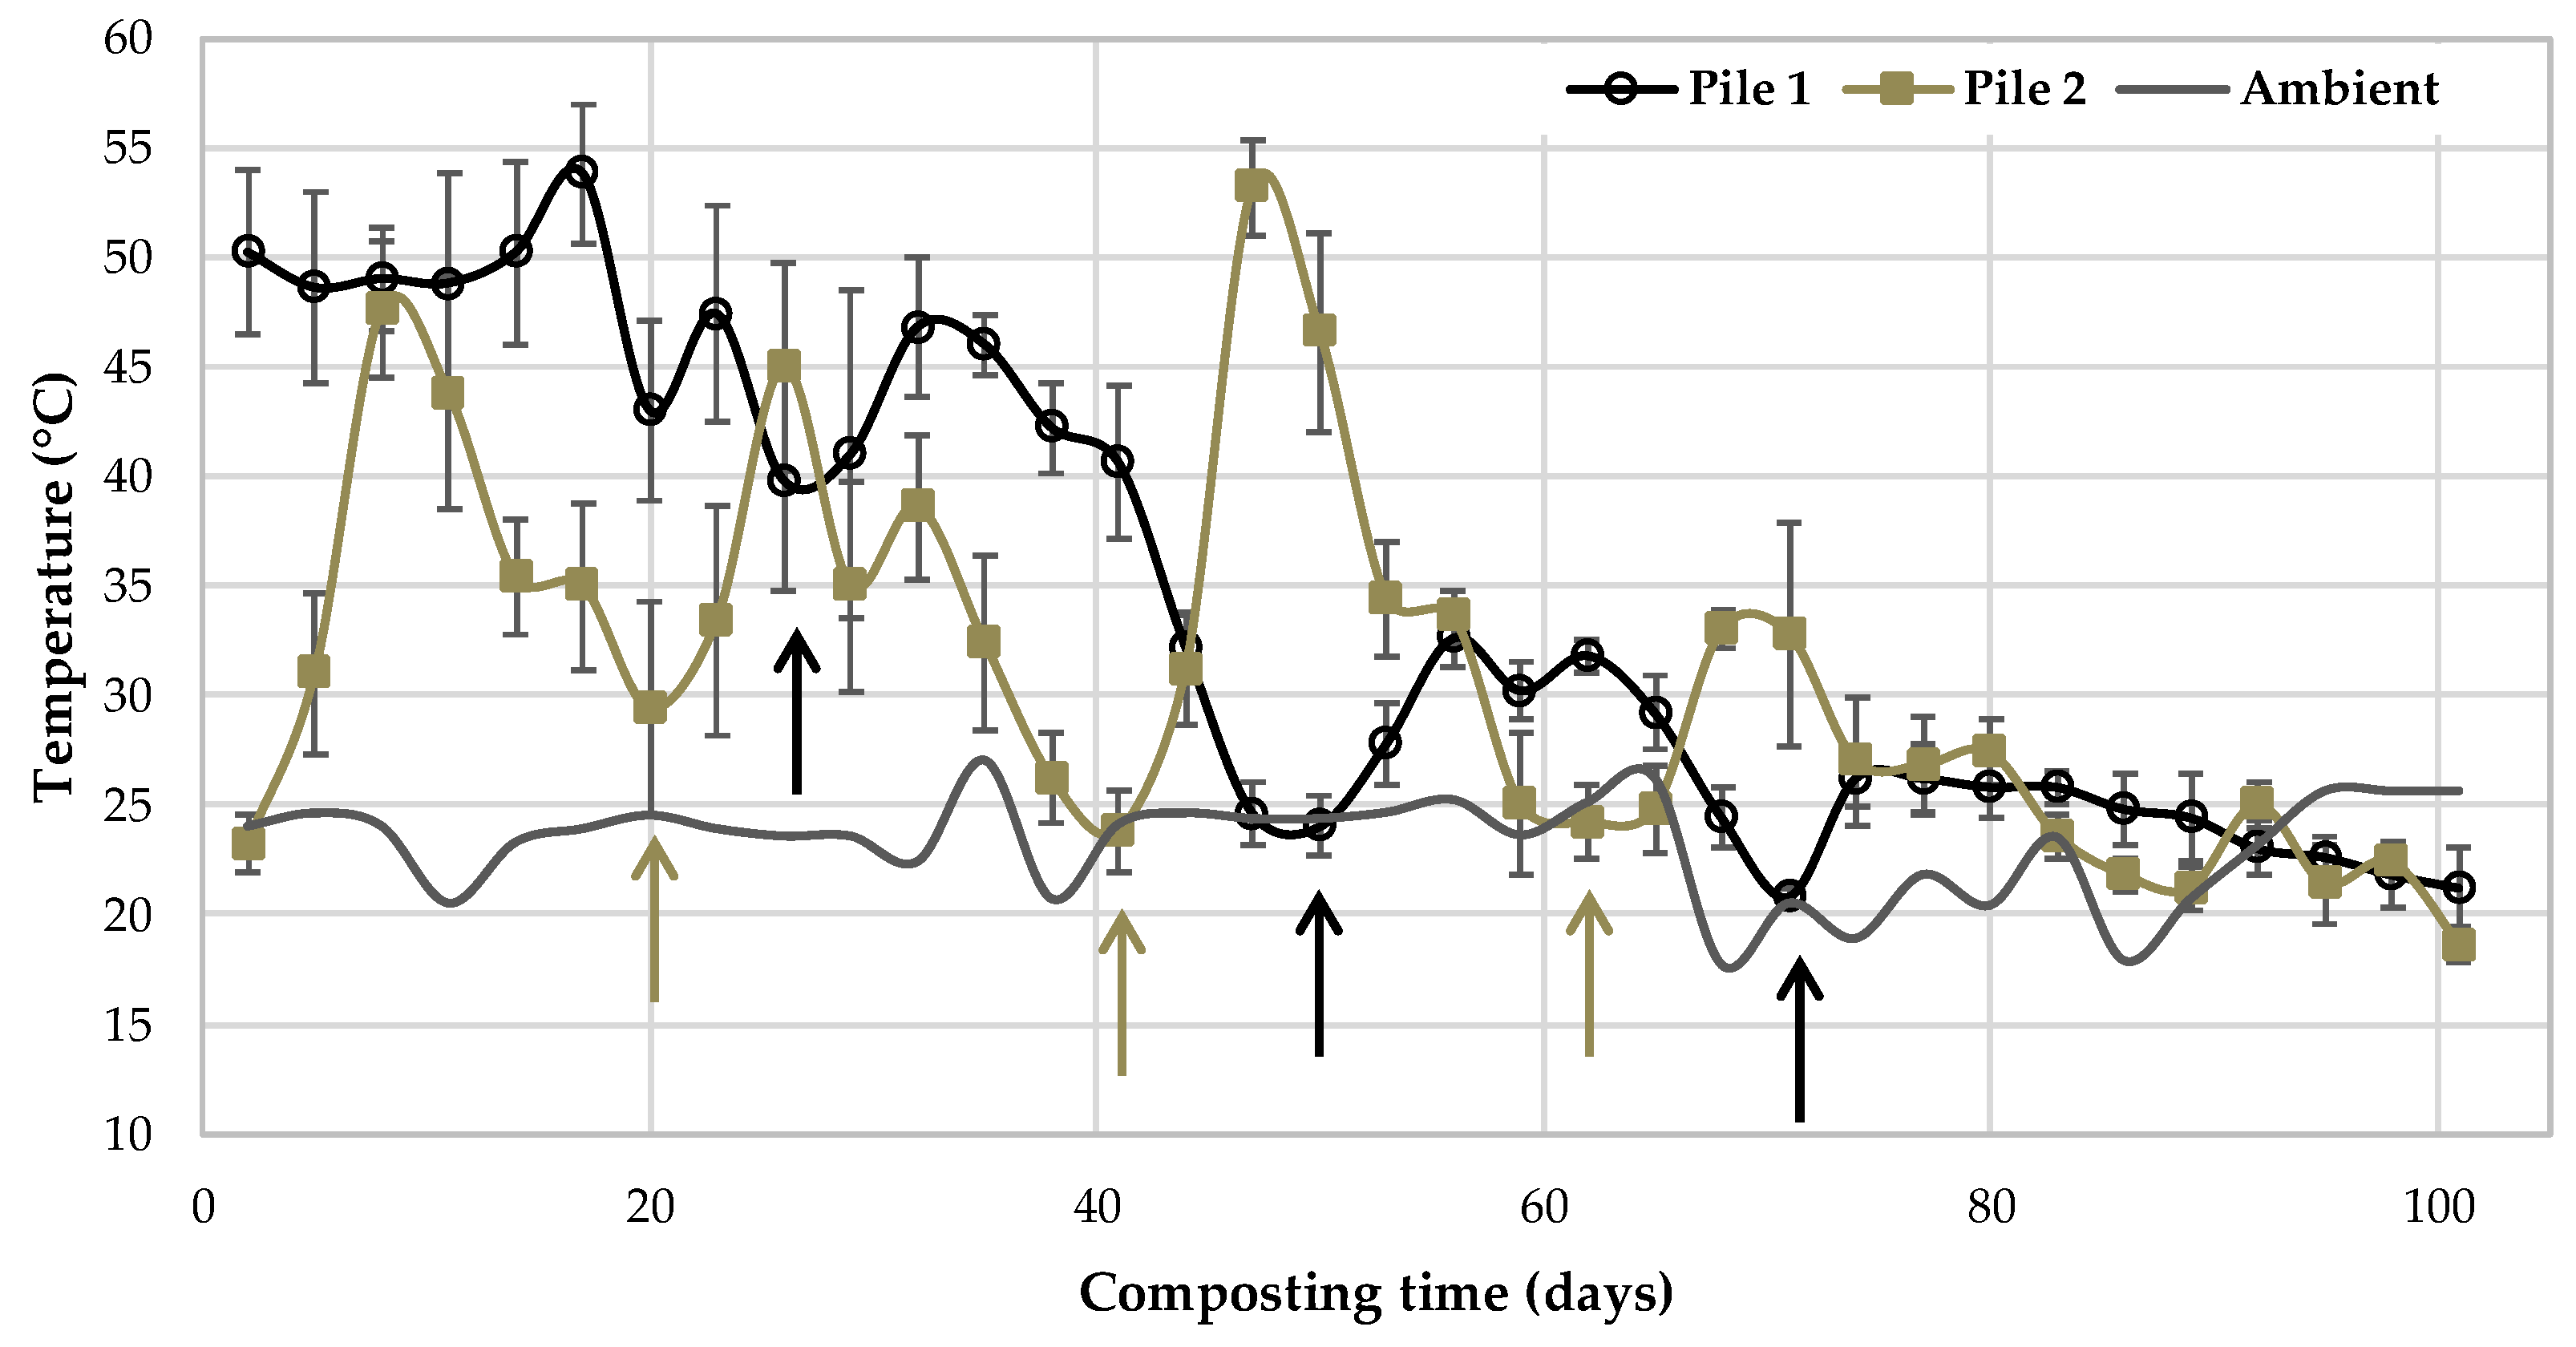
Figure 2.
Evolution of the population (number) (a) and biomass of earthworms (g) (b) during vermicomposting.
Figure 2.
Evolution of the population (number) (a) and biomass of earthworms (g) (b) during vermicomposting.
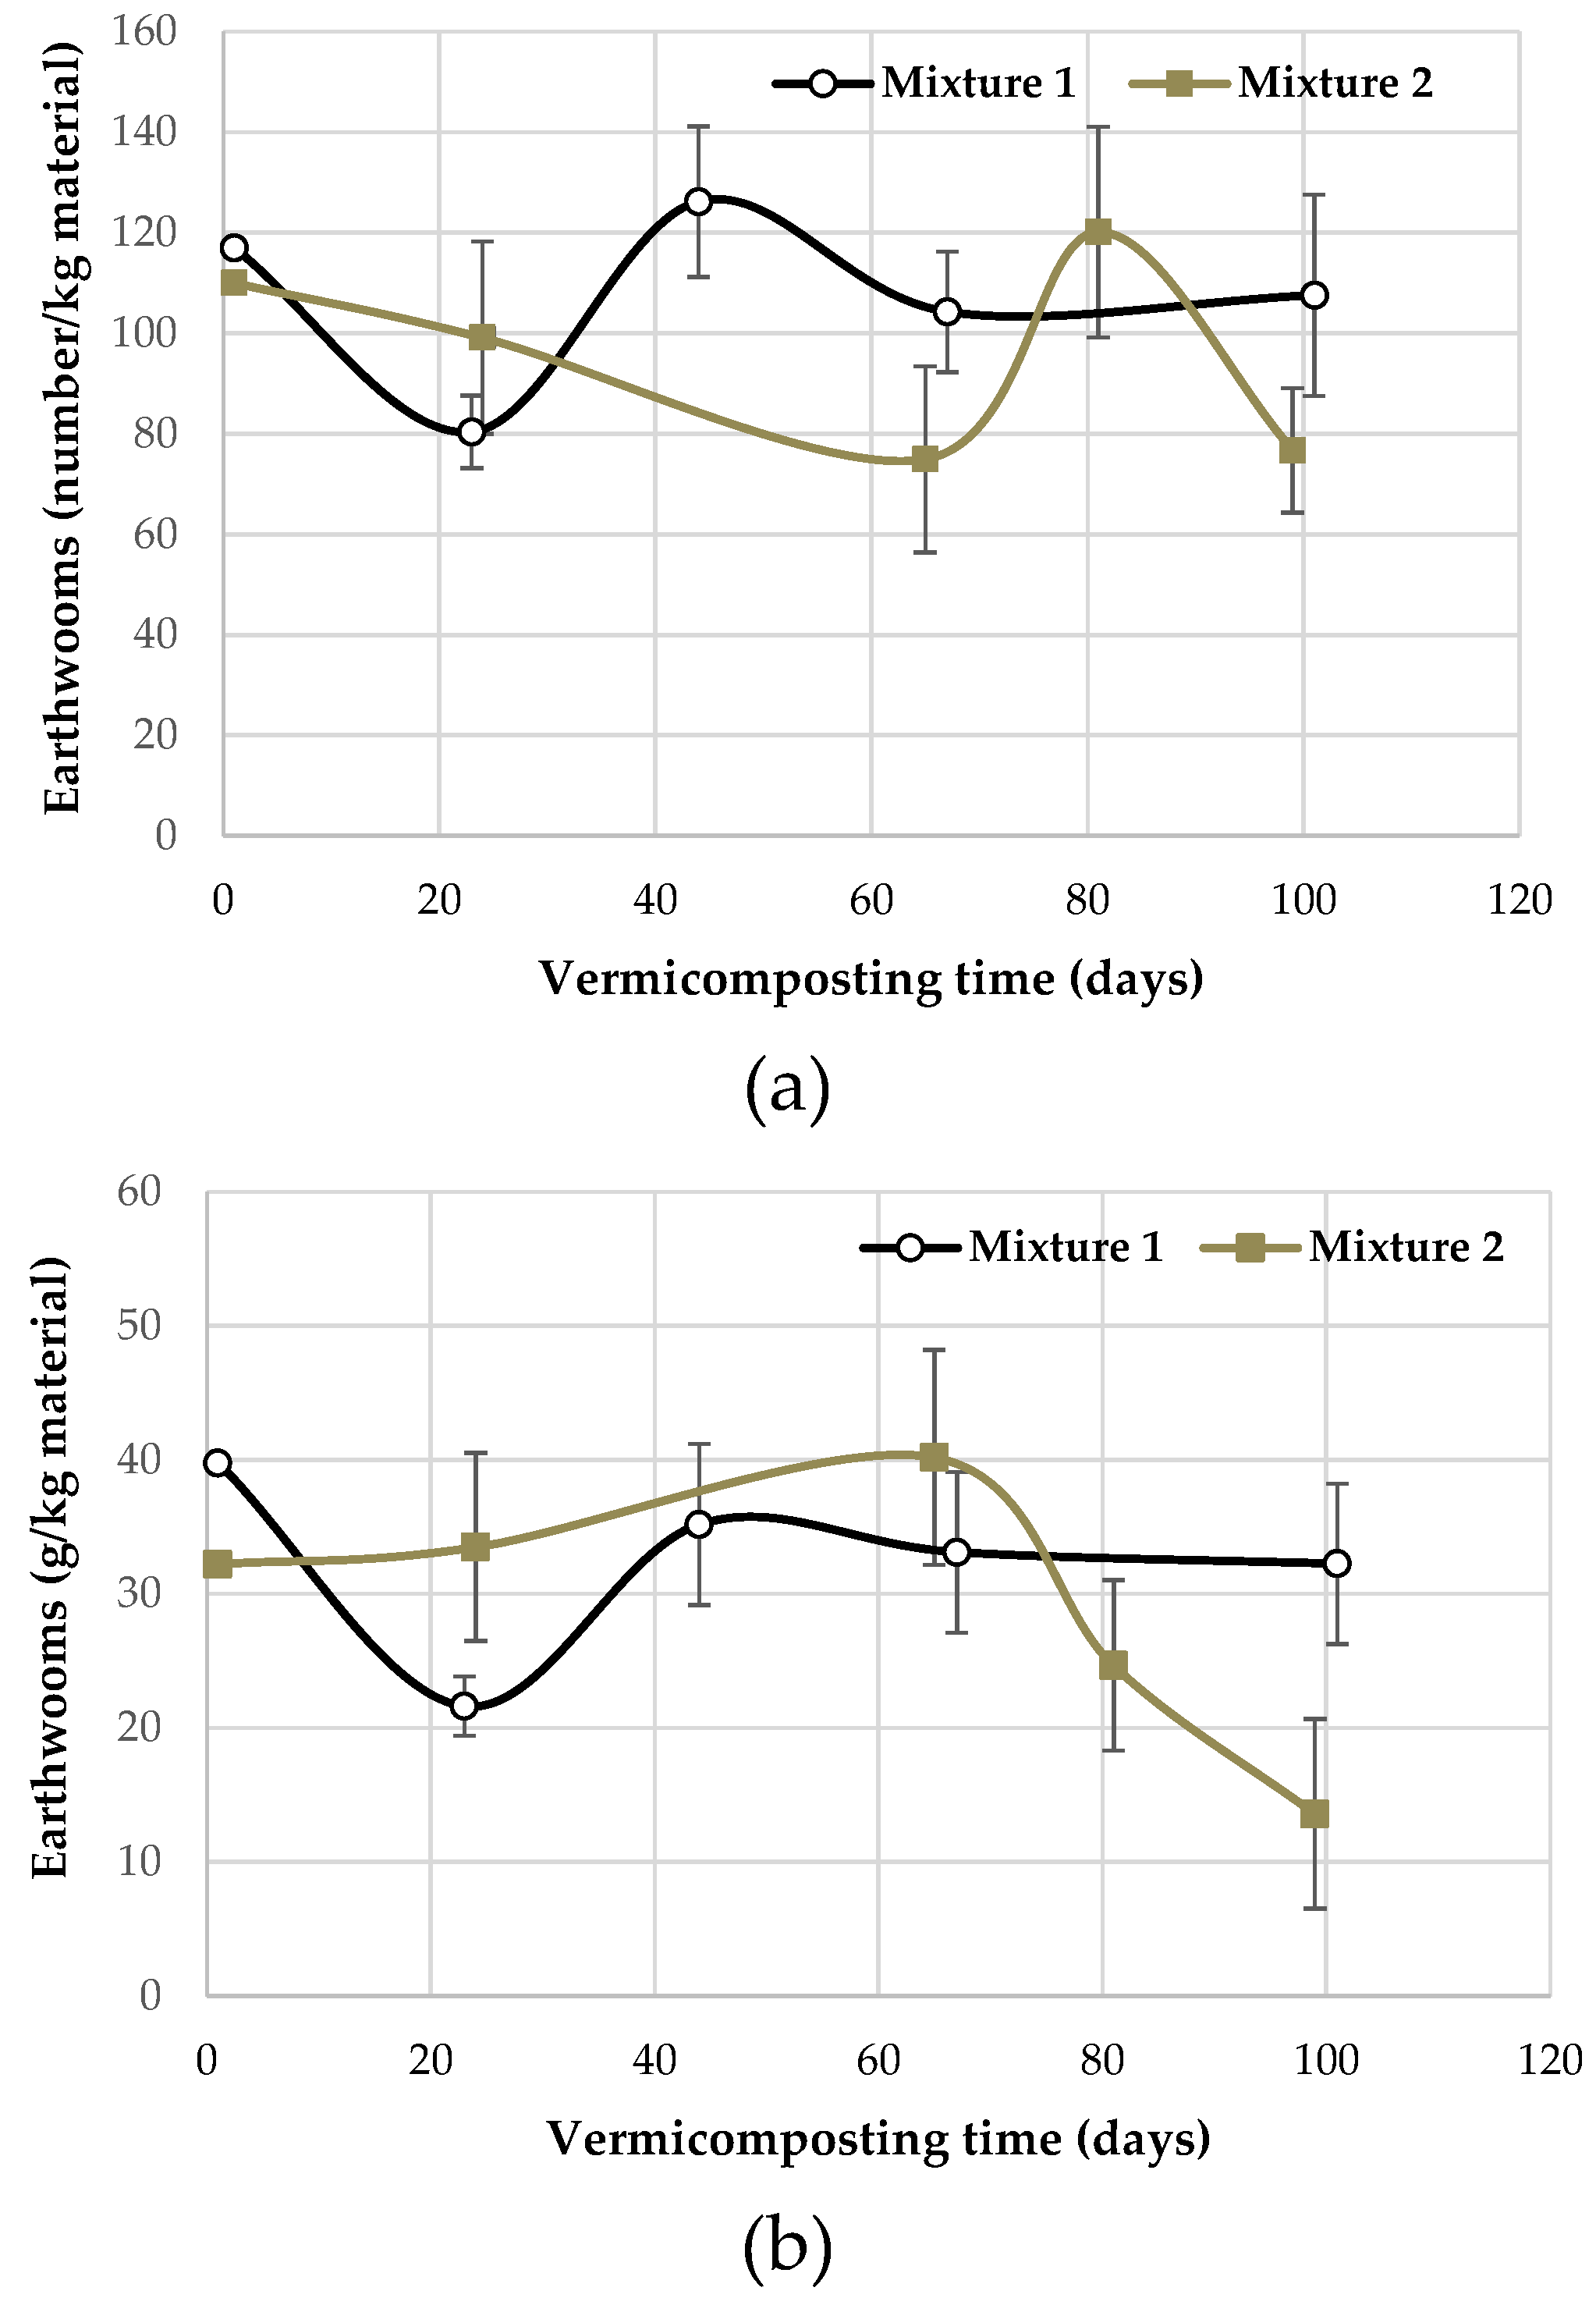

Table 1.
Analysis of the starting materials: barley residue (BR), garden waste (GW), and sewage sludge (SS) (dry weight basis).
Table 1.
Analysis of the starting materials: barley residue (BR), garden waste (GW), and sewage sludge (SS) (dry weight basis).
| Parameter | BR | GW | SS |
|---|---|---|---|
| pH | 7.0 | 6.8 | 5.4 |
| EC (dS/m) | 3.63 | 5.83 | 1.07 |
| OM (%) | 92.4 | 85.0 | 53.6 |
| Corg (%) | 53.7 | 49.5 | 30.2 |
| Nt (%) | 0.51 | 1.55 | 3.08 |
| Corg/Nt | 105.0 | 31.9 | 9.8 |
| P (g/kg) | 0.20 | 0.63 | 5.51 |
| K (g/kg) | 11.4 | 15.2 | 2.2 |
| Fe (mg/kg) | 112 | 963 | 14404 |
| Cu (mg/kg) | 6 | 10 | 24 |
| Mn (mg/kg) | 48 | 191 | 307 |
| Zn (mg/kg) | 16 | 77 | 190 |
| Cr (mg/kg) | 0.5 | 1.9 | 30.7 |
| Cd (mg/kg) | 0.03 | 0.04 | 0.95 |
| Pb (mg/kg) | 8 | 2 | 17 |
| Hg (mg/kg) | <0.05 | <0.05 | 0.23 |
EC: electrical conductivity, OM: organic matter, Corg: total organic carbon, Nt: total nitrogen.
Table 2.
Evolution of the principal parameters during composting and vermicomposting processes (dry weight basis).
Table 2.
Evolution of the principal parameters during composting and vermicomposting processes (dry weight basis).
| Time (days) | pH | EC (dS m-1) |
OM (%) |
Corg (%) |
Nt (%) |
Corg/Nt |
|---|---|---|---|---|---|---|
| Composting pile 1: 35% SS + 65 % GW | ||||||
| 0 | 6.6 | 3.34 | 73.4 | 31.6 | 2.05 | 15.4 |
| 27 | 7.9 | 4.39 | 66.1 | 36.0 | 2.81 | 12.8 |
| 105 | 7.4 | 4.76 | 55.9 | 20.1 | 2.42 | 8.5 |
| Mature | 7.4 | 5.57 | 52.9 | 16.8 | 3.14 | 5.4 |
| LSD | 0.4 | 0.46 | 7.4 | 1.1 | 0.09 | 0.5 |
| Composting pile 2: 45% SS + 55 % BR | ||||||
| 0 | 6.8 | 2.79 | 79.8 | 39.7 | 1.01 | 39.3 |
| 22 | 7.5 | 2.55 | 70.8 | 37.9 | 1.28 | 29.6 |
| 100 | 8.0 | 2.84 | 66.9 | 29.6 | 1.49 | 21.2 |
| Mature | 7.4 | 3.49 | 56.9 | 25.4 | 3.98 | 6.4 |
| LSD | 0.7 | 0.26 | 10.5 | 1.9 | 0.08 | 0.6 |
| Vermicomposting mixture 1: 35% SS + 65 % GW | ||||||
| 0 | 7.7 | 4.25 | 65.8 | 35.6 | 2.77 | 12.9 |
| 23 | 7.3 | 3.75 | 59.5 | 34.7 | 1.96 | 17.7 |
| 101 | 7.4 | 3.13 | 58.7 | 34.3 | 2.12 | 16.2 |
| Final | 6.8 | 2.50 | 48.0 | 27.8 | 2.70 | 10.3 |
| LSD | 0.4 | 0.37 | 11.9 | 1.3 | 0.10 | 0.5 |
| Vermicomposting mixture 2: 45% SS + 55 % BR | ||||||
| 0 | 7.6 | 2.62 | 71.4 | 38.4 | 1.35 | 28.4 |
| 24 | 7.8 | 2.16 | 63.9 | 37.1 | 3.01 | 12.2 |
| 99 | 6.1 | 1.14 | 59.8 | 34.8 | 2.30 | 15.1 |
| Final | 5.9 | 2.00 | 51.2 | 29.8 | 2.89 | 10.3 |
| LSD | 0.3 | 0.33 | 6.6 | 1.2 | 0.12 | 0.6 |
LSD: least significant difference at p < 0.05. For other abbreviations, see Table 1.
Table 3.
The main physicochemical and biological characteristics of the mature composts and vermicomposts (dry weight basis).
Table 3.
The main physicochemical and biological characteristics of the mature composts and vermicomposts (dry weight basis).
| Compost 1 |
Compost 2 |
Vermicompost 1 |
Vermicompost 2 |
F-ANOVA | US guidelinesa, b |
|
|---|---|---|---|---|---|---|
| pH | 7.4 c | 7.4 c | 6.8 b | 5.9 a | 32.10*** | 6.0-7.5 |
| EC (dS/m) | 5.57 c | 3.49 b | 2.50 a | 2.00 a | 253.54*** | < 5 |
| OM (%) | 52.9 b | 56.9 c | 48.0 a | 51.2 ab | 21.56*** | 50-60 |
| Corg/Nt | 5.4 a | 6.4 a | 10.3 b | 10.3 b | 14.55** | |
| GI (%) | 69.4 a | 83.3 c | 68.8 a | 75.1 b | 24.78*** | |
| Nt (%) | 3.14 a | 3.98 b | 2.70 a | 2.89 a | 10.27* | ≥ 1.0 |
| P (%) | 0.27 a | 0.26 a | 0.35 b | 0.33 b | 12.25** | ≥ 1.0 |
| K (%) | 2.67 b | 2.29 a | 3.30 c | 3.40 c | 5915.77*** | |
| Fe (mg/kg) | 12712 c | 995 a | 15800 d | 11100 b | 309.03*** | |
| Mn(mg/kg) | 385 c | 260 a | 400 d | 290 b | 406.16*** | |
| Cu (mg/kg) | 52 a | 56 b | 100 c | 102 c | 3119.03*** | 1500 |
| Zn (mg/kg) | 41 b | 36 a | 150 d | 100 c | 8815.43*** | 2800 |
| Cd (mg/kg) | 0.24 b | 0.02 a | 0.01 a | 0.01 a | 160.88*** | 39 |
| Cr (mg/kg) | 38.5 c | 26.0 b | 20.0 a | 20.0 a | 179.11*** | |
| Hg (mg/kg) | < 0.05 | < 0.05 | < 0.05 | < 0.05 | - | 17 |
| Pb (mg/kg) | 3.4 | 4.2 | 5.0 | 5.0 | 1.70NS | 300 |
| E. Coli (MPN/g) | < 3 | < 3 | < 3 | < 3 | - | < 1000 |
| Salmonella (MPN/g) | ND | ND | ND | ND | - | < 3 |
GI: germination index; MPN: most probable number. ND: not detected. For other abbreviations, see Table 1. ***, **, * and NS: significant at p < 0.001, p < 0.01, p < 0.05 and not significant, respectively. Values in a row followed by the same letter are not statistically different according to Tukey’s b test at p < 0.05. aAccording to US Composting Council [26]; bAccording to the EPA [29].
Table 4.
Estimation of the economic value of the compost and vermicompost based on the nutrient content (Nt, P2O5, and K2O), (US$/ton).
Table 4.
Estimation of the economic value of the compost and vermicompost based on the nutrient content (Nt, P2O5, and K2O), (US$/ton).
| Nutrienta | Compost 1 |
Compost 2 |
Vermicompost 1 |
Vermicompost 2 |
F-ANOVA | |
|---|---|---|---|---|---|---|
| Nt | 23.81 a | 30.18 b | 20.47 a | 21.91 a | 12.33* | |
| P2O5 | 15.23 | 15.00 | 19.66 | 18.64 | 6.43NS | |
| K2O | 23.66 b | 20.31 a | 29.20 c | 29.20 c | 5283.00*** | |
| Total combined value | 62.69 | 65.50 | 69.33 | 69.76 | ||
aThe estimation of the nutrient economic value of the composts and vermicomposts was based on a value of 45% moisture (the average value of the range established by US Composting Council [26]: 40 - 50%, for various applications of composts and different field conditions). For the abbreviations, see Table 1. ***, *, and NS: significant at p < 0.001, p < 0.05, and not significant, respectively. Values in a row followed by the same letter are not statistically different according to Tukey’s b test at p < 0.05.
Table 5.
Costs associated with the composting and vermicomposting processes (US$/ton).
| Costs associated | Composting process 1 |
Composting process 2 |
Vermicomposting process 1 |
Vermicomposting process 2 |
|---|---|---|---|---|
| Raw material transport | 33.33 | 23.81 | 16.81 | 15.04 |
| Earthworms | - | - | 58.82 | 52.63 |
| Labor for preparing the waste mixture, turning, and irrigation | 70.83 | 50.60 | 41.67 | 37.28 |
| Labor for monitoring the process | 33.45 | 23.89 | 25.30 | 22.63 |
| Indirect costs (water and energy used during process) | 6.88 | 4.91 | 5.94 | 5.31 |
| Total | 144.50 | 103.21 | 148.53 | 132.90 |
Disclaimer/Publisher’s Note: The statements, opinions and data contained in all publications are solely those of the individual author(s) and contributor(s) and not of MDPI and/or the editor(s). MDPI and/or the editor(s) disclaim responsibility for any injury to people or property resulting from any ideas, methods, instructions or products referred to in the content. |
© 2025 by the authors. Licensee MDPI, Basel, Switzerland. This article is an open access article distributed under the terms and conditions of the Creative Commons Attribution (CC BY) license (http://creativecommons.org/licenses/by/4.0/).
Copyright: This open access article is published under a Creative Commons CC BY 4.0 license, which permit the free download, distribution, and reuse, provided that the author and preprint are cited in any reuse.


