
Submitted:
16 September 2025
Posted:
16 September 2025
You are already at the latest version
Abstract
Traffic safety remains a critical area in transportation research due to its direct impact on public health. Reducing crash-related injuries and fatalities requires identifying key factors influencing injury severity. This study evaluates the predictive performance of three machine learning (ML) models; Random Forest (RF), XGBoost, and AdaBoost using a combination of structured crash data, highway characteristics, and unstructured crash narratives from police reports in Kentucky (2019–2023). RF was first applied for feature selection, identifying the top 100 predictors from over 350 variables. Two natural language processing (NLP) techniques; Term Frequency–Inverse Document Frequency (TF-IDF) and Word2Vec were then used to extract meaning from the crash narratives. These textual features were integrated with structured data to develop individual-level injury severity prediction models. XGBoost combined with TF-IDF yielded the highest predictive performance. The model was trained on 32,000 labeled records and then applied to a larger dataset of 67,000 crashes, many of which lacked injury severity data. The predicted results served as a baseline (Rb) for simulation-based sensitivity analysis. In this step, key input variables were systematically modified, and new predictions (R1, R2, etc.) were compared to assess how severity distributions shifted across four classes: fatal, major, minor, and possible injury. The analysis revealed that occupant entrapment, restraint use, not under proper control, ejection, speeding, and helmet use significantly influenced injury severity shifting. Changes in these factors often shifted outcomes from severe to less severe categories. These findings offer actionable insights for safety-focused policy and intervention strategies.
Keywords:
variable sensitivity analysis
; data-driven policy support
; crash injury severity shifting
; machine learning models
; text mining and NLP
1. Introduction
Traffic crashes continue to pose a major threat to public safety, causing significant loss of life, injuries, and economic burden globally. In the United States alone, tens of thousands of individuals are killed each year, while hundreds of thousands more suffer injuries ranging from minor to life-altering. Understanding and reducing crash-related injury severity is a key priority for transportation agencies and public health policymakers. While most prior studies have primarily focused on identifying the most important features associated with crash severity, few have explored the extent to which these variables can actively influence or shift severity outcomes. This research addresses that by adopting a three-step approach: first, identifying the most influential predictors using feature importance techniques; second, selecting the best-performing machine learning model for injury severity prediction; and third, conducting simulation-based sensitivity analyses. In these simulations, each key variable (particularly those with practical potential for empirical modification) was systematically adjusted to represent an ideal scenario. This allowed us to observe how such changes could shift injury outcomes, particularly reductions in fatal and serious injuries, providing actionable insights for data-driven safety interventions. Moreover, prior studies are mostly based on structured crash data and coded variables to model injury severity outcomes. While this information is valuable, it often fails to capture nuanced behavioral or contextual elements associated with crash events. Advances in NLP and text mining techniques present new opportunities for incorporating unstructured crash narratives (descriptions written by police officers at the crash scene) into injury prediction models. These narratives can provide rich qualitative insights that are not always captured in the structured dataset, potentially improving model performance and interpretability (1; 2).
This study builds on integrating both structured crash data and crash narratives to develop predictive models for individual-level injury severity using machine learning (ML) methods. In addition to evaluating the predictive accuracy of different model–text processing combinations, a key focus of this research is to identify which input variables most strongly influence injury prediction. To achieve this, Random Forest was first applied after data cleaning to select the top 100 most important variables from over 350 available variables. The model was then trained on a subset of approximately 32,000 crash records from 2019 to 2023 in Kentucky, where individual-level injury severity was reported in police crash forms. The full dataset used in this study was created by combining Kentucky police crash reports from 2019 to 2023 with detailed roadway and highway attributes from the Kentucky Highway Information System (HIS) database. Three ML models were implemented and compared for prediction: Random Forest (RF), XGBoost, and AdaBoost. To address the issue of class imbalance in injury data particularly the underrepresentation of fatal and major injuries a K-Nearest Neighbors (KNN) based oversampling strategy was applied to the training data before modeling. The first aim of the modeling process was to identify the best-performing combination of machine learning (ML) algorithms and NLP techniques. Based on the results, the integration of TF-IDF with the XGBoost model achieved the highest prediction performance. Following model development, predictions were generated for a larger dataset of nearly 67,000 crashes, in which only the original 32,000 had known injury severity values. The results of this prediction served as a baseline. Next, a simulation-based sensitivity analysis was conducted by systematically adjusting individual variables (such as posted speed limits, restraint usage, and alcohol involvement) and re-running the predictions to evaluate changes in the distribution of injury severity (3). The target variable in this study includes four levels of individual injury severity reported in Kentucky police crash records: fatal, major injury, minor injury, and possible injury. These simulation results are intended to inform targeted interventions aimed at reducing the frequency of severe injuries and improving overall traffic safety.
2. Literature Review
Traffic crashes remain one of the leading causes of injury and death globally, especially in the United States. To mitigate their impact, researchers have increasingly turned to predictive modeling techniques to better understand and prevent injuries. A substantial body of literature has concentrated on identifying key determinants of crash severity and developing predictive models to support transportation safety policies and decision-making. For a more extensive review of relevant studies, readers may refer to these references (4; 5). In this research, the objective extends beyond merely identifying the most important variables influencing injury severity. Equally critical is the identification of variables that not only hold predictive significance but also possess practical potential for change through policy, behavioral, or infrastructural interventions. By focusing on such actionable features, the study aims to determine which variables (when altered in simulation) lead to meaningful shifts in predicted injury severity outcomes. This dual emphasis allows for a more pragmatic application of machine learning results, guiding stakeholders toward factors that are both impactful and modifiable in real-world safety improvement efforts. Traditional statistical models, such as multinomial logit and ordered probit, have long been used to predict crash severity(6). However, these models often struggle with assumptions of linearity and fail to capture complex interactions between variables. To overcome these limitations, machine learning (ML) approaches such as Random Forest (RF), XGBoost, and AdaBoost have gained popularity for their ability to handle high-dimensional data, nonlinearity, and variable interactions(7). Injury severity prediction has commonly been approached at the crash level, where a single severity label is assigned to an entire crash, often based on the most severe outcome among all individuals involved. This method, while practical, overlooks the unique characteristics of each person involved in the crash. Recent studies have moved toward individual-level severity prediction to account for personal and situational heterogeneity(8). The NLP methods have shown promise in enhancing crash severity prediction by extracting useful features from unstructured crash narratives written by police officers. Methods such as TF-IDF and Word2Vec can uncover semantic information from text that is not captured in structured datasets. These techniques can capture subtle behavioral and situational details such as, improper vehicle control, sudden lane changes, or partial ejection that may signal a heightened risk of severe injury(9).
Another critical focus in the crash injury literature is identifying actionable variables that can meaningfully shift injury severity outcomes. Sensitivity analysis and simulation-based analysis have emerged as practical tools to assess how changes in key variables can alter predicted severity outcomes(10). These methods offer a powerful approach to test the potential safety benefits of policy or behavioral changes for example, increasing seat belt usage rates or reducing instances of speeding or alcohol involvement. Despite the growing body of ML-based injury prediction studies, relatively few have emphasized variable sensitivity as a core component. This is important because identifying which variables have the greatest potential to reduce severe outcomes can guide targeted safety interventions. For example, restraint use has consistently been linked to reductions in severe injury and fatality rates(11). To improve the accuracy and fairness of injury severity prediction, it is critical to address the inherent class imbalance that exists in most crash datasets. Severe injury cases such as, fatalities and major injuries are typically underrepresented compared to less severe outcomes like minor or possible injuries. This imbalance can cause machine learning models to bias their predictions toward the majority class, reducing their ability to accurately detect and predict rare but high-impact outcomes. To overcome this challenge, recent studies have incorporated oversampling techniques(12), particularly Synthetic Minority Oversampling Techniques (SMOTE) and its K-Nearest Neighbors (KNN)-based variations, to ensure a more balanced training process and enhance model generalization across severity levels. These methods have shown significant promise in reducing model bias and improving performance for minority classes.
Collectively, these advances in data balancing and text mining underscore the evolving role of machine learning in transportation safety research not just as a tool for classification, but as a framework for deeper insights. Our study leverages these capabilities to not only improve injury severity prediction accuracy but also to conduct systematic variable sensitivity analysis. This dual approach (combining balanced ML training with NLP-enhanced inputs) provides a powerful foundation for identifying which factors most significantly shift injury outcomes. For these reasons, we adopted this modeling strategy to better understand how individual crash variables influence injury severity shifting and to inform more effective and targeted safety interventions.
3. Data
Reliable research begins with accurate data collection and careful preparation. Inconsistent records, incorrect values, or poorly merged datasets can significantly undermine the validity and reliability of any analysis. Given the complexity of integrating diverse data sources and formats, this study placed strong emphasis on thorough data preparation and preprocessing to ensure the integrity of the modeling and results. The primary data for this research was obtained from two key sources: the Kentucky Highway Information System (HIS) and the official crash records maintained by the Kentucky State Police.
The HIS serves as a robust and comprehensive repository of roadway data in Kentucky, systematically categorized into eight main sections and over 30 detailed subgroups. Each subgroup is organized using route-specific identifiers; Route ID (RT_ID), Beginning Mile Point (BMP), and Ending Mile Point (EMP) and contains key roadway attributes such as posted speed limits, average annual daily traffic (AADT), number of lanes, median types, and functional classifications. For the purposes of this study, 15 subgroups were selected based on their relevance to roadway geometry and traffic flow, providing critical context for understanding crash environments across the state.
The selected HIS datasets were spatially integrated into a unified, statewide database using RT_ID, BMP, and EMP as joining keys. This comprehensive database enabled a detailed characterization of Kentucky’s roadway infrastructure.
The second primary data source for this study is the Kentucky State Police (KSP), which maintains detailed records of all officially reported motor vehicle crashes across the state. This research utilizes crash data spanning a five-year period from 2019 to 2023. The KSP dataset is organized into six major components: (1) general crash-level information, (2) vehicle-level details, (3) person-level records, (4) environmental conditions, (5) vehicle-specific attributes, and (6) driver-related characteristics. For each year, data from these six categories were collected, cleaned, and systematically merged to construct a unified, person-level crash dataset. These annual datasets were then consolidated into a comprehensive five-year database for the purpose of analysis. Given the study’s emphasis on individual-level injury prediction, only records corresponding to persons involved in crashes were retained for modeling. The dataset classifies injury severity into four levels: Fatal, Serious Injury, Minor Injury, and Possible Injury. Notably, it does not explicitly label “No Injury” cases at the person level. To address this limitation, an initial attempt was made to infer “No Injury” cases by including individuals from crashes labeled as Property Damage Only (O) with no reported injuries. However, this assumption introduced noise and reduced model performance. Consequently, the final dataset excludes the “No Injury” category and focuses solely on the four explicitly reported injury severity levels for predictive modeling.
Subsequently, the final cleaned crash dataset was spatially integrated with the Highway Information System (HIS) dataset. This spatial join was conducted using the RT_ID, BMP, EMP, and the specific Mile Point of each crash, ensuring accurate alignment between crash records and the corresponding roadway attributes. Post-integration, the merged dataset underwent careful validation to resolve any redundancies or inconsistencies. In the final integration step, the structured dataset was combined with crash narrative data. These narratives consist of free-text descriptions written by police officers at the scene, capturing detailed sequences of events, contributing factors, driver behaviors, and road or environmental conditions—elements often absent from structured fields. Incorporating this unstructured textual information adds a layer of context and depth, enhancing the accuracy and interpretability of injury severity prediction. To prepare the dataset for machine learning analysis, categorical features were encoded into numerical or binary formats using appropriate preprocessing techniques. The finalized dataset comprised 92 core features and over 350 derived sub-features. A summary of the key variables used in the modeling process is presented in Table 1.
4. Methodology
This methodology section outlines the comprehensive framework used to develop and evaluate injury severity prediction models by integrating structured crash data with unstructured police narrative texts. The process involved extensive preprocessing for both numerical/categorical variables and text narratives. For the textual data, NLP techniques TF-IDF and Word2Vec were applied to transform the narratives into numerical vector representations that capture both semantic content and contextual nuance. The full dataset was systematically divided into training, validation, and testing subsets. The validation set was used for model tuning, while the testing set served to assess final model performance. To address the inherent class imbalance in injury severity outcomes, the Synthetic Minority Over-sampling Technique (SMOTE) was implemented in combination with a K-Nearest Neighbors (KNN) strategy, helping ensure balanced representation across severity levels during training. Feature selection was performed on the structured dataset using feature importance scores from a Random Forest model. The top 100 most informative features were retained to reduce dimensionality and improve model generalization. Three machine learning algorithms RF, AdaBoost, and XGBoost were employed to build predictive models. These models leveraged both structured inputs and features derived from narrative texts to capture not only quantitative patterns but also the qualitative insights embedded in crash descriptions. After identifying the best-performing model, a separate dataset comprising over 67,000 records was utilized to conduct variable sensitivity analysis.
4.1. Data Preprocessing: Handling Missing Values
Real-world datasets, especially those derived from crash reports often contain missing values due to factors such as incomplete data entry, reporting errors, or unavailable information during incident documentation. Managing missing data effectively is critical, as it can substantially influence model accuracy and reliability. In this study, a two-pronged approach was adopted to address this issue: 1- features with more than 50% missing values were excluded from the analysis, and 2- the remaining missing values were imputed using the mode for binary (categorical) variables and the median for continuous (numerical) variables. This strategy helped preserve valuable information while maintaining the robustness of the dataset for machine learning applications(13; 14).
4.2. Model Validation Strategy
To ensure reliable model development and avoid overfitting, the dataset was divided into three subsets: training (70%), validation (15%), and testing (15%). The training set was used to teach the model, while the validation set supported hyperparameter tuning and model selection without introducing bias. The test set, kept entirely separate, was used once for final performance evaluation. Stratified sampling preserved the distribution of injury severity classes across all subsets. This three-way split prevents data leakage, ensures fair model assessment, and improves generalization to new data. It also enables iterative tuning while maintaining evaluation integrity, thereby enhancing the model’s real-world applicability(15).
4.3. Balancing Approach
Traffic crash data often suffer from severe class imbalance, with minor injuries far outnumbering severe or fatal cases. This imbalance can bias machine learning models toward predicting the majority class. To address this, SMOTE was applied to the training data, generating synthetic samples of rare classes by interpolating existing minority instances and their neighbors. This improves model performance while minimizing overfitting risks(16). The process for generating a synthetic sample is as follows: 1- For each minority class sample , its K nearest neighbors from the same minority class are identified. 2- One of these K neighbors, say , is randomly selected. 3- A new synthetic sample is created along the line segment connecting and using the following formula:
where δ is a random number between 0 and 1. This linear interpolation creates a new, but related, data point in the feature space.
SMOTE was applied exclusively to the training set; both the validation and test sets were left unaltered to preserve their original class distributions. This ensures that performance evaluations remain unbiased and truly reflective of the model’s effectiveness in real-world deployment scenarios(17).
4.4. Feature Selection
Feature selection plays a vital role in managing high-dimensional datasets by reducing complexity, minimizing overfitting, speeding up training, and improving interpretability and generalization. In this study, Random Forest’s built-in feature importance mechanism was used to identify and retain the most relevant variables, enabling more efficient and accurate modeling(18). This is typically achieved by calculating the Mean Decrease in Impurity (MDI), also known as Gini Importance(19). For a decision tree, impurity (e.g., Gini impurity for classification) at a node is a measure of the heterogeneity of the classes within that node. Gini impurity for a node with K classes is given by:
where is the proportion of samples belonging to class k at that node.
Random Forest determines feature importance by measuring the total reduction in impurity each feature contributes across all trees. In this study, importance scores were calculated using the Mean Decrease in Impurity (MDI) method, and features were ranked accordingly. An iterative process revealed that using the top 100 features produced the best model performance, balancing accuracy and computational efficiency. Random Forest’s ability to handle multicollinearity and capture non-linear interactions made it an ideal tool for selecting relevant predictors. Moreover, the selected features can be applied across different models, enhancing flexibility and generalization(20).
4.5. ML Models
4.5.1. Random Forest (RF)
Random Forest, introduced by Breiman (2001), is a powerful and flexible ensemble learning method based on the concept of bagging (bootstrap aggregating). It constructs multiple decision trees using random samples of the training data and aggregates their outputs typically via majority voting in classification tasks to improve prediction stability and accuracy. Two key strategies contribute to its effectiveness: training each tree on a bootstrapped sample to reduce variance and selecting a random subset of features at each split to promote tree diversity and minimize overfitting. The model is not only robust to noise and outliers but also well-suited for high-dimensional data. Additionally, Random Forests inherently provide feature importance scores, making them particularly useful for both prediction and feature selection applications(21).
4.5.2. Adaptive Boosting
AdaBoost (Adaptive Boosting), introduced by Freund and Schapire (1997), is one of the earliest and most influential ensemble learning algorithms based on the boosting paradigm. It functions by sequentially training a series of weak learners typically simple decision trees, often referred to as “decision stumps” when they contain only a single split. The key mechanism of AdaBoost lies in its iterative weight adjustment strategy: after each round of training, the algorithm increases the weights of misclassified instances so that the next weak learner pays greater attention to these more challenging cases. Conversely, instances classified correctly receive lower weights. Through this adaptive process, AdaBoost incrementally builds a stronger predictive model by focusing on errors made in previous iterations. This forces subsequent weak learners to focus more on the “difficult” samples. 2- Weighted Combination of Weak Learners: After training a specified number of weak learners, the final strong classifier H(x) is constructed as a weighted sum of the individual weak learners (x), where each weak learner (x) is assigned a weight αt based on its accuracy(22):
4.5.4. Extreme Gradient Boosting
XGBoost (Extreme Gradient Boosting) is an optimized, distributed gradient boosting library that has gained immense popularity for its efficiency, flexibility, and high predictive performance in various machine learning competitions and real-world applications(23). It builds upon the general framework of gradient boosting, where new decision trees are sequentially added to correct the errors (residuals) made by previous trees. Key enhancements and features of XGBoost include: 1- Regularization: XGBoost incorporates L1 (Lasso) and L2 (Ridge) regularization terms into its objective function. This helps to prevent overfitting by penalizing the complexity of the trees, leading to more generalized models. The regularized objective function at iteration t can be conceptually represented as:
where is the loss function, is the prediction from the previous (t−1) trees, is the new tree to be added, and is the regularization term for the new tree. 2- Parallel Processing: Optimized to run efficiently on parallel and distributed computing environments, significantly speeding up training times for large datasets. 3- Handling Missing Values: XGBoost can inherently handle missing values. It learns the optimal direction for missing values to go (left or right child node) during tree splits based on patterns observed in the data. 4- Tree Pruning: Unlike greedy approaches, XGBoost grows trees to their maximum depth first and then prunes them backward based on a specified gain criterion, which helps in preventing overfitting and finding optimal tree structures(23).
4.6. Text Mining Techniques
4.6.1. TF-IDF
TF-IDF is a widely used statistical measure for evaluating the importance of a word in a document relative to a collection of documents (corpus). It assigns a weight to each term based on how frequently it appears in a specific document (Term Frequency) balanced by how rare it is across the entire corpus (Inverse Document Frequency)(24). The TF-IDF transformation was applied to the preprocessed crash narratives. The process involves:
- -
- Term Frequency (TF)
Measures how frequently a term t appears in a document d. This can be a raw count or a normalized count.
- -
- Inverse Document Frequency (IDF)
Measures how important a term is by down-weighting terms that appear very frequently across many documents (e.g., stop words) and up-weighting terms that are rare. The IDF for a term t in a corpus D with N documents and being the number of documents containing term t is calculated as:
- -
- TF-IDF Score
The final TF-IDF score for a term t in document d within corpus D is the product of its TF and IDF scores, typically followed by L2 normalization for the entire document vector:
Each processed narrative was transformed into a sparse TF-IDF vector, representing the narrative in a high-dimensional feature space where each dimension corresponds to a unique term from the corpus vocabulary. These sparse vectors were then converted into dense NumPy arrays for compatibility with the machine learning models.
TF-IDF offers several advantages when applied to crash narrative data. It is particularly effective at identifying keywords that are locally significant within a given narrative yet relatively uncommon across the broader dataset allowing the model to capture terms that may indicate specific injury mechanisms or crash contexts. Due to its lightweight computational requirements, TF-IDF is also well-suited for large-scale datasets, enabling fast and scalable processing. Furthermore, by assigning lower weights to frequently occurring and less informative words, the TF-IDF process serves as a built-in feature selection mechanism that helps focus the analysis on the most meaningful and discriminative terms in the text.
4.6.2. Word2Vec
To address the limitations of sparse bag-of-words models, Word2Vec was employed to generate dense, low-dimensional vector representations of words from crash narratives. Word2Vec operates on the principle of distributional semantics, learning that words appearing in similar contexts tend to share similar meanings. It does so by optimizing the likelihood of observing neighboring words within a defined window around each target word, thereby capturing nuanced relationships based on usage patterns in the corpus. This results in continuous word embeddings that encode semantic similarity, enabling the model to better interpret the textual content and uncover patterns that may be associated with injury severity or crash dynamics (25).
These textual features, derived from both TF-IDF and Word2Vec, were then integrated with the structured data features to form a comprehensive, multi-modal input for the machine learning models, enabling a more holistic understanding of crash severity factors.
4.7. Evaluation Metrics
Given the confirmed class imbalance in the test dataset, model performance was rigorously evaluated using metrics that are robust to skewed class distributions. Relying solely on accuracy would be misleading in such scenarios. The primary evaluation metrics were(8):
- -
- Precision (P)
The proportion of correctly predicted positive observations out of all positive predictions. It quantifies the model’s ability to avoid false positives.
- -
- Recall (R) (Sensitivity)
The proportion of correctly predicted positive observations out of all actual positives. It quantifies the model’s ability to find all positive instances.
- -
- F1-score (F1)
The harmonic mean of Precision and Recall. It provides a balanced measure, especially useful when there is an uneven class distribution, as it penalizes models that perform well on one metric but poorly on the other.
- -
- Macro Average F1-score
This metric calculates the F1-score for each class independently and then takes the unweighted arithmetic mean of these per-class F1-scores. It gives equal weight to each class, regardless of its size, thus providing a strong indicator of the model’s performance on minority classes.
- -
- Weighted (Micro) Average F1-score
This metric also calculates per-class F1-scores but then takes an average weighted by the support (number of true instances) of each class. This provides an overall F1-score that reflects the performance on the larger classes more heavily, aligning with the real-world class distribution in the test set.
- -
- Accuracy
While secondary due to imbalance, overall accuracy providing a general measure of correctness across all predictions.
Where the true positive (TP) is the number of positive cases correctly identified as such, the true negative (TN) is the number of negative cases correctly identified as such, the false negative (FN) is the number of positive cases incorrectly identified as negative, and the false positive (FP) is the number of negative cases incorrectly identified as positive.
5. Results and Discussion
This section presents the integration of ML and NLP techniques for injury severity prediction, followed by an analysis of feature sensitivity and its impact on severity outcomes. A total of nine models were developed, and the best-performing results across different data configurations are summarized in Figure 1. The modeling process began with structured data only, without narrative information. Subsequently, crash narratives were incorporated using two distinct NLP approaches; TF-IDF and Word2Vec, to evaluate their contribution to model performance. As shown in the figure, Random Forest (RF) outperformed other models when only structured data were used. However, when narrative data were included, XGBoost consistently achieved the highest performance across both NLP techniques.
After identifying the best-performing model (a combination of XGBoost and TF-IDF) the next step involved applying this model to a larger dataset comprising over 67,000 records to predict injury severity outcomes. These predictions served as the baseline scenario for comparison. The third phase focused on identifying the most influential variables affecting crash severity from more than 350 available features. To facilitate this, the top 100 most important features were first selected using feature importance scores derived from the Random Forest model. Subsequently, a variable sensitivity analysis was conducted by systematically altering individual variables and re-running the prediction model. The resulting changes in the distribution of injury severity levels were then evaluated, highlighting those variables whose simulated adjustments led to meaningful shifts in predicted outcomes. Table 2 presents the variables for which simulation results indicated a significant effect on injury severity outcomes. The table includes the proportion of each variable’s occurrence in the dataset and the predicted number of cases for each injury severity level following simulation. The last row provides the baseline results for comparison. As shown in Table 2, the first variable evaluated in the sensitivity analysis was the posted speed limit on rural two-lane highways (R2L). According to Rahman (2023), there is a negative correlation between speed and crash frequency(26), and these road types are associated with a disproportionate share of crashes accounting for approximately 40% of all crashes, 47% of injury-related crashes, and 66% of fatal crashes in Kentucky(27). Given that over 85% of rural two-lane segments in our dataset had speed limits of 55 or 50 mph, we simulated a scenario where these speed limits were uniformly reduced to 45 mph to evaluate potential shifts in injury severity outcomes. According to the results, R1 and Rb, this change led to a reduction in major and minor injuries, with a corresponding shift toward possible injury. Additionally, a simulation was conducted to evaluate the impact of a 5 mph increase in speed limit across all records. The results indicated a shift in injury severity distribution, with an increase in minor injuries and a corresponding decrease in possible injuries.
The next variables examined were impairment R3 and roadway departure R4 indicators. Simulations were performed under the assumption of no impairment and no roadway departure. As shown, the R4 simulation demonstrated a notable impact by reducing both major and minor injuries and shifting outcomes toward possible injuries. Although impairment cases R3 represented a smaller portion of the dataset, simulating their absence still resulted in a measurable reduction in major injuries. Another variable examined was helmet non-use among bicyclists and motorcyclists involved in crashes. Although individuals not wearing helmets represent only a small portion of the dataset (approximately 1.7%), simulating a scenario in which all of them used helmets resulted in a substantial reduction in the number of predicted major injuries. However, the number of fatalities remained unchanged. This is likely due to the extremely low share (0.14%) of fatal cases involving unhelmet bicyclists or motorcyclists in the original dataset, limiting the model’s ability to detect any significant shift in fatal outcomes.
We now turn to the simulated variables that demonstrated measurable impacts on the number of fatal injuries. The first two; alcohol involvement and exceeding the speed limit are driver-related behavioral factors. Although these conditions represent a relatively small proportion of the dataset, simulating scenarios in which no alcohol (R6) and no speeding (R7) occurred resulted in a substantial shift in predicted injury outcomes. Specifically, fatalities, major, and minor injuries decreased, while possible injuries increased. This finding underscores the critical role these human factors play in influencing individual-level injury severity. The next variable examined is occupant ejection from the vehicle, which accounts for approximately 2% of the dataset. When simulating a scenario where no ejection occurred (R8), the results indicated a significant reduction in both fatal and major injuries. This highlights the critical importance of addressing ejection-related factors through policy interventions and technological advancements. Encouraging the use of seat belts, improving vehicle design, and implementing advanced restraint systems could substantially mitigate injury severity outcomes associated with occupant ejection. Another influential variable examined is the human factor associated with driver impairment, representing conditions in which drivers are not in proper control (due to drugs, medication, fatigue, alcohol, etc.). When this variable was simulated under an idealized condition of no impairment (R9), the results demonstrated a noticeable reduction across all three serious injury categories particularly in fatal and minor injury levels. The final two variables demonstrated the greatest impact on reducing fatal and major injuries. The first represents individuals who were injured while not wearing a seatbelt, and the second pertains to occupants who were trapped inside vehicles following a crash. Simulating a scenario in which all individuals in the first group wore seatbelts (R10) resulted in a notable reduction of 94 fatal and 195 major injuries. For the second group, assuming no one was trapped (R11) post-collision yielded the largest observed decrease in fatal and major injuries 110 and 621 cases, respectively. These results strongly reinforce the life-saving value of seatbelt usage and highlight the need for continued policy efforts to promote compliance. Furthermore, the vehicle entrapment variable underscores the critical role this condition plays in injury outcomes. It not only points to opportunities for vehicle manufacturers to improve safety designs but also emphasizes the importance of emergency response times. Trapped occupants may experience delays in medical intervention, which can exacerbate injury severity and reduce survival rates.
In this study, the analysis and prioritization of each variable’s impact were primarily based on the observed changes in the number of fatal injuries. However, alternative prioritization methods could be considered such as, weighting the total changes across all severity classes according to their associated societal or economic costs. Additionally, incorporating the inverse of each variable’s prevalence in the dataset could offer further insight into the relative importance of less frequent but highly impactful variables.
6. Conclusion
This study presents a comprehensive framework for predicting individual-level injury severity in traffic crashes by integrating structured crash data with unstructured police narratives using advanced ML and NLP techniques. Among the nine developed models, the combination of XGBoost and TF-IDF yielded the best performance, demonstrating the effectiveness of merging contextual narrative insights with structured features to improve predictive accuracy.
Variable sensitivity analysis revealed that occupant entrapment, lack of seatbelt use, and impaired driver control were the most influential factors in reducing severe injury outcomes in Kentucky crashes. These variables showed the highest potential to shift fatal and major injuries toward minor and possible injuries when ideal conditions were simulated. While other analytical approaches such as, weighting severity classes by societal cost or adjusting for each variable’s share in the dataset could further refine prioritization, this study prioritized based on reductions in the fatal injury class, given its critical importance in safety assessments and policy action. Furthermore, the use of class balancing techniques and NLP methods led to notable improvements in evaluation metrics for rare injury classes (fatal injuries) compared to previous studies with close contexts, such as the work by Zhu et al. (2021)(28), the F1 score for fatal class has been increased from 13.2% to 83%.
The approach demonstrated in this research offers a low-cost, easily implementable method for policymakers and transportation agencies to assess the real-world impact of potential safety interventions. By simulating changes in specific crash factors, decision-makers can identify and act upon the most promising areas for injury reduction. Although this study relied solely on police-reported injury data to define severity levels, future research incorporating EMS or hospital-reported medical outcomes could further enhance prediction precision. Additionally, incorporating roadway classification and network heterogeneity such as comparing freeway vs. non-freeway or multi-lane vs. two-lane segments may uncover more localized, context-sensitive factors that influence injury severity. This line of research provides a foundation for evidence-based, targeted safety improvements across diverse roadway environments.
References
- Khairuddin, M.Z.F.; Sankaranarayanan, S.; Hasikin, K.; Razak, N.A.A.; Omar, R. Contextualizing injury severity from occupational accident reports using an optimized deep learning prediction model. PeerJ Comput. Sci. 2024, 10, e1985. [CrossRef]
- Goldberg, D.M. Characterizing accident narratives with word embeddings: Improving accuracy, richness, and generalizability. J. Saf. Res. 2022, 80, 441–455. [CrossRef]
- Shaaban, K.; Ibrahim, M. Analysis and Identification of Contributing Factors of Traffic Crashes in New York City. Transp. Res. Procedia 2021, 55, 1696–1703. [CrossRef]
- Bhuiyan, H.; Ara, J.; Hasib, K.M.; Sourav, I.H.; Karim, F.B.; Sik-Lanyi, C.; Governatori, G.; Rakotonirainy, A.; Yasmin, S. Crash severity analysis and risk factors identification based on an alternate data source: a case study of developing country. Sci. Rep. 2022, 12, 1–22. [CrossRef]
- Zhipeng, P.; Yuan, R.; Qin, Y.; Wang, Y.; Gu, X. A comparative analysis of factors affecting injury severity in speeding-related crashes on rural and urban roads. Int. J. Crashworthiness 2024, 29, 794–805. [CrossRef]
- Qiu, B.; Fan, W.(. Mixed logit models for examining pedestrian injury severities at intersection and non-intersection locations. J. Transp. Saf. Secur. 2021, 14, 1333–1357. [CrossRef]
- Ahmed, S.; Hossain, A.; Bhuiyan, M.I.; Ray, S.K. A Comparative Study of Machine Learning Algorithms to Predict Road Accident Severity. 2021 20th International Conference on Ubiquitous Computing and Communications (IUCC/CIT/DSCI/SmartCNS). 2021; pp. 390–397.
- Jiang, Y.; Qu, X.; Zhang, W.; Guo, W.; Xu, J.; Yu, W.; Chen, Y. Analyzing Crash Severity: Human Injury Severity Prediction Method Based on Transformer Model. Vehicles 2025, 7, 5. [CrossRef]
- Li, P.; Chen, S.; Yue, L.; Xu, Y.; Noyce, D.A. Analyzing relationships between latent topics in autonomous vehicle crash narratives and crash severity using natural language processing techniques and explainable XGBoost. Accid. Anal. Prev. 2024, 203, 107605. [CrossRef]
- Shao, Y.; Shi, X.; Zhang, Y.; Shiwakoti, N.; Xu, Y.; Ye, Z. Injury severity prediction and exploration of behavior-cause relationships in automotive crashes using natural language processing and extreme gradient boosting. Eng. Appl. Artif. Intell. 2024, 133. [CrossRef]
- Mbarga, N.F.; Abubakari, A.-R.; Aminde, L.N.; Morgan, A.R. Seatbelt use and risk of major injuries sustained by vehicle occupants during motor-vehicle crashes: a systematic review and meta-analysis of cohort studies. BMC Public Heal. 2018, 18, 1413. [CrossRef]
- Mujahid, M.; Kına, E.; Rustam, F.; Villar, M.G.; Alvarado, E.S.; Diez, I.D.L.T.; Ashraf, I. Data oversampling and imbalanced datasets: an investigation of performance for machine learning and feature engineering. J. Big Data 2024, 11, 1–32. [CrossRef]
- Acuna, E., and C. Rodriguez. The treatment of missing values and its effect on classifier accuracy.In Classification, Clustering, and Data Mining Applications: Proceedings of the Meeting of the International Federation of Classification Societies (IFCS), Illinois Institute of Technology, Chicago, 15–18 July 2004, Springer, 2004. pp. 639-647.
- Imtiaz, S.A.; Shah, S.L. Treatment of missing values in process data analysis. Can. J. Chem. Eng. 2008, 86, 838–858. [CrossRef]
- Yan, Y.; Zheng, Z.; Zhang, Y.; Zhang, Y.; Yao, Y. CPS-3WS: A critical pattern supported three-way sampling method for classifying class-overlapped imbalanced data. Inf. Sci. 2024, 676. [CrossRef]
- Chawla, N.V.; Bowyer, K.W.; Hall, L.O.; Kegelmeyer, W.P. SMOTE: Synthetic Minority Over-sampling Technique. J. Artif. Intell. Res. 2002, 16, 321–357. [CrossRef]
- Sampath, P.; Elangovan, G.; Ravichandran, K.; Shanmuganathan, V.; Pasupathi, S.; Chakrabarti, T.; Chakrabarti, P.; Margala, M. Robust diabetic prediction using ensemble machine learning models with synthetic minority over-sampling technique. Sci. Rep. 2024, 14, 1–15. [CrossRef]
- Kaur, A., K. Guleria, and N. K. Trivedi. Feature selection in machine learning: Methods and comparison.In 2021 International Conference on Advance Computing and Innovative Technologies in Engineering (ICACITE), IEEE, 2021. pp. 789-795.
- Chen, J.; Tao, W.; Jing, Z.; Wang, P.; Jin, Y. Traffic accident duration prediction using multi-mode data and ensemble deep learning. Heliyon 2024, 10, e25957. [CrossRef]
- Li, Y.; Li, T.; Liu, H. Recent advances in feature selection and its applications. Knowl. Inf. Syst. 2017, 53, 551–577. [CrossRef]
- Breiman, L. Random forests. Machine learning, Vol. 45, 2001, pp. 5-32.
- Ying, C., M. Qi-Guang, L. Jia-Chen, and G. Lin. Advance and prospects of AdaBoost algorithm. Acta Automatica Sinica, Vol. 39, No. 6, 2013, pp. 745-758.
- Kavzoglu, T.; Teke, A. Predictive Performances of Ensemble Machine Learning Algorithms in Landslide Susceptibility Mapping Using Random Forest, Extreme Gradient Boosting (XGBoost) and Natural Gradient Boosting (NGBoost). Arab. J. Sci. Eng. 2022, 47, 7367–7385. [CrossRef]
- Al-Obaydy, W.N.I.; Hashim, H.A.; Najm, Y.A.; Jalal, A.A. Document classification using term frequency-inverse document frequency and K-means clustering. Indones. J. Electr. Eng. Comput. Sci. 2022, 27, 1517–1524. [CrossRef]
- Mikolov, T., K. Chen, G. Corrado, and J. Dean. Efficient estimation of word representations in vector space. arXiv preprint arXiv:1301.3781, 2013.
- Rahman, F.; Zhang, X.; Chen, M.; Shiwakoti, N. Evaluating Effect of Operating Speed on Crashes of Rural Two-Lane Highways. J. Adv. Transp. 2023, 2023, 1–13. [CrossRef]
- Rahman, F. Incorporating speed into crash modeling for rural two-lane highways. 2022.
- Zhu, S.; Wang, K.; Li, C. Crash Injury Severity Prediction Using an Ordinal Classification Machine Learning Approach. Int. J. Environ. Res. Public Heal. 2021, 18, 11564. [CrossRef]
Figure 1.
best model performance.
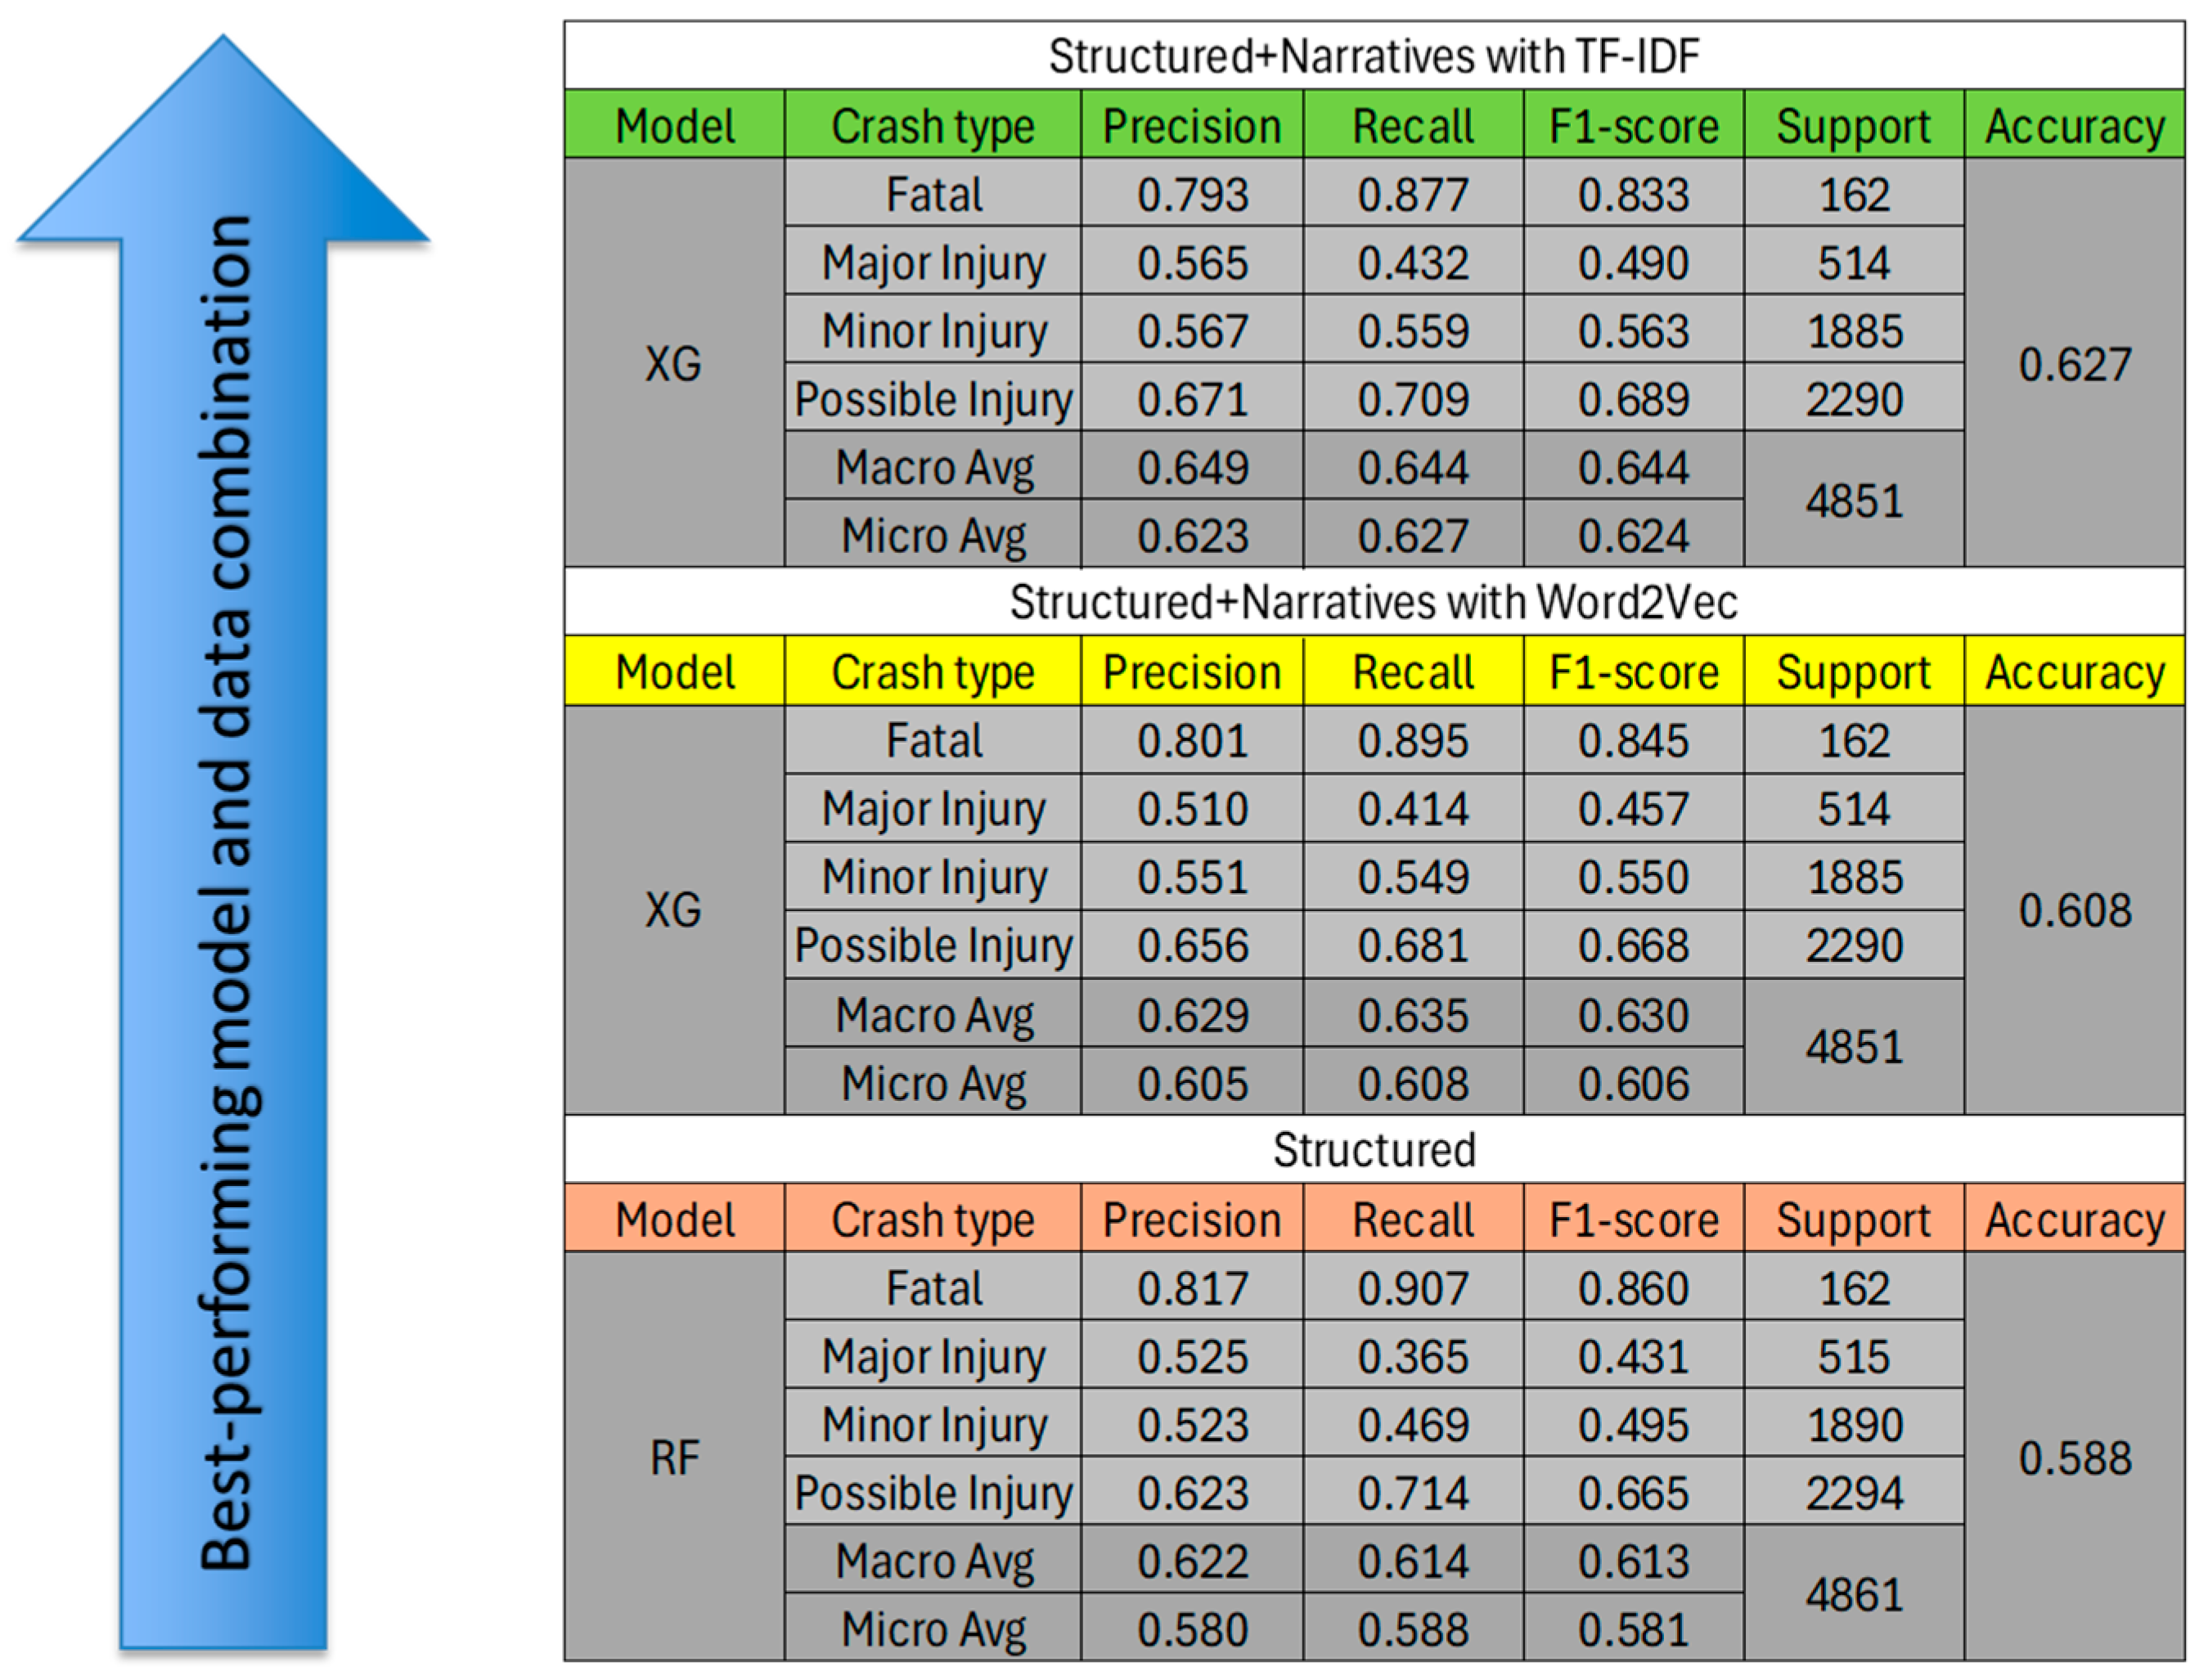

Table 1.
Crash percentages and features by varying crash severity.
| Feature | Category | Number | Percentage of Traffic Crash Severity (%) | |||
| Fatal | Major Injury | Minor Injury | Possible Injury | |||
| Speed Limit | 0 - 25 | 1110 | 1.09 | 6.84 | 40.27 | 51.80 |
| 30 - 50 | 10503 | 1.96 | 7.40 | 39.28 | 5136 | |
| 55 - 75 | 20727 | 4.15 | 12.42 | 38.58 | 44.85 | |
| Gender | Male | 16583 | 4.45 | 13.23 | 39.73 | 42.59 |
| Female | 15713 | 2.16 | 7.85 | 38.00 | 52.00 | |
| Age | 22 > | 7026 | 2.01 | 9.05 | 38.86 | 50.09 |
| 22 - 65 | 21507 | 3.49 | 11.24 | 39.36 | 45.91 | |
| > 65 | 3412 | 5.33 | 10.11 | 38.04 | 46.51 | |
| Alcohol | Yes | 1609 | 9.63 | 22.68 | 40.09 | 27.59 |
| No | 21196 | 2.91 | 10.10 | 39.94 | 47.05 | |
| Crash Type | Angle | 4762 | 2.33 | 6.22 | 36.92 | 54.54 |
| Backing | 66 | 1.52 | 3.03 | 39.39 | 56.06 | |
| Head on | 2634 | 8.12 | 19.13 | 35.73 | 37.02 | |
| Left turn | 1020 | 0.98 | 8.14 | 44.41 | 46.47 | |
| Rear end | 7710 | 1.14 | 4.81 | 35.67 | 58.38 | |
| Rear to rear | 137 | 0.73 | 6.57 | 38.69 | 54.01 | |
| Sideswipe-O-Dir | 1064 | 3.38 | 8.74 | 42.39 | 45.49 | |
| Sideswipe-Dir | 1732 | 0.92 | 6.12 | 40.01 | 52.94 | |
| Single vehicle | 13214 | 4.55 | 14.86 | 41.19 | 39.40 | |
| Light Condition | Dawn | 702 | 2.99 | 7.12 | 40.46 | 49.43 |
| Daylight | 21891 | 2.63 | 9.68 | 37.73 | 49.96 | |
| Dusk | 746 | 5.63 | 14.75 | 41.96 | 37.67 | |
| Dark-HWY lighted/off | 491 | 4.68 | 15.07 | 39.31 | 40.94 | |
| Dark-HWY lighted/on | 3006 | 3.06 | 9.25 | 44.64 | 43.05 | |
| Dark-HWY not lighted | 4948 | 6.24 | 14.96 | 38.74 | 40.06 | |
| Dark (unknown light) | 510 | 2.16 | 10.39 | 48.04 | 39.41 | |
| Other | 15 | 0.00 | 0.00 | 26.67 | 73.33 | |
| Unknown | 28 | 17.86 | 10.71 | 35.71 | 35.71 | |
| Airbag | On | 18342 | 3.48 | 10.39 | 39.65 | 46.48 |
| Off | 814 | 2.21 | 10.32 | 40.79 | 46.68 | |
| Not Presented | 13184 | 3.2 | 10.91 | 37.65 | 48.23 | |
| Weather | Blowing Snow | 36 | 2.78 | 2.78 | 69.44 | 25 |
| Clear | 20662 | 3.58 | 11.67 | 39.28 | 45.47 | |
| Cloudy | 6192 | 3.04 | 9.9 | 36.72 | 50.34 | |
| Fog with rain | 73 | 1.37 | 6.85 | 45.21 | 46.58 | |
| Raining | 4525 | 2.63 | 7.18 | 38.43 | 51.76 | |
| Crosswinds | 45 | 0 | 17.78 | 35.56 | 46.67 | |
| Sleet, hail | 178 | 4.49 | 8.99 | 49.44 | 37.08 | |
| Snowing | 360 | 1.94 | 5.28 | 43.06 | 49.72 | |
| Fog | 205 | 5.37 | 10.24 | 43.9 | 40.49 | |
| Smog, smoke | 7 | 0 | 28.57 | 28.57 | 42.86 | |
| Other | 55 | 7.27 | 9.09 | 52.73 | 30.91 | |
| Person Type | Driver | 22806 | 3.39 | 10.99 | 39.95 | 45.68 |
| Passenger | 8664 | 2.1 | 8.75 | 35.66 | 53.49 | |
| Pedestrian | 668 | 16.62 | 20.21 | 39.37 | 23.8 | |
| Animal-drawn/ridden | 29 | 0 | 20.69 | 41.38 | 37.93 | |
| Bicyclist | 159 | 8.18 | 13.21 | 54.09 | 24.53 | |
| Property owner | 14 | 0 | 14.29 | 57.14 | 28.57 | |
Table 2.
Variable sensitive results:.
| Variable changes | Percentage (%) | Possible injury | Minor injury | Major injury | Fatal |
| R2L_Speed Limit 55&50 to 45 mph (R1) | 29 | 40503 | 22250 | 3061 | 1969 |
| Increasing Speed Limit 5 mph (R2) | 100 | 40487 | 22263 | 3064 | 1969 |
| No Impairment (R3) | 8 | 40499 | 22256 | 3059 | 1969 |
| No Roadway Departure (R4) | 47 | 40728 | 22205 | 2881 | 1969 |
| Using Helmet (by bicyclist and motorcyclist) (R5) | 1.7 | 40508 | 22271 | 3035 | 1969 |
| No Alcohol (R6) | 2.2 | 40546 | 22217 | 3056 | 1964 |
| No Exceeded from Speed Limit (R7) | 1 | 40517 | 22244 | 3061 | 1961 |
| No Ejection (R8) | 2 | 40567 | 22315 | 2946 | 1955 |
| Under Proper Control (R9) | 10 | 40688 | 22088 | 3061 | 1946 |
| Using Seat Belt (R10) | 5.2 | 40705 | 22334 | 2869 | 1875 |
| No Trapp (R11) | 5.4 | 40877 | 22604 | 2443 | 1859 |
| Baseline Prediction (Rb) | - | 40497 | 22253 | 3064 | 1969 |
Disclaimer/Publisher’s Note: The statements, opinions and data contained in all publications are solely those of the individual author(s) and contributor(s) and not of MDPI and/or the editor(s). MDPI and/or the editor(s) disclaim responsibility for any injury to people or property resulting from any ideas, methods, instructions or products referred to in the content. |
© 2025 by the authors. Licensee MDPI, Basel, Switzerland. This article is an open access article distributed under the terms and conditions of the Creative Commons Attribution (CC BY) license (http://creativecommons.org/licenses/by/4.0/).
Copyright: This open access article is published under a Creative Commons CC BY 4.0 license, which permit the free download, distribution, and reuse, provided that the author and preprint are cited in any reuse.


