

Submitted:
02 September 2024
Posted:
03 September 2024
You are already at the latest version
Abstract
Despite various interventions in road safety work, fatal and severe road traffic accidents (RTAs) remain a significant challenge leading to human suffering and economic costs. Understanding the multicausal nature of RTAs, where multiple conditions and factors interact, is crucial for developing effective prevention measures in road safety work. This study investigates the multivariate statistical analysis of co-occurring conditions in RTAs, focusing on single-vehicle accidents with single occupancy and personal injury on Austrian roads outside built-up areas from 2012 to 2019. The aim is to detect recurring combinations of accident-related variables, referred to as blackpatterns (BPs), using the Austrian RTA database. The study proposes Fisher’s exact test to estimate the relationship between an accident-related variable and fatal and severe RTAs (severe casualties). In terms of pattern recognition, the study develops the maximum combination value (MCV) of accident-related variables, a procedure to search through all possible combinations of variables to find the one that has the highest frequency. The accident investigation proceeds with the application of pattern recognition methods, including binomial logistic regression and a newly developed method, the PATTERMAX-method, created to accurately detect and analyse variable-specific BPs in RTA data. Findings indicate significant BPs contributing to severe accidents. The combination of binomial logistic regression and the PATTERMAX-method appears to be a promising approach to investigate severe accidents, providing both insights into detailed variable combinations and their impact on accident severity.
Keywords:
accident analysis
; statistical methods
; road safety
; pattern recognition
; accident prevention
1. Introduction
1.1. Relevance and Problem Statement
Road traffic accidents () with personal injuries result in substantial material and immaterial costs. According to the Austrian Accident Cost Accounting from 2022, the economic costs of a single fatal are estimated at 4.801.407 Euros, with accidents resulting in severe injuries costing 593.479 Euros each [1]. Despite various interventions, fatal remain a significant challenge worldwide. Austria experienced a peak in fatal in 1972, with 2.948 fatalities. Since then, numerous safety interventions, such as speed limits and mandatory seatbelt use, have significantly reduced the number of fatal accidents [2]. However, Austria still ranks 11th in the EU with 47 traffic fatalities per million inhabitants in 2019 [3]. The Austrian Ministry of the Interior [4] identifies several major accident causes, including speeding, distraction, and priority violations. These causes are determined subjectively by police officers at the scene, leading to potential biases. Besides the definition of accident causes, road safety work also focuses on the identification of accident blackspots. Blackspots are road sections where accidents frequently occur. Identifying these points is crucial for implementing targeted safety measures. However, going beyond the definition of a major accident cause and the identification of blackspots, this study aims to identify blackpatterns (), which we define as recurring combinations of accident-related variables [5]. We conduct a detailed examination of recorded accident conditions, regardless of the officially designated accident cause. Understanding the multicausal nature of , where multiple conditions and factors interact, is crucial for developing effective prevention measures. This study addresses the gap in multivariate statistical investigation and pattern analysis approaches of , proposing that accidents are influenced by a complex interplay of driver, vehicle, roadway, and situational variables.
1.2. Literature Review
are a significant public health concern, influenced by a complex interplay of factors. Various studies emphasize the need for a multidimensional approach to understand and prevent s. [6] reviewed various data sources and techniques for accident analysis, emphasizing the benefits of combining multiple analytical methods. [7] employed system dynamics to model the complexity of , highlighting the importance of considering non-linear interactions between variables. [8] proposed a multidimensional and multi-period analysis of road safety, incorporating various criteria such as human factors, accident causes, and road characteristics. [9] reviewed , emphasizing the multifactorial nature of accidents involving human, vehicular, and environmental elements. [10] reviewed black spot identification methods, emphasizing the coupling of statistical and accident severity index methods for more reliable road safety assessments. [11] used generalized logistic regression and classification trees to identify combinations of factors leading to fatal accidents. [12] applied association rule mining to reveal complex interactions between human, vehicle, road, and environmental factors in multi-fatality crashes. [13] introduced a novel matched crash vs. non-crash approach for analysing severe crash patterns on multilane highways, identifying significant factors for different crash types. [14] developed logistic regression models to estimate fatality and major injury probabilities in single-vehicle accidents, finding that the major injury model had better explanatory power. These studies collectively demonstrate the value of advanced statistical methods in understanding accident circumstances and identifying potential areas for targeted interventions.
When analysing data, one of the major targets is to quantify the influence of an accident-related variable on the degree of injury. Research has identified various factors influencing accident severity and frequency. For example, [15,16] identified collision mode, road configuration, vehicle type, driver characteristics, and environmental conditions. [16] declare motorcycles, male drivers, elderly drivers, nighttime driving, high-speed roads, and darkness without lighting as specific risk factors associated with higher accident severity.
[17] revealed that that safety devices, narrow impact, ejection, airbag deployment, and higher speed are associated with more severe injuries. Other research identified airbag deployment, extrication, ejection, travel speed, and alcohol involvement as the most critical factors affecting injury severity [18,19]. [20] demonstrated that multiple driver mistakes tend to result in more severe crashes. According to [21,22], factors affecting accident severity include environmental conditions, vehicle type, protective devices, and time of day. Understanding these variables is crucial for conducting exploratory data analysis and developing effective road safety measures [23].
Further studies highlight the importance of comprehensive data analysis in developing effective road safety strategies [10,24,25,26]. [27] advocates for a system approach that focuses on the entire road transport system rather than just individual behaviour. [28] highlight the effectiveness of various interventions, including educational, engineering, and multifaceted approaches, in improving pedestrian safety. [29] found that legislation combined with strong enforcement or as part of a multifaceted approach was most effective in low- and middle-income countries. [30] stresses the importance of awareness creation, strict implementation of traffic rules, and scientific engineering measures to prevent . The dynamic interactions between various factors to analyse and develop more effective safety measures underscore the necessity of comprehensive, multidimensional approaches to prevention.
1.3. Research Question and Scope
remain a significant challenge, with single-vehicle accidents accounting for a substantial portion of fatalities in Europe [14]. Within the scope of a multidimensional approach to analysis, this study investigates how multivariate and recurrent in single-vehicle accidents can be identified, as well as their significance for severe and fatal accidents (referred to as severe casualties). The study aims to represent driver, vehicle, roadway, and situational variables and their correlations with accident severity using advanced statistical methods. Additionally, it identifies significant among these variables. These patterns provide a deeper understanding of accident circumstances and highlight potential areas for targeted safety interventions. By combining descriptive statistics, binomial logistic regression, and innovative methods like the PATTERMAX-method, the study seeks to detect recurring patterns that contribute to severe accidents and evaluate their frequency and impact. The research is intended not only to improve road safety measures but also to facilitate the development of more precise prevention strategies that target the most hazardous accident . Therefore, this paper addresses the following research question: How can multivariate and recurrent variable-specific blackpatterns () in single-vehicle, single-occupant road traffic accidents with personal injury be accurately identified and analysed, and what is their significance in mitigating severe and fatal accidents?
2. Methods
2.1. Data Preparation for Pattern Recognition
Between 2012 and 2019, 303.700 occurred on the Austrian road network. 110.666 road accidents occurred outside built-up areas, while 193.034 accidents occurred within built-up areas. The study focuses on single-vehicle accidents with single occupancy that occurred outside built-up areas between 2012 and 2019 (20.293). The chosen sample amounts to 7 % of all with a personal injury in Austria between 2012-2019 (303.700). Within the period under review, 110.666 accidents with personal injury occurred outside the built-up area, of which the extracted sample comprises 18 %. The selection of these specific accidents allows for an analysis that is not confounded by the presence of multiple vehicles or individuals, which could otherwise complicate the already complex nature of road traffic accidents. By isolating these accidents, the study can more effectively identify and examine the underlying and factors contributing to severe outcomes, making this sample particularly valuable for targeted analysis. The data preparation involves creating a binary database with over 150 accident-related variables. Figure 1 illustrates the extracted data sample in relation to all recorded between 2012-2019 in Austria.
2.2. Accident-Related Variables
After recoding all accident-related characteristics and setting up a binary accident database, the next step in data preparation foresees the assignment of each binary variable to one of the following categories: driver-related variables (54 variables), vehicle-related variables (32 variables), roadway-related variables (50 variables), and situation-related variables (22 variables). Table 1 illustrates the categorisation scheme for the 158 analysed accident-related variables.
We aim to quantify each accident-related variable's impact on the degree of injury. Therefore, the dependent variable shall combine severe injury and fatalities within the category severe casualties. Regarding the Austrian Road Safety Strategy 2021-2030 [31], it is equally important to reduce fatalities and the number of severe injuries. Also, both categories (severe and fatal accidents) entail high economic costs and human suffering. These premises lead to the following classification of the degree of injury:
- Casualties: minor injury, severe injury, death at accident site, death within 30 days,
- Severe casualties: severe injury, death at accident site, death within 30 days.
Thus, the degree of injury comprises two categories within this study. The resulting dependent variable is severe casualties. This classification corresponds to the definition within the Handbook Of Transportation System Planning [32, p.73].
2.3. Descriptive Analyses
Initial analyses include calculating conditional and joint probabilities, applying Fisher's exact test, and estimating the Phi coefficient for each accident-related variable in relation to severe casualties, treating severe casualties as the dependent variable. A bootstrap resampling method is used for robust parameter estimation, and a maximum combination value () is calculated as a key indicator for detection. This value indicates how often a specific variable co-occurs with one or more accident-related variables. Each accident-related variable is broken down into a contingency table, where the rows represent the accident variable, and the columns represent the outcomes: casualty and severe casualty. The frequency in the table represents the number of occurrences where the accident variable takes the value and the outcome is either casualty or severe casualty, with severe casualty being treated as the dependent variable. The conditional probability of an event given another event is denoted as :
Here, is the joint probability of and , and P is the probability of . In the context of this analysis, represents a specific accident variable, and represents the outcome severe casualties. Fisher's Exact Test calculates the exact probability of observing the distribution in the contingency table. This is particularly useful for small sample sizes or when examining the relationship between an accident variable and severe casualties. The Phi coefficient is a measure of association between each accident-related variable and the outcome severe casualties. The probability of observing this particular table is calculated using the hypergeometric distribution:
where:
is the binomial coefficient, calculated as ,
is the binomial coefficient for the second row,
is the binomial coefficient for the total table, where .
As a next step, we apply Bootstrap resampling to estimate robust confidence intervals for the parameters. The 95 % confidence intervals indicate that certain variables consistently contribute to severe accidents, reinforcing the findings from the Fisher's test. As a first step towards pattern recognition, we want to identify the , which tells us how often a specific variable co-occurs with one or more accident-related variables. Let be a dataset with entries. Each entry consists of a set of binary variables where each can be either 0 or 1. The goal is to find the combination of variables that maximizes the occurrence of a specific outcome, , which could be severe accidents, for instance. To define the combination of variables that includes , let be a combination of with other variables, where are selected from the full set . The frequency of each combination is defined as the number of entries , where all variables in take the value 1.
where the indicator is defined as:
The is the combination that includes and maximises the frequency in relation to a specific outcome
The approach involves searching through all possible combinations that include the specific variable , calculating the frequency with which these combinations occur when a specific outcome is observed, and identifying the combination with the highest frequency. The method analyses how frequently a particular variable occurs in combination with one or more other variables, identifying the most common combination in which the variable appears.
2.4. Binomial Logistic Regression
The study employs several pattern recognition methods. To investigate to what extent accident-related variable affects the probability of severe casualties, we apply binomial logistic regression, with severe casualties as the dependent variable. The logistic regression model is crucial for understanding how different accident-related variables, such as speeding, alcohol use, or road conditions, contribute to the probability of severe casualties. By examining these relationships, the model helps identify key factors that increase the risk of severe accidents.
where:
is the probability of the outcome being severe casualty,
is the probability of the outcome being a non-severe casualty,
is the log-odds of the outcome occurring (severe casualties),
is the intercept term, representing the log-odds of severe casualties when all predictors are zero,
are coefficients associated with each accident-related predictor variable, . These coefficients indicate the strength and direction of the relationship between each variable and the likelihood of severe casualties.
2.5. PATTERMAX-Method
The developed PATTERMAX-method analyses the frequencies of variable combinations ( and examines their association strength with severe casualties. The dataset consists of entries, where each entry is a sequence of binary variables (0s and 1s). We aim to calculate the frequency of each , i.e., each identical sequence of 0s and 1s of length in the dataset . We define the of length as a string of binary variables, where , with being either 0 or 1. To calculate the frequency of in the dataset , we use the PATTERMAX-method, which proceeds as follows:
where:
is the number of entries in the dataset ,
is the number of binary variables in each entry,
represents the i-th entry in the dataset ,
is the position in the entry where the is checked,
is an indicator function that returns 1 if the substring exactly matches from position to , and 0 otherwise.
This formula describes the PATTERMAX-method for calculating the frequency of the in the dataset . To verify if the matches at a specific position, we iterate over each entry in the dataset, over all positions in the entry, and use the indicator function. The sum over all entries and positions returns the total frequency of in . After identifying using the PATTERMAX-method, each generated is further examined using Fisher's Exact Test to determine the -value that quantifies the strength of the association between the and severe casualties. represents the -value obtained from Fisher's Exact Test for . This step ensures that the identified are not only frequent but also statistically significant in their relationship to severe accidents.
2.6. Blackpattern Impact Analysis
To calculate a blackpattern impact score (), we combine four components: frequency of the , the statistical association between the and severe causalities (measured by , the strength of this association (measured by the Phi coefficient ), and the logistic regression coefficients corresponding to the variables in . These components are integrated into a comprehensive to prioritize the identified . This approach enables a precise assessment of the concerning severe accidents by considering both their frequency and the strength of their association with severe casualties, thereby identifying that are both frequent and impactful.
where:
represents the logistic regression coefficient for each variable in the ,
is the frequency of the ,
is the Phi coefficient, which measures the strength of the association between the and the outcome,
is the -value from Fisher’s Exact Test, indicating the statistical significance of the association between the and the outcome.
To amplify the influence of highly significant (with very small -values), the negative logarithm of is used. The transformation converts very small -values into larger positive numbers. This ensures that with strong statistical significance have a greater impact on the. Both the logistic regression coefficients and the Phi coefficient represent the strength of association. Small coefficients or -values might otherwise have a minimal effect on the . The exponential transformation and magnifies these values, particularly when they are small. This emphasizes the contribution of where the variables have a stronger association with the outcome.
The blackpattern impact analysis allows to identify that are not only common and impactful but also statistically significant in their relationship with severe casualties. This approach provides a comprehensive and nuanced prioritization of , ensuring that our analysis highlights the most relevant and meaningful for further investigation or intervention. Table 2 illustrates the features of the blackpattern impact analysis that must be considered when interpreting the retrieved .
3. Results
3.1. Descriptive Analyses
Descriptive statistics reveal the frequency and probability of each variable in severe and fatal accidents. Significant relationships between variables and accident severity are identified using Fisher's exact test and the Phi coefficient. Also, we generate the presented . We conduct descriptive analyses for each variable within our defined categories (driver, vehicle, roadway, and situation). Table 3 illustrates the results for driver-related accident variables in Austria.
The driver-related outcomes reveal that male drivers are significantly more likely to be involved in severe accidents compared to female drivers, with a probability of 12,11 % versus 4,79 %, respectively. Age also plays a crucial role, with younger drivers aged 19 to 24 and older drivers aged 64 and above showing a higher likelihood of being involved in severe accidents. The analysis indicates that the absence of a driving license and probationary driving licenses are associated with increased accident severity, although their impact is relatively lower compared to other factors. Impairment due to alcohol, distraction, and fatigue are highlighted as significant contributors to severe accidents, but among these, fatigue shows a particularly strong correlation. The table also underscores the critical impact of not wearing a seatbelt, which is strongly associated with severe casualties, as evidenced by the highest Phi coefficient in the analysis. Various driving manoeuvres, such as skidding, hitting a tree, and sudden braking, also exhibit significant relationships with accident severity, with some manoeuvres like hitting a tree being particularly indicative of severe outcomes. The suggests that certain variables, like the absence of a seatbelt, tend to co-occur with other risk factors more frequently in severe accidents, further emphasizing their role in contributing to accident severity.
Table 4 presents a comprehensive analysis of vehicle-related variables and their association with the severity of accidents. Engine power is a notable factor, with vehicles having higher engine power (over 110 kW) showing a higher probability of severe casualties, as indicated by the Phi coefficient of 0,053 and a significant -value of 0,000. This suggests that vehicles with greater engine power are more likely to be involved in severe accidents. In contrast, vehicles with lower engine power (24-90 kW) demonstrate a negative correlation with accident severity, as reflected by a negative Phi coefficient (-0,066). Vehicle colours appear to play a neglectable role as the correlations are weak and not statistically significant. The table also highlights the impact of vehicle safety features on accident outcomes. Cases where the airbag did not deploy are strongly associated with severe casualties, as evidenced by a Phi coefficient of -0,149, making it one of the most critical factors in the analysis. Other variables, such as technical defects and insufficient vehicle security, are less prevalent but still present some level of risk, particularly vehicle fires, which have a Phi coefficient of 0,035.
Table 5 provides a detailed analysis of roadway-related variables and their impact on the severity of single-vehicle accidents that took place outside built-up areas in Austria between 2012 and 2019.
One of the most significant findings is the relationship between speed limits and accident severity. Accidents occurring in areas with a 100 km/h speed limit show a higher probability of severe casualties, with a Phi coefficient of 0,019 and a significant-value of 0,008, indicating a moderate positive correlation. Similarly, roads with a 130 km/h speed limit also show a notable frequency of severe accidents, although the correlation is slightly weaker. The type of road is another critical factor, with accidents on country roads being particularly severe, as these roads account for the highest number of severe casualties, although the Phi coefficient suggests only a weak correlation. Additionally, certain road characteristics, such as curves and straight roads, are strongly associated with severe accidents. Curves, in particular, have a significant negative Phi coefficient (-0,042), indicating a strong correlation with accident severity. In contrast, straight roads, despite their higher overall accident frequency, show a positive Phi coefficient (0,040), suggesting that while they are common sites for accidents, the severity is more strongly associated with other variables like speed or road conditions. The analysis also reveals that road conditions significantly impact accident severity, with dry roads being the most common setting for severe accidents, supported by a high Phi coefficient (0,095). However, wet and wintry conditions also play a significant role, as indicated by negative Phi coefficients, showing that these conditions are associated with less severe outcomes compared to dry conditions.
Table 6 provides an analysis of situation-related variables and their impact on the severity of single-vehicle accidents. The analysis highlights several critical situation-related factors that influence the severity of single-vehicle accidents. Time of day emerges as a significant variable, with accidents occurring between 12 a.m. and 6 a.m. showing a higher probability of severe casualties, indicated by a Phi coefficient of 0,051 and a significant -value of 0,000. This suggests that early morning hours are particularly dangerous, likely due to factors such as reduced visibility, fatigue, or lower traffic volumes leading to higher speeds. In contrast, the period from 12 p.m. to 6 p.m., although still significant, shows a negative correlation with accident severity, indicating fewer severe outcomes during daylight hours. The day of the week also plays a role, with accidents from Monday to Thursday slightly more likely to result in severe casualties compared to those occurring from Friday to Sunday. However, the correlation is weak, as reflected by the small Phi coefficient (-0,025). Seasonal variation is evident, with summer showing a slightly higher likelihood of severe accidents, as suggested by a Phi coefficient of 0,025. This could be attributed to increased travel and higher speeds during warmer weather. Winter, on the other hand, despite the challenging driving conditions, shows a negative correlation with severe outcomes, which may be due to more cautious driving during adverse weather conditions. Weather conditions have a notable impact, with clear or overcast weather being strongly associated with severe casualties, as indicated by a Phi coefficient of 0,053. This finding may be counterintuitive, but it suggests that drivers might be less cautious during clear conditions, leading to higher speeds and more severe accidents. Snowy conditions, however, show a significant negative correlation with severe casualties, likely reflecting more careful driving in such conditions. Light conditions further influence accident severity, with darkness being associated with a higher likelihood of severe accidents, as shown by a Phi coefficient of 0,044. This is consistent with the increased risks associated with driving at night, such as reduced visibility and driver fatigue.
3.2. Logistic Regression Analysis
Binomial logistic regression shows the strength of relationships between accident-related variables and severe accidents, identifying high-risk variables with significant odds ratios. The logistic regression analysis in Table 7 reveals several key variables that significantly increase the likelihood of severe . One of the most influential factors is the non-use of a safety belt, which has the highest odds ratio ( = 5,015) among the variables analysed, indicating that drivers not wearing a seatbelt are over five times more likely to be involved in a severe accident. Other critical factors include young drivers, particularly those aged 16 to 18, who have an odds ratio of 2,317, and those aged 19 to 24, with an odds ratio of 2,101, reflecting a significantly higher risk for these age groups.
Environmental and situational factors also play a substantial role. Driving during early morning hours (12 a.m. to 6 a.m.) increases the likelihood of severe accidents by 35,9 % ( = 1,359), likely due to factors such as fatigue and reduced visibility. Road conditions, such as driving on a wet road or under wintry conditions, also contribute to higher accident severity, with odds ratios of 1,261 and 1,462, respectively. The presence of specific road features like curves, intersections, and tunnels significantly increases the risk, with tunnels showing an odds ratio of 1,674 and curves 1,198, indicating these features are critical risk factors.
Vehicle-related factors also influence the severity of accidents. Vehicles with engine power between 24-90 kW show a 19,2 % higher likelihood of severe accidents, while certain actions like sudden braking or hitting an obstacle on the road increase the risk significantly, with odds ratios of 2,0 and 3,394, respectively. Interestingly, hitting a guard rail is associated with a lower likelihood of severe accidents, with an odds ratio of 0,731, suggesting that this might serve as a mitigating factor under certain conditions.
The analysis also highlights the significant impact of alcohol, which nearly doubles the likelihood of severe accidents ( = 1,916), underscoring the critical danger posed by impaired driving. Additionally, vehicle-related variables like the colour green and the absence of airbag deployment are associated with higher risks, with odds ratios of 1,317 and 2,233, respectively.
When performing multiple logistic regression, some variables may be excluded from the final model, resulting in no regression coefficient being assigned to them. This exclusion occurs because the statistical model deems these variables to have an insignificant or non-contributory effect on the outcome, often due to multicollinearity, lack of variability, or because their contribution is already captured by other variables in the model.
3.3. PATTERMAX-Method
The PATTERMAX-method reveals critical in the data, indicating combinations of factors that significantly contribute to severe accidents (Table 8). One of the most prominent identified is the combination of a 130 km/h speed limit, driving on a highway, drifting to the right, and being a male driver. This is statistically significant with a -value of 0,001 and a Phi coefficient of 0,027, occurring 44 times in the dataset. This suggests that this specific combination of factors is strongly associated with severe accidents. Another significant involves a 100 km/h speed limit on a country road, with left drift and male drivers, showing an even stronger correlation with severe casualties ( = 0,000, = 0,032) and a frequency of 41 occurrences. This underscores the heightened risk associated with country roads, particularly when combined with drifting and male drivers. Additional include scenarios where male drivers on country roads, particularly under conditions of fatigue or without wearing a safety belt, show a strong association with severe accidents. For example, the combination of a 100 km/h speed limit, left drift, male driver, and no safety belt applied is highly significant ( = 0,000, = 0,031), though it occurs less frequently, with 10 recorded instances. This indicates that although less common, this particular combination of factors leads to particularly severe outcomes. Other highlight the risk posed by wet roads and darkness. A involving a 100 km/h speed limit on a country road, a wet road surface, a male driver aged 25-34, and a right drift shows a strong association with severe accidents (= 0,001= 0,027). Similarly, driving in darkness on country roads with right drift and male drivers also presents a significant risk ( = 0,003, = 0,026).
3.4. Blackpattern Impact Analysis
The blackpattern impact analysis results in Table 9 highlight the varying influence of different combinations of variables on the likelihood of severe , with the providing a quantitative measure of their overall effect. In cases where a generated by the PATTERMAX-method includes variables without a regression coefficient, we assign a value of zero to these variables. By setting the coefficient to zero, we ensure that the variable neither positively nor negatively influences the , reflecting the fact that the variable does not significantly impact the likelihood of severe outcomes according to our logistic regression model.
The with the highest involves a 100 km/h speed limit on a country road, left drift, male driver, and the absence of a safety belt, which has a significant of 982,9. This high reflects the strong influence of not wearing a seatbelt, which substantially increases the likelihood of severe accidents, as indicated by the high regression coefficient ( = 1,612).
The combination of a 100 km/h speed limit, country road, and male driver, whether drifting left or right, consistently yields high (e.g., 804,7 and 167,6), indicating that these factors together significantly elevate the risk of severe accidents.
A speed limit of 130 km/h on a highway with right drift and male driver results in a relatively high of 628,4 which still presents a notable risk. This highlights that while speed and road type are important, the absence of additional high-risk behaviours like seatbelt non-use somewhat mitigates the overall risk.
involving female drivers or those with a speed limit of 80 km/h on a country road with right drift show even lower (e.g., 50,1 and 38,3), reflecting the reduced likelihood of severe outcomes compared to more dangerous combinations. This suggests that gender and lower speed limits contribute to safer outcomes, although they are not completely devoid of risk. The also underscores the combined risk posed by fatigue and specific road conditions (e.g., 167,6 and 37,1).
4. Discussion
The findings from this study underscore the complex and multivariate nature of , particularly single-vehicle, single-occupant accidents outside built-up areas in Austria. By applying statistical methods, such as binomial logistic regression and the PATTERMAX-method, we have identified significant that consistently correlate with severe casualties. These reveal critical insights into how specific combinations of driver-related, vehicle-related, roadway-related, and situational factors contribute to the severity of accidents.
One of the key observations from the logistic regression analysis is the substantial impact of not wearing a safety belt, which emerged as the most influential variable, increasing the likelihood of severe accidents by over five times. This finding aligns with existing literature that highlights the protective benefits of seatbelt usage, particularly in preventing severe injuries and fatalities. Similarly, the significant influence of young drivers, especially those aged 16 to 24, on accident severity suggests that targeted interventions, such as stricter licensing regulations and enhanced driver education programs, could be crucial in mitigating risks within this demographic.
The PATTERMAX-method further refines our understanding by identifying specific combinations of variables that, when occurring together, significantly increase the likelihood of severe outcomes. For example, involving high-speed limits, rural roadways, and male drivers frequently result in severe accidents, especially when compounded by factors like driver fatigue or adverse weather conditions. These provide valuable guidance for policymakers and road safety experts, emphasizing the need for comprehensive approaches that address multiple risk factors simultaneously.
The blackpattern impact analysis introduces a novel way of quantifying the combined effect of these variables, offering a clear prioritization of the most dangerous combinations. This approach is particularly useful for designing targeted interventions that can address the most critical risks. For instance, the combination of a 100 km/h speed limit, a country road, left drift, and a male driver not wearing a safety belt was identified as having the highest , making it a prime target for road safety campaigns and enforcement measures.
5. Conclusions
This study successfully identifies and quantifies the most significant associated with severe , providing a deeper understanding of the multicausal interactions that lead to these outcomes. The combination of pattern recognition methods, such as binomial logistic regression and the PATTERMAX-method, with a robust statistical evaluation framework, offers a comprehensive toolset for analysing data. These findings highlight the importance of addressing specific high-risk combinations of variables through targeted road safety interventions.
Future research should expand the scope of this analysis to include other types of accidents and integrate additional data sources, such as behavioural and environmental data, to develop more comprehensive accident prediction models. By doing so, we can further refine our understanding of the factors contributing to severe accidents and enhance the effectiveness of prevention strategies. The insights gained from this study provide a solid foundation for improving road safety and reducing the human and economic costs associated with severe .
Author Contributions
Conceptualization, T.F.; methodology, T.F.; validation, T.F. and G.H.; formal analysis, T.F.; investigation, T.F.; data curation, T.F.; writing—original draft preparation, T.F.; writing—review and editing, T.F. and G.H.; visualization, T.F.; supervision, G.H. All authors have read and agreed to the published version of the manuscript.
Funding
This research received no external funding.
Institutional Review Board Statement
Not applicable.
Informed Consent Statement
Not applicable.
Conflicts of Interest
The authors declare no conflicts of interest.
References
- Herry Conuslt, & KFV. (2022). Unfallkostenrechnung Straße 2022 (UKR 2022). Forschungsarbeiten des österreichischen Verkehrssicherheitsfonds, Wien: Bundesministerium für Klimaschutz, Umwelt, Energie, Mobilität, Innovation und Technologie (BMK).
- European Commission. (2020). Handbook on the external costs of transport. Version 2019 – 1.1, CE Delft, Directorate-General for Mobility and Transport.
- European Commission. (2019, December 18). Archive: Road safety statistics - characteristics at national and regional level. Retrieved August 8, 2021, from https://ec.europa.eu/eurostat/statistics-explained/index.php?title=Road_safety_statistics__characteristics_at_national_and_regional_level&oldid=463733.
- Bundesministerium für Inneres (BMI) I. (2020). Straßenverkehrstote in Österreich. Retrieved July 7, 2021, from bmi.gv.at: https://www.bmi.gv.at/202/Verkehrsangelegenheiten/files/Jahresvergleich_1983_2020.pdf.
- Fian, T. (2021). From Blackspots to Blackpatterns: Pattern recognition with road traffic accident data. Dissertation. [CrossRef]
- Gutierrez-Osorio, C., & Pedraza, C.A. (2020). Modern data sources and techniques for analysis and forecast of road accidents: A review. Journal of Traffic and Transportation Engineering, 7, 432-446. [CrossRef]
- Kizito, A., & Semwanga, A.R. (2020). Modeling the Complexity of Road Accidents Prevention: A System Dynamics Approach. International Journal of System Dynamics Applications, 9, 24-41. [CrossRef]
- Martins, M.A., & Garcez, T.V. (2021). A multidimensional and multi-period analysis of safety on roads. Accident analysis and prevention, 162, 106401. [CrossRef]
- Khalsa, A. (2019). Study on Road Traffic Accidents and Prevention in India. A Review. International Journal for Research in Applied Science and Engineering Technology. [CrossRef]
- Karamanlis, I., Nikiforiadis, A., Botzoris, G.N., Kokkalis, A., & Basbas, S. (2023). Towards Sustainable Transportation: The Role of Black Spot Analysis in Improving Road Safety. Sustainability. [CrossRef]
- Reeves, K., Chandan, J.S., & Bandyopadhyay, S. (2019). Using statistical modelling to analyze risk factors for severe and fatal road traffic accidents. International Journal of Injury Control and Safety Promotion, 26, 364 - 371. [CrossRef]
- Gu, C., Xu, J., Gao, C., Mu, M., E., G., & Ma, Y. (2022). Multivariate analysis of roadway multi-fatality crashes using association rules mining and rules graph structures: A case study in China. PLOS ONE, 17. [CrossRef]
- Pande, A., & Abdel-Aty, M.A. (2009). A novel approach for analyzing severe crash patterns on multilane highways. Accident analysis and prevention, 41 5, 985-94. [CrossRef]
- Alin, D., Cofarue, C., & Popesku, M.V. (2023). Investigation of Single Vehicle Accidents Severity by Using a Probabilistic Approach. Mobility and Vehicle Mechanics. [CrossRef]
- Cioca, L., & Ivașcu, L. (2017). Risk Indicators and Road Accident Analysis for the Period 2012–2016. Sustainability, 9, 1530. [CrossRef]
- Shibani, A., & Pervin, M.S. (2016). Analysis of traffic accident severity on Great Britain roadways and junctions. Engineering, Environmental Science, Geography. [CrossRef]
- Ju, Y.H., & Sohn, S.Y. (2011). Quantification method analysis of the relationship between occupant injury and environmental factors in traffic accidents. Accident analysis and prevention, 43 1, 342-51. [CrossRef]
- Yaman, T.T., Bilgiç, E., & Esen, M.F. (2020). Analysis of Traffic Accidents to Identify Factors Affecting Injury Severity with Fuzzy and Crisp Techniques. [CrossRef]
- Yaman, T.T., Bilgiç, E., & Esen, M.F. (2021). Analysis of traffic accidents with fuzzy and crisp data mining techniques to identify factors affecting injury severity. J. Intell. Fuzzy Syst., 42, 575-592. [CrossRef]
- Shaon, M.R., & Qin, X. (2020). Crash Data-Based Investigation into How Injury Severity Is Affected by Driver Errors. Transportation Research Record, 2674, 452 - 464. [CrossRef]
- Gilani, V., Hosseinian, S.M., Ghasedi, M., & Nikookar, M. (2021). Data-Driven Urban Traffic Accident Analysis and Prediction Using Logit and Machine Learning-Based Pattern Recognition Models. Mathematical Problems in Engineering, 2021, 1-11. [CrossRef]
- Sohn, S.Y., & Shin, H. (2001). Pattern recognition for road traffic accident severity in Korea. Ergonomics, 44, 107 - 117. [CrossRef]
- Khyara, H., Amine, A., & Nassih, B. (2023). Dependent and Independent Variables for Exploratory Analysis of Road Traffic Accidents. Proceedings of the International Conference on Industrial Engineering and Operations Management. [CrossRef]
- Athiappan, K., Karthik, C., Rajalaskshmi, M., Subrata, C., Rabiei-Dastjerdi, H., Liu, Y., Fernández-Campusano, C., & Gheisari, M. (2022). Identifying Influencing Factors of Road Accidents in Emerging Road Accident Blackspots. Advances in Civil Engineering. [CrossRef]
- Theofilatos, A., & Yannis, G. (2014). A review of the effect of traffic and weather characteristics on road safety. Accident analysis and prevention, 72, 244-56. [CrossRef]
- Aziz, S., & Ram, S. (2022). A Meta-analysis of the methodologies practiced worldwide for the identification of Road Accident Black Spots. Transportation Research Procedia. [CrossRef]
- Khorasani-Zavareh, D. (2011). System versus traditional approach in road traffic injury prevention: a call for action. Journal of Injury and Violence Research, 3, 61 - 61. [CrossRef]
- Rezapur-Shahkolai, F., Afshari, M., Doosti-Irani, A., Bashirian, S., & Maleki, S. (2022). Interventions to prevent road traffic injuries among pedestrians: a systematic review. International Journal of Injury Control and Safety Promotion, 29, 533 - 549. [CrossRef]
- Staton, C.A., Vissoci, J.R., Gong, E., Toomey, N., Wafula, R.B., Abdelgadir, J., Zhou, Y., Liu, C., Pei, F., Zick, B., Ratliff, C.D., Rotich, C., Jadue, N., de Andrade, L., von Isenburg, M., & Hocker, M.B. (2016). Road Traffic Injury Prevention Initiatives: A Systematic Review and Metasummary of Effectiveness in Low and Middle Income Countries. PLoS ONE, 11. [CrossRef]
- Gopalakrishnan, S. (2012). A Public Health Perspective of Road Traffic Accidents. Journal of Family Medicine and Primary Care, 1, 144 - 150. [CrossRef]
- KFV, & FGM. (2021). Österreichische Verkehrssicherheitsstrategie 2021–2030. Wien: Bundesministerium für Klimaschutz.
- Cerwenka, P., Hauger, G., Hörl, B., & Klamer, M. (2007). Handbuch der Verkehrssystemplanung. Österreichischer Kunst- und Kulturverlag, Wien.
Figure 1.
Development of road traffic accidents (RTAs) in Austria from 2012-2019. Own compilation based on RTA data from Statistics Austria.
Figure 1.
Development of road traffic accidents (RTAs) in Austria from 2012-2019. Own compilation based on RTA data from Statistics Austria.
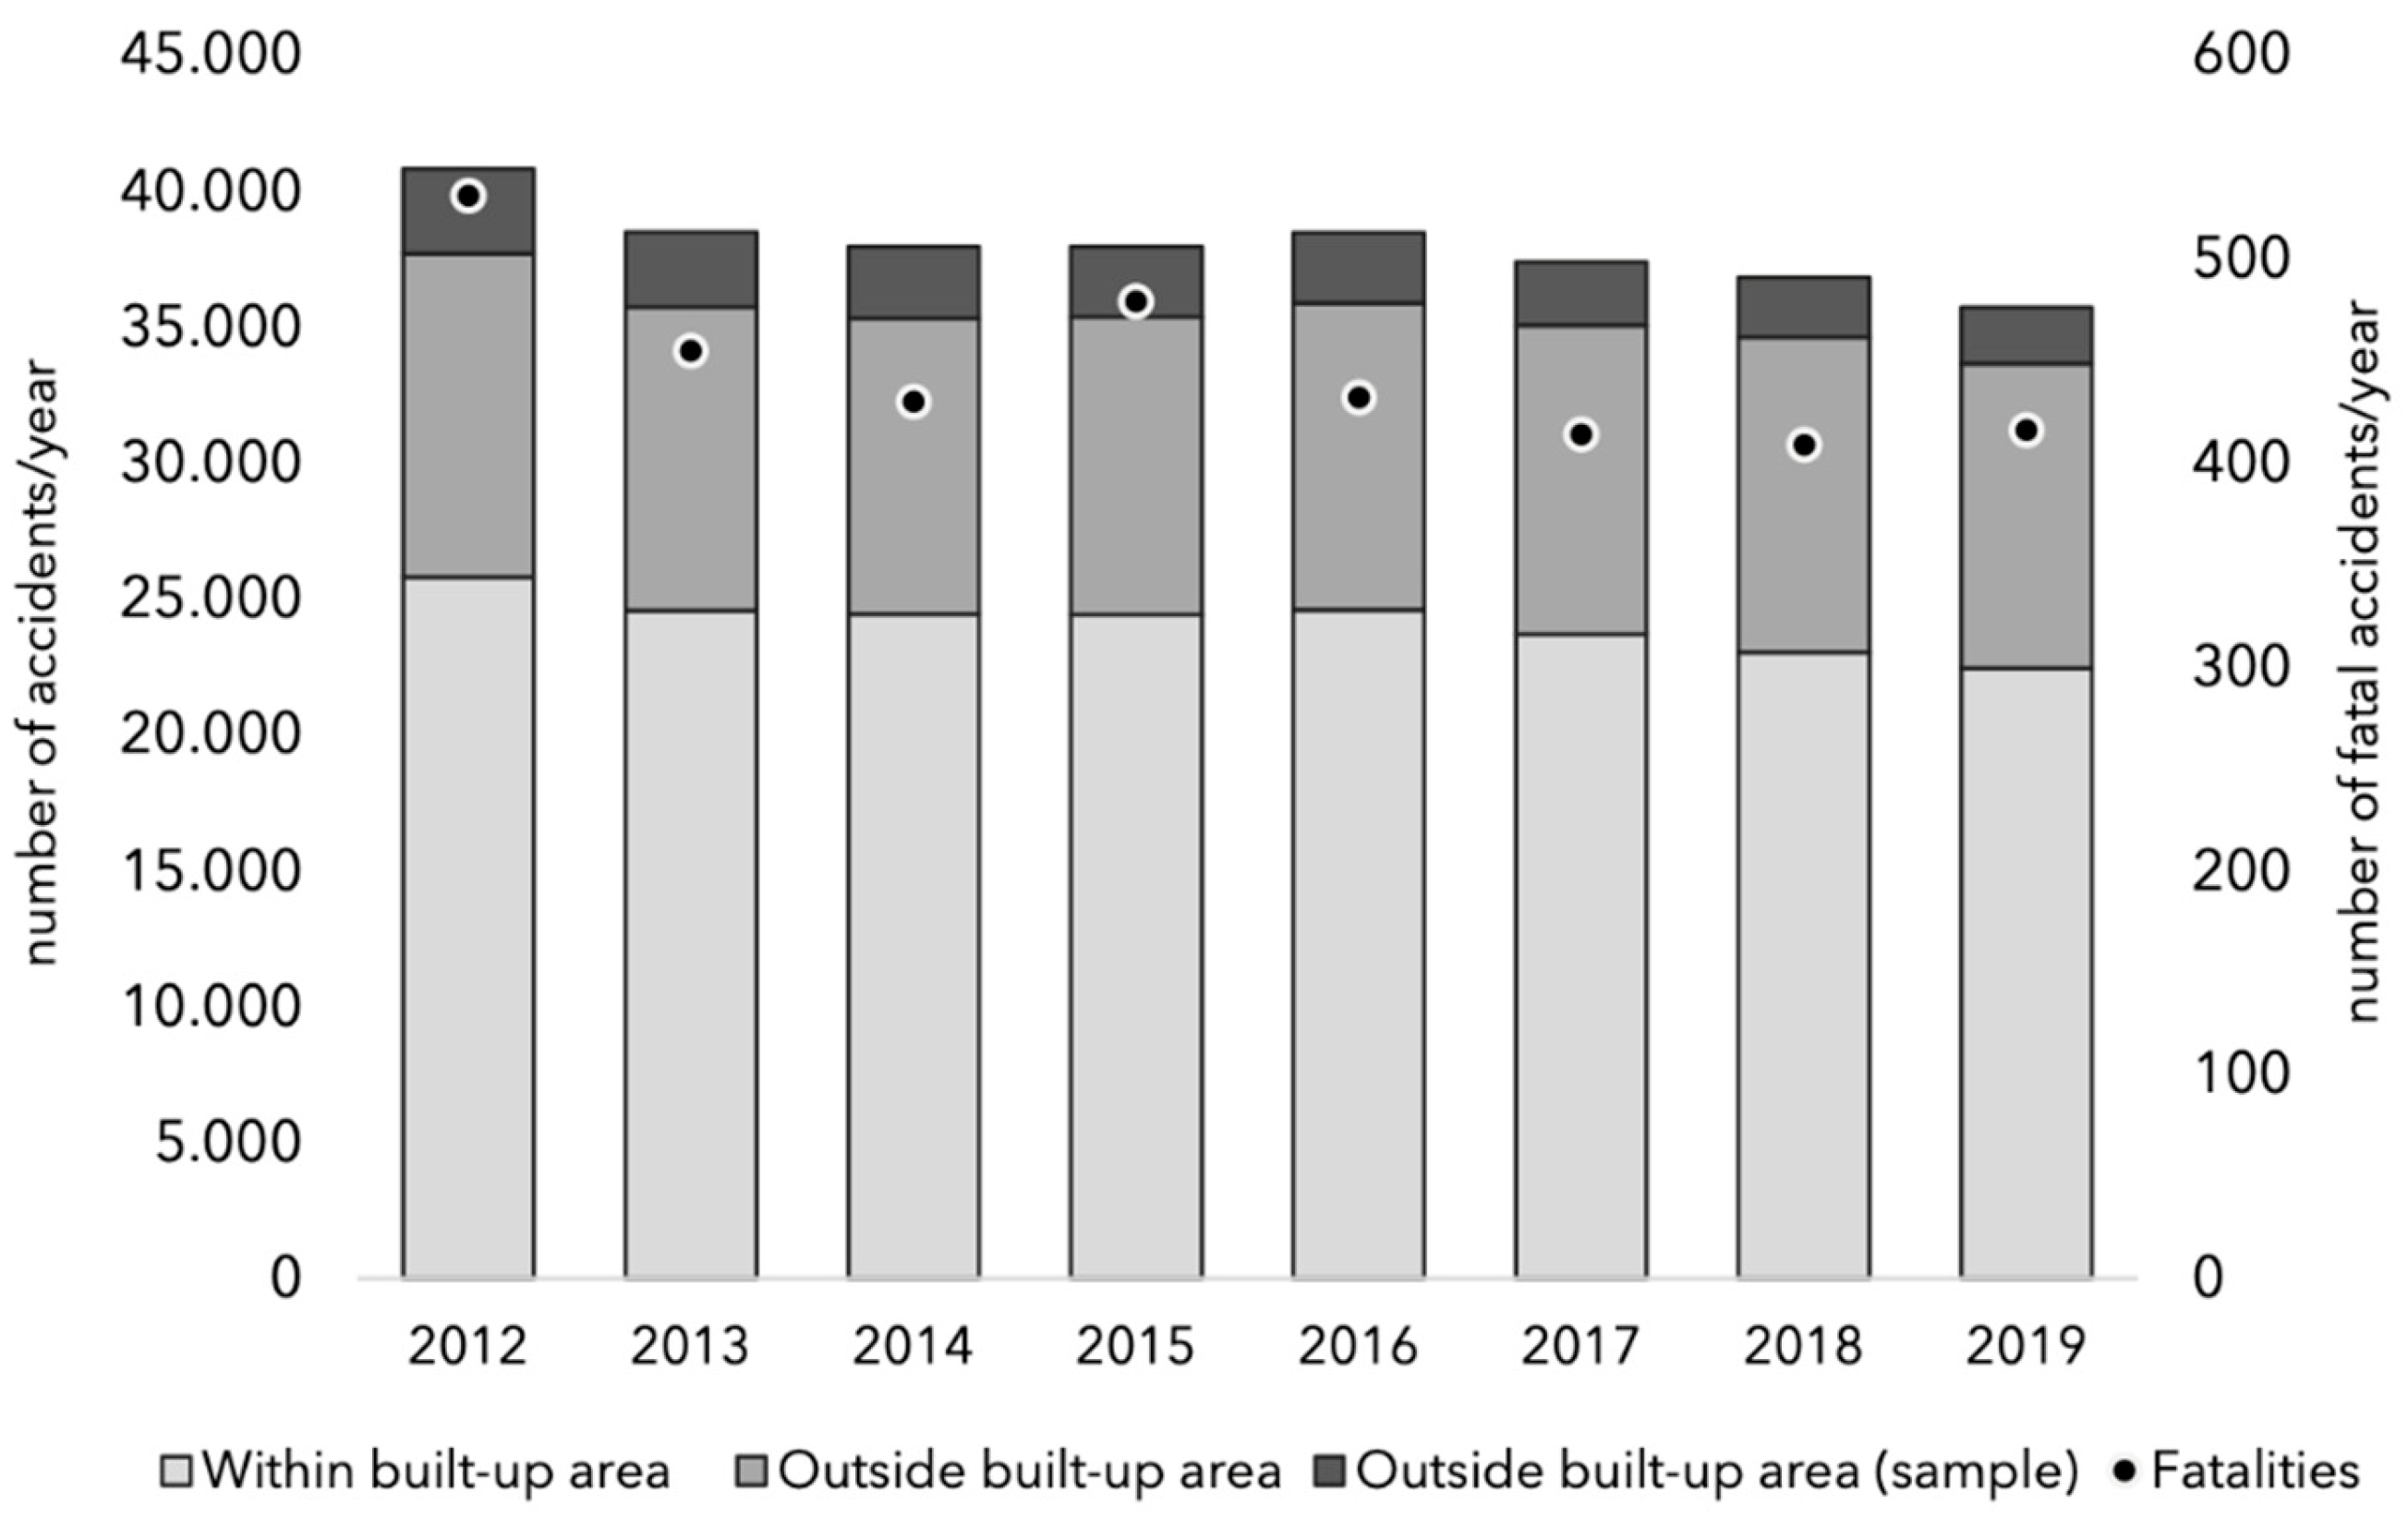

Table 1.
Categorisation scheme for accident-related variables.
| Driver | Vehicle | Roadway | Situation |
|---|---|---|---|
|
|
|
|
Table 2.
Features of the blackpattern impact score (BIS).
| BIS Features | Description |
|---|---|
| High Frequency | Blackpatterns that occur frequently in the dataset are prioritized. |
| High Impact | Blackpatterns with variables that have a strong influence on severe casualties are emphasized. |
| Strong Association | Blackpatterns that are statistically significant in their association with severe casualties are given higher priority. |
Table 3.
Single-vehicle accidents with single occupation and personal injury that occurred outside built-up areas between 2012 and 2019 in Austria broken down by driver-related variables. n=20.293 (3.431 are severe casualties).
Table 3.
Single-vehicle accidents with single occupation and personal injury that occurred outside built-up areas between 2012 and 2019 in Austria broken down by driver-related variables. n=20.293 (3.431 are severe casualties).
| Variable | Casualties n |
Severe casualties n |
P (X ∩ SC) % |
Fisher's exact test p |
Phi Coefficient |
MCV n |
|
|---|---|---|---|---|---|---|---|
| Sex | Male | 11.576 | 2.458 | 12,11% | ,000 | ,133 | 817 |
| Female | 8.706 | 972 | 4,79% | ,000 | -,133 | 1.132 | |
| Unknown sex | 11 | 1 | - | - | - | - | |
| Age class | 16 to 18 | 1.465 | 162 | 0,80% | ,000 | -,044 | 171 |
| 19 to 24 | 6.547 | 806 | 3,97% | ,000 | -,085 | 1.132 | |
| 25 to 34 | 4.323 | 697 | 3,43% | ,120 | -,011 | 830 | |
| 35 to 44 | 2.488 | 468 | 2,31% | ,008 | ,019 | 432 | |
| 45 to 54 | 2.180 | 476 | 2,35% | ,000 | ,046 | 382 | |
| 55 to 64 | 1.404 | 323 | 1,59% | ,000 | ,044 | 212 | |
| 64 and higher | 1.878 | 499 | 2,46% | ,000 | ,082 | 303 | |
| unknown age class | 8 | - | - | - | - | - | |
| *DL | No driving licence | 356 | 94 | 0,46% | ,020 | ,034 | 15 |
| Probationary driving licence | 2.805 | 303 | 1,49% | ,000 | -,065 | 391 | |
| Impairment | Alcohol | 2.858 | 481 | 2,37% | ,934 | -,001 | 246 |
| Distraction | 2.369 | 431 | 2,12% | ,079 | ,012 | 93 | |
| Fatigue | 1.518 | 317 | 1,56% | ,000 | ,030 | 134 | |
| Health | 432 | 91 | 0,45% | ,021 | ,016 | 38 | |
| Drugs | 66 | 15 | 0,07% | ,247 | ,009 | 3 | |
| Medicines | 50 | 10 | 0,05% | ,570 | ,004 | 2 | |
| Excitation | 7 | 2 | 0,01% | ,337 | ,006 | 1 | |
| Driving manoeuvres | Speeding | 3.608 | 579 | 2,85% | ,136 | -,011 | 131 |
| Skidding | 1.823 | 239 | 1,18% | ,000 | -.032 | 80 | |
| Hitting an obstacle next to road | 1.512 | 280 | 1,38% | ,086 | ,012 | 35 | |
| Hitting the guard rail | 1.378 | 181 | 0,89% | ,000 | -,027 | 37 | |
| Hitting a tree | 1.217 | 318 | 1,57% | ,000 | ,062 | 23 | |
| Misconduct by pedestrians | 503 | 79 | 0,39% | ,505 | -,005 | 12 | |
| Hit and run | 371 | 53 | 0,26% | ,186 | -,010 | 22 | |
| Sudden braking | 149 | 11 | 0,05% | ,002 | -.022 | 9 | |
| Overtaking | 147 | 26 | 0,13% | ,834 | ,002 | 8 | |
| Cutting curves | 128 | 27 | 0,13% | ,194 | ,009 | 4 | |
| Hitting an obstacle on the road | 117 | 6 | 0,03% | ,001 | -,024 | 7 | |
| Changing lanes | 58 | 9 | 0,04% | 1,000 | -,002 | 3 | |
| Inadequate safety distance | 38 | 7 | 0,03% | ,828 | ,002 | 1 | |
| Reverse driving | 26 | 6 | 0,03% | ,429 | ,006 | 2 | |
| Phoning | 25 | 7 | 0,03% | ,175 | ,010 | 1 | |
| Turning around | 22 | 4 | 0,02% | ,780 | ,001 | 3 | |
| Fall from the vehicle | 22 | 11 | 0,05% | ,000 | ,029 | 2 | |
| Getting in lane | 18 | 4 | 0,02% | ,529 | ,004 | 1 | |
| Disregarding driving direction | 16 | 2 | 0,01% | 1,000 | -,003 | 1 | |
| Priority violation | 15 | 4 | 0,02% | ,302 | ,007 | 1 | |
| Driving towards left-hand side of road | 9 | 3 | 0,01% | ,184 | ,009 | 1 | |
| Forbidden overtaking | 8 | 2 | 0,01% | ,630 | ,004 | 1 | |
| Hitting a moving vehicle | 8 | 0 | 0,00% | ,367 | -,009 | 2 | |
| Disregarding driving ban | 5 | 2 | 0,01% | ,201 | ,010 | 1 | |
| Driving in parallel | 5 | 1 | 0,00% | 1,000 | ,604 | 1 | |
| Opening the vehicle door | 5 | 2 | 0,01% | ,201 | ,010 | 1 | |
| Hitting a stationary vehicle | 3 | 0 | 0,00% | 1,000 | -,005 | 1 | |
| Wrong-way driver | 1 | 0 | 0,00% | 1,000 | -,003 | 1 | |
| Disregarding red light | 1 | 0 | 0,00% | 1,000 | -,003 | 1 | |
| Dangerous stopping and parking | 0 | 0 | - | - | - | - | |
| Disregarding turning ban | 0 | 0 | - | - | - | - | |
| Missing indication of direction change | 0 | 0 | - | - | - | - | |
| Driving against one-way | 0 | 0 | - | - | - | - | |
| **ST | Driving without mandatory light | 0 | 0 | - | - | - | - |
| No safety belt applied | 1.401 | 699 | 3,44% | ,000 | ,240 | 60 |
*DL: Driving licence; **ST: Safety Settings.
Table 4.
Single-vehicle accidents with single occupation and personal injury that occurred outside built-up areas between 2012 and 2019 in Austria broken down by vehicle-related variables. n=20.293 (3.431 are severe casualties).
Table 4.
Single-vehicle accidents with single occupation and personal injury that occurred outside built-up areas between 2012 and 2019 in Austria broken down by vehicle-related variables. n=20.293 (3.431 are severe casualties).
| Variable | Casualties n |
Severe casualties n |
P (X ∩ SC) % |
Fisher's exact test p |
Phi Coefficient |
MCV n |
|
|---|---|---|---|---|---|---|---|
| Engine power (kW) | 0-24 kW | 11 | 3 | 0,01% | ,411 | ,006 | 2 |
| 24-90 kW | 15.412 | 2.393 | 11,79% | ,000 | -,066 | 975 | |
| 90-110 | 1.928 | 413 | 2,04% | ,000 | ,039 | 201 | |
| 110+ | 1.947 | 448 | 2,21% | ,000 | ,053 | 256 | |
| Kilometrage (km) |
0 to 15.000 | 156 | 24 | 0,12% | ,662 | -,004 | 13 |
| 15.000 to 75.000 | 605 | 89 | 0,44% | ,154 | -,010 | 51 | |
| 75.000 to 100.000 | 387 | 70 | 0,34% | ,541 | ,004 | 33 | |
| 100.000 to 150.000 | 663 | 104 | 0,51% | ,428 | -,006 | 44 | |
| 150.000 to 200.000 | 942 | 176 | 0,87% | ,141 | ,010 | 56 | |
| Vehicle colour |
Beige | 18 | 3 | 0,01% | 1,000 | ,000 | 5 |
| Blue | 3.166 | 478 | 2,36% | ,003 | -,021 | 868 | |
| Brown | 193 | 35 | 0,17% | ,637 | ,003 | 52 | |
| Bronze | 1 | 0 | 0,00% | 1,000 | -,003 | 1 | |
| Dark | 30 | 6 | 0,03% | ,626 | ,003 | 6 | |
| Yellow | 129 | 18 | 0,09% | ,408 | -,006 | 37 | |
| Gold | 18 | 3 | 0,01% | 1,000 | ,000 | 5 | |
| Grey | 2.702 | 462 | 2,28% | ,784 | ,002 | 770 | |
| Green | 1.219 | 262 | 1,29% | ,000 | ,031 | 281 | |
| Bright | 8 | 2 | 0,01% | ,630 | ,004 | 2 | |
| Orange | 130 | 24 | 0,12% | ,647 | ,003 | 41 | |
| Red | 2.272 | 381 | 1,88% | ,857 | -,001 | 602 | |
| Black | 3.981 | 652 | 3,21% | ,334 | -,007 | 958 | |
| Silver | 716 | 136 | 0,67% | ,127 | ,011 | 146 | |
| Purple | 49 | 8 | 0,04% | 1,000 | -,001 | 11 | |
| White | 1.907 | 323 | 1,59% | ,977 | ,000 | 497 | |
| Others | 1 | 1 | 0,00% | ,169 | ,016 | 1 | |
| Vehicle safety |
Insufficient vehicle security | 16 | 6 | 0,03% | ,040 | ,015 | 2 |
| Insufficient load securing | 6 | 0 | 0,00% | ,598 | -,008 | 1 | |
| Technical defects | 102 | 15 | 0,07% | ,682 | -,004 | 6 | |
| Vehicle fire | 18 | 11 | 0,05% | ,000 | ,035 | 1 | |
| Airbag not deployed | 8.138 | 819 | 4,04% | ,000 | -,149 | 975 |
Table 5.
Single-vehicle accidents with single occupation and personal injury that occurred outside built-up areas between 2012 and 2019 in Austria broken down by roadway-related variables. n=20.293 (3.431 are severe casualties).
Table 5.
Single-vehicle accidents with single occupation and personal injury that occurred outside built-up areas between 2012 and 2019 in Austria broken down by roadway-related variables. n=20.293 (3.431 are severe casualties).
| Variable | Casualties n |
Severe casualties n |
P (X ∩ SC) % |
Fisher's exact test p |
Phi Coefficient |
MCV n |
|
|---|---|---|---|---|---|---|---|
| Speed limit (km/h) |
Driving ban | 2.270 | 380 | 1,87% | ,833 | -,002 | 350 |
| 5 | 1 | 1 | 0,00% | ,169 | ,016 | 1 | |
| 10 | 1 | 0 | 0,00% | 1,000 | -,003 | 1 | |
| 20 | 2 | 0 | 0,00% | 1,000 | -,004 | 1 | |
| 30 | 173 | 33 | 0,16% | ,479 | ,005 | 13 | |
| 40 | 40 | 8 | 0,04% | ,533 | ,004 | 6 | |
| 50 | 505 | 71 | 0,35% | ,095 | -,012 | 56 | |
| 60 | 334 | 55 | 0,27% | ,877 | -,002 | 43 | |
| 70 | 1.421 | 218 | 1,07% | ,108 | -,011 | 321 | |
| 80 | 1.231 | 192 | 0,95% | ,225 | -,009 | 222 | |
| 90 | 3 | 0 | 0,00% | 1,000 | -,005 | 1 | |
| 100 | 12.292 | 2.148 | 10,58% | ,008 | ,019 | 2.232 | |
| 110 | 35 | 4 | 0,02% | ,502 | -,006 | 10 | |
| 120 | 2 | 0 | 0,00% | 1,000 | -,004 | 1 | |
| 130 | 1.983 | 321 | 1,58% | ,377 | -,006 | 488 | |
| Road type |
Highway | 2.593 | 417 | 2,05% | ,239 | -,008 | 488 |
| Expressway | 595 | 80 | 0,39% | ,024 | -,016 | 82 | |
| Country road | 14.457 | 2.416 | 11,91% | ,247 | -,008 | 2.232 | |
| Other roads | 2.220 | 463 | 2,28% | ,000 | ,037 | 248 | |
| Intersection | 439 | 62 | 0,31% | ,125 | -,011 | 62 | |
| Roundabout | 68 | 16 | 0,08% | ,146 | ,010 | 11 | |
| Road characteristics |
Deceleration lane | 10 | 2 | 0,01% | ,681 | ,002 | 1 |
| Acceleration lane | 3 | 1 | 0,00% | ,426 | ,005 | 1 | |
| One-way | 144 | 33 | 0,16% | ,054 | ,014 | 26 | |
| Construction site | 157 | 21 | 0,10% | ,286 | -,008 | 10 | |
| Cycle path | 4 | 0 | 0,00% | 1,000 | -,006 | 1 | |
| Crosswalk | 3 | 0 | 0,00% | 1,000 | -,006 | 1 | |
| Pedestrian and cycle path | 10 | 2 | 0,01% | ,681 | ,002 | 3 | |
| Parking lane | 7 | 0 | 0,00% | ,610 | -,008 | 1 | |
| Secondary lane | 5 | 1 | 0,00% | 1,000 | ,001 | 1 | |
| Hard shoulder | 45 | 9 | 0,04% | ,551 | ,004 | 7 | |
| Banquet | 123 | 22 | 0,11% | ,729 | ,002 | 22 | |
| Straight road | 11.507 | 2.095 | 10,32% | ,000 | ,040 | 2.232 | |
| Tunnel | 89 | 26 | 0,13% | ,004 | ,022 | 8 | |
| Gallery | 15 | 8 | 0,04% | ,001 | ,026 | 1 | |
| Rest area | 26 | 6 | 0,03% | ,429 | ,006 | 2 | |
| Traffic island | 81 | 18 | 0,09% | ,233 | ,009 | 4 | |
| Underpass | 32 | 7 | 0,03% | ,476 | ,005 | 3 | |
| Middle separation | 777 | 104 | 0,51% | ,008 | -,019 | 137 | |
| Bridge | 157 | 41 | 0,20% | ,003 | ,022 | 7 | |
| Curve | 8.399 | 1.264 | 6,23% | ,000 | -,042 | 1.437 | |
| Narrow lane | 30 | 8 | 0,04% | ,149 | ,010 | 3 | |
| Entry or exit | 57 | 17 | 0,08% | ,019 | ,018 | 5 | |
| Tram or bus station | 8 | 2 | 0,01% | ,630 | ,004 | 1 | |
| Road condition |
Dry road | 10.441 | 2.126 | 10,48% | ,000 | ,095 | 2.232 |
| Wet road | 5.705 | 872 | 4,30% | ,000 | -0,27 | 1.225 | |
| Sand or grit on the road | 297 | 48 | 0,24% | ,809 | -,002 | 56 | |
| Wintry conditions | 3.771 | 370 | 1,82% | ,000 | -,090 | 938 | |
| Other conditions (oil, soil) | 95 | 17 | 0,08% | ,796 | ,002 | 16 | |
| TL* | Traffic light in full operation | 29 | 2 | 0,01% | ,213 | -,010 | 4 |
*TL: Traffic lights.
Table 6.
Single-vehicle accidents with single occupation and personal injury that occurred outside built-up areas between 2012 and 2019 in Austria broken down by situation-related variables. n=20.293 (3.431 are severe casualties).
Table 6.
Single-vehicle accidents with single occupation and personal injury that occurred outside built-up areas between 2012 and 2019 in Austria broken down by situation-related variables. n=20.293 (3.431 are severe casualties).
| Variable |
Casualties n |
Severe casualties n |
P (X ∩ SC) % |
Fisher's exact test p |
Phi Coefficient |
MCV n |
|
|---|---|---|---|---|---|---|---|
| Time | 12 a.m. to 6 a.m. | 3.367 | 713 | 3,51% | ,000 | ,051 | 245 |
| 6 a.m. to 12 p.m. | 6.283 | 889 | 4,38% | ,000 | -,049 | 586 | |
| 12 p.m. to 6 p.m. | 5.915 | 956 | 4,71% | ,070 | -,013 | 578 | |
| 6 p.m. to 12 a.m. | 4.728 | 873 | 4,30% | ,001 | ,023 | 368 | |
| WD* | Mon to Thu | 11.131 | 1.788 | 8,81% | ,000 | -,025 | 586 |
| Fri to Sun | 9.162 | 1.643 | 8,10% | ,000 | ,025 | 430 | |
| Season | Spring | 4.279 | 774 | 3,81% | ,021 | ,016 | 435 |
| Summer | 4.821 | 896 | 4,42% | ,000 | ,025 | 578 | |
| Autumn | 4.802 | 885 | 4,36% | ,001 | ,023 | 394 | |
| Winter | 6.391 | 876 | 4,32% | ,000 | -0,58 | 586 | |
| Weather condition |
Clear or overcast weather | 15.541 | 2.797 | 13,78% | ,000 | ,053 | 586 |
| Rain | 3.013 | 458 | 2,26% | ,007 | -,019 | 110 | |
| Hail, freezing rain | 124 | 17 | 0,08% | ,398 | -,007 | 12 | |
| Snow | 1.913 | 175 | 0,86% | ,000 | -,067 | 147 | |
| Fog | 636 | 102 | 0,50% | ,588 | -,004 | 37 | |
| High wind | 377 | 52 | 0,26% | ,113 | -,011 | 17 | |
| Light condition |
Daylight | 11.546 | 1.790 | 8,82% | ,000 | -,043 | 586 |
| Dusk or dawn | 1.604 | 266 | 1,31% | ,753 | -,003 | 111 | |
| Darkness | 6.828 | 1.311 | 6,46% | ,000 | ,044 | 368 | |
| Artificial light | 571 | 93 | 0,46% | ,730 | -,003 | 15 | |
| Limited visibility | 7 | 0 | 0,00% | ,610 | -,008 | 1 | |
| Glare from the sun | 109 | 24 | 0,12% | ,156 | ,010 | 8 |
*WD: Weekday.
Table 7.
Logistic regression analysis results.
| Variable | Regression coefficient β | Standard error SEM | p | exp(β) |
|---|---|---|---|---|
| no safety belt applied | 1,612 | 0,062 | 0,000 | 5,015 |
| gallery | 1,522 | 0,589 | 0,010 | 4,583 |
| vehicle fire | 1,394 | 0,541 | 0,010 | 4,029 |
| hitting an obstacle on the road | 1,222 | 0,426 | 0,004 | 3,394 |
| age class 16 to 18 | 0,840 | 0,104 | 0,000 | 2,317 |
| airbag not deployed | 0,803 | 0,046 | 0,000 | 2,233 |
| bridge | 0,773 | 0,197 | 0,000 | 2,166 |
| age class 19 to 24 | 0,743 | 0,057 | 0,000 | 2,101 |
| sudden braking | 0,693 | 0,324 | 0,032 | 2,000 |
| alcohol | 0,650 | 0,062 | 0,000 | 1,916 |
| hit and run | 0,552 | 0,161 | 0,001 | 1,737 |
| tunnel | 0,515 | 0,258 | 0,046 | 1,674 |
| one-way | 0,507 | 0,219 | 0,020 | 1,660 |
| age class 25 to 34 | 0,492 | 0,057 | 0,000 | 1,635 |
| male driver | 0,491 | 0,045 | 0,000 | 1,634 |
| intersection | 0,450 | 0,148 | 0,002 | 1,569 |
| other road | 0,397 | 0,082 | 0,000 | 1,487 |
| wintry conditions | 0,380 | 0,070 | 0,000 | 1,462 |
| hitting a tree | 0,365 | 0,075 | 0,000 | 1,441 |
| age class 35 to 44 | 0,308 | 0,065 | 0,000 | 1,361 |
| 0 a.m. to 6 a.m. | 0,307 | 0,058 | 0,000 | 1,359 |
| vehicle colour: green | 0,275 | 0,078 | 0,000 | 1,317 |
| county road | 0,247 | 0,062 | 0,000 | 1,280 |
| dry road | 0,232 | 0,047 | 0,000 | 1,261 |
| curve | 0,180 | 0,043 | 0,000 | 1,198 |
| engine power 24-90 kW | 0,175 | 0,046 | 0,000 | 1,192 |
| probationary driving licence | 0,166 | 0,078 | 0,033 | 1,181 |
| darkness | 0,165 | 0,049 | 0,001 | 1,180 |
| drifting left | 0,147 | 0,041 | 0,000 | 1,158 |
| speed limit 100km/h | 0,114 | 0,046 | 0,013 | 1,120 |
| hitting a guard rail | -0,313 | 0,091 | 0,001 | 0,731 |
| speed limit 50km/h | -0,329 | 0,144 | 0,022 | 0,719 |
| constant | -9,285 | 0,611 | 0,000 |
Table 8.
Blackpatterns showing a significant relationship with the target variable severe casualties, and a positive Phi coefficient. n=20.293 single-vehicle accidents with single occupation and personal injury occurring outside the built-up area on the Austrian road network (3.431 are severe casualties).
Table 8.
Blackpatterns showing a significant relationship with the target variable severe casualties, and a positive Phi coefficient. n=20.293 single-vehicle accidents with single occupation and personal injury occurring outside the built-up area on the Austrian road network (3.431 are severe casualties).
| BP ID | BP variables | Fisher’s exact test p |
Phi Coefficient ϕ |
Frequency n |
|---|---|---|---|---|
| BP1 | speed limit 130km/h, highway, right drift, male driver | 0,001 | 0,027 | 44 |
| BP2 | speed limit 100km/h, country road, left drift, male driver | 0,000 | 0,032 | 41 |
| BP3 | speed limit 100km/h, country road, curve, left drift, male driver | 0,011 | 0,020 | 30 |
| BP4 | country road, right drift, female driver | 0,042 | 0,015 | 28 |
| BP5 | speed limit 100km/h, country road, left drift, male driver, fatigue | 0,001 | 0,028 | 20 |
| BP6 | speed limit 130km/h, highway, drifting right, male driver, fatigue | 0,040 | 0,015 | 16 |
| BP7 | speed limit 100km/h, country road, wet road, age 25-34, right drift, male driver | 0,001 | 0,027 | 12 |
| BP8 | speed limit 100km/h, country road, left drift, male driver, no safety belt applied | 0,000 | 0,031 | 10 |
| BP9 | speed limit 100km/h, country road, darkness, right drift, male driver | 0,003 | 0,026 | 10 |
| B10 | speed limit 80km/h, country road, right drift, male driver | 0,016 | 0,020 | 10 |
Table 9.
Blackpattern impact analysis results.
| BP ID | BP Frequency n |
BP Fisher’s exact test p |
BP Phi coefficient ϕ |
BP variables and their regression coefficients β | BIS | |||||
|---|---|---|---|---|---|---|---|---|---|---|
| BP1 | 44 | 0,001 | 0,027 | Speed limit 130km/h | Highway | Right drift | Male driver | 628,4 | ||
| 0 | 0 | 0 | 0,491 | |||||||
| BP2 | 41 | 0,001 | 0,032 | Speed limit 100km/h | Country road | Left drift | Male driver | 804,7 | ||
| 0,114 | 0,247 | 0,147 | 0,491 | |||||||
| BP3 | 30 | 0,011 | 0,020 | Speed limit 100km/h | Country road | curve | Left drift | Male driver | 194,9 | |
| 0,114 | 0,247 | 0,180 | 0,147 | 0,491 | ||||||
| BP4 | 28 | 0,042 | 0,015 | Country road | Right drift | Female driver | 50,1 | |||
| 0,247 | 0 | 0 | ||||||||
| BP5 | 20 | 0,001 | 0,028 | Speed limit 100km/h | Country road | Left drift | Male driver | Fatigue | 167,6 | |
| 0,114 | 0,247 | 0,147 | 0,491 | 0 | ||||||
| BP6 | 16 | 0,040 | 0,015 | Speed limit 130km/h | Highway | Right drift | Male driver | Fatigue | 37,1 | |
| 0 | 0 | 0 | 0,491 | 0 | ||||||
| BP7 | 12 | 0,001 | 0,027 | Speed limit 100km/h | Country road | Wet road | Age 25-34 | Right drift | Male driver | 141,8 |
| 0,114 | 0,247 | 0 | 0,492 | 0 | 0,491 | |||||
| BP8 | 10 | 0,000 | 0,031 | Speed limit 100km/h | Country road | Left drift | Male driver | No safety belt | 982,9 | |
| 0,114 | 0,247 | 0,147 | 0,491 | 1,612 | ||||||
| BP9 | 10 | 0,003 | 0,026 | Speed limit 100km/h | Country road | Darkness | Right drift | Male driver | 71,6 | |
| 0,114 | 0,247 | 0,165 | 0 | 0,491 | ||||||
| BP10 | 10 | 0,016 | 0,020 | Speed limit 80km/h | Country road | Right drift | Male driver | 38,3 | ||
| 0 | 0,247 | 0 | 0,491 | |||||||
Disclaimer/Publisher’s Note: The statements, opinions and data contained in all publications are solely those of the individual author(s) and contributor(s) and not of MDPI and/or the editor(s). MDPI and/or the editor(s) disclaim responsibility for any injury to people or property resulting from any ideas, methods, instructions or products referred to in the content. |
© 2024 by the authors. Licensee MDPI, Basel, Switzerland. This article is an open access article distributed under the terms and conditions of the Creative Commons Attribution (CC BY) license (http://creativecommons.org/licenses/by/4.0/).
Copyright: This open access article is published under a Creative Commons CC BY 4.0 license, which permit the free download, distribution, and reuse, provided that the author and preprint are cited in any reuse.


