Submitted:
15 September 2025
Posted:
16 September 2025
You are already at the latest version
Abstract
Peru faces critical challenges in the development and maintenance of its national road infrastructure, comprising over 32,000 kilometers, of which only 26% are classified as being in good condition. This infrastructural deficit significantly elevates logistics costs and undermines national competitiveness, particularly in key sectors such as agricul-ture and mining. In this context, improving the accuracy and reliability of cost estima-tion in road infrastructure projects is imperative to optimize resource allocation and mitigate the risk of cost overruns. This study proposes a stochastic cost estimation framework that integrates Monte Carlo simulation with correlation matrices, enabling the modeling of uncertainty and the complex interdependencies among critical cost drivers. The methodology was applied to the Oyon Ambo highway in Peru. Historical input cost databases were analyzed to define probabilistic distributions, and correla-tion coefficients were employed to represent the dependencies between variables such as material prices, labor productivity, and equipment efficiency. The stochastic model produced probabilistic cost forecasts with associated confidence intervals and quanti-fied risk exposure. The findings demonstrate that the proposed integrated approach significantly enhances the precision and robustness of cost estimates, providing project managers and decision-makers with a rigorous, data-driven tool for risk-informed budgeting and strategic financial planning in complex infrastructure projects.
Keywords:
Monte Carlo simulation
; quantitative risk analysis
; correlation analysis
; transportation infrastructure
1. Introduction
Road infrastructure is a highly valued aspect of current policies aimed at achieving economic development and competitiveness, as it facilitates market integration, reduces logistics costs, and shortens transportation times [1,2,3]. However, Latin America faces a significant investment gap in this field: while it is estimated that approximately 6% of annual GDP is required to meet demand, the current level of investment falls short of that threshold. According to the Inter-American Development Bank (IDB), this gap amounts to 2.5% of GDP, equivalent to approximately USD 150 billion per year[4]. As a consequence, road quality in the region ranks among the lowest globally, with a direct impact on competitiveness and production costs. In Latin America, logistics costs account for nearly 20% of total production costs, double the global average [5].
One of the critical factors exacerbating this situation is the frequent occurrence of cost overruns and delays in infrastructure projects. Globally, infrastructure investment projects show average cost overruns of 28%, but in Latin America this figure rises to 48% [6]. Moreover, it has been documented that around 75% of projects face budget increases and 65% experience schedule delays. Unlike other regions where these indicators tend to decrease, in Latin America they have continued to rise over time. This situation not only increases the fiscal burden but also generates uncertainty in execution and undermines the efficiency of public spending: the IDB estimates that between 20% and 53% of the budget allocated to public investment remains unexecuted due to administrative and technical delays [7]
In Peru, this problem takes on special significance. The country ranks 110th out of 141 in terms of road infrastructure quality according to the World Economic Forum [2], and faces paradigmatic cases such as the Nueva Carretera Central, whose budget doubled from S/ 11 billion to over S/ 24 billion after alignment adjustments during the study phase [8]. Adding to this is a troubling panorama of paralyzed works: by the end of 2023, the Comptroller General of the Republic reported 2,298 projects halted with S/ 26.992 billion already invested, of which an additional S/ 13.772 billion would be required for completion [9]. Transport sector leads this group with 628 stalled works, many of them roads, mainly due to contractual breaches (23.5%) and lack of financing (22.4%)[10].
This combination of insufficient investment, poor construction quality, and frequent budget deviations seriously limits a country’s ability to effectively execute its infrastructure programs. The economic consequences are significant: it is estimated that if these gaps persist over the next decade, Latin America’s GDP would be 15 percentage points lower, with an accumulated loss close to USD 900 billion for the region.
In this context, the need to substantially improve cost estimation methodologies in road projects becomes evident, incorporating approaches that more realistically reflect the inherent uncertainty of this type of works. Traditional techniques, based on deterministic values, often underestimate the variability of inputs and the interdependencies among key factors such as material prices, labor productivity, and equipment efficiency. Hence, recent studies have proposed the use of stochastic tools such as Monte Carlo simulation to capture this complexity [11,12]. In a previous study [13] it was argued that Monte Carlo simulation is a suitable tool in contexts like Latin America, where the use of stochastic methods is still limited. Following this line of improvement, the present study proposes a stochastic cost estimation framework that integrates Monte Carlo simulation with correlation matrices, with the objective of explicitly modeling the relationships among interdependent variables using historical data or expert judgment.
Several international studies have demonstrated the usefulness of Monte Carlo simulation in estimating costs and schedules in construction projects, integrating correlation matrices to model interdependencies among variables. Research by Firouzi et al [14], Moselhi y Roghabadi [15] y Sobieraj y Metelski [16] has shown that ignoring correlation among items can lead to underestimating project uncertainty, affecting the accuracy of contingency and schedule estimates. However, these approaches have been developed mainly in European, North American, or Asian contexts, where there is greater availability of data and specialized tools. In contrast, in Latin America—and particularly in Peru—the application of such methodologies is still incipient, requiring the development of practical, adaptable, and rapidly implementable tools that allow for a robust initial approach to quantitative risk analysis. Therefore, this research proposes a model tailored to Latin American conditions, with direct application to a case study in a Peruvian road project.
Unlike previous studies that apply Monte Carlo simulation under the assumption of independence among variables, this research explicitly incorporates correlations between critical cost factors such as prices, productivity, and operational efficiency [17,18,19,20]. This methodological differentiation is key in real-world contexts where these variables are strongly interrelated, yet the literature often treats them as independent. The proposed model, in addition to presenting a correlation structure adaptable through historical data and expert judgment, also enables its practical implementation in data-limited environments such as those prevalent in Latin America. With this, the study seeks to close a concrete gap in the quantitative risk analysis of infrastructure projects in the region.
2. Methodology
2.1. Methodological Framework of the Research
The methodology of this research is structured in three main phases, as shown in Figure 1. Phase 1 comprises the identification of the problem, the literature review, and the selection of the case study. In Phase 2, the stochastic model is developed through data collection, goodness-of-fit testing, the selection of probability distributions, and the construction of the correlation matrix. Finally, Phase 3 involves the simulation using the Monte Carlo method and the analysis of the resulting indicators. This comprehensive approach allows for a realistic representation of uncertainty and interdependencies among critical variables in road infrastructure projects.
2.2. Case Study Description
The model was applied to the improvement of a 49 km section of the Oyón–Ambo highway, located in the central-northern region of Peru, which connects Lima, Pasco, and Huánuco. This case was selected due to its technical and logistical complexity, as well as the availability of reliable historical data, making it representative for validating a stochastic cost estimation methodology under real conditions of uncertainty. This project has been the subject of previous research under a qualitative approach [21,22], and a quantitative approach using Monte Carlo Simulation [13]. However, unlike earlier studies that relied solely on Monte Carlo simulation, this research introduces correlation matrices to capture interdependencies among key variables, representing a significant methodological advancement in contexts such as LATAM.
2.3. Data Collection and Historical Database
The model was based on the analysis of more than 500 unit records related to input prices, labor productivity, and equipment efficiency from road projects executed between 2019 and 2023 in the central-northern region of the country. The information sources included technical files from the Ministry of Transport and Communications (MTC), regional contractors’ databases, the Peruvian Unit Price Bank (BPU), and records from the National Public Investment System (SNIP). The data were cleaned to remove incomplete records and outliers. Subsequently, an exploratory analysis was conducted using statistical tools to identify the probability distribution of each variable. Goodness-of-fit tests such as Kolmogorov–Smirnov, as expressed in eq. (1), and Anderson–Darling were applied to validate the adequacy of the selected functions.
The goodness-of-fit tests, shown in Table 1, confirmed that the key variables of the model—cement, fuel, fine aggregate, and coarse aggregate—follow a normal distribution, with positive results in both Kolmogorov–Smirnov and Anderson–Darling tests.
Figure 2.
Simulated distributions of unit prices for key materials expressed in US dollars (USD). Subfigure (a) shows the adjusted distribution for fine aggregate, while subfigure (b). corresponds to cement. Both curves include a normal distribution fit based on historical data from the Peruvian market.
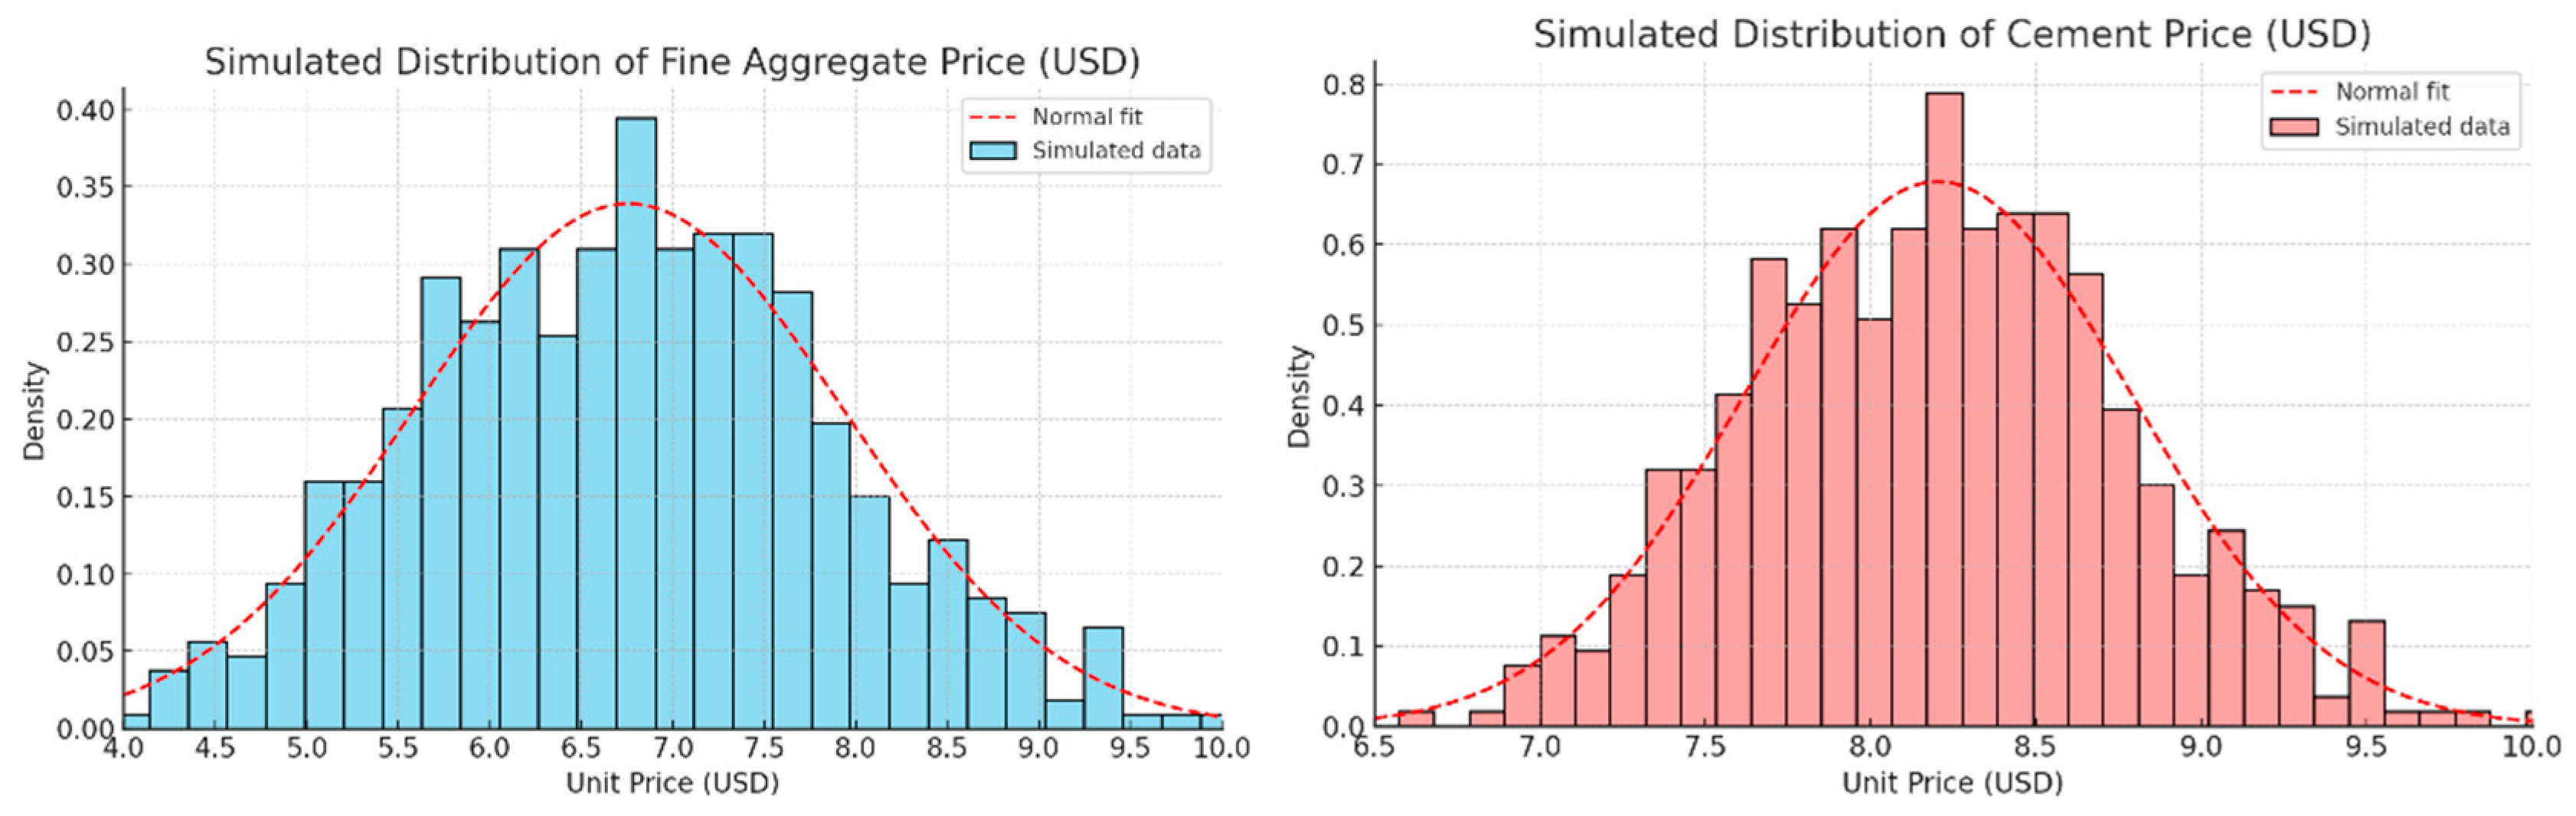
Probability distribution functions describe the likelihood that a random variable will take on certain values within a specific range. They are used in quantitative risk analysis to model uncertainty in project costs and schedules. There are two main types: discrete distributions (for variables that take specific, distinct values) and continuous distributions (for variables with an infinite range of possible values).
The normal distribution is used to model phenomena with a central tendency and symmetrical variability, making it useful when values are evenly distributed around a mean. Its probability density function is given by (2), where μ represents the mean and σ the standard deviation. This distribution is applied in cost and schedule estimations when variations result from multiple independent factors, in accordance with the Central Limit Theorem.
The triangular distribution is used when information is limited and only the minimum (a), most likely (b), and maximum (c) values are known. This model, described in (3), is applied in cost and schedule estimation when subjective assessments are available but there is insufficient historical data to use more complex distributions.
The Beta PERT distribution is a variant of the Beta distribution used to represent uncertainty in project activity estimates. It is defined in terms of the minimum (a), maximum (b), and mode (m) values, with its probability density function shown in (3).
Where B(α, β) is the Beta function, and the expressions for α and β are represented as shown in (4).
2.4. Definition of Random Variables and Probability Distributions
Based on the historical data collected, the main random variables that significantly influence the cost estimation of the Oyón–Ambo project were identified and selected. These variables were grouped into three main categories: (i) input prices, (ii) labor productivity, and (iii) equipment efficiency. Each variable was analyzed individually to determine its statistical behavior and the probability distribution function that best represented its variability.
Specialized tools such as @Risk were applied to fit probability distribution functions to the collected data, using triangular distributions for inputs with low dispersion, PERT distributions for productivity rates and operating times, and normal distributions for symmetric variables with a large sample size. They were parameterized according to minimum, maximum, most likely values, or means and standard deviations. In total, 15 random variables were modeled with their respective distributions, providing a solid statistical basis to simulate uncertainty scenarios and obtain more precise and realistic cost estimates.

Table 2.
Variables and inputs with probabilistic behavior in the stochastic model
| Category | Random Variable | Type of Distribution |
|---|---|---|
| Input prices | 1. Cement price | Normal |
| 2. Fine aggregate price | Normal | |
| 3. Coarse aggregate price | Normal | |
| 4. Fuel price | Normal | |
| 5. Steel price | Triangular | |
| 6. Cost of plasticizer additive | Triangular | |
| Labor productivity | 7. Productivity in earthworks (m³/day) | PERT |
| 8. Productivity in granular base spreading | PERT | |
| 9. Productivity in concrete placement | PERT | |
| 10. Productivity in asphalt layer placement | PERT | |
| Equipment efficiency | 11. Hourly cost of front loader | Normal |
| 12. Hourly cost of compactor roller | Normal | |
| 13. Roller efficiency (m³/hour) | PERT | |
| 14. Motor grader efficiency | PERT | |
| 15. Hourly cost of concrete mixer truck | Triangular |
These variables were selected due to their high budgetary impact and the availability of reliable data in the technical file.
2.5. Correlation Matrix and Interdependency Modeling
In stochastic cost modeling, assuming independence among random variables can lead to biased estimates of the project’s total risk. In real contexts, factors such as material prices, labor productivity, and equipment efficiency exhibit significant interdependencies. Ignoring these correlations limits the accuracy of uncertainty analysis and may underestimate the contingencies required to mitigate cost overruns.
To capture these relationships, a correlation matrix was constructed based on Pearson coefficients, calculated from the previously cleaned historical data. Only correlations with technical justification and absolute values greater than 0.30 were considered. The most relevant correlations were integrated into the model through the Cholesky decomposition method, using the @Risk tool, which allowed the generation of correlated random samples in the simulations. The construction of the correlation matrix follows a structure based on the variances of the risks as well as their respective covariances, as shown in equation (3) [23]
Table 3 summarizes the pairs of correlated random variables incorporated into the model, along with their respective correlation coefficients.
2.6. Monte Carlo Simulation Framework and Risk Metrics
Using @Risk [24], we ran 10,000-iteration simulations—validated in prior tests on this same project where 10,000 delivered convergence versus 5,000 and 50,000—to model cost uncertainty for the Oyón–Ambo section by sampling triangular, PERT, and normal input distributions, enforcing the empirically derived correlation matrix, and applying the project’s bill of quantities. Each iteration produced a total-cost scenario, yielding a full probability distribution of project cost. We then computed decision-oriented outputs: expected total cost (mean), standard deviation, confidence percentiles (P10, P50, P90), 95% Value-at-Risk (VaR), and the probability of exceeding the base budget. Together, these metrics quantify central tendency, dispersion, tail risk, and budget-overrun likelihood, supporting contingency sizing, proactive financial management, and strengthened controls under uncertainty.
3. Results
3.1. Distribution of Results
The execution of the Monte Carlo simulation with 10,000 iterations produced a probabilistic distribution of the total estimated cost for the Oyón–Ambo road project, integrating the variability of the input variables and their respective interdependencies. From these results, the most likely budget execution scenarios were identified, as well as the levels of exposure to economic risk.
When comparing the results of both simulations, a significant difference is observed in the projected values for the 95th percentile of the project’s total cost. In the model without correlations, P95 was USD 84.63 million, while in the model incorporating correlation matrices this value increased to USD 86.26 million. This increase reflects a direct effect of the dependencies introduced among random variables, which amplify risk propagation within the system. The wider interval between the 5th and 95th percentiles suggests greater dispersion in the possible scenarios, translating into higher volatility in cost estimation. This behavior is consistent with statistical principles, which indicate that positive correlation among variables increases the joint variance of the system. Therefore, the results show that the use of correlation matrices not only alters the expected value but also affects the shape and spread of the simulated outcome distribution, which is particularly relevant for contingency estimation in contexts with multiple interrelated sources of uncertainty.
Figure 3.
Results of the Monte Carlo simulation for the estimation of the Oyón–Ambo project cost. Figure (a) shows the total cost distribution without considering correlations among variables, while figure (b) incorporates a correlation matrix between random variables, showing greater dispersion and an increase in the 95th percentile of the simulated total cost.
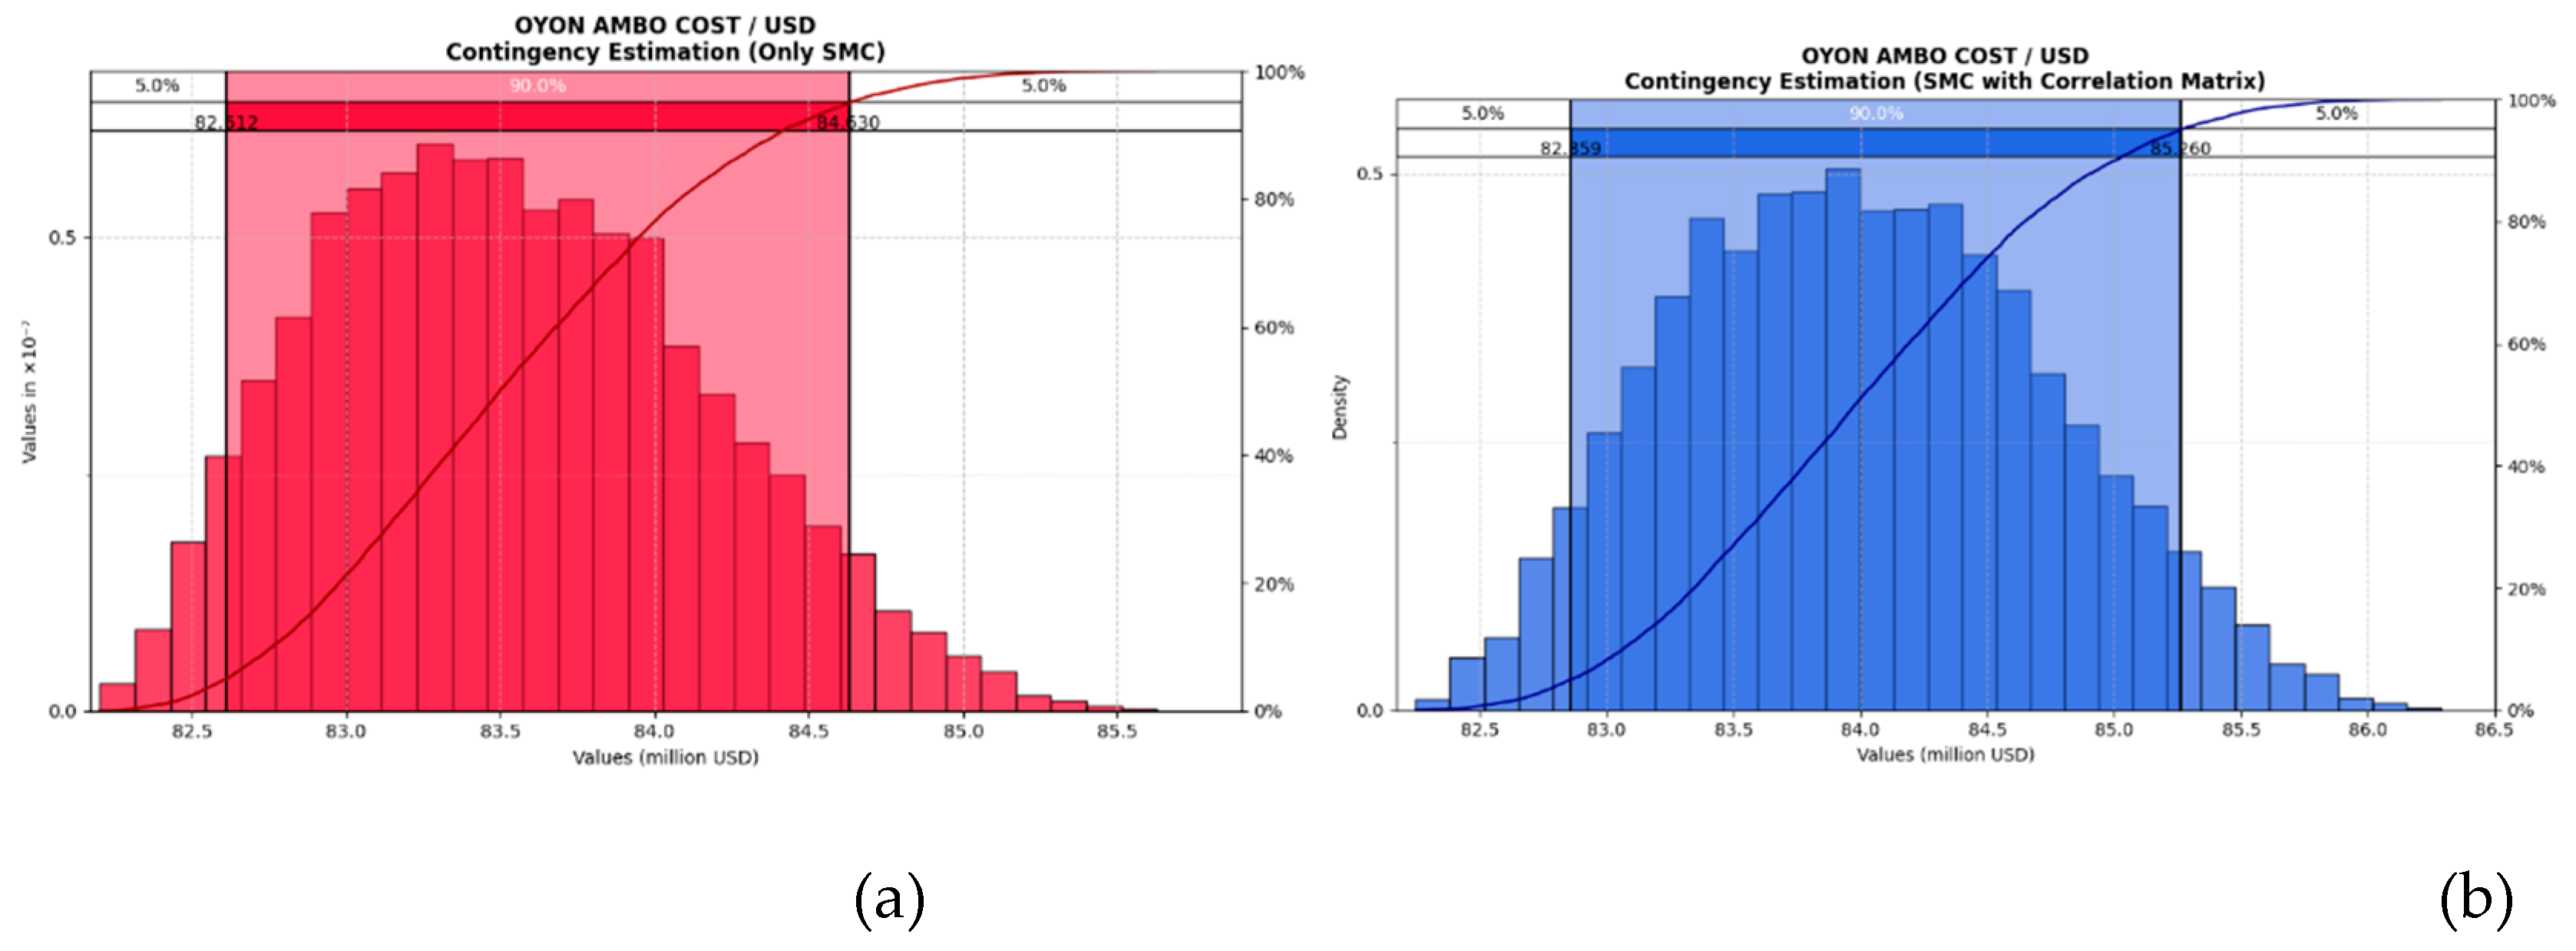
In the uncorrelated simulation (red curve), the distribution exhibits a slightly positive skew, with a longer right tail, indicating fewer high-cost scenarios. In contrast, the correlated model (blue curve) shows a more centered and compact distribution, with greater overall dispersion, reflecting a more uniform propagation of risk due to dependencies among variables.
This behavior is consistent with statistical theory: the incorporation of correlations among variables tends to increase joint variance and redistribute risk, making the curve more symmetric but broader. This results in more conservative and realistic estimates for budget planning.
3.2. Statistical Analysis
The main statistical indicators derived from both Monte Carlo simulations are presented below: one without considering correlations among random variables, and another integrating a correlation matrix. The objective is to contrast the effects of explicitly incorporating interdependencies on the shape and dispersion of the simulated total cost distribution. The results reveal relevant differences in the mean, key percentiles, and shape measures (skewness and kurtosis), showing greater dispersion and a slight reduction in kurtosis when correlations are considered.
Table 4.
Comparison of statistical indicators between simulations with and without correlation
| Indicator | Without correlation (red) | With correlation (blue) |
|---|---|---|
| Mean (USD million) | 83.55 | 84.01 |
| Percentile 10 (P10) | 82.77 | 83.06 |
| Percentile 50 (P50) | 83.50 | 83.98 |
| Percentile 90 (P90) | 84.39 | 85.00 |
| Standard deviation | 0.61 | 0.73 |
| Skewness | 0.32 | 0.18 |
| Kurtosis | –0.44 | –0.52 |
3.3. Sensitivity Analysis
Based on the cost distribution of the correlated model reported in Section 3.1 (Mean = USD 84.01 M, P50 = USD 83.98 M, P90 = USD 85.00 M, and P95 = USD 86.26 M), exceedance probabilities were estimated for different budget thresholds:
- If the approved budget were USD 84.00 M, the probability of exceedance would be 45.4%.
- If the approved budget were USD 84.50 M, the probability of exceedance would be 28.7%.
- If the approved budget were set at P90 (USD 85.00 M), the residual risk would decrease to 16.8%.
- If the approved budget were set at P95 (USD 86.26 M), the residual risk would be ≈ 3.0%.
These figures were obtained by fitting a skew-normal distribution that reproduces the reported quantiles and evaluating the cumulative distribution function (CDF) at each threshold. Compared to the approved budget in the technical file, the probability of exceedance can be directly interpreted depending on where the budget lies relative to P50/P90/P95: if set around USD 84.5 M, the project faces moderate risk (~29%); if raised to P90, that risk falls to ~17%; and at P95, the residual risk reduces to ~3%.
Figure 4 shows the probability density of simulated project costs, highlighting the expected distribution around the mean and indicating the position of the approved budget. This visualization allows decision-makers to directly observe the likelihood of costs clustering around central estimates or deviating toward higher values.
Figure 5 presents the CDF of simulated costs, which is particularly useful for interpreting exceedance probabilities. By comparing the position of the approved budget with the cumulative curve, one can directly quantify the risk of cost overruns. Together, these figures link the statistical analysis with practical financial decision-making, reinforcing the connection between percentiles (P50, P90, P95) and the residual budgetary risk identified in the sensitivity analysis.
4. Discussion
4.1. Comparison with Similar Methodology Studies
The results of this study’s stochastic cost estimation – particularly the inclusion of correlated risk factors – align with and extend findings from existing literature. The Monte Carlo simulations showed that incorporating correlation between cost drivers significantly widened the cost distribution and raised the high-end risk estimate. For instance, the 95th percentile (P95) cost forecast increased from about USD 84.63 million under an independence assumption to USD 86.26 million when correlations were modeled. This ~2% rise in the P95, coupled with a jump in the standard deviation (from 0.61 to 0.73), indicates greater volatility and a more conservative contingency requirement once interdependencies are acknowledged. Such behavior is consistent with statistical theory and has been observed by other authors – positively correlated inputs lead to higher joint variance and broader outcome ranges [25,26,27,28].
These findings corroborate prior studies emphasizing the critical role of accounting for correlations in project cost estimates [29,30,31,32]. Decades ago, Touran and Wiser [33] demonstrated that ignoring correlations among cost elements can severely underestimate total cost variance. More recently, Firouzi et al. [34] applied a copula-based Monte Carlo model and found that different dependency structures yield markedly different cost distribution shapes. They concluded that modeling such interdependencies (via copulas) improves the accuracy of total cost prediction. Likewise, Moselhi and Roghabadi underscored that correlation is “the most important issue” for accurate contingency estimation. In their fuzzy Monte Carlo approach, they even introduced subjective correlation techniques to handle situations with limited data on correlation coefficients [35]. Our results directly echo these studies: by explicitly integrating a correlation matrix, we obtain a more realistic risk profile, avoiding the underestimation of uncertainty that occurs when cost drivers are treated in isolation. This agreement with global research validates our methodological choice and highlights a key improvement over traditional Monte Carlo analyses that assume independent cost items.
Methodologically, our approach distinguishes itself by using actual historical data and expert judgment to construct the correlation matrix for cost variables. This is in contrast to earlier works that often assumed simplistic or no dependencies, or relied on preset correlation categories (“high/medium/low” subjective correlations as in Touran [36]. By capturing nuanced interdependencies, our model provides a refined risk quantification. Notably, Moselhi and Roghabadi’s fuzzy-simulation method achieved comparable accuracy to a full Monte Carlo by incorporating uncertainty in the correlation inputs – their “developed method” was shown to match the performance of a Monte Carlo with correlation even when run in an analytical (non-simulation) mode. This highlights that while the implementation may vary, the inclusion of correlation in cost risk models is indispensable for realism. In sum, the consensus across these studies is that acknowledging the interconnected nature of cost drivers leads to more robust and defensible estimates of contingency and risk exposure.
4.2. Global Context and Implications
Placing our findings in a global context, it becomes clear that advanced risk analysis techniques like ours are not just academic exercises but are crucial for addressing well-documented cost overrun trends. Worldwide, infrastructure projects commonly suffer cost overruns averaging around 28%, whereas in Latin America the average overrun soars to roughly 48%. Traditional deterministic estimating approaches – still prevalent in many projects – have been heavily criticized for contributing to these overruns due to their inability to represent uncertainty. They tend to produce point estimates that ignore variability and correlations, resulting in budgets that are too optimistic. Our Monte Carlo-based framework directly tackles this shortcoming by providing probability-based forecasts. For example, rather than a single-valued contingency, we can quantify the likelihood of exceeding the baseline budget. This probabilistic insight allows decision-makers to prepare more effectively for worst-case scenarios, a practice aligned with modern risk management but often missing in conventional estimates.
It is important to note that while quantitative risk analysis methods like Monte Carlo simulation are well-established in many developed regions, their adoption in developing contexts has lagged. The literature observes that most prior applications of Monte Carlo cost simulation with correlation have been in North America, Europe, or Asia, where abundant data and specialized tools facilitate such analyses. In contrast, in Latin America – and Peru in particular – the use of these stochastic methods is still incipient. This study contributes to bridging that gap by demonstrating a practical implementation tailored to a data-scarce environment. The current approach shows that even with limited historical information, a carefully constructed model can yield meaningful risk metrics [37,38,39]. The case of the Oyón–Ambo road project serves as an example of how integrating Monte Carlo simulation into local project planning can enhance estimate reliability, offering a template for similar efforts in the region.
The implications of our findings extend to improving contingency practices. By capturing a more realistic spread of possible costs, our model suggests contingencies that are neither overly conservative nor dangerously low, but rather calibrated to a chosen confidence level. In a recent related study of Peruvian road projects, Ariza and Zavala [13] reported that applying Monte Carlo–based quantitative risk analysis reduced uncertainty significantly, resulting in recommended cost contingencies between 1.34% and 11% of project budgets – far lower than the ~32% cost overruns historically observed on similar projects. This improvement underscores how embracing formal risk analysis can narrow the chronic gap between estimated and actual costs. In the current study, we similarly see that a rigorous stochastic estimation can elucidate a plausible contingency range (on the order of only a few percent of total cost for high-confidence budgeting), which can be compared against traditional ad-hoc contingencies or past project outcomes. Such comparisons reveal that quantitative risk models can substantially improve the accuracy of budget forecasts, thereby enhancing financial control.
The results are in strong agreement with global research on cost estimation under uncertainty [40,41], while also shedding light on context-specific considerations. The enhanced accuracy and robustness of the cost forecasts obtained here – attributable to modeling correlations and uncertainty comprehensively – mark a valuable advancement for infrastructure project management in developing regions. This comparative perspective, juxtaposing our findings with those of other authors and methods, not only validates the effectiveness of our approach but also illustrates the differences in outcomes when modern stochastic methods are employed versus when traditional techniques fall short. By reflecting on these differences, it underscore the importance of methodological choice in cost estimation: incorporating interdependencies and probabilistic risk assessment leads to more reliable budgets, ultimately improving the likelihood of project success in both local and global settings.
4.3. Limitations and Future Research
This study is constrained by data availability, distributional assumptions, and the chosen dependence structure. First, correlations among cost drivers were estimated from limited historical evidence and expert judgment; sampling error and potential non-stationarity (e.g., inflation regimes, FX shocks) may bias both the correlation matrix and the resulting tail risk. Second, the fitted marginal distributions and the skewness/asymmetry implied by our model are approximations; model misspecification can propagate to percentile-based contingencies. Third, linear correlation matrices capture co-movement but may under-represent tail dependence and asymmetric co-fluctuations. Future work should: (i) estimate dependencies empirically from multi-project panels and test vine-copulas against linear correlation; (ii) integrate dynamic price processes (e.g., SDEs for asphalt and steel) to link market volatility to budget risk; (iii) adopt hierarchical/Bayesian updating to recalibrate during execution; (iv) jointly model cost–schedule risk; and (v) back-test forecasts against realized outcomes, including extreme-value stress tests and bootstrap validation, to quantify calibration and improve transferability across contexts.
5. Conclusions
This paper advances stochastic cost estimation for transportation infrastructure by embedding correlated Monte Carlo simulation within a transparent risk framework. Relative to independence assumptions, modeling interdependencies among cost drivers produces a wider and more realistic cost distribution, materially lifting upper-tail percentiles (e.g., P90–P95) and, hence, contingency requirements. The approach yields interpretable outputs—exceedance probabilities for any budget threshold and sensitivity insights—that directly inform governance decisions on contingency sizing and risk appetite. In contexts where deterministic budgeting remains prevalent, these results demonstrate the practical value of probabilistic planning to reduce the likelihood and severity of cost overruns.
Beyond its empirical findings, the study offers a replicable template for agencies and practitioners operating under data constraints. By combining defensible marginal distributions with an explicit dependence structure, the method balances rigor and implementability, and can be progressively enriched with better data (panel histories), richer dependence models (copulas), and dynamic drivers (commodity price processes). The broader implication is clear: adopting correlated, percentile-based budgeting shifts practice from optimistic point estimates to risk-informed decisions, improving fiscal discipline and project credibility across the transportation sector.
Author Contributions
For research articles with several authors, a short paragraph specifying their individual contributions must be provided. The following statements should be used “Conceptualization, V.A.F. and G.Z.; methodology, V.A.F.; software, V.A.F.; validation, G.Z.A., R.S. and J.B.C.; formal analysis, V.A.F.; investigation, V.A.F.; resources, G.Z.A..; data curation, V.A.F.; writing—original draft preparation, V.A.F..; writing—review and editing, G.Z.A.; visualization, R.S..; supervision, J.B.C..; project administration, V.A.F.; funding acquisition, V.A.F. All authors have read and agreed to the published version of the manuscript.
Funding
This research was funded by ARIZA INGENIEROS CONSULTING FIRM.
Data Availability Statement
We encourage all authors of articles published in MDPI journals to share their research data. In this section, please provide details regarding where data supporting reported results can be found, including links to publicly archived datasets analyzed or generated during the study. Where no new data were created, or where data is unavailable due to privacy or ethical restrictions, a statement is still required. Suggested Data Availability Statements are available in section “MDPI Research Data Policies” at https://www.mdpi.com/ethics.
Acknowledgments
We acknowledge Ariza Ingenieros Consulting Firm by the support given for this research.
Conflicts of Interest
The authors declare no conflicts of interest.
References
- IMD World Competitiveness Center, “IMD World Competitiveness Booklet 2023,” Lausanne, Jun. 2023. Accessed: Sep. 21, 2024. Online. Available: https://worldcompetitiveness.imd.org/.
- K. Schwab, The Global Competitiveness Report. 2019.
- ComexPeru, “ INFRAESTRUCTURA VIAL: GOBIERNOS SUBNACIONALES ESTANCADOS.” Accessed: Apr. 10, 2025. Online. Available: https://www.comexperu.org.pe/articulo/infraestructura-vial-gobiernos-subnacionales-estancados#:~:text=La%20provisi%C3%B3n%20de%20carreteras%2C%20puentes,semanarios%201007%20%20y%2010.
- BID, “Infraestructura: la clave del crecimiento para América Latina,” BID. Accessed: Apr. 30, 2025. Online. Available: https://www.iadb.org/es/historia/infraestructura-la-clave-del-crecimiento-para-america-latina#:~:text=La%20brecha%20de%20inversi%C3%B3n%20en,no%20necesariamente%20en%20qu%C3%A9%20tipo.
- Portal Portuario, “BID: Urge reducir costos logísticos para enfrentar efectos de la pandemia en el comercio de América Latina,” Portal Portuario. Accessed: Apr. 30, 2025. Online. Available: https://portalportuario.cl/bid-urge-reducir-costos-logisticos-para-enfrentar-efectos-de-la-pandemia-en-el-comercio-de-america-latina/#:~:text=%E2%80%9CEl%20costo%20de%20transporte%2C%20log%C3%ADstica,o%20m%C3%A1s%20y%20est%C3%A1n%20relacionados.
- T. Serebrisky, A. Suárez-Alemán, C. Pastor, and A. Wohlhueter, “Aumentando la eficiencia en la provisión de infraestructura pública,” 2019.
- E. Cavallo, A. Powell, and T. Serebrisky, “DE ESTRUCTURAS A SERVICIOS. El camino a una mejor infraestructura en América Latina y el Caribe,” 2020.
- Infobae, “La nueva Carretera central: primer tramo hubiera costado S/ 11 millones por 40 kilómetros; ahora el precio será más del doble,” Lima, 2024. Accessed: Apr. 27, 2025. Online. Available: https://www.infobae.com/peru/2024/03/04/carretera-central-el-primer-tramo-costaria-s-11-millones-por-40-kilometros-mas-ahora-el-precio-sera-mas-del-doble/#:~:text=un%20trazo%20de%20145%20kil%C3%B3metros,tendr%C3%A1%20una%20extensi%C3%B3n%20de%20185.
- Contraloría General de la República, “Reporte de Obras Paralizadas,” 2024.
- B. Flyvbjerg et al., “Five things you should know about cost overrun,” Transp Res Part A Policy Pract, vol. 118, pp. 174–190, Dec. 2018. [CrossRef]
- J. C. Espinoza Jaco, C. M. Lopez Galarza, R. M. Venero, and J. A. D. Quispe, “Monte Carlo Simulation in a Peruvian Highway,” Civil Engineering and Architecture, vol. 9, no. 6, pp. 1727–1734, Oct. 2021. [CrossRef]
- H. D. Gómez and A. Orobio, “Effects of uncertainty on scheduling of highway construction projects,” Dyna (Medellin), vol. 82, no. 193, pp. 155–164, Oct. 2015. [CrossRef]
- V. A. Ariza Flores and G. Zavala Ascaño, “Quantitative Risk Analysis Framework for Cost and Time Estimation in Road Infrastructure Projects,” Infrastructures (Basel), vol. 10, no. 6, p. 139, Jun. 2025. [CrossRef]
- A. Firouzi, W. Yang, and C.-Q. Li, “Prediction of Total Cost of Construction Project with Dependent Cost Items,” J Constr Eng Manag, vol. 142, no. 12, Dec. 2016. [CrossRef]
- O. Moselhi and M. A. Roghabadi, “Risk quantification using fuzzy-based Monte Carlo simulation,” Journal of Information Technology in Construction, vol. 25, pp. 87–98, Feb. 2020. [CrossRef]
- J. Sobieraj and D. Metelski, “Project Risk in the Context of Construction Schedules—Combined Monte Carlo Simulation and Time at Risk (TaR) Approach: Insights from the Fort Bema Housing Estate Complex,” Applied Sciences, vol. 12, no. 3, p. 1044, Jan. 2022. [CrossRef]
- S. pal, “Quantitative risk analysis for institutional building construction,” Mater Today Proc, vol. 69, pp. 127–132, Jan. 2022. [CrossRef]
- M. Nabawy and L. M. Khodeir, “A systematic review of quantitative risk analysis in construction of mega projects,” Ain Shams Engineering Journal, vol. 11, no. 4, pp. 1403–1410, Dec. 2020. [CrossRef]
- L. Chen, Q. Lu, and D. Han, “A Bayesian-Driven Monte Carlo Approach for Managing Construction Schedule Risks of Infrastructures Under Uncertainty,” SSRN Electronic Journal, 2022. [CrossRef]
- L. Chen, Q. Lu, S. Li, W. He, and J. Yang, “Bayesian Monte Carlo Simulation–Driven Approach for Construction Schedule Risk Inference,” Journal of Management in Engineering, vol. 37, no. 2, Mar. 2021. [CrossRef]
- V. A. Ariza Flores and E. Portocarrero, “Integrating Resilience in Construction Risk Management: A Case Study on Peruvian Road Infrastructure,” E3S Web of Conferences, vol. 497, p. 02019, Mar. 2024. [CrossRef]
- V. A. Ariza Flores and R. Salvador, “Adaptive Risk Management in Road Construction: Oyon-Ambo Highway Insights, El Niño 2019 Case Study,” E3S Web of Conferences, vol. 497, p. 02020, Mar. 2024. [CrossRef]
- Damnjanovic and K. Reinschmidt, Data Analytics for Engineering and Construction Project Risk Management. in Risk, Systems and Decisions. Texas: Springer International Publishing, 2020. [CrossRef]
- Palisade Corporation, “@RISK,” 2024, Palisade Corporation, Ithaca, NY, USA: 8.4.
- A. Senić, M. Dobrodolac, and Z. Stojadinović, “Development of Risk Quantification Models in Road Infrastructure Projects,” Sustainability, vol. 16, no. 17, p. 7694, Sep. 2024. [CrossRef]
- R. Canesi and B. Gallo, “Risk Assessment in Sustainable Infrastructure Development Projects: A Tool for Mitigating Cost Overruns,” Land (Basel), vol. 13, no. 1, p. 41, Dec. 2023. [CrossRef]
- R. K. Haddad and Z. Harun, “Development of a Novel Quantitative Risk Assessment Tool for UK Road Tunnels,” Fire, vol. 6, no. 2, p. 65, Feb. 2023. [CrossRef]
- J.-S. Chou, “Cost simulation in an item-based project involving construction engineering and management,” International Journal of Project Management, vol. 29, no. 6, pp. 706–717, Aug. 2011. [CrossRef]
- A. M. El-Kholy, A. M. Tahwia, and M. M. Elsayed, “Prediction of simulated cost contingency for steel reinforcement in building projects: ANN versus regression-based models,” International Journal of Construction Management, vol. 22, no. 9, pp. 1675–1689, Jul. 2022. [CrossRef]
- F. Muhamad Halil, H. Ismail, M. S. Hasim, and H. Hashim, “A Conceptual Study on the Monte Carlo Simulation for Cost Forecasting in the Green Building Project,” Environment-Behaviour Proceedings Journal, vol. 5, no. 13, p. 75, Mar. 2020. [CrossRef]
- F. Muhamad Halil, H. Ismail, M. S. Hasim, and H. Hashim, “Monte Carlo Simulation for Cost Forecasting in the Green Building Project,” Asian Journal of Quality of Life, vol. 5, no. 18, pp. 33–42, Apr. 2020. [CrossRef]
- B. Zhu, L.-A. Yu, and Z.-Q. Geng, “Cost estimation method based on parallel Monte Carlo simulation and market investigation for engineering construction project,” Cluster Comput, vol. 19, no. 3, pp. 1293–1308, Sep. 2016. [CrossRef]
- A. Touran and E. P. Wiser, “Monte Carlo Technique with Correlated Random Variables,” J Constr Eng Manag, vol. 118, no. 2, pp. 258–272, Jun. 1992. [CrossRef]
- Firouzi, W. Yang, and C.-Q. Li, “Prediction of Total Cost of Construction Project with Dependent Cost Items,” J Constr Eng Manag, vol. 142, no. 12, Dec. 2016. [CrossRef]
- O. Moselhi and M. A. Roghabadi, “Risk quantification using fuzzy-based Monte Carlo simulation,” Journal of Information Technology in Construction, vol. 25, pp. 87–98, Feb. 2020. [CrossRef]
- Touran, “Probabilistic Cost Estimating with Subjective Correlations,” J Constr Eng Manag, vol. 119, no. 1, pp. 58–71, Mar. 1993. [CrossRef]
- E. Smirnova, “The use of the Monte Carlo method for predicting environmental risk in construction zones,” J Phys Conf Ser, vol. 1614, no. 1, p. 012083, Aug. 2020. [CrossRef]
- V. Zamani, E. Yavari, and H. Taghaddos, “A science mapping lens on discrete event simulation applications in construction engineering and management,” Autom Constr, vol. 166, p. 105625, Oct. 2024. [CrossRef]
- A. Qazi and M. C. E. Simsekler, “Risk assessment of construction projects using Monte Carlo simulation,” International Journal of Managing Projects in Business, vol. 14, no. 5, pp. 1202–1218, Jul. 2021. [CrossRef]
- H. D. Gómez and A. Orobio, “Effects of uncertainty on scheduling of highway construction projects,” Dyna (Medellin), vol. 82, no. 193, pp. 155–164, Oct. 2015. [CrossRef]
- A. Zhasmukhambetova, H. Evdorides, and R. J. Davies, “Integrating Risk Assessment and Scheduling in Highway Construction: A Systematic Review of Techniques, Challenges, and Hybrid Methodologies,” Future Transportation, vol. 5, no. 3, p. 85, Jul. 2025. [CrossRef]
Figure 1.
Methodological Framework of the Research
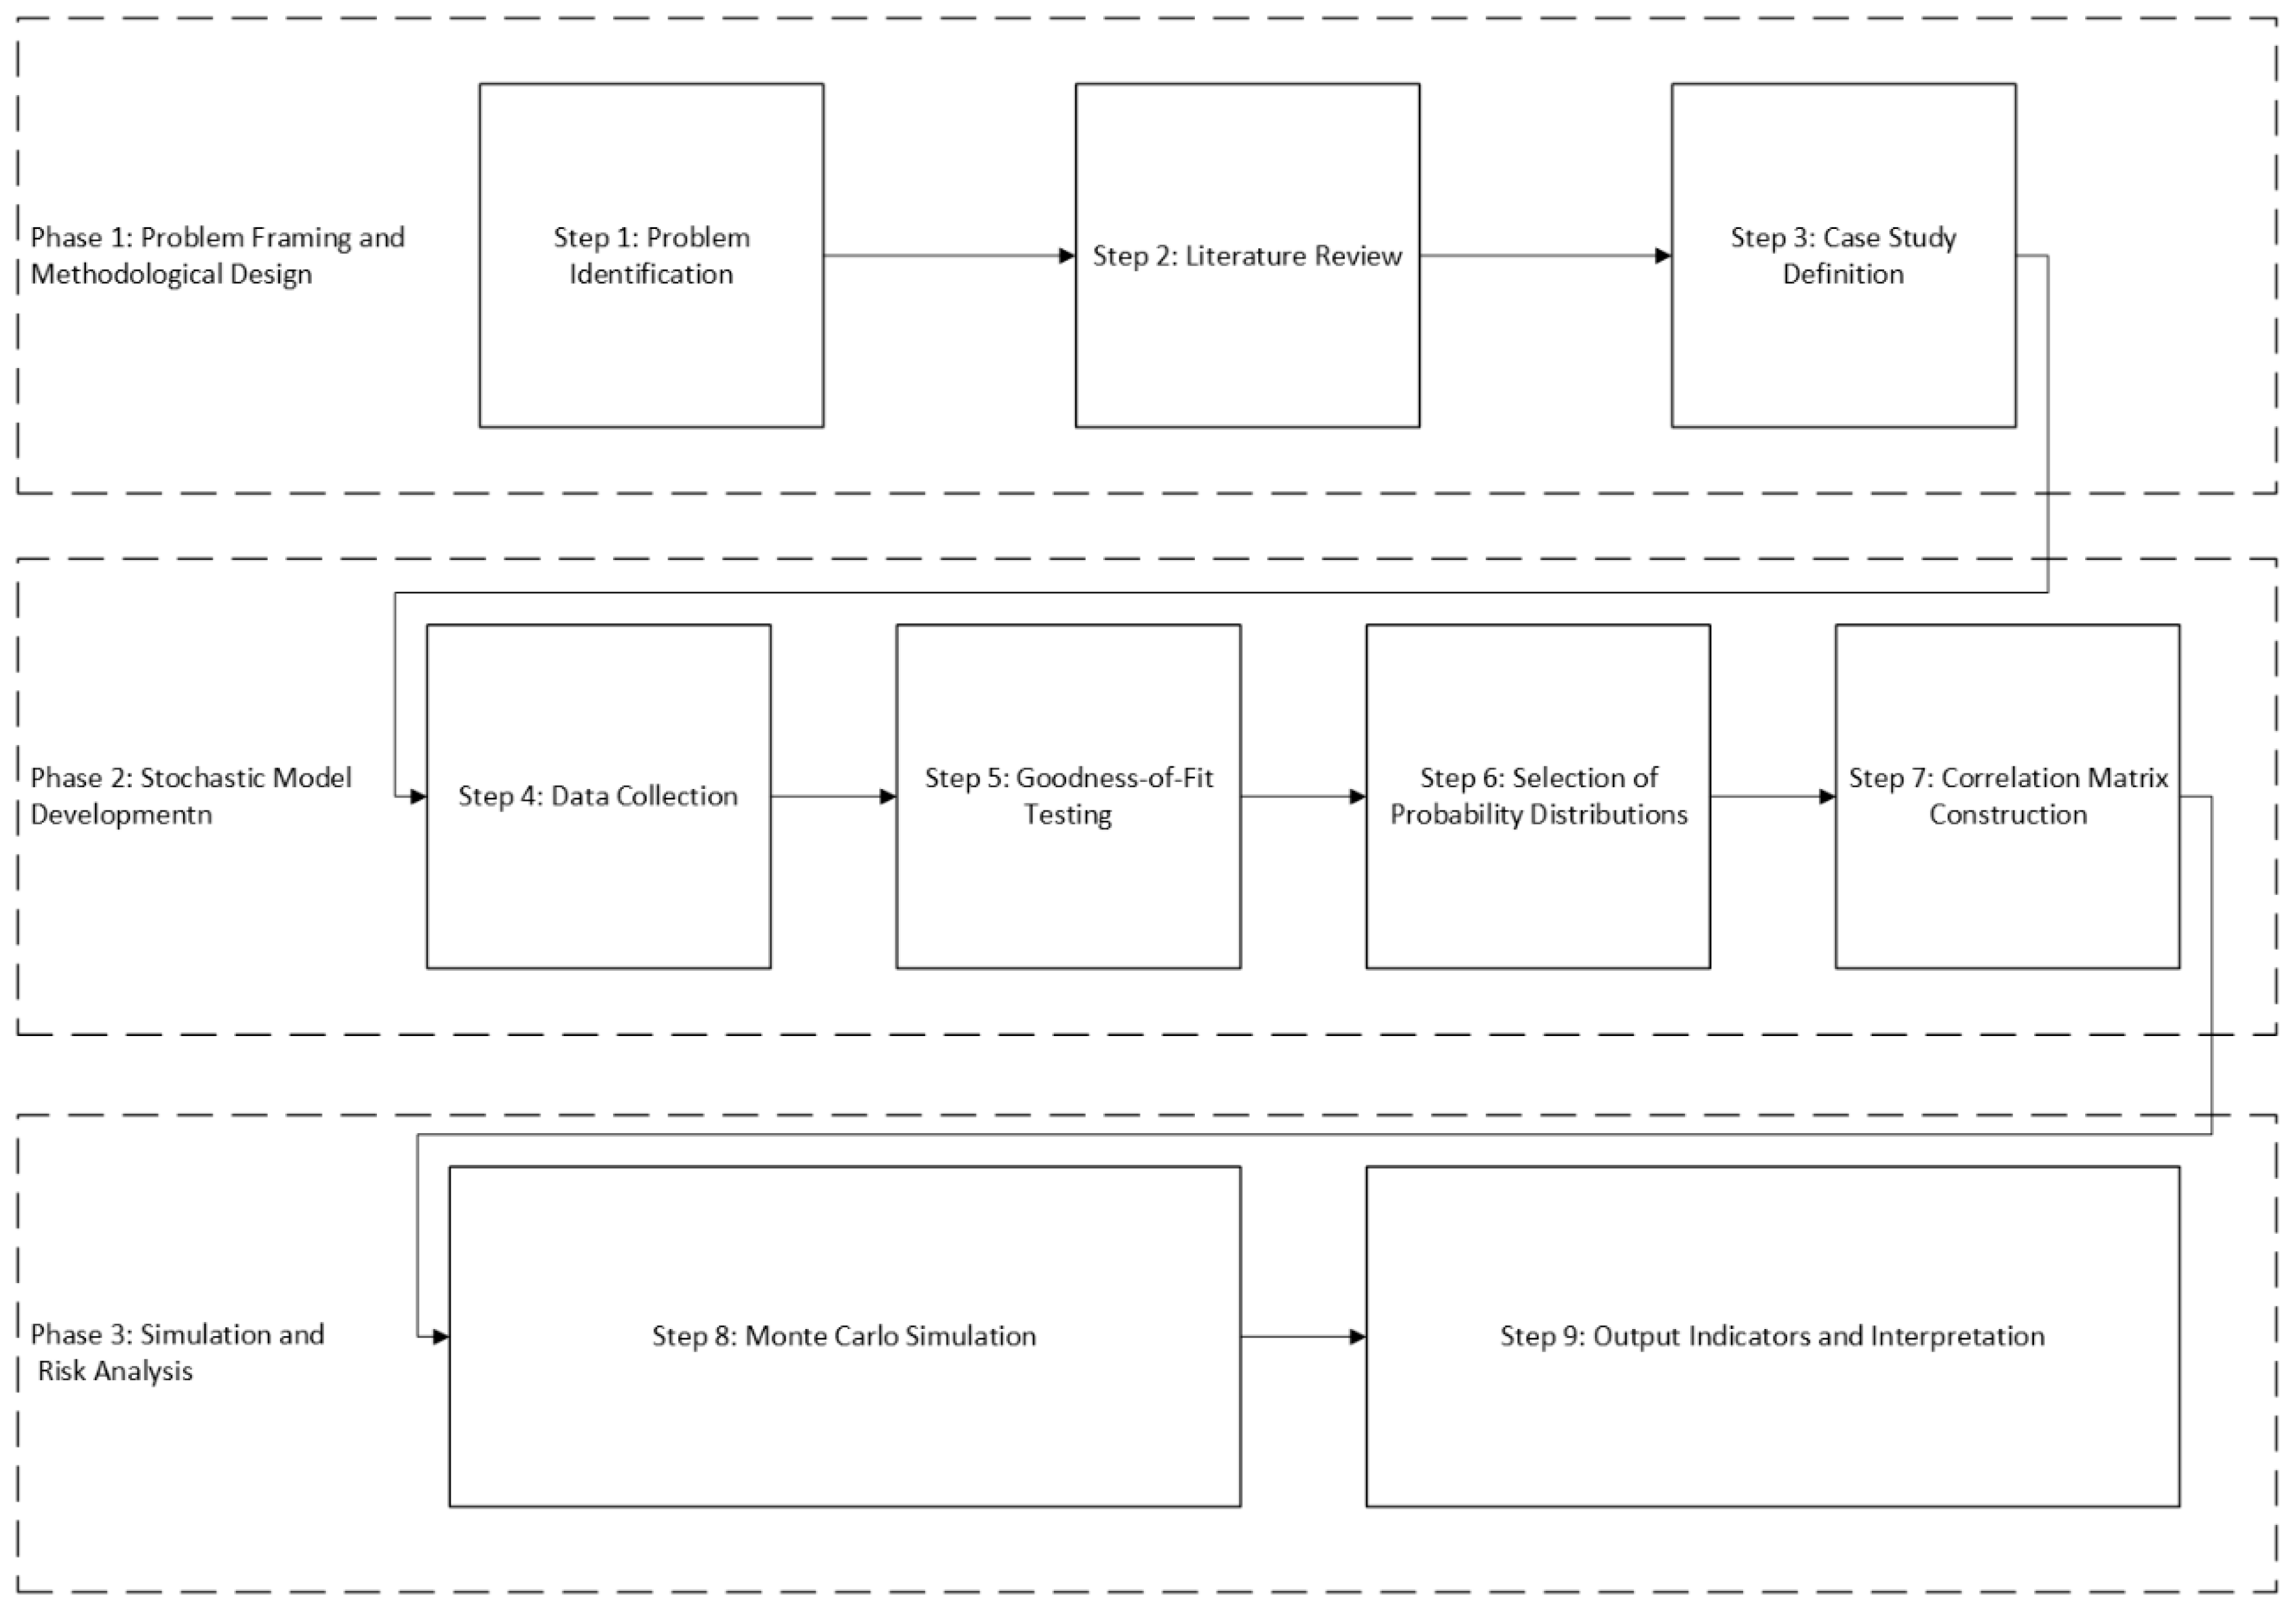
Figure 4.
Histogram of Simulated Total Costs under the Correlated Monte Carlo Model.
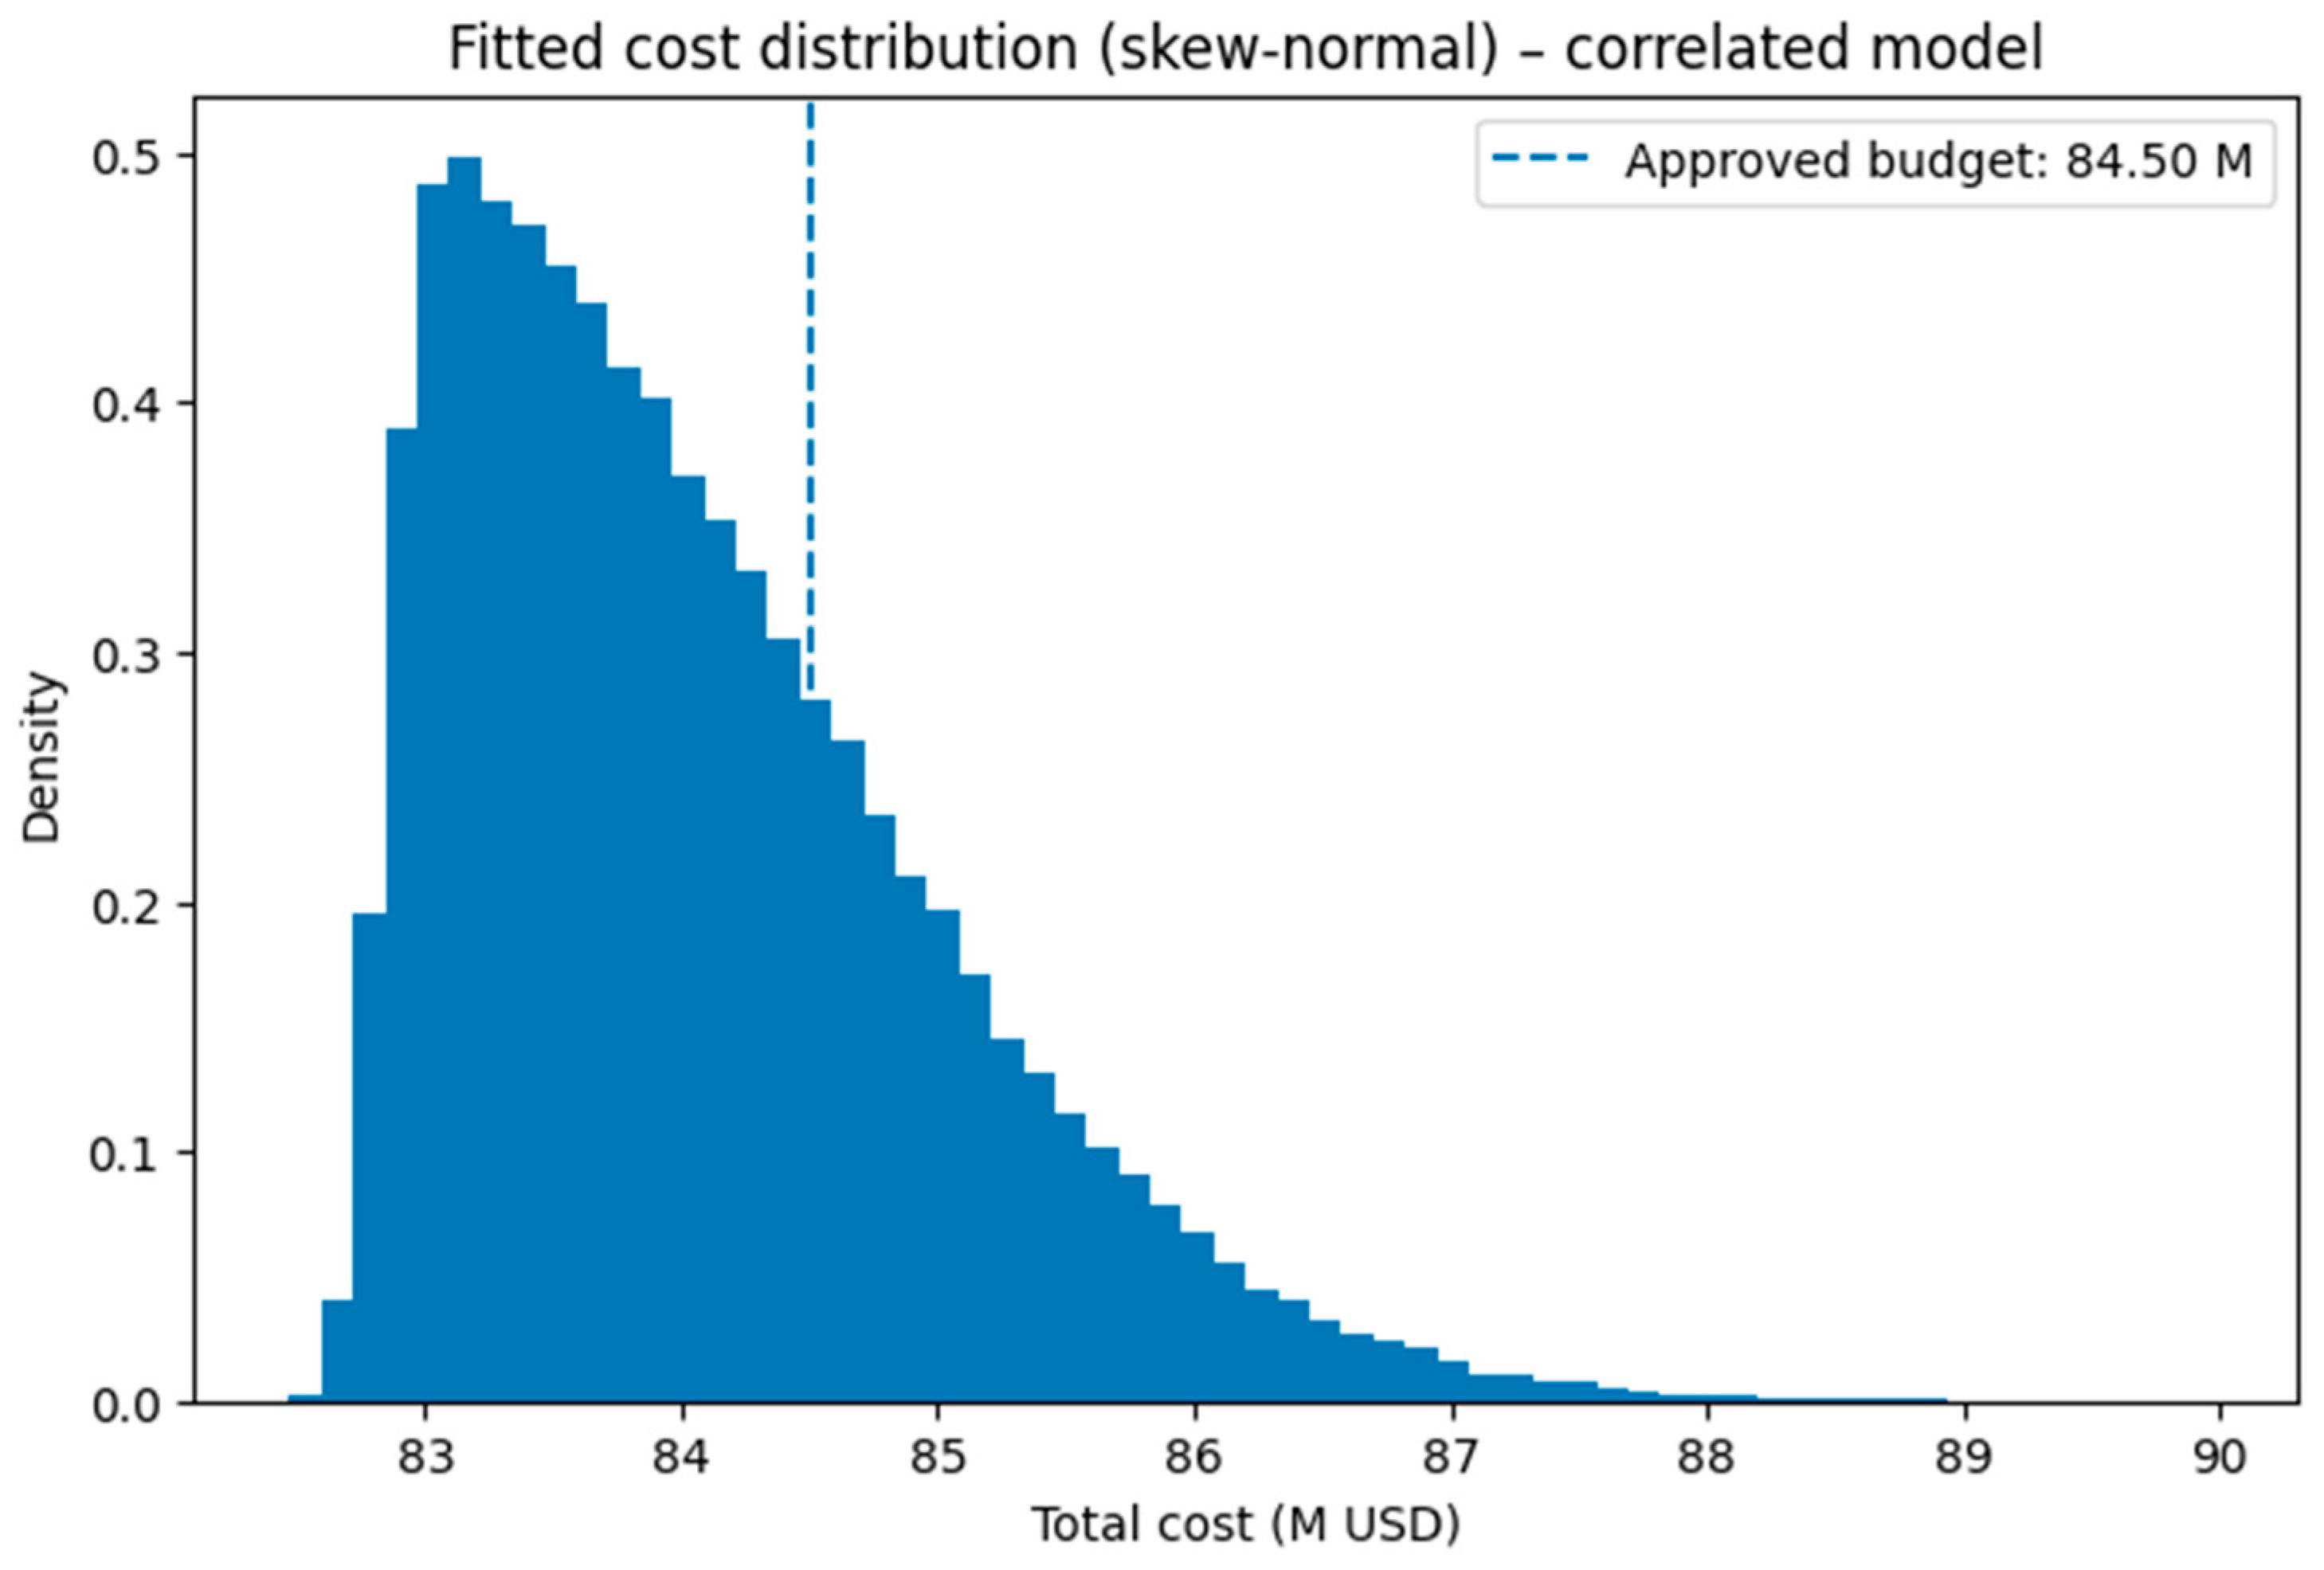
Figure 5.
Cumulative Distribution Function (CDF) of Simulated Total Costs and Budget Exceedance Probability.
Figure 5.
Cumulative Distribution Function (CDF) of Simulated Total Costs and Budget Exceedance Probability.
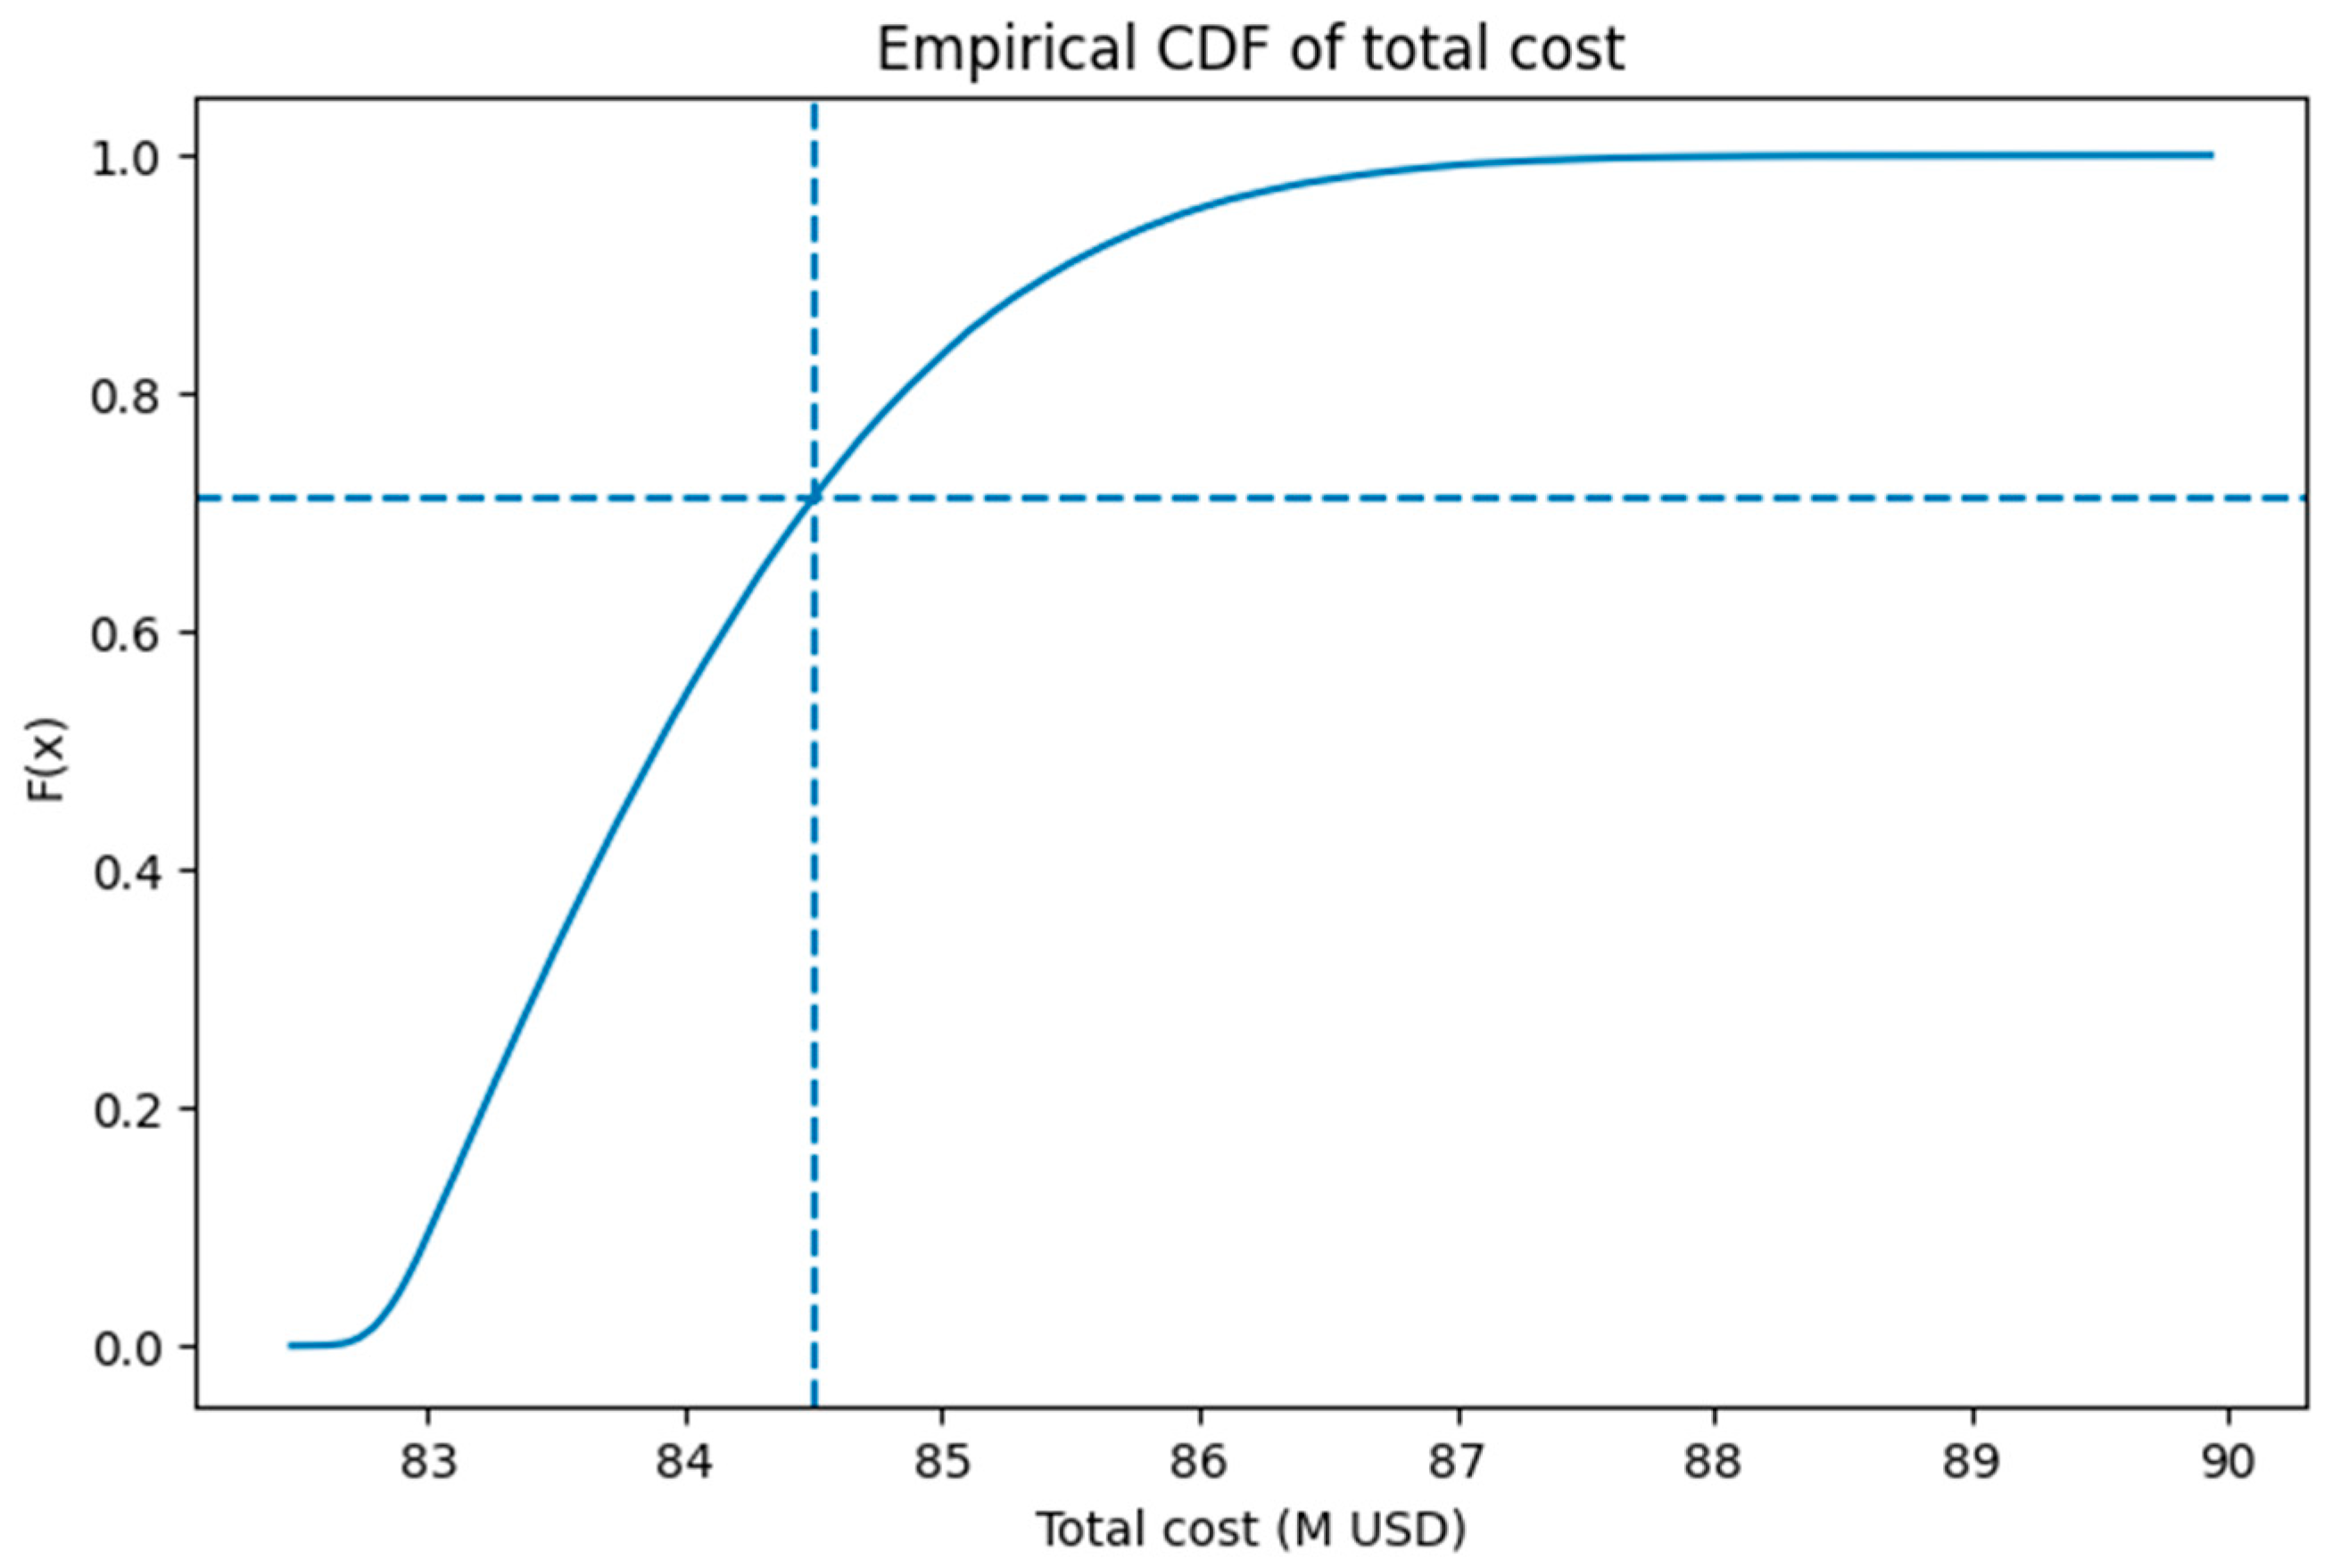
Table 1.
Goodness-of-fit tests for key variables of the stochastic model.
| Variable | Test | Statistic | p-value / Critical level | Result |
|---|---|---|---|---|
| Cement | Kolmogorov–Smirnov | 0.0508 | 0.9467 | Normality not rejected |
| Cement | Anderson–Darling | 0.2534 | 0.7590 (5%) | Normality not rejected |
| Fuel | Kolmogorov–Smirnov | 0.0733 | 0.6293 | Normality not rejected |
| Fuel | Anderson–Darling | 0.6214 | 0.7590 (5%) | Normality not rejected |
| Fine aggregate | Kolmogorov–Smirnov | 0.0543 | 0.9136 | Normality not rejected |
| Fine aggregate | Anderson–Darling | 0.4066 | 0.7590 (5%) | Normality not rejected |
| Coarse aggregate | Kolmogorov–Smirnov | 0.0668 | 0.7405 | Normality not rejected |
| Coarse aggregate | Anderson–Darling | 0.3864 | 0.7590 (5%) | Normality not rejected |
Table 3.
Correlated random variables in the stochastic model
| Fuel | Heavy Machinery | Labor | Fine Aggregate | Coarse Aggregate | Roller | Compaction | |
|---|---|---|---|---|---|---|---|
| Fuel | 1.00 | 0.78 | |||||
| Heavy Machinery | 0.78 | 1.00 | |||||
| Labor | 1.00 | 0.65 | |||||
| Fine Aggregate | 1.00 | 0.83 | |||||
| Coarse Aggregate | 0.83 | 1.00 | |||||
| Roller | 1.00 | 0.71 | |||||
| Compaction | 0.65 | 0.71 | 1.00 |
Disclaimer/Publisher’s Note: The statements, opinions and data contained in all publications are solely those of the individual author(s) and contributor(s) and not of MDPI and/or the editor(s). MDPI and/or the editor(s) disclaim responsibility for any injury to people or property resulting from any ideas, methods, instructions or products referred to in the content. |
© 2025 by the authors. Licensee MDPI, Basel, Switzerland. This article is an open access article distributed under the terms and conditions of the Creative Commons Attribution (CC BY) license (http://creativecommons.org/licenses/by/4.0/).
Copyright: This open access article is published under a Creative Commons CC BY 4.0 license, which permit the free download, distribution, and reuse, provided that the author and preprint are cited in any reuse.


