
Submitted:
15 September 2025
Posted:
16 September 2025
You are already at the latest version
Abstract
For centuries, various efforts have been made to address the costly and environmentally concerning issue of biofouling. Biofouling refers to the formation of a biofilm on submerged surfaces. This problem affects ships, fisheries, petroleum mining operations, water pipeline systems, and other vital industries. Additionally, biofouling challenges the health of marine environments by the transmission of biofilm-generating bacteria by ships beyond their natural habitat, causing algae blooms, and contributing to fish and crab mortality. Historically, solutions for antifouling protection have included toxic compounds, such as heavy metals and tributyl tin (TBT), as well as biocide busters. Previous attempts in hydrophobic polymeric coatings and plant-based solutions have been explored; however, their efficacy is limited by cost and randomicity in the selection process for plants. Intelligent selection of plant materials in antifouling trials was performed, hypothesizing that the use of plants enriched with antioxidants would slow down surface degradation, benefiting bacteria attachment, as well as slow biofilm polymerization, while the use of plants enriched with essential oils would kill bacteria at the surface. Previously, we hae reported a short-term test utilizing Aronia mitschurinii as the first case of our approach for the choice of plants. Here, based on promising initial screenings of various plants and algae with antibacterial and antioxidant properties, comparative results for the holy basil and juvenile ginger, in comparison to Aronia mitschurinii, are presented. Very high content of essential oils and phenolic antioxidants has been reported for these plants, resulting in a significant reduction in biofilm formation in the initial stages.
Keywords:
Antifouling protection
; Aronia mitschurinii
; juvenile ginger
; holy basil
; biofilm formation
; reducing toxicity of antifouling formulations
1. Introduction
Biofouling results from a multi-stage process, including the adhesion and accumulation of bacteria and other microorganisms on submerged surfaces, forming biofilms. The first phase is the environmental oxidation of metal surfaces of submerged portions of ships or platforms. These changes create microenvironments conducive to bacterial attachment and irreversible adhesion to the surface and allow for biofilm maturation [1]. The second phase of biofilm development is the formation of a slime layer. A slime layer is created from the secretion of extracellular polymeric substances (EPS) produced by the microbial cells to solidify the colonization of microorganisms on a surface [2]. EPS are composed of polysaccharides, proteins, and DNA, and are a form of radical polymerization. EPS acts as a medium for nutrient entrapment, thus increasing the availability of nutrients within the slime layer for microbial growth [3]. Protection and nutrient availability result in the recruitment of other organisms, such as algae, barnacles, and various sea sponges, that can attach to the growing biofilm to form a 3D structure with the layer of attached barnacles at the top [4,5].
In recent years, evidence has supported the impacts of environmental conditions both interfering with and supporting the polymerization of microbial biofilms. For example, in water treatment facilities, sulfate-reducing bacteria change their metabolic capabilities under different seasonal conditions, seasonally altering the prevalence of steel-corroding biofilms [6]. A similar study researching the seasonal influence of biofilm formation found more conclusive evidence of biofilm-forming microbial activity while studying Gammaproteobacteria, Alphaproteobacteria, and Betaproteobacteria in the deep Mediterranean Sea during winter and summer months [7].
Biofouling presents significant problems for several industries, including fisheries, recreational boating, cargo, healthcare, food service, and water treatment. Fouling accumulating on the hulls of large shipping vessels degrades the smooth surface and increases friction. An increase in friction can cause a reduction in cruising speed of up to 86% [8]. The losses are extensive for an industry that accounts for approximately 90% of the world trade and is now worth U.S. $4 billion annually [9,10]. The shipping industry comprises 104,304 ships from over 150 nations, and it is easily understandable that fouling is a significant economic problem affecting all layers of trade and countries/consumers worldwide. Fouling can occur on various submerged objects, including cargo vessels, as well as other structures such as heat exchanger surfaces, piping, turbines, solar panels, electrical heating elements, and spark plugs, resulting in similar decreases in efficiency and degradation. With over 490 vessels in its active and reserve fleets, the Navy alone consumes approximately 1.3 billion gallons of fuel annually, for $4–5 billion. This represents approximately 10% of its budget [11].
Fouling can also contribute to ecological changes, as biofilms can introduce invasive foreign species that establish themselves within their structure. The species introduced by fouling can threaten biological and ecological diversity, causing permanent damage to native species by introducing new types of predators, parasites, and diseases. This can alter competition and harm critical marine, estuarine, and lake habitats. Such changes are estimated to have a negative annual financial impact of $80–$ 85 billion for the U.S. fishing industry.
Fouling can also produce diversity and adaptability in biofilm communities. The unique physical and chemical environments within biofilm communities foster substantial biological diversity, resulting in variations in morphology, nutritional requirements, polysaccharide production, and motility among bacterial populations. Interestingly, biofilm communities also foster genetic variation. Oxidative stress from anaerobic conditions within biofilms leads to bacterial DNA breakage/recombination. The diversity produced within biofilms allows further adaptation of bacteria to coexist and adapt to the conditions under which the bacterial colonies interact. This reservoir of diversity enables the survival of bacteria even in the presence of elevated levels of antibiotics and antimicrobial compounds [12]. It contributes to the biofilm's survival, making it challenging to inhibit the growth of biofilm on undesired surfaces [13].
Attempts to prevent fouling have a centuries-long history. Previous antifouling methods employed specialized coatings to defend against biofilm formation. For example, antifouling lead- and copper-based paints date to 1500-300 BC. In the late 18th and early 19th century, copper-, arsenic-, and mercury-based paints were used to prevent fouling. From the 1800s until today, copper is still widely used in antifouling coatings because of its effectiveness. However, copper paint requires constant reapplication, and studies supporting the negative impacts on non-target species are causing a restrictive use of copper-based antifouling paint. In the 1960s, antifouling paints containing tributyltin (TBT) were widely distributed and used because of their effectiveness on broad-spectrum marine microorganisms. However, the use of TBT was banned due to its high toxicity and negative effects on marine ecosystems [14]. For example, studies on oyster farms in France related the use of TBT to the malformation of shells in 80-100% of individual oysters. Following the ban on TBT, “Booster” biocides were introduced in antifouling paint to combat copper-resistant algae. The chemicals incorporated in Booster biocides were most often herbicides and pesticides, such as chlorothalonil, diuron, dichloro-octyl-isoxazole, SiNC-DCOIT, thiocyanatomethylthio-benzothiazole, and copper pyrithione [15]. The broad Booster biocide effects on the growth rate of photosynthetic organisms caused many countries to ban its use.
There is an interest in finding alternative, non-toxic sources for antifouling agents. One recent approach was the utilization of zwitterionic particles as functional biocides. The use of these particles extends from water sterilization to antifouling biocides but largely remains within the realm of machine use [16]. Another attempt utilized dual-charged KCl, KBr, KSCN, K2SO4, and K2HPO4 solutions combined with poly-(sulfobetaine methacrylate) [17]. This application utilizes a porous membrane surface with counterions that demonstrate excellent antifouling properties. The results of this study were comparable to an older 2015 study where the copolymer film, comprised of poly(44-vinyl pyridine-co-ethylene glycol diacrylate), had been anchored to several test substrates. Of the differentiating factors, this test involved using an initiated Chemical Vapor Decomposition (iCVD) release technique. iCVD release is designed to be substrate-independent, thus allowing the antifouling film a more excellent range of application opportunities, including, but not limited to, metals, polymeric membranes, Si, and gold. Despite this, many modern antifouling solutions still rely on synthetic biocides, which, regardless of efficacy, display the risk of possible bioaccumulation of otherwise hazardous substances over time.
Most recently, biofilm prevention methods have centered around synthetic hydrophobic polymer brushes [18]. The antifouling blend demonstrated no noticeable toxicity to brine shrimp, a widely used feed organism in the seafood industry. Another recent solution is Selektope®, a micro-additive to paint and/or copper-based antifouling biocides based on a molecular structure comprising phenyl and imidazole groups [19]. Although the effect is temporary, and the additive is non-toxic, it affects only the last stage of biofilm formation. It only affects barnacles, not other plankton and macro-organisms in biofilm formation.
Biofilm formation, diversity, and adaptability are associated with oxidative stress [20]. By effectively eliminating the radical polymerization of bacterial metabolites using natural radical scavengers, such as antioxidants, or employing natural antiseptics and antibacterial agents to inhibit bacterial colonization, new perspectives on biofouling control emerge [21]. Overall, the free radicals created by oxidation and biofilm formation can be halted in the presence of antioxidants.
Recently, the extract of Aronia mitschurinii encapsulated in poly-methyl methacrylate (PMMA) polymer was reported as a natural and non-toxic solution for antifouling protection [22]. Since two major “role players” in biofilm formation are radicals and bacteria, it was hypothesized that plants with extremely high content of antioxidants would scavenge free radicals. In contrast, plants with extremely high content of antibacterial essential oils and terpenes would kill bacteria at the surface. Aronia is known for its high hydrophilic antioxidant content and strong radical scavenging abilities, and it has demonstrated a pronounced antifouling effect.
Here, a comparison is made of the antifouling effect of Aronia with the results of two other crops rich in essential oils and terpenes but also containing phenolic antioxidants – holy basil (Tulsi) and juvenile ginger, known for gingerol content but also peaking in its phenolic content between weeks 7-11 of its ripening cycle. Extraction, phytochemical characterization, test methodology, and results of post-test analyses using different microscopic techniques are presented.
2. Materials and Methods
Aluminum chloride (99% extra pure, anhydrous granules), 190 proof ethyl alcohol (95.0% ACS spectrophotometric grade), and quercetin hydrate (95%) were purchased from Thermo Fisher Scientific (Waltham, MA). Potassium acetate (Certified ACS Crystalline), potassium chloride (Certified ACS), and anhydrous sodium carbonate (HPLC grade powder) were purchased from Fisher Scientific (Pittsburgh, PA). Folin & Ciocalteu’s phenol reagent and gallic acid monohydrate (ACS reagent grade) were purchased from MP Biomedicals. Sodium acetate (Sigma Ultra, minimum 99.0%) was purchased from Sigma-Aldrich. Conc. HCl, Conc. NaOH, pure ethanol, 95% ethanol, quercetin hydrate, potassium acetate, aluminum chloride, potassium chloride, and sodium acetate were purchased from Fisher Scientific. Distilled water was used for all procedures. Fisher Sci. reagents and solvents—ACS-certified quality were used as is.
Plant source, growing, and sample preparation. The Aronia plants were grown at the University of Maryland’s Wye Research and Education Center (WyeREC) in Queenstown, MD. The soil was a Mattapex-Butlertown silt loam with a 0-2 percent slope and a pH of 6.1. Fruit samples were maintained in a -25 °C freezer before processing and preparing samples. The samples were defrosted for about three minutes before a mortar and pestle were used to grind the Aronia fruit.
11-week-old Blue Ring high-tunnel cultivars of ginger were provided by Virginia State University, as they were previously determined to have the most potent phytochemical content of all available ginger samples.
Tulsi temperate was grown at the University of Maryland Demonstration Farm in Princess Anne, MD, in 20-gallon pots in a soil mixture of Promix, fertilizer, and worm castings. Samples were harvested 11 weeks after planting and kept at -20 °C for crop preservation.
For aronia extractions, a reflux extraction was utilized to mix solid plant materials with a solvent and heat to extract desired compounds. 40 grams of frozen A. mitschurinii berries were weighed, and the berries were allowed to thaw at room temperature before crushing (mortar and pestle). The crushed berries were added to a 250 mL round-bottom flask and 100 mL of ethyl acetate solvent. A magnetic stirrer was added, and rotation on the hotplate was maintained at 100-250 rpm to prevent settling. The temperature was set and maintained at 50 °C using a thermoregulatory probe connected to the hot plate, and the extraction lasted for 72 hours. Following completion, the extract was cooled and vacuum filtered. The vacuum filtration setup consisted of a filter flask, a Buchner funnel, Whatman filter paper, and a vacuum pump.
For the ginger, 10 grams of fresh, juvenile ginger was ground in a food processor until large chunks were no longer visible. In a 250 mL round-bottomed flask, ground ginger was combined with 100 mL of ethyl acetate, and the sample was refluxed for 72 hours at 50℃ for extraction. After which, the sample was vacuum filtered, followed by rotary evaporation to a total volume of 25 mL. This concentrated extract was stored in the freezer at -20℃ until analysis. To prepare the sample for antioxidant analysis, 5 mL of the concentrated extract was roto-evaporated until all ethyl acetate solvent was removed. The remaining product was then reconstituted in 80% methanol and used for UV/Vis assays.
For holy basil, a 1:10 plant-to-solvent ratio was used for extraction purposes. 30 grams of fresh holy basil were weighed in three equal parts: flowers, leaves, and stems. The ground sample was added to a 500 mL round-bottom flask, and 300 mL of ethyl acetate was added. A magnetic stirrer was added, and rotation was maintained between 500-700 rpm. The temperature was set and maintained at 50 ºC, and the extraction was run for 72 hours. This initial extract was cooled, vacuum-filtered, and stored until it was made into aliquots.
The purpose of preparing diluted extracts is to study the relationship between the concentration of extracts and the antifouling efficacy. This is needed to prove that the protective effect originates in the plant extract and not in the solvent or polymer used in the antifouling formulation. Aliquots were made to demonstrate the correlation between the concentration of plant extract in the sample and its antifouling activities, proving that the activity is due to the plant and not the polymer coating. A dilution was performed on the original plant extract to achieve various concentrations via serial dilutions. All aliquots were stored in 15 mL centrifuge tubes at -20 °C until analysis.
The phytochemical screening of ginger samples was carried out using methods described by Kela et al. [23] . The procedures performed included the detection of alkaloids, flavonoids, tannins, saponins, glycosides, steroids, anthraquinones, phenols, and oxalates.
A gas chromatography-mass spectrometer (GC-MS) (Shimadzu GC-MS machine with helium as a carrier gas, equipped with a standard VF-5 fused silica capillary column (30 m × 0.25 mm, film thickness 0.25 μm) configured with a Flow rate of 1mL/min at 8.2317psi. A temperature ramp of 3℃/min until reaching a final temperature of 240℃ was utilized to generate chromatographs for extracts to determine present terpenes and essential oils. GC-MS chromatograms were created and taken for lyophilized samples. Chromatograms were integrated such that identified compounds had more than 90% match in similarity based on m/z ratio, and the base area was no less than 400,000.
Anthocyanin content was calculated using a method previously performed by Lee et al [24]. Two sets of samples were made, with each set using a separate buffer. Set one utilized a 0.025 M potassium chloride buffer adjusted to a pH of 1 using HCl, and set two utilized a 0.4 M sodium acetate buffer solution at a pH of 4.5. Each sample was diluted in a ratio of 1 part sample and 199 parts buffer. In triplicate, absorption was measured on a Cary 60 UV-Vis spectrophotometer at 520 and 700 nm. The following formula was used to calculate absorbance (A):
A=(A520-A700) pH1.0-(A520-A700) pH4.5A=(A520-A700) pH1.0-(A520-A700) pH4.5.
The total anthocyanin concentration per sample was calculated using the following formula:
where MW is the molecular weight of cyanidin-3-O-glucoside (449.2 g/mol), DF is the dilution factor, and ε is the molar extinction coefficient of cyanidin-3-glucoside (ε = 26 900 L cm−1 mol−1). Anthocyanin content is calculated in cyanidin-3-glucoside equivalents in mg/L.
A×MW×DF×1000)/(εx1)
Flavonoid content was measured using a method based on that developed by Chang et al [25]. A quercetin stock solution was made from quercetin hydrate and used to create a standard curve on a Cary 60 UV-Vis spectrophotometer. 125 μL of the sample was combined with 375 μL of distilled water, 25 μL of potassium acetate, 25 μL of 10% aluminum chloride, and finally, 950 μL of distilled water to increase the total volume. The samples were incubated at room temperature for thirty minutes and then analyzed at 415 nm on the Cary 60 UV-Vis spectrophotometer in triplicate. Flavonoid concentration was calculated as µg Quercetin Equivalents/mL. The calculated concentration was then converted into mg Quercetin Equivalents based on the sample volume.
Polyphenol content was measured using a method outlined by Nowak et al [26]. A calibration curve was created with a gallic acid standard. Twenty microliters of sample, 1580 microliters of distilled water, and 100 microliters of Follins Reagent were combined. The samples were incubated at room temperature for five minutes. After incubation, 300 microliters of 20% W/V sodium carbonate were added. Samples were then incubated again at 40°C. Samples were measured on a Cary60 UV-Vis Spectrophotometer at 765nm in triplicate. All polyphenol concentrations are expressed as gallic acid equivalents/mL of juice.
Tannins were determined by standard procedures for colorimetric analysis of plant material described in the literature [27,28]. The standard calibration was created using tannic acid solutions (50-500mg/L, R2=0.9987). To a small vial, 300uL of liquid sample was combined with 100 μL of 0.01M tetrazolium blue chloride, and 100 μL of 0.2M sodium hydroxide solution. Following a brief incubation period, the samples were then combined with 1500 μL of 80% ethanol in water, and the absorbance was measured at 527nm. The Total Tannin Concentration (TTC) in mg of tannic acid equivalent (TAE)/g of Dry Weight (DW) or Fresh Weight (FW) was then determined using the following equation:
where A = average absorbance, V = collected volume of extract, m = mass of sample used for extract, and DF = dilution factor.
Water samples were gathered at GPS-controlled locations, including Chincoteague Oceanside for the saltwater aquarium and Pocomoke River for the freshwater aquarium. The water parameters measured at the time of sampling are presented in Table 1. Basic water parameters were collected, which included pH, temperature, salinity, oxidation-reduction potential, dissolved oxygen, and conductivity. Water parameters were collected utilizing an AZ Instruments water quality meter, model AZ-86031. After collecting, the water samples were heated and aerated to ensure the preservation of bacterial microbial communities.
Aquirium's water composition. Two methods – manual and automatic - were used to ensure that the aquarium's water composition and mineral content remained constant during the entire test time. This action is necessary because water will naturally evaporate from the surface of aquariums as the experiment progresses. In contrast, minerals, organics, and bacterial content will not evaporate, and as a result, their concentration will increase. In the manual method, the control of the water sample and the current sample of water from the aquarium are measured using the standard water probe (M&A INSTRUMENTS, model AZ-86031 5 in 1 Water Quality Meter Dissolved Oxygen Tester PH Meter PH Conductivity Salinity Temperature Meter). Then, distilled water is added to aquariums by increments of 1 L, and measurements are re-taken after each addition. The addition continues until the water parameters in the aquarium are approximately identical to those in the standard. Table 2 illustrates a typical example of measuring standards and water in aquariums after all the needed additions.
To determine how often the manual dilution needs to be performed, the dynamics of water evaporation in aquariums as a function of time was monitored. After measuring water level changes in aquariums daily for five days and repeating these measurements three times, it was concluded that aquariums stored in the lab at room temperature, with set turbulence, would lose an average of 0.5 inches every 48 hours. Automatic water level control was achieved using the commercially available automatic water refill system. Manual data was used to set up the pace of automatic water refills.
Preparation of slides for antifouling tests. Samples vary by the type of plant extract and its dilution. However, the procedure of mixing with polymethyl methacrylate (PMMA), coating the microscope slides using a spin coater, and drying the sample slides was done identically, as described below:
10 mL of extract was transferred into a 20 mL vial, where 1 gram of Poly (methyl methacrylate) (PMMA) was slowly added. To facilitate the blending of PMMA, the samples were stirred and heated to 50°C. The solvent and PMMA were stirred for approximately one hour to ensure a homogenous solution was made. After the slides were labeled, they were individually placed on a Chemat KW-4A Spin coater, and 200 µL of sample was dispensed on top of the slide while it was rotating. A Chemat KW-4A Spin Coater was utilized to produce thin films. The spin coater was used to rotate samples with a liquid blend present at high speeds to spread the blend over the surface of the slide before drying. The spin coater is operated at one speed for 10 seconds at 2000 RPM, and the polymer is dispensed between 3-5 seconds. The slide was then carefully removed from the spin coater and placed on a drying rack for 48 hours before microscopic images of the slides and the antifouling tests were taken.
Antifouling Test Design. The short-term test involves exposing the slides to filtered marine water for a short period of time. This test is used to determine the bacteria's initial attachment to the slide's surface. A 3D-printed slide holder (Figure 1) was designed using a 3D modeling website called TinkerCAD and printed using a Dremel 3D45 Printer. The slide holder was designed to securely hold 6 slides for a single control and 5 replicates. containers utilized for submerging test slides within water are leak-proof, clear Rubbermaid food storage containers with dimensions of 11x7.6x3.1 inches.
After completing the short-term tests, the slides were rinsed in deionized water to remove excess sediment and dye. Three beakers were prepared, each filled with deionized water, and slides were carefully dipped to prevent further delamination. To maintain cleanliness and expedite the cleaning procedure, the water in the beakers was regularly recycled. After this dipping process three times, the slides were left to air-dry for 72 hours within an air-tight container, preparing them for microscopic analysis.
Another method is using pretreated water with methylene blue, a bacterial stainer that can be detected and quantified using a phase contrast microscope. For this test, water is pre-treated with methylene blue. The rest of the test and post-test processing are the same as described above.
Surface analysis was performed using phase contrast microscopy and 3D profiling methods, as described in previous antifouling research on Aronia mitschurinii [22]. ImageJ software was used to calculate bacterial precipitation using the same methodology.
Limits of detection. The limit of flavonoid detection was measured using a guideline produced by the Clinical and Laboratory Standards Institute. The quercetin stock solution in 95% ethanol was prepared in triplicate with a concentration of 1500mg/L measured against a blank of 95% ethanol. The sample was serially diluted by a factor of two until the absorbance measurements did not change. The final concentration was defined as the limit of detection for flavonoids. Absorbance was measured at 510 nm. The LOD can be found in the supplemental materials file as Figure S1.
For the limit of detection for polyphenols, the Gallic Acid stock solution in 20% ethanol was prepared in triplicate with a concentration of 1000mg/L measured against a blank of distilled water. The sample was serially diluted by a factor of two until the absorbance measurements did not change. The final concentration was defined as the limit of detection for polyphenols. Absorbance was measured at 765 nm. The LOD can be found in supplemental information as Figure S2.
For the limit of detection of tannins, a Tannic Acid stock solution in 20% ethanol was prepared in triplicate with a concentration of 1500 mg/L, measured against a blank of distilled water. The sample was serially diluted by a factor of two until the absorbance measurements did not change. The final concentration was defined as the limit of detection for tannins. Absorbance was measured at 527 nm. The LOD can be found in supplemental information as Figure S3.
The limit of detection for anthocyanins was determined through the serial dilution of pure aronia juice with distilled water. Dilutions were performed until the absorbance reached zero, and a non-linear relationship was found in concentration. Absorbance was measured at 520 nm and 700 nm. The LOD can be found in Figure S4 in the supplemental information file.
Statistical approach. Each experiment was repeated three times, and each sample for individual measurement was performed three times. The data were then analyzed statistically using Mean ± Standard Error, t-test, and one-way analysis of variance (ANOVA) within a 95% confidence interval. Values of p < 0.05 were considered significant.
3. Results and Discussion
Plants were selected based on the phytochemical screening of various crops. After performing an express one to two-week antifouling test with samples prepared by the encapsulation of extracts of super-fruits, medical herbs and roots into biocompatible polymethyl methacrylate (PMMA) in ethyl acetate as a solvent, and post-test analysis of precipitation using profilometric and microscopic methods, The three most promising candidates for the long-term testing have been selected: Aronia (Aronia mitschurinii) – our first plant that was used as a model for the developing of testing and coating methodology, results for which have recently been reported,22 holy basil, and juvenile (11-week-old) ginger. Along with samples prepared from extracts of these plants, control samples were used containing only polymer and also examined the surface of our samples before the test to determine the background of natural surface imperfections.
Two dilution series for extracts of each plant were performed: one series was used to encapsulate extracts into PMMA and prepare coated microscopic slides for short and long-term tests; the other series with the same dilutions was used for the phytochemical characterization of the same diluted extracts. The dilutions of extracts were performed to ensure that the protective antifouling effect of our samples is due to components of the extracts as opposed to solvents and/or polymers used for the coating formulations.
Phytochemical screening of ginger extracts revealed the presence of flavonoids, polyphenols, essential oils, tannins, carbohydrates, alkaloids, and saponins. For aronia, phytochemical screening detected flavonoids, phenolics, carbohydrates, tannins, and glycosides. Finally, for holy basil, essential oils, diterpenes, flavonoids, and tannins are present in extracts.
The initial attempts to conduct UV/-Vis determination of the total of anthocyanins, polyphenols, flavonoids, and tannins in the ethyl acetate solution failed for most of the samples. This is because the original procedures were developed for water/ethanol solutions of plant extracts, while ethyl acetate was used, with the much higher solubility of PMMA in it. The solubility of color-developing reagents in ethyl acetate is much lower than in water/ethanol solutions. As a result, before all measurements, ethyl acetate was gently evaporated from all samples and replaced by the same amount of a mixture of 80% methanol and 20% water. Further analysis was performed in this solvent mixture. This was only performed for the determination of exact concentrations of active components in the extracts, while for the antifouling formulation, ethyl acetate was used as a solvent. The use of five different dilutions allows us to show that the antifouling effect originates in the extracts, as opposed to the solvent or polymer. Observing a decrease in protection with diluted extracts indicates this.

Table 3.
Influence of Dilution Factor on Phytochemical Concentration.
| Crop: Dilution | Polyphenols (mg GAE/g) | Flavonoids (mg QE/g) | Tannins (mg TAE/g) |
| Holy Basil: 1X | 3.42 ± 0.03 | 1.91 ± 0.05 | 0.92 ± 0.01 |
| Holy Basil: 5x | 0.36 ± 0.05 | 0.21 ± 0.00 | 0.00 |
| Ginger: 1X | 4.57 ± 0.08 | 3.50 ± 0.07 | 1.40 ± 0.03 |
| Ginger: 5x | 0.47 ± 0.02 | 0.32 ± 0.09 | 0.02 ±0.02 |
The dilution process for aronia berries with full phytochemical characterization of diluted extracts has been previously described [22]. In addition to the antioxidant groups found in holy basil and ginger, aronia also has a high concentration of anthocyanins. Phytochemical analysis results indicate that aronia has the highest concentrations of phenolic antioxidants when compared to holy basil and ginger. Ginger is shown to have higher concentrations of phytochemicals compared to holy basil in the most concentrated extract; however, they are comparable at the 16x dilution. The complete calculation of phytochemicals per dilution can be found in the supplemental information as figures S5-S10
GC-MS results for the most concentrated extract of plants are presented in Figure 2 for juvenile ginger and in Figure 3 for holy basil. Ginger and holy basil have the highest content and the widest variety of essential oils and terpenes, while previously it has been shown that aronia has a very limited amount of them [22].
Short-term antifouling tests were performed on glass slides coated with the antifouling formulations containing ethyl acetate as a solvent, PMMA, and different dilutions of plant extracts. Tests were performed for three weeks of five dilutions of holy basil and juvenile ginger, and then compared with the similar results obtained for aronia previously. As described in the Materials and Methods part, tests were conducted in salt- and fresh-water samples, in two series – one just on water samples for further observation using phase contrast and laser microscopes, and in water with methylene blue – for staining bacteria in water before it migrates to the surface and develops the biofilms. Further microscopic observations allow for the estimation of the number of bacteria in biofilms, which is approximately proportional to the total amount of biofilm. After the end of the test, the slides were gently washed in distilled water and dried prior to microscopic observation and quantification. All images were observed at five random observation points of each slide. An example of the image for each formulation is presented below in tables 5, 7, 9, and 11, while the average of the five observation points quantification of precipitation using ImageJ software is presented in tables 6, 8, 10, and 12, respectively.
For holy basil extracts, Table 4 shows examples of images obtained with the phase-contrast microscope. In such a type of observation, the overall precipitation on the surface is pictured. Images in Table 4 are from a single observation point of the slide. However, 5 observation points were taken, and the result was processed using ImageJ software and averaged between different observation points. This quantitated result is presented in Table 5.
The first row of Table 4 shows slides before they were submerged in their respective water samples. Normal cracks, bubbles, and small amounts of precipitation were seen before submerging the slides. Control slides, made with only PMMA and ethyl acetate, exhibited poor protection against precipitation. When observing freshwater slides, holy basil showed traits of a strong anti-fouling agent until 8x dilution, where precipitation became extreme. However, in saltwater conditions, holy basil did not perform as effectively, even past the 2x dilution.
Table 5 shows the precipitation count per slide as an average of five observation points, with a standard deviation taken per slide as calculated by ImageJ. As a possible result of less antifouling protection, an accumulation of biofilm allows substances to stick to slides during the short-term tests. In both fresh and saltwater samples, precipitation increased with increased dilution of plant extract, indicating that the protection effect is correlated with the extract and not with solvent or PMMA, for which the concentration was the same at all dilutions. For saltwater samples, the base amount of precipitation count was significantly higher than for freshwater samples, possibly due to the presence of traces of salt crystals on the slides. In salt water, while the trend was to increase the precipitation with a decrease in the concentration of the extract, the overall precipitation was higher.
Table 6 displays images taken from the same holy basil slides, utilizing either saltwater or freshwater samples, with methylene blue added. This stain allows for observation under the microscope of bacteria that migrated from the water and formed biofilm. While this method only shows bacteria colonies in the biofilm precipitate, the bacteria's metabolites polymerize on the surface into the biofilm. An increased number of bacterial colonies indirectly indicates weaker antifouling protection.
Table 7 shows the precipitation count per slide as an average with a standard deviation of three observation points taken per slide, as calculated by ImageJ for slides stained with methylene blue. The trends with bacteria observation overall resemble those observed for the overall precipitation. However, when observing bacteria only, holy basil performs better in saltwater by significant margins up to a 16x dilution factor.
For the samples prepared with a different dilution of the extract of juvenile ginger, Table 8 shows examples of images obtained with the phase-contrast microscope and shows the overall precipitation on the surface. Images in Table 8 are from a single observation point of the slide, while in Table 10, the averaging of five observation points using ImageJ software is presented.
Table 8 demonstrates the primary relationship between the extract/polymer blend and overall bacterial growth. In the saltwater experiment, it can be noted that there was a significant buildup of salt crystals on slides of all concentrations. The increased surface area may have resulted in the increased precipitation over the freshwater slides. However, despite this, as the concentration of ginger extract decreased in both cases, the amount of bacterial growth increased as expected.
Table 9 shows the corresponding ImageJ calculations to Table 8. It can be observed that bacterial precipitation counts are increased in saltwater samples compared to freshwater samples, which were observed in holy basil extracts.
Table 10 highlights the capabilities of ginger in specifically deterring bacterial growth, illustrated by the coloration of bacterial colonies with methylene blue. Freshwater treatments showed a very linear relationship in that as the concentration of the extract was further diluted, the amount of bacterial precipitate increased correspondingly. Saltwater treatments proved to be obstructed by the delamination of the PMMA polymer. Potential causes of this delamination may be linked to the content of methylene blue and/or the precipitation of salt crystals on the surface of the microscope slide. However, in the experiment with plain saltwater, Table 4, it can be seen that there was ample lamination on the saltwater slides, allowing for proliferation. This leads to the conclusion that delamination in the methylene blue experiment may have been caused by other factors.
ImageJ analysis in Table 11 confirms the effectiveness of higher-concentration extracts in preventing precipitation development. Despite the delamination of the saltwater slides, the data obtained still support the linear relationship between concentration and precipitation.
The overall results indicate that both holy basil and juvenile ginger are effective in antifouling protection and demonstrate almost the same level of performance in short-term antifouling tests. Aronia has shown a bit stronger protective effect [22].
4. Conclusions
The short-term tests' data suggest that Aronia mitschurinii, holy basil, and juvenile ginger may serve as effective, non-toxic antifouling agents. Moreover, it has been proven that the protective effect originates in the extract and not in the polymer of the solvent by preparing samples with different dilutions of the extract. In all experiments, the more diluted the sample, the less effective it was in the antifouling tests. Out of the examined plants, aronia has a slightly stronger effect, as compared to holy basil and ginger samples. However, all their plants have demonstrated a significant antifouling effect at their most concentrated extracts, as compared to unprotected surfaces and surfaces covered by polymer only.
Short-term tests indicate that ginger shows higher protection than holy basil when comparing bacterial precipitation through methylene blue.
Testing three different plant materials, all chosen based on the premise that plants high in antioxidants, which are radical scavengers, would slow down polymerization processes during the biofilm formation, while plants rich in essential oils would kill bacteria, and demonstrating the positive effect of all three of them, supports the original premise. This helps to step from random plant selection and screening to a much more precise selection of plants with high antifouling potential.
Current development is focused on testing individual antioxidants and essential oils detected in aronia, holy basil, and juvenile ginger as antifouling agents to determine if they are as effective as the original extracts. As well, using these individual isolates allows for a significant increase in the concentration of antifouling agents in the formulations, as well as ease of future technology transfer. These experiments are currently ongoing and will be reported in the future.
Supplementary Materials
The following supporting information can be downloaded at the website of this paper posted on Preprints.org, Figure S1: Limit of Detection for Quercetin; Figure S2: Limit of Detection of Gallic Acid; Figure S3: Limit of Detection for Tannic Acid; Figure S4: Limit of Detection for Anthocyanins; Figure S5: Holy Basil Polyphenols per Dilution; Figure S6: Ginger Polyphenols per Dilution; Figure S7: Holy Basil Flavonoids per Dilution; Figure S8 Ginger Flavonoids per Dilution; Figure S9: Holy Basil Tannins per Dilution; Figure S10: Ginger Tannins per Dilution.
Author Contributions
Conceptualization, V.V. and W.W.; methodology, V.V, W.W., and R.B.-M.,; software, W.W., R.B.-M.; validation, W.W., V.V.; formal analysis, E.C., K.B., B.S., and L.O.; investigation, V.V.; resources, V.V.; data curation, E.C, V.V.; writing—original draft preparation, E.C., V.V.; writing—review and editing, E.C., V.V.; visualization, V.V.; supervision, V.V.; project administration, V.V.; funding acquisition, V.V. All authors have read and agreed to the published version of the manuscript
Funding
This research is supported by the Department of the NAVY MSI grant # N00014-21-1-2756, USDA-NIFA UMES Evans-Allen Grants, accession numbers 1016197 and 7004559, USDA-NIFA CBG, grant number 2021-38821-34601, USDA-NIFA, grant number 2024-38821-42106, and Title III funds of the University of Maryland Eastern Shore.
Data Availability Statement
All data are available in this paper or in the supplemental materials.
Acknowledgments
The authors thank Dr. Andrew G. Ristvey from the Wye Research and Education Center in Queenstown, MD, for growing aronia, holy basil, and juvenile ginger samples for this project. We also would like to thank Prof. Evgueni Nesterov from the Department of Chemistry, Northern Illinois University, for allowing us to use a profilometer and for his valuable insights into the methods of post-test analysis of surfaces. R.B.-M. and L.O. would like to thank the Honors program of the University of Maryland Eastern Shore for travel support. We would also like to thank undergraduate students Ms. Jasmin McKennie, Ms. Kanaya Streeter, and Mr. William Harrod for their minor contributions.
Conflicts of Interest
The authors declare no conflicts of interest. The funders had no role in the design of the study, in the collection, analysis, or interpretation of data, in the writing of the manuscript, or in the decision to publish the results.
Abbreviations
The following abbreviations are used in this manuscript:
| EPS | Extracellular polysaccharides |
| DNA | Deoxyribonucleic acid |
| AF | Antifouling |
| PLL-G-PEG | Poly(L-lysine)-graft-poly(ethylene glycol) |
| UV-VIS nm |
Ultraviolet-visible-spectrophotometry Nanometers |
| QSI | Quorum Sensing Inhibitor |
| SEM | Scanning Electron Microscopy |
| EIS | Energy Dispersive X-ray Spectroscopy |
| SW | Saltwater |
| FW | Fresh water |
| TDS | Total Dissolved Solids |
| DO | Dissolved Oxygen |
| KOH | Potassium Hydroxide |
| PMMA | Polymethyl Methacrylate |
| LOD mg |
Limit of Detection Milligrams |
| C3G GAE TTC QE |
Cyanidin-3-Glucoside Gallic Acid Equivalents Total Tannin Concentration Quercetin Equivalents |
References
- Sergey Dobretsov; Rittschof, D. Biofouling and Antifouling: Interactions between Microbes and Larvae of Invertebrates. International Journal of Molecular Sciences 2023, 24 (7), 6531–6531. [CrossRef]
- Sharma, S.; Mohler, J.; Mahajan, S. D.; Schwartz, S. A.; Bruggemann, L.; Aalinkeel, R. Microbial Biofilm: A Review on Formation, Infection, Antibiotic Resistance, Control Measures, and Innovative Treatment. Microorganisms 2023, 11 (6), 1614. [CrossRef]
- Mahto, K. U.; Vandana; Priyadarshanee, M.; Samantaray, D. P.; Das, S. Bacterial Biofilm and Extracellular Polymeric Substances in the Treatment of Environmental Pollutants: Beyond the Protective Role in Survivability. Journal of Cleaner Production 2022, 379, 134759. [CrossRef]
- Nicky Rahmana Putra; Ismail, A.; Dian Purnama Sari; Nurcholis Nurcholis; Totok Triputrastyo Murwatono; Rina, R.; Yuniati Yuniati; Endah Suwarni; Agus Sasmito; Putri Virliani; Johar, S.; Irianto Irianto; Alfa akustia Widati. A Bibliometric Analysis of Cellulose Anti-Fouling in Marine Environments. Heliyon 2024, 10 (7), e28513–e28513. [CrossRef]
- Qian, P.-Y. .; Lau, S. C. K.; Dahms, H.-U. .; Dobretsov, S.; Harder, T. Marine Biofilms as Mediators of Colonization by Marine Macroorganisms: Implications for Antifouling and Aquaculture. Marine Biotechnology 2007, 9 (4), 399–410. [CrossRef]
- Abdulina, D. R.; Kurmakova, I. N.; Bondar, E. S.; Demchenko, N. R.; Bondarenko, A. I. Seasonal Dynamics of Bacteria in Corrosive Biofilms Formed on the Surface of Wastewater Treatment Plants. Journal of Water Chemistry and Technology 2019, 41 (1), 44–51. [CrossRef]
- Nikoleta Bellou; Antonio, J.; Franciscus Colijn; Herndl, G. J. Seasonality Combined with the Orientation of Surfaces Influences the Microbial Community Structure of Biofilms in the Deep Mediterranean Sea. Deep Sea Research Part II Topical Studies in Oceanography 2019, 171, 104703–104703. [CrossRef]
- Callow, J. A.; Callow, M. E. Trends in the Development of Environmentally Friendly Fouling-Resistant Marine Coatings. Nature Communications 2011, 2 (1). [CrossRef]
- Papers - 2019 - Pentagon Fuel Use, Climate Change, and the Costs of War | Costs of War. The Costs of War. https://watson.brown.edu/costsofwar/papers/ClimateChangeandCostofWar.
- Dyck, A. J.; Sumaila, U. R. Economic Impact of Ocean Fish Populations in the Global Fishery. Journal of Bioeconomics 2010, 12 (3), 227–243. [CrossRef]
- Office of the Under Secretary of Defense (Comptroller). Defense.gov. https://comptroller.defense.gov/.
- Ferreira, S.; Fraqueza, M. J.; Queiroz, J. A.; Domingues, F. C.; Oleastro, M. Genetic Diversity, Antibiotic Resistance and Biofilm-Forming Ability of Arcobacter Butzleri Isolated from Poultry and Environment from a Portuguese Slaughterhouse. International Journal of Food Microbiology 2013, 162 (1), 82–88. [CrossRef]
- Lewis, K. Riddle of Biofilm Resistance. Antimicrobial Agents and Chemotherapy 2001, 45 (4), 999–1007. [CrossRef]
- Yebra, D. M.; Kiil, S.; Dam-Johansen, K. Antifouling Technology—Past, Present and Future Steps towards Efficient and Environmentally Friendly Antifouling Coatings. Progress in Organic Coatings 2004, 50 (2), 75–104. [CrossRef]
- Guardiola, F. A.; Cuesta, A.; Meseguer, J.; Esteban, M. A. Risks of Using Antifouling Biocides in Aquaculture. International Journal of Molecular Sciences 2012, 13 (2), 1541–1560. [CrossRef]
- Ziemann, E.; Tali Coves; Levin, O.; Bernstein, R. Zwitterion Polymer Brushes on Porous Membranes: Characterization, Tribology, Performance, and the Effect of Electrolyte Anions. ACS Applied Polymer Materials 2020, 2 (11), 4613–4625. [CrossRef]
- Shafi, H. Z.; Wang, M.; Gleason, K. K.; Khan, Z. Synthesis of Surface-Anchored Stable Zwitterionic Films for Inhibition of Biofouling. Materials Chemistry and Physics 2020, 239, 121971. [CrossRef]
- Zeuthen, C. M.; Shahrokhtash, A.; Sutherland, D. S. Nanoparticle Adsorption on Antifouling Polymer Brushes. Langmuir 2019, 35 (46), 14879–14889. [CrossRef]
- Andersson Trojer, M.; Movahedi, A.; Blanck, H.; Nydén, M. Imidazole and Triazole Coordination Chemistry for Antifouling Coatings. Journal of Chemistry 2013, 2013, 1–23. [CrossRef]
- Boles, B. R.; Singh, P. K. Endogenous Oxidative Stress Produces Diversity and Adaptability in Biofilm Communities. Proceedings of the National Academy of Sciences 2008, 105 (34), 12503–12508. [CrossRef]
- Ong, K. S.; Mawang, C. I.; Daniel-Jambun, D.; Lim, Y. Y.; Lee, S. M. Current Anti-Biofilm Strategies and Potential of Antioxidants in Biofilm Control. Expert Review of Anti-infective Therapy 2018, 16 (11), 855–864. [CrossRef]
- Bratley, K.; Cable, E.; Weaver, W.; and Volkis, V.V. Aronia mitschurinii Encapsulated into Biocompatible Polymers as an Effective Solution for Antifouling Protection. ACS Omega 2025, Submitted.
- Lee, J.; Durst, R. W.; Wrolstad, R. E.; Eisele, T.; Giusti, M. M.; Hach, J.; Hofsommer, H.; Koswig, S.; Krueger, D. A.; Kupina;, S.; Martin, S. K.; Martinsen, B. K.; Miller, T. C.; Paquette, F.; Ryabkova, A.; Skrede, G.; Trenn, U.; Wightman, J. D. Determination of Total Monomeric Anthocyanin Pigment Content of Fruit Juices, Beverages, Natural Colorants, and Wines by the PH Differential Method: Collaborative Study. Journal of AOAC INTERNATIONAL 2005, 88 (5), 1269–1278. [CrossRef]
- Chang, C.-C. .; Yang, M.-H. .; Wen, H.-M. .; Chern, J.-C. . Estimation of Total Flavonoid Content in Propolis by Two Complementary Colorimetric Methods. Journal of Food and Drug Analysis 2020, 10 (3). [CrossRef]
- Nowak, D.; Gośliński, M.; Wojtowicz, E. Comparative Analysis of the Antioxidant Capacity of Selected Fruit Juices and Nectars: Chokeberry Juice as a Rich Source of Polyphenols. International Journal of Food Properties 2015, 19 (6), 1317–1324. [CrossRef]
- Amin, A. S. Utilization of Tetrazolium Blue for the Colorimetric Assay of Tannins in Tea. Microchimica Acta 1997, 126 (1-2), 105–108. [CrossRef]
- Antoine, M. -L; Simon, C.; Pizzi, A. UV Spectrophotometric Method for Polyphenolic Tannin Analysis. Journal of Applied Polymer Science 2003, 91 (4), 2729–2732. [CrossRef]
Figure 1.
Slide holder design using TinkerCAD.

Figure 2.
GC-MS analysis for the extract of juvenile ginger with description of main essential oils and terpenes.
Figure 2.
GC-MS analysis for the extract of juvenile ginger with description of main essential oils and terpenes.
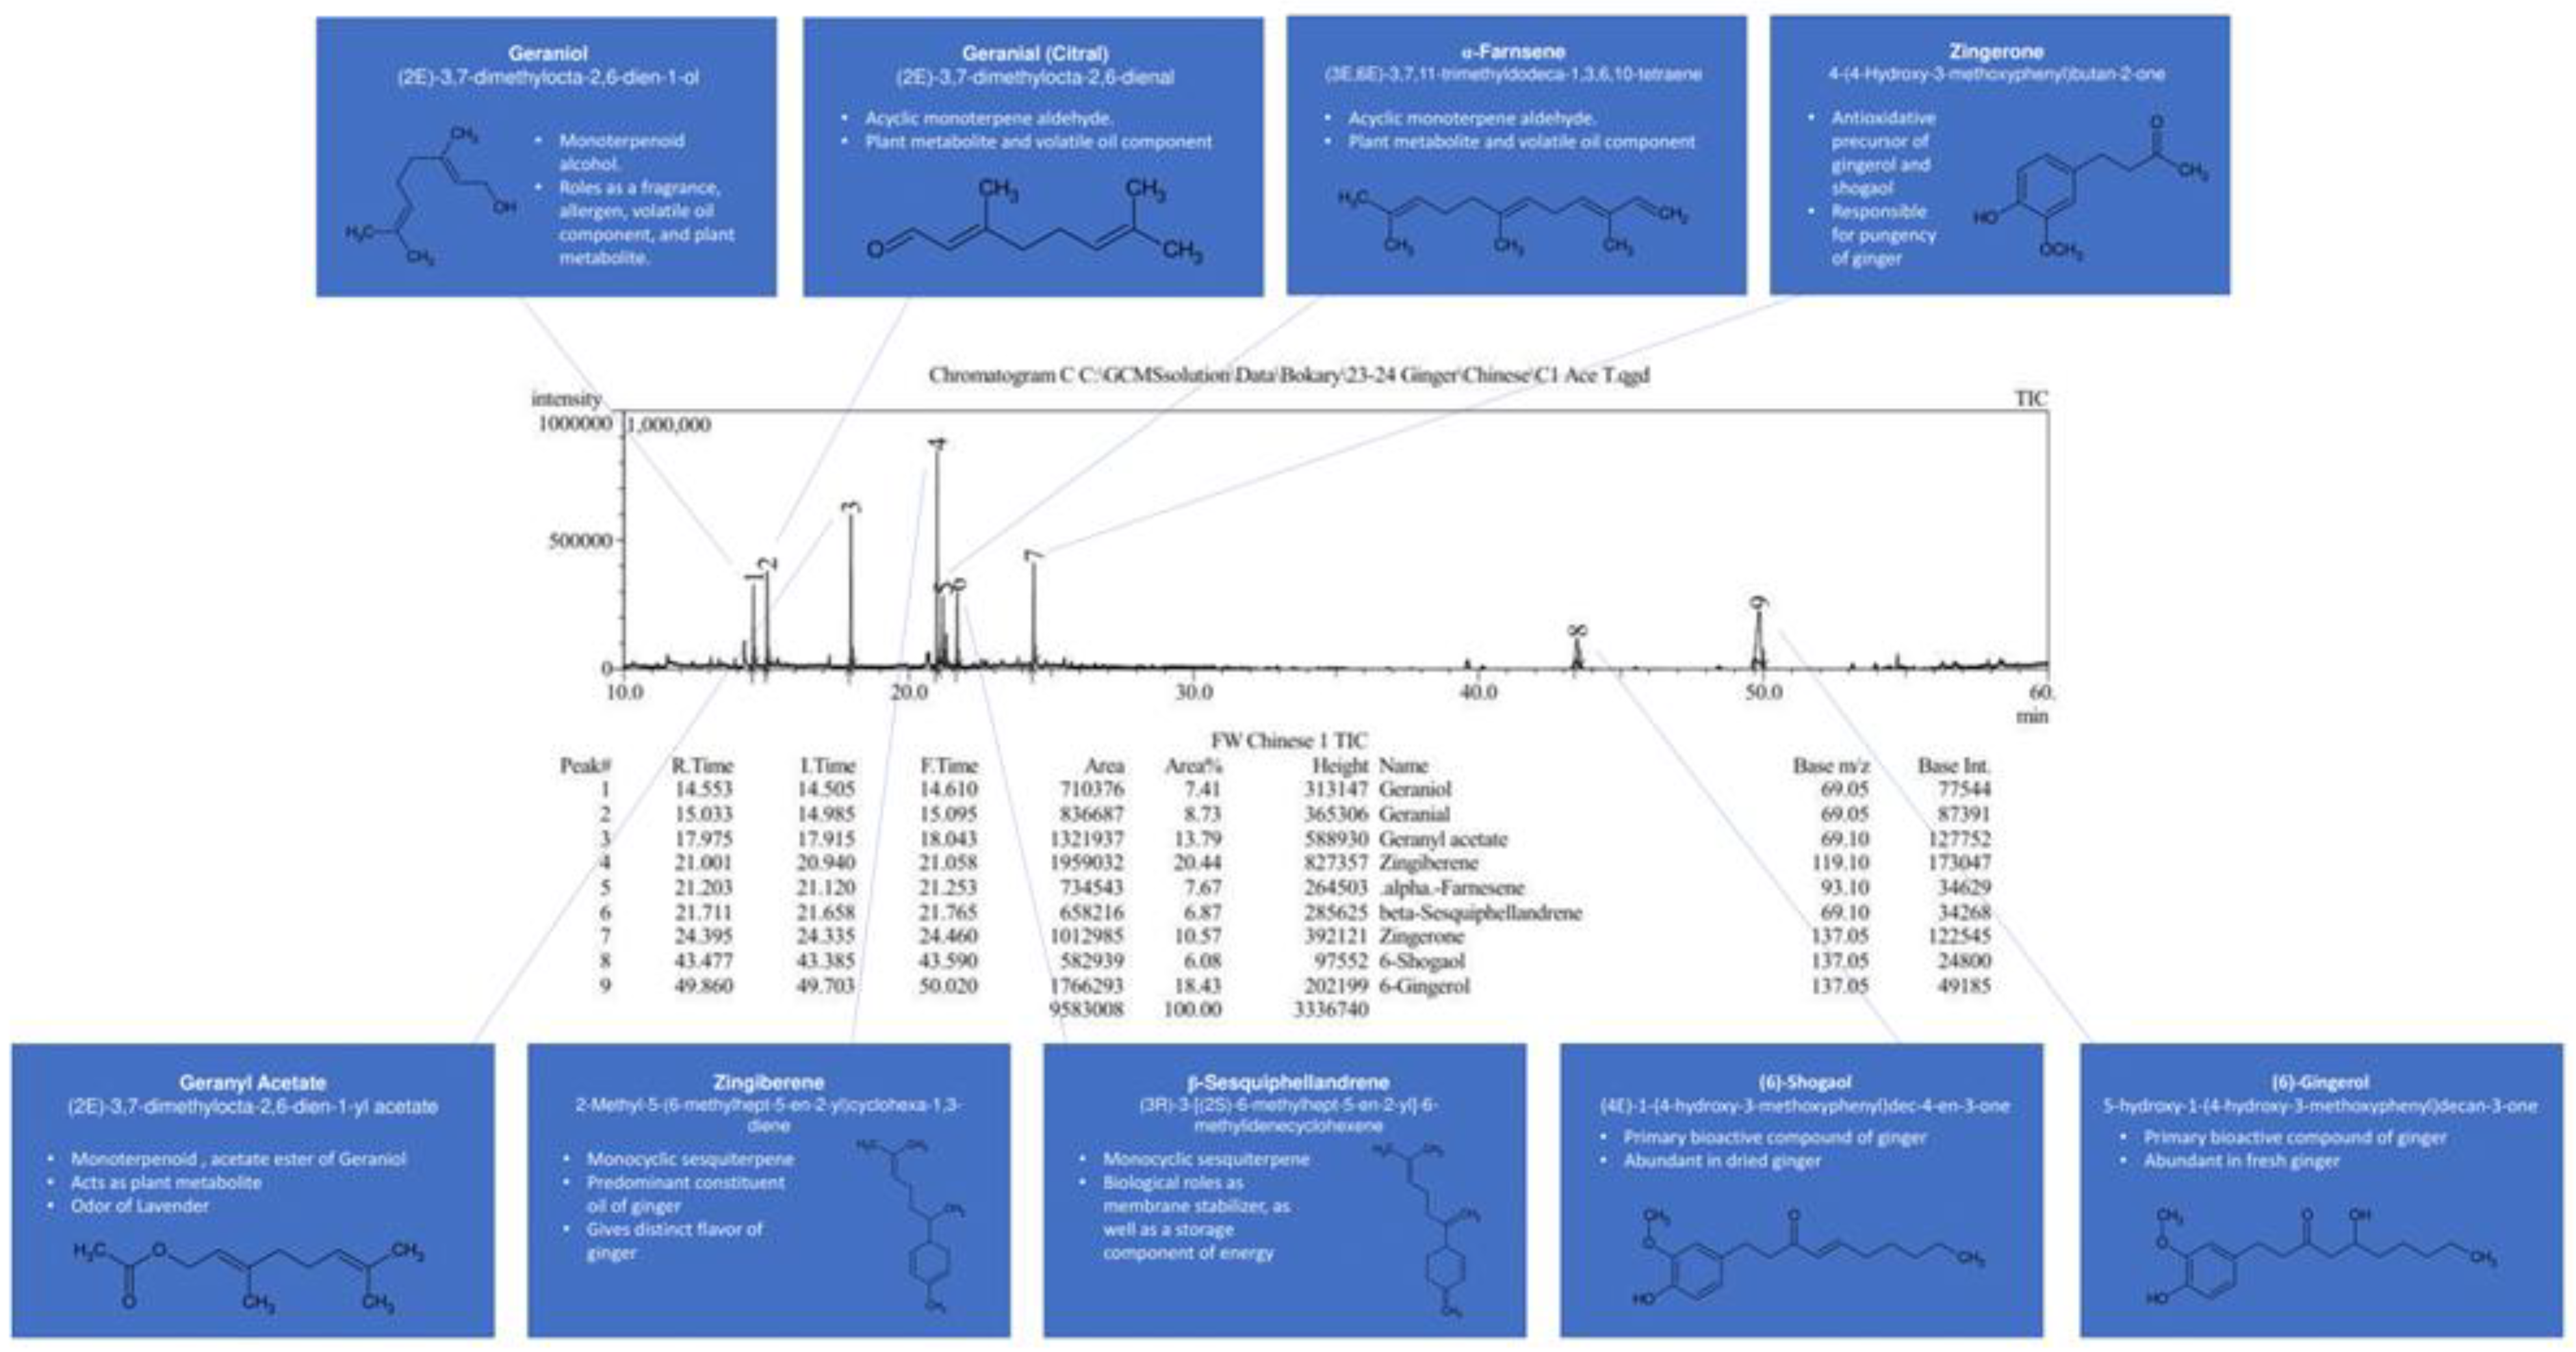
Figure 3.
GC-MS analysis for the extract of holy basil with description of main essential oils and terpenes.
Figure 3.
GC-MS analysis for the extract of holy basil with description of main essential oils and terpenes.
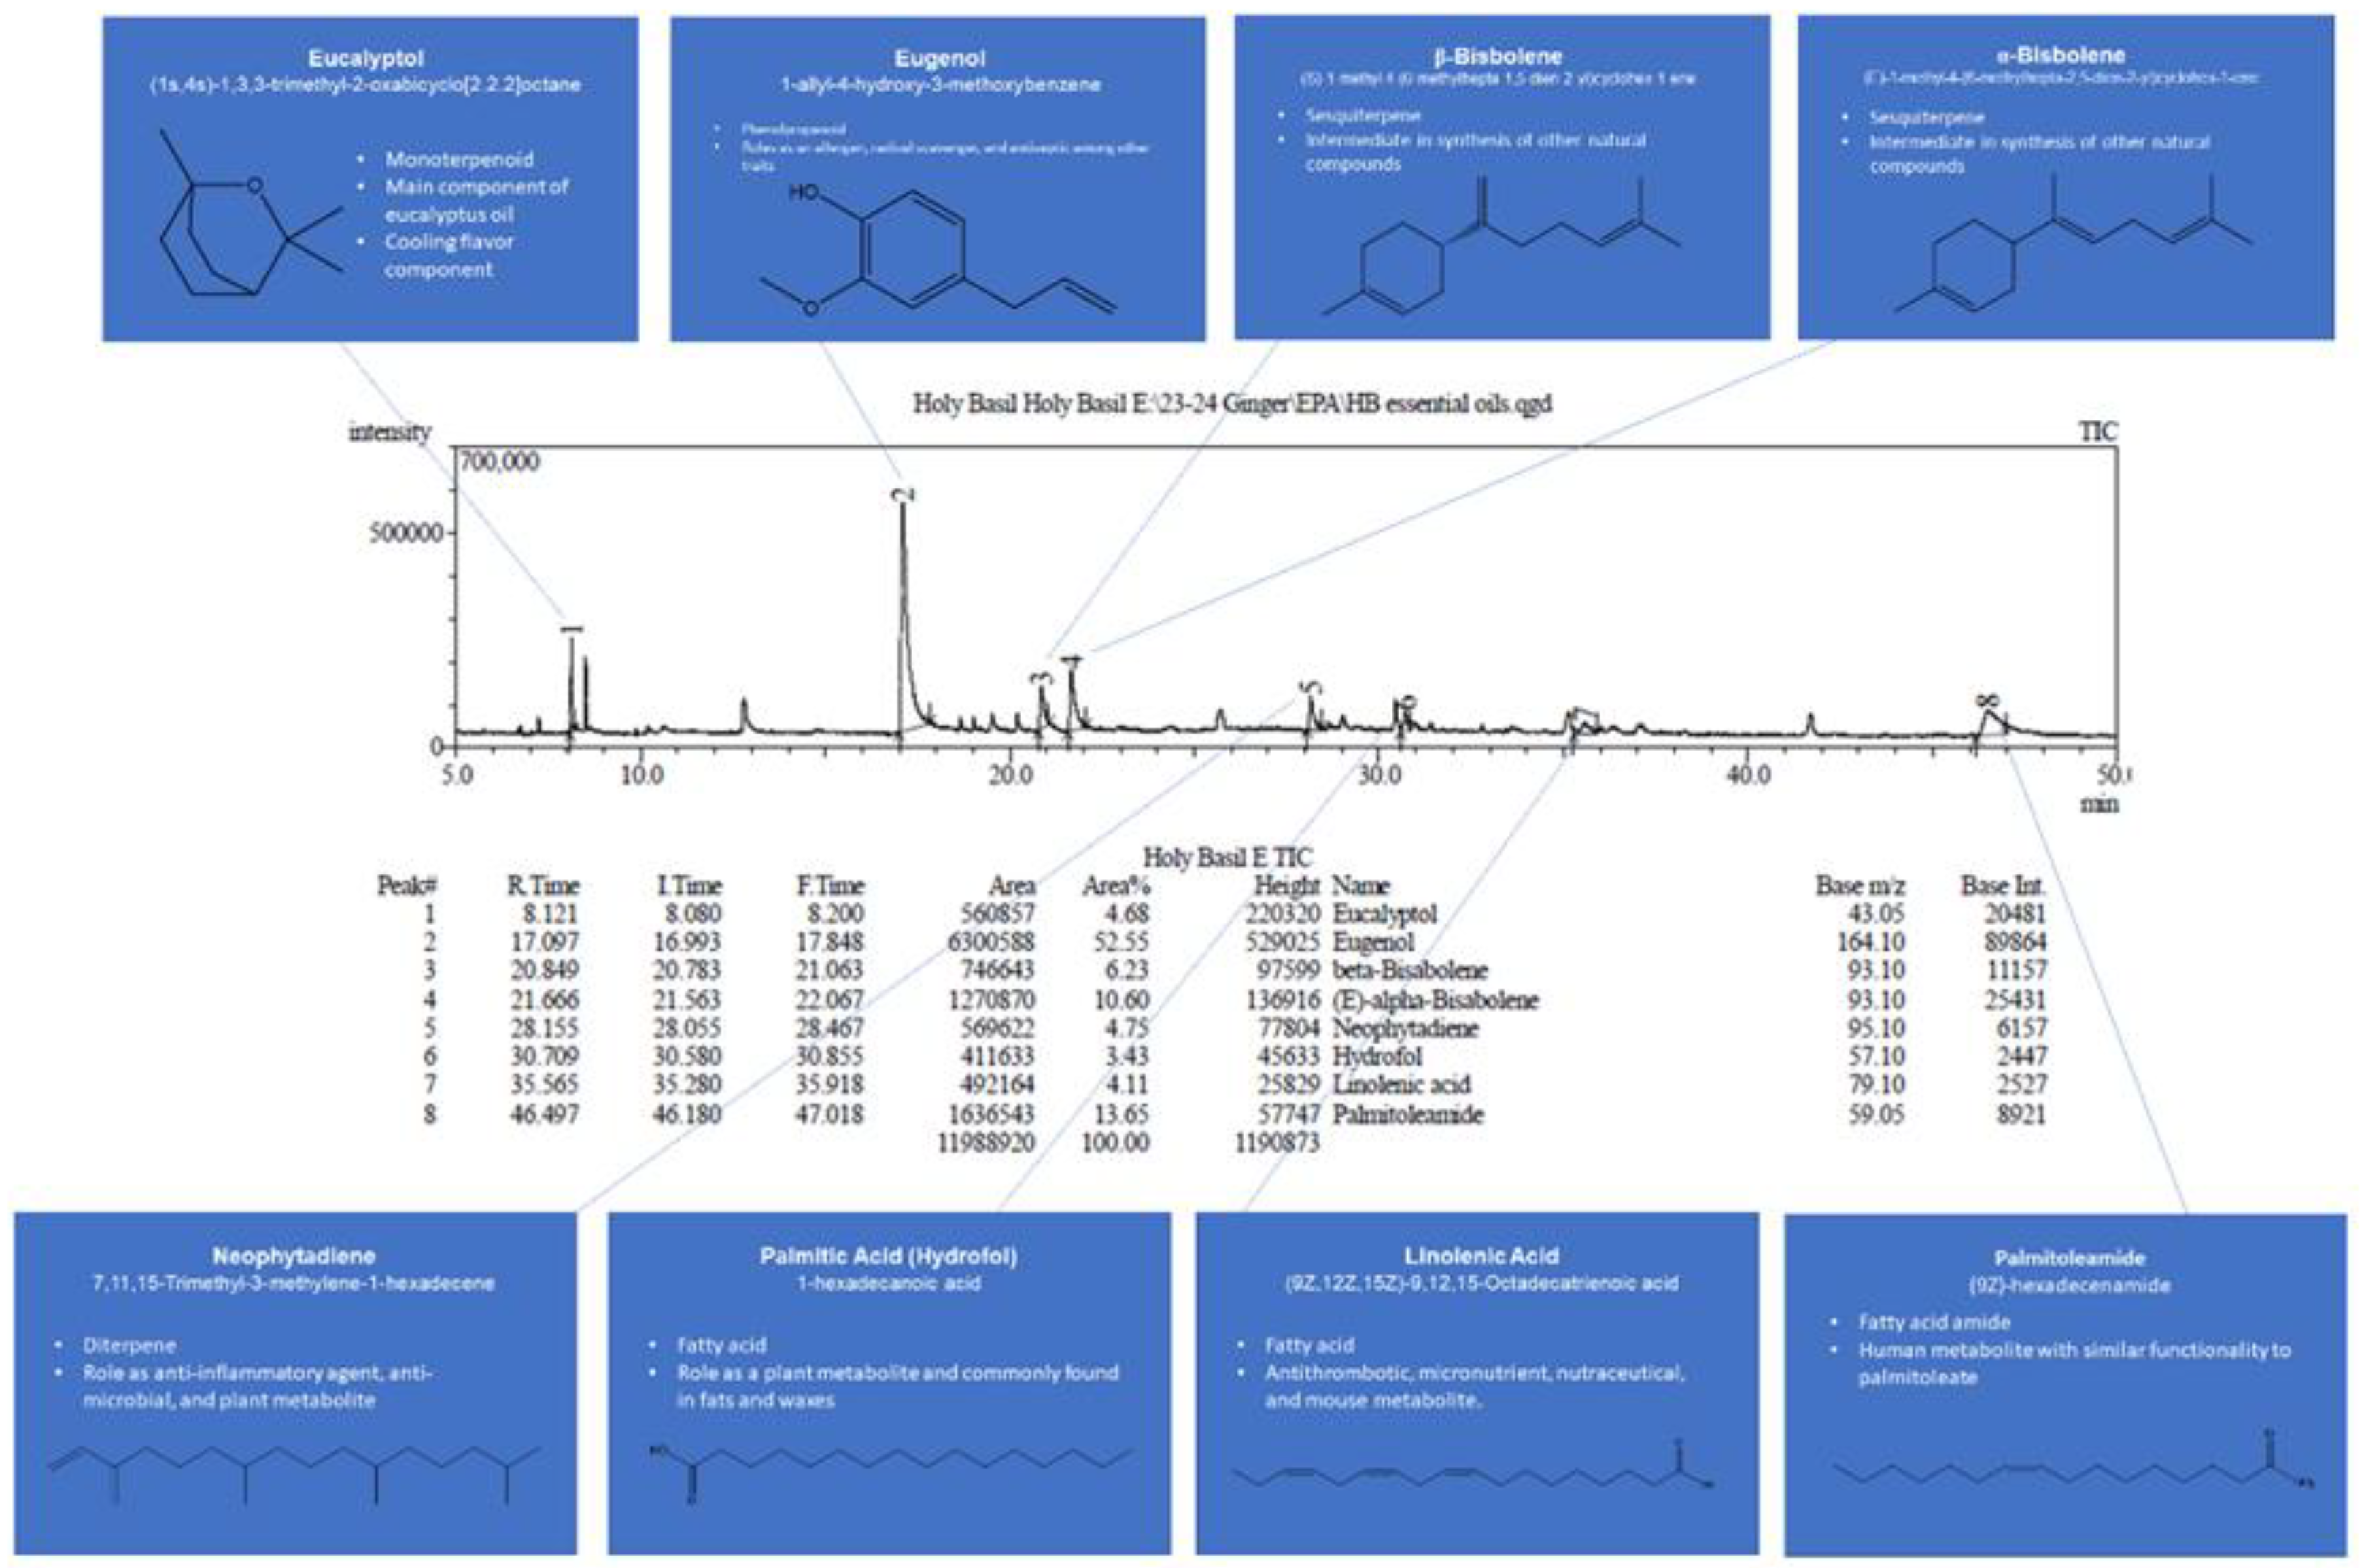
Table 1.
Characteristics and locations of water samples.
| Location | GPS Location | pH | Temperature (°C) |
Salinity (ppt) |
Dissolved Oxygen (mg/L) |
| Chincoteague Oceanside | 37.0238° N, 74.9989° W | 8.12 | 17.9 | 26.8 | 11.76 |
| Pocomoke River | 38.0765°N, 75.5706° W |
7.62 | 15.5 | 0.08 | 11.94 |
Table 2.
Example of measurements of controls and aquarium water after adding water in salt water (SW) and fresh water (FW) aquariums.
Table 2.
Example of measurements of controls and aquarium water after adding water in salt water (SW) and fresh water (FW) aquariums.
| Parameter | FW Control | SW Control | FW Tank | SW tank |
| pH (mV) | 7.33 | 7.61 | 7.34 | 8.13 |
| Conductivity (uS) | 220 | 41.8 | 215 | 41.7 |
| Salinity (ppt) | 0.11 | 27.7 | 0.11 | 27.7 |
| TDS (ppm) | 106 | 21.0 | 106 | 20.9 |
| D.O (%) | 7.08 | 7.14 | 8.52 | 8.42 |
Table 4.
Phase Contrast Microscopy of Short-Term Slides in Pure Water for Holy Basil Samples.
| Dilutions | 1x | 2x | 4x | 8x | 16x |
| Dry Slides Before Submersion | 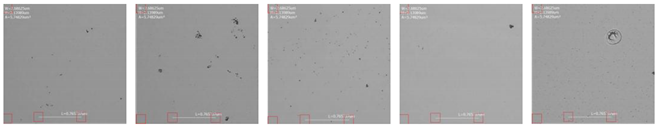 |
||||
| Freshwater samples after the test | 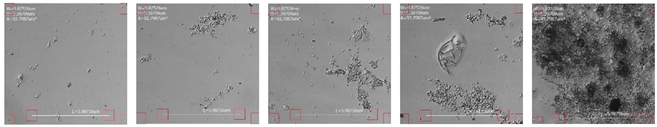 |
||||
| Saltwater samples after the test | 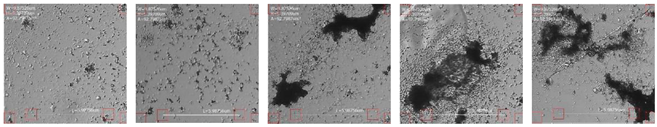 |
||||
Table 5.
ImageJ Data for Pure Water Submersion for Holy Basil Samples.
| Dilutions | 1x | 2x | 4x | 8x | 16x |
| Freshwater samples after the test | 3.40 ± 0.4 | 10.1 ± 0.1 | 20.6 ± 2.7 | 28.0 ± 3.7 | 59.6 ± 7.8 |
| Saltwater samples after the test | 22.4 ± 6 | 26.0 ± 7.1 | 30.8 ± 1.2 | 38.8 ± 3.3 | 41.41 ± 1.8 |
Table 6.
Phase Contrast Microscopy of Short-Term Slides in Methylene Blue for holy basil samples.
| Dilutions | 1x | 2x | 4x | 8x | 16x |
| Dry Slides Before Submersion | 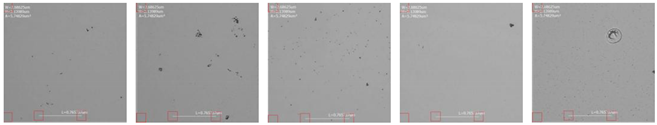 |
||||
| Freshwater with methylene blue samples after the test | 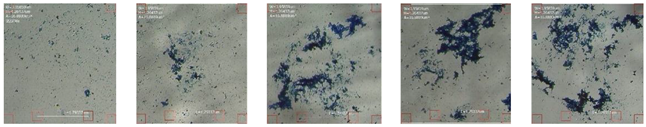 |
||||
| Saltwater with methylene blue samples after the test | 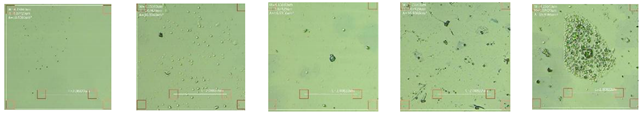 |
||||
Table 7.
ImageJ Data for Methylene Blue Stained Slides for Holy Basil Samples.
| Treatment | 1x | 2x | 4x | 8x | 16x |
| Freshwater samples after the test | 58.3 ± 7.3 | 63.0 ± 14.7 | 79.8± 0.8 | 98.6 ± 12.9 | 114.2 ± 13.7 |
| Saltwater samples after the test | 9.3 ± 1.0 | 20.2 ±1.2 | 26.2 ± 3.9 | 46.3 ± 6.4 | 53.4 ± 3.7 |
Table 8.
Phase Contrast Microscopy of Short-Term Slides of Ginger Extracts.
| Dilutions | 1x | 2x | 4x | 8x | 16x |
| Dry Slides Before Submersion | 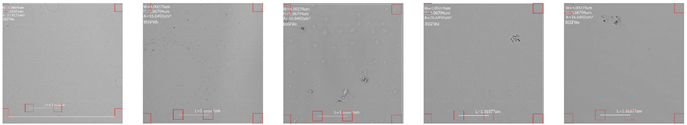 |
||||
| Freshwater | 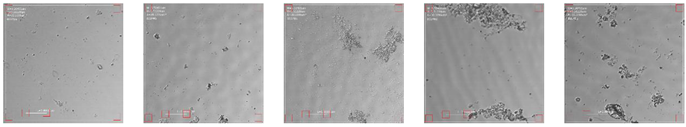 |
||||
| Saltwater | 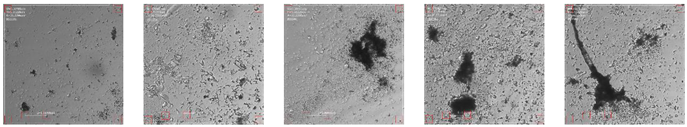 |
||||
Table 9.
ImageJ precipitation results for ginger extracts in saltwater/freshwater.
| Dilutions | 1x | 2x | 4x | 8x | 16x |
| Freshwater | 3.9±0.8 | 11.3±6.5 | 22.8±4.9 | 24.7±5.5 | 36.2±4.9 |
| Saltwater | 87.1±17.3 | 154.1±23.1 | 197.4±55.1 | 202.1±58.2 | 272.3±29.2 |
Table 10.
Phase Contrast Microscopy of Short-Term Slides of Ginger Extracts in Methylene Blue.
| Dilutions | 1x | 2x | 4x | 8x | 16x |
| Dry Slides Before Submersion | 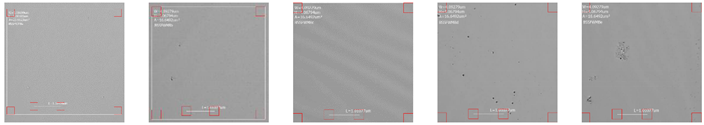 |
||||
| Freshwater | 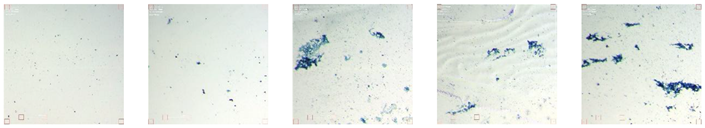 |
||||
| Saltwater | 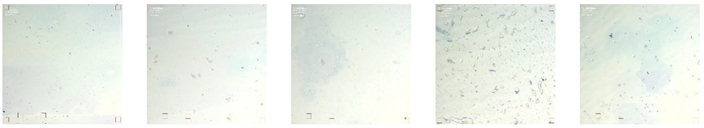 |
||||
Table 11.
ImageJ results for ginger extracts in saltwater/freshwater with methylene blue.
| Dilutions | 1x | 2x | 4x | 8x | 16x |
| Freshwater | 5.4±1.8 | 5.4±0.6 | 6.0±0.3 | 7.3±1.3 | 16.8±0.5 |
| Saltwater | 9.5±0.3 | 9.9±4.4 | 11.4±2.5 | 16.5±3.3 | 15.5±2.1 |
Disclaimer/Publisher’s Note: The statements, opinions and data contained in all publications are solely those of the individual author(s) and contributor(s) and not of MDPI and/or the editor(s). MDPI and/or the editor(s) disclaim responsibility for any injury to people or property resulting from any ideas, methods, instructions or products referred to in the content. |
© 2025 by the authors. Licensee MDPI, Basel, Switzerland. This article is an open access article distributed under the terms and conditions of the Creative Commons Attribution (CC BY) license (http://creativecommons.org/licenses/by/4.0/).
Copyright: This open access article is published under a Creative Commons CC BY 4.0 license, which permit the free download, distribution, and reuse, provided that the author and preprint are cited in any reuse.


