
Submitted:
15 September 2025
Posted:
16 September 2025
You are already at the latest version
Abstract
GV1001, an anticancer vaccine, exhibits diverse biological activities, including antioxidant, anti-inflammatory, anti-Alzheimer’s, and anti-atherosclerotic effects, and protects mitochondria from drug-induced injury. Cisplatin, a widely used chemotherapeutic, is effective but limited by nephrotoxicity driven by mitochondrial dysfunction in renal epithelial cells. We investigated whether GV1001 could counteract cisplatin-induced kidney injury in mice and preserve mitochondrial integrity in human renal epithelial cells. In vivo, GV1001 completely mitigated cisplatin-induced nephrotoxicity. It prevented cisplatin-induced histopathological damage, kidney injury marker expression, macrophage infiltration, endothelial-to-mesenchymal transition, inflammation, and apoptosis. In vitro, GV1001 maintained mitochondrial membrane potential, preserved ATP production, and prevented mitochondrial membrane peroxidation, possibly by binding to cardiolipin. It also reduced reactive oxygen species (ROS), cytochrome c release into the cytosol, and subsequent activation of apoptosis-related pathways elicited by cisplatin. Collectively, these findings demonstrate that GV1001 protects against cisplatin-induced nephrotoxicity (CIN) by preserving mitochondrial structure and function while suppressing downstream pathological events. By directly targeting the central mechanism of cisplatin toxicity, GV1001 emerges as a promising therapeutic strategy to mitigate CIN and improve the safety of chemotherapy.
Keywords:
GV1001
; cisplatin
; nephrotoxicity
; mitochondria
; reactive oxygen species
1. Introduction
Cisplatin, a platinum-based chemotherapeutic agent, is extensively used for the treatment of solid malignancies, including prostate, head and neck, ovarian, and lung cancers [1]. However, its clinical use is limited by severe adverse effects, most notably nephrotoxicity, which can progress to renal failure [2,3]. As the kidney is the primary organ for cisplatin elimination via glomerular filtration and tubular secretion [4], drug accumulation in the renal cortex reaches levels approximately five-fold higher than in serum, with preferential localization in the S-segment of proximal tubules [5]. Although hydration therapy is routinely administered to attenuate nephrotoxicity, its efficacy remains limited [6], highlighting the urgent need for alternative therapeutic strategies. Cisplatin primarily exerts cytotoxicity by inducing nuclear DNA damage, but mitochondria has also been identified as a significant target [7]. Given the kidney’s high energy demands for reabsorbing nearly 99% of glomerular ultrafiltrate and maintaining systemic homeostasis [8], mitochondrial integrity is essential for renal function. Cisplatin-impaired mitochondria generate excessive reactive oxygen species (ROS), overwhelming cellular antioxidant defenses and amplifying oxidative injury [9]. Accordingly, therapeutic interventions that alleviate mitochondrial oxidative stress and preserve mitochondrial function represent promising approaches for preventing cisplatin-induced nephrotoxicity [10].
GV1001, a 16–amino acid peptide derived from human telomerase reverse transcriptase (hTERT) [11,12], exhibits diverse biological activities, including suppression of mitochondrial ROS production [13], inhibition of atherosclerosis [14], attenuation of vascular inflammation, and prevention of endothelial-to-mesenchymal transition in endothelial cells [15]. In addition, GV1001 demonstrates protective effects against cancer progression, viral infections, and inflammation [16,17,18,19,20]. We previously reported that GV1001 mitigated doxorubicin-induced mitochondrial damage by preventing mitochondrial structural abnormalities, lipid peroxidation, ferrous iron accumulation, and ATP depletion [15]. However, whether GV1001 protects against cisplatin-induced nephrotoxicity (CIN) remains unknown. In this study, we investigated the renoprotective effects of GV1001 in cisplatin-induced nephrotoxicity and explored its potential as a mitochondria-targeted therapeutic strategy for chemotherapy-associated kidney injury.
2. Materials and Methods
2.1. Cell Culture
Human kidney epithelial cells (HK-2; ATCC, #CRL-2190, Manassas, VA) were cultured in RPMI 1640 Medium (#11875093, Thermo Fisher Scientific, Waltham, MA) supplemented with 10% fetal bovine serum (FBS, #10437028, Thermo Fisher Scientific, Waltham, MA). The medium was renewed every 2 days. Cells were cultured at 37°C and in a 5% (v/v) of CO2 in air atmosphere with humidity.
2.2. Animals and animal welfare
To assess the in vivo effect of GV1001 on cisplatin-induced nephrotoxicity, thirty-two 8-week-old male mice (C57BL6 background) were purchased from Jackson Laboratories (Bar Harbor, ME). The mice were housed in a pathogen-free environment and given free access to food and water as described previously [14,18]. Subsequently, these mice were randomly divided into 4 groups (n=8 per group) as follows:
- Control Group: Received phosphate-buffered saline (PBS) intraperitoneally (i.p.) three times per week for 6 weeks.
- GV1001 Group: Received GV1001 (2 mg/kg) i.p. three times per week for 6 weeks. This dosage has been demonstrated to be effective for its anti-inflammatory effect without causing toxicity [14].
- Cisplatin + PBS Group: Received cisplatin (2.5 mg/kg) i.p. twice per week for 6 weeks, along with PBS i.p. injections three times per week for 6 weeks.
- Cisplatin + GV1001 Group: Received cisplatin (2.5 mg/kg) i.p. twice per week for 6 weeks, in combination with GV1001 (2 mg/kg) i.p. three times per week for 6 weeks.
Mouse health and behavior were monitored daily throughout the experiment with body weights measured once per week. After the 6-week treatment period, the mice were sacrificed. GV1001 was obtained from GemVax/Kael, Inc., Seongnam-si, South Korea. Cisplatin was purchased from Selleck Chemicals LLC (#S1166, Houston, TX).
2.3. Sample and tissue collections
Mice were harvested under general anesthesia to collect kidney and whole blood, after the administration of PBS, GV1001, and/or cisplatin were finished. Whole blood was centrifuged at 2000 x g for 15 minutes to isolate serum, with uric acid in serum evaluated using uric acid assay kit (Cayman Chemical Co. Inc., #700320, Ann Arbor, MI) according to the manufacturer’s instructions.
2.4. Histological analysis
Fresh kidney tissue was dissected and immediately fixed with 4% paraformaldehyde. Sections from the paraffin-embedded mouse kidneys were stained with hematoxylin and eosin (H&E). Tubular damage was scored by calculation of the percentage of tubules in the sections that displayed cell necrosis, loss of the brush border, cast formation, and tubular dilatation. At least 10 fields per section for each sample were examined. The damaged tubule scores were divided into the following levels: grade 0, no damage; grade 1, <25%; grade 2, 25-49%; grade 3, 50-74%; and grade 4, ≥75% [21,22].
2.5. Histological and Immunofluorescence (IF) Analysis
For immunofluorescent (IF) staining, paraffin sections of kidneys and fixed HK-2 cells were incubated with primary antibodies, such as F4/80 (Abcam, #ab6640, Cambridge, UK), α-SMA (alpha smooth muscle actin, #A2547, Millipore Sigma, Burlington, MA), TNF-α (Abcam, #ab6671, Cambridge, UK), KIM-1 (Cell Signaling Technology, #CST14971, Danvers, MA), E-Cadherin (BD Biosciences, #610181, San Jose, CA), PARP (Cell Signaling Technology, #CST9542, Danvers, MA), Cleaved Caspase 3 (Cell Signaling Technology, #CST9661, Danvers, MA), p-p38 (Cell Signaling Technology, #CST9211, Danvers, MA), p38 (Cell Signaling Technology, #CST9212, Danvers, MA), COX-4 (Cell Signaling Technology, #CST4850, Danvers, MA), NDUFS1 (Cell Signaling Technology, #CST70264, Danvers, MA), SDHB (Cell Signaling Technology, #CST92649, Danvers, MA), UQCRFS1(Cell Signaling Technology, #CST95231, Danvers, MA), Cytochrome C (Invitrogen, #MA5-11674, Carlsbad, CA), IL-6 (Thermo Fisher Scientific, #701028, Waltham, MA), p65 (Santa Cruz Biotechnology, #SC-8008, Dallas, TX), Bax (Santa Cruz Biotechnology, #SC-20067, Dallas, TX), Col3a1 (Santa Cruz Biotechnology, #SC-271249, Dallas, TX), p53 (Santa Cruz Biotechnology, #SC-126, Dallas, TX), IL-1β (Santa Cruz Biotechnology, #SC-32294, Dallas, TX), γ-H2AX (Millipore Sigma, #05-636, Burlington, MA), p-p65 (Cell Signaling, #CST-3036, Danvers, MA), Mitosox Red Mitochondrial Superoxide Indicator (Invitrogen, #M36008, Carlsbad, CA), Fluorometric Intracellular ROS probe (MilliporeSigma, #MAK143, Burlington, MA), MitoTracker Red CMXRos (Cell Signaling Technology, #CST9082, Danvers, MA), BioTrackerTM Mitochondrial FerroGreen live cell probe (Mito-FerroGreen) (EMD Millipore Corp., #SCT262, Burlington MA), MT-1(Fish scientific, # NC1933275, Waltham MA), NAO (Acridine Orange 10-nonyl bromide, MilliporeSigma, #A7847, Burlington, MA), GV1001 antibody is from GemVax/Kael, Inc., Seongnam-si, South Korea, followed by fluorometric detection with Alexa Fluor 488- or 594-conjugated secondary antibodies (Thermo Fisher Scientific, Waltham, MA). Sequentially, the sections were mounted on slides with VECTASHIELD Antifade Mounting Medium with 4′,6-diamidino-2-phenylindole (DAPI) (Vector Laboratories, #H1200, Burlingame, CA). The IF images were taken using a confocal fluorescent microscope (Carl Zeiss, LSM 700, Oberkochen, Germany). All experiments were performed according to the manufacturer’s guidelines and published references [15,23,24,25].
2.6. Apoptosis assessment
Apoptotic cells from HK-2 cell cultures or mouse renal tissue were identified using Terminal deoxynucleotidyl transferase dUTP Nick-End Labeling (TUNEL) assay kit (Cell Signaling, CST-25879, Danvers, MA) according to the manufacturer’s guidelines.
2.7. Quantitative Real-Time Polymerase Chain Reaction (RT-qPCR)
Total RNA was extracted from HK-2 and mouse tissue, reverse transcribed, and qPCR was performed as described previously [18]. Total RNA was extracted from tissue using the RNeasy Micro Kit (#74004, Qiagen, Valencia, CA, USA) and reverse transcribed following these steps: 5 minutes at 65°C, 2 minutes at 25°C, and 1 hour at 45°C using the SuperScript. III Reverse Transcriptase Synthesis Kit (#18080044, Thermo Fisher Scientific, Waltham, MA, USA). Quantitative PCR (qPCR) was then performed using Powerup™ SYBR-Green Master Mix (#A25742, Thermo Fisher Scientific, Waltham, MA), according to the manufacturer’s protocol. Glyceraldehyde 3-phosphate dehydrogenase (GAPDH) was used as a loading control. Fold induction was calculated using the comparative ΔCq method and presented as relative transcript levels (2−ΔΔCq). The primer sequences used for RT-qPCR were listed in Table S1 (Supplemental Materials).
2.8. Western blotting
Western blotting was performed from the whole-cell extracts (WCEs) of the cultured HK-2 as described elsewhere [26].
2.9. Enzyme-linked immunosorbent assay (ELISA)
To detect the content of Interleukin-6 (IL-6), Interleukin-6 (IL-8), Interleukin-1β (IL-1β), and Tumor necrosis factor-alpha (TNF-α) in mouse serum, commercially available enzyme-linked immunosorbent assay kits (Invitrogen, Carlsbad, CA) were used according to the manufacturer’s instructions as described previously [27].
2.10. ATP detection assay
HK-2 were seeded into a 6-well plate at a density of 1.5 × 10⁵ cells/well in 2 mL of culture medium, followed by treatment with GV1001 (10 g/ml) alone or together with Cisplatin (25 M) for 24 hrs. Intracellular ATP content assays were performed using an ATP Detection Assay Kit (Cayman Chemical Co. Inc., #700410, Ann Arbor, MI), following the manufacturer’s instructions as described by others [28,29].
2.11. Labelling GV1001 with Fluorescein isothiocyanate (FITC)
To prepare GV1001 peptide solution, GV1001 peptide was diluted in 0.1 M sodium bicarbonate buffer (MilliporeSigma, #S6014, Burlington, MA), pH 9.0-9.5, to a concentration of 2 mg/ml. Dissolve solid FITC (MilliporeSigma, #F3651, Burlington, MA) in anhydrous DMSO to a concentration of 1 mg/ml. The FITC stock solution was added dropwise to the GV1001 solution at a molar ratio of 5:1 (FITC to GV1001). The reaction was gently stirred in the dark for 2-8 hours at 4°C. 50 mM NH₄Cl solution was added to quench excess FITC. The reaction was incubated in the dark for another 2 hours at 4°C. Pass the reaction through a G-25 Sephadex column equilibrated with PBS to separate free FITC from FITC-labeled GV1001 [30].
2.12. Cardiolipin binding assay
For ELISA-based cardiolipin binding assay, a Corning 96-well white opaque tissue culture plate (Corning Life Science, Union City, CA, #353296) was coated with 2.0 μg/well cardiolipin (MilliporeSigma, Rockville, MD, USA, #C1649) in the dark, stored at 4°C overnight and blocked in assay buffer (10 mM bis-Tris and 10 mM CaCl2) containing with 0.5% skim milk and 2% fatty acid-free BSA for 1 hour as previously described [31]. Then, we added 50 µL of each serial dilutions of GV1001 labelled with FITC to wells in triplicate and incubated for 2 hours at 37°C to allow potential binding. After washings, measure FITC fluorescent intensity (The excitation length is 490 and emission length is 519) using a plate reader (Bio-Rad Laboratories, #PR4100, Hercules, CA, USA). The relative amount of GV1001 bound to cardiolipin was calculated using the equation: (F-Fblank) / (Fmax-Fblank), where F is fluorescent intensity of FITC. Results were presented as a percentage and fitted to a sigmoidal curve.
2.13. Subcellular fractionation
Cellular mitochondria were isolated using a Mitochondrial Isolation Kit for Mammalian Cells (Thermo Fisher Scientific, # 89874, Waltham, MA) with the manufacturer’s guidelines. Cells exposed to cisplatin, alone or in combination with GV1001, were washed with PBS twice and harvested. Collected cells were suspended in a fractionation buffer and incubated in ice for 5 min. Then, samples were centrifuged at 12,000 x g for 15 min according to the manufacturer's instructions to separate the cytosolic fraction (supernatant) from the mitochondrial one (pellet). Proteins in these fractions were analyzed using Western blot.
2.14. Statistical analyses
All graphs were created using GraphPad Prism software, and statistical analyses were calculated using GraphPad Prism 9 (GraphPad Software, Boston, MA). For multiple comparisons, one-way ANOVA with the Newman-Keuls test was used. P-value of less than 0.05 was considered significant. All results from in vitro were confirmed by at least three independent experiments. Error bars represent mean ± SE.
3. Results
3.1. GV1001 notably ameliorated cisplatin-induced nephrotoxicity
Despite decades of research and clinical trials, no effective pharmacological strategy has been established to prevent CIN in patients undergoing chemotherapy [32]. The development of CIN is partly attributable to cisplatin-induced mitochondrial dysfunction in renal epithelial cells [4]. Since GV1001 has been shown to protect mitochondria from various insults, including doxorubicin-induced injury in endothelial cells [15], we investigated its potential renoprotective effect against cisplatin-induced kidney damage in a mouse model. Histological analyses revealed that cisplatin treatment caused pronounced tubular cystic dilation and formation of proteinaceous casts, classic hallmarks of nephrotoxicity [33], compared with kidneys from mice treated with PBS or GV1001 alone (Figure 1A–1C). Remarkably, co-treatment with GV1001 completely prevented these pathological alterations, underscoring its strong protective effect (Figure 1D). Consistently, semi-quantitative scoring of H&E-stained sections demonstrated that GV1001 markedly attenuated cisplatin-induced tubular dilation, necrosis, and cast formation (Figure 1D, 1I). Immunofluorescence staining further revealed that cisplatin induced monocyte/macrophage infiltration within the renal cuboidal epithelium (Figure 1E–1G), whereas GV1001 co-treatment significantly reduced immune cell accumulation (Figure 1H, 1J). Moreover, elevated serum uric acid, a biomarker and pathogenic contributor to CIN [34], was markedly increased in cisplatin-treated mice. GV1001 treatment alone had no effect on the baseline levels but significantly suppressed the cisplatin-induced elevation (Figure 1K). In addition, TUNEL assays demonstrated that cisplatin induced apoptosis of renal tubular cells, while co-treatment of GV1001 effectively prevented this apoptotic response, thereby limiting kidney damage (Figure 1L, 1M). Together, these findings demonstrate that GV1001 mitigates the cisplatin-induced histological alterations, inflammation, and apoptosis of renal epithelial cells.
3.2. GV1001 inhibited the expression of genes associated with the cisplatin-induced kidney injury
Kidney injury molecule-1 (KIM-1) and Neutrophil gelatinase-associated lipocalin (NGAL) are biomarkers of CIN [35]. As shown in Figure 2A and 2B, the RT-PCR analysis revealed that cisplatin markedly upregulated the mRNA expression of both KIM-1 and NGAL in the kidney epithelium. GV1001 significantly suppressed the cisplatin-induced overexpression of KIM-1 and NGAL. Consistently, immunofluorescent staining revealed that cisplatin highly induced KIM-1 protein expression in renal tissues (Figure 2C, 2D), whereas GV1001 co-treatment notably attenuated cisplatin’s effect.
3.3. GV1001 suppressed the cisplatin-induced epithelial-to-mesenchymal transition (EMT) of kidney epithelium of mice
Cisplatin is known to trigger EMT, a pathological process that promotes renal fibrosis and contributes to progressive renal failure [36]. To further investigate the protective role of GV1001 against CIN, we investigated whether cisplatin could induce EMT in kidney cuboidal epithelial cells and whether GV1001 inhibited this response. As shown in Figure 3A-C, cisplatin indeed induced EMT of kidney epithelial cells by downregulation the expression of an epithelial cell marker (E-Cadherin) and upregulating the expression of α-SMA (a key indicator of EMT) in proximal epithelium of kidney. Co-administration of GV1001 with cisplatin completely reversed cisplatin-induced EMT.
3.4. GV1001 inhibited the cisplatin-induced systemic and renal inflammation in mice
Kidney disease and inflammation are tightly interconnected, as chronic inflammation plays a pivotal role in the initiation and progression of kidney disorders [37]. Thus, we examined the expression of pro-inflammatory cytokines in both kidney tissue and blood serum. As shown in Figure 4A, cisplatin treatment significantly enhanced the gene expression of TNF-α, IL-1β, IL-6, Transforming growth factor-beta1 (TGF-β1) and TGF-β2 in renal tissue, whereas combined treatment of cisplatin and GV1001 inhibited the cisplatin-induced pro-inflammatory cytokine gene expression. Consistently, immunofluorescent staining images showed that cisplatin markedly elevated intraepithelial staining intensity of these cytokines, whereas GV1001 completely mitigated cisplatin-induced staining intensity (Figure 4B). Furthermore, ELISA data showed that cisplatin administration significantly increased serum levels of TNF-α, IL-1β, and IL-6, but GV1001 completely attenuated these elevations (Figure 4C).
3.5. Cisplatin altered mitochondrial mass and function, while GV1001 reversed such structural and functional changes
Mitochondria play a pivotal role in renal physiology, as the kidneys require high levels of energy to support filtration and reabsorption processes [38]. To evaluate the protective mechanism of GV1001 against CIN, we examined the effect of GV1001 on cisplatin-induced mitochondrial dysfunction in renal cells. Excessive mitochondrial ROS generation is known to drive the damage of mitochondrial structure and function, and disruption of the mitochondrial membrane potential (MMP) [39]. As shown in Figure 5A, 5B, cisplatin markedly decreased mitochondrial mass in HK-2 cells. In contrast, GV1001 co-treatment completely inhibited these structural impairments. Consistent with this finding, cisplatin significantly elevated mitochondrial ROS (Figures 5C, 5E) and cytosol ROS levels (Figure S2), which were significantly suppressed by GV1001. Moreover, cisplatin increased the levels of mitochondrial ferrous iron (Figure 5C, 5D) and peroxidized lipids (Figure 5F, 5G), both of which were substantially reduced by GV1001. MMP represents the electrochemical gradient across the inner mitochondrial membrane, which is essential for ATP synthesis [10]. High MMP drives MT-1 probe accumulation in mitochondria, producing strong red fluorescence. Cisplatin significantly diminished MT-1 red fluorescence, reflecting MMP depolarization, while GV1001 reversed this reduction (Figure 5H, 5I). In line with these findings, cisplatin suppressed cellular ATP production, which was restored to near control levels with GV1001 co-treatment in HK-2 cells (Figure 5J). Mitochondrial ATP production depends on the electron transport chain (ETC), which is composed of multi-subunit protein complexes embedded within the inner mitochondrial membrane [40]. To investigate whether cisplatin altered ETC expression level, we compared the level of ETC complexes I–IV in HK-2 cells using immunofluorescence staining. Specifically, we assessed complex I (NADH: ubiquinone oxidoreductase core subunit S1, NDUFS1), complex II (succinate dehydrogenase complex iron–sulfur subunit B, SDHB), complex III (ubiquinol–cytochrome c reductase Rieske iron–sulfur polypeptide 1, UQCRFS1), and complex IV (cytochrome c oxidase subunit IV, COX-4). As shown in Figure S3, cisplatin markedly reduced the level of NDUFS1, SDHB, UQCRFS1, and COX-4. Notably, GV1001 co-administration restored the level of all four ETC complexes to near control levels, suggesting that GV1001 preserved mitochondrial ETC levels under cisplatin-induced stress.
3.6. GV1001 alleviated cisplatin-caused apoptosis in HK-2 cells.
Mitochondrial dysfunction eventually induces release of mitochondrial cytochrome c into the cytosol, where it activates caspases and initiates apoptosis [41]. As shown in Figure 6A, 6B, the immunofluorescent staining revealed pronounced release of cytochrome c from mitochondria in cisplatin-treated cells, whereas GV1001 effectively hindered cytochrome c translocation into the cytosol. MitoTracker probe was utilized as an indicator of mitochondria in cells. Similar results as shown in Figure S1 indicated that cisplatin induced cytochrome c release from mitochondria, whereas GV1001 blocked this movement. Subcellular fractionation and immunoblotting assays further confirmed that cisplatin caused cytochrome c release, while GV1001 abrogated this translocation (Figure 6C). Once released, cytochrome c activates effector caspase-3, which dismantles cellular components and drives apoptosis [42]. As shown in Figure 6D, cisplatin treatment notably activated caspase-3, whereas GV1001 suppressed such activation. One of the major caspase-3 substrates is PARP, and PARP cleavage serves as a classic marker of apoptosis [43]. Consistently, cisplatin increased cleaved PARP accumulation, while GV1001 markedly reduced PARP cleavage. In addition, cisplatin-induced DNA damage activates both p53 and p38 signaling pathways. Activated p53 upregulates pro-apoptotic genes such as Bax, which promotes mitochondrial outer membrane permeabilization and cytochrome c release [44]. As shown in Figure 6E, cisplatin increased γ-H2AX (a DNA double-strand break marker), p-p38, p53, and Bax expression. These effects were substantially abrogated by GV1001. Moreover, as shown in Figure 6F, 6G, cisplatin markedly increased TUNEL-positive cells, whereas GV1001 significantly reduced cisplatin-induced apoptosis. This result was consistent with the decreased caspase-3 activity and other apoptotic marker expression observed in cells treated by the co-administration of GV1001 and cisplatin.
3.7. GV1001 bound to mitochondrial cardiolipin
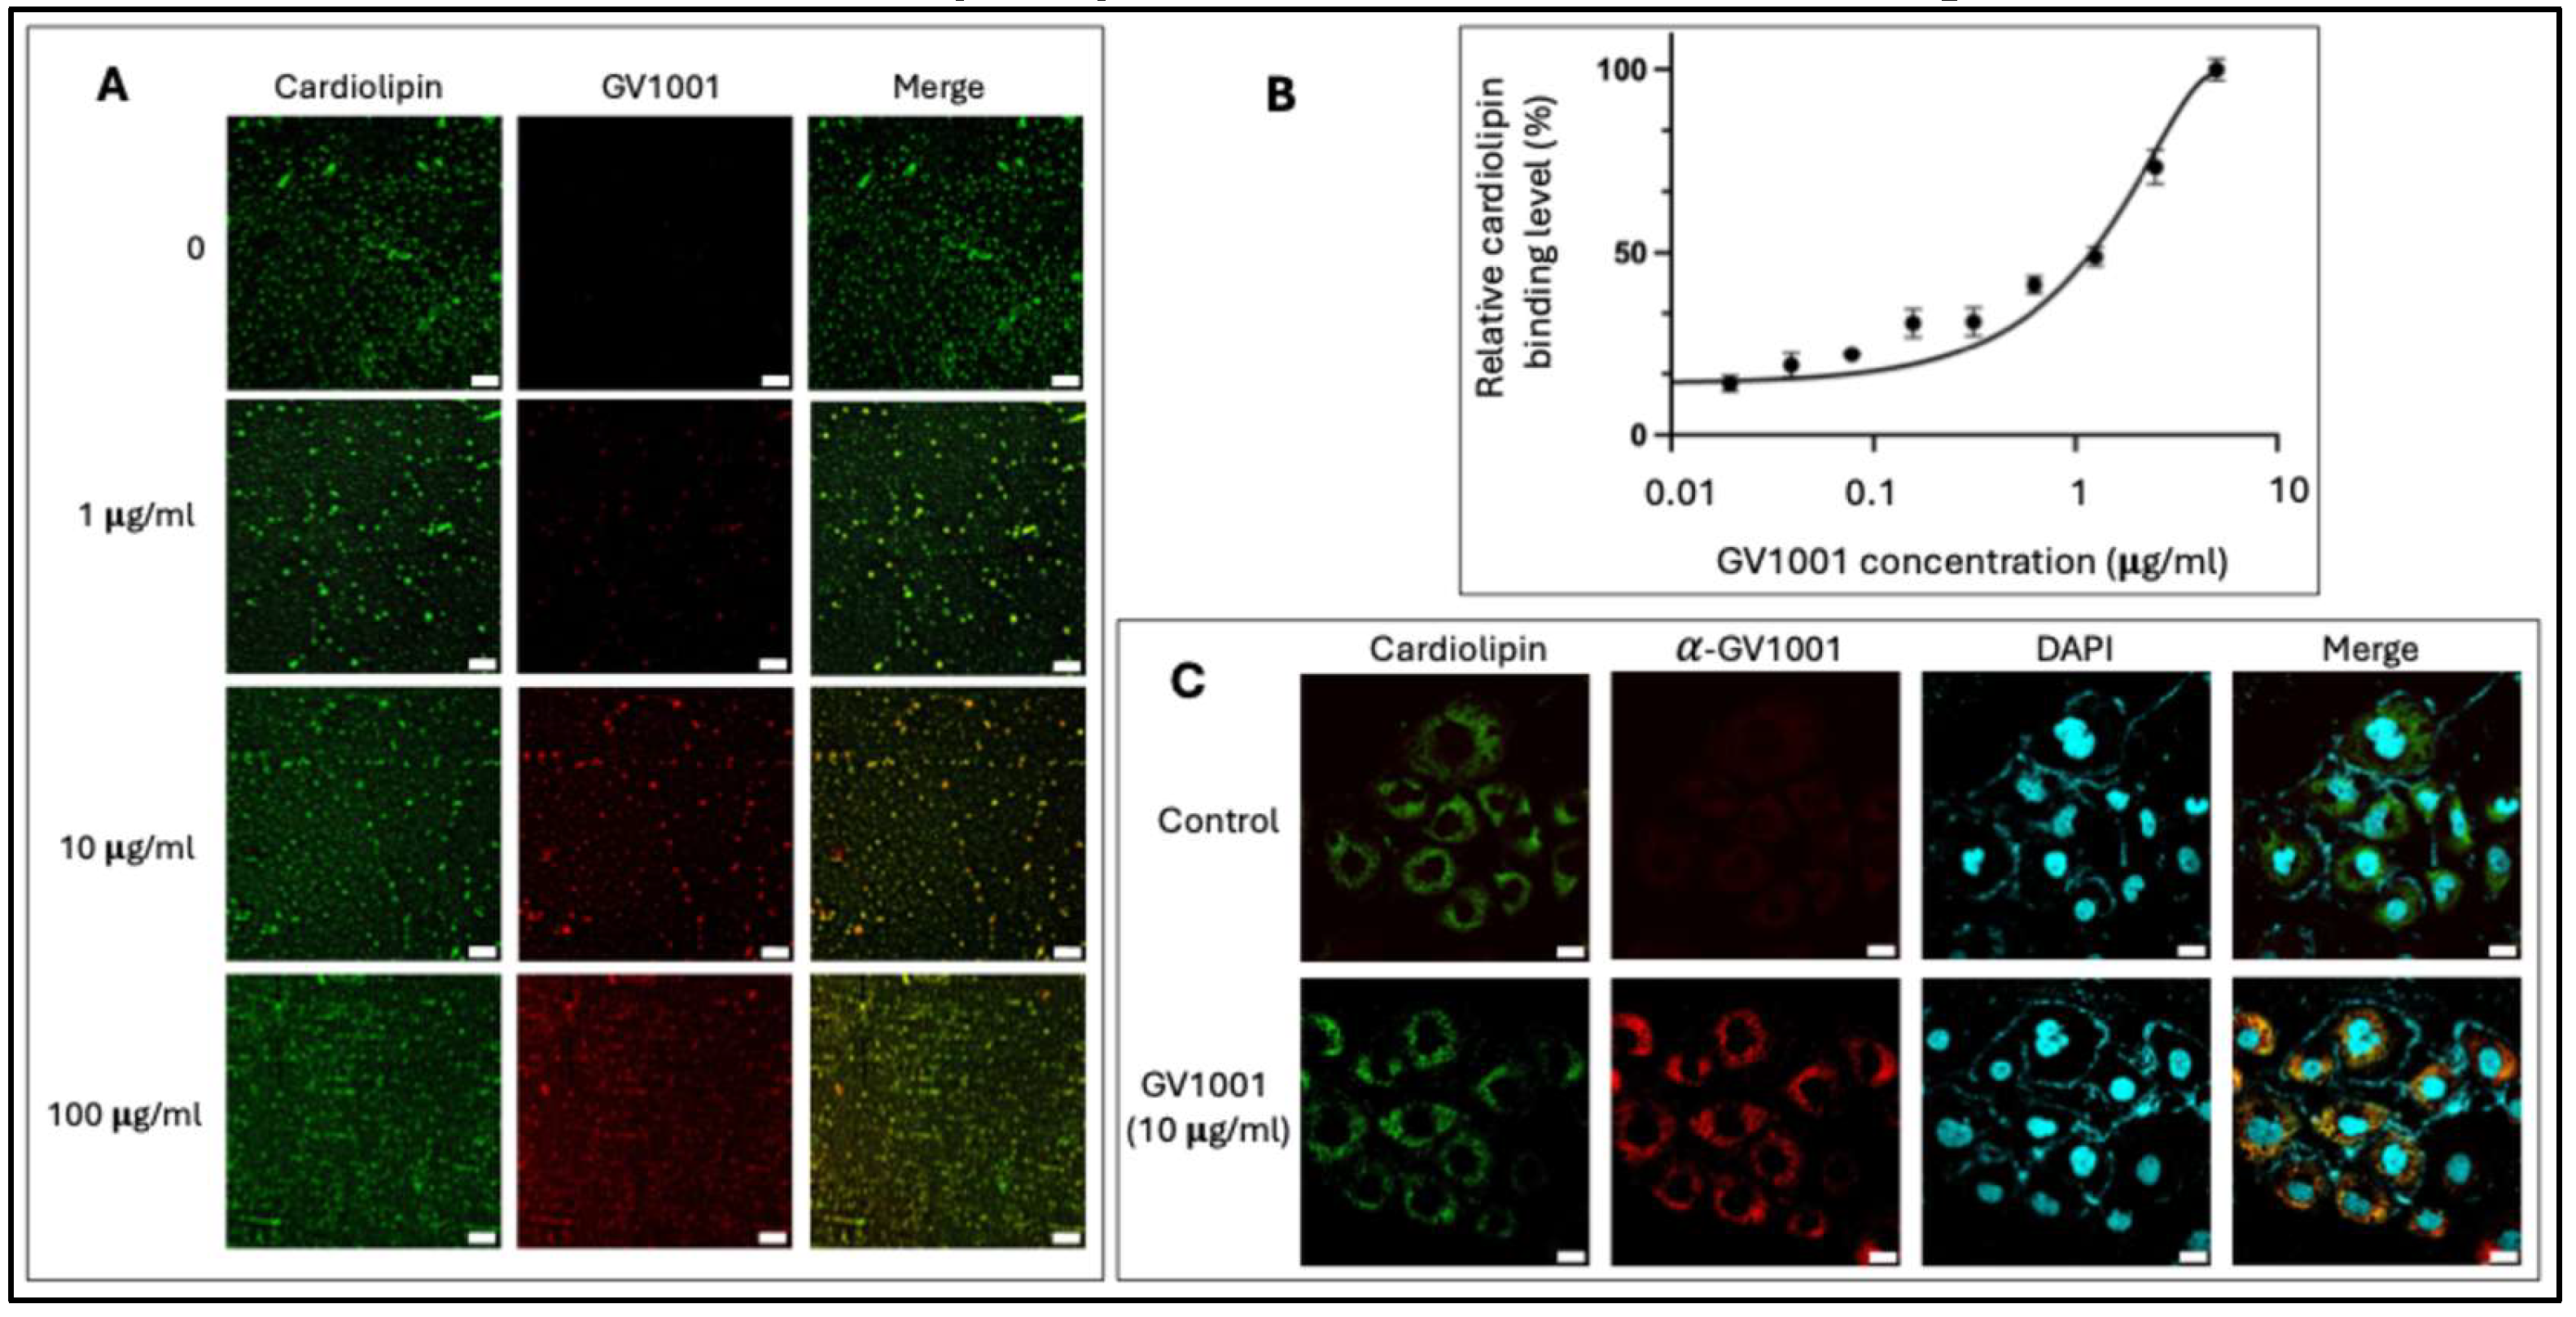
Cardiolipin is a unique phospholipid predominantly localized in the inner mitochondrial membrane (IMM), where it is essential for maintaining membrane structure and integrity to ensure efficient electron transfer and ATP production [45]. Given cardiolipin’s central role in mitochondrial physiology and GV1001’s protective effects, we hypothesized that GV1001 may directly interact with cardiolipin. Immunofluorescence staining with α-GV1001 antibody revealed a dose-dependent binding of GV1001 to cardiolipin in vitro (Figure 7A). To further characterize this interaction, we performed an ELISA-based assay using cardiolipin-coated plates incubated with increasing concentrations of GV1001-FITC fusion protein. The assay demonstrated a concentration-dependent increase in fluorescence intensity, confirming GV1001’s binding to cardiolipin (Figure 7B). Ten-N-nonyl acridine orange (NAO), a fluorescent probe that binds to cardiolipin, was used to visualize the location of cardiolipin in mitochondria (Figure S4). Double staining with NAO and α-GV1001 antibody demonstrated that GV1001 diffused into the cytoplasm of HK-2 cells and colocalized with cardiolipin (Figure 7C). Furthermore, as shown in Figure S4, GV1001 was observed to accumulate in mitochondria, where it colocalized with MitoTracker probe in live HK-2 cells, providing additional evidence for GV1001’s mitochondrial targeting and interaction with cardiolipin.
4. Discussion
This study provides comprehensive evidence that GV1001 protects against cisplatin-induced nephrotoxicity through multi-faceted mechanisms centered on mitochondrial preservation. Cisplatin is a widely used chemotherapeutic agent, but its clinical utility is significantly limited by dose-dependent nephrotoxicity, which is largely driven by mitochondrial dysfunction, oxidative stress, inflammation, and apoptosis [46]. Our findings demonstrate that GV1001 effectively counteracts each of these pathogenic pathways, thereby preserving renal structure and function.
Histological analyses revealed that GV1001 prevented tubular dilation, necrosis, and cast formation, hallmarks of cisplatin-induced kidney injury. These morphological benefits were accompanied by a marked reduction in macrophage infiltration, serum uric acid accumulation, and tubular apoptosis. Importantly, GV1001 attenuated the cisplatin-induced upregulation of kidney injury biomarkers KIM-1 and NGAL, both of which are early diagnostic indicators and contributors to renal pathology [47,48]. By suppressing EMT, as shown by preservation of E-cadherin and reduction of α-SMA, GV1001 also inhibited fibrogenic remodeling, which plays a critical role in the progression from acute injury to chronic kidney disease [49,50].
At the mechanistic level, GV1001 displayed significant anti-inflammatory and anti-apoptotic effects. Cisplatin markedly induced renal and systemic expression of TNF-α, IL-1β, IL-6, and TGF-β isoforms, consistent with previous reports linking inflammation to nephrotoxicity [51]. GV1001 co-treatment significantly suppressed the expression of these pro-inflammatory cytokines, thereby limiting both local and systemic inflammatory responses. Furthermore, GV1001 inhibited mitochondrial apoptotic signaling by preventing cytochrome c release, caspase-3 and PARP cleavage, and DNA fragmentation. These effects were accompanied by suppression of stress-responsive signaling molecules, including p53, p38, Bax, and γ-H2AX, supporting a role for GV1001 in blocking DNA damage-driven apoptotic cascades [52].
Our mitochondrial functional assays provide further insight into the basis of GV1001’s renoprotective action. GV1001 restored mitochondrial mass, membrane potential, and ATP production, while suppressing excessive ROS generation, ferrous iron accumulation, and lipid peroxidation. These effects were paralleled by restoration of ETC complexes I–IV, suggesting that GV1001 stabilizes mitochondrial respiration and prevents bioenergetic collapse. Notably, we identified cardiolipin as a direct molecular target of GV1001. Cardiolipin is a mitochondria-specific phospholipid critical for ETC complex stability and the regulation of apoptosis [53]. Our binding and co-localization assays confirmed GV1001’s interaction with cardiolipin, providing a mechanistic explanation for its ability to preserve ETC function, suppress ROS amplification, and prevent cytochrome c release.
Collectively, these results establish GV1001 as a mitochondria-targeted therapeutic capable of preventing cisplatin-induced nephrotoxicity. Unlike other renoprotective agents that typically target a single pathogenic pathway [54,55,56], GV1001 exerts broad-spectrum protection by stabilizing mitochondrial function, reducing inflammation, suppressing EMT, and inhibiting apoptosis. Future studies should evaluate whether GV1001 selectively protects normal renal tissue without diminishing cisplatin’s antitumor efficacy, as this will be essential for clinical translation.
In summary, our findings demonstrate that GV1001 protects against cisplatin-induced nephrotoxicity by attenuating EMT, inflammation, mitochondrial dysfunction, and apoptosis. These results support GV1001 as a promising therapeutic candidate for preventing CIN and provide mechanistic insights into its renal protective effect. Targeting mitochondria with GV1001 may represent a novel strategy to reduce chemotherapy-associated kidney injury and improve cancer treatment outcomes.
5. Conclusions
GV1001 protects against cisplatin-induced nephrotoxicity by suppressing tubular damage, inflammation, EMT, and apoptosis, while preserving mitochondrial integrity and ATP production. By restoring ETC function by likely binding cardiolipin, GV1001 interrupts the cascade of cisplatin-induced mitochondrial dysfunction that drives kidney injury. These findings position GV1001 as a promising mitochondria-targeted therapy to reduce chemotherapy-associated nephrotoxicity and improve the safety of cisplatin-based cancer treatment.
Supplementary Materials
The following supporting information can be downloaded at the website of this paper posted on Preprints.org. Figure S1. GV1001 inhibited the cisplatin-induced release of cytochrome c from mitochondria to cytosol in renal cells; Figure S2. GV1001 alleviated the cisplatin-induced cellular ROS levels in renal cells; Figure S3. GV1001 reversed the inhibitory effect of cisplatin on the level of ETC complexes. Figure S4. GV1001 translocated into cells and accumulated in the mitochondria of HK-2 cells; Figures S5, S6 and S7. Original western blot figures for Figure 6C, 6D and 6E. Table S1. Sequences of the primers for quantitative reverse transcription–polymerase chain reaction (RT-qPCR).
Author Contributions
No-Hee Park: Responsible for the entire study, including the creation of the hypothesis and aims of the study, design of the experiment, analysis and interpretation of data, problem solving, supervision, resources, preparation and editing the final draft of the manuscript, etc. Wei Chen: In vitro and in vivo studies studies, including RT-qPCR, immunostaining, cell culture, etc. Collected data analysis, Manuscript preparation and editing. Cheyenne Beheshtian: Collection of animal tissue, sections and immunofluoresecnt staining, and manucsript editing. Seojin Kim: In vitro studies, including cell culture and immunoflurescent stainings. manuscript editing. Reuben Kim: Study design and editing the manuscript. Sangjae Kim: Dr. Kim conceptulaized the study, including the working hypothesis and aims of the study. He was also involved in the preparation of manuscript, and editing the final draft of the manuscript.
Funding
This work was supported, in part, by the research funds awarded from the UCLA Chancellor’s Office and various private donations (N-HP) and 1R21DE031074-01A1 (WC).
Institutional Review Board Statement
All animal procedures were performed in compliance with the institution’s policy and applicable provisions of the United States Department of Agriculture (USDA) Animal Welfare Act Regulations and the Public Health Service (PHS) Policy. The experimental protocols were approved by the Animal Research Committee (ARC) of the University of California, Los Angeles (UCLA) under ARC# 2019-057.
Informed Consent Statement
Not applicable.
Data Availability Statement
Data is available upon request to the corresponding author.
Conflicts of Interest
Dr. Sangjae Kim serves as a scientific consultant for GemVax/Kael, Inc., the provider of GV1001 for this study. The authors confirm that the research was conducted without any commercial or financial relationships that could be perceived as a potential conflict of interest. Additionally, the funders, including UCLA, NIH, and various donors played no role in the study’s design, data collection, analysis, interpretation, or the decision to publish the results.
References
- Dasari, S.; Tchounwou, P.B. Cisplatin in cancer therapy: molecular mechanisms of action. Eur J Pharmacol 2014, 740, 364-378. [CrossRef]
- Davoudi, M.; Jadidi, Y.; Moayedi, K.; Farrokhi, V.; Afrisham, R. Ameliorative impacts of polymeric and metallic nanoparticles on cisplatin-induced nephrotoxicity: a 2011-2022 review. J Nanobiotechnology 2022, 20, 504.
- Qi, L.; Luo, Q.; Zhang, Y.; Jia, F.; Zhao, Y.; Wang, F. Advances in Toxicological Research of the Anticancer Drug Cisplatin. Chem Res Toxicol 2019, 32, 1469-1486. [CrossRef]
- Miller, R.P.; Tadagavadi, R.K.; Ramesh, G.; Reeves, W.B. Mechanisms of Cisplatin nephrotoxicity. Toxins (Basel) 2010, 2, 2490-2518.
- Yao, X.; Panichpisal, K.; Kurtzman, N.; Nugent, K. Cisplatin nephrotoxicity: a review. Am J Med Sci 2007, 334, 115-124.
- Sikking, C.; Niggebrugge-Mentink, K.L.; van der Sman, A.S.E.; Smit, R.H.P.; Bouman-Wammes, E.W.; Beex-Oosterhuis, M.M.; van Kesteren, C. Hydration Methods for Cisplatin Containing Chemotherapy: A Systematic Review. Oncologist 2024, 29, e173-e186. [CrossRef]
- Kleih, M.; Bopple, K.; Dong, M.; Gaissler, A.; Heine, S.; Olayioye, M.A.; Aulitzky, W.E.; Essmann, F. Direct impact of cisplatin on mitochondria induces ROS production that dictates cell fate of ovarian cancer cells. Cell Death Dis 2019, 10, 851.
- Bhargava, P.; Schnellmann, R.G. Mitochondrial energetics in the kidney. Nat Rev Nephrol 2017, 13, 629-646. [CrossRef]
- Zorov, D.B.; Juhaszova, M.; Sollott, S.J. Mitochondrial reactive oxygen species (ROS) and ROS-induced ROS release. Physiol Rev 2014, 94, 909-950. [CrossRef]
- Zorova, L.D.; Popkov, V.A.; Plotnikov, E.Y.; Silachev, D.N.; Pevzner, I.B.; Jankauskas, S.S.; Babenko, V.A.; Zorov, S.D.; Balakireva, A.V.; Juhaszova, M.; et al. Mitochondrial membrane potential. Anal Biochem 2018, 552, 50-59.
- Kim, S.; Kim, B.J.; Kim, I.; Kim, J.H.; Kim, H.K.; Ryu, H.; Choi, D.R.; Hwang, I.G.; Song, H.; Kwon, J.H.; et al. A phase II study of chemotherapy in combination with telomerase peptide vaccine (GV1001) as second-line treatment in patients with metastatic colorectal cancer. J Cancer 2022, 13, 1363-1369. [CrossRef]
- Chen, W.; Shin, K.H.; Kim, S.; Shon, W.J.; Kim, R.H.; Park, N.H.; Kang, M.K. hTERT peptide fragment GV1001 demonstrates radioprotective and antifibrotic effects through suppression of TGF-beta signaling. Int J Mol Med 2018, 41, 3211-3220.
- Park, H.H.; Lee, K.Y.; Kim, S.; Lee, J.W.; Choi, N.Y.; Lee, E.H.; Lee, Y.J.; Lee, S.H.; Koh, S.H. Novel vaccine peptide GV1001 effectively blocks beta-amyloid toxicity by mimicking the extra-telomeric functions of human telomerase reverse transcriptase. Neurobiol Aging 2014, 35, 1255-1274.
- Chen, W.; Kim, S.Y.; Lee, A.; Kim, Y.J.; Chang, C.; Ton-That, H.; Kim, R.; Kim, S.; Park, N.H. hTERT Peptide Fragment GV1001 Prevents the Development of Porphyromonas gingivalis-Induced Periodontal Disease and Systemic Disorders in ApoE-Deficient Mice. Int J Mol Sci 2024, 25, 6126. [CrossRef]
- Chen, W.; Kim, S.; Kim, S.Y.; Beheshtian, C.; Kim, N.; Shin, K.H.; Kim, R.H.; Kim, S.; Park, N.H. GV1001, hTERT Peptide Fragment, Prevents Doxorubicin-Induced Endothelial-to-Mesenchymal Transition in Human Endothelial Cells and Atherosclerosis in Mice. Cells 2025, 14, 98.
- Choi, I.A.; Choi, J.Y.; Jung, S.; Basri, F.; Park, S.; Lee, E.Y. GV1001 immunotherapy ameliorates joint inflammation in a murine model of rheumatoid arthritis by modifying collagen-specific T-cell responses and downregulating antigen-presenting cells. Int Immunopharmacol 2017, 46, 186-193. [CrossRef]
- Li, C.; Tian, Y.; Sun, F.; Lei, G.; Cheng, J.; Tian, C.; Yu, H.; Deng, Z.; Lu, S.; Wang, L.; et al. A Recombinant Oncolytic Influenza Virus Carrying GV1001 Triggers an Antitumor Immune Response. Hum Gene Ther 2024, 35, 48-58. [CrossRef]
- Kim, S.Y.; Kim, Y.J.; Kim, S.; Momeni, M.; Lee, A.; Treanor, A.; Kim, S.; Kim, R.H.; Park, N.H. GV1001 Inhibits the Severity of the Ligature-Induced Periodontitis and the Vascular Lipid Deposition Associated with the Periodontitis in Mice. Int J Mol Sci 2023, 24, 12566. [CrossRef]
- Park, H.H.; Yu, H.J.; Kim, S.; Kim, G.; Choi, N.Y.; Lee, E.H.; Lee, Y.J.; Yoon, M.Y.; Lee, K.Y.; Koh, S.H. Neural stem cells injured by oxidative stress can be rejuvenated by GV1001, a novel peptide, through scavenging free radicals and enhancing survival signals. Neurotoxicology 2016, 55, 131-141. [CrossRef]
- Lee, S.A.; Kim, J.; Sim, J.; Kim, S.G.; Kook, Y.H.; Park, C.G.; Kim, H.R.; Kim, B.J. A telomerase-derived peptide regulates reactive oxygen species and hepatitis C virus RNA replication in HCV-infected cells via heat shock protein 90. Biochem Biophys Res Commun 2016, 471, 156-162.
- Ma, N.; Wei, Z.; Hu, J.; Gu, W.; Ci, X. Farrerol Ameliorated Cisplatin-Induced Chronic Kidney Disease Through Mitophagy Induction via Nrf2/PINK1 Pathway. Front Pharmacol 2021, 12, 768700. [CrossRef]
- Chen, J.; Chen, J.K.; Conway, E.M.; Harris, R.C. Survivin mediates renal proximal tubule recovery from AKI. J Am Soc Nephrol 2013, 24, 2023-2033.
- Jang, S.K.; Ahn, S.H.; Kim, G.; Kim, S.; Hong, J.; Park, K.S.; Park, I.C.; Jin, H.O. Inhibition of VDAC1 oligomerization blocks cysteine deprivation-induced ferroptosis via mitochondrial ROS suppression. Cell Death Dis 2024, 15, 811. [CrossRef]
- Tadokoro, T.; Ikeda, M.; Ide, T.; Deguchi, H.; Ikeda, S.; Okabe, K.; Ishikita, A.; Matsushima, S.; Koumura, T.; Yamada, K.I.; et al. Mitochondria-dependent ferroptosis plays a pivotal role in doxorubicin cardiotoxicity. JCI Insight 2020, 5, e132747.
- Bharat, V.; Durairaj, A.S.; Vanhauwaert, R.; Li, L.; Muir, C.M.; Chandra, S.; Kwak, C.S.; Le Guen, Y.; Nandakishore, P.; Hsieh, C.H.; et al. A mitochondrial inside-out iron-calcium signal reveals drug targets for Parkinson's disease. Cell Rep 2023, 42, 113544. [CrossRef]
- Suh, J.S.; Lee, S.H.; Fouladian, Z.; Lee, J.Y.; Kim, T.; Kang, M.K.; Lusis, A.J.; Bostrom, K.I.; Kim, R.H.; Park, N.H. Rosuvastatin Prevents the Exacerbation of Atherosclerosis in Ligature-Induced Periodontal Disease Mouse Model. Sci Rep 2020, 10, 6383. [CrossRef]
- Suh, J.S.; Kim, S.Y.J.; Lee, S.H.; Kim, R.H.; Park, N.H. Hyperlipidemia is necessary for the initiation and progression of atherosclerosis by severe periodontitis in mice. Mol Med Rep 2022, 26, 273.
- Lin, H.Y.; Liang, C.J.; Yang, M.Y.; Chen, P.L.; Wang, T.M.; Chen, Y.H.; Shih, Y.H.; Liu, W.; Chiu, C.C.; Chiang, C.K.; et al. Critical roles of tubular mitochondrial ATP synthase dysfunction in maleic acid-induced acute kidney injury. Apoptosis 2024, 29, 620-634. [CrossRef]
- Sun, Y.; Preiss, N.K.; Valenteros, K.B.; Kamal, Y.; Usherwood, Y.K.; Frost, H.R.; Usherwood, E.J. Zbtb20 Restrains CD8 T Cell Immunometabolism and Restricts Memory Differentiation and Antitumor Immunity. J Immunol 2020, 205, 2649-2666. [CrossRef]
- Lakowicz, J.R.; Malicka, J.; Huang, J.; Gryczynski, Z.; Gryczynski, I. Ultrabright fluorescein-labeled antibodies near silver metallic surfaces. Biopolymers 2004, 74, 467-475.
- Hwang, K.Y.; Choi, Y.B. Modulation of Mitochondrial Antiviral Signaling by Human Herpesvirus 8 Interferon Regulatory Factor 1. J Virol 2016, 90, 506-520.
- McSweeney, K.R.; Gadanec, L.K.; Qaradakhi, T.; Ali, B.A.; Zulli, A.; Apostolopoulos, V. Mechanisms of Cisplatin-Induced Acute Kidney Injury: Pathological Mechanisms, Pharmacological Interventions, and Genetic Mitigations. Cancers (Basel) 2021, 13, 1572. [CrossRef]
- Ozkok, A.; Edelstein, C.L. Pathophysiology of cisplatin-induced acute kidney injury. Biomed Res Int 2014, 2014, 967826.
- Roncal, C.A.; Mu, W.; Croker, B.; Reungjui, S.; Ouyang, X.; Tabah-Fisch, I.; Johnson, R.J.; Ejaz, A.A. Effect of elevated serum uric acid on cisplatin-induced acute renal failure. Am J Physiol Renal Physiol 2007, 292, F116-122. [CrossRef]
- Tanase, D.M.; Gosav, E.M.; Radu, S.; Costea, C.F.; Ciocoiu, M.; Carauleanu, A.; Lacatusu, C.M.; Maranduca, M.A.; Floria, M.; Rezus, C. The Predictive Role of the Biomarker Kidney Molecule-1 (KIM-1) in Acute Kidney Injury (AKI) Cisplatin-Induced Nephrotoxicity. Int J Mol Sci 2019, 20, 5238.
- Chen, S.; Xue, K.; Zhao, R.; Chai, J.; Zhu, X.; Kong, X.; Ding, Y.; Xu, L.; Wang, W. Insufficient S-sulfhydration of cAMP-response element binding protein 1 participates in hyperhomocysteinemia or cisplatin induced kidney fibrosis via promoting epithelial-mesenchymal transition. Free Radic Biol Med 2025, 237, 312-325. [CrossRef]
- Mihai, S.; Codrici, E.; Popescu, I.D.; Enciu, A.M.; Albulescu, L.; Necula, L.G.; Mambet, C.; Anton, G.; Tanase, C. Inflammation-Related Mechanisms in Chronic Kidney Disease Prediction, Progression, and Outcome. J Immunol Res 2018, 2018, 2180373.
- Verissimo, T.; de Seigneux, S. New evidence of the impact of mitochondria on kidney health and disease. Nat Rev Nephrol 2024, 20, 81-82.
- Wang, Y.; Cai, J.; Tang, C.; Dong, Z. Mitophagy in Acute Kidney Injury and Kidney Repair. Cells 2020, 9, 338.
- Pham, L.; Arroum, T.; Wan, J.; Pavelich, L.; Bell, J.; Morse, P.T.; Lee, I.; Grossman, L.I.; Sanderson, T.H.; Malek, M.H.; et al. Regulation of mitochondrial oxidative phosphorylation through tight control of cytochrome c oxidase in health and disease - Implications for ischemia/reperfusion injury, inflammatory diseases, diabetes, and cancer. Redox Biol 2024, 78, 103426. [CrossRef]
- Li, J.Y.; Sun, X.A.; Wang, X.; Yang, N.H.; Xie, H.Y.; Guo, H.J.; Lu, L.; Xie, X.; Zhou, L.; Liu, J.; et al. PGAM5 exacerbates acute renal injury by initiating mitochondria-dependent apoptosis by facilitating mitochondrial cytochrome c release. Acta Pharmacol Sin 2024, 45, 125-136. [CrossRef]
- Liu, P.F.; Hu, Y.C.; Kang, B.H.; Tseng, Y.K.; Wu, P.C.; Liang, C.C.; Hou, Y.Y.; Fu, T.Y.; Liou, H.H.; Hsieh, I.C.; et al. Expression levels of cleaved caspase-3 and caspase-3 in tumorigenesis and prognosis of oral tongue squamous cell carcinoma. PLoS One 2017, 12, e0180620. [CrossRef]
- Gorbunova, A.S.; Denisenko, T.V.; Yapryntseva, M.A.; Pivnyuk, A.D.; Prikazchikova, T.A.; Gogvadze, V.G.; Zhivotovsky, B. BNIP3 as a Regulator of Cisplatin-Induced Apoptosis. Biochemistry (Mosc) 2020, 85, 1245-1253.
- Tait, S.W.; Green, D.R. Mitochondria and cell death: outer membrane permeabilization and beyond. Nat Rev Mol Cell Biol 2010, 11, 621-632.
- Jiang, Z.; Shen, T.; Huynh, H.; Fang, X.; Han, Z.; Ouyang, K. Cardiolipin Regulates Mitochondrial Ultrastructure and Function in Mammalian Cells. Genes (Basel) 2022, 13, 1889.
- Tang, C.; Livingston, M.J.; Safirstein, R.; Dong, Z. Cisplatin nephrotoxicity: new insights and therapeutic implications. Nat Rev Nephrol 2023, 19, 53-72. [CrossRef]
- Strader, M.; Friedman, G.; Benain, X.; Camerlingo, N.; Sultana, S.; Shapira, S.; Aber, N.; Murray, P.T. Early and Sensitive Detection of Cisplatin-Induced Kidney Injury Using Novel Biomarkers. Kidney Int Rep 2025, 10, 1175-1187.
- Virzi, G.M.; Morisi, N.; Oliveira Paulo, C.; Clementi, A.; Ronco, C.; Zanella, M. Neutrophil Gelatinase-Associated Lipocalin: Biological Aspects and Potential Diagnostic Use in Acute Kidney Injury. J Clin Med 2025, 14, 1570.
- Huang, R.; Fu, P.; Ma, L. Kidney fibrosis: from mechanisms to therapeutic medicines. Signal Transduct Target Ther 2023, 8, 129.
- Hadpech, S.; Thongboonkerd, V. Epithelial-mesenchymal plasticity in kidney fibrosis. Genesis 2024, 62, e23529. [CrossRef]
- Elmorsy, E.A.; Saber, S.; Hamad, R.S.; Abdel-Reheim, M.A.; El-Kott, A.F.; AlShehri, M.A.; Morsy, K.; Salama, S.A.; Youssef, M.E. Advances in understanding cisplatin-induced toxicity: Molecular mechanisms and protective strategies. Eur J Pharm Sci 2024, 203, 106939.
- Hirata, Y.; Takahashi, M.; Yamada, Y.; Matsui, R.; Inoue, A.; Ashida, R.; Noguchi, T.; Matsuzawa, A. trans-Fatty acids promote p53-dependent apoptosis triggered by cisplatin-induced DNA interstrand crosslinks via the Nox-RIP1-ASK1-MAPK pathway. Sci Rep 2021, 11, 10350.
- Fuentes, J.M.; Morcillo, P. The Role of Cardiolipin in Mitochondrial Function and Neurodegenerative Diseases. Cells 2024, 13, 609.
- Onuigbo, M. Renoprotection and the Bardoxolone Methyl Story - Is This the Right Way Forward? A Novel View of Renoprotection in CKD Trials: A New Classification Scheme for Renoprotective Agents. Nephron Extra 2013, 3, 36-49.
- Louvis, N.; Coulson, J. Renoprotection by Direct Renin Inhibition: A Systematic Review and Meta- Analysis. Curr Vasc Pharmacol 2018, 16, 157-167.
- Ren, Y.; Wang, J.; Guo, W.; Chen, J.; Wu, X.; Gu, S.; Xu, L.; Wu, Z.; Wang, Y. Renoprotection of Microcystin-RR in Unilateral Ureteral Obstruction-Induced Renal Fibrosis: Targeting the PKM2-HIF-1alpha Pathway. Front Pharmacol 2022, 13, 830312.
Figure 1.
A-D. Representative H&E-stained kidney sections from mice treated with PBS (A), GV1001 (B), cisplatin (C), or cisplatin + GV1001 (D). Red arrows indicated dilated tubules with epithelial cell flattening and loss; yellow arrows pointed to areas of tubular necrosis and proteinaceous casts. E-H. Representative immunofluorescence images of monocytes/macrophages stained with F4/80 antibody in the kidney epithelium of mice treated with PBS (E), GV1001 (F), cisplatin (G), or cisplatin + GV1001 (H). Cells stained with F4/80 antibody was in red. Nuclei counterstained with DAPI (blue). Scale bar: 20 m. I. Tubular injury score of H&E-stained kidney sections were used to quantify renal tubular damage. J. Quantification of F4/80-positive staining area per field through ImageJ software. K. Uric acid levels were analyzed in the serum of mice. L. Representative immunofluorescent TUNEL staining in renal tubular epithelium from mice treated with PBS, GV1001, cisplatin alone or in combination with GV1001. TUNEL-positive cells (red) and DAPI counterstaining (blue). Scale bar: 20 m. M. Quantification of TUNEL-positive cells with ImageJ software (mean ± SEM, n = 8 per group). Data analyzed by one-way ANOVA. ns, not significant different; *P < 0.05; **P < 0.01; ****P < 0.0001 with n = 8 per group. All experiments were performed in triplicate.
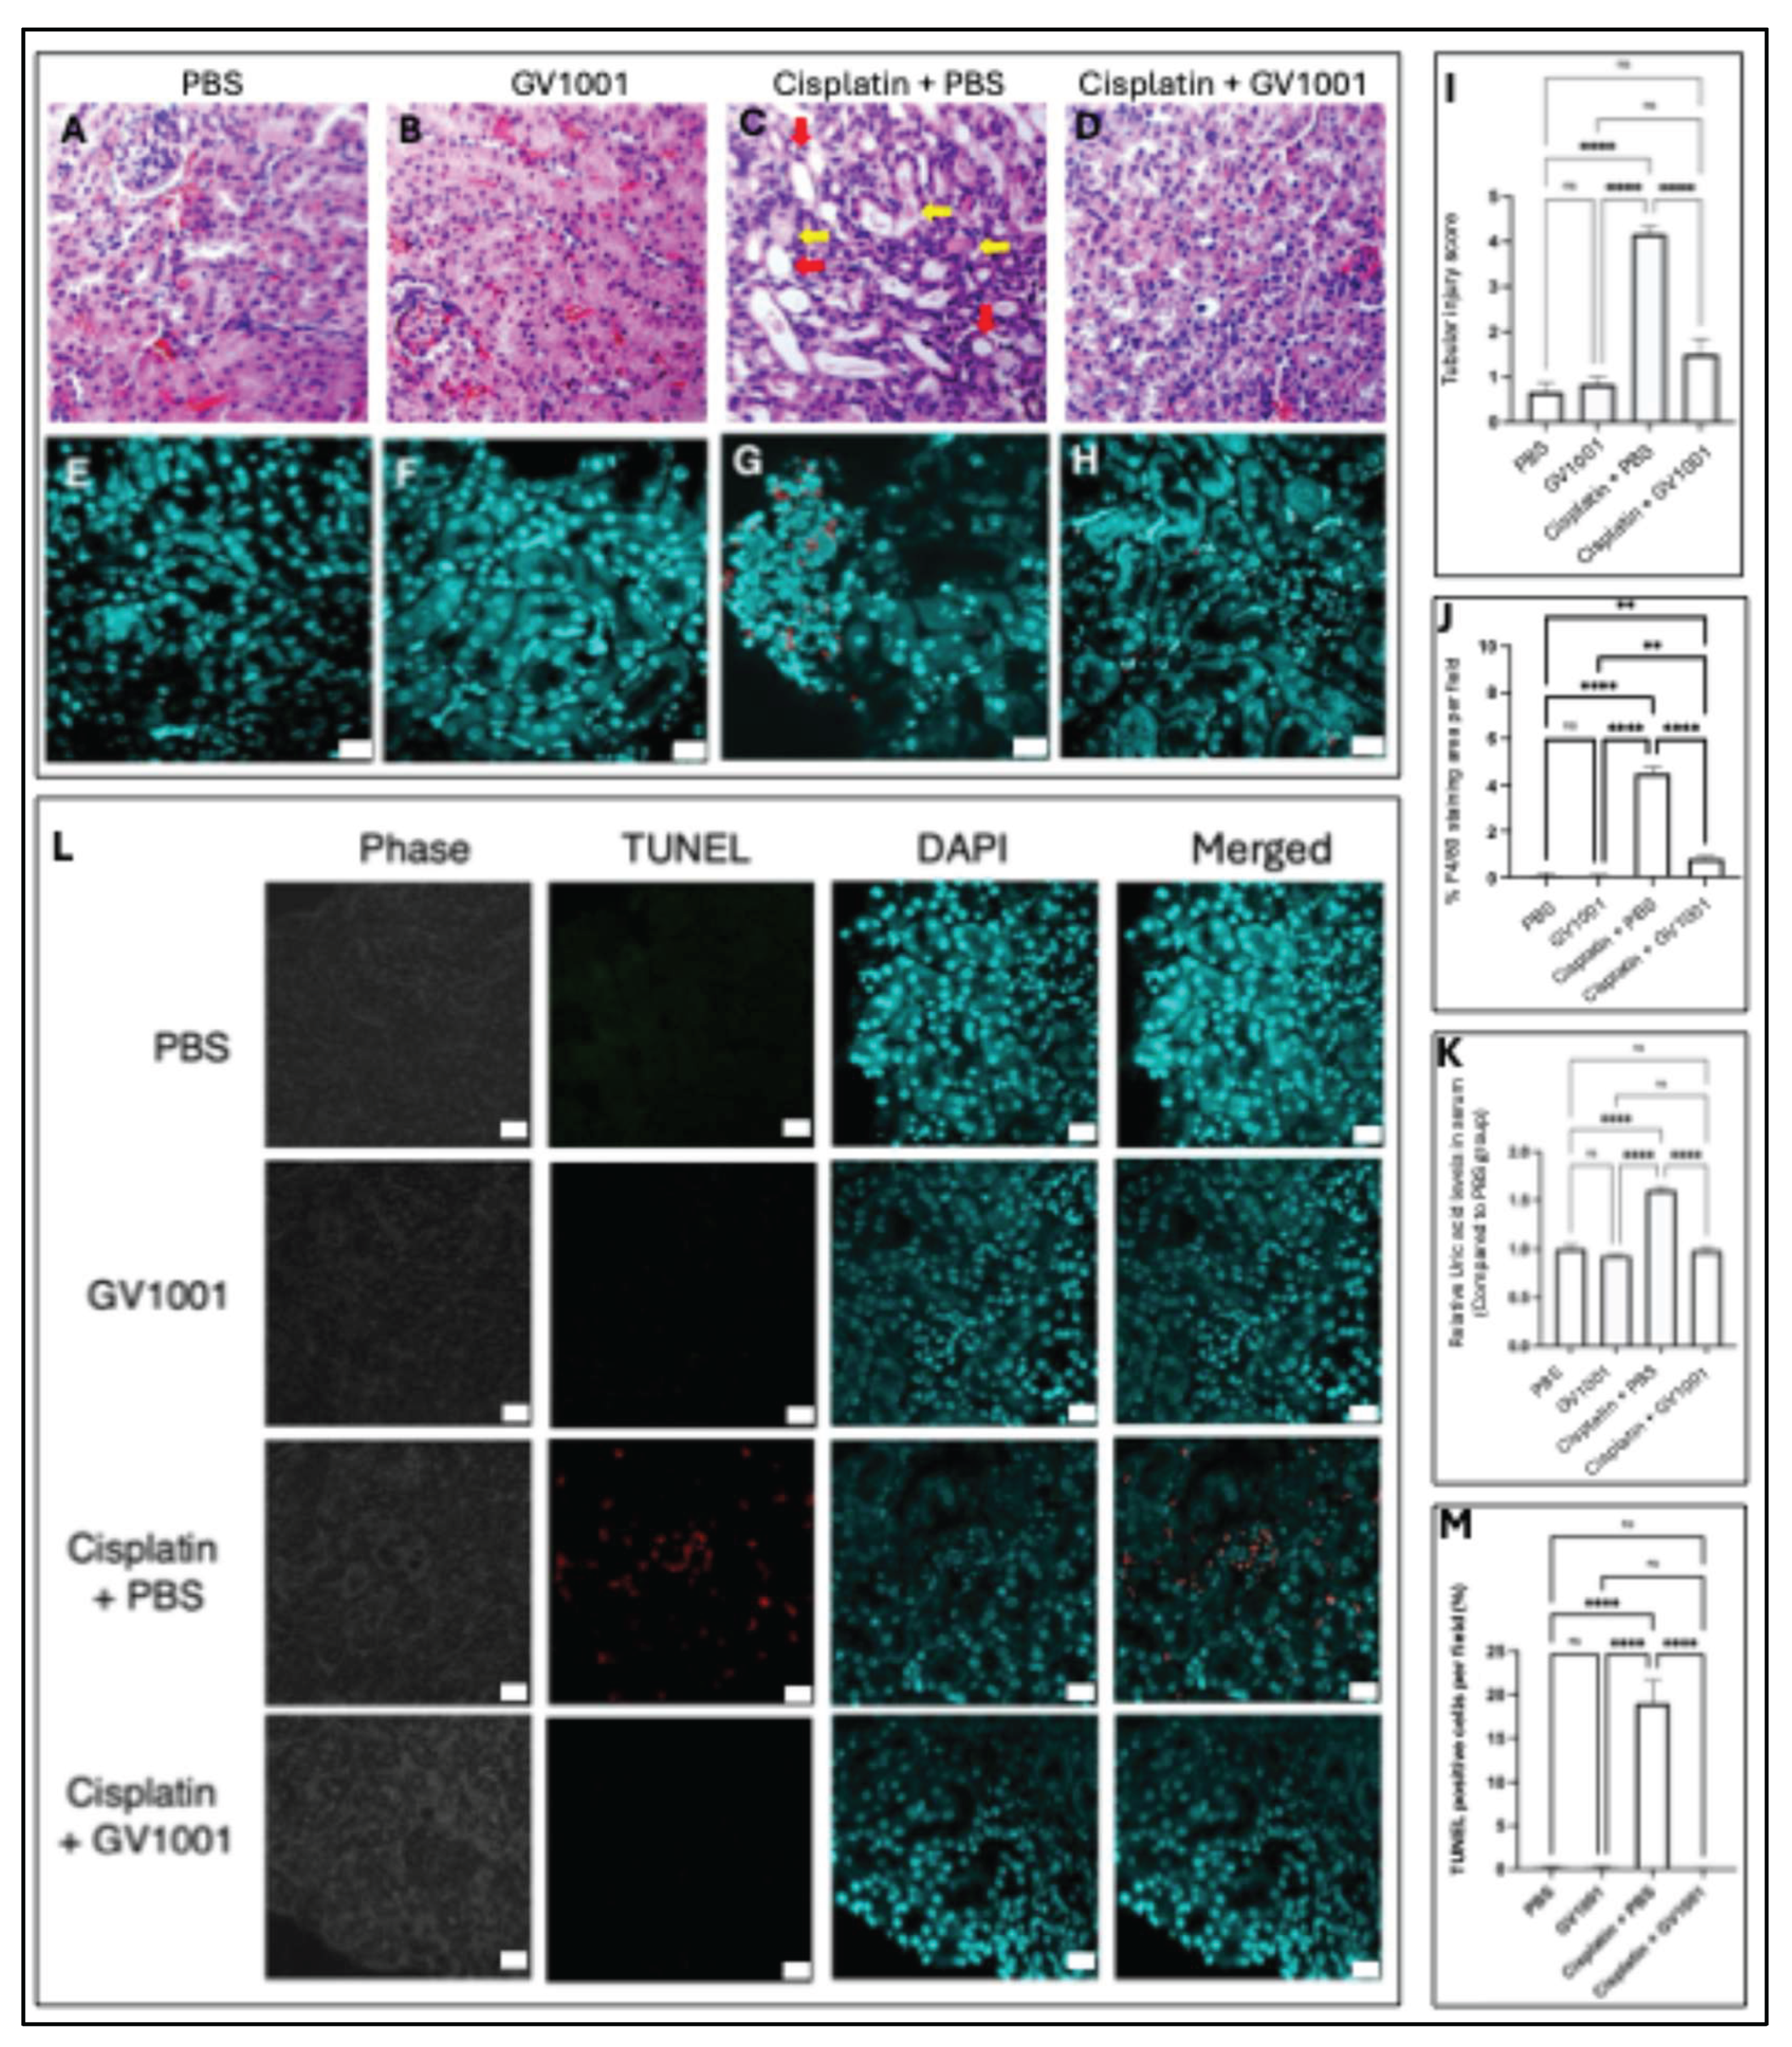
Figure 2.
A. and B. RT-PCR analysis of KIM-1 and NGAL expression in renal tissues of mice treated with PBS, GV1001, Cisplatin + PBS, or Cisplatin + GV1001. C. Representative immunofluorescent staining of KIM-1 in kidney cuboidal epithelium of mice. KIM-1 was marked in red; nuclei in blue (DAPI). Scale bar: 20 m. D. Quantification of positive staining area of KIM-1 per field using ImageJ software. Results were presented as mean ± SEM (n = 6 per group). Data analyzed by one-way ANOVA. ns = not significantly different; *P < 0.05; ****P < 0.0001. All experiments were performed in triplicate.
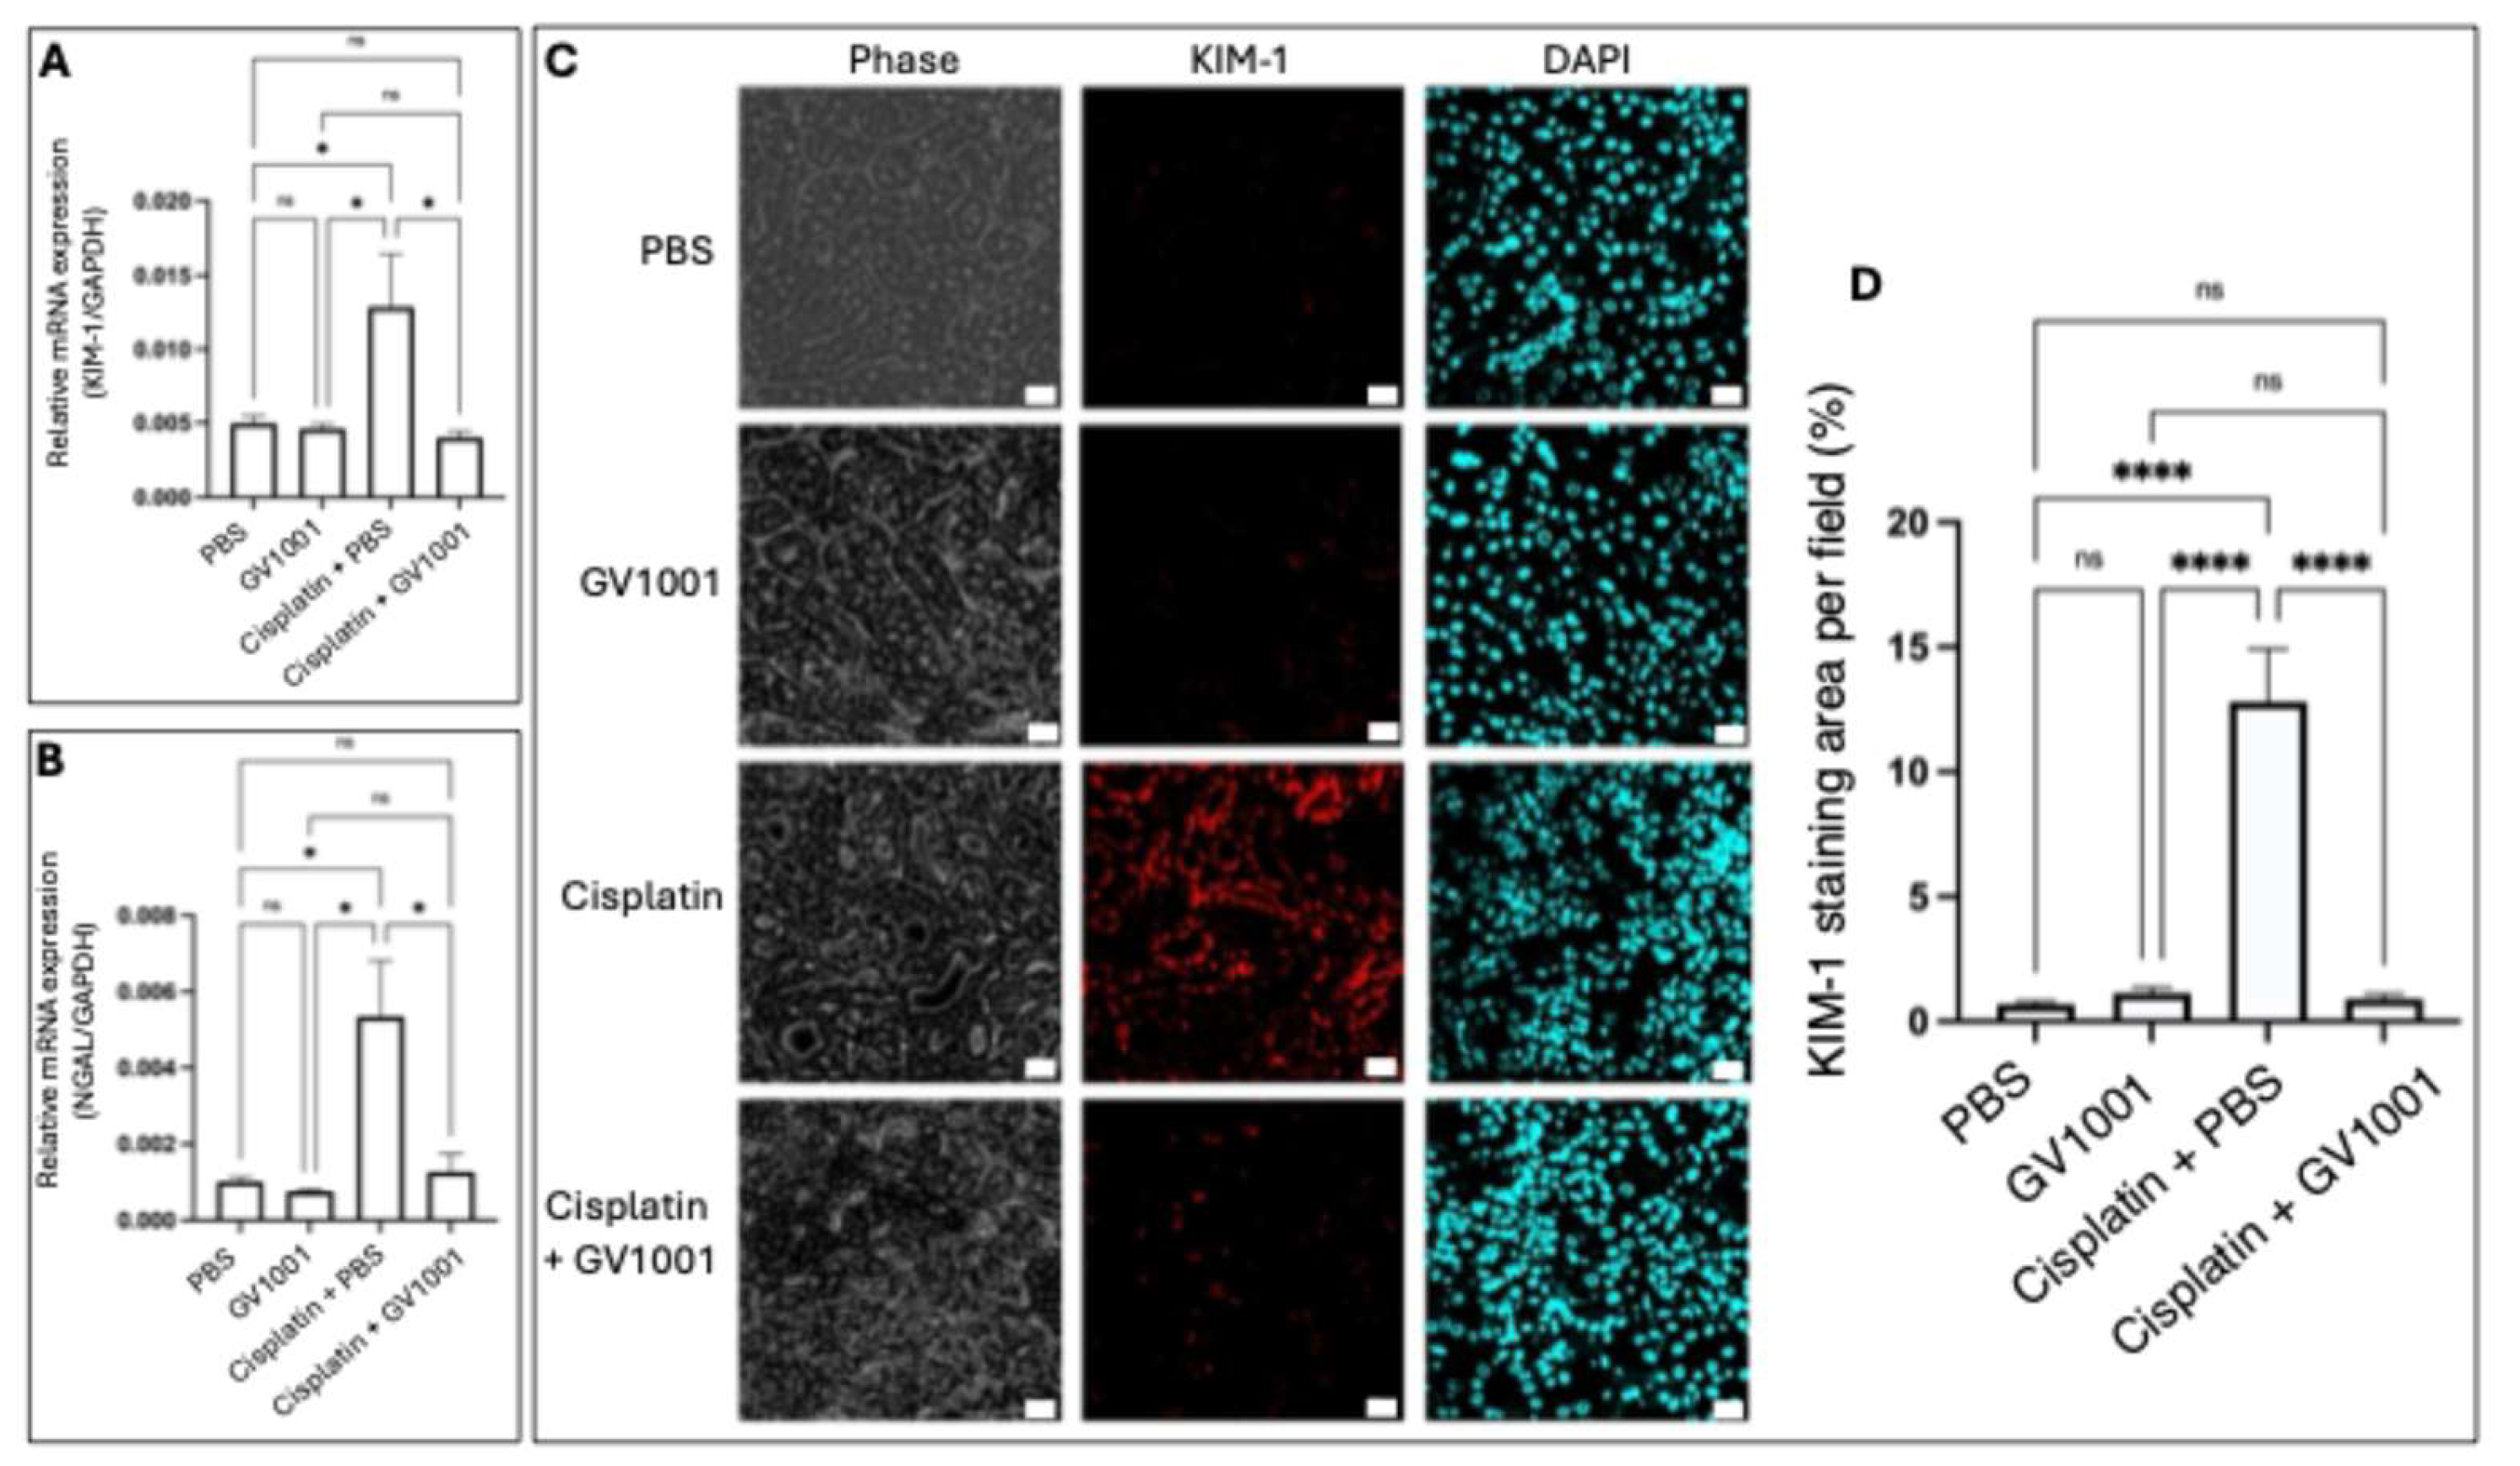
Figure 3.
A. Representative immunofluorescent staining images of E-cadherin and α-SMA in kidney cuboidal epithelium of mice treated with PBS, GV1001, Cisplatin or in combination with GV1001. E-cadherin were shown in green. α-SMA in red; nuclei in blue (DAPI). Scale bar: 20 m. B., C. Quantification of positive staining area of E-cadherin and α-SMA per field using ImageJ software. Results were presented as mean ± SEM (n = 6 per group). Data analyzed by one-way ANOVA. ns = not significantly different; *P < 0.05; **P < 0.01; ****P < 0.0001. All experiments were performed in triplicate.
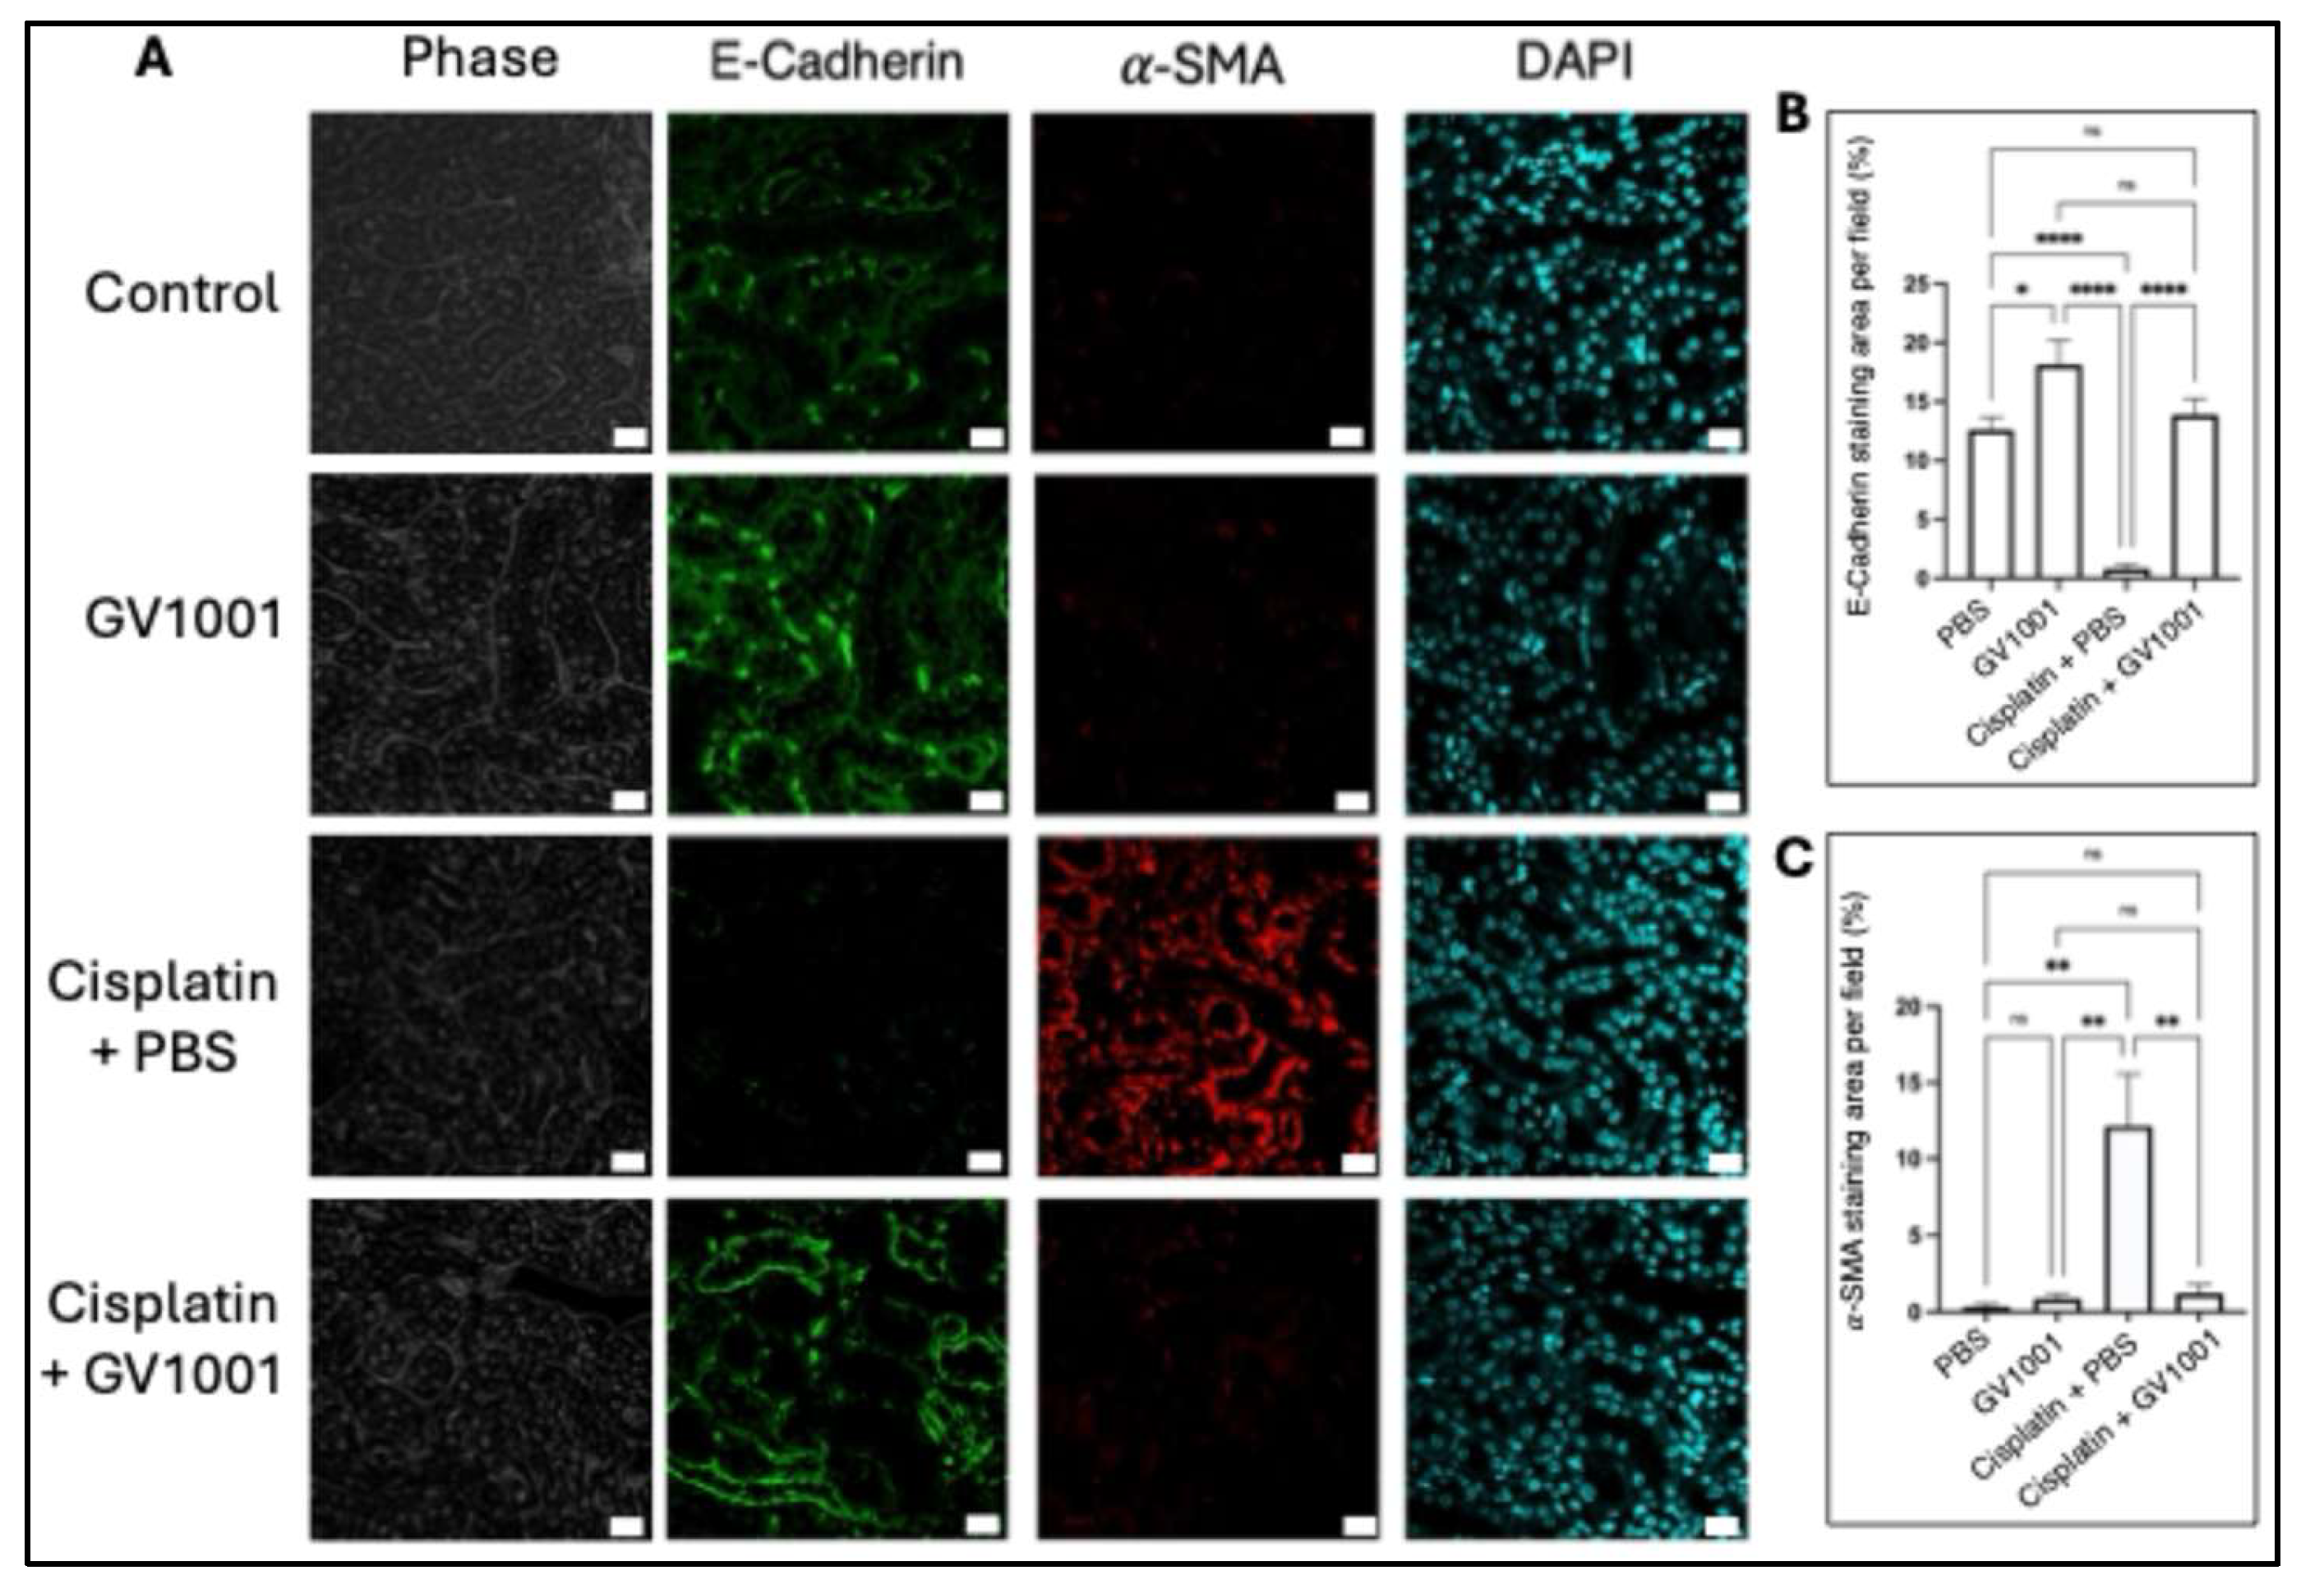
Figure 4.
A. GV1001 suppressed the cisplatin-induced upregulation of TNF-α, IL-1β, IL-6, TGF-β1 and TGF-β2 mRNA expression in renal tissue. Gene expression was quantified by RT-qPCR, with GAPDH as the internal control. B. Representative immunofluorescence images showing TNF-α, IL-1β, and IL-6 expression in the renal tubular epithelium of mice treated with PBS, GV1001, cisplatin alone or in combination with GV1001. Pro-inflammatory cytokines were shown in red; nuclei were counterstained with DAPI (blue). Scale bar: 20 m. C. ELISA analysis of TNF-α, IL-1β, and IL-6 levels in the sera of mice. Statistical significance was assessed by one-way ANOVA. Symbols indicated ns, not significant; *P < 0.05; **P < 0.01; ***P < 0.001; ****P < 0.0001. Data were presented as means ± SEM (n = 8). All experiments were performed in triplicate.
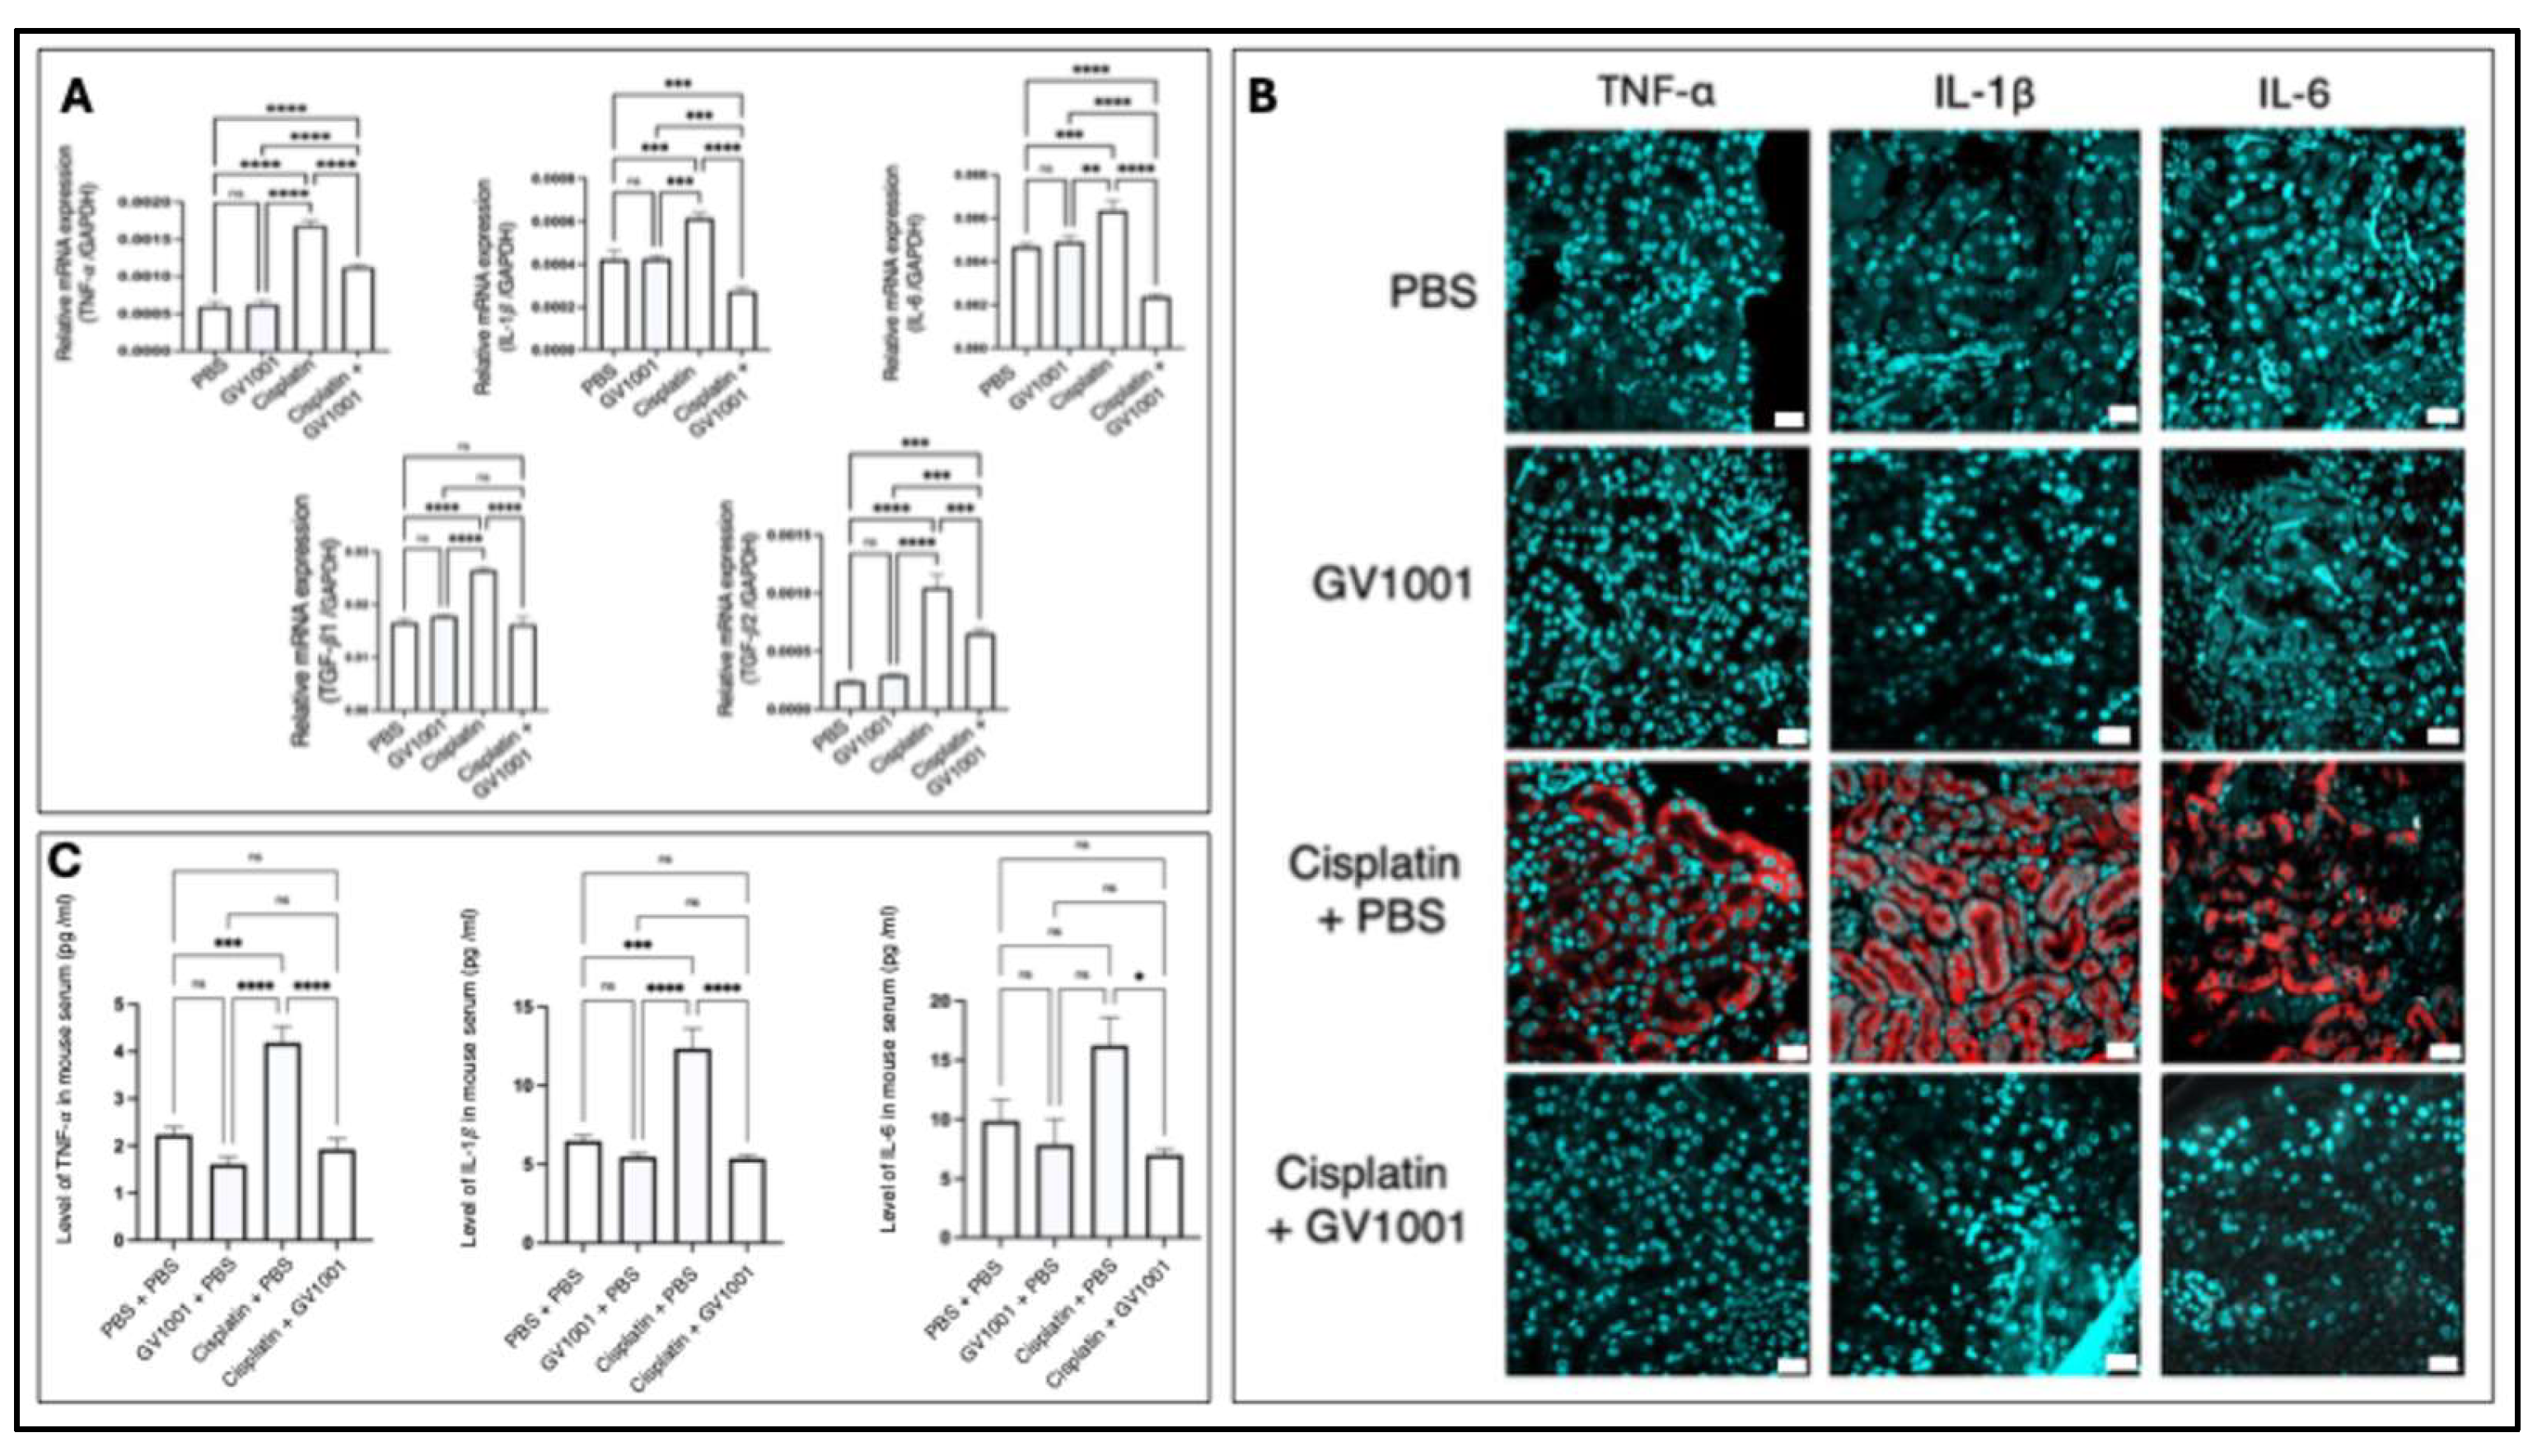
Figure 5.
A. Representative immunofluorescence images of mitochondrial mass detected by MitoTracker Red CMXRos. (red) in HK-2 cells treated with cisplatin, GV1001, or a combination of cisplatin and GV1001 for 24 hr. Scale bar: 10 μm. B. Quantification of mitochondrial mass using ImageJ analysis. Representative immunofluorescence images of mitochondrial ROS and mitochondrial ferrous iron (Mito-Fe²⁺) (C), lipid peroxidation (MitoPeDPP staining) (F), and MT-1 (indicator of MMP) (H). Scale bar: 20 μm. Quantification of mitochondrial ROS (D) and mitochondrial ferrous iron (E), lipid peroxidation (G), and MMP levels (I) using ImageJ software. J. Relative cellular ATP levels in HK-2 cells. Data analyzed by one-way ANOVA; ns: not significant different; **P < 0.01; ***P < 0.001; ****P < 0.0001. All experiments were performed in triplicate.
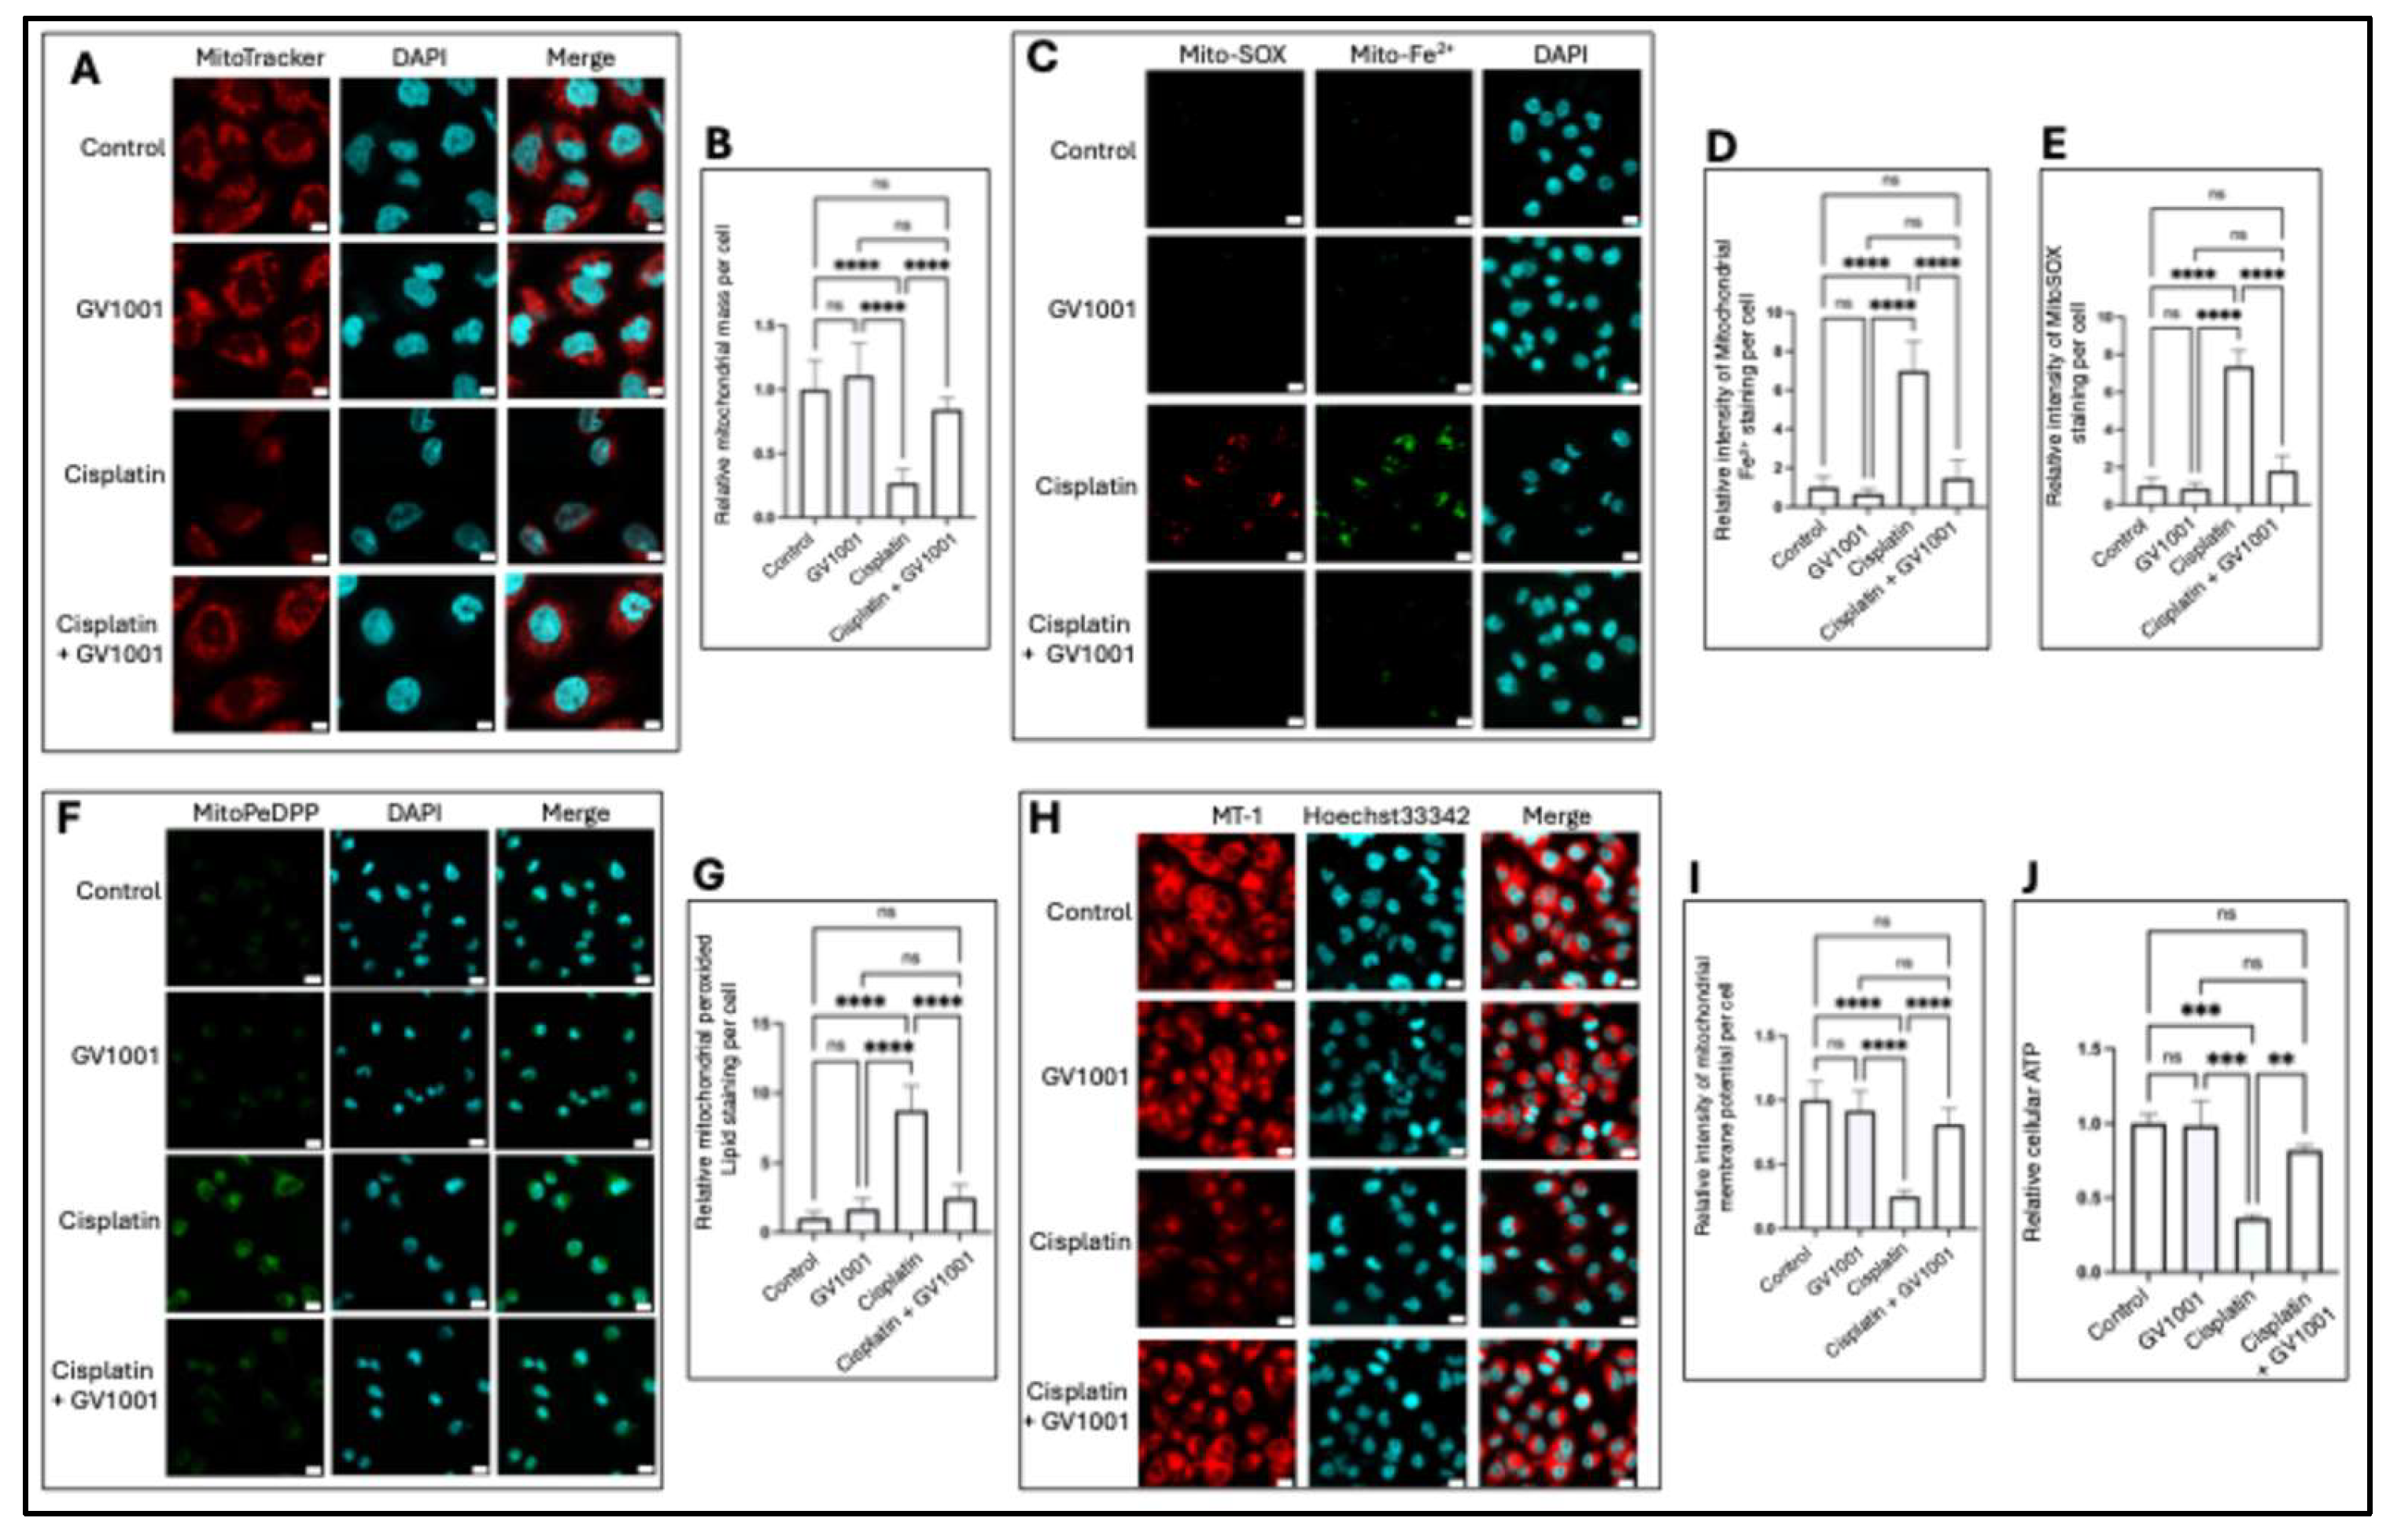
Figure 6.
A. Representative immunofluorescent staining of cytochrome c in cells exposed to GV1001, or cisplatin alone or in combination with cisplatin. Cytochrome c was shown in green. MitoTracker staining in red; nuclei in blue (DAPI). Scale bar: 20 μm. B. Quantification of cells with cytosolic cytochrome c per field (n = 5 per group). C. Western blot analysis of cytochrome c in mitochondria vs mitochondria-free cytosolic following subcellular fractionation. D. and E. Western blot analysis of apoptosis (cleaved PARP, cleaved caspase-3, p-p38, p53, Bax) and DNA damages (γ-H2AX) in cells exposed to vehicle, GV1001, cisplatin or in combination with GV1001. F. Representative immunofluorescent TUNEL staining in renal tubular epithelium from mice treated with vehicle, GV1001, cisplatin or in combination with GV1001. TUNEL-positive nuclei (red) and DAPI counterstaining (blue). Scale bar: 20 μm. G. Quantification of TUNEL-positive cells through ImageJ software (mean ± SEM, n = 8 per group). Data analyzed by one-way ANOVA; ns, not significant; **** P<0.0001. All experiments were performed in triplicate.
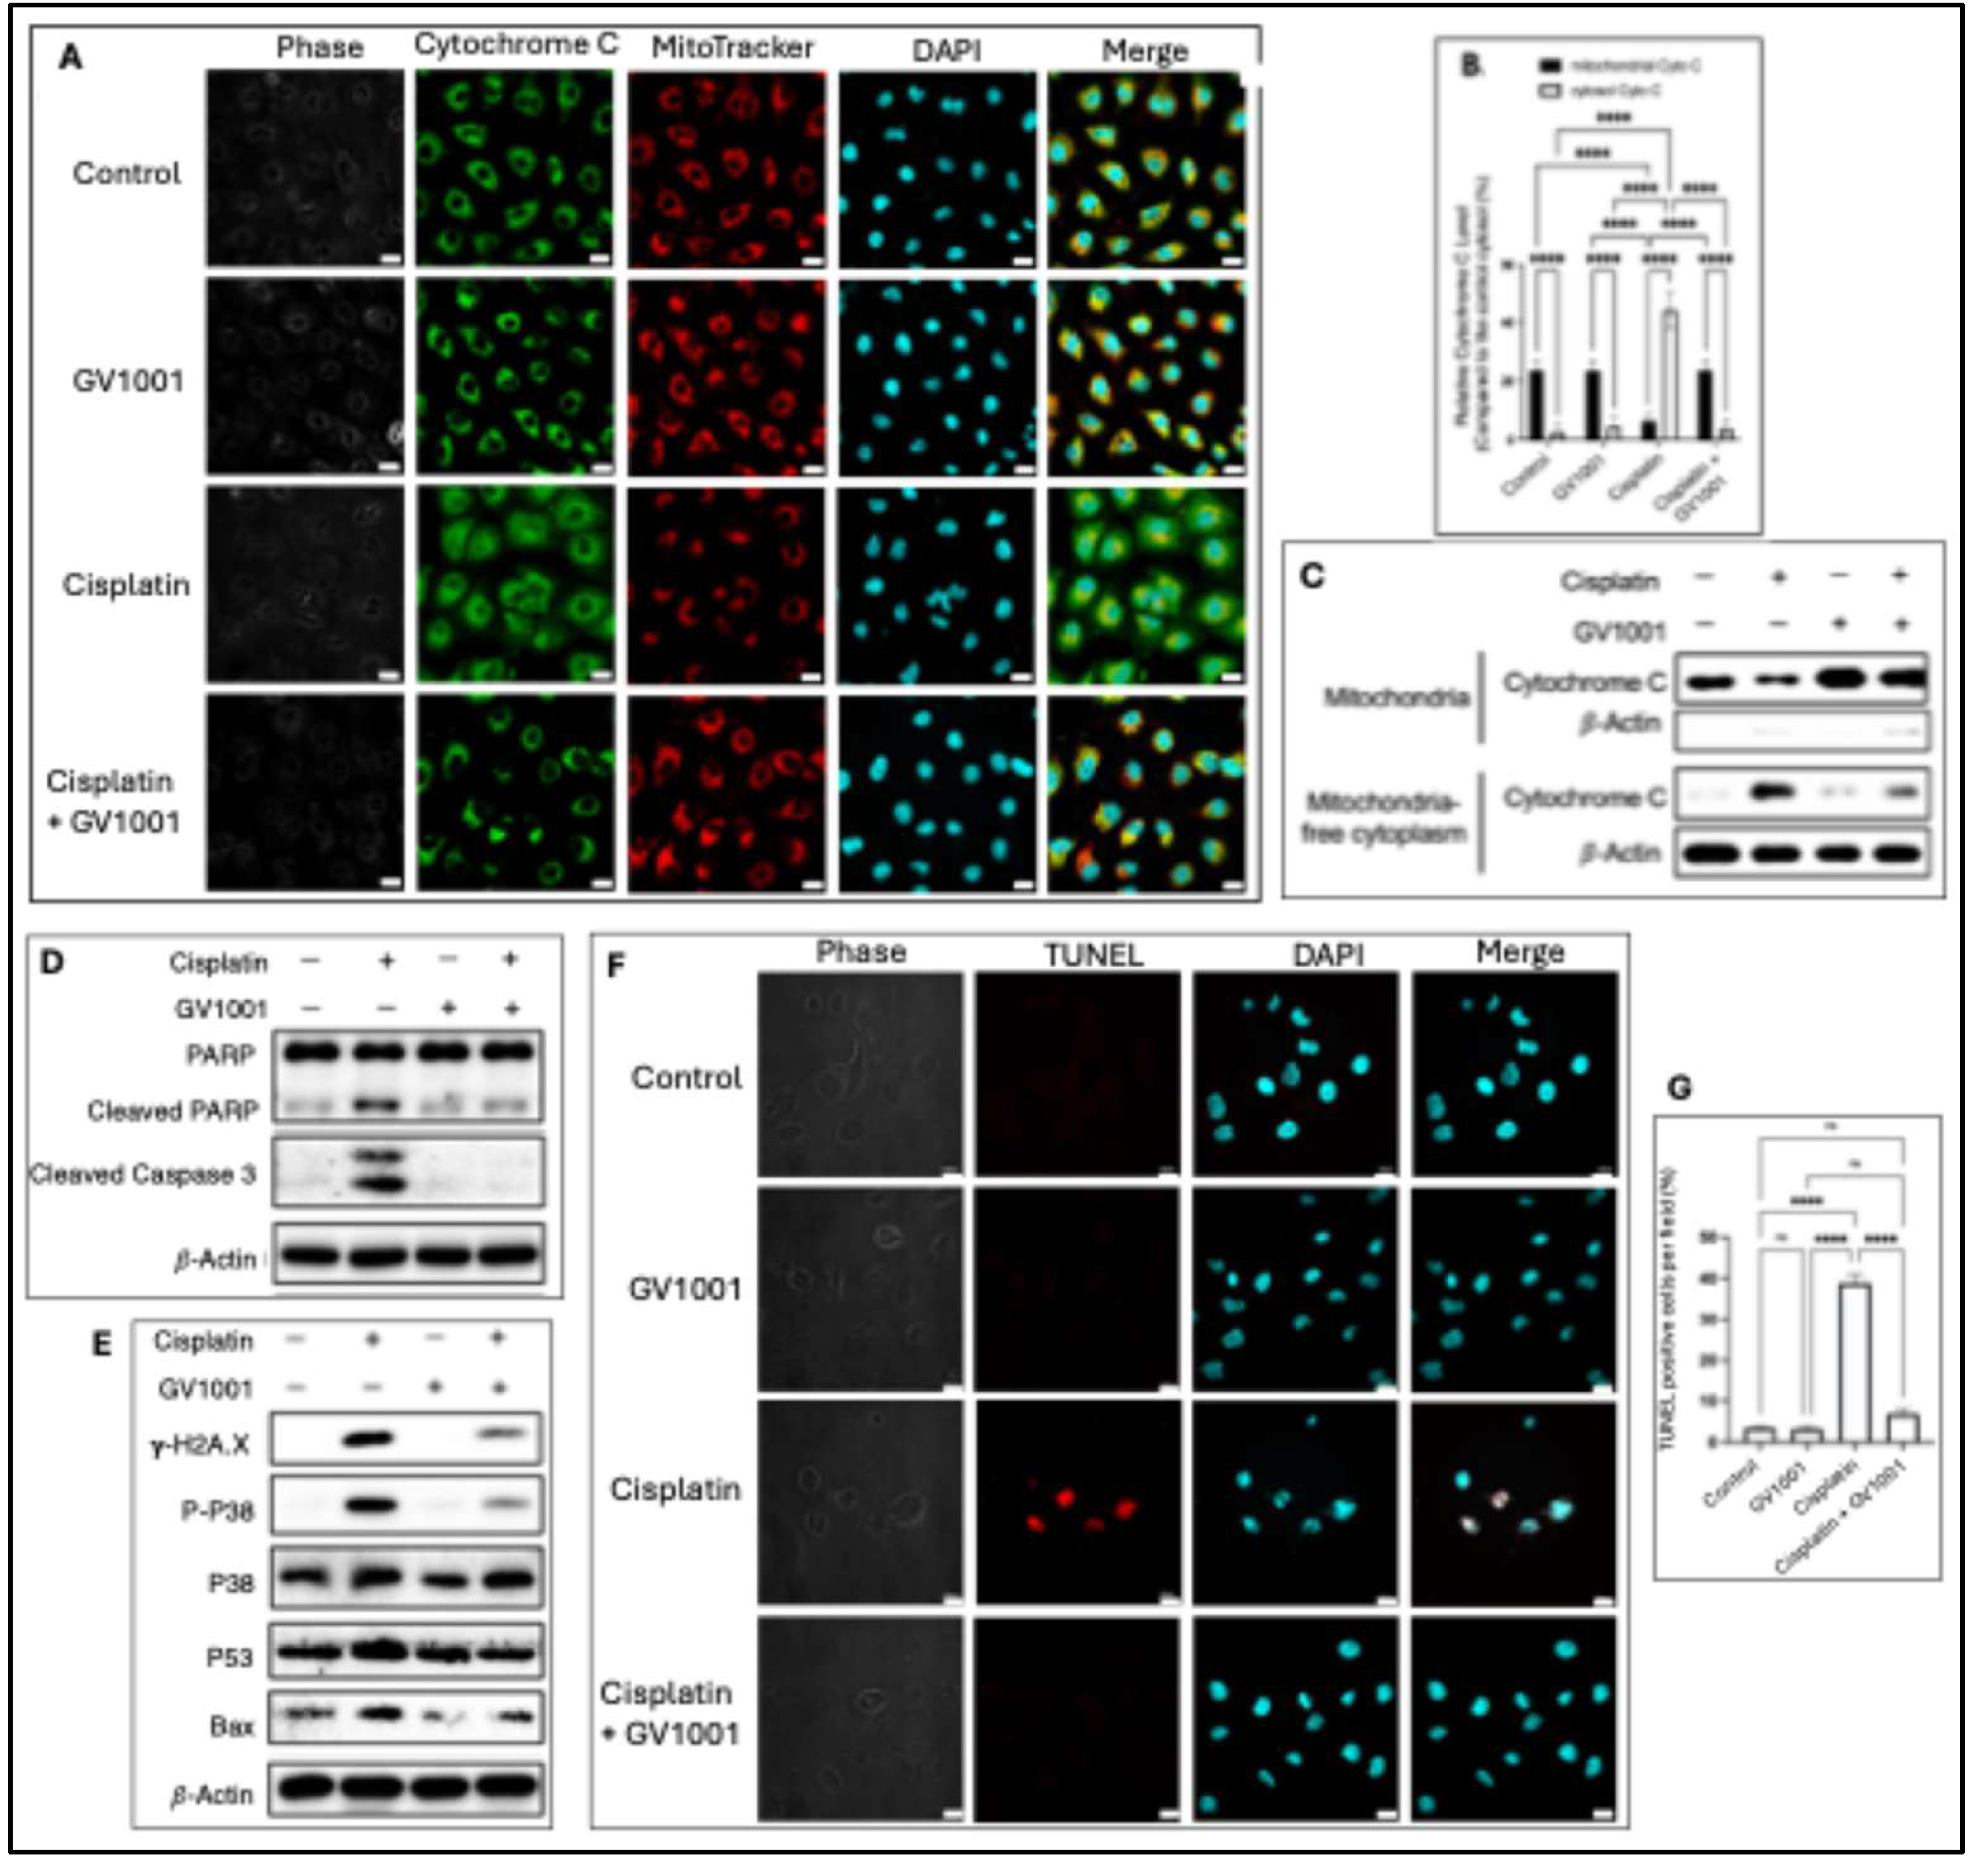
Figure 7.
A. Dose-dependent binding of GV1001 (red) to cardiolipin (green) B. ELISA assay for determining of the binding of cardiolipin with the indicated concentrations of FITC-labeled GV1001. C. Representative immunofluorescence images of GV1001 and cardiolipin in HK-2 cells treated with GV1001 (10 µg/mL). GV1001 was shown in red, cardiolipin was stained with NAO (green) and nuclei were counterstained with DAPI (blue). Scale bar: 20 μm. All experiments were performed in triplicate.
Disclaimer/Publisher’s Note: The statements, opinions and data contained in all publications are solely those of the individual author(s) and contributor(s) and not of MDPI and/or the editor(s). MDPI and/or the editor(s) disclaim responsibility for any injury to people or property resulting from any ideas, methods, instructions or products referred to in the content. |
© 2025 by the authors. Licensee MDPI, Basel, Switzerland. This article is an open access article distributed under the terms and conditions of the Creative Commons Attribution (CC BY) license (http://creativecommons.org/licenses/by/4.0/).
Copyright: This open access article is published under a Creative Commons CC BY 4.0 license, which permit the free download, distribution, and reuse, provided that the author and preprint are cited in any reuse.


