Submitted:
12 September 2025
Posted:
15 September 2025
You are already at the latest version
Abstract
Smart mobility is widely promoted as a solution to the urban challenges of congestion, pollution, and inefficient transportation systems. Yet, its adoption remains inconsistent, particularly in developing cities where structural and systemic barriers are dominant. Prior research has examined enabling factors such as digital infrastructure and user perceptions, but has paid limited attention to the institutional, political, and socio-cultural constraints that influence adoption. Moreover, whenever considered, the barriers are studied in isolation, obscuring their systemic interactions. This study addresses this gap using Total Interpretive Structural Modelling (TISM) to hierarchically map the barriers. To complement the analysis, MICMAC classification is used to assess their driving and dependence power. Findings reveal that legacy paradigms in conventional transport planning, fragmented institutional mandates, and regulatory misalignment are the foundational barriers, reinforcing downstream challenges such as affordability constraints, limited service coverage, and persistent car-centric preferences. Anchored in Critical Urban Theory, the study depicts how smart mobility adoption is not a neutral technological process, but one deeply embedded in wider struggles over governance, equity, and urban development. The paper contributes to the literature by offering a theory-building framework that captures the interdependence of institutional, technological, and behavioral barriers. It also provides practical entry points for policymakers, planners, and mobility innovators seeking to target root cause interventions rather than symptoms, thereby enabling more equitable, scalable, and resilient smart mobility transitions.
Keywords:
Smart mobility
; barriers to adoption
; Critical Urban Theory
; Total Interpretive Structural Modelling (TISM)
; MICMAC analysis
; emerging cities
1. Introduction
Cities worldwide are under mounting pressure to transform their transport systems in response to rapid urbanization, climate imperatives, and digital innovation. In this context, smart mobility, which entails the integration of digital technologies, multi-modal transport options, and user-centered services, has emerged as a potential solution to longstanding urban mobility challenges [1,2]. Defined as the application of technology and data to create efficient, sustainable, and user-friendly transport systems, smart mobility promises to optimize efficiency, reduce environmental impacts, and enhance urban livability [3,4,5,6].
Yet, despite its transformative potential, the adoption of smart mobility is inconsistent, particularly in cities of the Global South. Existing research has largely focused on enabling factors such as service efficiency, digital infrastructure and perceived usefulness [7,8,9], but offers limited insight into how barriers may impede adoption. Furthermore, studies on barriers have explored them in isolation, overlooking the systemic interactions between institutional inertia, governance fragmentation, regulatory constraints, and social resistance [10,11]. As a result, little is known about the relative power and influence of these barriers, or which among them function as root causes of resistance to smart mobility transitions. A central but underexplored barrier lies in the legacy paradigms of conventional transport planning (CTP). Rooted in rational-comprehensive and car-centric models, CTP prioritizes traffic flow, vehicle throughput and saving time over flexibility, accessibility and multimodal integration [12,13]. Such paradigms are fundamentally misaligned with the adaptive, data-driven, and user-centered logics of smart mobility [14,15]. This institutional misfit is further compounded by fragmented mandates across transport agencies, outdated policies, gaps in digital literacy, and uneven infrastructure that create a web of resistance to mobility innovation [16,17].
This paper addresses these gaps by moving beyond descriptive accounts to offer a systems-level and theory-informed analysis of barriers to smart mobility adoption. Drawing on Critical Urban Theory, the study interrogates the political, economic, and ideological forces shaping mobility transitions, thereby responding to recent calls for more socially attuned mobility research [18]. In doing so, the study positions smart mobility adoption not as a neutral technological project, but as a contested process embedded within wider struggles over urban governance, equity, and sustainability.
The findings reveal that legacy paradigms in transport planning, fragmented mandates, and regulatory misalignment function as root causes exerting a strong influence, shaping downstream challenges such as affordability, spatial coverage, and cultural attachment to car ownership. This finding signals that resistance to smart mobility adoption emerges not from isolated technical deficits, but from an interconnected ecosystem of institutional, political, and socio-cultural constraints.
By combining Critical Urban Theory with structural modelling methods, this study contributes to the growing literature on urban mobility transitions in three ways. First, it advances a holistic framework that identifies and maps how barriers interact. Second, it reframes adoption challenges as products of institutional and political dynamics, challenging the prevailing technocratic narratives of smart mobility. Third, it offers practical entry points for policymakers to target structural root causes, with particular relevance for Global South cities seeking to develop inclusive, scalable, and resilient smart mobility systems.
The remainder of the paper is structured as follows. Section 2 reviews the theoretical and empirical literature on smart mobility barriers. Section 3 outlines the research methodology. Section 4 presents the results of the TISM and MICMAC analyses. Section 5 discusses the implications of the findings, and Section 6 concludes with recommendations for policy, practice, and future research.
2. Theoretical Background: Smart Mobility Adoption Barriers
2.1. Framing Smart Mobility in Urban Sustainability Discourse
Smart mobility has emerged as a paradigm shift in urban transport, promising enhanced efficiency, reduced environmental impact, and increased accessibility through the integration of digital technologies, data-driven services, and platform-based transport innovations. Built on digital platforms, algorithmic optimization, and real-time data exchange, smart mobility is recognized for its transformative potential through technologies such as AI-enabled traffic control, Mobility-as-a-Service (MaaS), micro-mobility, and automated vehicles [19,20]. In both policy and academic discourse, these technologies are framed as offering efficient, low-emission, and user-centric transport alternatives [1].
However, beneath these aspirations lie a web of institutional, technological, and social tensions that challenge the actualization of smart mobility at scale. Moreover, critiques have emerged that challenge the techno-optimistic framing of smart mobility [21]. Scholars have highlighted the risk of "solutionism", where digital tools are seen as ends in themselves rather than parts of broader systemic change [22,23]. Additionally, these solutions have raised concerns about equity, privacy, data governance, sustainability and urban exclusion [24]. Concerns have been raised about the social, political, and ethical dimensions, especially the issues of data governance, surveillance, spatial exclusion, and the reinforcement of inequality, which could hinder smart mobility adoption [10,25,26]. Overall, these critiques suggest that the success of smart mobility cannot be measured solely by technological efficiency or emissions reductions, but must also consider how power, access, and other barriers are distributed in its implementation.
2.2. Barriers to Smart Mobility Adoption
Despite the increasing promotion of smart mobility as a sustainable and efficient alternative to traditional transport systems, its widespread adoption remains uneven across cities, especially in developing urban contexts. A growing body of literature has examined various barriers impeding smart mobility adoption, yet most studies tend to address these challenges in isolation. Drawing on behavioral, institutional, and technological theories, this section provides a review of key barriers identified in this study.
2.2.1. Interoperability and Integration Deficits
A lack of interoperability among different transport services and poor integration of payment systems, real-time information, and routing functionalities diminish the user experience [27]. The absence of common standards, data interoperability protocols, and coordinated system architectures makes the integration of various mobility services difficult. Interoperability can, however, be enhanced through open standards, shared platforms, and public-private partnerships [28].
2.2.2. Inadequate Digital Infrastructure
The success of smart mobility is contingent on robust digital infrastructure, including high-speed internet, GPS coverage, and IoT-enabled systems [26]. It is equally important to have an elaborate infrastructure to collect, organize, access and control data. In cities or areas where these are lacking or unreliable, deployment is delayed or limited in scope [29]. Smart mobility is predicated on digital access, literacy, and engagement. Yet, significant segments of the population remain digitally excluded due to lack of smartphone access, limited digital literacy, or affordability issues. This digital divide has been found to disproportionately affect low-income, elderly, and marginalized urban residents, signaling that smart mobility could exacerbate mobility injustice rather than alleviate it [30,31,32]. However, targeted investments in digital infrastructure can act as enablers, particularly when aligned with national digital transformation agendas [33].
2.2.3. Data Privacy and Security Concerns
Smart mobility systems rely heavily on data collection, processing, and sharing. Privacy concerns and lack of robust data protection frameworks undermine user trust and hinder uptake [34,35,36,37]. Studies have pointed out the growing power asymmetries between private mobility platform providers and users, particularly when data is collected and monetized without sufficient transparency or regulation [24,38]. From a socio-technical perspective, perceived surveillance and loss of control over personal data reduce willingness to adopt [39]. Conversely, transparent data governance and ethical design practices can enhance trust and system acceptance [40].
2.2.4. Inclusive Design Deficiencies
Smart mobility systems may fail to meet the needs of persons with disabilities, older adults, and those with caregiving responsibilities [41,42,43]. Further, smart mobility systems use algorithms such as dynamic pricing, route allocation, or predictive policing, which can inadvertently reinforce social inequalities or spatial exclusion [44]. For instance, ride-hailing algorithms may prioritize profitable zones over underserved areas, or price surges may penalize those with limited transport alternatives [45]. Digital and physical exclusion results whenever universal design principles are not integrated into mobility innovations. Conversely, inclusive design can significantly broaden user adoption and enhance societal benefits [46].
2.2.5. Fragmented Institutional Mandates
The governance of urban transport involves multiple institutions with overlapping or poorly defined mandates, leading to inefficiencies, conflicting policies, and lack of coordination [47,48]. Fragmentation hinders smart mobility by stalling integrated planning and the deployment of multimodal systems. On the other hand, governance integration and inter-agency collaboration have been shown to enhance coordination and streamline innovation diffusion [16,49].
2.2.6. Unsupportive Regulations and Policies
Outdated or misaligned transport regulations can obstruct smart mobility by failing to accommodate emerging models such as micromobility, shared services, or Mobility-as-a-Service (MaaS) [50]. Likewise, regulatory uncertainty deters private investment and experimentation [51]. Yet, enabling policies such as incentives, open data frameworks, and supportive licensing regimes have demonstrated success in accelerating adoption in cities like Helsinki and Singapore [52].
2.2.7. Legacy Paradigms in Conventional Transport Planning (CTP)
Conventional transport planning (CTP) frameworks, rooted in mid-20th-century planning logics, continue to pose significant obstacles to the adoption of smart mobility. Traditionally centered around car-oriented development, CTP prioritizes infrastructure investments in road networks, emphasizes traffic flow and vehicle throughput, while marginalizing investments in public and non-motorized transport [53,54]. These practices contribute to spatial inequities and reinforce auto-dependence, particularly in urban peripheries.
Institutional inertia and sunk costs in legacy infrastructure further entrench these paradigms, creating path dependencies that stifle innovation [55]. Planning remains largely governed by rational-comprehensive approaches that rely on predictive models and outdated indicators such as congestion levels and travel times [14,56]. These models are poorly equipped to address contemporary challenges such as digital disruption, the unpredictability of travel behavior, and the urgency of decarbonizing transport systems [57].
While CTP and smart mobility share some overlapping goals, such as emissions reduction and modal shift, they differ fundamentally in approach and evaluative capacity. CTP lacks the frameworks necessary to regulate or integrate innovations like Mobility-as-a-Service (MaaS), micro-mobility, or real-time data-driven services [15]. In contrast, smart mobility emphasizes adaptability, user-centered design, digital integration, and resilience [3]. Yet, smart mobility is not without contradictions: while it promises quality-of-life improvements and greater system efficiency [5,58], it may inadvertently lead to longer trip distances and higher vehicle miles traveled (VMT), potentially undermining the compact urban development and reduced travel demand that CTP has historically pursued [59,60]. This apparent conflict highlights a deeper paradigmatic misalignment between legacy planning institutions and the techno-urban logic underpinning smart mobility [17]. The resulting tension limits the capacity of cities to pursue integrated and future-ready transport solutions. Scholars have increasingly called for a paradigm shift—away from rigid, automobile-centric models—toward participatory, flexible, and sustainability-oriented planning [14,61].
Without redefining institutional priorities, updating planning tools, and adopting new evaluative metrics, smart mobility risks being co-opted by outdated systems that fail to deliver on its promise. This study therefore recognizes legacy CTP not as a neutral backdrop, but as an active, structural barrier influencing the governance, adoption, and long-term effectiveness of smart, sustainable, and resilient mobility systems [16,59].
2.2.8. Political Resistance
The politics of urban mobility typically reflects entrenched interests and ideologies. Resistance can stem from political actors reluctant to disrupt existing systems, fear of backlash from powerful car lobbies, or lack of political will to promote transformative policies [62]. However, political leadership and narrative framing can play a transformative role, particularly when smart mobility is positioned within broader goals of equity, climate action, and economic resilience [31].
2.2.9. Digital Literacy Gaps
Low levels of digital literacy, particularly among older adults, low-income groups, and marginalized communities, would hinder the equitable adoption of app-based smart mobility services [63]. According to the digital divide theory, unequal access to digital skills reproduces mobility and social exclusion [64]. Certain approaches to address these gaps have been suggested namely user training, multilingual interfaces, and co-design approaches that reflect user diversity [65].
2.2.10. Safety Concerns for Pedestrians and Cyclists
Smart mobility solutions are defined by walking and cycling as key components of sustainable transport. Yet, inadequate infrastructure, poor lighting, and unsafe road conditions deter use, especially among vulnerable groups [66]. Safety improvements not only enable greater uptake of active modes but also increase public confidence in multimodal travel options [67].
2.2.11. Public Transport Appeal
Smart mobility is most effective when integrated with high-quality public transport. However, in many urban contexts especially in the developing cities, public transport suffers from unreliability, overcrowding, and negative public perceptions [68,69]. Enhancing service quality and branding public transit as a premium, sustainable choice can reposition it as a desirable option within smart mobility ecosystems.
2.2.12. Limited Coverage of Smart Mobility Services
Smart mobility services in developing megalopolis are mainly concentrated in central urban areas, neglecting peri-urban and other underserved communities. This spatial bias limits access and reinforces inequality [70]. To bridge this gap, it has been suggested to expand coverage through geographic subsidies, demand-responsive transport and spatial equity policies [13,71].
2.2.13. Affordability of Smart Mobility Options
Cost remains a critical barrier, especially for lower-income groups. Despite the promise of shared mobility to lower costs, pricing models can remain prohibitive [72]. Flexible fare structures, subsidies, and bundling services for options like MaaS schemes can make smart mobility more affordable [73].
2.2.14. Car as a Status Symbol and Personal Space
Automobile ownership is deeply embedded in cultural and social norms, which to some degree symbolize success, freedom, and identity [74]. This psychological barrier can impede modal shift to shared and collective modes. While, it is apparent that generational change, climate awareness, and urban lifestyle shifts are slowly eroding this status quo, the affection for cars is enduring [12].
2.3. Critical Theory and Smart Urbanism
The rise of smart mobility cannot be fully understood through technological or functionalist lenses alone. Instead, its evolution and adoption must be situated within broader political, institutional, and ideological contexts [18]. Critical Urban Theory, rooted in neo-Marxist and post-structuralist traditions, provides an essential lens for interrogating how power, inequality, and ideology are embedded within the technological transformation of cities [75]. From this perspective, smart urbanism, and by extension, smart mobility, is not a neutral or universally beneficial innovation but a politically charged project that reflects and reproduces dominant interests [24,76].
At its core, critical theory challenges the instrumental rationality that underpins many smart city initiatives, including transport innovations. It critiques the “techno-solutionism” embedded in smart mobility discourse; the idea that digital technologies alone can resolve prevailing urban problems such as congestion, pollution, or inequity. Instead, critical theorists argue that such solutions often obscure underlying structural issues and depoliticize urban governance by shifting attention away from social justice, redistribution, and institutional accountability [77].
In the context of smart mobility, this critique is particularly salient. Technologies such as ride-hailing, Mobility-as-a-Service (MaaS), autonomous vehicles, and AI-based traffic systems have been introduced without sufficient attention to who benefits, who governs, and who is excluded. Therefore, smart mobility platforms frequently reproduce spatial, economic, and digital inequalities, privileging affluent users and well-served urban cores while marginalizing peripheral communities [30,38]. Furthermore, the privatization of data infrastructures and the influence of large tech firms in shaping urban transport agendas raise questions about democratic oversight, transparency and citizen agency.
More importantly, critical theory foregrounds the role of institutional path dependencies and systemic inertia, which are key concerns in this study. The adoption of smart mobility does not occur in a vacuum; it is filtered through existing urban governance systems, including Conventional Transport Planning (CTP) frameworks, which have long prioritized automobility, infrastructure expansion, and predictive forecasting models. These legacy systems can subtly constrain or redirect smart mobility in ways that reinforce established priorities and resist transformative change. As such, the conflict between CTP and smart mobility is not just technical or procedural, as it reflects a deeper ideological clash between rational-comprehensive planning models and more emergent, data-driven, and user-centric logics.
Moreover, critical theory allows us to see CTP as a site of epistemic power, where certain forms of knowledge (e.g., traffic modeling, vehicle throughput metrics) are privileged over others (e.g., lived experience, community-based mobility practices and quality of life). This epistemic hierarchy contributes to the marginalization of alternative mobility visions, such as feminist, de-colonial, or sustainability-oriented transport paradigms [31].
Through the critical theory lens, this study interrogates not just the visible barriers to smart mobility adoption, such as digital access or institutional silos, but also the invisible logics, inherited paradigms, and institutional configurations that structure how urban mobility is imagined, governed, and enacted. It helps uncover how legacy planning systems may constrain innovation not by design, but by habit, ideology, or governance inertia. By so doing, critical theory reframes smart mobility adoption as a contested and political process, shaped by entrenched institutional logics, uneven power relations, and conflicting urban imaginaries [18]. It offers a valuable framework for analyzing how emerging technologies interact with and are constrained by legacy systems like CTP, thereby enriching our understanding of why smart mobility adoption remains partial, uneven, and fraught with contradictions.
3. Materials and Methods
This study adopts Total Interpretive Structural Modelling (TISM) to identify and analyze the key barriers that hinder smart mobility adoption in urban settings. Specifically, the research combines a mini literature review to establish a list of potential barriers and then examines their interrelationships using expert consultation. The role of experts was to aid in distilling the list of barriers, analyzing the correlation among barriers, and providing the interpretive logic [78]. This approach is particularly suitable due to the dual nature of the study objectives: (i) exploring the range of obstacles to smart mobility uptake and (ii) establishing structured relationships of how these barriers reinforce or interact with one another.
3.1. Identification of Barriers
This study began with a literature review to extract potential barriers to the adoption of smart mobility. Drawing from over 10 peer-reviewed articles, policy reports, and systematic reviews, a total of 31 barriers were identified (see Table 1). The original list drew from various interdisciplinary sources across transport planning, urban studies, technology adoption, and public policy [2,8,9]. These barriers captured a wide range of institutional, technological, behavioral, and infrastructural constraints. A summary of the original barriers and their sources is presented in Table 1.
The list reflected a wide range of conceptual overlaps and varying levels of abstraction; thus, it was necessary to streamline the barriers to facilitate effective modeling and interpretation. To make the subsequent structural modelling tractable and meaningful, it was necessary to refine and consolidate the list. First, duplicate or overlapping barriers were merged. For instance, “access to data and internet,” “digital and banking divide,” and “lack of knowledge about smartphones and internet” were conceptually aggregated under broader categories such as digital literacy gaps or inadequate digital infrastructure [94]. Similarly, multiple entries relating to the socio-cultural role of car ownership (e.g., loss of car as a status symbol, as personal space, and the tradition of private vehicles) were consolidated into a unified barrier representing the psychosocial attachment to private cars.
Following this conceptual distillation, a focus group discussion was conducted with five domain experts drawn from Nairobi, Kenya’s commercial and transportation hub. The experts who comprised an urban transport planner, policy analyst, academic, and digital mobility practitioner were convened to further validate and streamline the list. This step was necessary to assess the face validity and contextual relevance [95,96]. Drawing on the principles of the Delphi method [97], the experts were organized into a focus group that engaged in iterative discussions to ensure the consistency, contextual relevance, and non-redundancy of the identified barriers [97]. The experts assessed each item based on its systemic influence, relevance to the study objectives, and potential for policy intervention.
In parallel, a theoretical filtering process ensured that the retained barriers aligned with the study's aims and were analytically suitable for the Total Interpretive Structural Modeling (TISM) framework [78]. Barriers that were too broad to allow precise pairwise comparison or lacked sufficient interpretability (e.g., “smart leadership”) were deemed unsuitable for interpretive modeling. Only those barriers that were specific, actionable, and theoretically grounded yet broad enough to capture systemic dynamics were retained. The expert-driven reduction aligns with prior studies that have emphasized the importance of domain-specific filtering in interpretive modelling exercises [78,98]. Finally, the process narrowed the original list down to 14 barriers, which were deemed to be the most salient, structurally relevant, and theoretically significant for the study context. These 14 barriers, presented in Table 2, served as the input variables for the Total Interpretive Structural Modelling (TISM) and MICMAC analysis conducted in subsequent sections.
3.2. Research Approach
The research is situated within an interpretivist paradigm, which supports the co-construction of meaning through the subjective interpretation of expert insights and existing literature. Thus, an inductive approach was used that enabled the emergence of key themes from data and structured theory building. An inductive approach enabled the derivation of the list of barriers through literature synthesis and expert validation. Subsequently, relationships among these barriers were mapped and modeled using TISM.
3.3. The Choice of Total Interpretive Structural Modelling (TISM) in this Study
The core objective of this study is twofold: first, to identify the key barriers that hinder the adoption of smart mobility in urban contexts, and second, to analyze how these barriers interact to reinforce or impede adoption. This dual aim, which is both diagnostic and explanatory, requires a methodological approach that can reveal not only the existence of barriers but also their structural interdependencies and relative influence.
Total Interpretive Structural Modelling (TISM) was selected as the principal analytical technique because it is well-suited for theory-building in complex, underexplored domains. Smart mobility adoption, especially in developing urban contexts, is characterized by multilayered challenges spanning technological, institutional, and behavioral dimensions. While the field has seen growing interest in recent years, mass adoption has been hindered due to persistent barriers that limit system scalability [2]. There is a dearth of research that has systematically analysed the barriers using a structured methodology that moves beyond simple identification toward a layered interpretation of how they interconnect and evolve over time.
TISM is an advanced extension of the Interpretive Structural Modelling (ISM) method [99,100,101] enriched by the incorporation of interpretive logic. Unlike ISM that identifies binary relationships between factors, TISM advances this by requiring justifications for why and how specific relationships exist [78,102,103]. This interpretive depth enables researchers to build more meaningful, actionable models relevant for policy makers who, need to understand systemic resistance in order to design effective interventions.
Following a literature review and expert consultations, this study identified a preliminary set of barriers operating across three levels: user-related (e.g., behavioral inertia, low digital literacy), technological (e.g., limited interoperability, inadequate infrastructure), and institutional (e.g., regulatory fragmentation, lack of policy coordination). TISM was then employed to model how these barriers interact, resulting in a structured hierarchy that distinguishes between driving barriers (those that initiate or intensify other challenges) and dependent barriers, (which manifest as downstream symptoms of broader systemic issues). This approach allows the study to address the core dimensions of theory development articulated by [104]. By so doing, the model not only identifies which barriers are most critical, but also explains how they reinforce or amplify one another and why they deserve priority attention in policy or planning.
Recent methodological enhancements in TISM, such as the integration of argumentation-based reasoning [105], were integrated in the interpretative logic to further strengthen the model’s validity. This extension allows the relationships between elements to be grounded not just in observation or consensus, but also in stakeholder justification. This is particularly relevant for smart mobility systems, which evolve and require different policy responses at different stages from initiation, scaling, through to stabilization. TISM’s flexibility makes it possible to identify which barriers are most salient at each of these stages, offering a dynamic and context-sensitive roadmap for intervention.
3.4. Justification for TISM over Alternative Methods
To ensure methodological rigor, TISM was evaluated against alternative multi-criteria decision-making and systems modeling techniques, including Interpretive Structural Modelling (ISM), Analytic Hierarchy Process (AHP), and DEMATEL. While ISM is widely used to identify and structure key elements within complex systems [106,107], providing clarity by establishing relationships among these elements [108], it does not allow for interpretive elaboration, fails to include transitive links, and hence limits its explanatory power [109]. On the other hand, AHP, though useful for prioritizing factors, is more suited to quantitative comparisons and lacks the ability to map causal relationships or generate hierarchical models based on qualitative inputs [110]. Similarly, Decision-Making Trial and Evaluation Laboratory (DEMATEL) is effective at identifying cause-and-effect relationships in complex problems but does not yield structured hierarchies of influence [111].
TISM overcomes the aforementioned limitations and uniquely integrates interpretation, hierarchy, and causal logic [78,112,113]. It captures transitive relationships, enhances theoretical development by explicitly addressing the “why,” and transforms complex systems into accessible, well-structured models [114]. Furthermore, TISM enables the creation of a coherent structural model that reveals the layered influence of various barriers, critical for understanding systemic resistance to smart mobility. The method’s ability to incorporate stakeholder reasoning and build consensus around interdependencies enhances its practical relevance for smart mobility.
4. Data Analysis and Results
4.1. Data Collection and Analysis
The data collection and analysis process for this study followed a structured three-phase approach. In the initial phase, a list of 31 potential barriers to smart mobility adoption was compiled. This list was informed by a review of relevant literature, expert consultations. These barriers represent a broad range of institutional, technological and user-level challenges.
In the second phase, a panel of domain experts with over a decade of professional experience in transport planning and smart mobility was engaged to evaluate the relevance and significance of the identified barriers. Experts were selected through purposive sampling, a strategy well-suited for studies requiring rich, experience-based input. This sampling approach is appropriate due to its ability to ensure flexibility and convenience for participants, access to in-depth, context-sensitive insights grounded in practical experience, and support for asynchronous, reflective engagement [115,116].
In line with [117], a pre-screening process was undertaken to ensure that only well-informed participants were included. All selected respondents had professional experience ranging from seven to thirty years across diverse roles. The panel comprised, two academic experts in transport planning and smart urban systems, each with over 20 years of teaching and research experience. In addition, the panel drew from three practitioners from the transport sector (two from government agencies and one from a private mobility firm), each with more than twenty-five years of professional experience in transport policy, planning, or digital mobility services. This number of experts is deemed sufficient considering it smart mobility is a narrow and growing field and recent studies in nascent fields have used similar samples [118,119]. The list of experts is presented in Table 2.
Data collection was carried out at mutually convenient times. The interview gathered relevant demographic and professional information and presented the 14 selected barriers. Respondents were asked to perform pairwise comparisons to assess causal relationships between each pair of barriers, with the row representing the cause and the column the effect. For each pair, a value of “1” indicated the presence of a relationship, while “0” indicated no relationship. Where a relationship was identified, respondents were also asked to explain the rationale, adding interpretive depth to the data. The data collection tool is presented in Appendix A.
4.2. Analysis of the Barriers
To ensure methodological rigor in determining consensus among the experts, the Gage Repeatability and Reproducibility (Gage R&R) technique was employed. This method evaluates the level of agreement among raters in qualitative assessments. Following the benchmark established by [120], a consensus score exceeding 80% was considered indicative of acceptable reproducibility and inter-rater reliability. Based on this criterion, 14 out of the initial 31 barriers met the inclusion threshold and were retained for further analysis using the Total Interpretive Structural Modelling (TISM) methodology. The initial reachability matrix was developed based on the cumulative input of five experts. A consensus rule was applied: if three or more respondents rated a particular relationship as “1,” the corresponding matrix entry was marked as “1”; otherwise, it was marked as “0.” This approach ensured both rigor and reliability in capturing expert agreement and laid the foundation for the subsequent TISM analysis.
4.2. Procedure for Conducting Total Interpretive Structural Modelling (TISM)
The Total Interpretive Structural Modelling (TISM) procedure applied in this study followed a structured and iterative set of steps designed to identify, analyze, and interpret the interrelationships among the most critical barriers to smart mobility adoption.
Step 1: Identification of Key Barriers
The process began with an identification of barriers based on a mini literature review, expert consultations. A final list of 14 validated barriers was established for modeling (see Section 3.1).
Step 2: Establishing Contextual Relationships
To investigate how the identified barriers interact, a contextual relationship was defined for each pair as follows: “Barrier i influences or enhances Barrier j.” These directional relationships were elicited through a pairwise comparison process, where experts assessed the extent to which one barrier affects another. For each pair (Bi, Bj), experts were asked to indicate their level of agreement with the proposed influence using one of three responses: (1) Agree, (2) Neutral, or (3) Disagree.
Given that 14 barriers were selected for analysis, this yielded a total of 182 pairwise comparisons (14 × 13). To determine whether a relationship exists between two barriers, a consensus threshold was applied: if at least 50% of expert responses indicated agreement, the relationship was considered valid and retained; otherwise, it was discarded as non-significant [103,109,118]. This approach ensured that only those directional links with collective expert support were incorporated into the structural model, thereby enhancing the reliability of the relationship mapping and enabling the identification of causal linkages across the system.
Step 3: Construction of the Structural Self-Interaction Matrix (SSIM)
Expert input was used to assess the existence and direction of influence for every possible pair of the 14 barriers. The SSIM was developed based on four possible relationships and presented in Table 3
- V: Barrier i influences Barrier j
- A: Barrier j influences Barrier i
- X: Barriers i and j influence each other
- O: No relationship exists between Barriers i and j
The SSIM matrix, reflecting expert judgments, is presented in Table 3.
Step 4: Binary Interpretation of Relationships
Once the valid relationships were established, they were encoded into a binary matrix to construct the initial reachability matrix. This square “n × n” matrix (where n is the number of barriers) captures the direct influence of each barrier on another. Specifically, cell (i, j) represents the influence of Barrier i on Barrier j, and is coded as:
- 1, if a direct influence exists (as agreed upon in Step 2),
- 0, if no influence is identified.
This binary representation simplifies the analysis of interrelationships and provides a foundation for subsequent hierarchical structuring. By default, all diagonal elements in the matrix (i.e., where i = j) are assigned a value of 1, indicating that each barrier is assumed to influence itself, in line with conventional practice [78,101,109]. The initial reachability matrix is presented in Table 4.
Step 5: Development of the Interpretive Logic Knowledge Base
An interpretive knowledge base was created, documenting the logical explanations for each confirmed relationship. Each barrier was compared with all others in a pairwise manner. If a relationship was affirmed (“Yes”), a justification was documented based on expert judgment and literature support.
Step 6: Reachability Matrix and Transitivity Check
To ensure logical consistency and completeness of the model, the principle of transitivity was applied. This rule posits that if Barrier A influences Barrier B, and Barrier B influences Barrier C, then Barrier A is assumed to indirectly influence Barrier C. All such inferred transitive relationships were systematically checked and incorporated into the matrix.
The resulting matrix thus reflects both the direct and transitive influences among the barriers, enabling the construction of a hierarchical structure in subsequent steps. The finalized reachability matrix, inclusive of transitive links, is presented in Table 5.
Step 7: Level Partitioning
Using the reachability matrix, level partitions were identified by determining the reachability and intersection sets for each barrier. Barriers with matching sets were placed at the same level in the hierarchy. This step was repeated iteratively until all barriers were assigned a hierarchical level. The level partitioning process is illustrated in Table 6.
Step 8: Development of the Digraph
A directed graph (digraph) was constructed to visualize the hierarchical structure and relationships among the barriers. Arrows were used to denote directional influences between elements based on the reachability matrix. This graphical representation is shown in Figure 1.
The level partitioning process arranged the 14 barriers to smart mobility adoption into a seven-level hierarchy based on their driving and dependence relationships (see Table 6). At the base of the hierarchy, B8: Legacy paradigms in conventional transport planning (CTP) was positioned at Level VII, indicating it as the most foundational barrier influencing others but not directly influenced itself. Similarly, B1: Fragmented institutional mandates and B14: Digital literacy gaps occupy Level VI, highlighting their systemic influence across regulatory and user domains.
Mid-level barriers such as B5: Unfavorable regulations, B4: Data privacy concerns, and B7: Political resistance (Level V) act as both influencers and recipients of influence. These barriers typically represent policy-related and governance constraints that both shape and respond to institutional and technological challenges.
The other barriers such as B3: Inadequate digital infrastructure and B10: Lack of safe pedestrian and cyclist environments fall under Level IV, indicating their intermediate structural importance. These are technical and infrastructural issues that are influenced by high-level governance barriers but also shape user-level perceptions.
User-experience-focused barriers like B2: Lack of inter-operability, B6: Absence of inclusive design, B9: Lack of appeal of public transport, and B11: Limited coverage of smart mobility appear in Level III, demonstrating their dependence on upstream technical and regulatory conditions.
At the top of the model, B13: Affordability of smart mobility services (Level II) and B12: Loss of car as a status symbol and personal space (Level I) are positioned as the most dependent barriers. These represent end-user concerns that are largely shaped by upstream system, policy, and infrastructure factors.
Step 9: Construction of the Final TISM Model
The final TISM model (Figure 1) was developed by translating the digraph into an interpretive structural framework. This model illustrates both direct and transitive relationships among the barriers and reflects the cumulative insights gathered through literature, expert interpretation, and TISM logic. Further, based on the explanation of the experts, an interpretive logic was added to each relationship as presented in Table 7.
4.3. MICMAC Analysis
To complement the structural insights generated by the TISM model, a MICMAC analysis (Matrice d’Impacts Croisés Multiplication Appliquée à un Classement) was performed to assess the driving and dependence power of each identified barrier [112]. MICMAC enables a systematic classification of elements based on their systemic influence and susceptibility, offering a strategic framework for prioritizing policy and planning interventions [131,132]. The outcome is illustrated in Figure 2.
The barriers were grouped into four quadrants as presented in the subsequent section:
4.3.1. Driving Barriers
These are barriers with high driving power but low dependence. These are foundational barriers that exert influence over many others and thus serve as strategic leverage points for intervention. In this study, six driving barriers fall in this category, namely: legacy paradigms in CTP (B8), fragmented institutional mandates (B1), unfavorable regulations and policies (B5), data privacy and security (B4), political resistance (B7) and digital literacy gaps (B14).
B8 (Legacy paradigms in CTP), consistent with [16] and [20], emerges as the most influential root barrier reinforces outdated infrastructure priorities, entrenches car-centric development, and obstructs the shift toward data-driven, user-centric smart mobility models. This foundational constraint exacerbates B1 (Fragmented institutional mandates), a condition noted by [19] and [133], which leads to incoherent governance and impedes integrated transport solutions.
4.3.2. Dependent Barriers
These barriers have low driving power but high dependence. They are typically the outcomes of deeper systemic issues and include: limited coverage of smart mobility (B11), lack of inter-operability and multimodal integration (B2), absence of inclusive design (B6), affordability constraints (B13) and loss of car as status symbols or personal space B12). B12, which sits at the top of the model, highlights how personal attitudes and social values surrounding car ownership persist as the final obstacles in the shift toward sustainable urban transport. Similar observations are reported by [74]and [129]who argue that car use is often culturally reinforced and emotionally driven. However, the dependent barriers can only be meaningfully addressed once systemic issues at the institutional and technological levels are resolved.
4.3.3. Linkage Barriers
These elements exhibit both high driving and high dependence power, making them unstable and dynamic within the system [102,134]. They typically influence and are influenced by multiple other barriers. Interestingly, no elements were identified in this category, suggesting a relatively structured separation between foundational and symptomatic barriers in this study.
4.3.4. Autonomous Barriers
These barriers have both low driving and low dependence power, indicating their relative disconnection from the system’s core dynamics. The following barriers fall under this category: inadequate digital infrastructure (B3), lack of appeal of public transport (B9) and lack of safe environment for cyclists and pedestrians (B10). While these factors may not significantly shape or be shaped by the systemic structure, they remain important for direct user experience and public acceptance. For example, lack of safe infrastructure continues to be a deterrent for non-motorized mobility in many cities [70,84].
The MICMAC analysis enriches the findings from TISM by identifying high-leverage intervention points. Barriers such as legacy planning paradigms (B8), institutional fragmentation (B1), and regulatory resistance (B5) stand out as the most influential and should be addressed first to trigger cascading improvements across the system [124]. Meanwhile, dependent and autonomous barriers, although less influential, should be integrated into long-term strategies that build public trust, increase access, and encourage behavioral shifts toward smart mobility.
5. Discussion, Implications and Limitations
5.1. Discussion
The study set out to examine the barriers to smart mobility adoption and to map their structural interrelationships using Total Interpretive Structural Modelling (TISM) and MICMAC analysis. The results reveal that barriers to smart mobility are not isolated or purely technical, but are embedded within a system of institutional, political, and socio-cultural constraints. Through the lens of the Critical Urban Theory (CUT), the study revealed that smart mobility adoption is shaped by entrenched power structures, car-centric urban paradigms, and governance arrangements that reproduce inequality in urban mobility systems.
At the base of the TISM hierarchy, legacy paradigms in conventional transport planning (CTP) emerged as the most influential barrier. These paradigms, anchored in car-centric development, traffic-flow optimization, and path-dependent infrastructure choices, systematically undermine the transition to smart mobility [54,56,135]. From the critical urban theory perspective, this trend reflects how transportation planning institutions have historically been aligned with growth-oriented, automobile-dependent models of urbanization [62,136]. Rather than neutral policy tools, legacy planning frameworks represent a form of urban political economy that privileges private car ownership while marginalizing collective and active modes of transport.
Furthermore, the entrenched legacy systems tend to directly influence institutional fragmentation (B1), which further hampers coordination among agencies, perpetuating governance silos, weak coordination, and inconsistent objectives across transport, ICT, and urban development agencies [16,70]. These fragmented mandates illustrate how overlapping institutional logics protect vested interests and resist disruptive reforms, thereby obstructing transformative mobility transitions. As noted by [137], the paradigm is yet to shift and may take radical approaches to upend the existing system.
The middle layers of the model depict the role of unsupportive regulations, political resistance, and weak data governance as systemic barriers. Political resistance, in particular, reflects entrenched coalitions, namely car lobbies, fuel industries, and political actors that defend the status quo for ideological and economic gain [31]. Regulatory gaps exacerbate this resistance by creating uncertainty and deterring private investment in innovative services [51]. These barriers exemplify the “politics of urban mobility,” where institutional arrangements are not passive but actively reproduce inequality and exclusion [18]. They also highlight how governance failures cascade downstream, influencing user-facing concerns such as affordability, service quality, and trust in digital systems. For instance, the lack of inclusive design and multimodal integration tend to reinforce perceptions that smart mobility is inaccessible or inconvenient, especially for marginalized users [138,139,140].
At the dependent end of the hierarchy, barriers such as affordability, digital literacy gaps, safety for non-motorized users, and car ownership as a cultural status symbol emerge as outcomes rather than root causes. These findings align with socio-technical transition theory, which posits that user-level change is unlikely without supportive structural conditions [141,142]. This insight is important as it shows that exclusionary practices in technology adoption such as reliance on app-based platforms in contexts with weak digital infrastructure may reproduce existing urban inequalities [63,143]. For example, car ownership as a status symbol persists not simply because of individual preferences, but because unreliable public transport and fragmented governance reinforce its cultural and economic value [74,80]. Similarly, affordability concerns are symptomatic of institutional inefficiencies and fragmented digital ecosystems that constrain economies of scale. These findings suggest that smart mobility adoption cannot be achieved through behavioral campaigns alone but requires systemic restructuring [144,145].
The MICMAC analysis complemented the TISM findings by classifying the barriers into driving, dependent, and autonomous categories. The identification of legacy paradigms, institutional fragmentation, and regulatory weaknesses as high-driving-power barriers confirms their role as leverage points for system-wide change. These insights are consistent with previous research emphasizing the importance of tackling root causes rather than surface-level symptoms [98]. The findings are also consistent with previous studies that have posited that transport planning is the leverage point and holds the key to addressing the root causes of car-centric paradigms [56].
5.2. Implications for Theory and Policy
This study offers a theoretical contribution to mobility transition research through a combination of TISM with MICMAC analysis. It demonstrates that barriers are not only hierarchically structured but also interdependent, with high-driving-power barriers (e.g., legacy paradigms, fragmented mandates, political resistance) functioning as leverage points for systemic change. In contrast, autonomous barriers such as digital infrastructure or public transport appeal appear disconnected from the structural core, cautioning against piecemeal interventions.
Theoretically, the integration of critical urban theory into this analysis extends existing socio-technical perspectives by foregrounding power, inequality, and institutional resistance as central dynamics in smart mobility adoption. It reframes the transition not as a neutral technological shift but as a contested socio-political process embedded in broader urban contradictions. For policymakers, the results emphasize the need to prioritize structural reforms such as governance integration, regulatory clarity, and institutional paradigm shifts as opposed to narrow technical fixes.
5.3. Study Limitations and Future Research Directions
While the study provides new insights, several limitations exist and should be acknowledged. First, the reliance on expert judgments to develop the Structural Self-Interaction Matrix (SSIM) may introduce subjectivity, as expert perspectives can be shaped by their institutional affiliations and professional biases. Second, the focus on a single urban context limits generalizability; mobility challenges may manifest differently across cities with varying governance models, levels of digital maturity, and socio-economic conditions. Third, while TISM and MICMAC capture structural relationships, they provide a static view of barriers and do not account for dynamic changes over time. Future research could address these limitations by incorporating longitudinal data, comparative cross-city analyses, and mixed-method approaches such as fuzzy-set Qualitative Comparative Analysis (fsQCA) or Agent-Based Modeling (ABM).
6. Conclusions
This study examined the barriers to smart mobility adoption by integrating Total Interpretive Structural Modelling (TISM) and MICMAC analysis to uncover their hierarchical structure, interdependencies, and systemic influence. The analysis revealed that legacy paradigms in conventional transport planning, fragmented institutional mandates, and regulatory weaknesses are not just technical hurdles but foundational structural barriers that shape downstream constraints such as affordability, limited coverage, and user resistance. In contrast, issues such as inadequate digital infrastructure or the appeal of public transport emerged as relatively autonomous, highlighting the limited impact of addressing them in isolation.
Theoretically, this study advances the literature by moving beyond isolated or user-centric perspectives to offer a structural and critical understanding of smart mobility barriers. By drawing on Critical Urban Theory, the study demonstrates that resistance to smart mobility adoption is deeply embedded in the institutional, political, and socio-cultural fabric of urban governance. Rather than framing adoption challenges as mere technical deficits or individual choices, the findings underscore the role of entrenched power relations, car-centric legacies, and systemic inequities in shaping mobility futures.
Practically, the results highlight clear leverage points for policymakers and planners. Targeting high-driving-power barriers such as institutional reform, regulatory alignment, and paradigm shifts in transport planning may offer the potential for cascading system-wide effects. Without such structural interventions, efforts to promote smart mobility through pricing adjustments, digital upgrades, or behavioral campaigns risk being incremental and insufficient.
Finally, while the study offers new theoretical and practical insights, it also points to avenues for future research. Comparative and longitudinal studies are needed to examine how these barriers evolve across different urban contexts, particularly in the Global South, where institutional and infrastructural deficits are more pronounced. Methodological extensions combining TISM with fsQCA or Agent-Based Modeling could further illuminate how interventions at leverage points interact under dynamic and uncertain conditions.
Appendix A
Appendix A. Data Collection tool
| Section | Item/Question | Responses Format |
| A. Background Information | 1. Please indicate your current role/affiliation (e.g., policymaker, academic, practitioner, private sector). | Open-ended |
| 2. How many years of experience do you have in the field of urban mobility, transport planning, or related areas? | Number of Years | |
| B. Barrier Validation | 3. Please rate the relevance of each barrier (list of 31 barriers provided in a separate sheet) to smart mobility adoption in your context. | 5-point Likert scale (1=Not Relevant, 5=Highly Relevant) |
| 4. From your experience, are there barriers not captured in this list? Please specify. | Open-ended | |
| C. Barrier Interrelationships (TISM Input) | 5. Do you believe Barrier X influences Barrier Y? (Pairwise comparisons of 14 barriers presented in matrix form). | Response options: V (X influences Y), A (Y influences X), X (Mutual influence), O (No relation). |
| 6. Please provide a brief explanation for your judgment (why/how one barrier influences another). | Open-ended |
References
- Goumiri, S.; Yahiaoui, S.; Djahel, S. Smart Mobility in Smart Cities: Emerging Challenges, Recent Advances and Future Directions. Journal of Intelligent Transportation Systems: Technology, Planning, and Operations 2023.
- Hensher, D.A.; Nelson, J.D. Do Integrated Mobility Services Have a Future? The Neglected Role of Non-Mobility Service Providers: Challenges, and Opportunities to Extract Sustainable Transport Outcomes. Transp Policy (Oxf) 2025, 163, 348–357, doi:10.1016/j.tranpol.2025.01.029.
- Ribeiro, P.; Dias, G.; Pereira, P. Transport Systems and Mobility for Smart Cities. Applied System Innovation 2021, 4, doi:10.3390/asi4030061.
- Chen, Z.; Chan, I.C.C. Smart Cities and Quality of Life: A Quantitative Analysis of Citizens’ Support for Smart City Development. Information Technology and People 2023, 36, 263–285, doi:10.1108/ITP-07-2021-0577.
- Zhao, C.; Wang, K.; Dong, X.; Dong, K. Is Smart Transportation Associated with Reduced Carbon Emissions? The Case of China. Energy Econ 2022, 105, doi:10.1016/j.eneco.2021.105715.
- Mitieka, D.; Luke, R.; Twinomurinzi, H.; Mageto, J. Smart Mobility in Urban Areas: A Bibliometric Review and Research Agenda. Sustainability (Switzerland) 2023, 15.
- Carpentiere, C.D.; Messeni Petruzzelli, A.; Ardito, L. Success Factors in Smart Mobility: A New Framework and Implications for the EuroMed Context from Case Study of New York, Copenhagen, Singapore, Bari and Barcelona. EuroMed Journal of Business 2024, doi:10.1108/EMJB-01-2024-0015.
- Shaheen, S.; Cohen, A. Shared Ride Services in North America: Definitions, Impacts, and the Future of Pooling. Transp Rev 2019, 39, 427–442.
- Zhang, Y.; Kamargianni, M. A Review on the Factors Influencing the Adoption of New Mobility Technologies and Services: Autonomous Vehicle, Drone, Micromobility and Mobility as a Service. Transp Rev 2023, 43, 407–429, doi:10.1080/01441647.2022.2119297.
- Wolniak, R.; Stecuła, K. Artificial Intelligence in Smart Cities—Applications, Barriers, and Future Directions: A Review. Smart Cities 2024, 7, 1346–1389.
- Tarei, P.K.; Chand, P.; Gupta, H. Barriers to the Adoption of Electric Vehicles: Evidence from India. J Clean Prod 2021, 291, doi:10.1016/j.jclepro.2021.125847.
- Kent, J.L. Driving to Save Time or Saving Time to Drive? The Enduring Appeal of the Private Car. Transp Res Part A Policy Pract 2014, 65, 103–115, doi:10.1016/j.tra.2014.04.009.
- Qiao, S.; Yeh, A.G.O. Mobility-on-Demand Public Transport toward Spatial Justice: Shared Mobility or Mobility as a Service. Transp Res D Transp Environ 2023, 123, doi:10.1016/j.trd.2023.103916.
- Harrison, G.; Grant-Muller, S.M.; Hodgson, F.C. New and Emerging Data Forms in Transportation Planning and Policy: Opportunities and Challenges for “Track and Trace” Data. Transp Res Part C Emerg Technol 2020, 117, doi:10.1016/j.trc.2020.102672.
- Rye, T.; Lyons, G.; Svensson, T.; Lenferink, S.; Mladenovič, L.; Piras, F.; Witzell, J. Uncertainty and Triple Access Planning in European Sustainable Urban Mobility Plans: A Long Way to Go Yet? Transportation Planning and Technology 2024, doi:10.1080/03081060.2024.2311804.
- Marsden, G.; Reardon, L. Questions of Governance: Rethinking the Study of Transportation Policy. Transp Res Part A Policy Pract 2017, 101, 238–251, doi:10.1016/j.tra.2017.05.008.
- Woods, O. Subverting the Logics of “Smartness” in Singapore: Smart Eldercare and Parallel Regimes of Sustainability. Sustain Cities Soc 2020, 53, doi:10.1016/j.scs.2019.101940.
- Kębłowski, W.; Dobruszkes, F.; Boussauw, K. Moving Past Sustainable Transport Studies: Towards a Critical Perspective on Urban Transport. Transp Res Part A Policy Pract 2022, 159, 74–83, doi:10.1016/j.tra.2022.02.008.
- Pangbourne, K.; Mladenović, M.N.; Stead, D.; Milakis, D. Questioning Mobility as a Service: Unanticipated Implications for Society and Governance. Transp Res Part A Policy Pract 2020, 131, 35–49, doi:10.1016/j.tra.2019.09.033.
- Docherty, I.; Marsden, G.; Anable, J. The Governance of Smart Mobility. Transp Res Part A Policy Pract 2018, 115, 114–125, doi:10.1016/j.tra.2017.09.012.
- Turienzo, J.; Cabanelas, P.; Lampón, J.F.; Parkhurst, G. The Transformation of Mobility in Europe: Technological Change and Social Conditionings. Travel Behav Soc 2025, 38, doi:10.1016/j.tbs.2024.100907.
- Canitez, F. Pathways to Sustainable Urban Mobility in Developing Megacities: A Socio-Technical Transition Perspective. Technol Forecast Soc Change 2019, 141, 319–329, doi:10.1016/j.techfore.2019.01.008.
- Vrščaj, D.; Nyholm, S.; Verbong, G.P.J. Smart Mobility Innovation Policy as Boundary Work: Identifying the Challenges of User Involvement. Transp Rev 2021, 41, 210–229, doi:10.1080/01441647.2020.1829743.
- Kitchin, R. The Real-Time City? Big Data and Smart Urbanism. GeoJournal 2014, 79, 1–14, doi:10.1007/s10708-013-9516-8.
- Groth, S. Multimodal Divide: Reproduction of Transport Poverty in Smart Mobility Trends. Transp Res Part A Policy Pract 2019, 125, 56–71, doi:10.1016/j.tra.2019.04.018.
- Paiva, S.; Ahad, M.A.; Tripathi, G.; Feroz, N.; Casalino, G. Enabling Technologies for Urban Smart Mobility: Recent Trends, Opportunities and Challenges. Sensors 2021, 21, 1–45.
- Hasselwander, M.; Bigotte, J.F. Transport Authorities and Innovation: Understanding Barriers for MaaS Implementation in the Global South. In Proceedings of the Transportation Research Procedia; Elsevier B.V., 2022; Vol. 62, pp. 475–482.
- Harris, S.; Mata, É.; Plepys, A.; Katzeff, C. Sharing Is Daring, but Is It Sustainable? An Assessment of Sharing Cars, Electric Tools and Offices in Sweden. Resour Conserv Recycl 2021, 170, doi:10.1016/j.resconrec.2021.105583.
- Kitchin, R. Data-Driven, Networked Urbanism. SSRN Electronic Journal 2015, doi:10.2139/ssrn.2641802.
- Vanolo, A. Is There Anybody out There? The Place and Role of Citizens in Tomorrow’s Smart Cities. Futures 2016, 82, 26–36, doi:10.1016/j.futures.2016.05.010.
- Sheller, M. Mobility Justice: The Politics of Movement in an Age of Extremes; Taylor & Francis, LLC, 2018; Vol. 8;.
- Golub, A.; Satterfield, V.; Serritella, M.; Singh, J.; Phillips, S. Assessing the Barriers to Equity in Smart Mobility Systems: A Case Study of Portland, Oregon. Case Stud Transp Policy 2019, 7, 689–697, doi:10.1016/j.cstp.2019.10.002.
- OECD OECD Economic Outlook; OECD, 2020; ISBN 9789264680135.
- Yao, Q.; Hu, C.; Zhou, W. The Impact of Customer Privacy Concerns on Service Robot Adoption Intentions: A Credence/Experience Service Typology Perspective. Technol Forecast Soc Change 2024, 198, doi:10.1016/j.techfore.2023.122948.
- Schuster, F.; Habibipour, A. Users’ Privacy and Security Concerns That Affect IoT Adoption in the Home Domain. Int J Hum Comput Interact 2024, 40, 1632–1643, doi:10.1080/10447318.2022.2147302.
- Pool, J.; Akhlaghpour, S.; Fatehi, F.; Gray, L.C. Data Privacy Concerns and Use of Telehealth in the Aged Care Context: An Integrative Review and Research Agenda. Int J Med Inform 2022, 160.
- Zhou, T. The Effect of Information Privacy Concern on Users’ Social Shopping Intention. Online Information Review 2020, 44, 1119–1133, doi:10.1108/OIR-09-2019-0298.
- Sadowski, J.; Maalsen, S. Modes of Making Smart Cities: Or, Practices of Variegated Smart Urbanism. Telematics and Informatics 2020, 55, doi:10.1016/j.tele.2020.101449.
- Shin, D.-H. The Effects of Trust, Security and Privacy in Social Networking: A Security-Based Approach to Understand the Pattern of Adoption. Interact Comput 2010, 22, 428–438, doi:10.1016/j.intcom.2010.05.001.
- Cavoukian, A.; Taylor, S.; Abrams, M.E. Privacy by Design: Essential for Organizational Accountability and Strong Business Practices. Identity in the Information Society 2010, 3, 405–413, doi:10.1007/s12394-010-0053-z.
- Tennakoon, V.; Wiles, J.; Peiris-John, R.; Wickremasinghe, R.; Kool, B.; Ameratunga, S. Transport Equity in Sri Lanka: Experiences Linked to Disability and Older Age. J Transp Health 2020, 18, doi:10.1016/j.jth.2020.100913.
- Bascom, G.W.; Christensen, K.M. The Impacts of Limited Transportation Access on Persons with Disabilities’ Social Participation. J Transp Health 2017, 7, 227–234, doi:10.1016/j.jth.2017.10.002.
- Lucas-Carrasco, R.; Salvador-Carulla, L. Life Satisfaction in Persons with Intellectual Disabilities. Res Dev Disabil 2012, 33, 1103–1109, doi:10.1016/j.ridd.2012.02.002.
- Bruzzone, F.; Cavallaro, F.; Nocera, S. The Definition of Equity in Transport. In Proceedings of the Transportation Research Procedia; Elsevier B.V., January 1 2023; Vol. 69, pp. 440–447.
- Lim, H.S.M.; Taeihagh, A. Algorithmic Decision-Making in AVs: Understanding Ethical and Technical Concerns for Smart Cities. Sustainability (Switzerland) 2019, 11, doi:10.3390/su11205791.
- Imrie, R. Universalism, Universal Design and Equitable Access to the Built Environment. Disabil Rehabil 2012, 34, 873–882, doi:10.3109/09638288.2011.624250.
- Meadowcroft, J. Who Is in Charge Here? Governance for Sustainable Development in a Complex World. Journal of Environmental Policy and Planning 2007, 9, 299–314.
- Rode, P.; Floater, G.; Thomopoulos, N.; Docherty, J.; Schwinger, P.; Mahendra, A.; Fang, W. Accessibility in Cities: Transport and Urban Form. In; 2017; pp. 239–273.
- Hölscher, K.; Frantzeskaki, N.; McPhearson, T.; Loorbach, D. Capacities for Urban Transformations Governance and the Case of New York City. Cities 2019, 94, 186–199, doi:10.1016/j.cities.2019.05.037.
- Benevolo, C.; Dameri, R.P.; D’Auria, B. Smart Mobility in Smart City. In; 2016; pp. 13–28.
- Cohen, B.; Kietzmann, J. Ride On! Mobility Business Models for the Sharing Economy. Organ Environ 2014, 27, 279–296, doi:10.1177/1086026614546199.
- Kamargianni, M.; Li, W.; Matyas, M.; Schäfer, A. A Critical Review of New Mobility Services for Urban Transport. In Proceedings of the Transportation Research Procedia; Elsevier B.V., 2016; Vol. 14, pp. 3294–3303.
- Sheller, M.; Urry, J. The City and the Car. Int J Urban Reg Res 2000, 24, 737–757, doi:10.1111/1468-2427.00276.
- Banister, D. The Sustainable Mobility Paradigm. Transp Policy (Oxf) 2008, 15, 73–80, doi:10.1016/j.tranpol.2007.10.005.
- Polites; Karahanna Shackled to the Status Quo: The Inhibiting Effects of Incumbent System Habit, Switching Costs, and Inertia on New System Acceptance. MIS Quarterly 2012, 36, 21, doi:10.2307/41410404.
- Lovelace, R.; Parkin, J.; Cohen, T. Open Access Transport Models: A Leverage Point in Sustainable Transport Planning. Transp Policy (Oxf) 2020, 97, 47–54, doi:10.1016/j.tranpol.2020.06.015.
- Paddeu, D.; Lyons, G.; Chatterjee, K.; Calvert, T. Practitioner Views on Transport Planning’s Evolution – A Sisyphean Task Still Ahead? Transp Policy (Oxf) 2024, 156, 89–100, doi:10.1016/j.tranpol.2024.07.015.
- Chang, V. An Ethical Framework for Big Data and Smart Cities. Technol Forecast Soc Change 2021, 165, doi:10.1016/j.techfore.2020.120559.
- Müller-Eie, D. Conceptual Barriers to Integrating Smart and Sustainable Mobility Planning. In A Nordic Smart Sustainable City; Routledge: London, 2025; pp. 94–105.
- Kirejev, M.; Gerstlberger, W.D.; Niine, T. Contrasting “Smart Mobility” and “Sustainable Mobility” in Transport Governance: The Case of Municipalities in Estonia. Scientific Papers of the University of Pardubice, Series D: Faculty of Economics and Administration 2024, 32, doi:10.46585/sp32011891.
- Klaever, A.; Roessner, V.; Becker, S.; Scheidler, V. Lived Expertise of the Structurally Disadvantaged: Towards a More Just Participatory Transport Planning Process. Mobilities 2024, doi:10.1080/17450101.2024.2426554.
- Schwanen, T. Transport Geography, Climate Change and Space: Opportunity for New Thinking. J Transp Geogr 2019, 81, doi:10.1016/j.jtrangeo.2019.102530.
- Mullen, C.; Marsden, G. Mobility Justice in Low Carbon Energy Transitions. Energy Res Soc Sci 2016, 18, 109–117, doi:10.1016/j.erss.2016.03.026.
- van Dijk, J.A.G.M. Digital Divide Research, Achievements and Shortcomings. Poetics 2006, 34, 221–235, doi:10.1016/j.poetic.2006.05.004.
- Salazar-Miranda, A.; Heine, C.; Duarte, F.; Schechtner, K.; Ratti, C. Measuring the Impact of Slow Zones on Street Life Using Social Media. Cities 2022, 131, doi:10.1016/j.cities.2022.104010.
- Pucher, J.; Buehler, R. Walking and Cycling for Healthy Cities; 2010; Vol. 36;.
- Aldred, R.; Verlinghieri, E.; Sharkey, M.; Itova, I.; Goodman, A. Equity in New Active Travel Infrastructure: A Spatial Analysis of London’s New Low Traffic Neighbourhoods. J Transp Geogr 2021, 96, doi:10.1016/j.jtrangeo.2021.103194.
- Litman, T.A.; Litman, T. Evaluating Public Transit Benefits and Costs; 2025;
- Rasca, S.; Saeed, N. Exploring the Factors Influencing the Use of Public Transport by Commuters Living in Networks of Small Cities and Towns. Travel Behav Soc 2022, 28, 249–263, doi:10.1016/j.tbs.2022.03.007.
- Pojani, D.; Stead, D. Sustainable Urban Transport in the Developing World: Beyond Megacities. Sustainability (Switzerland) 2015, 7, 7784–7805, doi:10.3390/su7067784.
- Sharma, G.; Patil, G.R. Urban Spatial Structure and Equity for Urban Services through the Lens of Accessibility. Transp Policy (Oxf) 2024, 146, 72–90, doi:10.1016/j.tranpol.2023.10.017.
- Shaheen, S. Shared Mobility: The Potential of Ridehailing and Pooling. In Three Revolutions; Island Press/Center for Resource Economics: Washington, DC, 2018; pp. 55–76.
- Sochor, J.; Arby, H.; Karlsson, I.C.M.A.; Sarasini, S. A Topological Approach to Mobility as a Service: A Proposed Tool for Understanding Requirements and Effects, and for Aiding the Integration of Societal Goals. Research in Transportation Business and Management 2018, 27, 3–14, doi:10.1016/j.rtbm.2018.12.003.
- Steg, L. Car Use: Lust and Must. Instrumental, Symbolic and Affective Motives for Car Use. Transp Res Part A Policy Pract 2005, 39, 147–162, doi:10.1016/j.tra.2004.07.001.
- Brenner, N.; Madden, D.J.; Wachsmuth, D. Assemblage Urbanism and the Challenges of Critical Urban Theory. City 2011, 15, 225–240, doi:10.1080/13604813.2011.568717.
- Tonnarelli, F.; Mora, L. Smart Urbanism in Africa: When Theories Do Not Fit with Contextual Practices. Reg Stud 2024, 58, 1767–1777, doi:10.1080/00343404.2023.2235407.
- Monstadt, J.; Rutherford, J.; Coutard, O. Infrastructures as Urban Solutions? Critical Perspectives on Transformative Socio-Technical Change. Urban Studies 2025, 62, 1709–1730, doi:10.1177/00420980251339430.
- Sushil Modified ISM/TISM Process with Simultaneous Transitivity Checks for Reducing Direct Pair Comparisons. Global Journal of Flexible Systems Management 2017, 18, 331–351, doi:10.1007/s40171-017-0167-3.
- Butler, L.; Yigitcanlar, T.; Paz, A. Barriers and Risks of Mobility-as-a-Service (MaaS) Adoption in Cities: A Systematic Review of the Literature. Cities 2021, 109, doi:10.1016/j.cities.2020.103036.
- Pritchard, J. MaaS to Pull Us out of a Car-Centric Orbit: Principles for Sustainable Mobility-as-a-Service in the Context of Unsustainable Car Dependency. Case Stud Transp Policy 2022, 10, 1483–1493.
- Alonso-González, M.J.; Hoogendoorn-Lanser, S.; van Oort, N.; Cats, O.; Hoogendoorn, S. Drivers and Barriers in Adopting Mobility as a Service (MaaS) – A Latent Class Cluster Analysis of Attitudes. Transp Res Part A Policy Pract 2020, 132, 378–401, doi:10.1016/j.tra.2019.11.022.
- Zhao, C.; Dong, K.; Taghizadeh-Hesary, F. Can Smart Transportation Enhance Green Development Efficiency? Economic Change and Restructuring 2023, 56, 825–857, doi:10.1007/s10644-022-09448-7.
- Shah, K.J.; Pan, S.-Y.; Lee, I.; Kim, H.; You, Z.; Zheng, J.-M.; Chiang, P.-C. Green Transportation for Sustainability: Review of Current Barriers, Strategies, and Innovative Technologies. J Clean Prod 2021, 326, 129392, doi:10.1016/j.jclepro.2021.129392.
- Nieuwenhuijsen, M.J. Urban and Transport Planning Pathways to Carbon Neutral, Liveable and Healthy Cities; A Review of the Current Evidence. Environ Int 2020, 140.
- Mahdavian, A.; Shojaei, A.; McCormick, S.; Papandreou, T.; Eluru, N.; Oloufa, A.A. Drivers and Barriers to Implementation of Connected, Automated, Shared, and Electric Vehicles: An Agenda for Future Research. IEEE Access 2021, 9, 22195–22213, doi:10.1109/ACCESS.2021.3056025.
- Fagnant, D.J.; Kockelman, K. Preparing a Nation for Autonomous Vehicles: Opportunities, Barriers and Policy Recommendations. Transp Res Part A Policy Pract 2015, 77, 167–181, doi:10.1016/j.tra.2015.04.003.
- Merfeld, K.; Wilhelms, M.P.; Henkel, S.; Kreutzer, K. Carsharing with Shared Autonomous Vehicles: Uncovering Drivers, Barriers and Future Developments – A Four-Stage Delphi Study. Technol Forecast Soc Change 2019, 144, 66–81, doi:10.1016/j.techfore.2019.03.012.
- Karlsson, I.C.M.; Mukhtar-Landgren, D.; Smith, G.; Koglin, T.; Kronsell, A.; Lund, E.; Sarasini, S.; Sochor, J. Development and Implementation of Mobility-as-a-Service – A Qualitative Study of Barriers and Enabling Factors. Transp Res Part A Policy Pract 2020, 131, 283–295, doi:10.1016/j.tra.2019.09.028.
- Casadó, R.G.; Golightly, D.; Laing, K.; Palacin, R.; Todd, L. Children, Young People and Mobility as a Service: Opportunities and Barriers for Future Mobility. Transp Res Interdiscip Perspect 2020, 4, doi:10.1016/j.trip.2020.100107.
- Weckström, C.; Mladenović, M.N.; Ullah, W.; Nelson, J.D.; Givoni, M.; Bussman, S. User Perspectives on Emerging Mobility Services: Ex Post Analysis of Kutsuplus Pilot. Research in Transportation Business and Management 2018, 27, 84–97, doi:10.1016/j.rtbm.2018.06.003.
- Kayikci, Y.; Kabadurmus, O. Barriers to the Adoption of the Mobility-as-a-Service Concept: The Case of Istanbul, a Large Emerging Metropolis. Transp Policy (Oxf) 2022, 129, 219–236, doi:10.1016/j.tranpol.2022.10.015.
- Sanders, R.L.; Branion-Calles, M.; Nelson, T.A. To Scoot or Not to Scoot: Findings from a Recent Survey about the Benefits and Barriers of Using E-Scooters for Riders and Non-Riders. Transp Res Part A Policy Pract 2020, 139, 217–227, doi:10.1016/j.tra.2020.07.009.
- Martínez-Buelvas, L.; Rakotonirainy, A.; Grant-Smith, D.; Oviedo-Trespalacios, O. A Transport Justice Approach to Integrating Vulnerable Road Users with Automated Vehicles. Transp Res D Transp Environ 2022, 113, doi:10.1016/j.trd.2022.103499.
- Krueger, R.A..; Casey, M.Anne. Focus Groups : A Practical Guide for Applied Research; SAGE, 2009; ISBN 1412969476.
- Morgan, D.L. FOCUS GROUPS; 1996; Vol. 22;.
- Bloor, M.; Frankland, J.; Thomas, M.; Robson, K. Focus Groups in Social Research; SAGE Publications Ltd: 1 Oliver’s Yard, 55 City Road, London England EC1Y 1SP United Kingdom , 2001; ISBN 9780761957423.
- Kar, S.; Kar, A.K.; Gupta, M.P. Modeling Drivers and Barriers of Artificial Intelligence Adoption: Insights from a Strategic Management Perspective. Intelligent Systems in Accounting, Finance and Management 2021, 28, 217–238, doi:10.1002/isaf.1503.
- Yadav, G.; Kumar, A.; Luthra, S.; Garza-Reyes, J.A.; Kumar, V.; Batista, L. A Framework to Achieve Sustainability in Manufacturing Organisations of Developing Economies Using Industry 4.0 Technologies’ Enablers. Comput Ind 2020, 122, doi:10.1016/j.compind.2020.103280.
- Warfield, J.N.; Member, S. Toward Interpretation of Complex Structural Models; 1974;
- Singh, M.D.; Kant, R. Knowledge Management Barriers: An Interpretive Structural Modeling Approach. International Journal of Management Science and Engineering Management 2008, 3, 141–150, doi:10.1080/17509653.2008.10671042.
- Mathiyazhagan, K.; Govindan, K.; Noorul Haq, A. Pressure Analysis for Green Supply Chain Management Implementation in Indian Industries Using Analytic Hierarchy Process. Int J Prod Res 2014, 52, 188–202, doi:10.1080/00207543.2013.831190.
- Jain, P.; Garg, S.; Kansal, G. A TISM Approach for the Analysis of Enablers in Implementing Mass Customization in Indian Manufacturing Units. Production Planning and Control 2023, 34, 173–188, doi:10.1080/09537287.2021.1900616.
- Singh, A.; Singla, A.R. Modelling and Analysis of Factors for Implementation of Smart Cities: TISM Approach. Journal of Modelling in Management 2022, 17, 1587–1622, doi:10.1108/JM2-07-2020-0192.
- Whetten, D. Whetten-What-Constitutes-a-Theoretical-Contribution. Academy of Management Review 1989, 14, 490–495.
- Sushil; Dinesh, K.K. Structured Literature Review with TISM Leading to an Argumentation Based Conceptual Model. Global Journal of Flexible Systems Management 2022, 23, 387–407, doi:10.1007/s40171-022-00309-w.
- Mangla, S.K.; Kumar, P.; Barua, M.K. Risk Analysis in Green Supply Chain Using Fuzzy AHP Approach: A Case Study. Resour Conserv Recycl 2015, 104, 375–390, doi:10.1016/j.resconrec.2015.01.001.
- Venkatesh, V.G.; Zhang, A.; Deakins, E.; Luthra, S.; Mangla, S. A Fuzzy AHP-TOPSIS Approach to Supply Partner Selection in Continuous Aid Humanitarian Supply Chains. Ann Oper Res 2019, 283, 1517–1550, doi:10.1007/s10479-018-2981-1.
- Linstone, H.A.; Lendaris, G.G.; Rogers, S.D.; Wakeland, W.; Williams, M.; Valery, P. The Use of Structural Modeling for Technology Assessment; 1979; Vol. 14;.
- Jena, J.; Sidharth, S.; Thakur, L.S.; Kumar Pathak, D.; Pandey, V.C. Total Interpretive Structural Modeling (TISM): Approach and Application. Journal of Advances in Management Research 2017, 14, 162–181, doi:10.1108/JAMR-10-2016-0087.
- Saaty, R.W. THE ANALYTIC HIERARCHY PROCESS-WHAT IT IS AND HOW IT IS USED; 1987; Vol. 9;.
- Sethi, M.; Sushil; Gupta, M.P. Modelling the Enablers of Organizational Resilience: A Modified Total Interpretive Structural Modeling (m-TISM) Approach. Benchmarking 2024, doi:10.1108/BIJ-09-2023-0621.
- Dubey, R.; Gunasekaran, A.; Papadopoulos, T.; Childe, S.J.; Shibin, K.T.; Wamba, S.F. Sustainable Supply Chain Management: Framework and Further Research Directions. J Clean Prod 2017, 142, 1119–1130, doi:10.1016/j.jclepro.2016.03.117.
- Dhir, S.; Dhir, S. Modeling of Strategic Thinking Enablers: A Modified Total Interpretive Structural Modeling (TISM) and MICMAC Approach. International Journal of System Assurance Engineering and Management 2020, 11, 175–188, doi:10.1007/s13198-019-00937-z.
- Jayalakshmi, B.; Pramod, V.R. Total Interpretive Structural Modeling (TISM) of the Enablers of a Flexible Control System for Industry. Global Journal of Flexible Systems Management 2015, 16, 63–85, doi:10.1007/s40171-014-0080-y.
- Goel, P.; Kumar, A.; Parayitam, S.; Luthra, S. Understanding Transport Users’ Preferences for Adopting Electric Vehicle Based Mobility for Sustainable City: A Moderated Moderated-Mediation Model. J Transp Geogr 2023, 106.
- Lamond, J.; Everett, G. Sustainable Blue-Green Infrastructure: A Social Practice Approach to Understanding Community Preferences and Stewardship. Landsc Urban Plan 2019, 191, doi:10.1016/j.landurbplan.2019.103639.
- Johnstone, D.J. A Listening Guide Analysis of Women’s Experiences of Unacknowledged Rape. Psychol Women Q 2016, 40, 275–289, doi:10.1177/0361684315624460.
- Baliga, A.J.; Chawla, V.; Sunder M, V.; Kumar, R. Barriers to Service Recovery in B2B Markets: A TISM Approach in the Context of IT-Based Services. Journal of Business and Industrial Marketing 2021, 36, 1452–1473, doi:10.1108/JBIM-02-2020-0112.
- Mageto, J.; Twinomurinzi, H.; Luke, R.; Mhlongo, S.; Bwalya, K.; Bvuma, S. Building Resilience into Smart Mobility for Urban Cities: An Emerging Economy Perspective. Int J Prod Res 2024, 62, 5556–5573, doi:10.1080/00207543.2022.2139866.
- Sunder, V. Rejects Reduction in a Retail Bank Using Lean Six Sigma. Production Planning and Control 2016, 27, 1131–1142, doi:10.1080/09537287.2016.1187312.
- Givoni, M.; Banister, D. Mobility, Transport and Carbon. In Moving Towards Low Carbon Mobility; Edward Elgar Publishing, 2013.
- Su, W.; Junge, S. Unlocking the Recipe for Organizational Resilience: A Review and Future Research Directions. European Management Journal 2023, 41, 1086–1105, doi:10.1016/j.emj.2023.03.002.
- Hesselgren, M.; Sjöman, M.; Pernestål, A. Understanding User Practices in Mobility Service Systems: Results from Studying Large Scale Corporate MaaS in Practice. Travel Behav Soc 2020, 21, 318–327, doi:10.1016/j.tbs.2018.12.005.
- Raetze, S.; Duchek, S.; Maynard, M.T.; Kirkman, B.L. Resilience in Organizations: An Integrative Multilevel Review and Editorial Introduction. Group Organ Manag 2021, 46, 607–656, doi:10.1177/10596011211032129.
- Vassilakopoulou, P.; Hustad, E. Bridging Digital Divides: A Literature Review and Research Agenda for Information Systems Research. Information Systems Frontiers 2023, 25, 955–969, doi:10.1007/s10796-020-10096-3.
- Steg, L.; Gifford, R. Sustainable Transportation and Quality of Life. J Transp Geogr 2005, 13, 59–69, doi:10.1016/j.jtrangeo.2004.11.003.
- Lucas, K. Transport and Social Exclusion: Where Are We Now? Transp Policy (Oxf) 2012, 20, 105–113, doi:10.1016/j.tranpol.2012.01.013.
- Yeo, V.C.S.; Goh, S.K.; Rezaei, S. Consumer Experiences, Attitude and Behavioral Intention toward Online Food Delivery (OFD) Services. Journal of Retailing and Consumer Services 2017, 35, 150–162, doi:10.1016/j.jretconser.2016.12.013.
- Anable, J. “Complacent Car Addicts”; or “Aspiring Environmentalists”? Identifying Travel Behaviour Segments Using Attitude Theory. Transp Policy (Oxf) 2005, 12, 65–78, doi:10.1016/j.tranpol.2004.11.004.
- Lyons, G.; Hammond, P.; Mackay, K. The Importance of User Perspective in the Evolution of MaaS. Transp Res Part A Policy Pract 2019, 121, 22–36, doi:10.1016/j.tra.2018.12.010.
- Sindhwani, R.; Malhotra, V. Modelling and Analysis of Agile Manufacturing System by ISM and MICMAC Analysis. International Journal of System Assurance Engineering and Management 2017, 8, 253–263, doi:10.1007/s13198-016-0426-2.
- Bhosale, V.A.; Kant, R. An Integrated ISM Fuzzy MICMAC Approach for Modelling the Supply Chain Knowledge Flow Enablers. Int J Prod Res 2016, 54, 7374–7399, doi:10.1080/00207543.2016.1189102.
- Banister, D.; Woodcock, J. Moving Toward Sustainable Urban Transport. In Ensuring a Sustainable Future; Oxford University Press, 2013; pp. 135–160.
- Shukla, M.; Shankar, R. Modeling of Critical Success Factors for Adoption of Smart Manufacturing System in Indian SMEs: An Integrated Approach. OPSEARCH 2022, 59, 1271–1303, doi:10.1007/s12597-021-00566-w.
- Wong, Y.Z.; Hensher, D.A.; Mulley, C. Mobility as a Service (MaaS): Charting a Future Context. Transp Res Part A Policy Pract 2020, 131, 5–19, doi:10.1016/j.tra.2019.09.030.
- Brenner, N. What Is Critical Urban Theory? City 2009, 13, 198–207, doi:10.1080/13604810902996466.
- Khalaj, F.; Pojani, D.; Sipe, N.; Corcoran, J. Why Are Cities Removing Their Freeways? A Systematic Review of the Literature. Transp Rev 2020, 40, 557–580, doi:10.1080/01441647.2020.1743919.
- De Vos, J. Towards Truly Sustainable Mobility. Transp Res Interdiscip Perspect 2024, 24.
- Lucas, K.; Mattioli, G.; Verlinghieri, E.; Guzman, A. Transport Poverty and Its Adverse Social Consequences. Proceedings of the Institution of Civil Engineers: Transport 2016, 169, 353–365, doi:10.1680/jtran.15.00073.
- Santos, G. Sustainability and Shared Mobility Models. Sustainability (Switzerland) 2018, 10.
- Shove, E.; Pantzar, M.; Watson, M. The Dynamics of Social Practice: Everyday Life and How It Changes; SAGE Publications Ltd: 1 Oliver’s Yard, 55 City Road, London EC1Y 1SP United Kingdom , 2012; ISBN 9780857020437.
- Geels, F.W. A Socio-Technical Analysis of Low-Carbon Transitions: Introducing the Multi-Level Perspective into Transport Studies. J Transp Geogr 2012, 24, 471–482, doi:10.1016/j.jtrangeo.2012.01.021.
- Graham, S.; Marvin, S. Splintering Urbanism; Routledge: London, 2002; ISBN 9780203452202.
- Longo, A.; Zappatore, M.; Navathe, S.B. The Unified Chart of Mobility Services: Towards a Systemic Approach to Analyze Service Quality in Smart Mobility Ecosystem. J Parallel Distrib Comput 2019, 127, 118–133, doi:10.1016/j.jpdc.2018.12.009.
- Kussl, S.; Wald, A. Smart Mobility and Its Implications for Road Infrastructure Provision: A Systematic Literature Review. Sustainability (Switzerland) 2023, 15.
Figure 1.
TISM hierarchical Model for Smart Mobility Barriers.
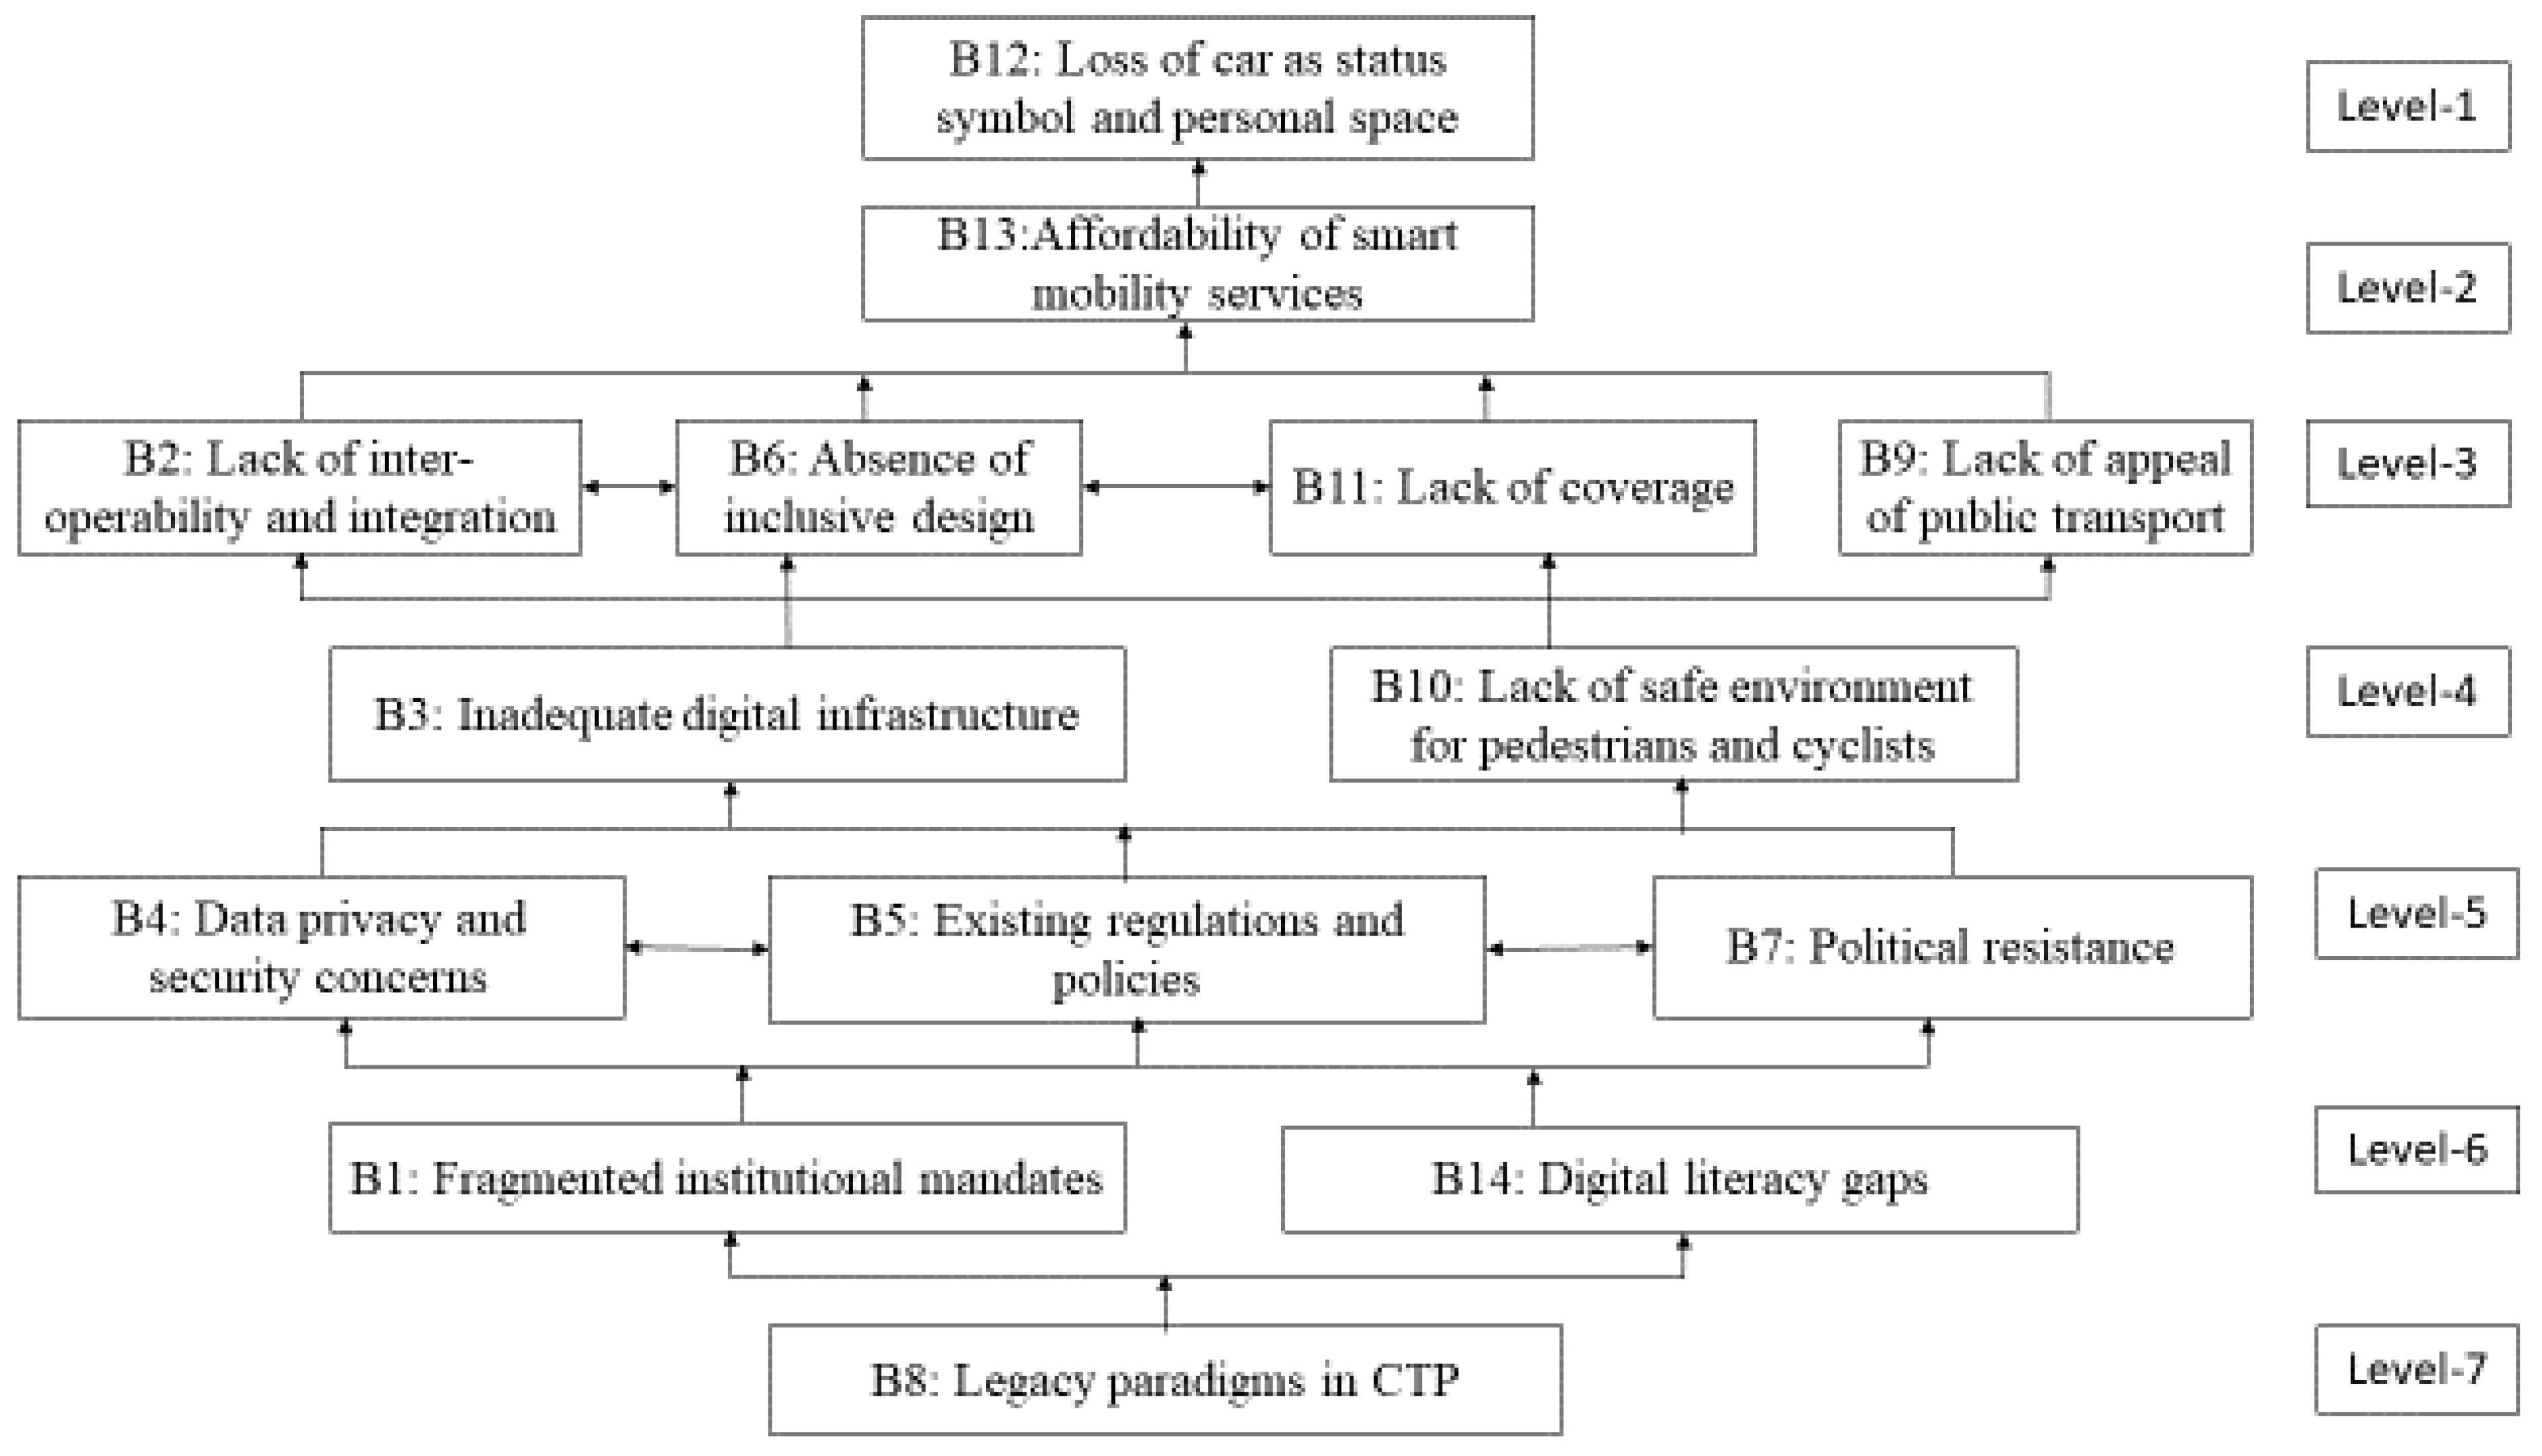
Figure 2.
MICMAC Analysis. infrastructure; B4=Data privacy and security; B5=Existing regulations and policies; B6=Absence of inclusive design; B7=Political resistance; B8=Legacy Paradigms in CTP; B9=Lack of public transport appeal; B10=Lack of safe environment for pedestrians and cyclists; B11=Lack of coverage: B12=Loss of car as status symbol and personal space; B13=Affordability; B14=Digital literacy gaps. Source: Authors’ own creation.
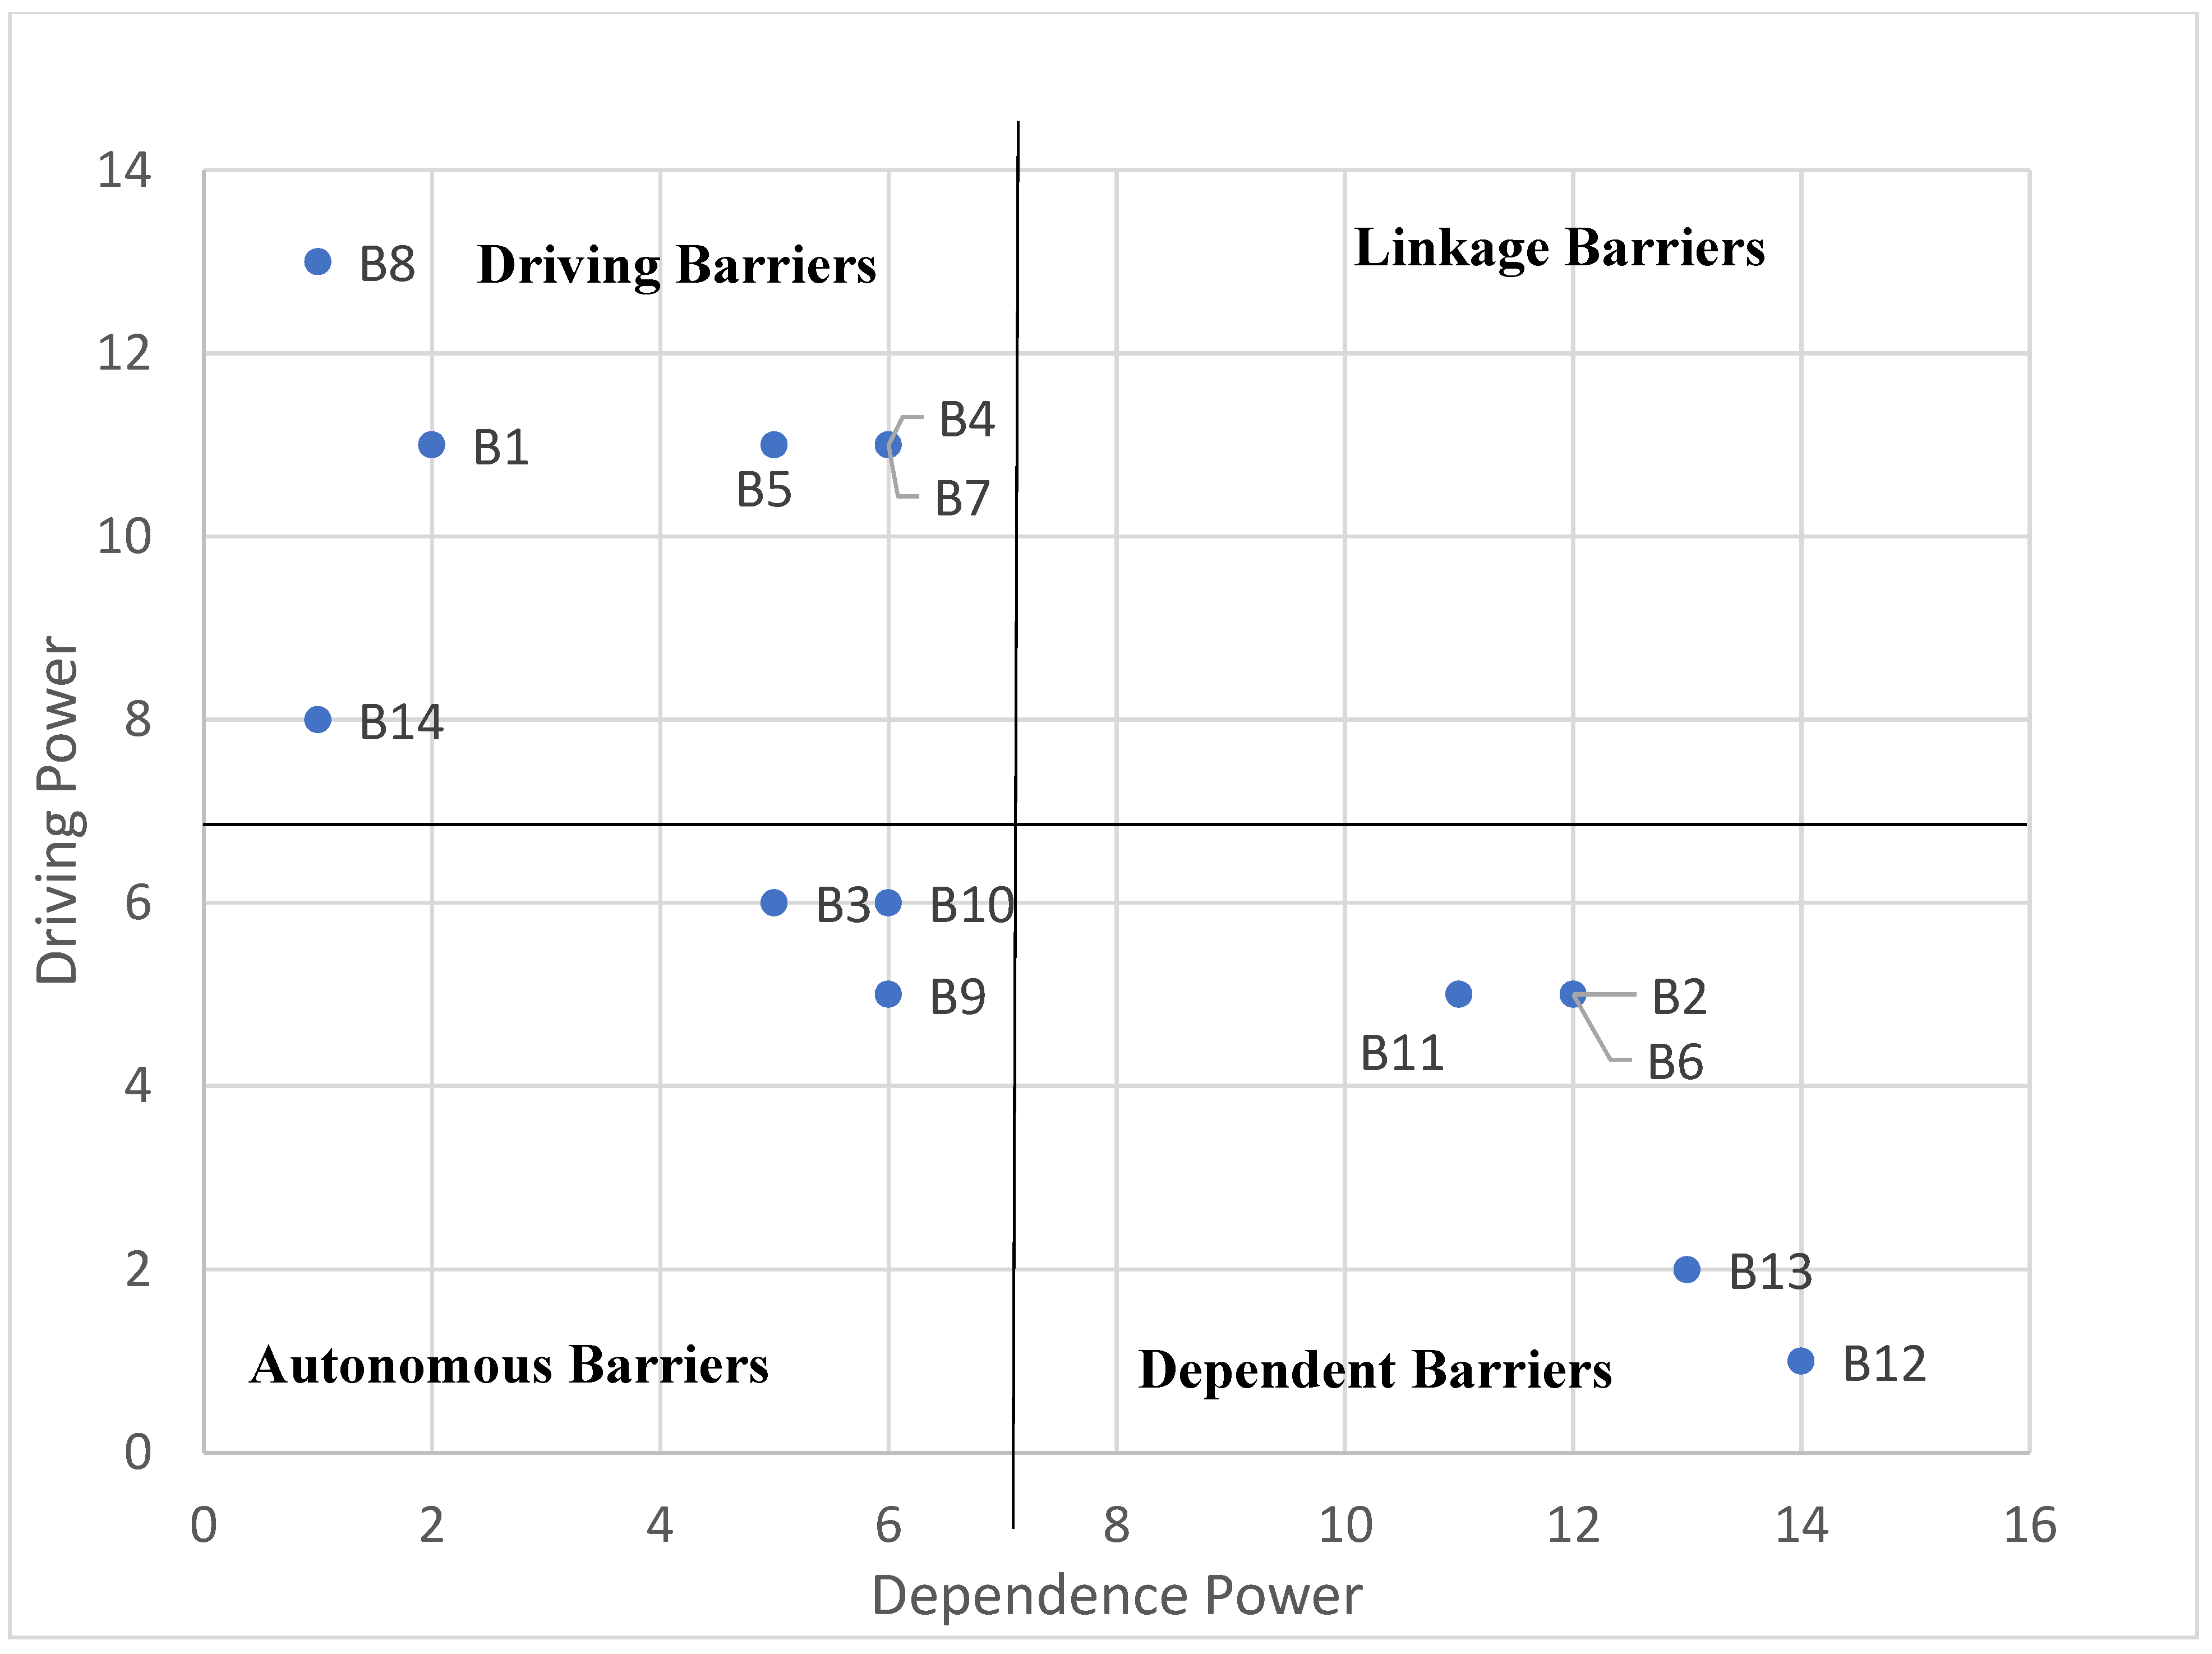

Table 1.
Original List of Barriers to Smart Mobility Adoption obtained from literature review.
| No. | Barrier | Source |
| 1 | Infrastructure for sustainable mobility | [27,79] |
| 2 | Openness to Innovation and new technologies in mobility | [27,80,81] |
| 3 | Platform security | [27,32] |
| 4 | Public transport attitude | [81,82,83] |
| 5 | Car-dependency reduction | [84] |
| 6 | Conventional Transport Planning (CTP) | [15,59,84] |
| 7 | App-based (on-demand) mobility services | [15] |
| 8 | Active mobility | [15] |
| 9 | Basic transportation access | [32,85] |
| 10 | Access to data and the internet | [32] |
| 11 | Digital and banking divide | [27] |
| 12 | Low digital literacy and privacy concerns | [32,86] |
| 13 | Perceived security | [86,87] |
| 14 | Conservative mindsets and customer acceptance | [83,87] |
| 15 | Data safety, ethics, and surveillance concerns | [11] |
| 16 | Regulatory and legal uncertainty (liability, insurance) | [83,87,88] |
| 17 | Urban-centric service coverage | [87] |
| 18 | Lobbyism and industry influence | [87] |
| 19 | Loss of car as personal space/status symbol | [81,87] |
| 20 | Public acceptance of shared mobility | [83] |
| 21 | Legislation, taxation, and funding gaps | [88] |
| 22 | Weak business models and market uncertainty | [88] |
| 23 | Lack of cooperation among stakeholders | [88] |
| 24 | Interoperability and multimodal coordination issues | [10,27,89] |
| 25 | Ticketing/payment system fragmentation | [89] |
| 26 | Weak integration with public transport in underserved areas | [10,90] |
| 27 | Tradition of private vehicle ownership | [79,81] |
| 28 | Limited platform appeal to older adults and conservative users | [79] |
| 29 | Fragmented vision, collaboration, and data-sharing | [79,91] |
| 30 | Financial/resource constraints | [91] |
| 31 | Unsafe walking/cycling infrastructure and vulnerable road user neglect | [92,93] |
Table 2.
List of Experts.
| Expert | Sector | Role / Title | Experience Area |
| E1 | Academia | Professor of Urban Transport | Smart mobility policy, urban governance |
| E2 | Government | Senior Urban Planner (City Transport Dept.) | Multi-modal transport planning |
| E3 | Industry | Head of Operations, Ride-hailing Platform | Platform-based mobility service delivery |
| E4 | Civil Society | Director, Mobility and Access NGO | Inclusive design and transport justice |
| E5 | Regulator | Officer, National ICT Authority | Data governance, privacy, and digital infrastructure |
Table 3.
SSIM Matrix.
| Barriers | B14 | B13 | B12 | B11 | B10 | B9 | B8 | B7 | B6 | B5 | B4 | B3 | B2 | B1 |
| B1:Fragmented institutional mandates | O | V | V | V | O | V | A | V | V | V | O | O | V | X |
| B2:Lack of inter-operability and information on multimodal journeys and Integration | O | V | O | A | A | A | A | A | V | A | O | A | X | |
| B3:Inadequate digital infrastructure | O | V | O | V | O | O | A | A | V | A | O | X | ||
| B4:Data privacy and security concerns | A | V | V | V | O | O | A | V | V | A | X | |||
| B5:Existing regulations and policies are not favorable for Smart Mobility | O | V | V | V | V | V | A | A | V | X | ||||
| B6 Absence of inclusive design | O | V | O | V | A | A | O | A | X | |||||
| B7 Political resistance | O | V | O | V | O | V | A | X | ||||||
| B8 Legacy paradigms in CTP | O | V | V | V | V | V | X | |||||||
| B9:Lack of appeal of public transport | O | V | V | O | O | X | ||||||||
| B10:Lack of safe environment for pedestrians and cyclists | O | V | V | V | X | |||||||||
| B11:Lack of coverage -smart mobility not extensively covered | O | V | V | X | ||||||||||
| B12:Loss of car as status symbol and personal space (e.g flexibility). | O | A | X | |||||||||||
| B13:Affordability of smart mobility services | O | X | ||||||||||||
| B14:Digital literacy gaps | X |
Source: Authors’ own creation.
Table 4.
Initial Reachability Matrix.
| Barriers | B1 | B2 | B3 | B4 | B5 | B6 | B7 | B8 | B9 | B10 | B11 | B12 | B13 | B14 |
| B1:Fragmented institutional mandates | 1 | 1 | 0 | 0 | 1 | 1 | 1 | 0 | 1 | 0 | 1 | 1 | 1 | 0 |
| B2: Lack of inter-operability and information on multimodal journeys and Integration | 0 | 1 | 0 | 0 | 0 | 1 | 0 | 0 | 0 | 0 | 0 | 0 | 1 | 0 |
| B3: Inadequate digital infrastructure | 0 | 1 | 1 | 0 | 0 | 1 | 0 | 0 | 0 | 0 | 1 | 0 | 1 | 0 |
| B4:Data privacy and security concerns | 0 | 1 | 0 | 1 | 0 | 1 | 1 | 0 | 0 | 0 | 1 | 1 | 1 | 0 |
| B5: Existing regulations and policies are not favorable for Smart Mobility | 0 | 1 | 1 | 1 | 1 | 1 | 0 | 0 | 1 | 1 | 1 | 1 | 1 | 0 |
| B6: Absence of inclusive design | 0 | 0 | 0 | 0 | 0 | 1 | 0 | 0 | 0 | 0 | 1 | 0 | 1 | 0 |
| B7: Political resistance | 0 | 1 | 1 | 0 | 1 | 1 | 1 | 0 | 1 | 0 | 1 | 0 | 1 | 0 |
| B8: Legacy paradigms in CTP | 1 | 1 | 1 | 1 | 1 | 0 | 1 | 1 | 1 | 1 | 1 | 1 | 1 | 0 |
| B9: Lack of appeal of public transport | 0 | 1 | 0 | 0 | 0 | 1 | 0 | 0 | 1 | 0 | 0 | 1 | 1 | 0 |
| B10: Lack of safe environment for pedestrians and cyclists | 0 | 1 | 0 | 0 | 0 | 1 | 0 | 0 | 0 | 1 | 1 | 1 | 1 | 0 |
| B11: Lack of coverage -smart mobility not extensively covered | 0 | 1 | 0 | 0 | 0 | 0 | 0 | 0 | 0 | 0 | 1 | 1 | 1 | 0 |
| B12: Loss of car as status symbol and personal space (e.g flexibility). | 0 | 0 | 0 | 0 | 0 | 0 | 0 | 0 | 0 | 0 | 0 | 1 | 0 | 0 |
| B13: Affordability of smart mobility services | 0 | 0 | 0 | 0 | 0 | 0 | 0 | 0 | 0 | 0 | 0 | 1 | 1 | 0 |
| B14: Digital literacy gaps | 0 | 0 | 0 | 1 | 0 | 0 | 0 | 0 | 0 | 0 | 0 | 0 | 0 | 1 |
Source: Authors’ own creation.
Table 5.
Final Reachability Matrix with Transitivities.
| Barriers | B1 | B2 | B3 | B4 | B5 | B6 | B7 | B8 | B9 | B10 | B11 | B12 | B13 | B14 | Driving Power |
| B1:Fragmented institutional mandates | 1 | 1 | 0 | 1 | 1 | 1 | 1 | 0 | 1 | 1 | 1 | 1 | 1 | 0 | 11 |
| B2:Lack of inter-operability and information on multimodal journeys and Integration | 0 | 1 | 0 | 0 | 0 | 1 | 0 | 0 | 0 | 0 | 1 | 1 | 1 | 0 | 5 |
| B3:Inadequate digital infrastructure | 0 | 1 | 1 | 0 | 0 | 1 | 0 | 0 | 0 | 0 | 1 | 1 | 1 | 0 | 6 |
| B4:Data privacy and security concerns | 0 | 1 | 1 | 1 | 1 | 1 | 1 | 0 | 1 | 1 | 1 | 1 | 1 | 0 | 11 |
| B5:Existing regulations and policies are not favorable for Smart Mobility | 0 | 1 | 1 | 1 | 1 | 1 | 1 | 0 | 1 | 1 | 1 | 1 | 1 | 0 | 11 |
| B6: Absence of inclusive design | 0 | 1 | 0 | 0 | 0 | 1 | 0 | 0 | 0 | 0 | 1 | 1 | 1 | 0 | 5 |
| B7: Political resistance | 0 | 1 | 1 | 1 | 1 | 1 | 1 | 0 | 1 | 1 | 1 | 1 | 1 | 0 | 11 |
| B8: Legacy paradigms in CTP | 1 | 1 | 1 | 1 | 1 | 1 | 1 | 1 | 1 | 1 | 1 | 1 | 1 | 0 | 13 |
| B9:Lack of appeal of public transport | 0 | 1 | 0 | 0 | 0 | 1 | 0 | 0 | 1 | 0 | 0 | 1 | 1 | 0 | 5 |
| B10:Lack of safe environment for pedestrians and cyclists | 0 | 1 | 0 | 0 | 0 | 1 | 0 | 0 | 0 | 1 | 1 | 1 | 1 | 0 | 6 |
| B11:Lack of coverage -smart mobility not extensively covered | 0 | 1 | 0 | 0 | 0 | 1 | 0 | 0 | 0 | 0 | 1 | 1 | 1 | 0 | 5 |
| B12:Loss of car as status symbol and personal space (e.g flexibility). | 0 | 0 | 0 | 0 | 0 | 0 | 0 | 0 | 0 | 0 | 0 | 1 | 0 | 0 | 1 |
| B13:Affordability of smart mobility services | 0 | 0 | 0 | 0 | 0 | 0 | 0 | 0 | 0 | 0 | 0 | 1 | 1 | 0 | 2 |
| B14:Digital literacy gaps | 0 | 1 | 0 | 1 | 0 | 1 | 1 | 0 | 0 | 0 | 1 | 1 | 1 | 1 | 8 |
| Dependency Power | 2 | 12 | 5 | 6 | 5 | 12 | 6 | 1 | 6 | 6 | 11 | 14 | 13 | 1 |
Table 6.
Partition Level Matrix of the Final Reachability Matrix.
| Iteration #1 | ||||
| Barrier | Reachability Set | Antecedent Set | Intersection Set | Level |
| B1 | B1,B2,B4,B5,B6,B7,B9,B10,B11,B12,B13 | B1,B8 | B1 | |
| B2 | B2,B6,B11,B12,B13 | B1,B2,B3,B4,B5,B6,B8,B9,B10,B11,B14 | B2,B6,B11 | |
| B3 | B2,B3,B6,B11,B12,B13 | B3,B4,B5,B7,B8 | B3 | |
| B4 | B2,B3,B4,B5,B6,B7,B9,B10,B11,B12,B13 | B1,B4,B5,B7,B8,B14 | B4,B5,B7 | |
| B5 | B2,B3,B4,B5,B6,B7,B9,B10,B11,B12,B13 | B1,B4,B5,B7,B8 | B4,B5,B7 | |
| B6 | B2,B6,B11,B12,B13 | B1,B2,B3,B4,B5,B6,B7,B8,B9,B10,B11,B14 | B2,B6,B11 | |
| B7 | B2,B3,B4,B5,B6,B7,B9,B10,B11,B12,B13 | B1,B4,B5,B7,B8,B14 | B4,B5,B7 | |
| B8 | B1,B2,B3,B4,B5,B6,B7,B8,B9,B10,B11,B12,B13 | B8 | B8 | |
| B9 | B2,B6,B9,B12,B13 | B1,B4,B5,B7,B8,B9 | B9 | |
| B10 | B2,B6,B10,B11,B12,B13 | B1,B4,B5,B7,B8,B10 | B10 | |
| B11 | B2,B6,B11,B12,B13 | B1,B2,B3,B4,B5,B6,B7,B8,B10,B11,B14 | B2,B6, B11 | |
| B12 | B12 | B1,B2,B3,B4,B5,B6,B7,B8,B9,B10,B11,B12,B13,B14 | B12 | I |
| B13 | B12,B13 | B1,B2,B3,B4,B5,B6,B7,B8,B9,B10,B11,B13,B14 | B13 | |
| B14 | B2,B4,B6,B7,B11,B12,B13,B14 | B14 | B14 | |
| Iteration #2 | ||||
| Barrier | Reachability Set | Antecedent Set | Intersection Set | |
| B1 | B1,B2,B4,B5,B6,B7,B9,B10,B11,B13 | B1,B8 | B1 | |
| B2 | B2,B6,B11,B13 | B1,B2,B3,B4,B5,B6,B8,B9,B10,B11,B14 | B2,B6,B11 | |
| B3 | B2,B3,B6,B11,B13 | B3,B4,B5,B7,B8 | B3 | |
| B4 | B2,B3,B4,B5,B6,B7,B9,B10,B11,B13 | B1,B4,B5,B7,B8,B14 | B4,B5,B7 | |
| B5 | B2,B3,B4,B5,B6,B7,B9,B10,B11,B13 | B1,B4,B5,B7,B8 | B4,B5,B7 | |
| B6 | B2,B6,B11,B13 | B1,B2,B3,B4,B5,B6,B7,B8,B9,B10,B11,B14 | B2,B6,B11 | |
| B7 | B2,B3,B4,B5,B6,B7,B9,B10,B11,B13 | B1,B4,B5,B7,B8,B14 | B4,B5,B7 | |
| B8 | B1,B2,B3,B4,B5,B6,B7,B8,B9,B10,B11,B13 | B8 | B8 | |
| B9 | B2,B6,B9,B13 | B1,B4,B5,B7,B8,B9 | B9 | |
| B10 | B2,B6,B10,B11,B13 | B1,B4,B5,B7,B8,B10 | B10 | |
| B11 | B2,B6,B11,B13 | B1,B2,B3,B4,B5,B6,B7,B8,B10,B11,B14 | B2,B6, B11 | |
| B13 | B13 | B1,B2,B3,B4,B5,B6,B7,B8,B9,B10,B11,B13,B14 | B13 | II |
| B14 | B2,B4,B6,B7,B11,B13,B14 | B14 | B14 | |
| Iteration #3 | ||||
| Barrier | Reachability Set | Antecedent Set | Intersection Set | |
| B1 | B1,B2,B4,B5,B6,B7,B9,B10,B11 | B1,B8 | B1 | |
| B2 | B2,B6,B11 | B1,B2,B3,B4,B5,B6,B8,B9,B10,B11,B14 | B2,B6,B11 | III |
| B3 | B2,B3,B6,B11 | B3,B4,B5,B7,B8 | B3 | |
| B4 | B2,B3,B4,B5,B6,B7,B9,B10,B11 | B1,B4,B5,B7,B8,B14 | B4,B5,B7 | |
| B5 | B2,B3,B4,B5,B6,B7,B9,B10,B11 | B1,B4,B5,B7,B8 | B4,B5,B7 | |
| B6 | B2,B6,B11 | B1,B2,B3,B4,B5,B6,B7,B8,B9,B10,B11,B14 | B2,B6,B11 | III |
| B7 | B2,B3,B4,B5,B6,B7,B9,B10,B11 | B1,B4,B5,B7,B8,B14 | B4,B5,B7 | |
| B8 | B1,B2,B3,B4,B5,B6,B7,B8,B9,B10,B11 | B8 | B8 | |
| B9 | B2,B6,B9 | B1,B4,B5,B7,B8,B9 | B9 | III |
| B10 | B2,B6,B10,B11 | B1,B4,B5,B7,B8,B10 | B10 | |
| B11 | B2,B6,B11 | B1,B2,B3,B4,B5,B6,B7,B8,B10,B11,B14 | B2,B6, B11 | III |
| B14 | B2,B4,B6,B7,B11,B14 | B14 | B14 | |
| Iteration #4 | ||||
| Barrier | Reachability Set | Antecedent Set | Intersection Set | |
| B1 | B1,B4,B5,B7,B10 | B1,B8 | B1 | |
| B3 | B3 | B3,B4,B5,B7,B8 | B3 | IV |
| B4 | B3,B4,B5,B7,B10 | B1,B4,B5,B7,B8,B14 | B4,B5,B7 | |
| B5 | B3,B4,B5,B7,B10 | B1,B4,B5,B7,B8 | B4,B5,B7 | |
| B7 | B3,B4,B5,B7,B10 | B1,B4,B5,B7,B8,B14 | B4,B5,B7 | |
| B8 | B1,B3,B4,B5,B7,B8,B10 | B8 | B8 | |
| B10 | B10 | B1,B4,B5,B7,B8,B10 | B10 | IV |
| B14 | B4,B7,B14 | B14 | B14 | |
| Iteration #5 | ||||
| Barrier | Reachability Set | Antecedent Set | Intersection Set | |
| B1 | B1,B4,B5,B7 | B1,B8 | B1 | |
| B4 | B4,B5,B7 | B1,B4,B5,B7,B8,B14 | B4,B5,B7 | V |
| B5 | B4,B5,B7 | B1,B4,B5,B7,B8 | B4,B5,B7 | V |
| B7 | B4,B5,B7 | B1,B4,B5,B7,B8,B14 | B4,B5,B7 | V |
| B8 | B1,B4,B5,B7,B8 | B8 | B8 | |
| B14 | B4,B7,B14 | B14 | B14 | |
| Iteration #6 | ||||
| Barrier | Reachability Set | Antecedent Set | Intersection Set | |
| B1 | B1 | B1,B8 | B1 | VI |
| B8 | B1,B8 | B8 | B8 | |
| B14 | B14 | B14 | B14 | VI |
| Iteration #7 | ||||
| Barrier | Reachability Set | Antecedent Set | Intersection Set | |
| B8 | B8 | B8 | B8 | VII |
Table 7.
The Interpretive Matrix.
| From Barrier | To Barrier | Interpretation of Influence | Supporting Literature |
| B8: Legacy paradigms in CTP | B1: Fragmented institutional mandates | Outdated planning practices in conventional transport (e.g., car-centric, siloed approaches) continue to shape institutional mandates, leading to fragmented roles among agencies. This weakens coordination and undermines integrated mobility planning. | [16,20] |
| B8 | B14: Digital literacy gaps | Legacy systems often marginalize digital innovation and public ICT education, contributing to inadequate digital literacy among users and decision-makers. | [19] |
| B1: Fragmented institutional mandates | B4: Data privacy and security concerns | Fragmented institutional structures lack unified standards or oversight mechanisms for managing mobility data securely, increasing user concerns over privacy and data misuse. | [121] |
| B1 | B5: Unfavorable regulations and policies | Disjointed mandates lead to inconsistent or outdated policy frameworks that do not support smart mobility innovations such as e-hailing, shared micromobility, or MaaS platforms. | [122,123] |
| B1 | B7: Political resistance | Institutional fragmentation dilutes accountability and policy leadership, making it easier for entrenched political interests to resist disruptive mobility reforms. | [124] |
| B14: Digital literacy gaps | B4: Data privacy and security concerns | Users with limited digital literacy are more likely to be wary of data privacy issues, leading to reluctance in using app-based smart mobility services. | [125] |
| B14 | B5: Unfavorable regulations and policies | Poor digital understanding among decision-makers hampers the development of responsive policies that address smart mobility governance and regulation. | [126] |
| B14 | B7: Political resistance | Political leaders with low digital fluency may perceive smart mobility initiatives as risky or unmanageable, leading to resistance or policy inertia. | [16] |
| B4, B5, B7 | B3: Inadequate digital infrastructure | Data privacy concerns (B4), outdated policies (B5), and political reluctance (B7) delay investment in and deployment of essential digital infrastructure for smart mobility (e.g., sensors, real-time data platforms). | [20] |
| B4, B5, B7 | B10: Lack of safe environments for cyclists and pedestrians | Data privacy concerns (B4), outdated policies (B5), and political reluctance (B7) prevent urban redesign that accommodates active mobility and smart infrastructure like connected crossings or bike-tracking apps. | [84] |
| B3, B10 | B2: Lack of interoperability and integration | Poor digital infrastructure (B3) limits the ability to interconnect transport modes, while unsafe streets (B10) reduce the feasibility of integrating active travel into mobility-as-a-service (MaaS) platforms. | [70] |
| B3, B10 | B6: Absence of inclusive design | Limited infrastructure investment and inadequate safety planning lead to systems that do not account for the needs of vulnerable users (e.g., elderly, disabled and marginalised), undermining inclusivity. | [127] |
| B3, B10 | B11: Limited coverage | Poor infrastructure and unsafe environments constrain the geographic and demographic reach of smart mobility services, particularly in peripheral or underserved areas. | [128] |
| B3, B10 | B9: Lack of appeal of public transport | Poor infrastructure and safety concerns discourage the use of public transport and make it less attractive in comparison to private vehicles. | [126] |
| B2, B6, B9, B11 | B13: Affordability of smart mobility services | Fragmentation, exclusivity, poor coverage, and unappealing alternatives reduce economies of scale, increase operational costs, and pass affordability burdens to users. | [129] |
| B13 | B12: Loss of car as a status symbol and personal space | When smart mobility becomes affordable, accessible, and comprehensive, it begins to offer a viable alternative to private car ownership, challenging cultural norms and attachment to personal vehicles. | [74,130] |
Disclaimer/Publisher’s Note: The statements, opinions and data contained in all publications are solely those of the individual author(s) and contributor(s) and not of MDPI and/or the editor(s). MDPI and/or the editor(s) disclaim responsibility for any injury to people or property resulting from any ideas, methods, instructions or products referred to in the content. |
© 2025 by the authors. Licensee MDPI, Basel, Switzerland. This article is an open access article distributed under the terms and conditions of the Creative Commons Attribution (CC BY) license (http://creativecommons.org/licenses/by/4.0/).
Copyright: This open access article is published under a Creative Commons CC BY 4.0 license, which permit the free download, distribution, and reuse, provided that the author and preprint are cited in any reuse.


