
Submitted:
15 September 2025
Posted:
17 September 2025
You are already at the latest version
Abstract
Acetaminophen (APAP) is a widely used pharmaceutical increasingly detected as a contaminant in aquatic environments due to its persistent nature and incomplete removal by conventional wastewater treatment. This study investigates the adsorption performance and mechanisms of commercial activated carbon (M) and its hydrothermally modified form (MH) for APAP removal. Characterization via elemental analysis, X-ray photoelectron spectroscopy (XPS), and N2 adsorption isotherms revealed that hydrothermal treatment reduced oxygen content and enhanced micro- and mesopore volumes, resulting in a more homogeneous and carbon-rich surface. Batch adsorption experiments conducted under varying pH (5–7) and temperature (30–40 °C) conditions showed that MH achieved up to 94.3% APAP removal, outperforming the untreated carbon by more than 15%. Kinetic modeling indicated that adsorption followed a pseudo-second-order mechanism (R² > 0.99), and isotherm data fitted best to the Langmuir model for MH and the Freundlich model for M, reflecting their differing surface properties. Adsorption was enhanced at lower pH and higher temperatures, consistent with an endothermic and pH-dependent mechanism. Complementary density functional theory (DFT) simulations confirmed that π–π stacking is the dominant interaction between APAP and the carbon surface. The most favorable configuration involved coplanar stacking with non-oxidized graphene (ΔG = −33 kJ/mol), while oxidized graphene models exhibited weaker interactions. Natural Bond Orbital (NBO) analysis further supported the prevalence of π–π interactions over dipole interactions. These findings suggest that surface deoxygenation and improved pore architecture achieved via hydrothermal treatment significantly enhance APAP adsorption, offering a scalable strategy for pharmaceutical pollutant removal in water treatment applications.
Keywords:
activated carbon
; hydrothermal treatment
; acetaminophen/paracetamol adsorption
; pharmaceutical contaminants
; DFT modeling
; π–π interactions
1. Introduction
Acetaminophen (APAP), also known as paracetamol or N-(4-hydroxyphenyl)acetamide, is a widely used over-the-counter and prescription non-steroidal analgesic and antipyretic. Its primary pharmacological action involves the inhibition of prostaglandin synthesis through cyclooxygenase (COX-1 and COX-2) pathways, thereby alleviating pain and reducing fever. Global consumption of APAP is substantial, estimated at nearly 1.5 tons annually [1,2,3]. China and India currently lead global production, accounting for over 70% of the total supply [4,5].
Despite its therapeutic benefits, APAP has been increasingly recognized as a persistent and ubiquitous contaminant in aquatic environments, posing a pressing environmental and health concern. Its widespread usage, combined with incomplete removal in conventional wastewater treatment plants (WWTPs), contributes to its frequent detection in wastewater effluents, surface waters, groundwater, and even seawater. Reported concentrations range from nanograms to milligrams per liter. [1,6,7]. With a solubility of 305 mg/L at 25 °C and a Log Kow of 0.46, APAP is relatively hydrophilic and poorly adsorbed onto organic matter, contributing to its mobility in aquatic systems. Following administration, approximately 90% of APAP is excreted via urine in both unchanged and conjugated forms [8]. Additional pathways of environmental contamination include discharge from pharmaceutical manufacturing and improper disposal of expired or unused medications [1]. The direct release of untreated or partially treated wastewater, a significant source of APAP, can have severe ecotoxic effects on aquatic species and carcinogenic and mutagenic effects on humans [9].
The environmental occurrence of APAP has consequences. It has been documented in surface water, groundwater, and drinking water sources across 29 countries, with reported concentrations averaging 0.161 μg/L and reaching a maximum of up to 230 μg/L. These concentrations, even at the lower end of the range, are significant and indicate the widespread presence of APAP in our water sources, posing potential risks to both the environment and human health [10].
Human health risks associated with APAP include severe hepatotoxicity, oxidative stress, DNA damage, and liver failure in overdose scenarios. Environmentally, it is classified as a high-risk pollutant, particularly to aquatic organisms [11,12,13]. Aquatic invertebrates such as Daphnia magna, as well as fish species like Danio rerio and trout, exhibit sensitivity to APAP even at trace levels, manifesting in oxidative stress, enzyme inhibition, and developmental impairments [14,15]. Notably, paracetamol was identified as the NSAID (nonsteroidal anti-inflammatory drugs) that disrupted the most significant number of oxidative stress biomarkers, underscoring its ecotoxicological relevance [16]. Plants also experience phytotoxic effects, including reduced concentrations of photosynthetic pigments and inhibited root growth [13].
While the challenges are significant, the potential of advanced treatment solutions beyond conventional methods is promising. A recent survey of 20 WWTPs in China revealed APAP in 19 of the samples, with concentrations ranging from 0.06 to 29.2 nM. However, despite high removal rates reported for APAP during secondary treatment [3,17,18], more toxic metabolites such as p-aminophenol have been detected post-treatment at elevated concentrations (23.93–108.68 nM), indicating the existence of metabolic bottlenecks in existing treatment processes [19]. This highlights the need for advanced treatment solutions beyond conventional methods, along with continuous monitoring strategies to mitigate potential environmental and health risks [8,20,21].
Several advanced remediation technologies have been explored for the removal of APAP. Among these, Advanced Oxidation Processes (AOPs) have garnered considerable interest due to their ability to generate highly reactive radicals, particularly hydroxyl (•OH), capable of mineralizing organic pollutants into benign by-products [3,22]. In AOPs, hydroxyl radicals play a key role in breaking down organic pollutants, including APAP, into simpler, less harmful compounds, thereby reducing their environmental impact. However, AOPs face limitations, including incomplete mineralization and the formation of toxic intermediates—especially during photocatalytic oxidation. Additionally, UV-based systems are energy-intensive, and their efficiency can be diminished by background organic matter or radical-scavenging ions present in complex water matrices. Membrane technologies, including microfiltration, ultrafiltration, nanofiltration, and reverse osmosis, provide an advanced treatment pathway. While these systems offer high separation efficiencies, they are often hindered by membrane fouling, increased energy consumption, and high operational costs, particularly in pressure-driven applications such as reverse osmosis [23,24]. Additionally, high energy consumption is a notable drawback, particularly in pressure-driven systems, such as reverse osmosis, which require substantial energy inputs to maintain optimal performance.
Electrochemical methods, particularly Electrochemical Advanced Oxidation Processes (EAOPs), provide a flexible alternative for degrading pharmaceutical pollutants through redox reactions [25]. Recent innovations in nanostructured electrodes and catalytic coatings have significantly improved performance [26]. Integration with biological and membrane-based technologies has also demonstrated synergistic potential in complex treatment scenarios.
Biological remediation approaches, including phytoremediation and microbial biodegradation, have shown promise due to their sustainability and cost-effectiveness. Phytoremediation relies on specific plant species—often hardy or invasive—to absorb and transform pharmaceuticals through enzymatic pathways [27,28]. Similarly, microbial biodegradation utilizes bacteria, fungi, and microalgae capable of enzymatically degrading APAP via pathways involving amidases, oxygenases, and deaminases [13]. The low operational cost and environmental compatibility of biological methods make them an attractive option for sustainable water treatment. However, these methods are sensitive to environmental factors such as temperature, pH, and the presence of co-contaminants, which can impair microbial activity and overall efficiency.
Among the various remediation technologies, adsorption has emerged as one of the most promising strategies for removing emerging contaminants, including pharmaceutical contaminants from water systems [29,30,31,32,33]. Adsorbents, such as activated carbon and biochar, capitalize on their high surface area, porosity, and tunable surface chemistries to effectively capture organic contaminants [34]. Activated carbon, available in both granular (GAC) and powdered (PAC) forms, is particularly valued for its cost-effectiveness, chemical stability, and high adsorption capacity. Surface modifications, including oxidation and amination, further enhance its performance by introducing reactive functional groups that improve affinity toward ionizable or polar compounds such as APAP [20,35,36,37]. Advanced materials such as metal-organic frameworks (MOFs), carbon nanotubes (CNTs), and graphene derivatives exhibit even higher adsorption capacities. However, their high production costs and limited scalability remain significant barriers to widespread application [38,39]. In contrast, activated carbon offers a practical and scalable solution, especially for large-scale water treatment applications. Despite its advantages, adsorption-based remediation is not without challenges. Regeneration of spent adsorbents via thermal or chemical means is often energy-intensive and can degrade material integrity over time [40]. Moreover, safe disposal or recycling of exhausted adsorbents is critical to prevent secondary contamination. Nonetheless, continued advancements in adsorbent materials and system design underscore the viability of adsorption, particularly using activated carbon, as a cornerstone strategy for APAP remediation.
Enhancing the yield and performance of activated carbons can be effectively achieved through modifications to their surface chemistry and porous structure. In this context, we have explored hydrothermal modification as a viable strategy to improve the physicochemical properties of activated carbon. This approach has yielded promising results in previous studies, where the modified materials demonstrated high adsorption capacities for contaminants such as thorium [41], uranium [42], and acetamiprid [43]. Additionally, these materials have shown catalytic activity in reactions relevant to the synthesis of fine chemicals [44], further highlighting their versatility and potential for multifunctional applications.
In this context, the present study explores the use of activated carbon for the adsorption and removal of acetaminophen from contaminated water. Particular emphasis is placed on elucidating the adsorption mechanisms, evaluating key performance parameters, and assessing the practical feasibility of applying this approach in real-world water treatment systems.
RESULTS AND DISCUSSION
Characterization of Carbonaceous Materials
The proximate analysis (heating program detailed in the Supplementary Material) yielded comparable results for both materials, with a slight reduction in fixed carbon content and a corresponding increase in volatile matter in the hydrothermally treated sample (MH), as shown in Table 1. Both samples exhibit high fixed carbon content, indicative of a significant degree of carbonization, characteristic of activated carbons.
The elemental composition of the organic phase (excluding ash content) is summarized in Table 2. Hydrothermal treatment results in an increase in carbon, nitrogen, and sulfur content, and a reduction in hydrogen and oxygen. The former three elements are typically embedded within the graphene basal plane and thus exhibit lower reactivity. Conversely, hydrogen and oxygen, commonly located at the edges or defects of the carbon matrix, are more susceptible to removal under hydrothermal conditions.
X-ray photoelectron spectroscopy (XPS) further confirms these trends. Atomic and mass-based compositions are reported in Table 3 and Table 4, respectively. Both samples display surfaces enriched in carbon, with MH showing a more uniform composition and detectable nitrogen content, not detected in M.
Deconvolution of the C 1s peak (Figure 1, Table 5) reveals that hydrothermal treatment significantly reduces the proportion of moderately oxidized carbon species (285.7 to 286.5 eV) and strongly oxidized carbon species (288.6 to 289.6 eV), associated with hydroxyl/ether/carbonyl and carboxylic/ester groups, respectively. In contrast, the signal at 284.8 eV, corresponding to sp² carbon or C–H/C–C bonding, increases in MH.
The deconvolution of the O 1s peak, while limited due to overlap and complexity of functional groups, reveals the emergence of a secondary component at 536.8 eV in MH in addition to the only one showed by M (533 eV), suggesting structural rearrangements during treatment (Figure S4). Other elemental peaks did not present sufficient resolution for further analysis.
The point of zero charge (PZC) increased from 7.51 (M) to 8.06 (MH), indicating a reduction in surface acidity. This is consistent with the XPS results showing a decrease in oxygenated groups following hydrothermal treatment.
The FTIR spectra of both samples is shown in Figure 2. There are some small differences between them.
Some of the main bands observed are: 3450 cm-1 (O-H), 1700 cm-1 (C=O), 1550 cm-1 (C=C), 1140 cm-1 (C-O). It is observed that the 1700 cm-1 band only appears (weakly) in the MH sample. The band near 1140 cm-1 has a maximum in M and a double peak in MH. This indicates that changes have occurred in the functional groups possessing C-O single bonds as discussed in the XPS analysis. In addition, in the region between 1500 and 1300 cm-1 carbon backbone of these materials there is a decrease in the intensity at MH while the relative intensity of the 1550 cm-1 band increases. This implies that there are also changes in this part of the structure.
Nitrogen adsorption–desorption isotherms (Figure 3) demonstrate that both samples exhibit type IV isotherms with H4 hysteresis loops [45], typical of micro-mesoporous carbonaceous materials. MH displays a higher total N2 uptake.
Although MH shows a slight decrease in surface area, it exhibits higher micropore and mesopore volumes, which contribute to its improved adsorption performance. The pore size distribution (Table 6, Figure 4) further indicates a broader and slightly larger distribution in MH. In contrast, SEM micrographs (Figures S1 and S2, Supplementary Information) do not reveal any substantial morphological alterations.
Adsorption Experiments
The adsorption kinetics of acetaminophen (APAP) were evaluated using both adsorbent materials, M and MH, under varying pH (5, 6, and 7) and temperature conditions (30 °C and 40 °C). These parameters were selected to simulate hospital wastewater discharge scenarios, where APAP concentrations might be elevated. At these pH levels, APAP (pKa = 9.5) [46], predominantly exists in its neutral molecular form.
As shown in Figure 5(a) and 5(b), adsorption equilibrium was reached within 180 minutes for both adsorbents. MH consistently exhibited a significantly higher adsorption capacity than M across all conditions, with differences exceeding 15 percentage points. This enhanced performance is attributed to improved pore accessibility and surface chemistry introduced by hydrothermal treatment, which likely increases the availability of active sites. These conditions facilitate stronger adsorbate–adsorbent interactions, such as, π–π stacking, particularly relevant at pH values where APAP remains neutral. The sharper initial removal rates for MH suggest reduced diffusion resistance and improved mass transport properties.
To elucidate the adsorption mechanism, the kinetic data were fitted to pseudo-first order and pseudo-second-order models:
- Pseudo-first-order model:
(1)
- Pseudo-second-order model:
(2)Where qt is the amount of adsorbate adsorbed at time t (mg/g); qe is the amount of adsorbate adsorbed in equilibrium; ki is the kinetic constant of the model (pseudo-first order: min -1 pseudo-second order: g/mg min); t is the time (min).
The pseudo-second-order model provided a significantly better fit across all experimental conditions (R² > 0.99). For example, under the MH_40_pH5 condition, an R² of 0.9995 was obtained, with a rate constant k = 0.2413 min⁻¹ and a calculated equilibrium removal of 94.3%. The kinetic parameters obtained are shown in Table 7.
Equilibrium adsorption isotherms were obtained at pH 5, 6, and 7, and at 30 °C and 40 °C, for both materials (Figure 6, Figure 7 and Figure 8). MH consistently outperformed M, with adsorption efficiency increasing by up to 19.9%. Higher temperature favored adsorption, consistent with an endothermic process.
The equilibrium data were modeled using the Langmuir and Freundlich isotherms (Table 8):
- Langmuir equation:
(3) Where K L is the Langmuir constant and S m is the adsorption capacity of a monolayer on the adsorbent.
- Freundlich equation:
(4) Where K F is the Freundlich constant that increases with the capacity of the adsorbent.
Carbon M fits the Freundlich model more closely, suggesting a heterogeneous surface with multiple active site types. In contrast, MH adheres better to the Langmuir model, indicating a more uniform surface chemistry and monolayer adsorption behavior. Despite similar monolayer capacities, experimental adsorption was consistently higher for MH. The Freundlich parameter n, which reflects adsorption favorability, was lower for MH, yet experimental results contradicted this, further supporting that different materials may align with different mechanistic models. As they respond to different mechanisms, the comparison of these parameters may not be correct.
To assess performance at higher concentrations, the effect of initial APAP concentration was evaluated. Table 9 summarizes these results. At low concentrations (100 mg/L), MH removed >93% of APAP across all conditions. Even at 500 mg/L, MH maintained a removal efficiency >57%, significantly outperforming M.
In conclusion, MH exhibits superior adsorption performance primarily due to changes in textural and chemical properties induced by hydrothermal treatment. The influence of temperature and pH, while present, is comparatively secondary. Adsorption is slightly more favorable at lower pH due to speciation effects and is enhanced at higher temperatures, suggesting an endothermic mechanism.
Computational Study
To gain further insight into the adsorptive interactions between APAP and the carbonaceous materials, a computational study was conducted using graphene and oxidized graphene models (see Supplementary Information, Figure S3). Geometry optimization was performed as outlined in the Experimental section. The oxidized graphene model included representative hydroxyl, carbonyl, and carboxylic functional groups.
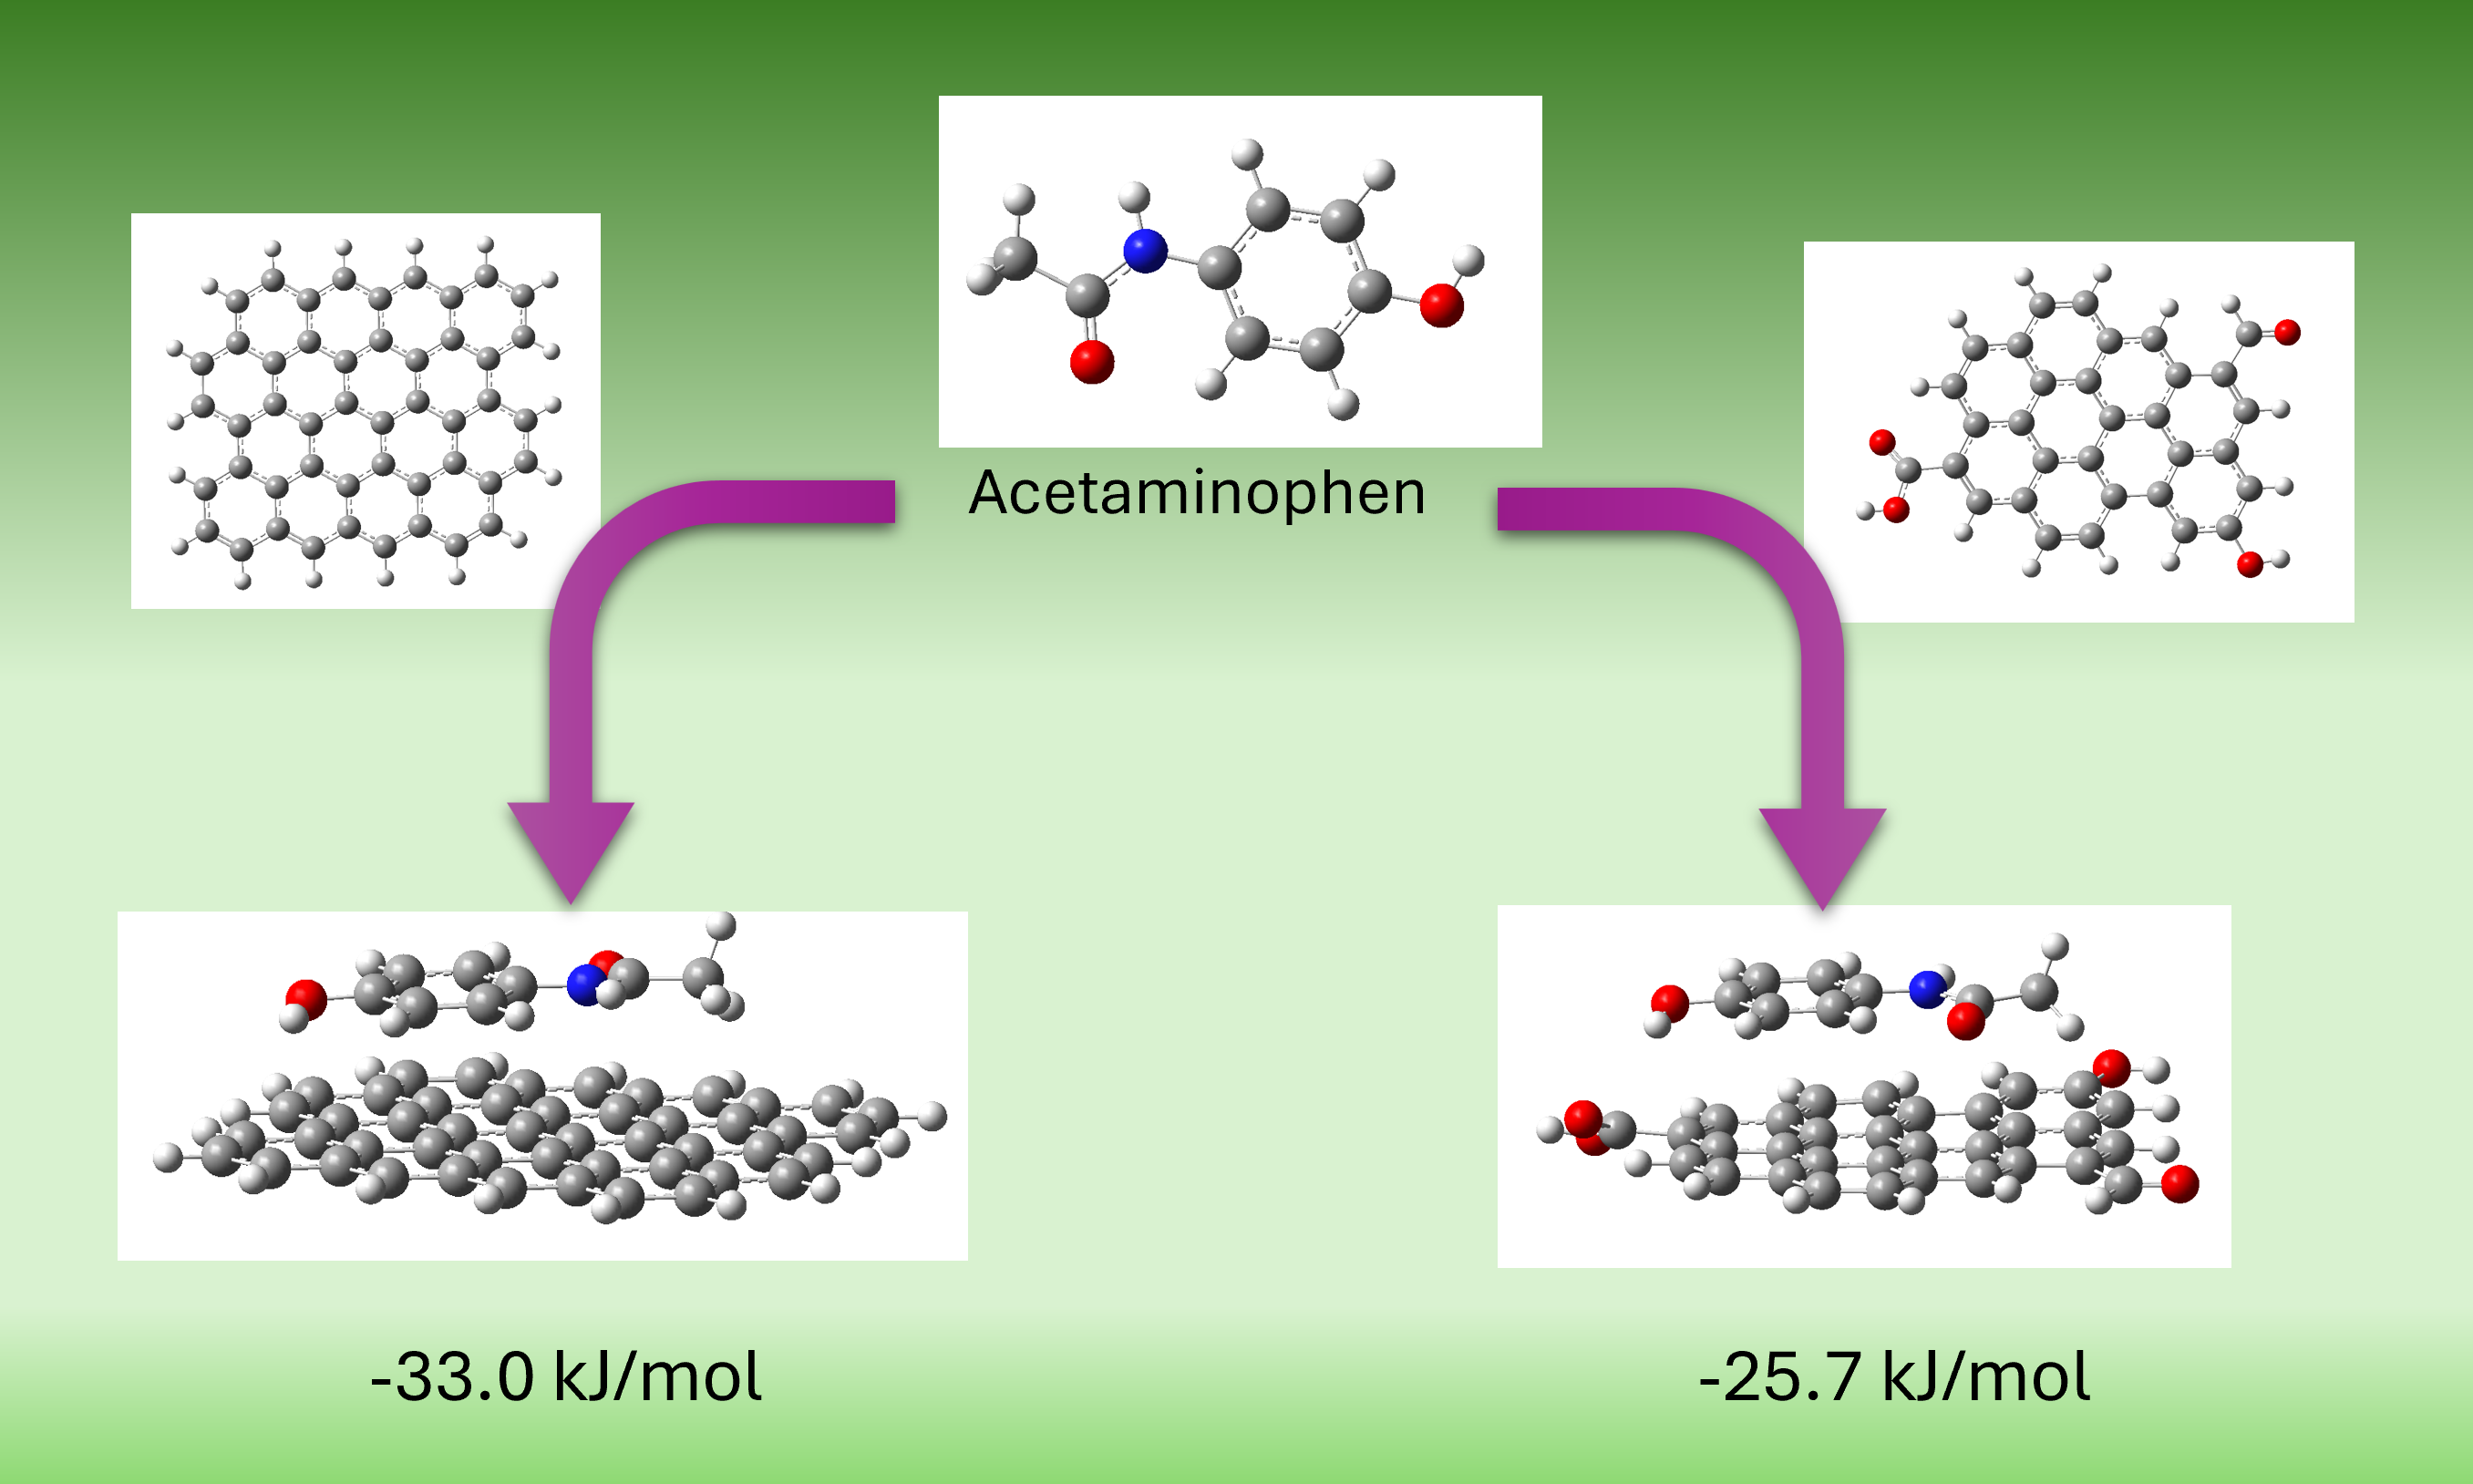
The most stable configuration (model M3a) corresponded to a coplanar π–π stacking interaction between APAP and non-oxidized graphene, with a calculated free energy of adsorption of −33.0 kJ/mol (Figure 9(a)). In comparison, the analogous interaction with oxidized graphene (model M3b) yielded a less favorable ΔG of −25.7 kJ/mol (Figure 9(b)). This result is consistent with experimental findings, in which MH (lower oxygen content) exhibited higher adsorption capacity than M. However, it is noteworthy that this trend is not universal; for instance, prior simulations with phenol demonstrated enhanced adsorption on oxidized graphene [47].
Natural Bond Orbital (NBO) analysis revealed four significant interactions (>0.5 kcal/mol) in M3a versus two in M3b. These were primarily π–π stacking interactions, although one donor–acceptor interaction between APAP hydroxyl groups and graphene aromatic carbons is present as well. The stability of M3a suggests that π–π stacking dominates the adsorption mechanism.
To isolate the role of dipolar interactions, additional models (M4-1 to M4-6) were constructed in which APAP functional groups (hydroxyl or acetamide) were positioned near oxygenated groups on graphene (hydroxyl, carbonyl, or carboxyl), intentionally avoiding initial π–π stacking. During optimization, some systems (M4-2, M4-5) evolved into π–π stacked conformations, indicating a thermodynamic preference for these interactions. This can be better appreciated in Figure 10. The APAP molecule is initially facing a graphene’s carbonyl group (model M4-5), yet as geometry optimization develops, it keeps moving to find the most stable position located in a parallel plane above the graphene model. Others (M4-1, M4-3) retained dipolar contact but exhibited positive or near-zero ΔG values, suggesting less favorable adsorption. Finally, in the other two cases (M4-4 y M4-6), an intermediate situation was reached. Figure 11 shows the optimized geometries for all these models.
These results suggest that although dipole interactions may contribute to adsorption under certain conditions, the dominant interaction mechanism for APAP on carbonaceous materials is π–π stacking. The relatively small energy differences among various binding sites further support the experimental observation that surface structure and chemical homogeneity critically influence adsorption behavior.
MATERIALS AND METHODS
Materials
Acetaminophen was purchased from Sigma-Aldrich (Merck Group, Darmstadt, Germany). Commercial activated carbon granular 1.5 mm extrapure (Ref. 1.02514) was acquired also from Merck. Distilled water was used as a solvent in all determinations.
Synthesis of the Hydrothermal Carbon
MH Preparation
The commercial carbon material M (4 g) was treated with distilled water (50 mL) in a Teflon® vessel reinforced with a duraluminium outer jacket at a temperature of 180 ºC during 20 h. The content was filtered in a funnel with a filter plate and washed with 200 mL of distilled water. Then, it was dried in an oven at 110 °C for 24 h.
Characterization of the Activated Carbons
Textural characterization was performed by N2 adsorption isotherms at 77 K in an Anton Paar GmbH (Graz, Austria) Quantachrome Quadrasorb Evo equipment with prior degassing at 200 °C for 24 h , and the specific surface area was calculated by applying the BET method [48]. Elemental analysis (C, H, N, S, O) was performed using a Leco (St. Joseph, MI, USA) CHMS-932 elemental analyzer. C, H, N, and S were analyzed, and the difference was assigned to ash and oxygen content. Ash quantification was carried out in a Netzsch (Selb, Germany) STA 449 F3 Jupiter thermobalance (see heating program in Table S1). The point of zero charge (PZC) values were determined using the method proposed by Valente Nabais and Carrott [49]. A Hitachi (Tokyo, Japan) field emission scanning electron microscope (SEM) S-4800 and a FEI (Hillsboro, OR, USA) field emission scanning electron microscope (SEM) Quanta 3D FEG, were used to explore the surface morphological characteristics of all samples. The sample analysis was performed under high-vacuum conditions. X-Ray photoelectron spectra (XPS) were recorded on a SPECS (Zürich, Switzerland) FlexPS-ARPES-E SPECS instrument using monochromatic Al Kα radiation at 1486.68 eV. Fourier-transform infrared spectra were recorded in a Bruker (Billerica, MA, USA) Vertex70 spectrometer in the 400–4000 cm−1 range, with a DLaTGS detector and a 0.4 cm−1 spectral resolution. A KBr tablet was prepared with 1/250 dilution.
Adsorption Experiments
Adsorption Kinetics
In Erlenmeyer flasks, 200 mL of a 100 mg/L acetaminophen (APAP) solution at pH 5, 6, and 7 were placed, the pH was adjusted by adding dropwise 0.01M HCl and NaOH buffer solutions, then 200 mg of Merck (M) or Merck hydrothermal (MH) carbon were added. The experiments were placed in a constant shaking bath at 30 °C and 40 °C, where 3 mL of sample were taken at 5, 10, 20, 30, 60, 120, 180, 240, 300, 360, 420, 480, and 1440 min.
Adsorption Isotherm
40-mL solutions containing 200, 300, 400, 500, and 600 mg/L of APAP at pH 5, 6, and 7 were placed in Erlenmeyer flasks, followed by the addition of 40 mg of adsorbent. The tests were stirred for 24 h at 30 °C and 40 °C. The studies were performed in triplicate. After this time, an aliquot of the APAP solution was taken after 24 h, and the residual concentration was quantified.
The adsorption capacity of the materials was determined using equation 5.
(5) Where qe is the adsorption capacity at 24 h (mg/g), Ci is the initial concentration of APAP (mg/L), Cf is the concentration of APAP at 24 h (mg/L), V is the volume of APAP placed in the tests (L) and m is the mass of adsorbent placed during the experiments (g).
Analytical Determinations
Samples were analyzed using a UV-Vis spectrophotometer Shimadzu (Kyoto, Japan) at a wavelength of 249 nm.
Computational Details
The computational study was performed using the Gaussian16 (Revision A.03) package [50] with the PW6B95D3/Def2SVP DFT level of theory. The calculations were carried out in water (SMD model) [51].
The thermodynamic parameters for the two-molecule models were calculated by subtracting the calculated data of the individual molecules from the joint model result.
To study which are the most important interactions between APAP and graphene we have used NBO Analysis. This method transforms the wave functions used in the DFT calculation into localized forms (bonds and orbitals). It is often used to determine the Lewis structure of a compound but, in our case, we have used the second order perturbation theory to calculate the donor-acceptor interactions and estimate the energetic importance of each one.
CONCLUSIONS
Hydrothermal modification of commercial activated carbon significantly enhanced its physicochemical properties by increasing carbon and nitrogen content, reducing surface oxygen functionalities, and improving micro- and mesoporosity. The modified material (MH) exhibited superior adsorption performance for acetaminophen (APAP), achieving up to 94.3% removal under optimal conditions. Adsorption kinetics were best described by the pseudo-second-order model, while equilibrium data indicated that MH follows the Langmuir isotherm and M aligns more closely with the Freundlich model, reflecting differences in surface homogeneity. The adsorption process was only slightly favored at lower pH and higher temperatures. Density functional theory (DFT) calculations supported these findings, revealing that π–π stacking interactions dominate the adsorption mechanism and are strongest on non-oxidized carbon surfaces. Together, the experimental and computational results demonstrate that hydrothermal treatment is a promising and scalable strategy for enhancing the performance of activated carbon in the removal of pharmaceutical contaminants from water.
Supplementary Materials
The following supporting information can be downloaded at the website of this paper posted on Preprints.org, Figure S1. SEM images of M; Figure S2. SEM images of MH; Figure S3. Models of APAP (M1), graphene (M2a) and oxidized graphene (M2b); Figure S4. O 1s XPS spectra for (a) M and (b) MH; Table S1. Heating program.
Author Contributions
Conceptualization, C.J.D.V. and M.A.P.; methodology, C.J.D.V. and M.A.P.; formal analysis, A.G.C.C. and I.M.L.C.; investigation, A.G.C.C. and M.A.P.; resources, C.J.D.V. and I.M.L.C.; writing—original draft preparation, I.M.L.C., A.G.C.C. and M.A.P.; writing—review and editing, C.J.D.V. and I.M.L.C.; visualization, C.J.D.V., M.A.P., A.G.C.C. and I.M.L.C.; supervision, C.J.D.V.; project administration, C.J.D.V.; funding acquisition, C.J.D.V. and I.M.L.C. All authors have read and agreed to the published version of the manuscript.
Funding
This research was funded by European Union (European Regional Development Fund (85%)) and the Junta de Extremadura grant number GR24050 and the Ministerio de Ciencia e Innovación of Spain, grant number PID2021-124021OB-I00.
Institutional Review Board Statement
Not applicable
Data Availability Statement
The data will be provided upon request to the authors..
Acknowledgments
The authors would like to thank the members of the Servicio de Apoyo a la Investigación at the Universidad de Extremadurafor their work.
Conflicts of Interest
The authors declare no conflicts of interest.
References
- Phong Vo, H.N.; Le, G.K.; Hong Nguyen, T.M.; Bui, X.T.; Nguyen, K.H.; Rene, E.R.; Vo, T.D.H.; Thanh Cao, N.D.; Mohan, R. Acetaminophen Micropollutant: Historical and Current Occurrences, Toxicity, Removal Strategies and Transformation Pathways in Different Environments. Chemosphere 2019, 236, 124391. [Google Scholar] [CrossRef]
- Tena-Garitaonaindia, M.; Rubio, J.M.; Martínez-Plata, E.; Martínez-Augustin, O.; Sánchez de Medina, F. Pharmacological Bases of Combining Nonsteroidal Antiinflammatory Drugs and Paracetamol. Biomedicine & Pharmacotherapy 2025, 187, 118069. [Google Scholar] [CrossRef] [PubMed]
- Bakhtshokouhi, S.; Assadi, A. Examining Sulfate Radical-Based Enhanced Oxidation Techniques to Degradation Pharmaceutically Active Substances in Aqueous Media: With Acetaminophen Serving as a Case Study. Journal of Hazardous Materials Advances 2025, 17, 100599. [Google Scholar] [CrossRef]
- Chopra, S.; Kumar, D. Characterization and Biodegradation of Paracetamol by Biomass of Bacillus Licheniformis Strain PPY-2 Isolated from Wastewater. Rend Lincei Sci Fis Nat 2023, 34, 491–501. [Google Scholar] [CrossRef]
- Debortoli, C.; Lan, R.; Lafont, J.; Campana, F.; Catherine, J.-H. Paracetamol Misusing to Dental Pain: A Case-Report and Recommandations for Treatment. Journal of Oral Medicine and Oral Surgery 2021, 27, 57. [Google Scholar] [CrossRef]
- dos Santos, C.R.; Lebron, Y.A.R.; Moreira, V.R.; Koch, K.; Amaral, M.C.S. Biodegradability, Environmental Risk Assessment and Ecological Footprint in Wastewater Technologies for Pharmaceutically Active Compounds Removal. Bioresour Technol 2022, 343, 126150. [Google Scholar] [CrossRef]
- Monk, J.R.; Hooda, P.S.; Busquets, R.; Sims, D. Occurrence of Pharmaceuticals, Illicit Drugs and PFAS in Global Surface Waters: A Meta-Analysis-Based Review. Environmental Pollution 2025, 378, 126412. [Google Scholar] [CrossRef]
- Wu, J.; Liu, Z.; Ma, Q.; Dai, L.; Dang, Z. Occurrence, Removal and Risk Evaluation of Ibuprofen and Acetaminophen in Municipal Wastewater Treatment Plants: A Critical Review. Science of The Total Environment 2023, 891, 164600. [Google Scholar] [CrossRef]
- Vieira, Y.; Spode, J.E.; Dotto, G.L.; Georgin, J.; Franco, D.S.P.; dos Reis, G.S.; Lima, E.C. Paracetamol Environmental Remediation and Ecotoxicology: A Review. Environ Chem Lett 2024, 22, 2343–2373. [Google Scholar] [CrossRef]
- aus der Beek, T.; Weber, F.; Bergmann, A.; Hickmann, S.; Ebert, I.; Hein, A.; Küster, A. Pharmaceuticals in the Environment—Global Occurrences and Perspectives. Environ Toxicol Chem 2016, 35, 823–835. [Google Scholar] [CrossRef] [PubMed]
- Kim, Y.; Choi, K.; Jung, J.; Park, S.; Kim, P.-G.; Park, J. Aquatic Toxicity of Acetaminophen, Carbamazepine, Cimetidine, Diltiazem and Six Major Sulfonamides, and Their Potential Ecological Risks in Korea. Environ Int 2007, 33, 370–375. [Google Scholar] [CrossRef]
- Damasceno de Oliveira, L.L.; Nunes, B.; Antunes, S.C.; Campitelli-Ramos, R.; Rocha, O. Acute and Chronic Effects of Three Pharmaceutical Drugs on the Tropical Freshwater Cladoceran Ceriodaphnia Silvestrii. Water Air Soil Pollut 2018, 229, 116. [Google Scholar] [CrossRef]
- Pandey, B.; Pandey, A.K.; Bhardwaj, L.; Dubey, S.K. Biodegradation of Acetaminophen: Current Knowledge and Future Directions with Mechanistic Insights from Omics. Chemosphere 2025, 372, 144096. [Google Scholar] [CrossRef]
- Nogueira, A.F.; Pinto, G.; Correia, B.; Nunes, B. Embryonic Development, Locomotor Behavior, Biochemical, and Epigenetic Effects of the Pharmaceutical Drugs Paracetamol and Ciprofloxacin in Larvae and Embryos of Danio Rerio When Exposed to Environmental Realistic Levels of Both Drugs. Environ Toxicol 2019, 34, 1177–1190. [Google Scholar] [CrossRef] [PubMed]
- S, D.L.; B, V.G.; Murali, V. From Prescription to Pollution: The Ecological Consequences of NSAIDs in Aquatic Ecosystems. Toxicol Rep 2024, 13, 101775. [Google Scholar] [CrossRef] [PubMed]
- Justi, L.H.Z.; Silva, J.F.; Santana, M.S.; Laureano, H.A.; Pereira, M.E.; Oliveira, C.S.; Guiloski, I.C. Non-Steroidal Anti-Inflammatory Drugs and Oxidative Stress Biomarkers in Fish: A Meta-Analytic Review. Toxicol Rep 2025, 14. [Google Scholar] [CrossRef]
- Oluwole, A.O.; Omotola, E.O.; Olatunji, O.S. Pharmaceuticals and Personal Care Products in Water and Wastewater: A Review of Treatment Processes and Use of Photocatalyst Immobilized on Functionalized Carbon in AOP Degradation. BMC Chem 2020, 14, 1–29. [Google Scholar] [CrossRef]
- Greenham, R.T.; Miller, K.Y.; Tong, A. Removal Efficiencies of Top-Used Pharmaceuticals at Sewage Treatment Plants with Various Technologies. J Environ Chem Eng 2019, 7, 103294. [Google Scholar] [CrossRef]
- Yin, C.F.; Pan, P.; Li, T.; Song, X.; Xu, Y.; Zhou, N.Y. The Universal Accumulation of P-Aminophenol during the Microbial Degradation of Analgesic and Antipyretic Acetaminophen in WWTPs: A Novel Metagenomic Perspective. Microbiome 2025, 13. [Google Scholar] [CrossRef]
- Nand, S.; Singh, P.P.; Verma, S.; Mishra, S.; Patel, A.; Shukla, S.; Srivastava, P.K. Biochar for Mitigating Pharmaceutical Pollution in Wastewater: A Sustainable Solution. Science of the Total Environment 2025, 966, 178743. [Google Scholar] [CrossRef]
- Humayun, S.; Hayyan, M.; Alias, Y. A Review on Reactive Oxygen Species-Induced Mechanism Pathways of Pharmaceutical Waste Degradation: Acetaminophen as a Drug Waste Model. J Environ Sci (China) 2025, 147, 688–713. [Google Scholar] [CrossRef] [PubMed]
- Wada, O.Z.; Olawade, D.B. Recent Occurrence of Pharmaceuticals in Freshwater, Emerging Treatment Technologies, and Future Considerations: A Review. Chemosphere 2025, 374, 144153. [Google Scholar] [CrossRef]
- Martí-Calatayud, M.C.; Schneider, S.; Yüce, S.; Wessling, M. Interplay between Physical Cleaning, Membrane Pore Size and Fluid Rheology during the Evolution of Fouling in Membrane Bioreactors. Water Res 2018, 147, 393–402. [Google Scholar] [CrossRef]
- Martí-Calatayud, M.C.; Schneider, S.; Wessling, M. On the Rejection and Reversibility of Fouling in Ultrafiltration as Assessed by Hydraulic Impedance Spectroscopy. J Memb Sci 2018, 564, 532–542. [Google Scholar] [CrossRef]
- Martínez-Huitle, C.A.; Panizza, M. Electrochemical Oxidation of Organic Pollutants for Wastewater Treatment. Curr Opin Electrochem 2018, 11, 62–71. [Google Scholar] [CrossRef]
- Yang, H.J.; Kim, J.; Bae, J.H. Selectivity of Electrochemical Reactions Based on Adsorption at Nanoporous Electrodes. Anal Chem 2023, 95, 16216–16224. [Google Scholar] [CrossRef]
- Prabakaran, K.; Li, J.; Anandkumar, A.; Leng, Z.; Zou, C.B.; Du, D. Managing Environmental Contamination through Phytoremediation by Invasive Plants: A Review. Ecol Eng 2019, 138, 28–37. [Google Scholar] [CrossRef]
- Tajarudin, H.A. Bin; Othman, M.F. Bin; Serri, N.A.B.; Tamat, M.R. Bin Biological Treatment Technology for Landfill Leachate. In Waste Management; IGI Global, 2020; pp. 775–806.
- Shearer, L.; Pap, S.; Gibb, S.W. Removal of Pharmaceuticals from Wastewater: A Review of Adsorptive Approaches, Modelling and Mechanisms for Metformin and Macrolides. J Environ Chem Eng 2022, 10, 108106. [Google Scholar] [CrossRef]
- Soffian, M.S.; Abdul Halim, F.Z.; Aziz, F.; A.Rahman, M.; Mohamed Amin, M.A.; Awang Chee, D.N. Carbon-Based Material Derived from Biomass Waste for Wastewater Treatment. Environmental Advances 2022, 9, 100259. [Google Scholar] [CrossRef]
- Gęca, M.; Wiśniewska, M.; Nowicki, P. Biochars and Activated Carbons as Adsorbents of Inorganic and Organic Compounds from Multicomponent Systems – A Review. Adv Colloid Interface Sci 2022, 305, 102687. [Google Scholar] [CrossRef] [PubMed]
- Enaime, G.; Baçaoui, A.; Yaacoubi, A.; Lübken, M. Biochar for Wastewater Treatment—Conversion Technologies and Applications. Applied Sciences 2020, 10, 3492. [Google Scholar] [CrossRef]
- Izquierdo, S.; Pacheco, N.; Durán-Valle, C.J.; López-Coca, I.M. From Waste to Resource: Utilizing Sweet Chestnut Waste to Produce Hydrothermal Carbon for Water Decontamination. C (Basel) 2023, 9, 57. [Google Scholar] [CrossRef]
- Borchardt, L.; Zhu, Q.-L.; Casco, M.E.; Berger, R.; Zhuang, X.; Kaskel, S.; Feng, X.; Xu, Q. Toward a Molecular Design of Porous Carbon Materials. Materials Today 2017, 20, 592–610. [Google Scholar] [CrossRef]
- Zhu, X.; He, M.; Sun, Y.; Xu, Z.; Wan, Z.; Hou, D.; Alessi, D.S.; Tsang, D.C.W. Insights into the Adsorption of Pharmaceuticals and Personal Care Products (PPCPs) on Biochar and Activated Carbon with the Aid of Machine Learning. J Hazard Mater 2022, 423, 127060. [Google Scholar] [CrossRef] [PubMed]
- Zhu, L.; Zhao, N.; Tong, L.; Lv, Y.; Li, G. Characterization and Evaluation of Surface Modified Materials Based on Porous Biochar and Its Adsorption Properties for 2,4-Dichlorophenoxyacetic Acid. Chemosphere 2018, 210, 734–744. [Google Scholar] [CrossRef]
- Srivastava, A.; Gupta, B.; Majumder, A.; Gupta, A.K.; Nimbhorkar, S.K. A Comprehensive Review on the Synthesis, Performance, Modifications, and Regeneration of Activated Carbon for the Adsorptive Removal of Various Water Pollutants. J Environ Chem Eng 2021, 9, 106177. [Google Scholar] [CrossRef]
- Khalil, A.M.E.; Memon, F.A.; Tabish, T.A.; Salmon, D.; Zhang, S.; Butler, D. Nanostructured Porous Graphene for Efficient Removal of Emerging Contaminants (Pharmaceuticals) from Water. Chemical Engineering Journal 2020, 398, 125440. [Google Scholar] [CrossRef]
- Aziz, K.H.H.; Mustafa, F.S.; Hama, S. Pharmaceutical Removal from Aquatic Environments Using Multifunctional Metal-Organic Frameworks (MOFs) Materials for Adsorption and Degradation Processes: A Review. Coord Chem Rev 2025, 542, 216875. [Google Scholar] [CrossRef]
- Dutta, T.; Kim, T.; Vellingiri, K.; Tsang, D.C.W.; Shon, J.R.; Kim, K.-H.; Kumar, S. Recycling and Regeneration of Carbonaceous and Porous Materials through Thermal or Solvent Treatment. Chemical Engineering Journal 2019, 364, 514–529. [Google Scholar] [CrossRef]
- Durán-Valle, C.J.; Izquierdo, S.; Flores-Barroso, A.M.; Adame-Pereira, M.; López-Coca, I.M. De Residuos a Recursos: Carbones Hidrotermales de Calibio de Castaña Para El Tratamiento de Agua Contaminada Con Torio. Boletín del Grupo Español del Carbón 2024, 71, 106–107. [Google Scholar]
- Adame-Pereira, M.; Durán-Valle, C.J.; Fernández-González, C.; Rubio-Montero, M.P. Preparación y Caracterización de Carbones Obtenidos Por Carbonización Hidrotermal. Adsorción de Uranio. Bol. Grupo Esp. Carbon 2024, 71, 100–101. [Google Scholar]
- Adame-Pereira, M.; Durán-Valle, C.J.; Fernández-González, C. Hydrothermal Carbon Coating of an Activated Carbon—A New Adsorbent. Molecules 2023, 28, 4769. [Google Scholar] [CrossRef] [PubMed]
- Román, I.; Pardo-Botello, R.; Durán-Valle, C.J.; Cintas, P.; Fernando Martínez, R. An Eco-Friendly and Switchable Carbon-Based Catalyst for Protection-Deprotection of Vicinal Diols. ChemCatChem 2023, 15. [Google Scholar] [CrossRef]
- Thommes, M.; Kaneko, K.; Neimark, A. V.; Olivier, J.P.; Rodriguez-Reinoso, F.; Rouquerol, J.; Sing, K.S.W. Physisorption of Gases, with Special Reference to the Evaluation of Surface Area and Pore Size Distribution (IUPAC Technical Report). Pure and Applied Chemistry 2015, 87, 1051–1069. [Google Scholar] [CrossRef]
- Prescott, L. Kinetics and Metabolism of Paracetamol and Phenacetin. Br J Clin Pharmacol 1980, 10, 291S–298S. [Google Scholar] [CrossRef]
- Omenat-Morán, D.; Durán-Valle, C.J.; Martínez-Cañas, M.A. Kinetic and Mechanistic Analysis of Phenol Adsorption on Activated Carbons from Kenaf. Molecules 2024, 29, 1–21. [Google Scholar] [CrossRef] [PubMed]
- Brunauer, S.; Emmett, P.H.; Teller, E. Adsorption of Gases in Multimolecular Layers. J Am Chem Soc 1938, 60, 309–319. [Google Scholar] [CrossRef]
- Valente Nabais, J.M.; Carrott, P.J.M. Chemical Characterization of Activated Carbon Fibers and Activated Carbons. J Chem Educ 2006, 83, 436. [Google Scholar] [CrossRef]
- Frisch, M.J.; Trucks, G.W.; Schlegel, H.B.; Scuseria, G.E.; Robb, M.A.; Cheeseman, J.R.; Scalmani, G.; Barone, V.; Petersson, G.A.; Nakatsuji, H.; et al. Gaussian 16 2016.
- Marenich, A. V.; Cramer, C.J.; Truhlar, D.G. Universal Solvation Model Based on Solute Electron Density and on a Continuum Model of the Solvent Defined by the Bulk Dielectric Constant and Atomic Surface Tensions. J Phys Chem B 2009, 113, 6378–6396. [Google Scholar] [CrossRef]
Figure 1.
C 1s XPS spectra for (a) M and (b) MH.
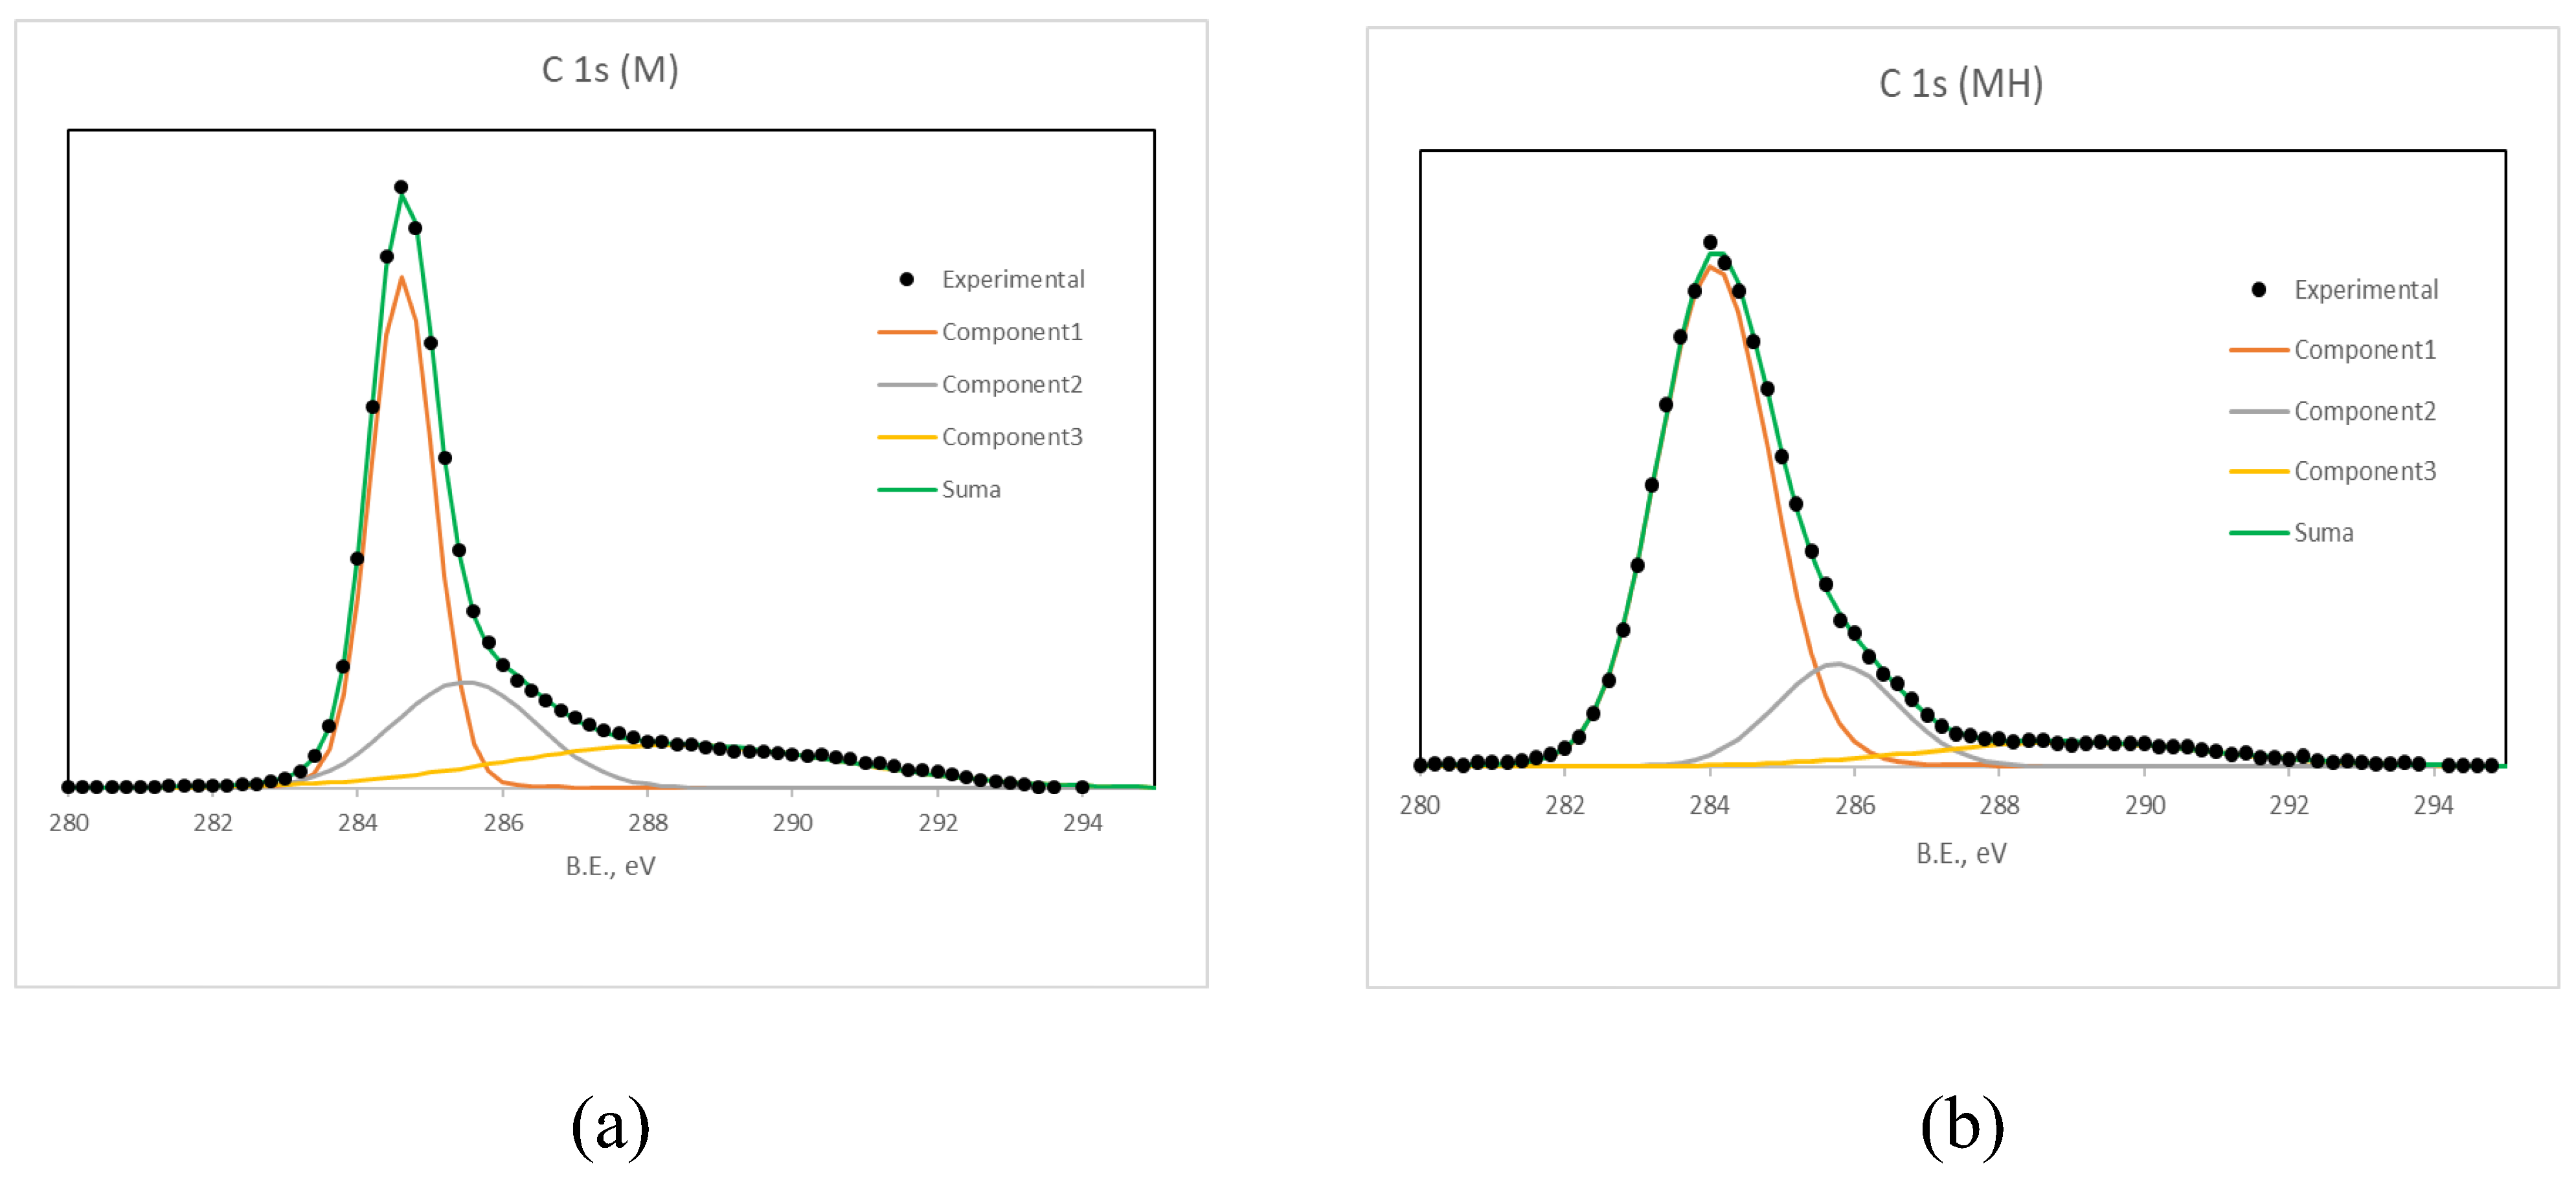
Figure 2.
FTIR spectra of M and MH.
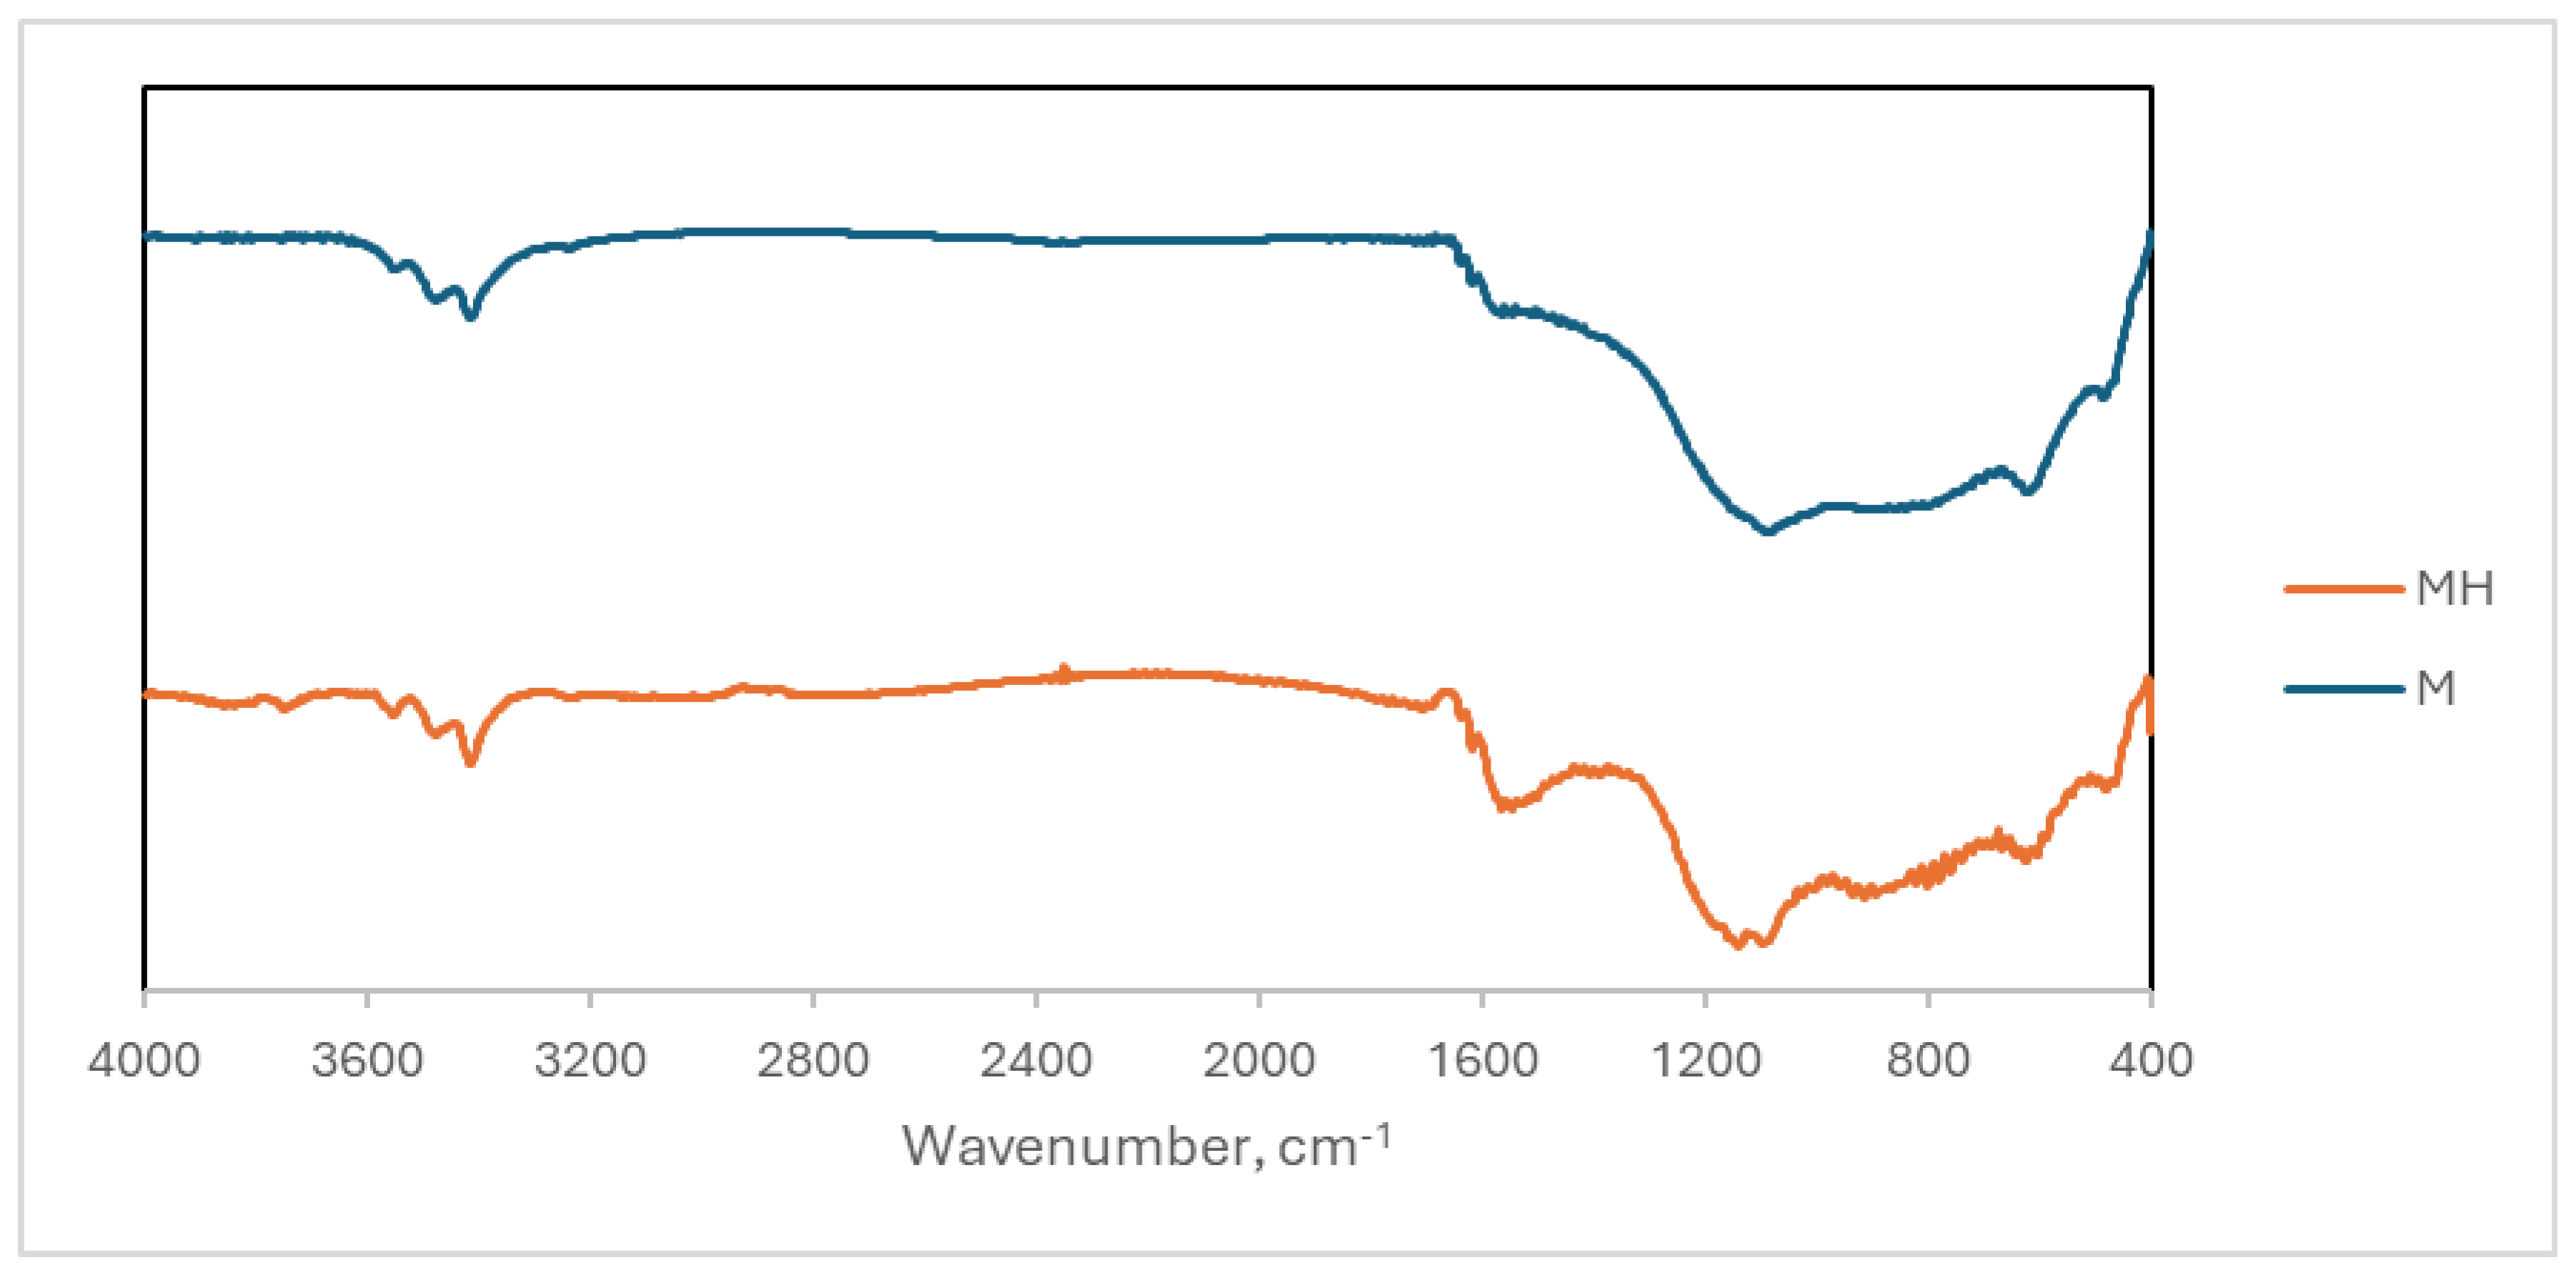
Figure 3.
N₂ adsorption isotherms at 77 K.
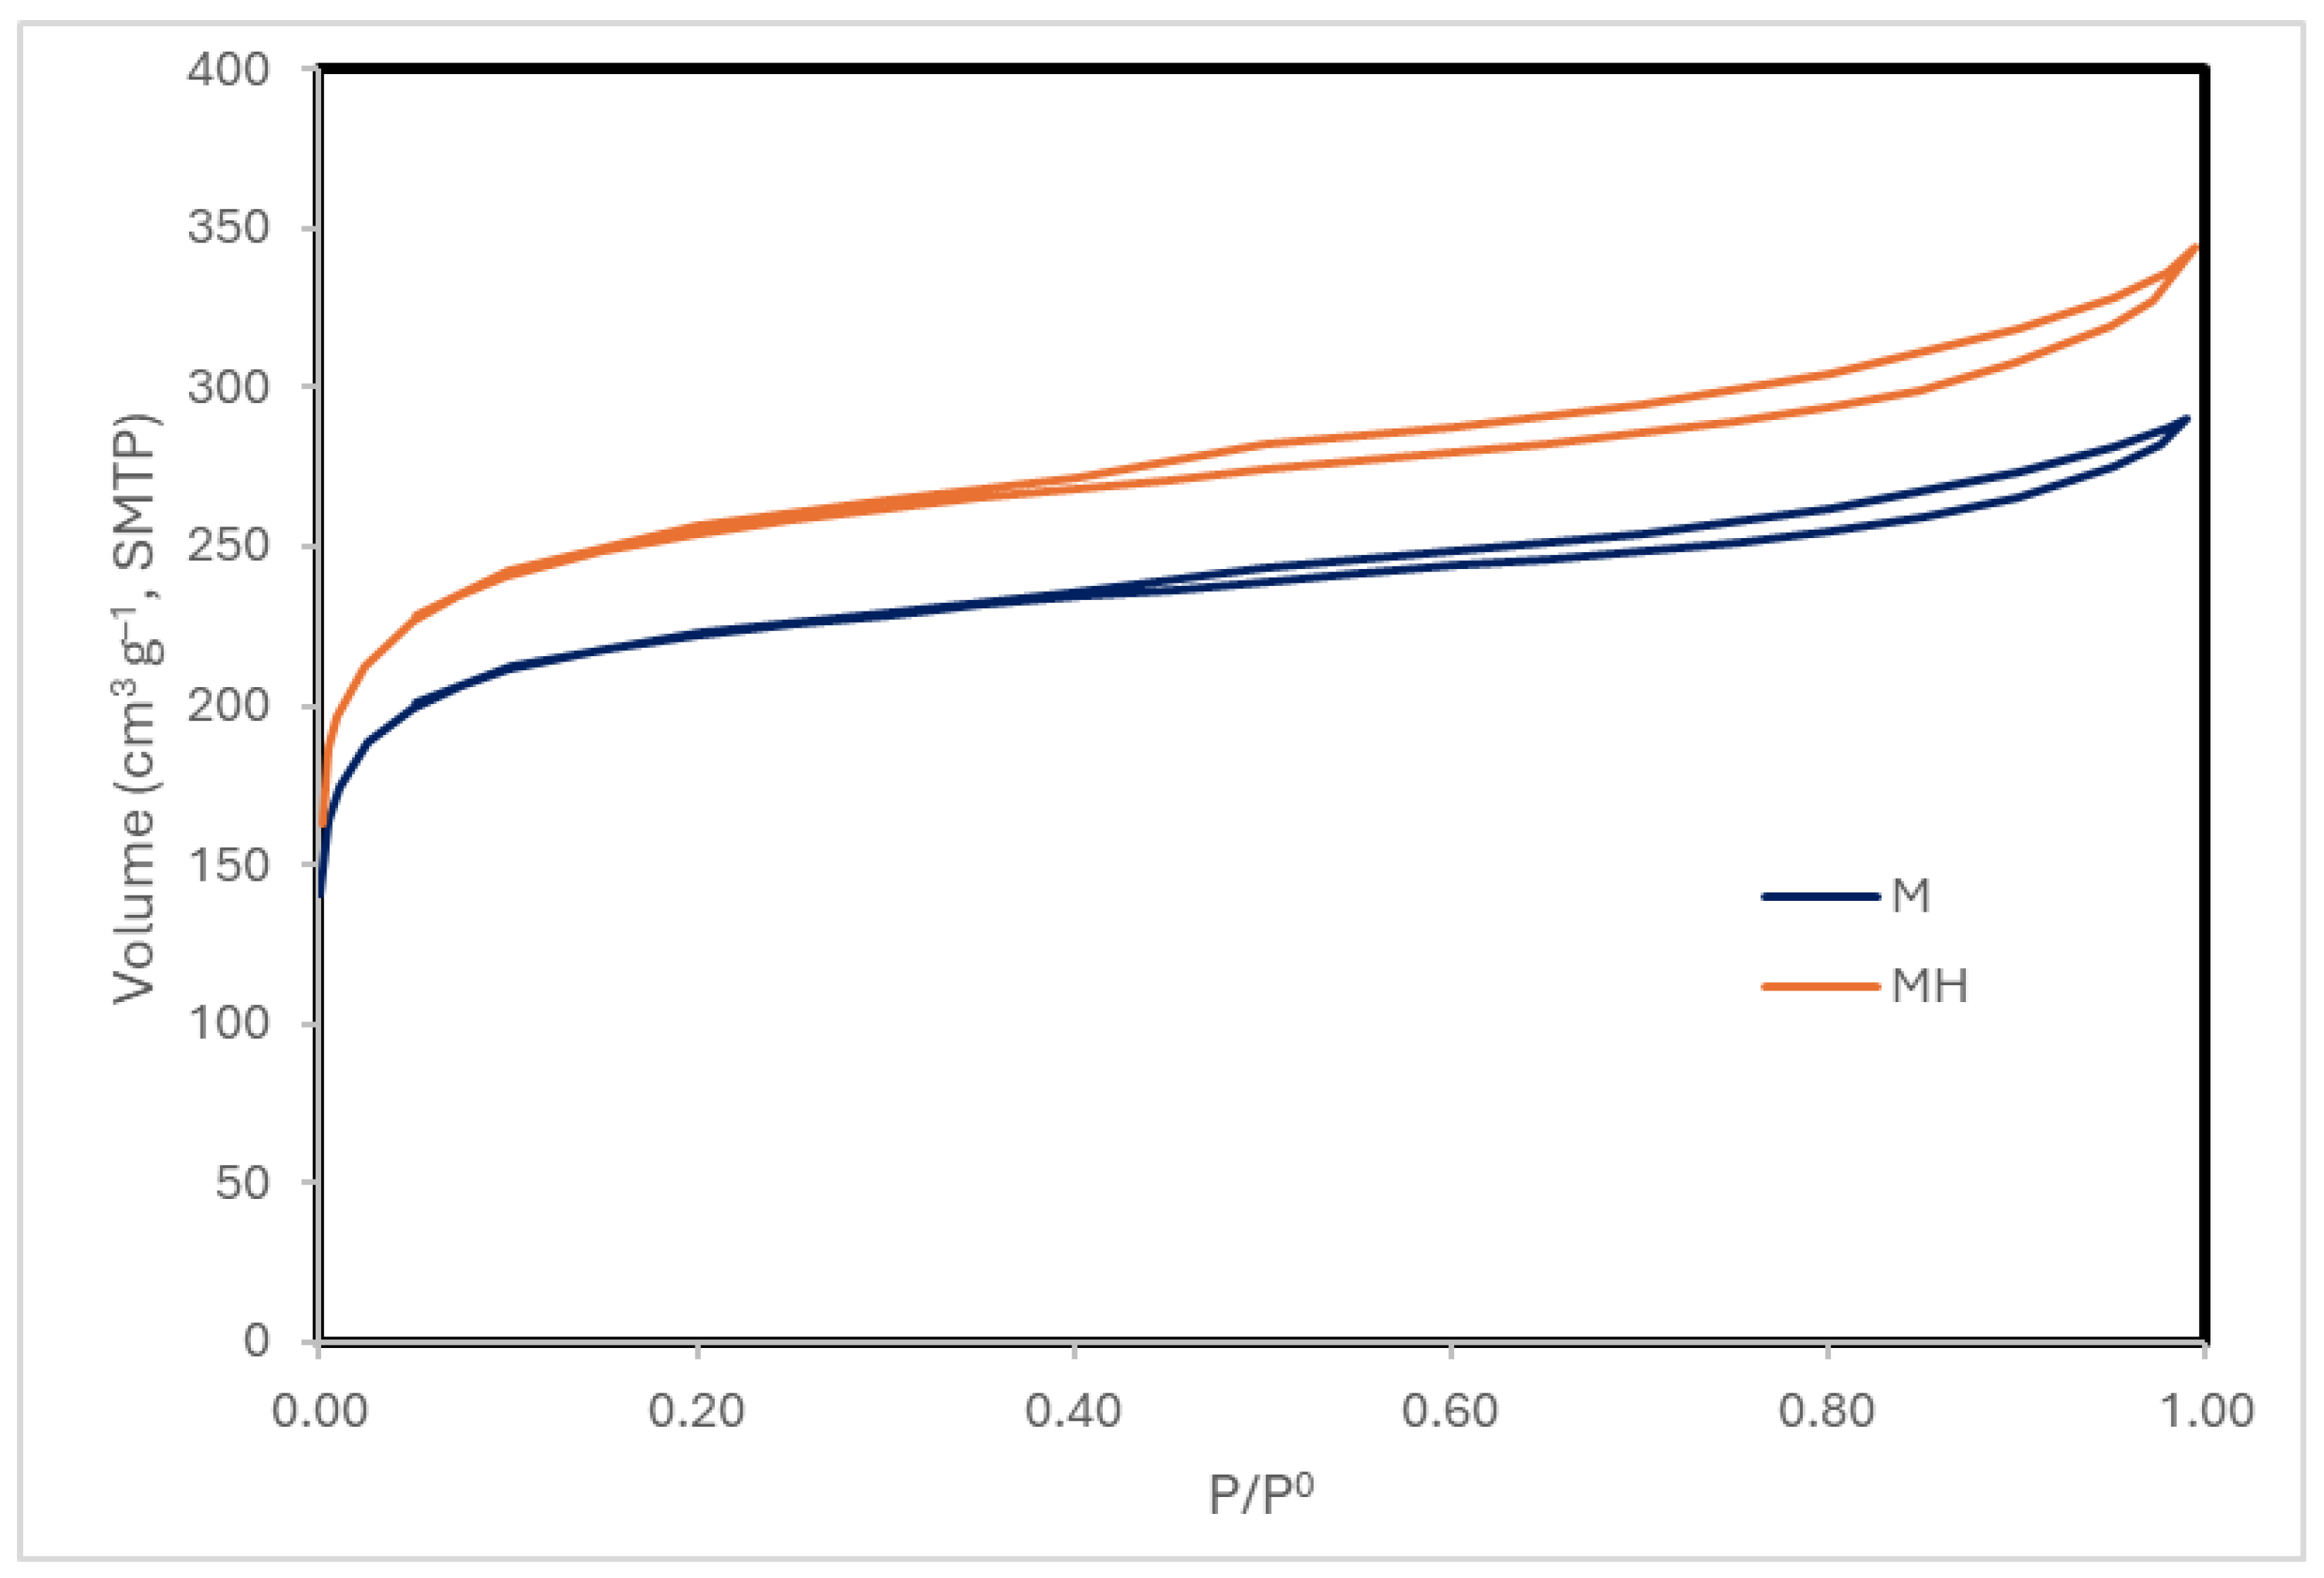
Figure 4.
Pore size distribution (DFT method).
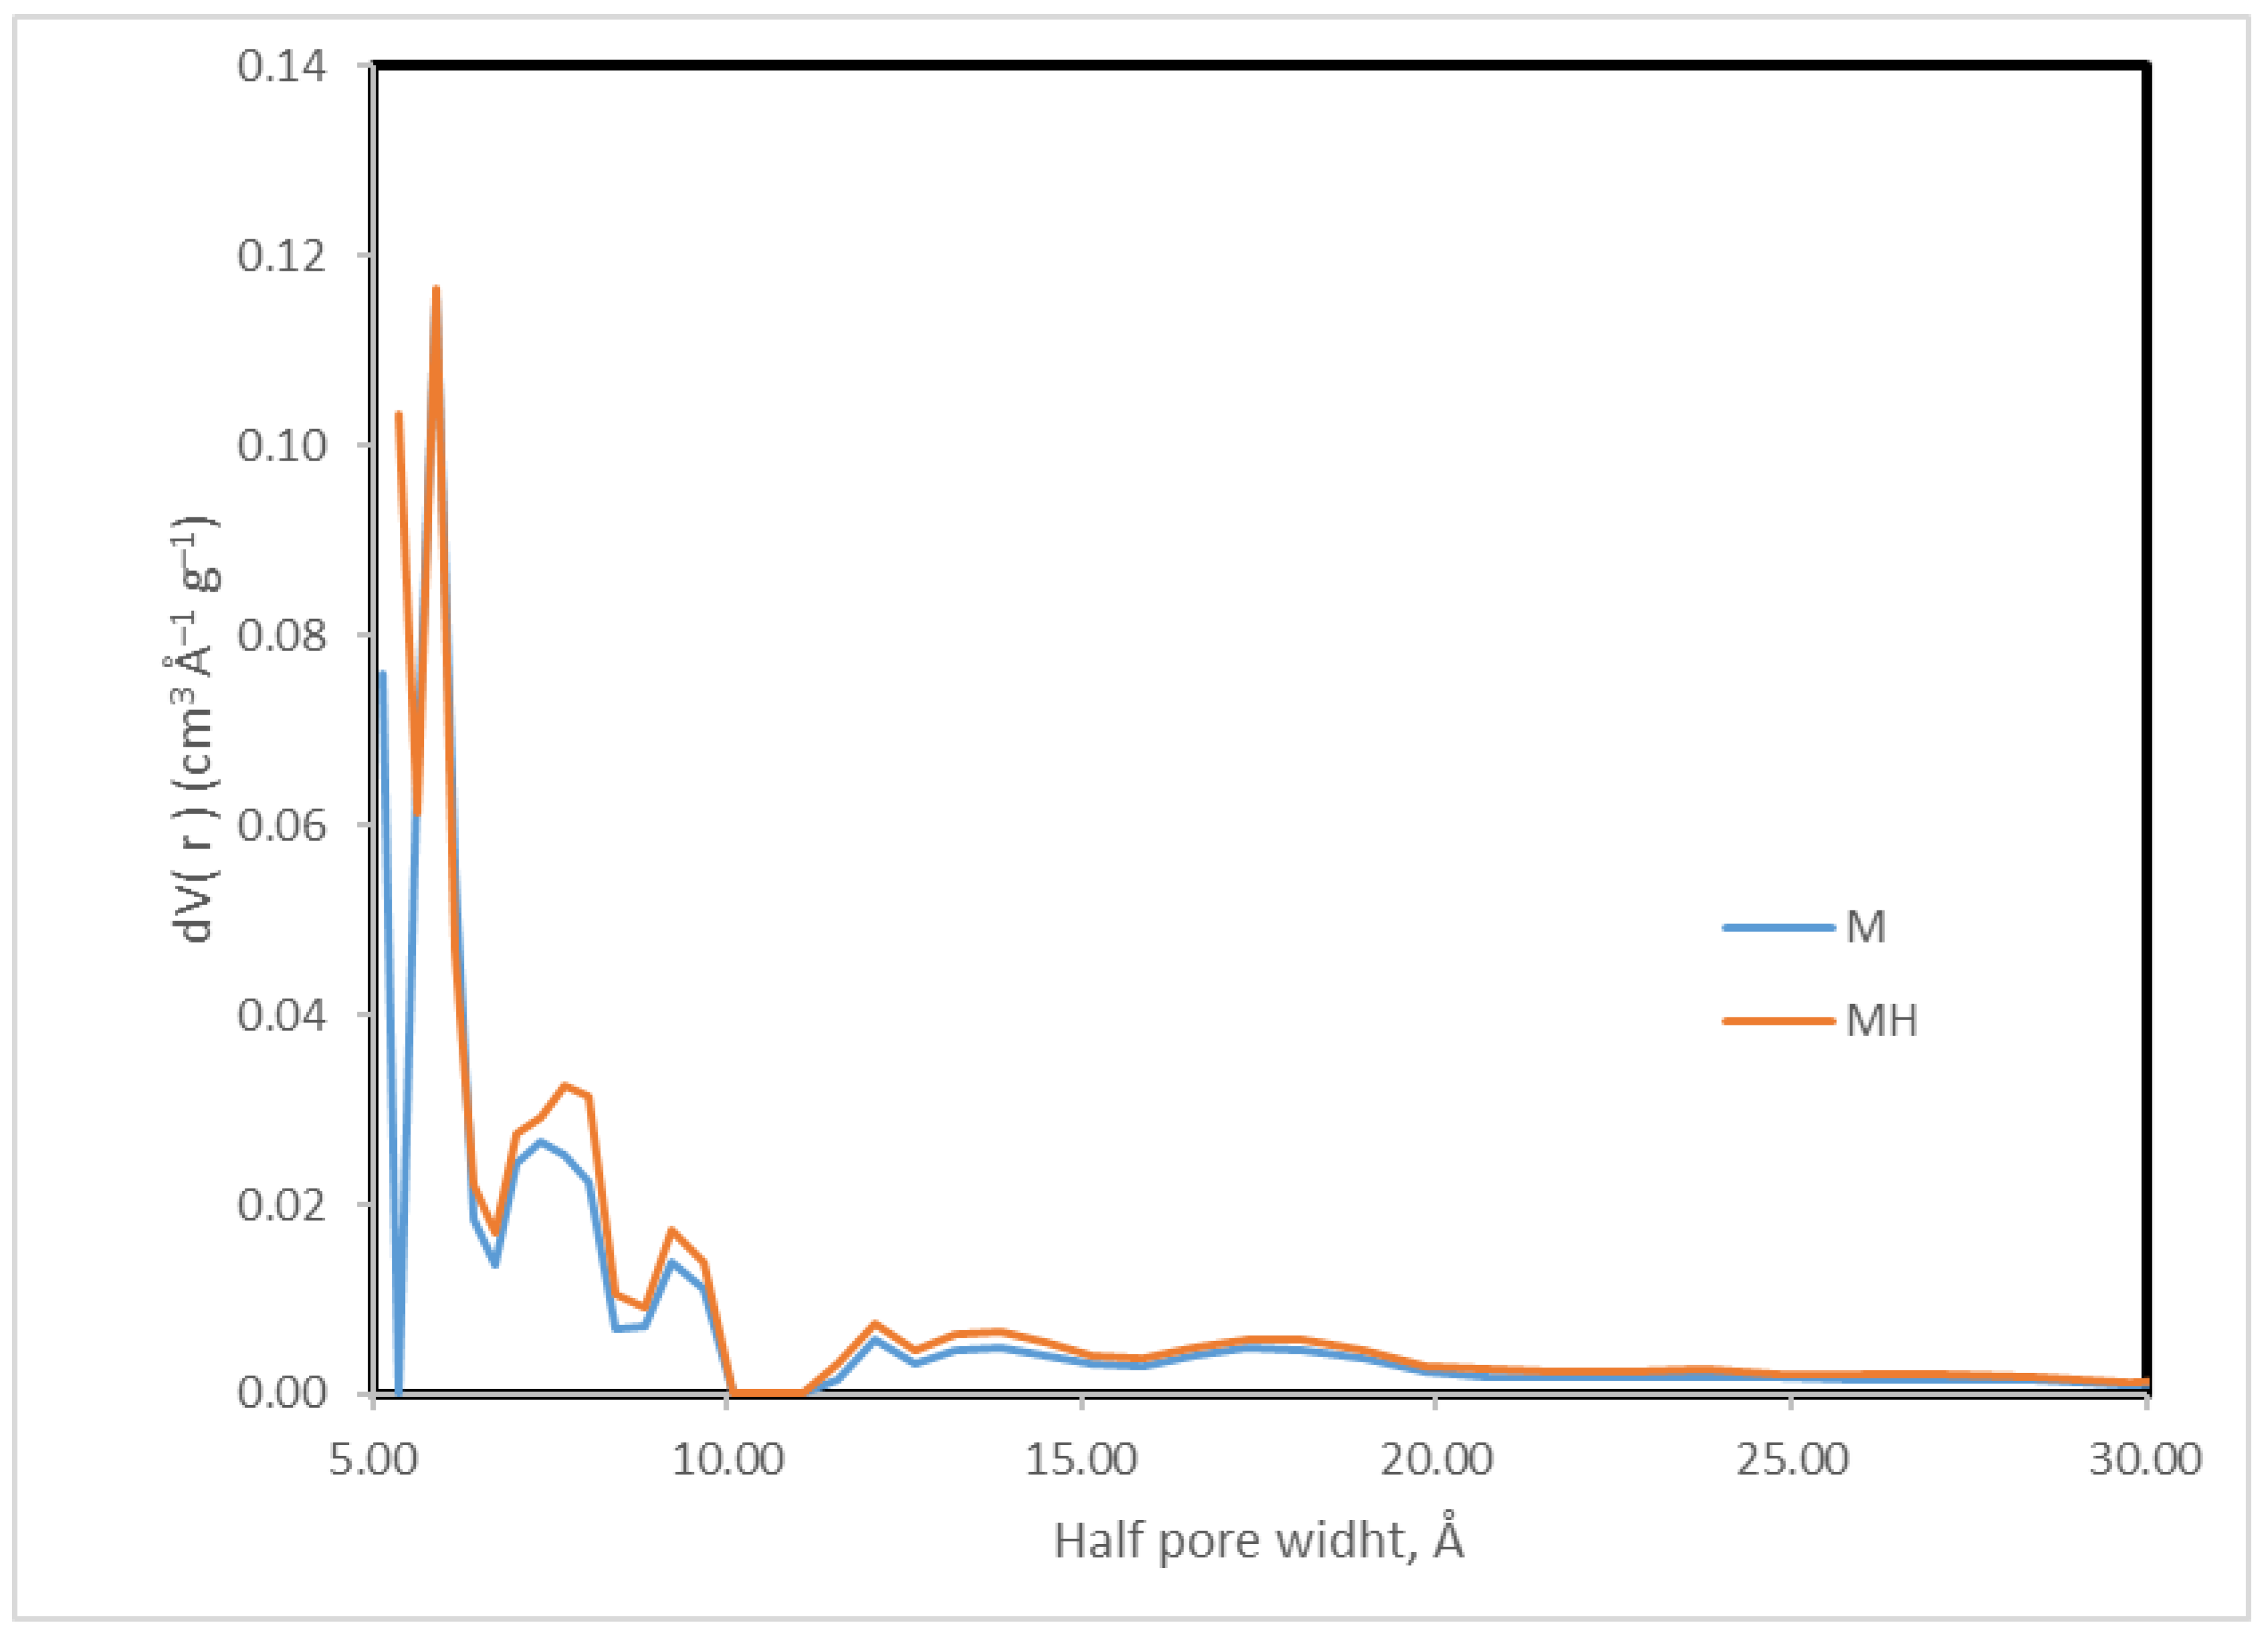
Figure 5.
APAP removal kinetics for (a) M and (b) MH. Numeric data from pH 5, 40 ºC experiment.
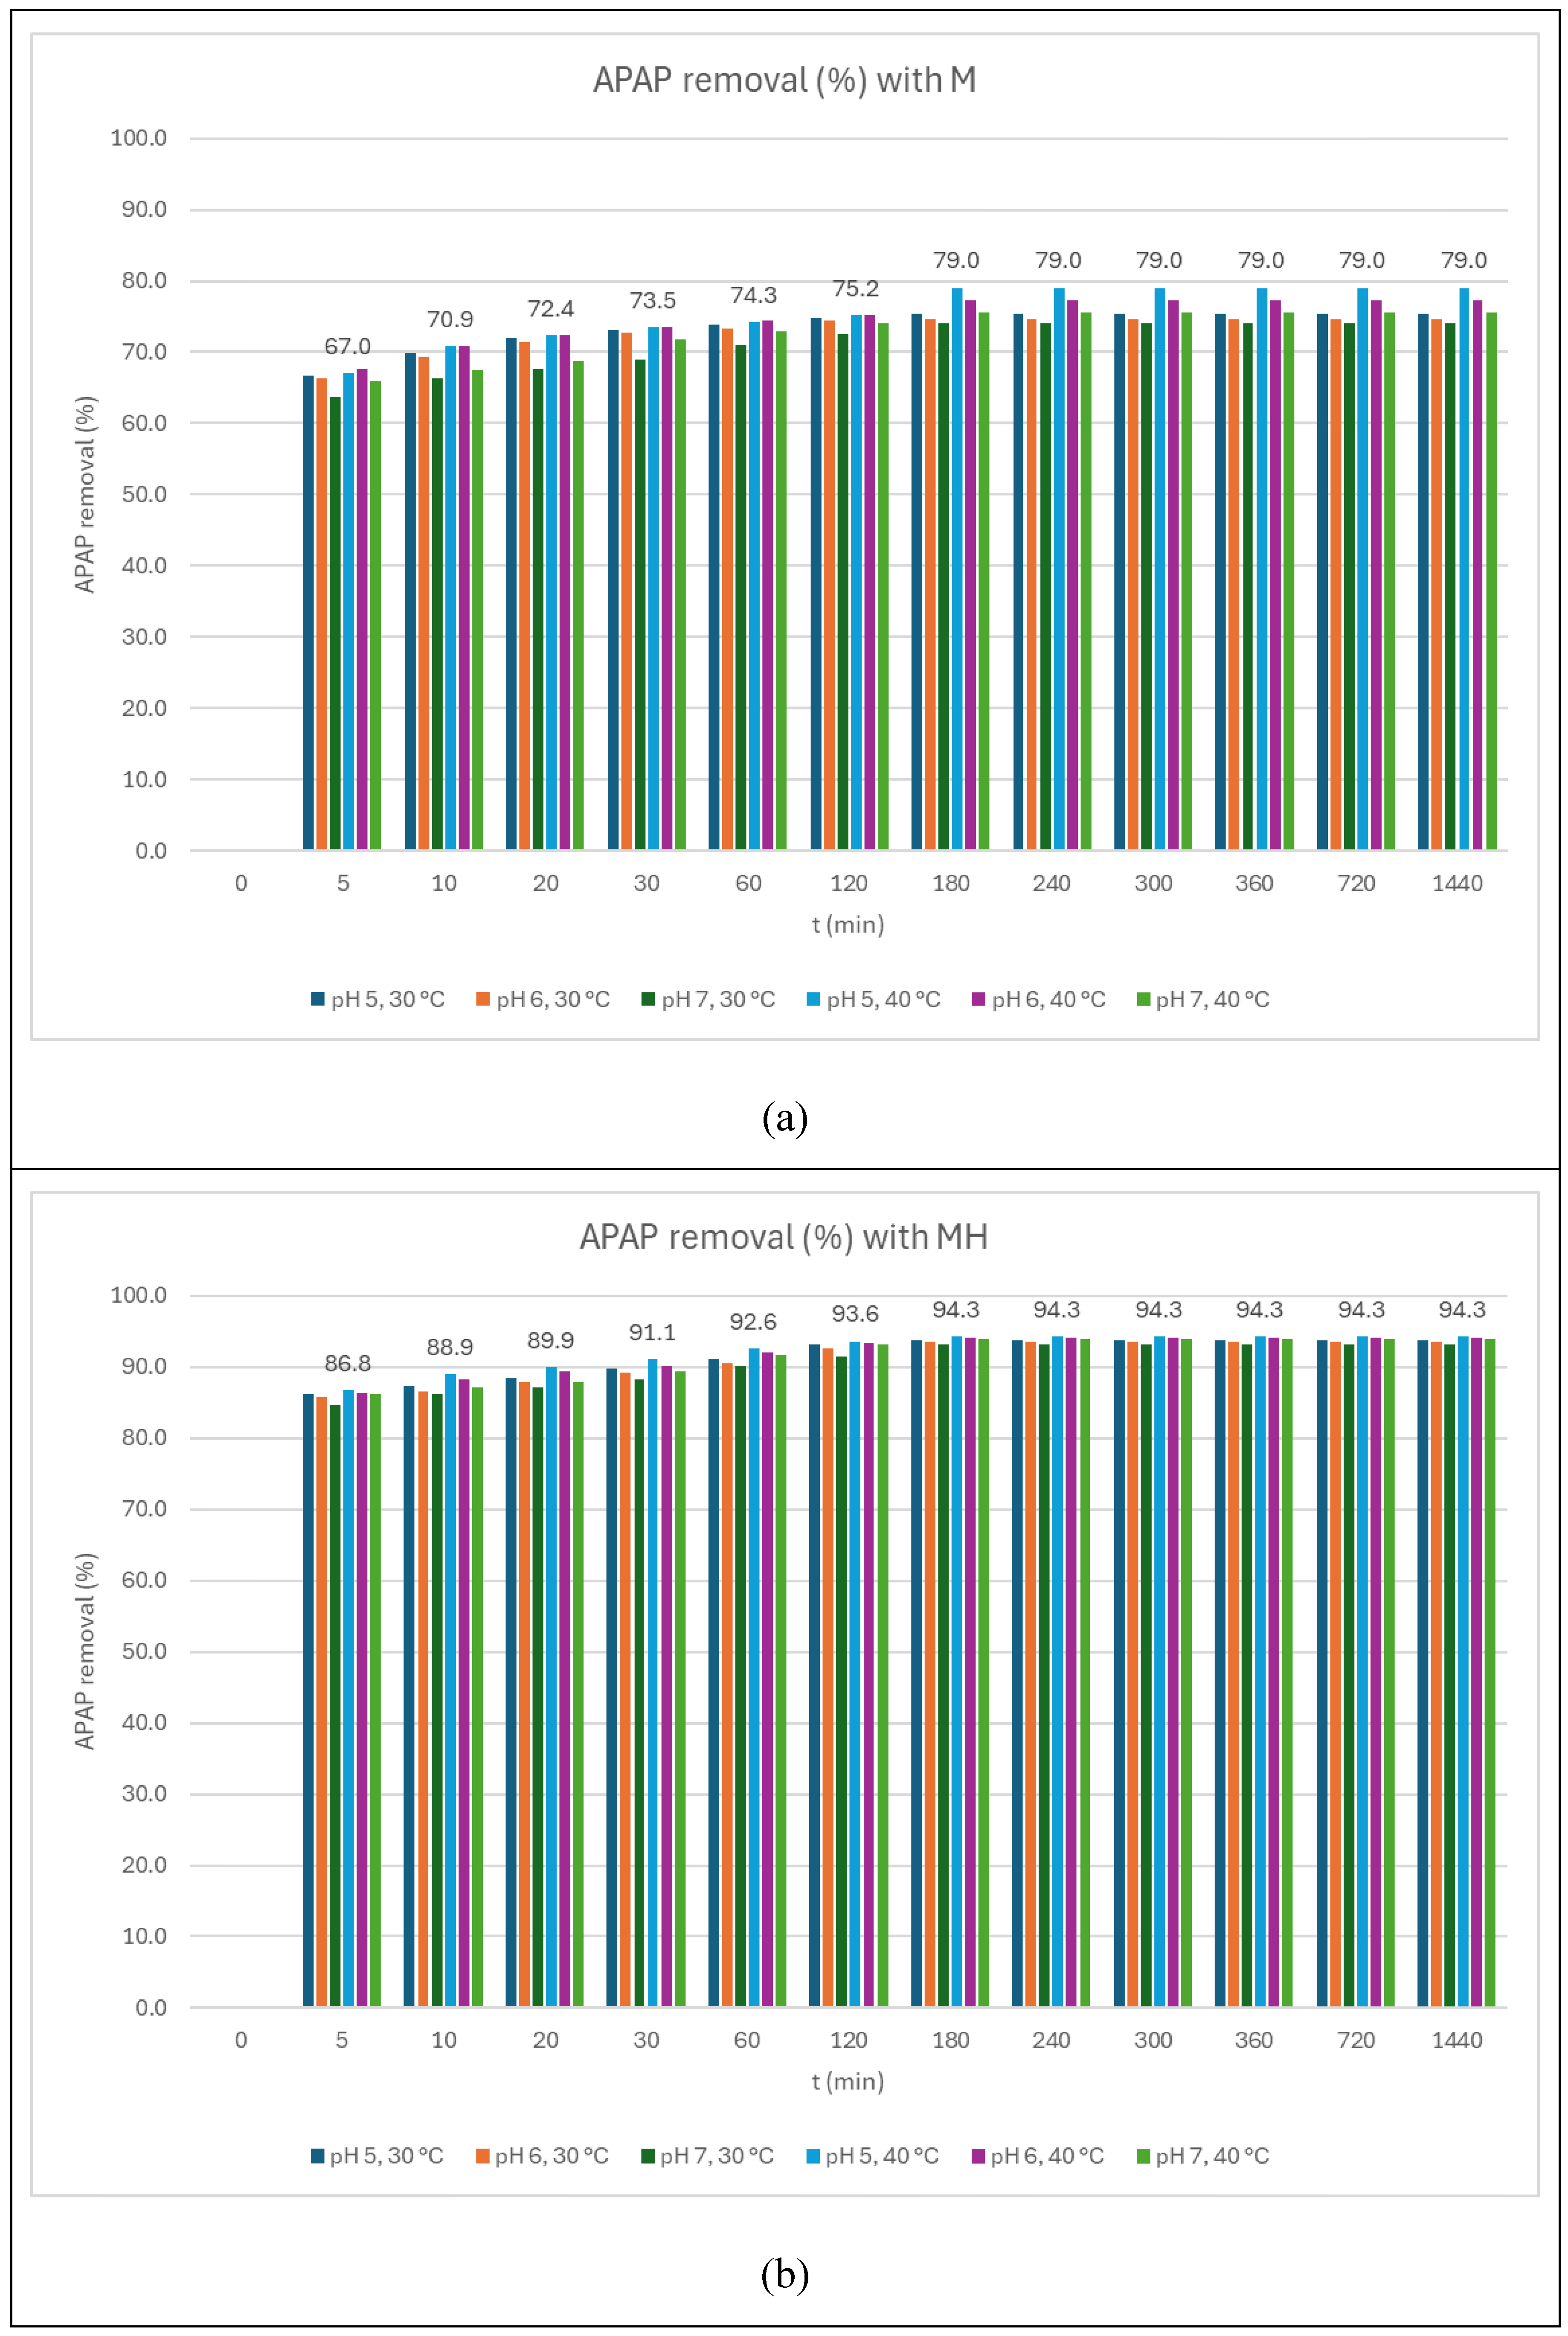
Figure 6.
Adsorption isotherm for APAP onto M and MH at pH 5, 30 °C and 40 °C.
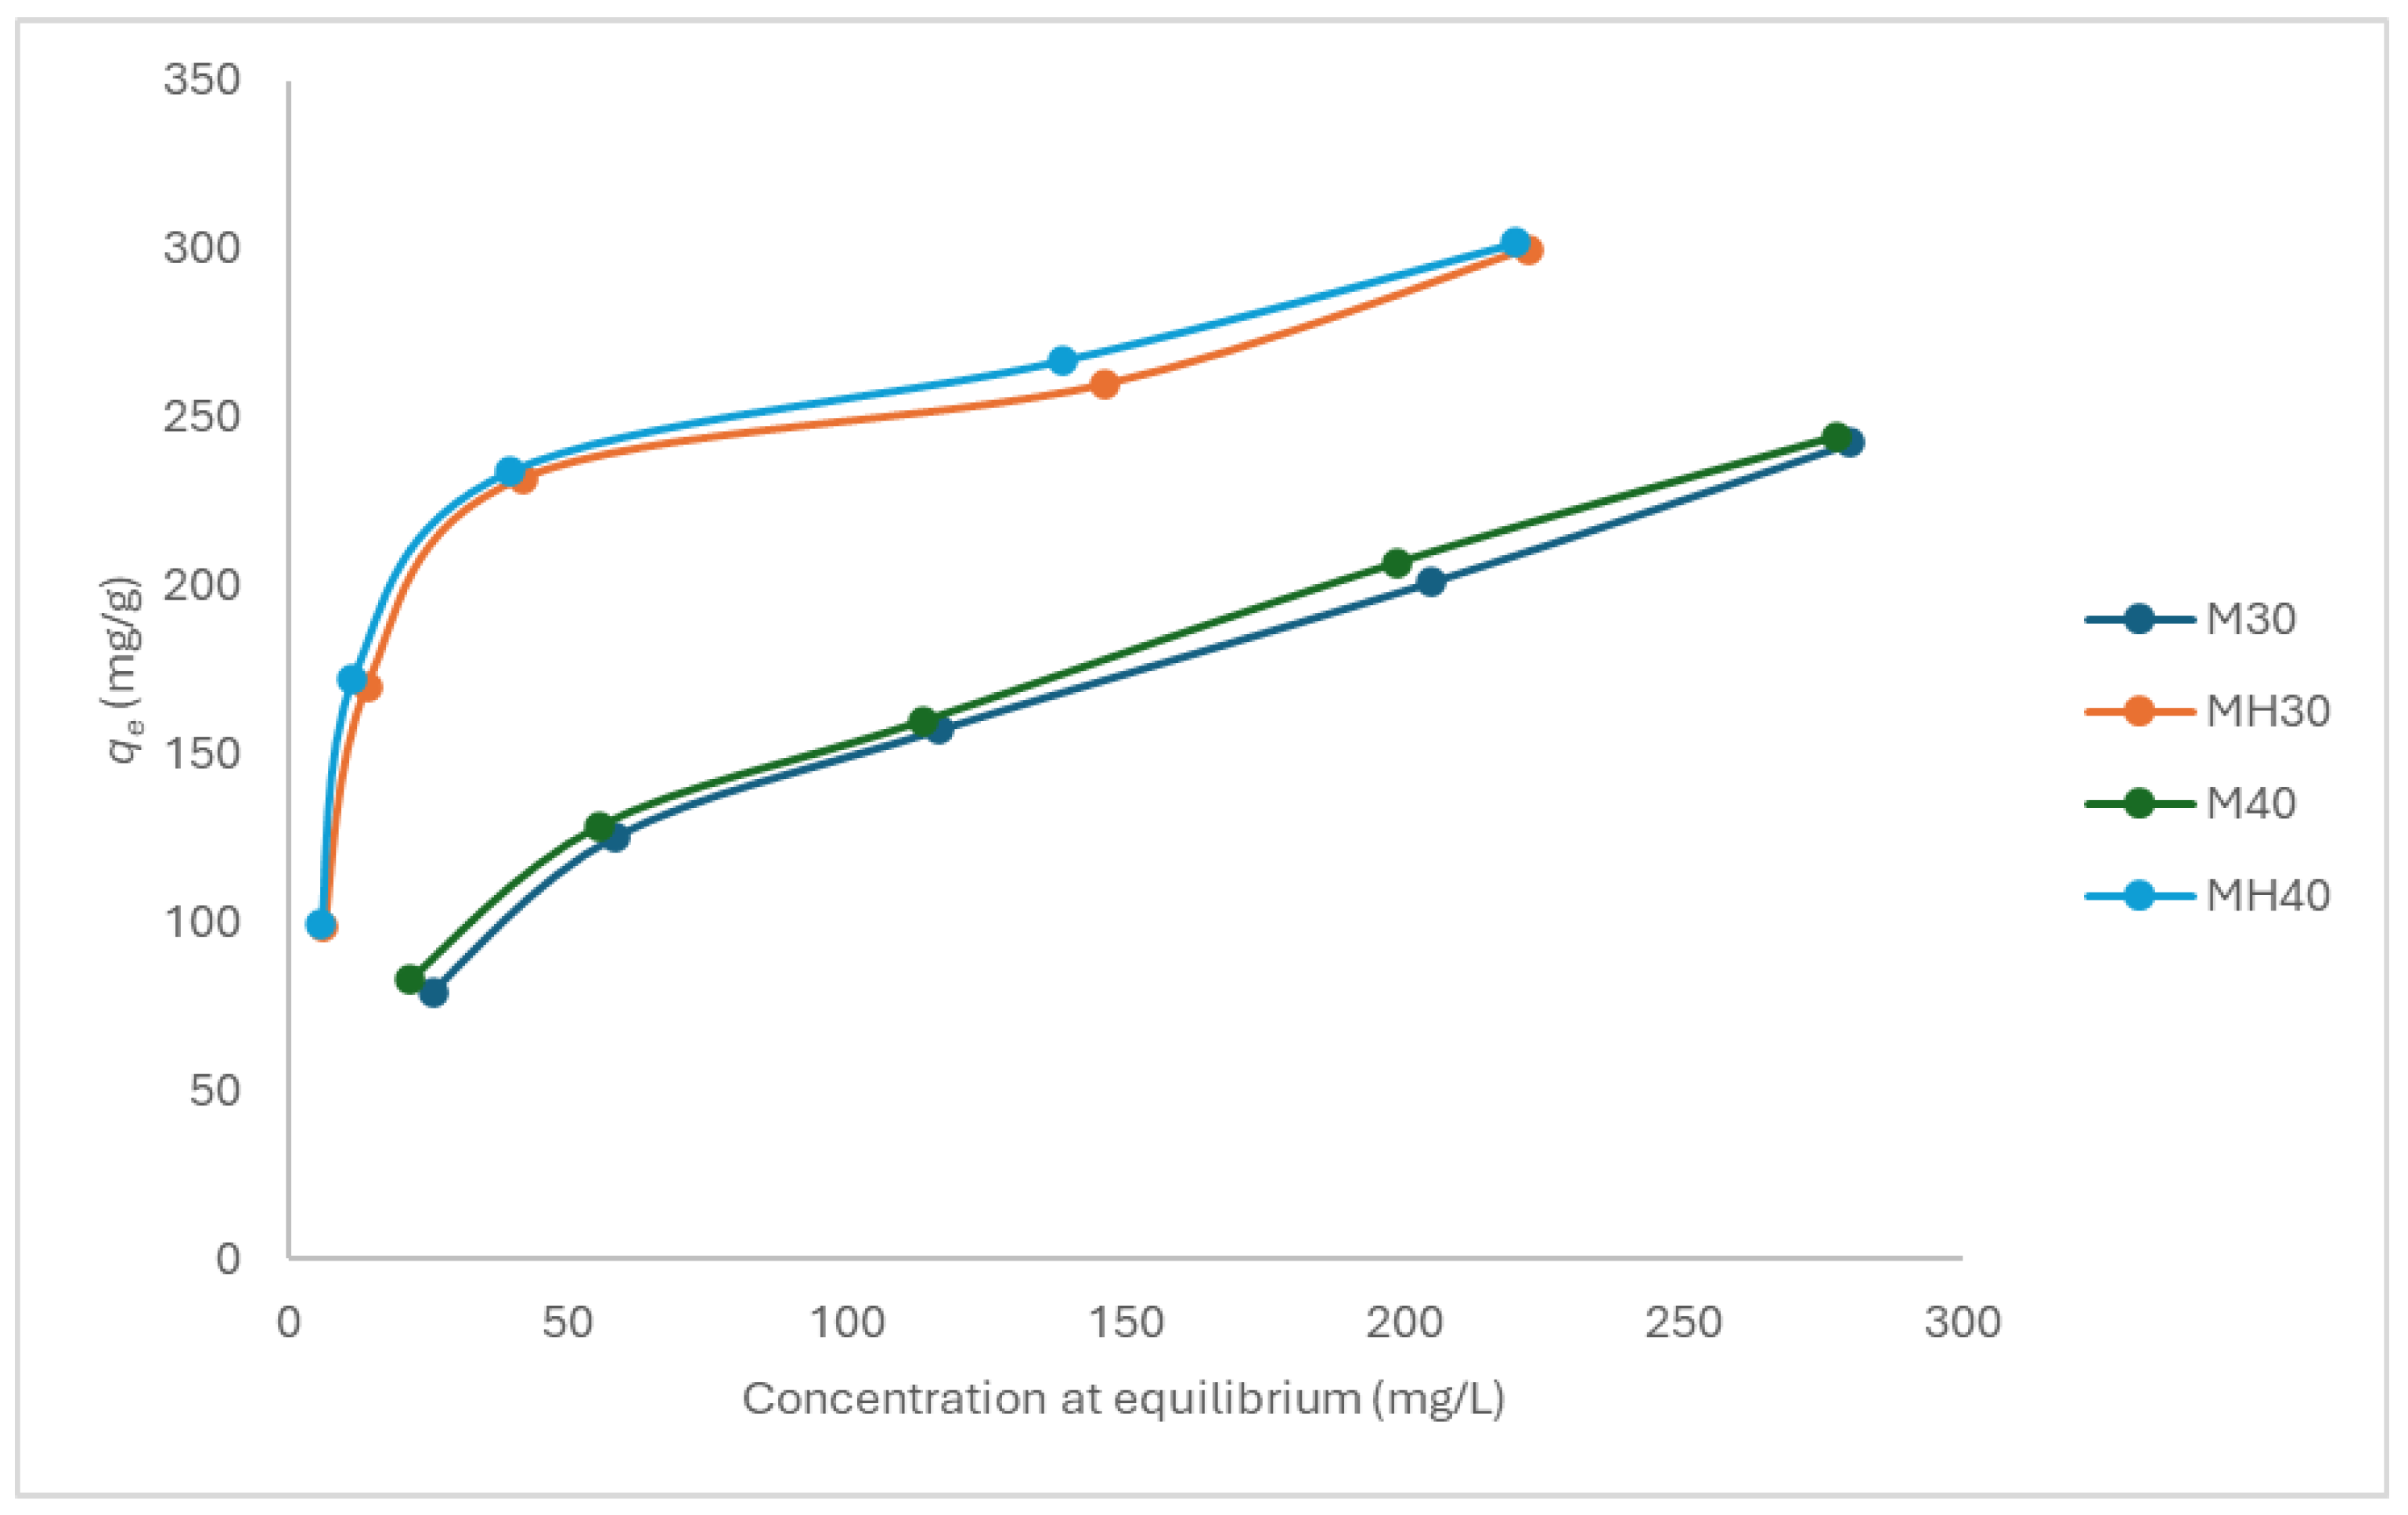
Figure 7.
Adsorption isotherm for APAP onto M and MH at pH 6, 30 °C and 40 °C.
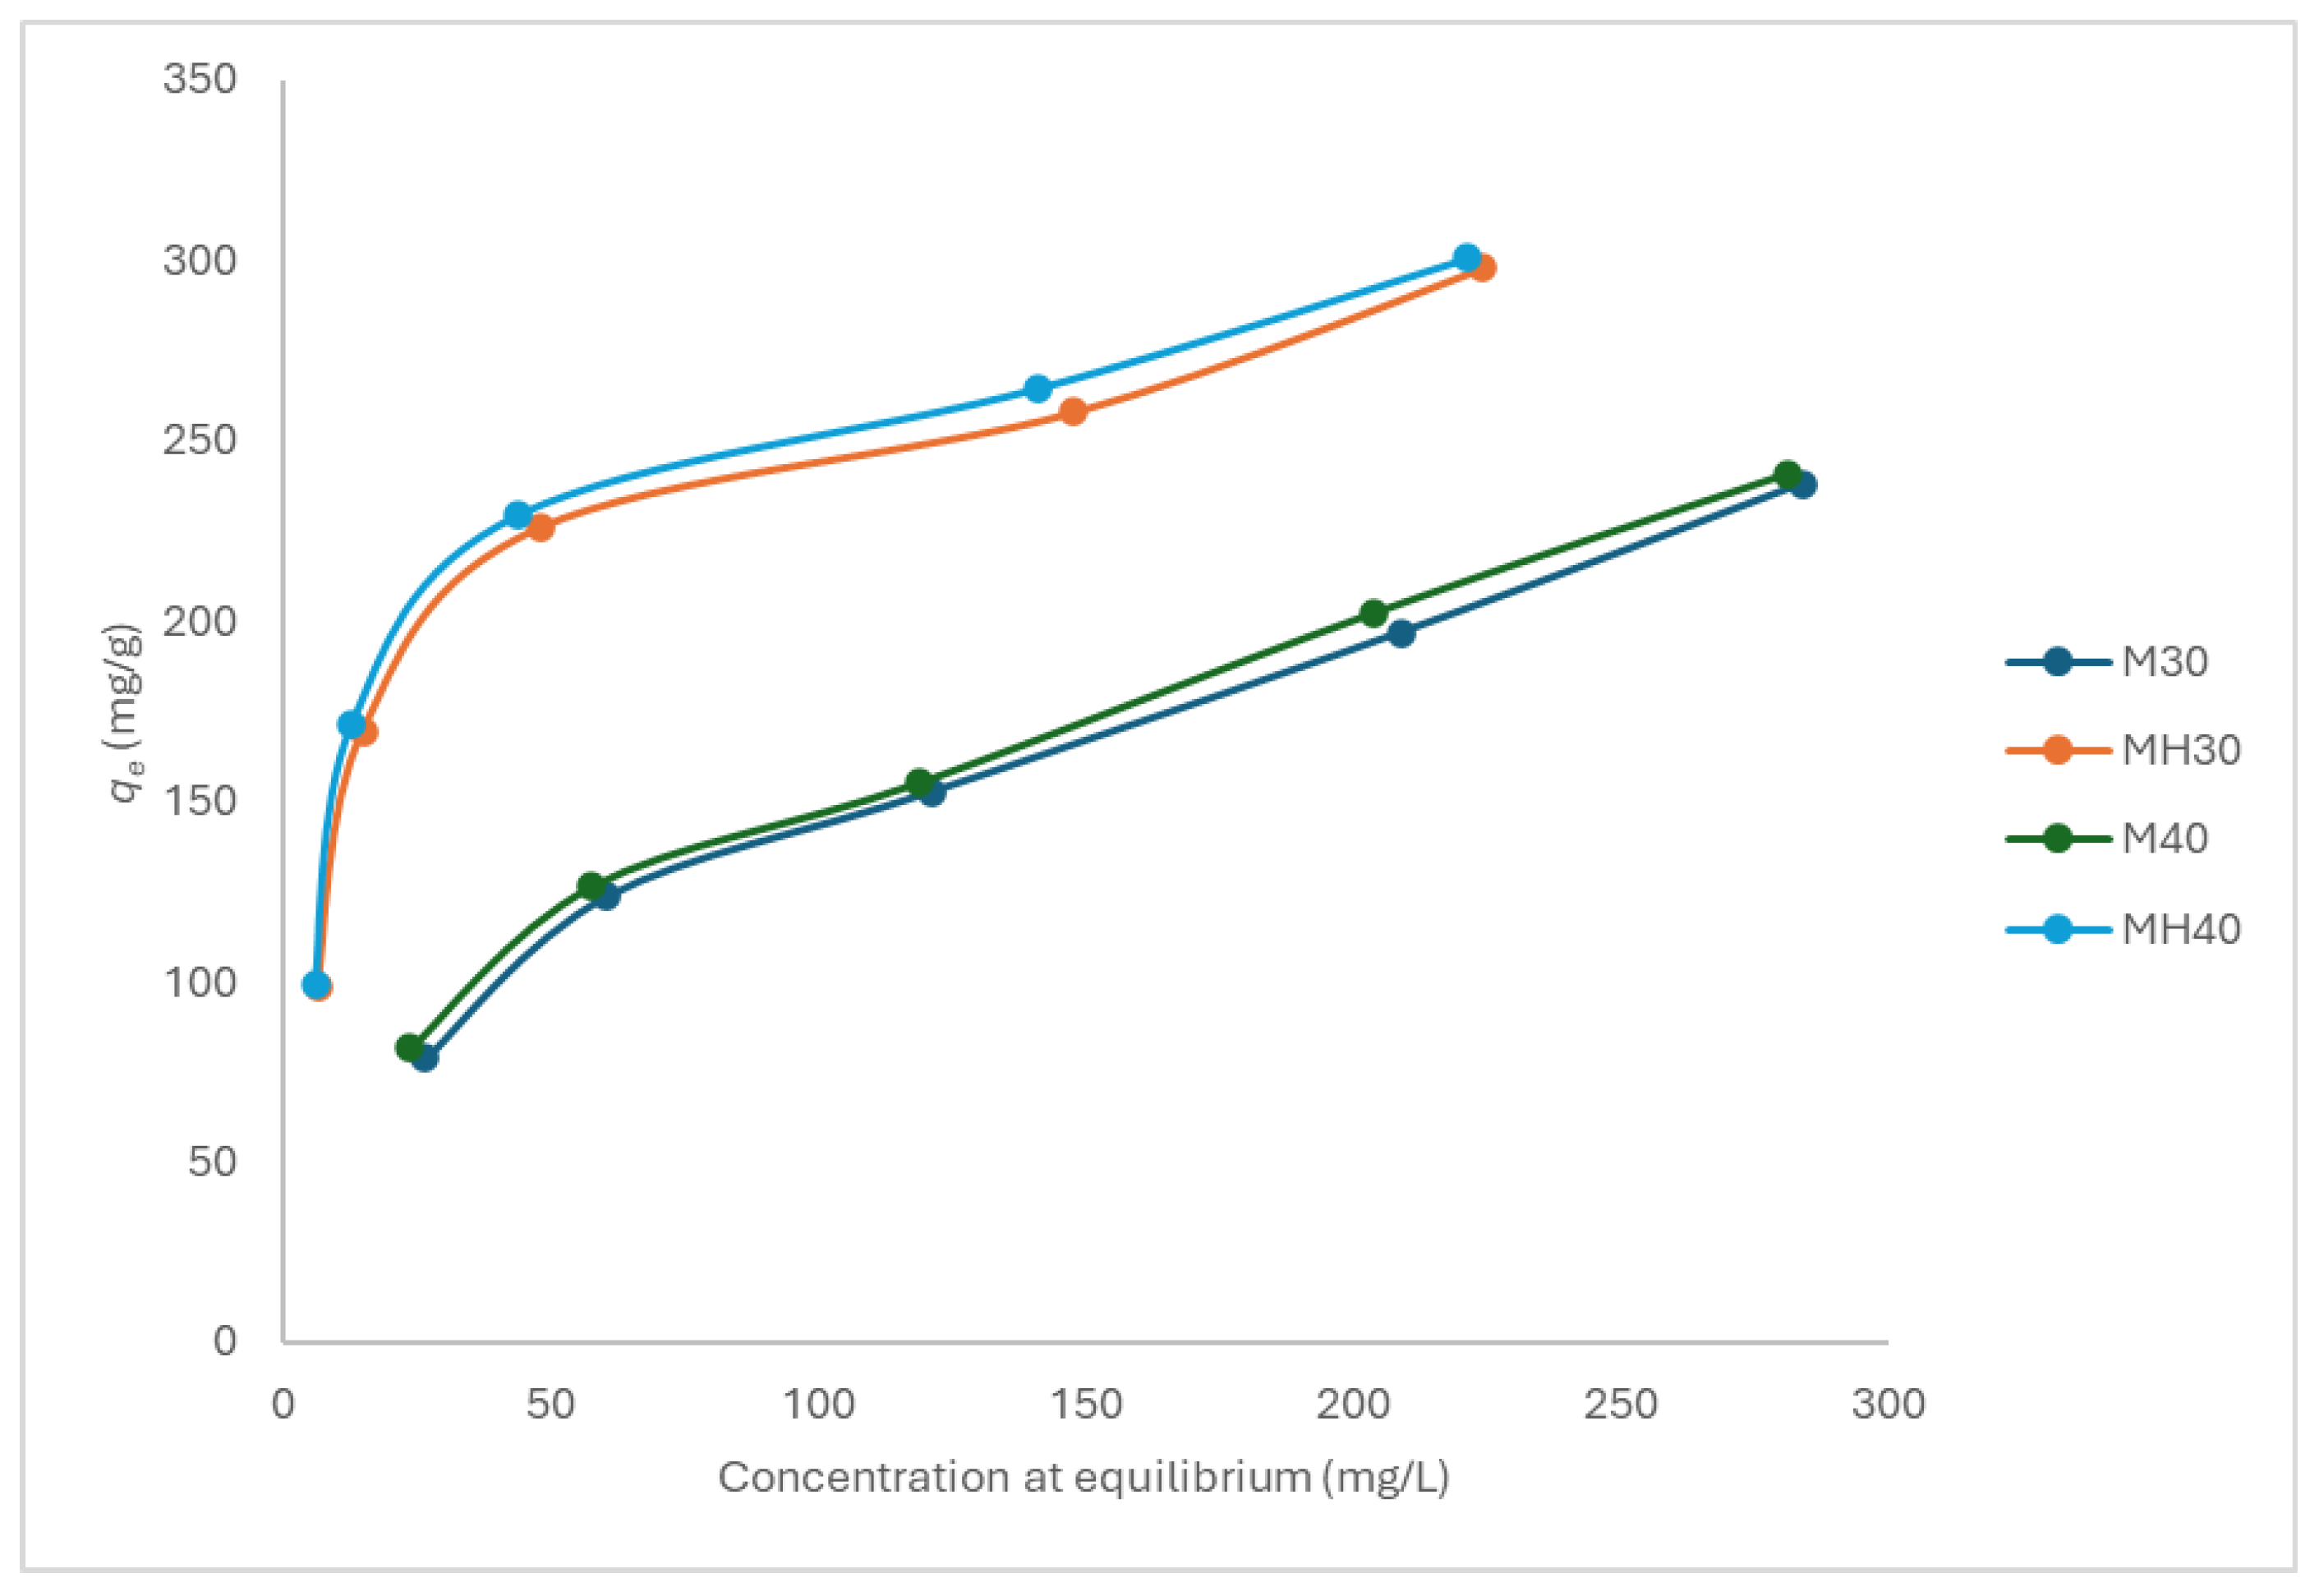
Figure 8.
Adsorption isotherm for APAP onto M and MH at pH 7, 30 °C and 40 °C.
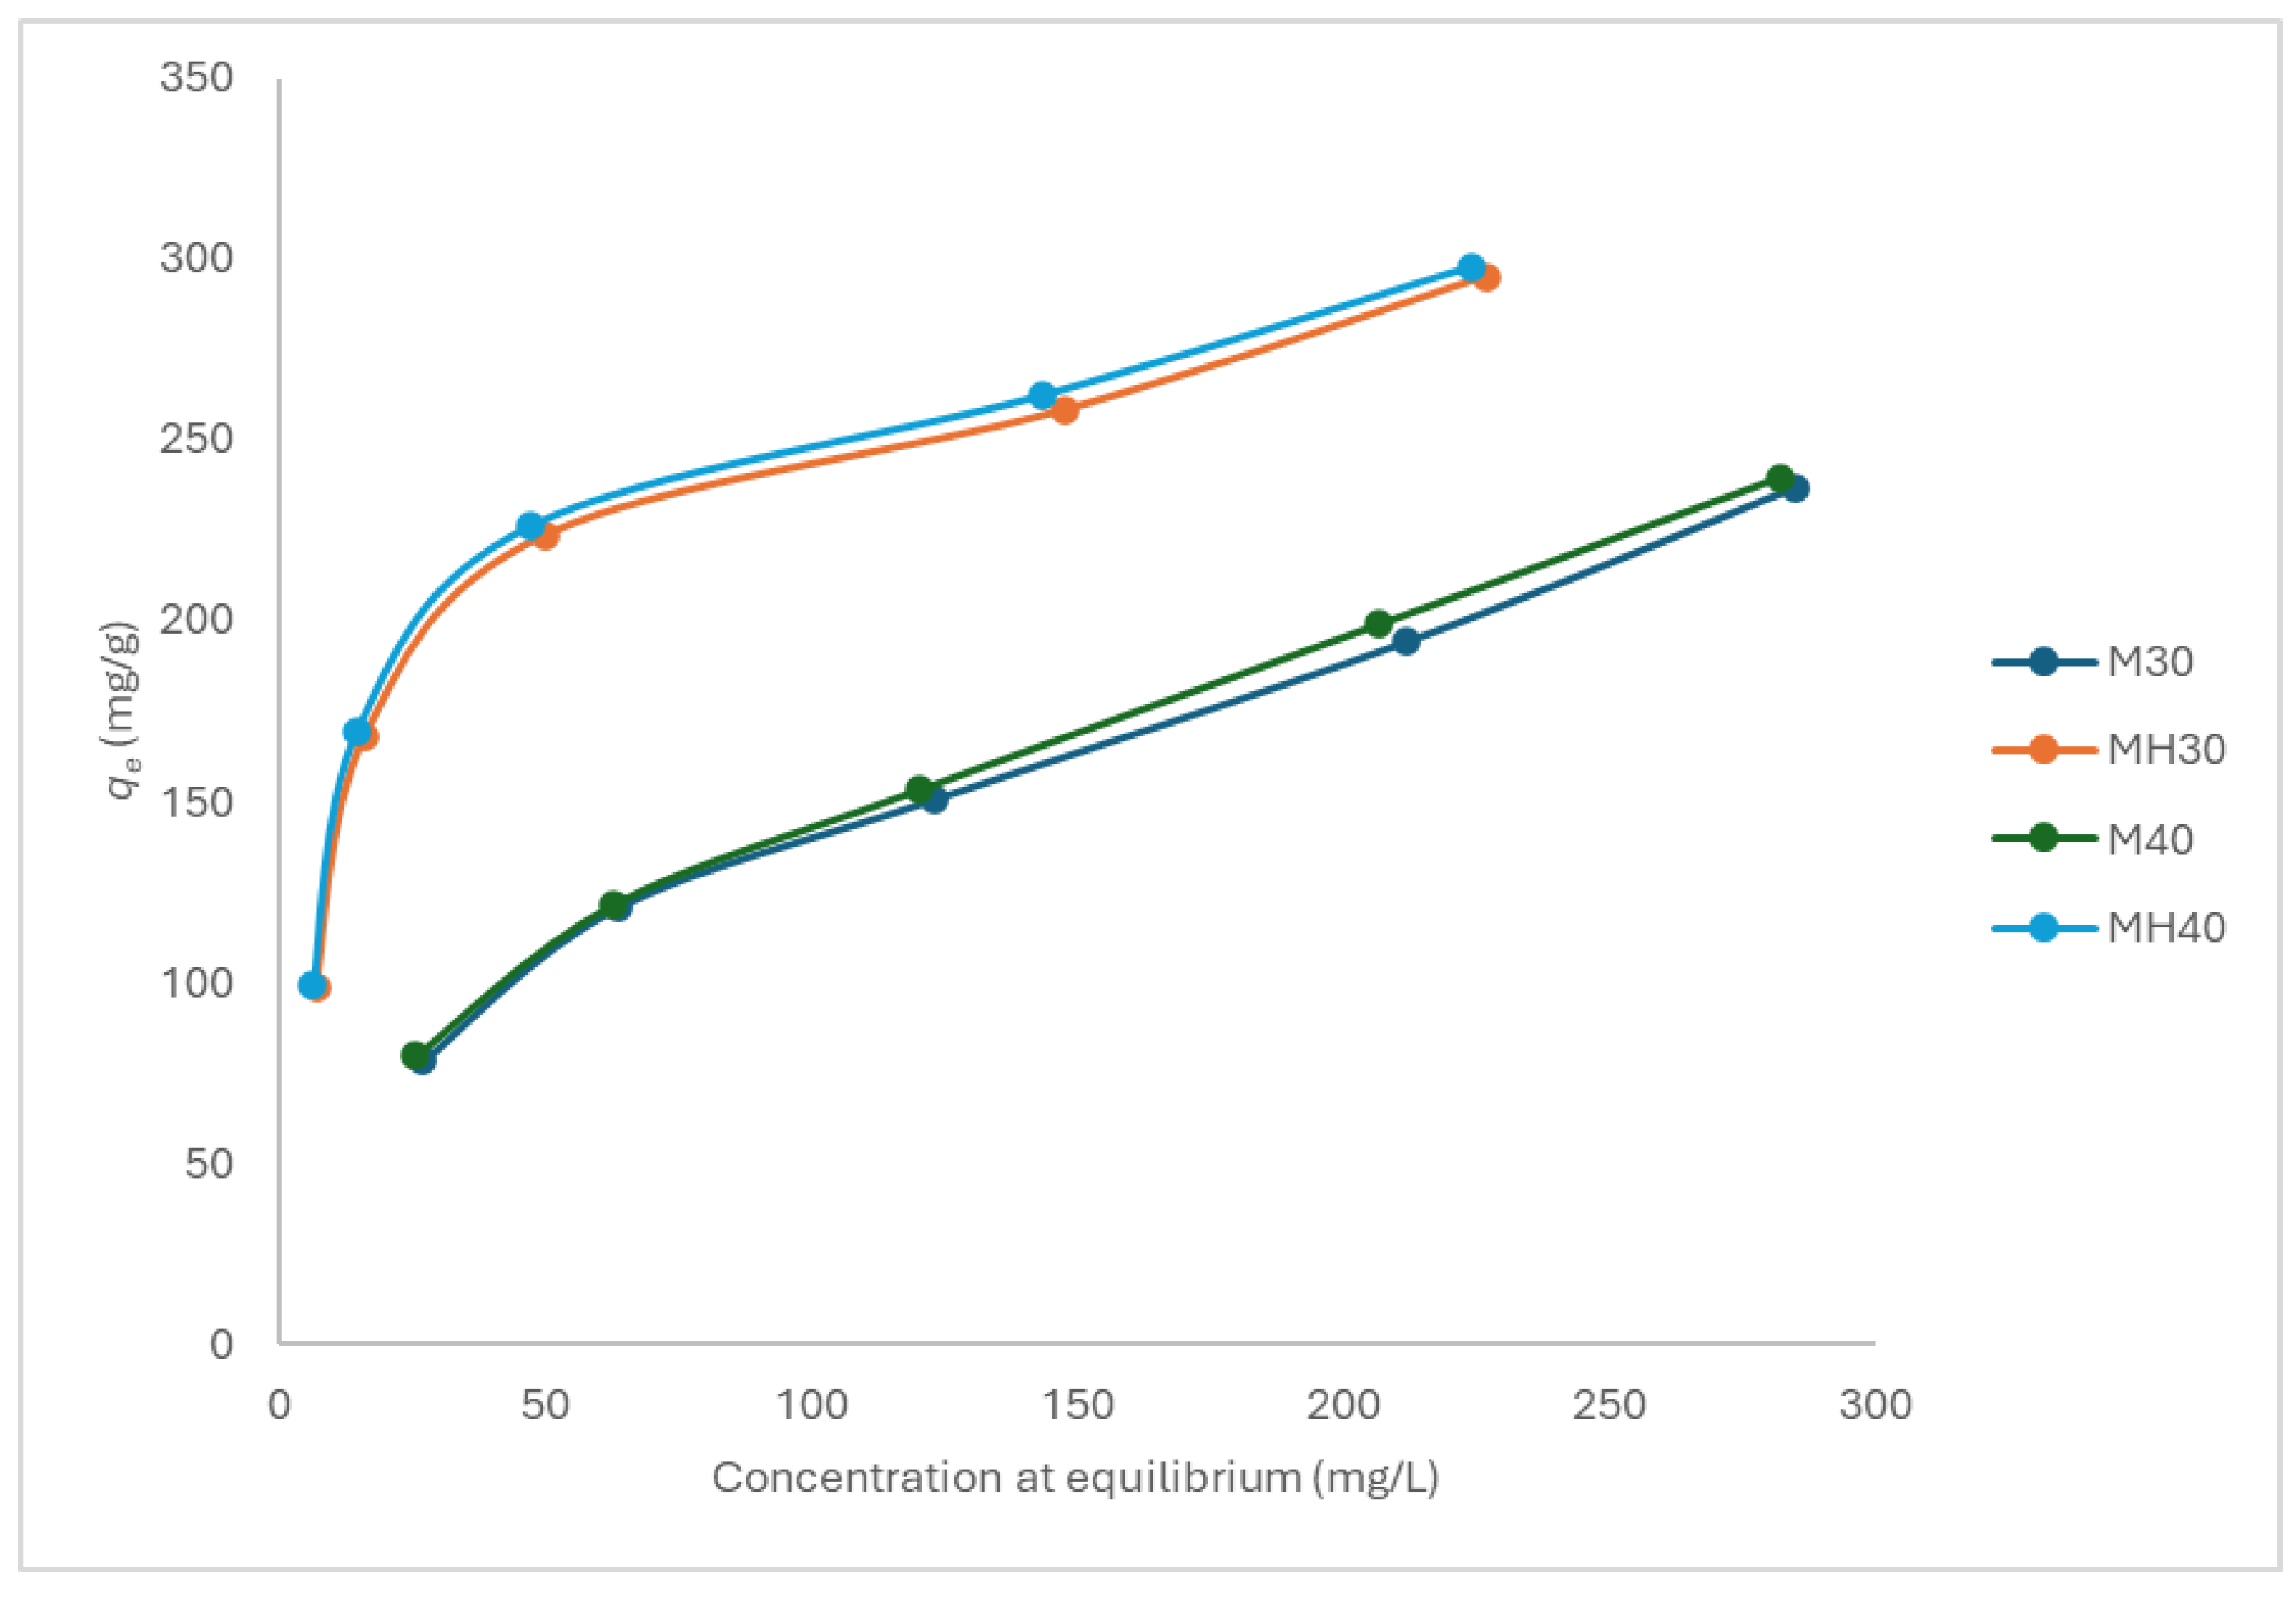
Figure 9.
Optimized geometries of APAP interaction with (a) non-oxidized (M3a) and (b) oxidized graphene (M3b).
Figure 9.
Optimized geometries of APAP interaction with (a) non-oxidized (M3a) and (b) oxidized graphene (M3b).
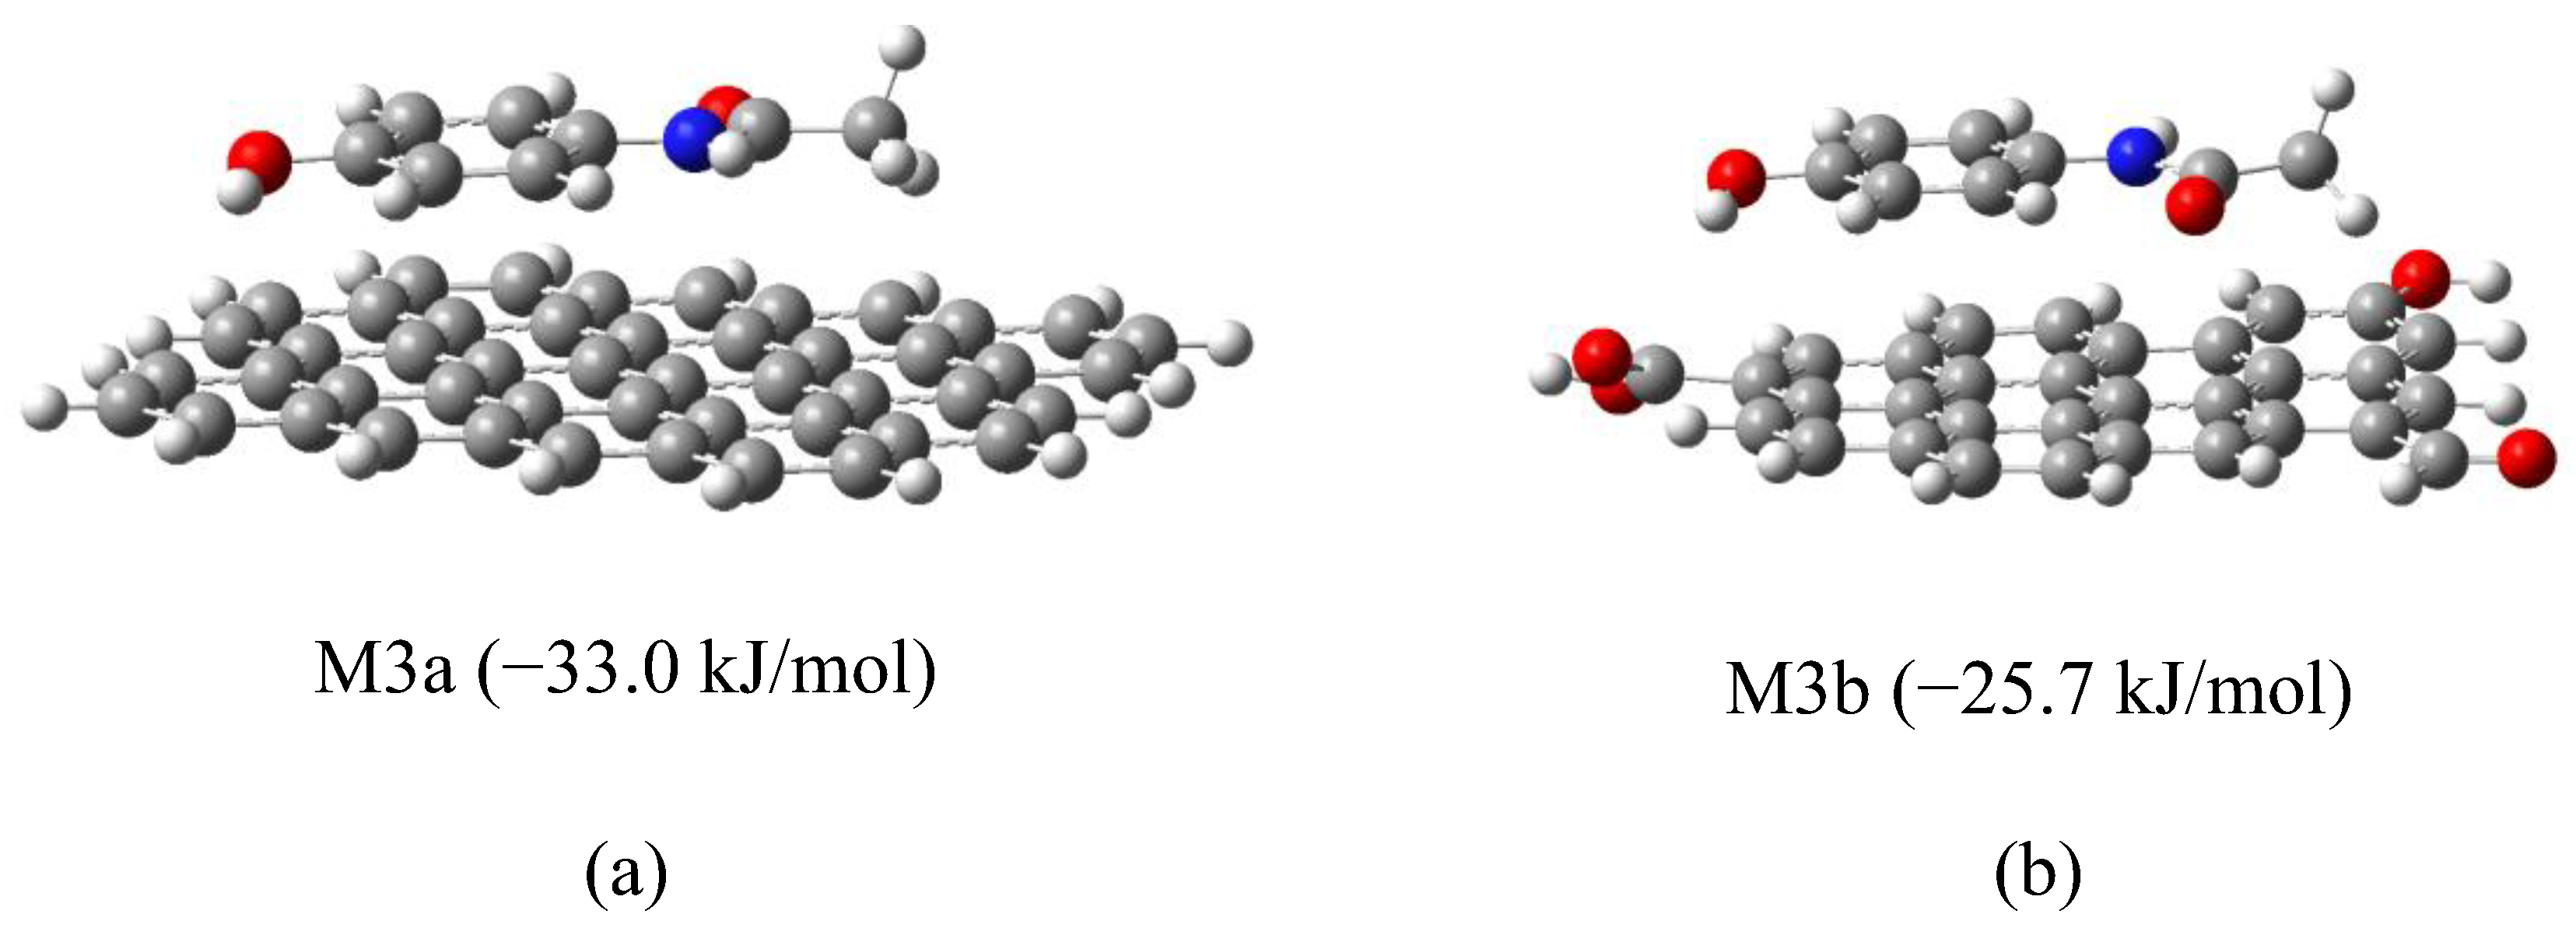
Figure 10.
Optimization trajectory of model M4-5 showing APAP shifting into π–π stacked conformation.
Figure 10.
Optimization trajectory of model M4-5 showing APAP shifting into π–π stacked conformation.
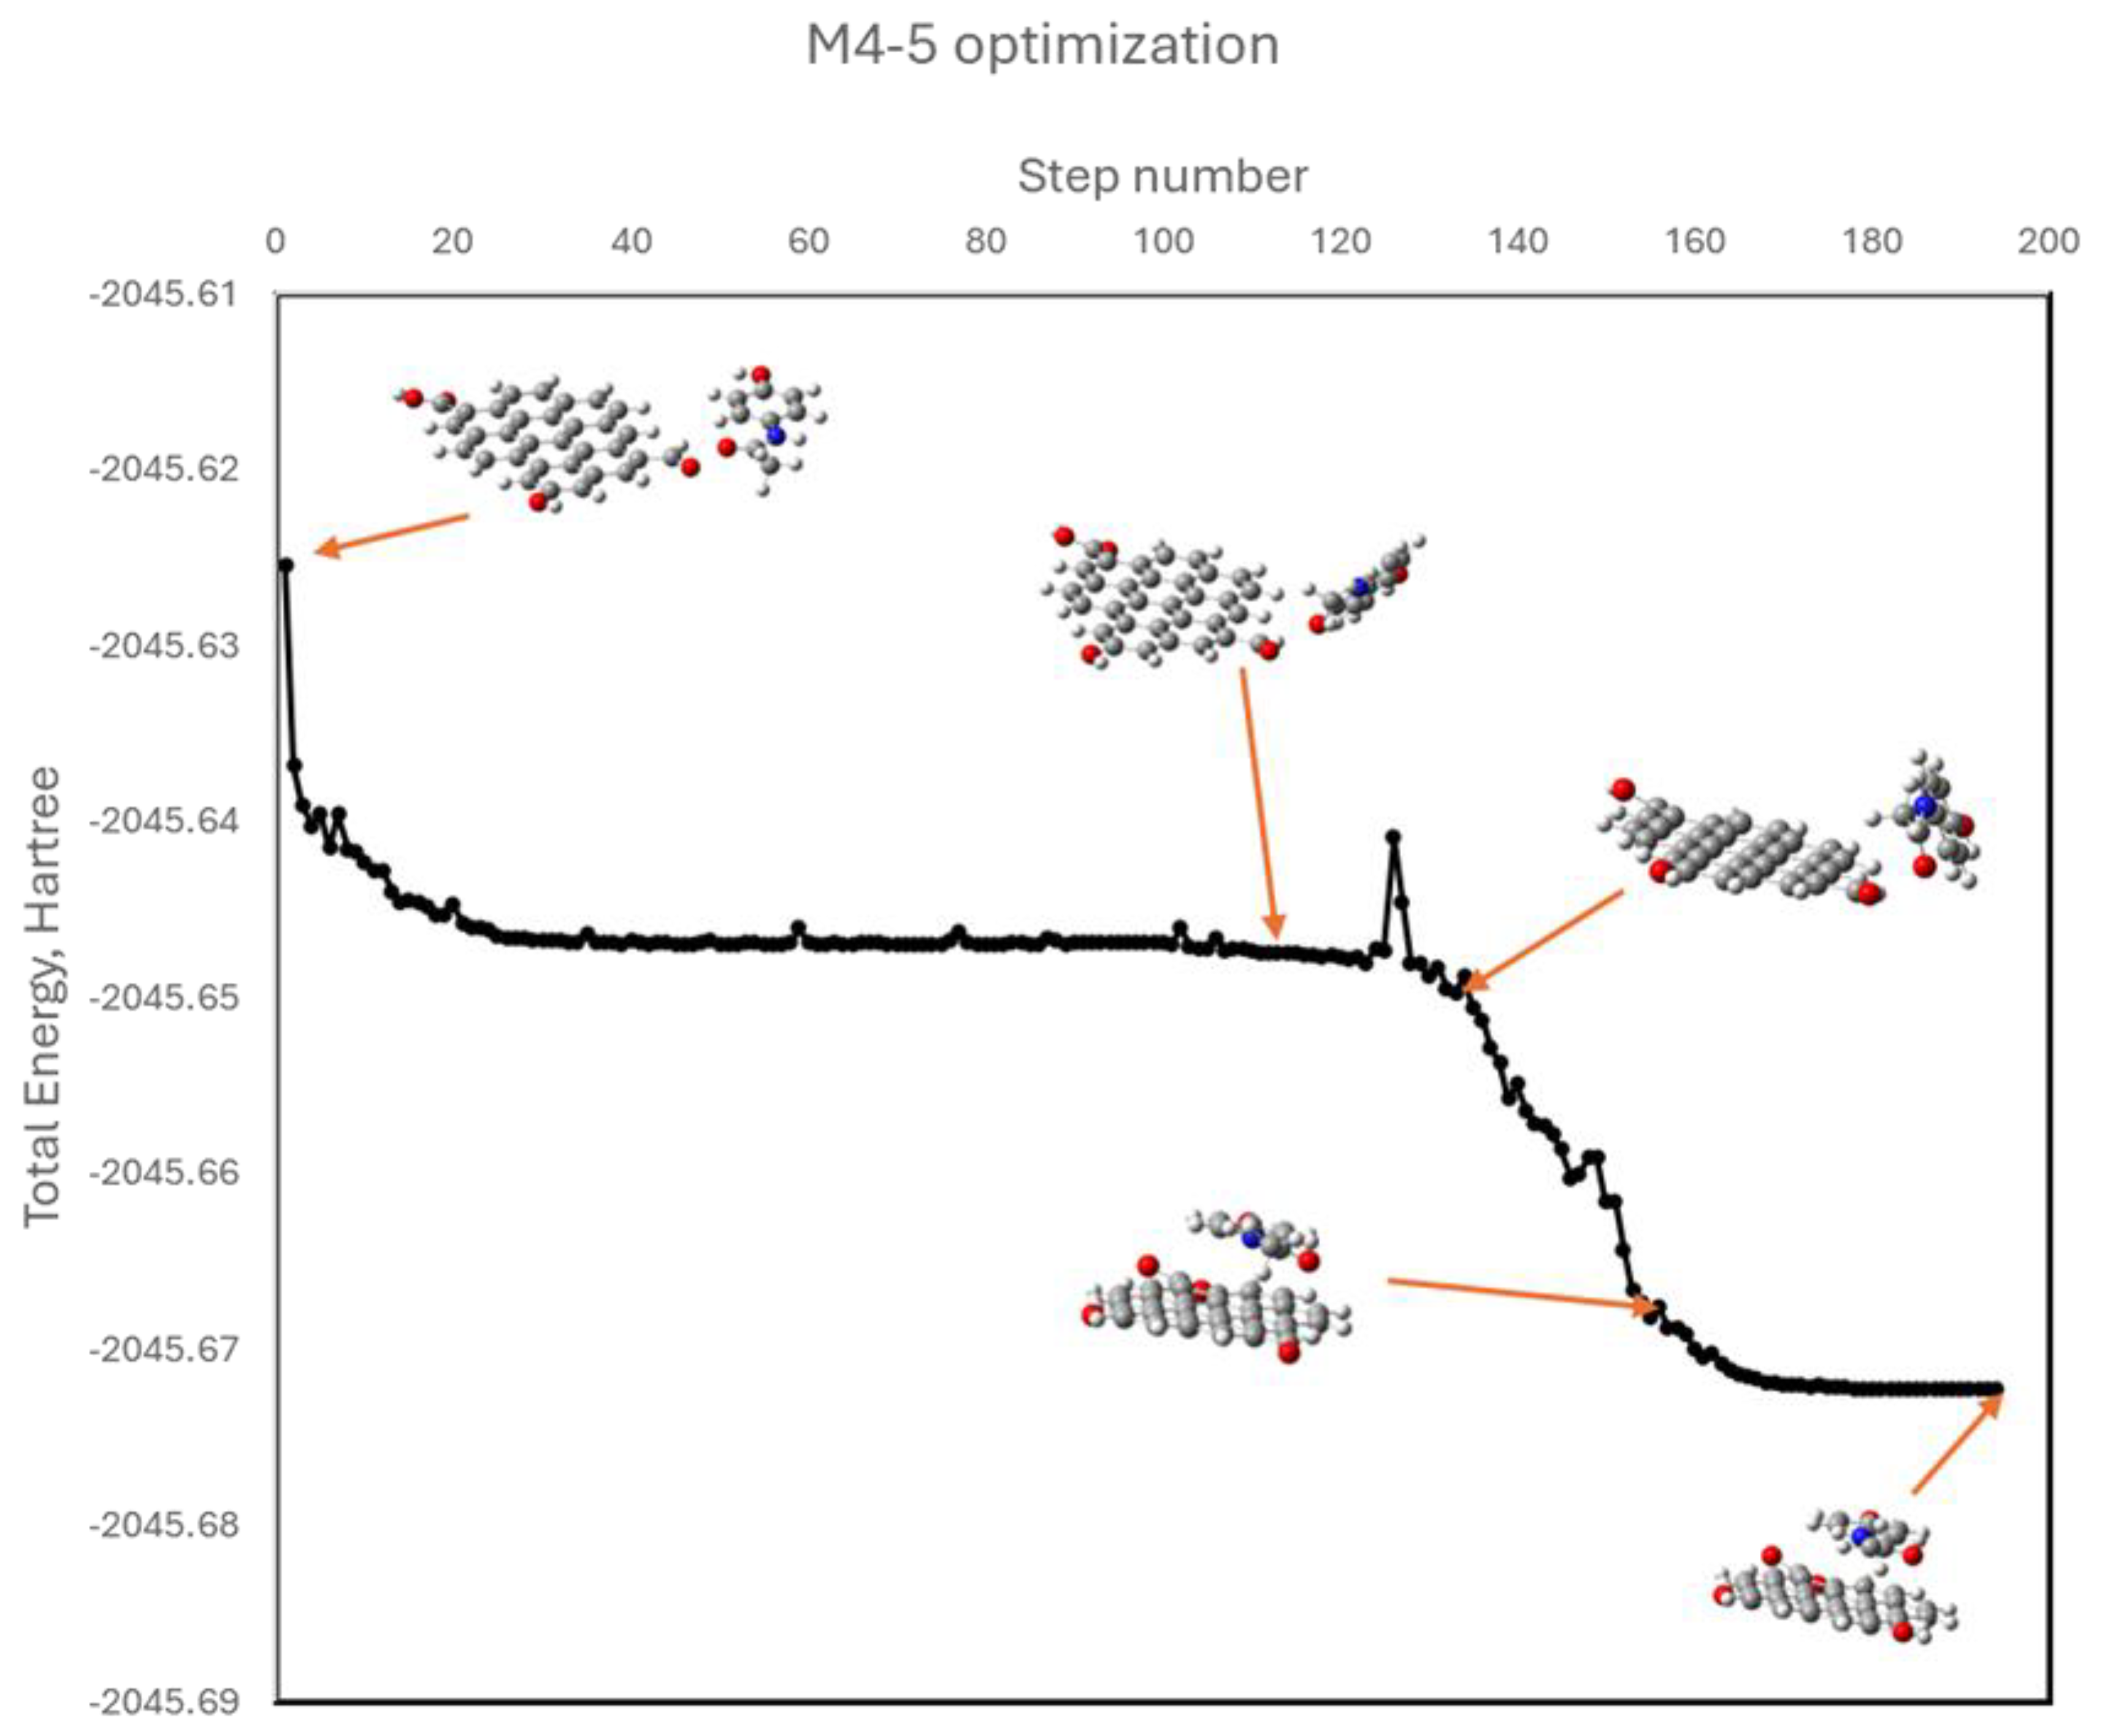
Figure 11.
Optimized geometries of APAP with oxidized graphene in models M4-1 through M4-6, with corresponding ΔG values.
Figure 11.
Optimized geometries of APAP with oxidized graphene in models M4-1 through M4-6, with corresponding ΔG values.
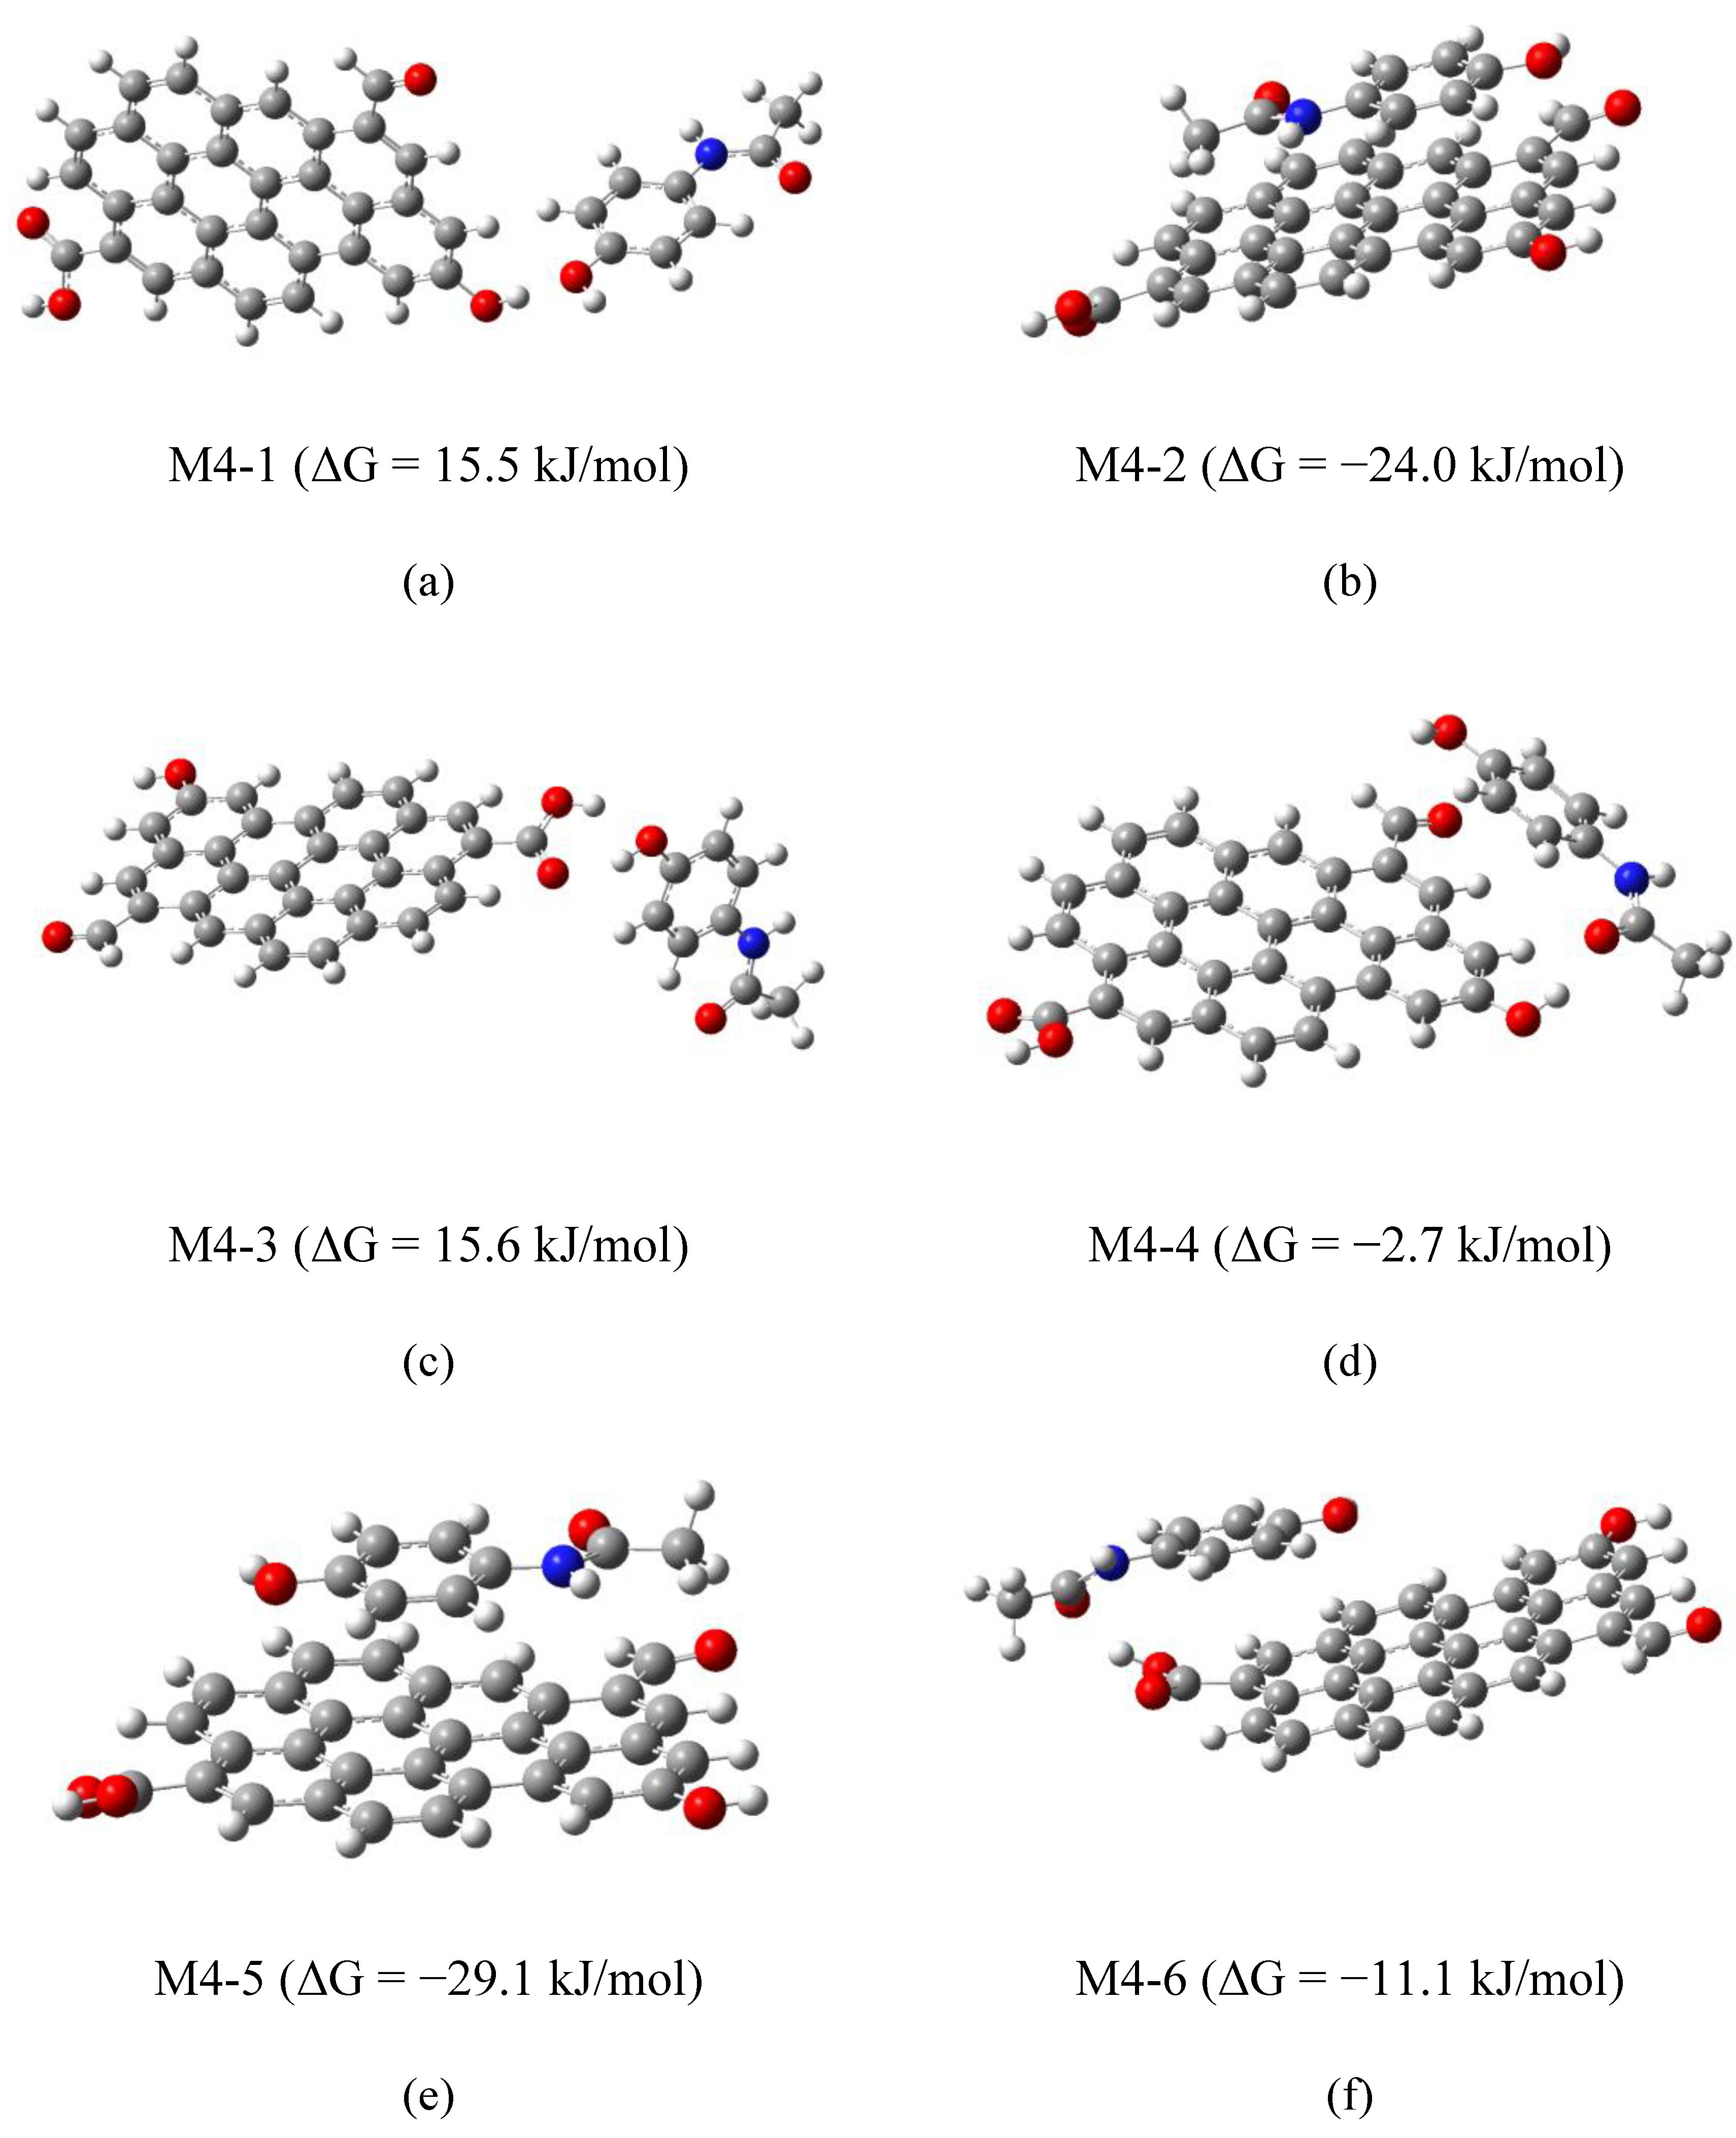

Table 1.
Proximate analysis (dry basis, wt%) of the carbon materials.
| Sample | Fixed Carbon (%) | Volatile Matter (%) | Ash (%) |
| M | 92.62 | 3.41 | 3.97 |
| MH | 90.78 | 5.13 | 4.09 |
Table 2.
Elemental composition of the organic fraction (wt%).
| Sample | C (%) | H (%) | N (%) | S (%) | O a (%) |
| M | 81.54 | 2.12 | 0.77 | 0.71 | 14.86 |
| MH | 92.17 | 0.81 | 1.33 | 0.78 | 4.90 |
a Oxygen content determined by difference.
Table 3.
Surface elemental composition (atomic %) by XPS.
| Sample | C 1s (%) | O 1s (%) | N 1s (%) | S 2p (%) | Si 2p (%) | Al 2p (%) |
| M | 94.05 | 5.01 | n.d. | 0.13 | 0.61 | 0.20 |
| MH | 94.22 | 4.12 | 0.78 | 0.30 | 0.58 | n.d. |
Table 4.
Surface elemental composition (wt%) by XPS.
| Sample | C 1s | O 1s | N 1s | S 2p | Si 2p | Al 2p |
| M | 91.36 | 6.48 | 0.00 | 0.34 | 1.39 | 0.44 |
| MH | 91.68 | 5.34 | 0.88 | 0.78 | 1.31 | 0.00 |
Table 5.
Components of the C 1s peak obtained by deconvolution.
| B.E., eV (%) | |||
| M | 284.8 (52.75 %) | 285.7 (23.95 %) | 288.6 (23.3 %) |
| MH | 284.8 (74.69 %) | 286.5 (16.2 %) | 289.6 (9.11 %) |
Table 6.
Textural properties from N₂ isotherms.
| SBET | VDR | Vme | Vtotal | |
| m2/g | cm3/g | cm3/g | cm3/g | |
| M | 839.10 | 0.336 | 0.103 | 0.448 |
| MH | 808.26 | 0.384 | 0.130 | 0.533 |
| model | BET | DR | DFT |
Table 7.
Kinetic parameters for APAP adsorption on M and MH.
| M | MH | ||||||||||||
| 30 °C | 40 °C | 30 °C | 40 °C | ||||||||||
| pH 5 | pH 6 | pH 7 | pH 5 | pH 6 | pH 7 | pH 5 | pH 6 | pH 7 | pH 5 | pH 6 | pH 7 | ||
| P-first order | qe | 28.65 | 28.44 | 29.78 | 32.34 | 28.99 | 31.06 | 29.15 | 29.64 | 30.01 | 28.67 | 28.53 | 79.97 |
| k | 0.0981 | 0.1004 | 0.0693 | 0.0702 | 0.0797 | 0.0769 | 0.0785 | 0.0758 | 0.0721 | 0.0864 | 0.0797 | 0.0267 | |
| R2 | 0.7293 | 0.7393 | 0.6019 | 0.6139 | 0.6339 | 0.6599 | 0.5487 | 0.5391 | 0.5202 | 0.5860 | 0.5446 | 0.4169 | |
| P-second order | qe | 34.01 | 33.33 | 29.41 | 34.25 | 34.13 | 31.95 | 51.02 | 50.51 | 49.50 | 52.63 | 51.55 | 50.51 |
| k | 0.1882 | 0.1882 | 0.2058 | 0.1960 | 0.2067 | 0.1781 | 0.2489 | 0.2456 | 0.2608 | 0.2413 | 0.2640 | 0.2623 | |
| R2 | 0.9976 | 0.9975 | 0.9975 | 0.9979 | 0.9983 | 0.9937 | 0.9995 | 0.9994 | 0.9996 | 0.9995 | 0.9997 | 0.9995 | |
Table 8.
Isotherm model parameters for APAP adsorption.
| Langmuir | Freundlich | |||||||
| T, °C | Carbon | pH | R2 | Sm | KL | R2 | KF | n |
| 30 | M | 7 | 0.9615 | 298.5 | 1.08·10-3 | 0.9930 | 1.96·10-3 | 0.4574 |
| 30 | MH | 7 | 0.9945 | 307.7 | 1.81·10-3 | 0.9184 | 2.13·10-6 | 0.3125 |
| 40 | M | 7 | 0.9654 | 302.1 | 1.01·10-3 | 0.9960 | 1.57·10-3 | 0.4507 |
| 40 | MH | 7 | 0.9952 | 309.6 | 1.62·10-3 | 0.9168 | 1.28·10-6 | 0.3050 |
| 30 | M | 6 | 0.9670 | 296.7 | 1.02·10-3 | 0.9903 | 1.65·10-3 | 0.4521 |
| 30 | MH | 6 | 0.9930 | 308.6 | 1.70·10-4 | 0.9100 | 1.64·10-6 | 0.3086 |
| 40 | M | 6 | 0.9676 | 294.1 | 9.25·10-4 | 0.9915 | 7.96·10-4 | 0.4276 |
| 40 | MH | 6 | 0.9951 | 311.5 | 1.49·10-4 | 0.8982 | 1.22·10-6 | 0.3055 |
| 30 | M | 5 | 0.9729 | 302.1 | 9.54·10-4 | 0.9918 | 1.60·10-3 | 0.4538 |
| 30 | MH | 5 | 0.9931 | 308.6 | 1.55·10-4 | 0.8881 | 1.87·10-6 | 0.3125 |
| 40 | M | 5 | 0.9732 | 295.0 | 8.43·10-4 | 0.9950 | 5.28·10-4 | 0.4162 |
| 40 | MH | 5 | 0.9956 | 311.5 | 1.35·10-4 | 0.8766 | 1.21·10-6 | 0.3074 |
Table 9.
Influence of initial APAP concentration on adsorption performance.
| Material | Temperature (°C) | Adsorption capacity (mg/g) | Removal efficiency (%) | ||||
| pH 5 | pH 6 | pH 7 | pH 5 | pH 6 | pH 7 | ||
| [APAP] 100 mg/L | |||||||
| M | 30 | 79.44 | 78.70 | 78.15 | 75.30 | 74.60 | 74.10 |
| 40 | 83.33 | 81.48 | 79.63 | 79.00 | 77.30 | 75.50 | |
| MH | 30 | 98.89 | 98.70 | 98.33 | 93.80 | 93.60 | 93.30 |
| 40 | 99.44 | 99.26 | 99.07 | 94.30 | 94.10 | 94.00 | |
| [APAP] 500 mg/L | |||||||
| M | 30 | 242.35 | 238.15 | 236.98 | 46.4 | 45.60 | 45.40 |
| 40 | 244.63 | 240.74 | 239.88 | 46.90 | 46.10 | 45.90 | |
| MH | 30 | 300.00 | 297.84 | 295.19 | 57.50 | 57.00 | 56.50 |
| 40 | 302.04 | 300.62 | 297.90 | 57.80 | 57.60 | 57.10 | |
Disclaimer/Publisher’s Note: The statements, opinions and data contained in all publications are solely those of the individual author(s) and contributor(s) and not of MDPI and/or the editor(s). MDPI and/or the editor(s) disclaim responsibility for any injury to people or property resulting from any ideas, methods, instructions or products referred to in the content. |
© 2025 by the authors. Licensee MDPI, Basel, Switzerland. This article is an open access article distributed under the terms and conditions of the Creative Commons Attribution (CC BY) license (https://creativecommons.org/licenses/by/4.0/).
Copyright: This open access article is published under a Creative Commons CC BY 4.0 license, which permit the free download, distribution, and reuse, provided that the author and preprint are cited in any reuse.


