Submitted:
12 September 2025
Posted:
15 September 2025
You are already at the latest version
Abstract
Machine learning-based weather forecasting models are of paramount importance for almost all sectors of human activity. However, incorrect weather forecasts can have serious consequences on a global scale. The Adamawa region of Cameroon has suffered the consequences of erroneous forecasts, resulting in enormous losses and material damage. Missing or abnormal values are one of the problems that can contribute to the inaccuracy of weather forecasting models. Our objective is to provide a systematic view of how anomalies can affect the results of weather forecasting models and to compare imputation methods such as LinearRegressor, BayesianRidge, ExtraTreeRegressor(ETR), KNeighborsRegressor(KNR), DecisionTreeRegressor, KNNImputer, and MICE. The performance criteria used to evaluate these methods are RMSE and execution time. For the dataset, we generated four datasets with a specific anomaly rate. The abnormal values were transformed into missing values. Next, all the missing values were imputed using these different imputation methods, and then compared. Finally, the cleaned data was used by Machine learning-based forecasting models to generate forecast data. The results show that the imputation of anomalies in weather data is done in a reduced time, allowing for good quality weather data while improving the accuracy of weather forecasting models.
Keywords:
machine learning
; imputation methods
; anomalies
; weather observation
; weather forecasting
; forecast weather data
; comparison
; performance
; Adamawa
; Cameroon
1. Introduction
Erroneous weather forecasts can have severe global consequences, affecting agriculture, food security, water resource management, and increasing the risk of natural disasters [8]. Regarding natural disasters, according to WMO [23], between 1970 and 2019, there were disasters that met the registration criteria, these events causing deaths and trillion in economic losses. In Africa, from 1970 to 2019; disasters claimed the lives of people and caused economic losses of billion [23].
However, the accuracy of weather forecasting models remains a major challenge [25,27,28].Missing or abnormal values are one of the problems that can contribute to the deterioration of weather forecasting model performance, leading to erroneous or inaccurate weather forecasts.
According to the WORLD BANK [24], most weather services in sub-Saharan African countries no longer meet the current needs for weather and climatic information. The data collected by these services are riddled with anomalies, which can be missing or abnormal values. Therefore, these data constitute a huge problem for weather forecasts. The origins of these anomalies are as follows: instrument failure (instrument malfunctions, insufficient maintenance, incorrect calibration) [3,5,6,30], environmental conditions (extreme conditions, physical obstacles, contamination) [6], human errors (reading errors, input errors, lack of training) [3,6], and transmission problems (interference, insufficient bandwidth, and network outages) [6,7]. Cameroon is one of the sub-Saharan countries.
The production of weather data is becoming an essential element of the development process in Cameroon [26]. According to estimates from the Department National of Meteorology (DNM) in 2014, more than 80% of the weather observation network in Cameroon is no longer used and needs to be renewed [26].
In the Adamawa region of Cameroon, there are four climate stations recognized by the DNM and the Ministry of Transport [26], among which we have the ASCENA weather station in Ngaoundere. In terms of observation means, these climate stations in the Adamaoua region face a number of problems that hinder the proper collection of weather data [26]. This includes the presence of anomalies in the weather data streams. This contributes to reducing the performance of the weather forecasting models in the weather forecasting systems.
Weather forecasting systems involve data collection, processing, storage, and analysis [21]. Data collection and processing are carried out using a weather station. The databases contained in the weather forecasting systems include observed and forecasted weather data. Forecast models use observed weather data to generate forecast data.
Several weather forecasting models have been proposed, including some based on machine learning. However, the presence of missing or abnormal values in weather data streams poses a major challenge to the accuracy of these models. Indeed, the presence of these values in the weather data stream can make weather forecasts inaccurate [3,38]. According to (Alejandro et al., 2022) [8], machine learning-based weather forecasting models that are deployed in a real environment can become inaccurate due to the presence of anomalies in weather data streams. This argument was supported by (Ajina et al., 2023) [16], (Ravi et al., 2022) [18] , and (Zhang et al., 2020) [19] when they stated that the presence of missing and abnormal values in weather data streams can make forecast weather data inaccurate. Thus, (Heinrigs, 2020) [20] believes that improving the accuracy of forecasts requires the availability of high-quality observational data. In the context of our work, missing and abnormal values are considered anomalies.
Our objective is to provide a systematic view of how anomalies can affect the results of weather forecasting models and to compare imputation methods such as LinearRegressor (LR) [10,12], BayesianRidge (BR) [10], ExtraTreeRegressor(ETR) [10,12], KNeighborsRegressor(KNR), DecisionTreeRegressor (DTR) [10,12], KNNImputer (KNNI) [13,15], and MICE [8,13]. The performance criteria used to evaluate these methods are the RMSE and execution time. For the dataset, we generated four datasets with a specific anomaly rate. The abnormal values were transformed into missing values. And subsequently, all the missing values were imputed by these different imputation methods and then compared. So, the data cleaned using the best imputation method in terms of accuracy was used by our various machine learning-based weather forecasting models to produce forecast data in order to select the weather forecasting model best suited to the cleaned data. Subsequently, we will propose an architecture for a weather forecasting system equipped with a Real-Time Anomaly Detection and Correction Module. And finally, we will also propose a Real-Time Anomaly Detection and Correction Algorithm.
The structure of our research work is organised as follows. Section 2 presents related works. In this section, we will discuss the role of weather stations and then address the management of anomalies in the weather forecasting systems proposed by the authors. Section 3 presents the study area and the weather data used in this research work. The methodological framework used in our work, the anomalies in the weather data, the imputation methods used, the ML-based weather forecasting models for performing real-time weather forecast simulations from data cleaned by the ETR imputation method, the evaluation metrics and the tools used are presented in the Section 4. Section 5 presents the results of this research work. The Section 6 presents the discussion of this research work. Conclusion and Futur work of our research work is made in Section 7.
2. Related Work
Meteorology is the interdisciplinary science of atmospheric physics, which studies the state of the weather, the atmospheric environment, the phenomena produced, and the laws that govern them [29]. The process of measuring the weather is directly linked to the establishment of weather stations.
2.1. Weather Station
The weather station is an example of how science and technology are applied to understand and forecast local weather conditions [30,34]. For the purpose of understanding and forecasting the weather in a region, the weather station is used to collect quantitative data on the local weather [34]. Figure 1 shows a weather station with its various components.
Observation data sets are essential in the weather forecasting process, as they provide a stream of information describing the current state of the atmosphere [32]. The collected data may be in raw form that cannot be directly entered into the forecasting models [35], as they may contain missing or abnormal values that are considered anomalies [35].
2.2. Anomalies In Weather Observation Data
With the rapid development of automatic data collection via the weather station, the problem of anomalies has become a considerable problem. The weather data observed from the weather sensors are not entirely credible [3]. Min-Ki et al. [3] mention that there are many anomalies in the weather data due to multiple defects in the weather forecasting systems. The origins of these anomalies are as follows: instrument failure [3,5,6,30], environmental conditions [6], human errors [3,6], and transmission problems [6,7].
In most weather stations, the data logger is usually configured to encode the missing sensor reading as an ‘impossible value’, usually a large negative value such as -999 [9]. Most often, different ‘impossible values’ are used to encode different problems; that is, a value of -998 may indicate an offline sensor, while a value of -999 may encode a currently uninstalled sensor [9]. Anomalies can be either abnormal values (-999, -998) or missing values (NaN) present in weather observation data. However, these values disrupt weather forecasting models and degrade their performance.
The presence of anomalies can lead to biased estimates and misinterpretation of results [5]. The presence of anomalies makes the weather forecast data imprecise [3,38] and negatively affects the performance of the forecast models [3,19,38]. Similarly, Ravi et al. [18] state that these values are bad for machine learning models which can reduce the accuracy of weather models, leading to less reliable forecasts.
Weather forecast errors or inaccurate predictive data can lead to poor decision-making, crop failures, air crashes due to inappropriate weather phenomena, families, illness, industrial bankruptcies, unemployment, and so on.
The management of these anomalies is crucial to ensure the continuity of observations and their use in weather forecasting. So, to ensure good accuracy of machine learning-based weather forecasting models, the observation data streams must be cleaned [36]. Accurate forecasts are an important element [37]. Therefore, it is necessary to refine the flow of real-time weather observation data to obtain more accurate weather forecasts [38].
The following section will address the different approaches to minimizing anomalies in the weather data streams proposed by the authors.
2.3. Weather Forecasting Systems Based on Machine Learning
In the field of real-time weather forecasting, we have two categories of authors who have proposed weather forecasting systems whose weather forecasting models are based on ML. The first category of authors proposes weather forecasting systems that do not take anomaly management into account. The second category proposes weather forecasting systems that take into account anomaly management. Their management is based on the detection and removal of anomalies in real time.
Regarding the first category, several authors have proposed weather forecasting systems that do not take into account anomaly management. (Goncalo et al., 2015) [39] proposed an intelligent weather station that collected data on temperature, humidity, and solar radiation. The data collected was stored and then routed to the ANN-based weather forecasting model to predict the temperature in real time. According to their results, the accuracy of their model gave an RMSE of . (Kothapalli and Totad, 2017) [40] proposed a forecasting system that allows real-time weather forecasting. Their system collected temperature and humidity data. The data collected was stored and then routed to the ANN-based weather forecasting model to predict these two weather parameters. However, the accuracy of their weather forecasting model was not mentioned. (Parashar, 2018) [41] proposed a real-time weather forecasting system. Their system allowed for the collection of temperature, humidity, and atmospheric pressure data. The data collected was stored and then sent to the MLR-based weather forecasting model to predict the temperature. According to their results, the accuracy of their model gave an RMSE of 1.35. (Pradeep et al., 2020) [42] proposed a weather forecasting system that allows the collection of weather data. These data are transferred to the cloud via GSM. The data transferred are then routed to the forecasting model based on the TCN (Temporal Convolutional Neural) to perform real-time weather forecasting. According to their results, the accuracy of their forecasting model gave an MSE of 2.048. However, the systems proposed by the first category of authors do not take anomaly management into account. But the second category of authors takes into account the management of anomalies present in the observation data.
Several authors have proposed approaches for handling anomalies in weather data streams. This management is based solely on the detection and removal of anomalies in real time. (Masoud and Tao, 2020) [43] proposed an approach to detect anomalies (missing and incorrect values) in temperature. The detected anomalies are removed. Subsequently, the processed temperature data are used by the linear regression (LR) weather forecasting model. The accuracy of their forecasting model gave an MAE of 2.74. (Shruti et al., 2021) [44] proposed an approach to detect abnormal events present in real-time weather data and eliminate them. (Kaya et al., 2023) [37] proposed an approach to detect anomalies in real-time weather data streams. The objective of their study is to identify inaccurate data in a stream of weather data and then remove them. (Adela et al., 2024) [45] used isolation forests and autoencoders to identify anomalies in the data recorded during the period 2009-2023. However, anomaly detection was performed on historical data and not in real time. However, all anomaly management approaches proposed by the authors of the second category are based solely on the detection and removal of anomalies without imputing them. Nonetheless, Little and Rubin’s authors [49] have shown the limitations of deletion by proving that the removal or deletion of these anomalies leads to a loss of information, contributing to the inaccuracy of the forecasting models.
Figure 2 summarizes the two categories of authors who have proposed real-time weather forecasting systems. This figure illustrates the limitations or shortcomings of their systems that could bias weather forecast data.
It is therefore important to impute the anomalies present in the weather data streams in order to obtain high-quality forecast data generated by our weather forecasting models [50]. According to (Bruyant et al., 2023) [52], data imputation helps prevent data loss and improves the quality of forecast data generated by forecasting models.
3. Study Area And Weather Data
3.1. Study Area
The study area in the Adamawa region of Cameroon is located on the Adamawa plateau, characterized by its altitude and its high-altitude Sudano-Sahelian climate [46]. The Adamawa Plateau is located between 1000 m and 2000 m in altitude [46]. This region is a mountainous area that marks the transition between the forested Cameroon to the south and the savannas to the North. It borders Nigeria to the West and the Central African Republic (CAR) to the East [46,47,48]. With an area of [46]. It is covered by the humid tropical highland climate, also known as the highland Sudanese climate, which generally extends between and N in Cameroon [46,48]. There are two well-contrasted seasons of almost equal duration (06 months) but varying depending on the stations [46]. The rainy season generally extends from March to September-October, while the dry season runs from October-November to February. Due to its high altitude, Adamawa enjoys a "temperate" climate [46]. The temperatures are generally quite low, with an annual average of around [46,48]. The minimum temperature is [46]. It is recorded around December-January which then experiences cold nights [46]. On the other hand, the maximum temperature is recorded in March, which corresponds to the end of the dry season [46,48]. The map of our study area is shown in Figure 3.
3.2. Weather Data
The simulation is based on the weather data for the city of Ngaoundéré. In fact, Ngaoundéré is the capital of the Adamawa Region of Cameroon. In step 1 of our methodological framework presented in section 3.2, we used five weather parameters (temperature, air humidity, dew point, precipitation, and atmospheric pressure), while in steps 2 and 3, we only used the temperature parameter. The table below presents the different weather parameters.

Table 1.
Weather parameters.
| Weather Parameters | Symbols | Units |
|---|---|---|
| Temperature | T2M | Celsius |
| Relative humidity | R2HM | Percentage |
| Precipitation | PRECTOTCORR | millimetre |
| Dew point | T2MDEW | Farenheit |
| Air pressure | PS | Hectopascals |
4. Methods And Tools
4.1. Methodological Framework
In this section, we present the methodological framework of our work. Our methodological framework consists of five steps of our work :
- -
- Step 1 : Comparison of the forecast data predicted by the LSTM model, using the uncleaned data stream as input on one hand and the cleaned data stream on the other hand. This step shows how the forecasting model becomes inaccurate when the data stream contains anomalies. Figure 5 describes step 1;
- -
- Step 2 : Comparison of different allocation methods. Performance evaluation metrics are based on accuracy and execution time. Figure 6 illustrates the process of comparing different imputation methods;
- -
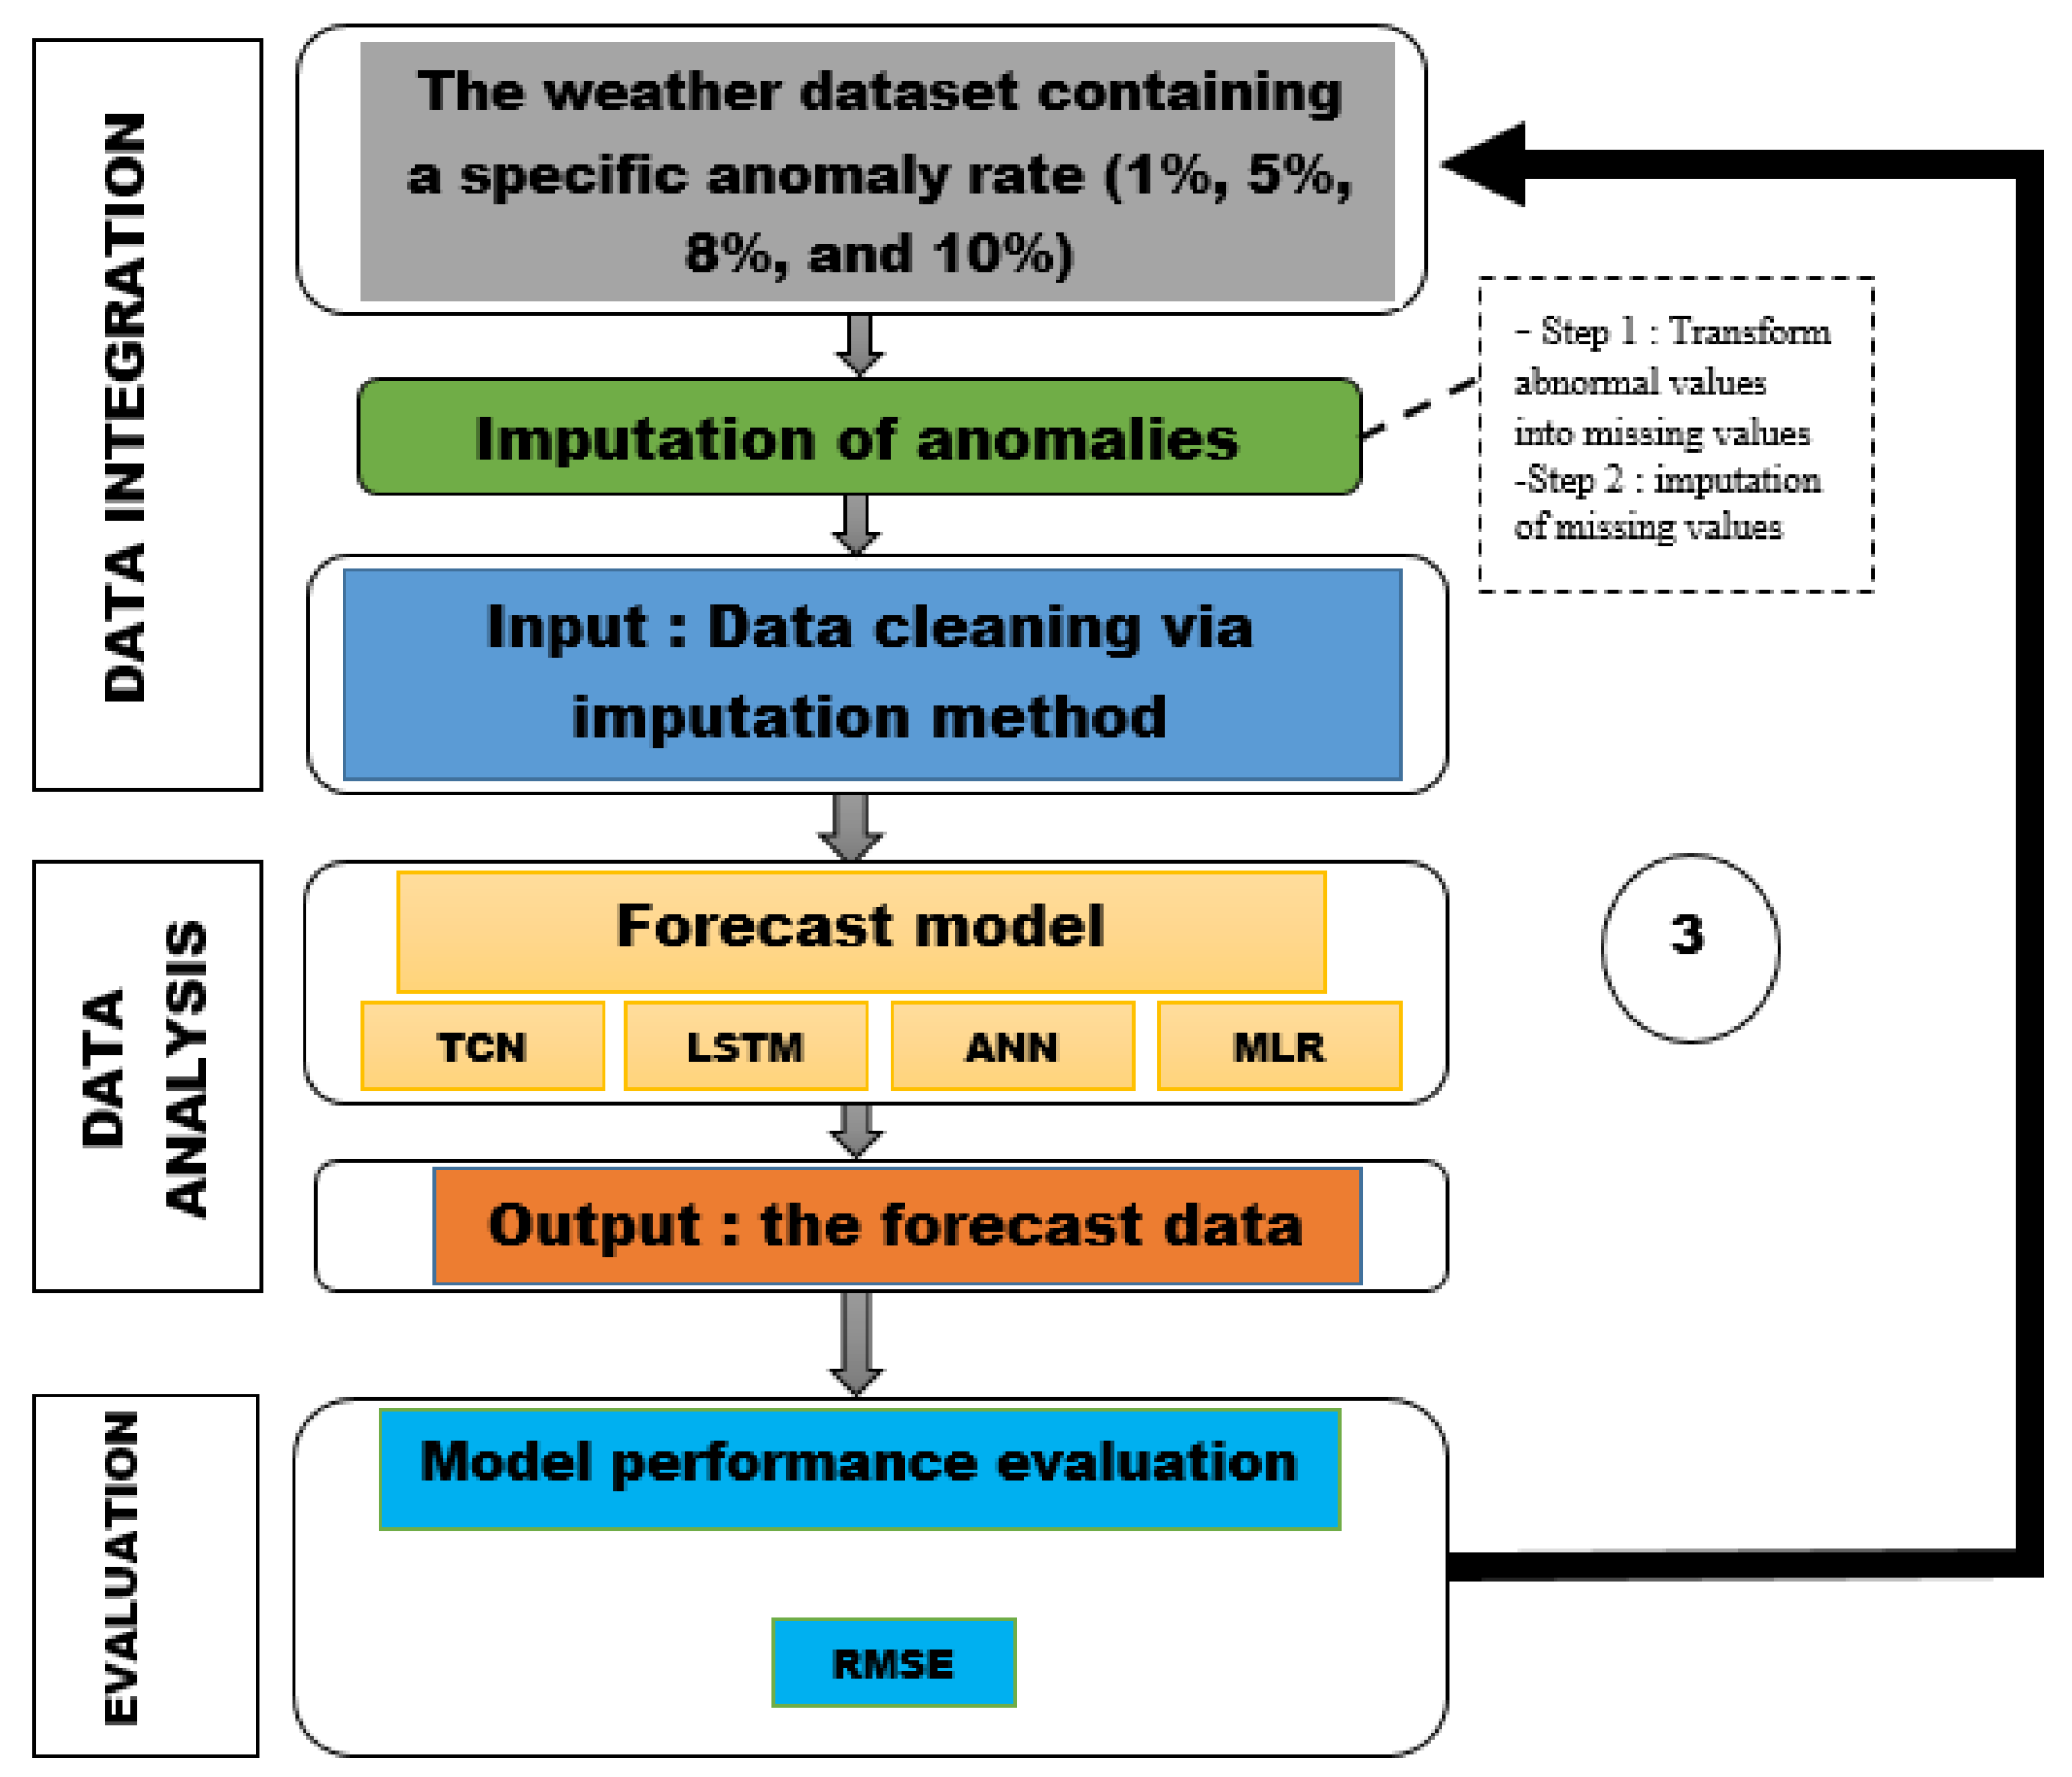
- Step 3 : Forecast using our various models on data cleaned using the ETR imputation method, which previously had a specific anomaly rate (see Figure 7);
- -
- Step 4 : Proposal for an Architecture of a Forecasting System;
- -
- Step 5 : Proposal of a Real-Time Anomaly Detection and Correction Algorithm in a Weather Forecasting System.
Figure 4 illustrates our methodological framework.
Figure 4.
Proposal Design.
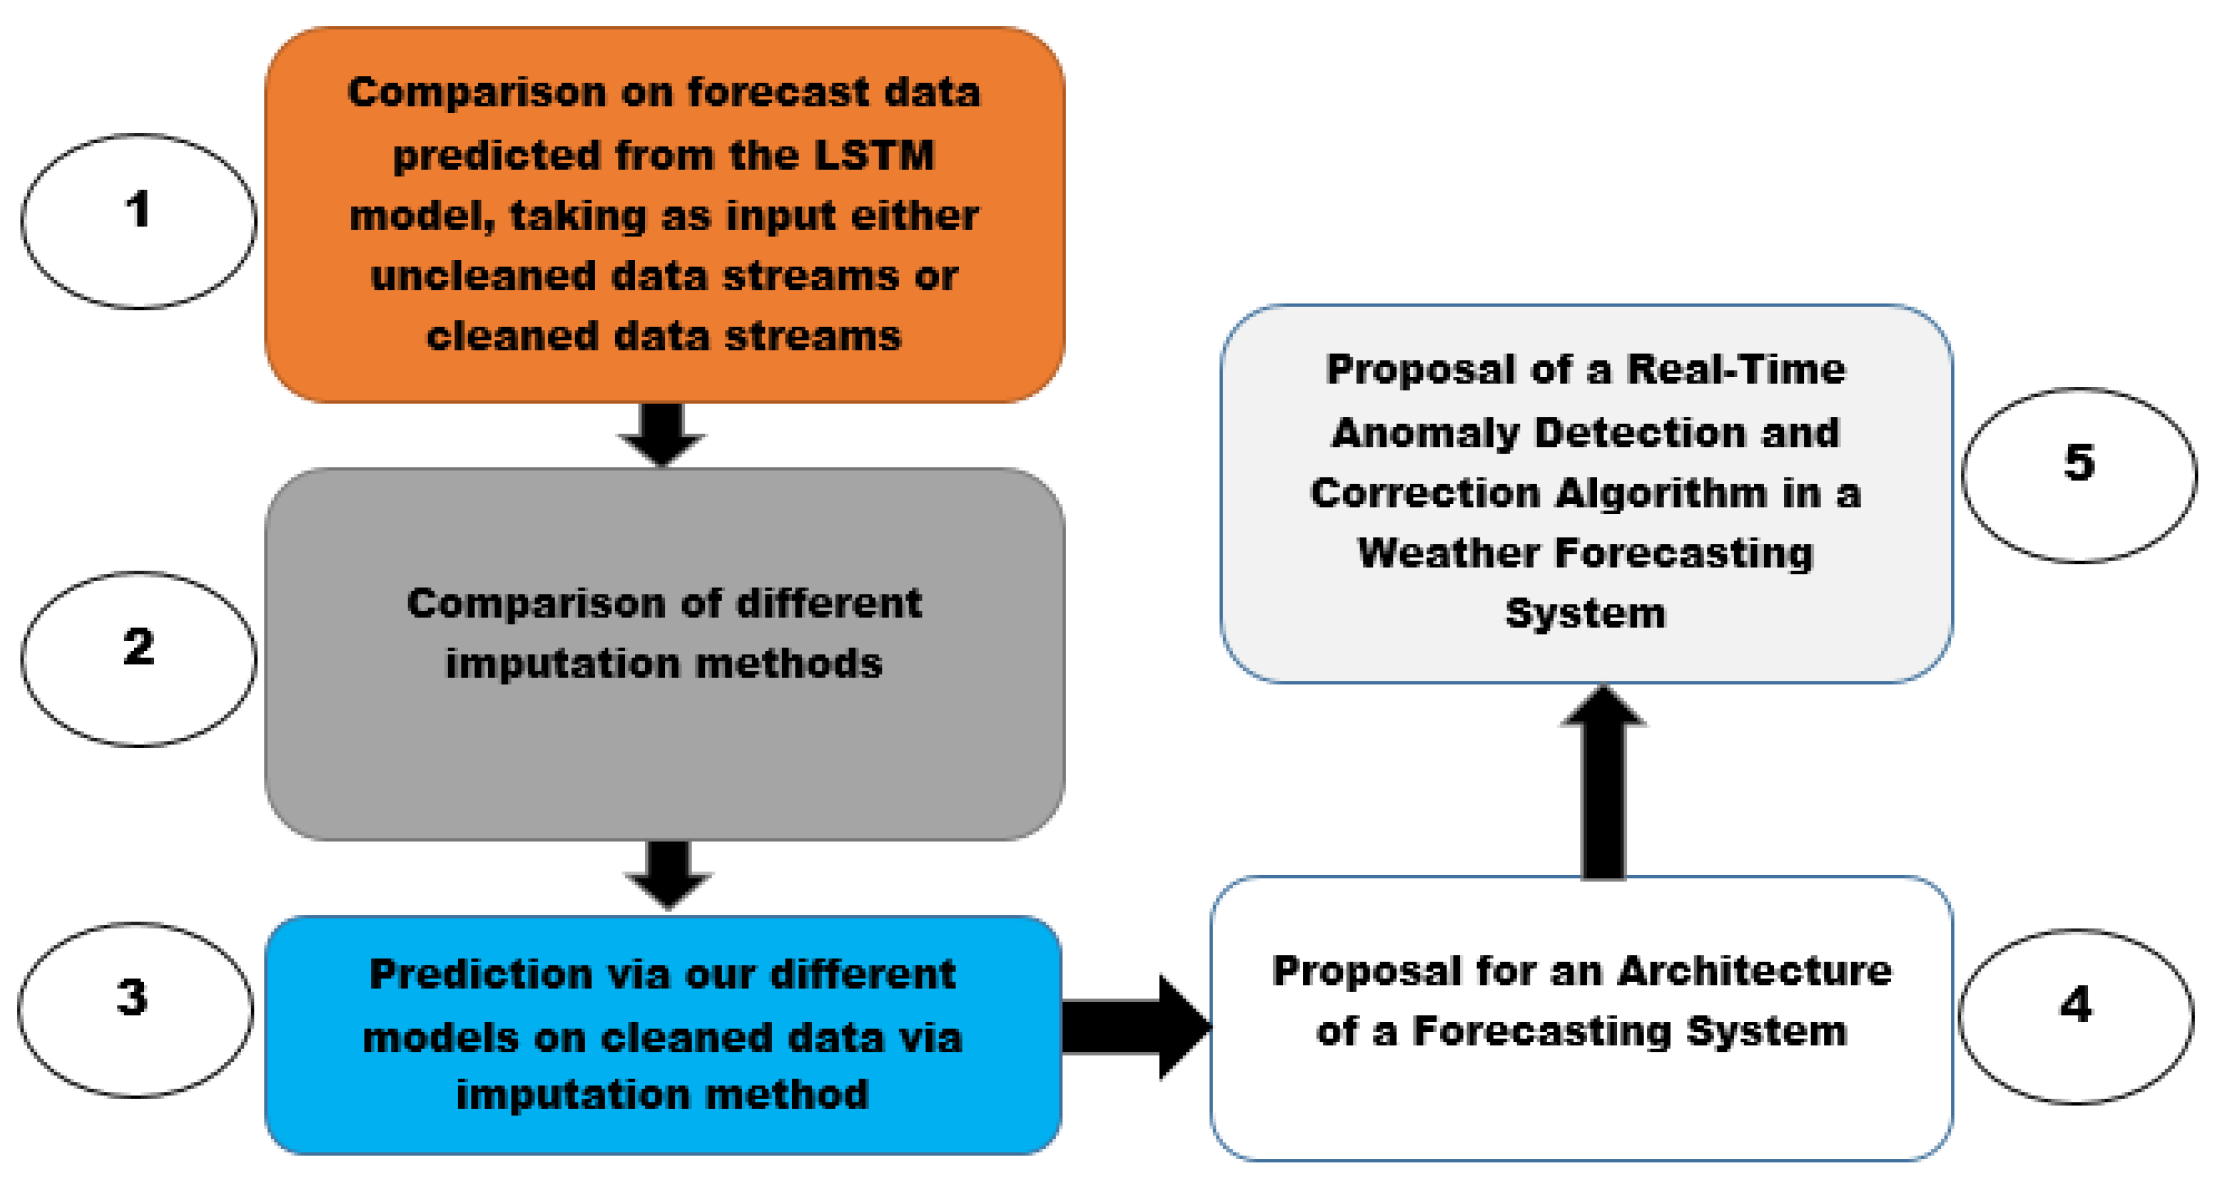
Figure 5.
Prediction via LSTM model taking data streams as input (uncleaned and cleaned).
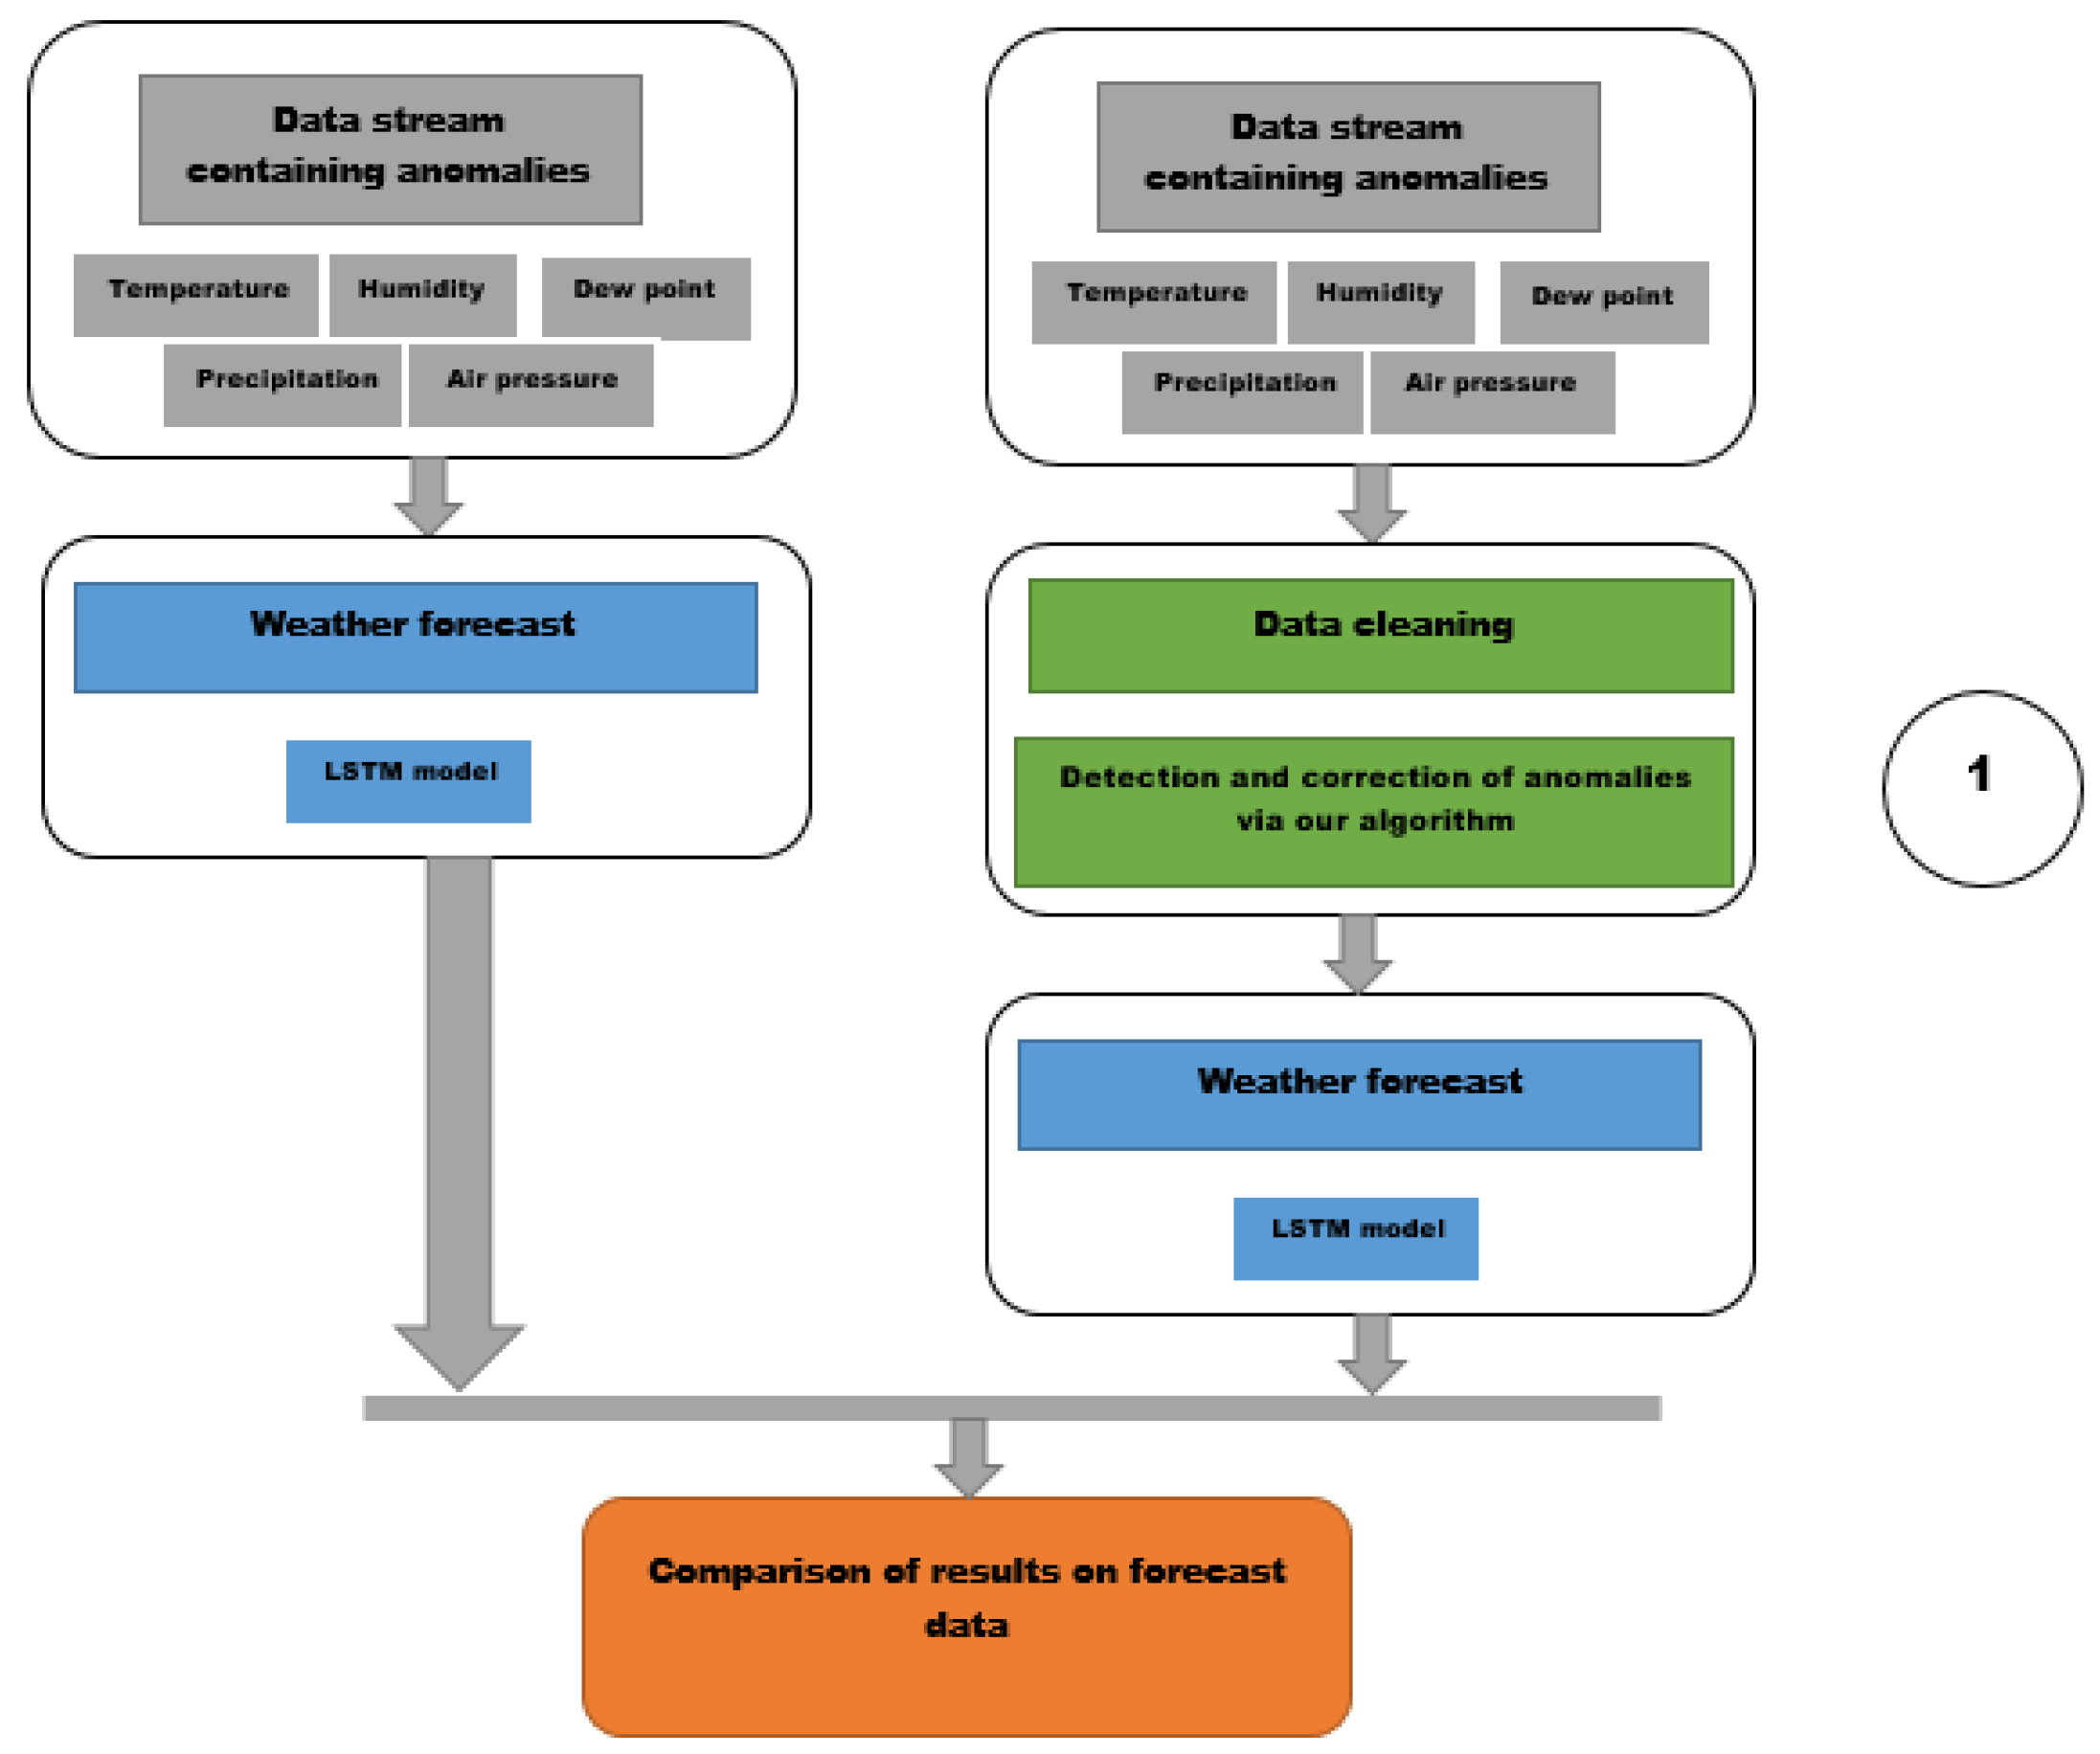
Figure 6.
Selection of the best imputaion model.
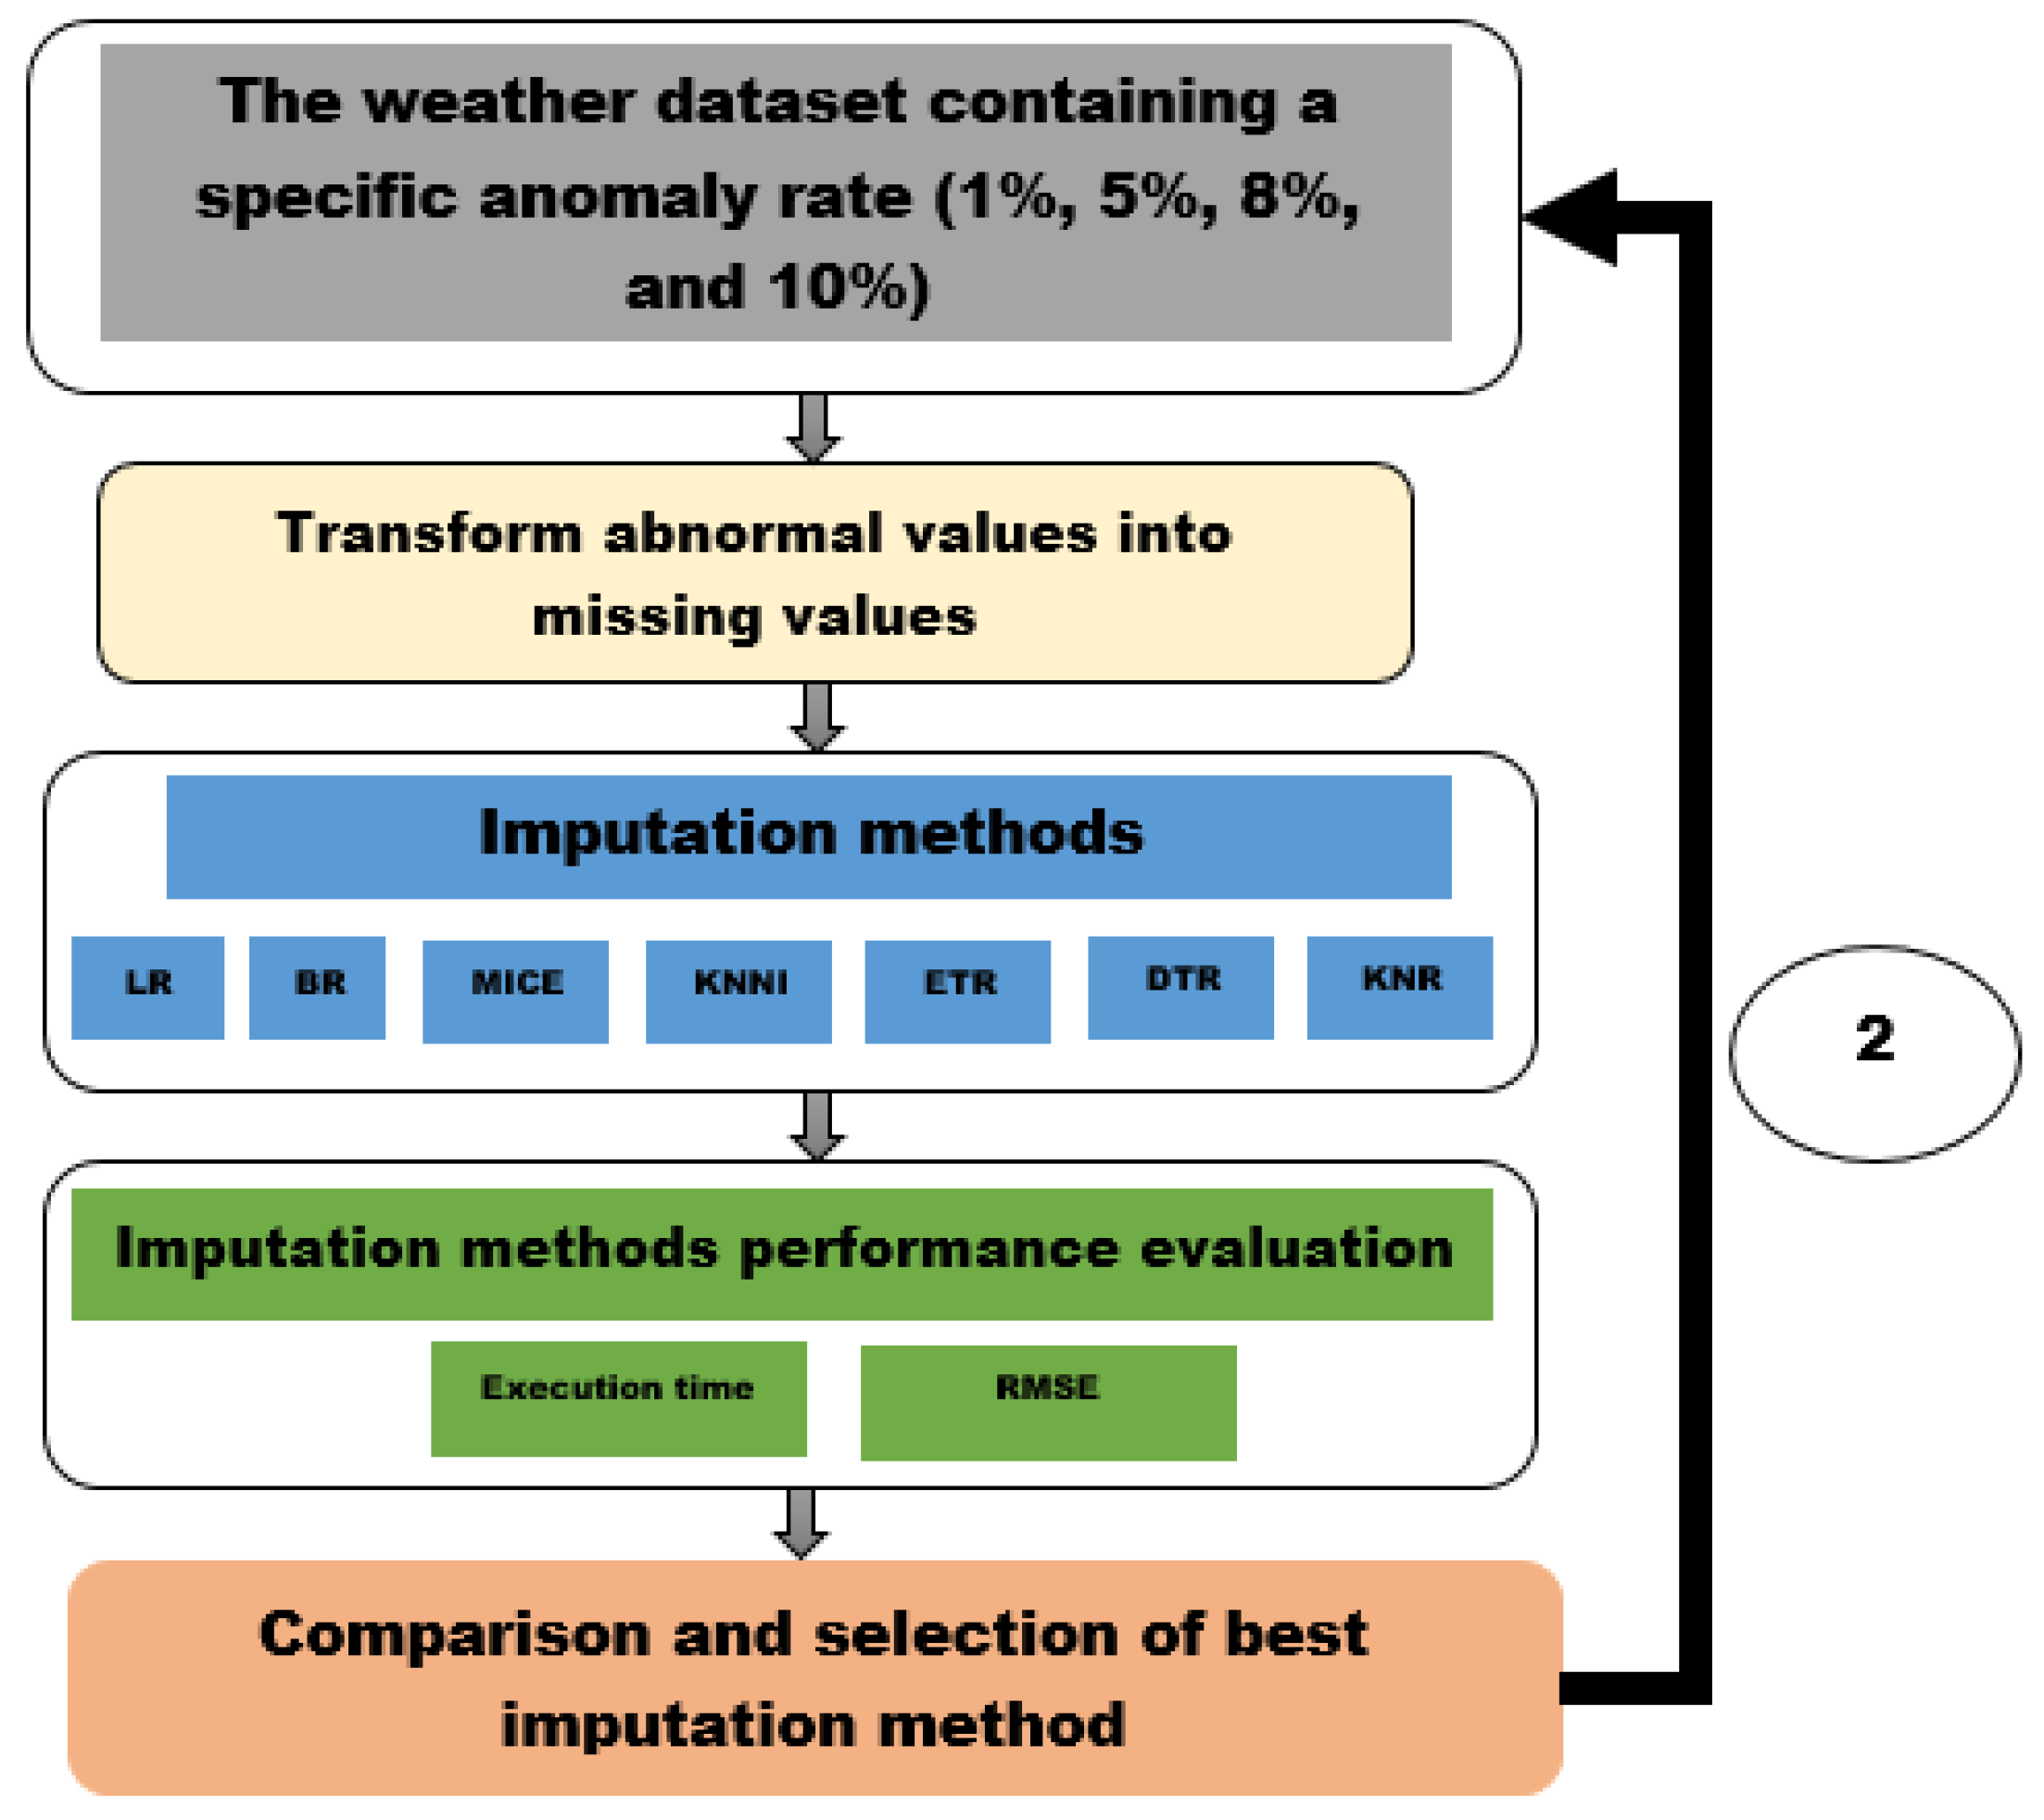
Figure 7.
Prediction via our different forecasting models on cleaned data via imputation method.
4.2. Anomalies in Weather Data
In this study, we randomly included artificial anomalies using a computer program we designed, namely missing values (NaN) and abnormal values (-999, -998). These anomalies are used to evaluate existing imputation models.
Figure 8.
Unprocessed data flows.
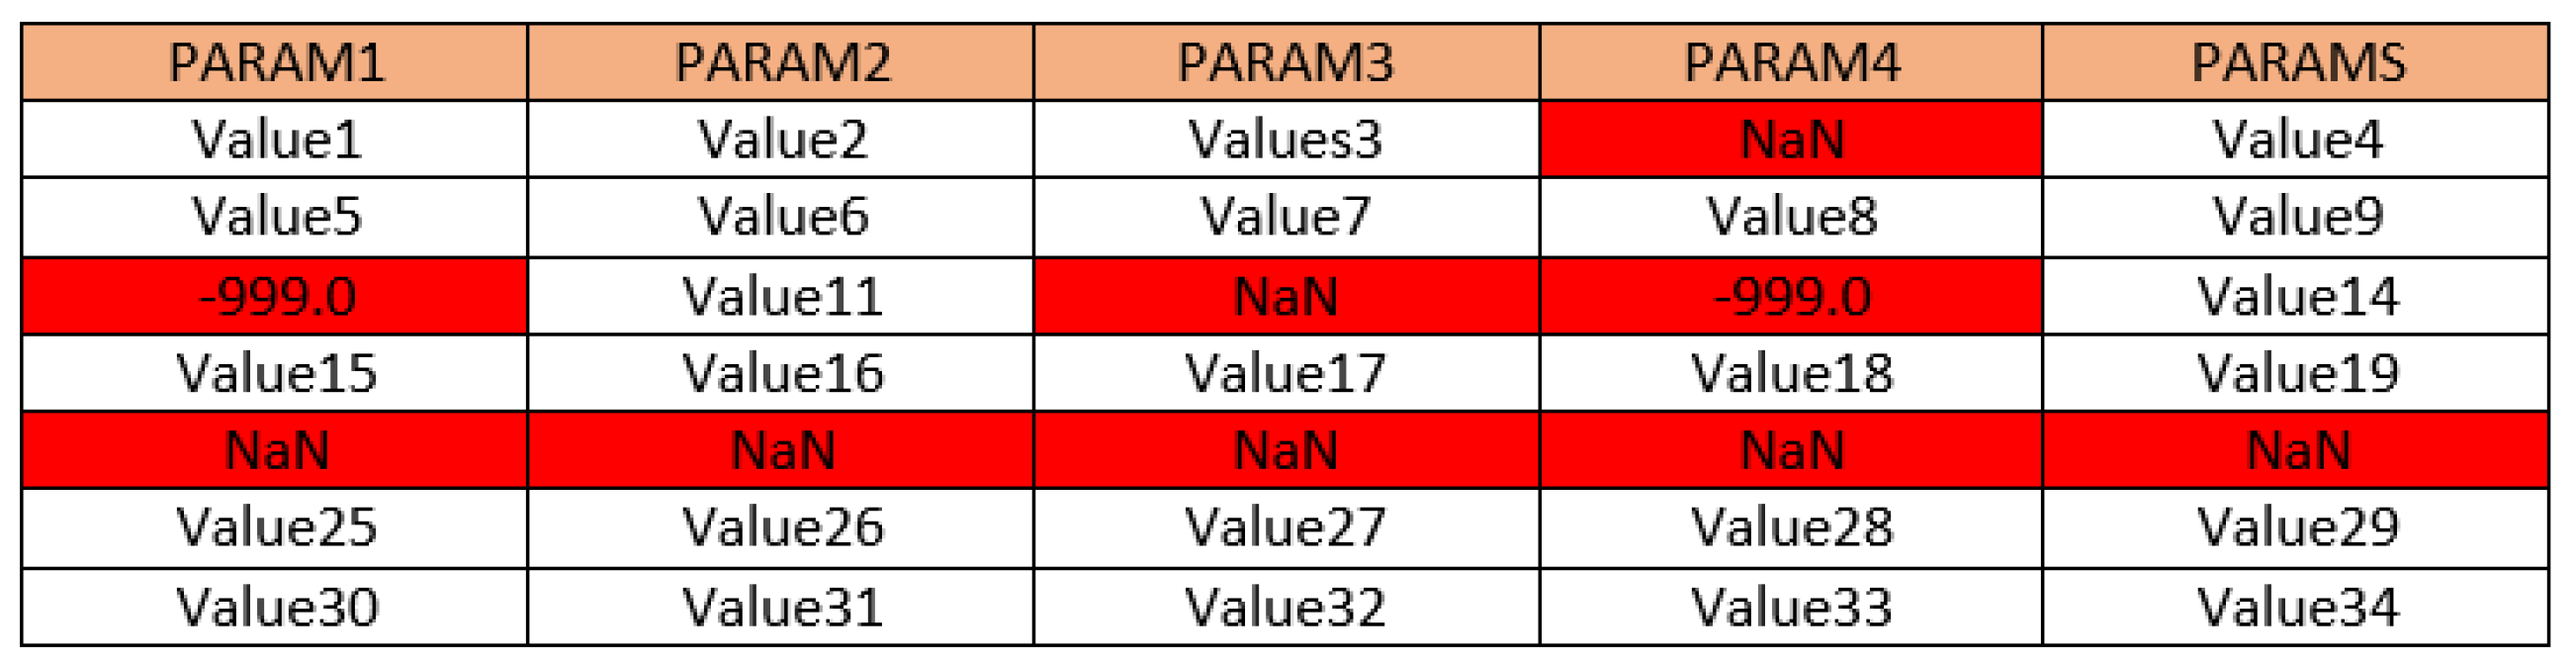
Figure 9.
Processed data flows.
4.3. Imputation Methods
Imputation methods allow for the modification of data structure by replacing missing values with estimated values [51,52,53] , which makes the data complete and usable for weather forecasting models. These methods are essential because missing data can bias the results of the forecast data generated by weather forecasting models [5].
We focus on seven existing imputation methods to select the best. The imputation methods we have used are as follows: LinearRegressor (LR) [10,12], BayesianRidge (BR) [10], DecisionTreeRegressor (DTR) [10,12], ExtraTreeRegressor (ETR) [10,12], KNeighborsRegressor (KNR), KNNImputer (KNNI) [13,15] and MICE [8,13,15].
4.3.1. LinearRegressor
One technique for dealing with missing data in a dataset is called linear regression imputation, which involves predicting the missing values using a linear regression model [10,12]. In order to estimate the missing values for the variable of interest, a regression model based on the observed data must be constructed [10,12]. When normality assumptions are satisfied, this method is frequently applied to continuous variables.
4.3.2. BayesianRidge
By adding uncertainty about the missing values to the model, Bayesian regression is employed as an imputation technique to deal with missing data [10]. This method, which is frequently referred to as Bayesian imputation, entails creating several imputed datasets and then integrating the outcomes to produce conclusions that take into consideration the uncertainty posed by the missing data [10].
4.3.3. DecisionTreeRegressor
4.3.4. ExtraTreeRegressor
It is possible to use Extra Tree Regressor as an imputation technique, especially in an iterative imputation framework [10,12]. The main concept is to approach the imputation of missing values in a single feature as a regression issue, in which the observed values of other features in the dataset are used to predict the missing values of that feature [10,12].
4.3.5. KNeighborsRegressor
KNR also identifies the k-nearest neighbors to a data point with a missing value. However, instead of directly using the neighbors’ values, it builds a regression model (usually a linear regression model) using the neighbors’ data to predict the missing value.
4.3.6. KNNImputer
One technique for estimating and filling in missing values in a dataset is K-Nearest Neighbors (KNN) imputation [13,15]. To estimate the missing data, it first determines the "k" most comparable data points (neighbors) to the observation with the missing value. Then, it uses the values from these neighbors [13,15]. Using a selected distance metric (such as the Euclidean distance for numerical data or the Hamming distance for categorical data), KNN imputation determines the k-nearest neighbors of a data point with a missing value.
4.3.7. MICE
One effective statistical technique for dealing with missing data in datasets is Multivariate Imputation by Chained Equations, or MICE [8,13,15]. Regression models based on other variables in the dataset are used iteratively to impute missing values. Until the imputed values converge, this process is repeated, producing several complete datasets. After that, these datasets can be examined independently, and the findings pooled to produce statistical conclusions [8,13,15].
4.4. Weather forecasting model based on ML
We used four weather forecasting models based respectively on MLR, ANN, LSTM, and TCN to simulate weather forecasts from data cleaned by the imputation method. The choice of these models is due to the weather forecasting models that were mentioned in one of the subsections of the related works, namely subsection 2.3. The MLR, ANN, LSTM, and TCN are Batch Machine Learning models, also referred to as Offline Machine Learning [54,55]. These models were designed using historical data before being deployed for real-time weather forecasting simulations. The objective is to show through evaluation metrics that imputation methods improve the quality of forecast weather data generated by these weather forecasting models.
4.5. Evaluation Metrics
Model evaluation metrics will be used to evaluate imputation methods and weather forecasting models. For the imputation methods, we will use the following metrics : time execution and Root Mean Squared Error (RMSE). For weather forecasting models, we will use Root Mean Squared Error (RMSE). RMSE is used to determine the difference between the weather forecast (or the estimated weather) and the expected weather observation values. This metric is used to analyse the accuracy of the models. Their mathematical expressions are given below :
Where n is the number of weather observations in the dataset, is the actual value of the weather observation, and is the weather predicted (or estimated) value of the observation.
All our data has been normalized to facilitate the evaluation of imputation methods as well as weather forecasting models.
4.6. Tools
To carry out our experiments, we used a laptop with the following specifications: Windows 10 Professional 64-bit, 4GB RAM, AMD 1.80 GHz processor. The programming language used is Python. The IDE used is Jupyter Notebook.
5. Results
5.1. Forecasting via LSTM Model Taking Data Streams as Input (Uncleaned and Cleaned)
5.1.1. Forecast of Weather Data Containing Anomalies
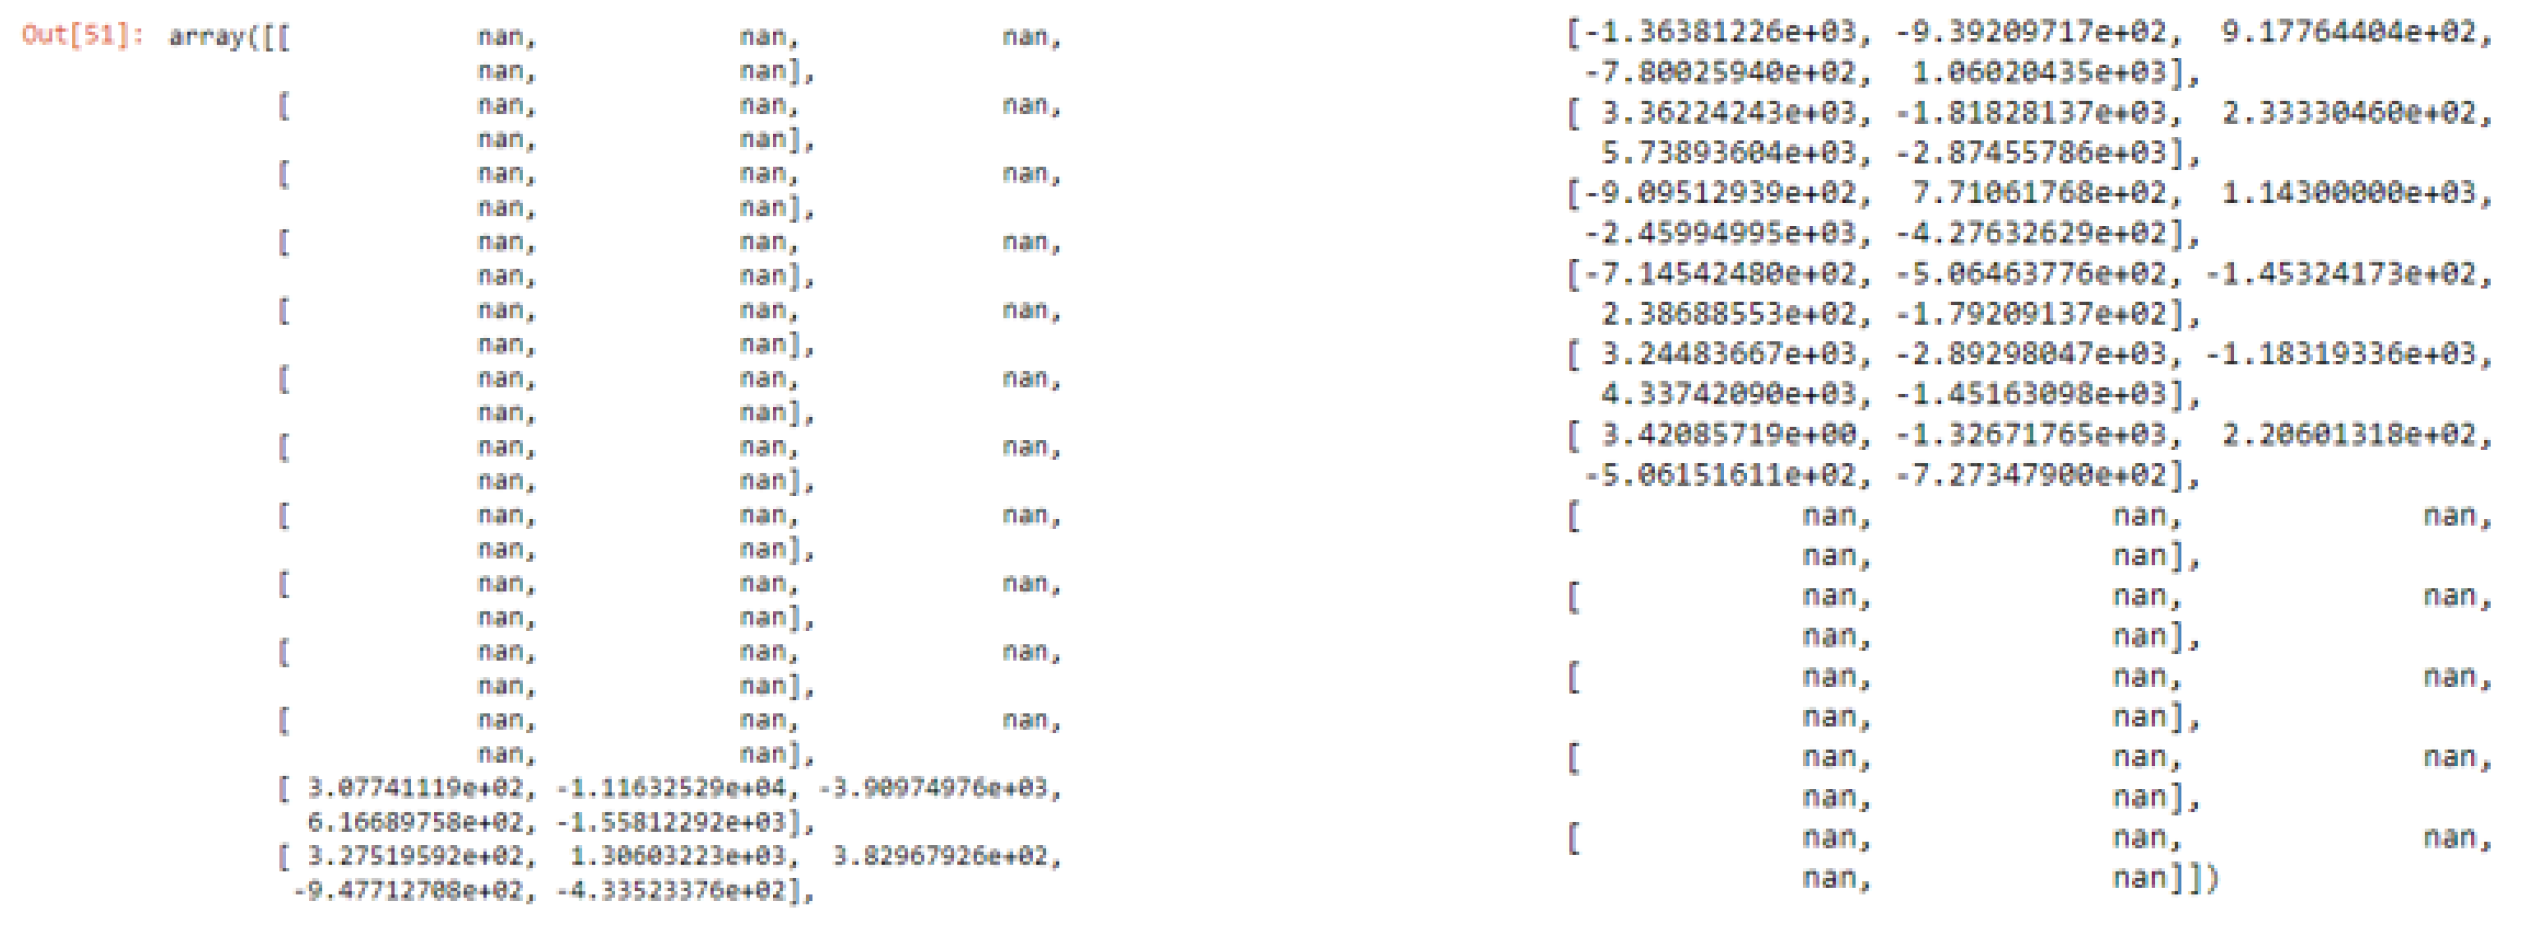
Figure 10 shows an extract of the weather data stream containing the anomalies. This weather data stream contains two types of anomalies : missing values (NaN) and abnormal values (-999). This data stream will be used as input by the LSTM weather forecasting model. The results of these forecasts are shown in Figure 11.
We have observed that the presence of anomalies in the flow of weather data leads to poor forecasts and a decrease in the performance of the forecasting model.
Figure 10.
Extract of weather data stream containing anomalies.
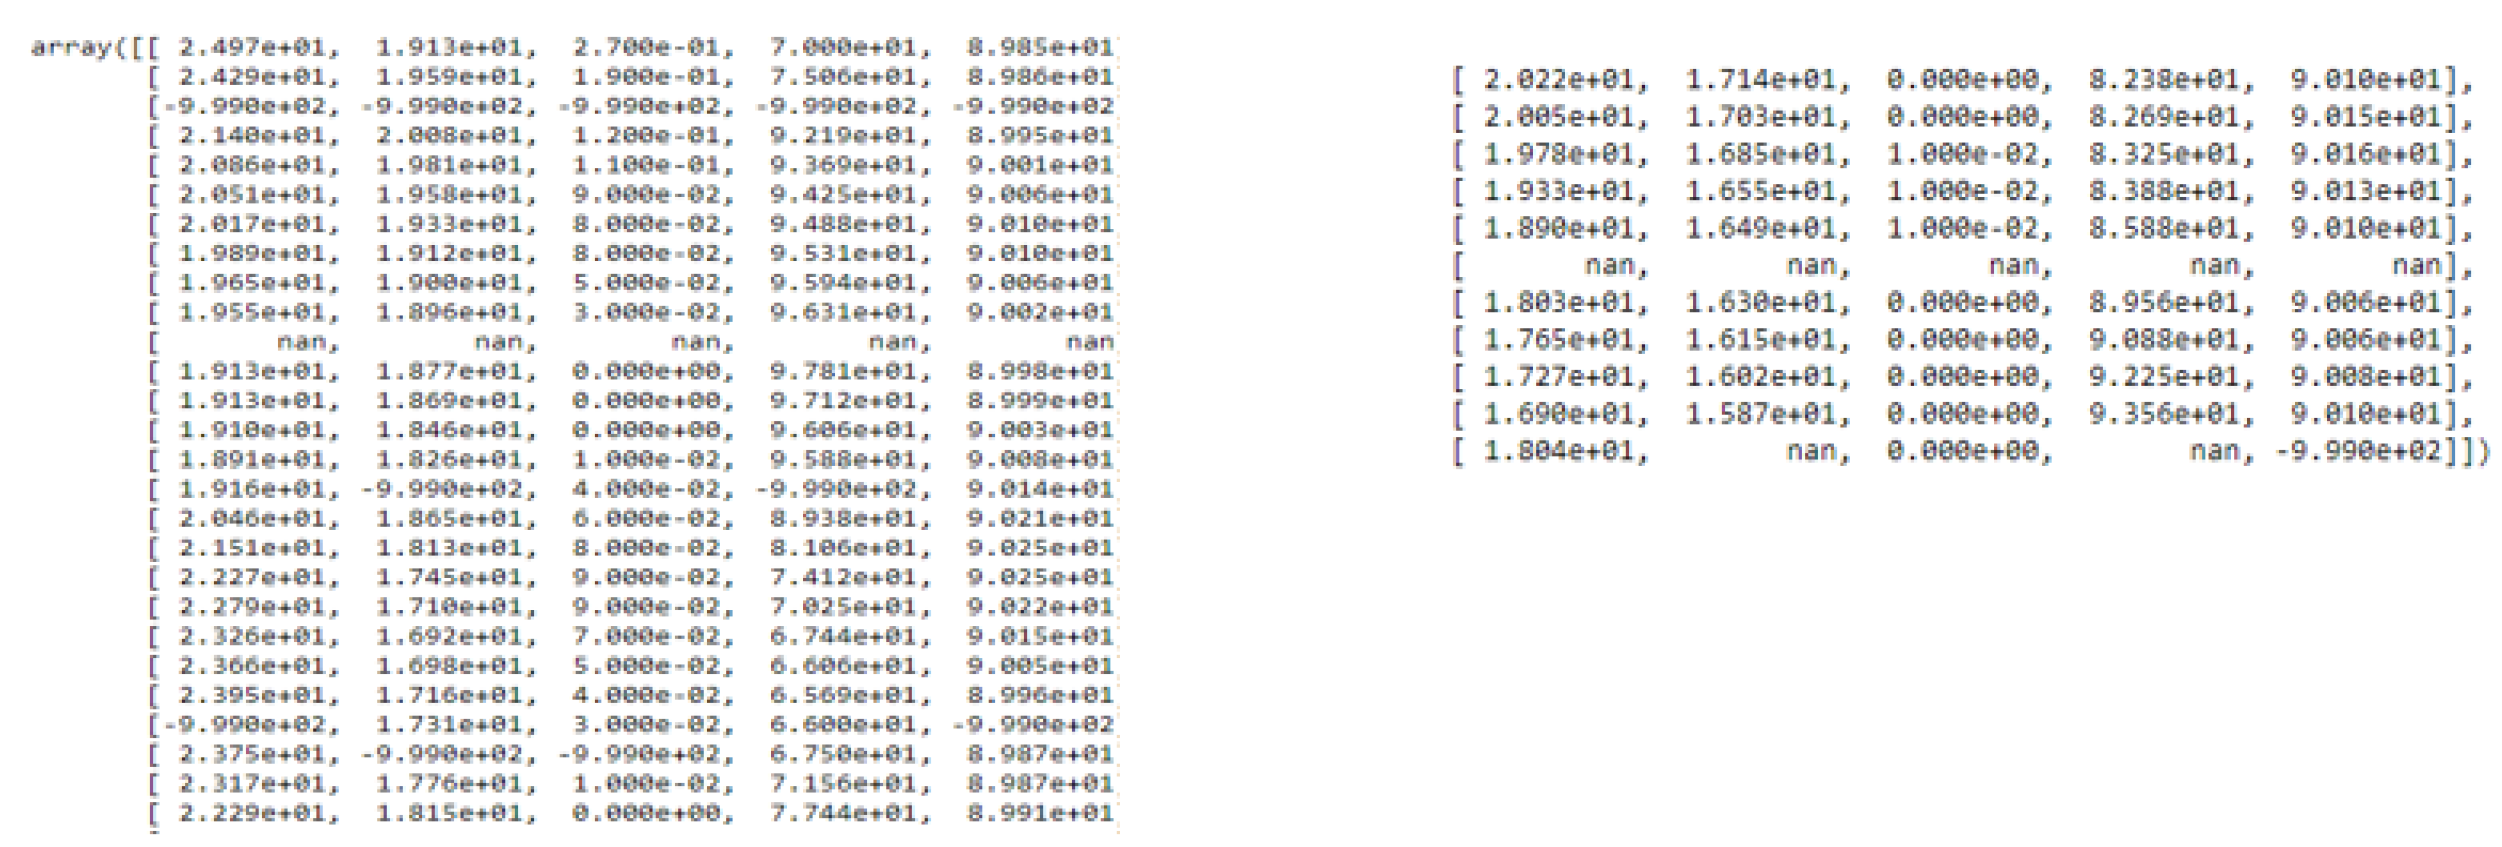
Figure 11.
Data predicted by our LSTM model.
5.1.2. Forecast of Processed Weather Data
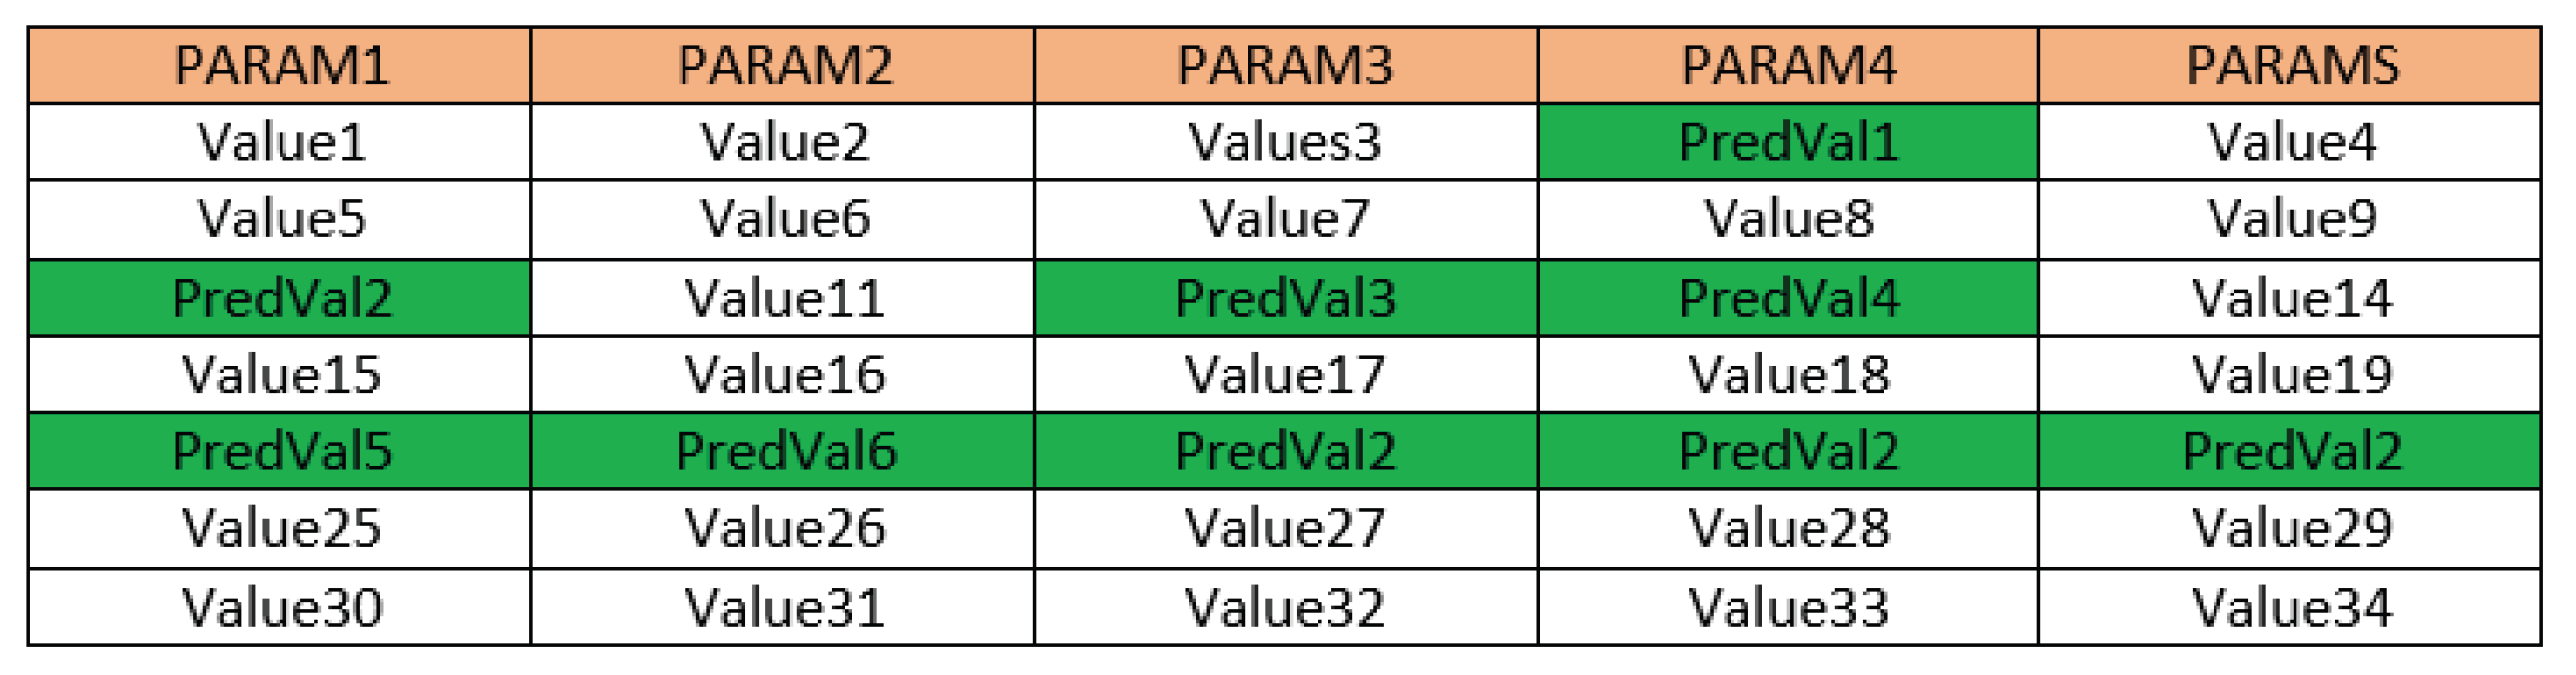
Using the same data streams containing the anomalies, the abnormal values are transformed into missing values. Then, all these missing values are imputed using an MICE imputation method. The cleaned data streams are finally used by the LSTM model to produce the forecast data. Figure 12 shows the result of a cleaned extract of weather data using the imputation method, and Figure 13 illustrates the result of the weather forecast simulation based on this data.
Based on these two scenarios, we can assert that data imputation contributes to the performance of the weather forecasting model.
5.2. Selection of the Best Imputaion Model
The temperature dataset contains 8,759 weather observations for the year 2020 and the sampling time is 1 hour. This dataset was used to perform imputation simulations. We conducted imputation simulations on our dataset using the seven imputation methods. Each simulation was repeated 30 times in order to obtain the average RMSE and the average execution time for each imputation method. As shown in Figure 6, the dataset contains a specific anomaly rate and is then cleaned. All abnormal values have been transformed into missing values. Subsequently, the imputation models will take care of imputing all the missing values present in the dataset. The evaluation results of our different imputation methods are presented in Table 2 and Table 3.
First of all, with anomaly rates ranging between and that were corrected by imputation methods. The RMSE results on the quality of the data processed by these imputation methods range between and (see Table 2). From these results, we observe a very good quality of the processed weather data because the RMSEs are very low. Moreover, all imputation methods run in less than 2 seconds (see Table 3). Furthermore, the results of the evaluation of the imputation method in terms of accuracy, illustrated in Table 2 and Figure 14, show that the KNR model (RMSE = ) is the best method to handle anomalies with a missing value rate of . For handling anomalies with missing values of and , the ETR method is the best imputation method, with an RMSE of and , respectively. Finally, for handling anomalies with a missing value rate of , the MICE method (RMSE = ) is the best imputation method.
The data cleaned by the ETR method will be used as input by the weather forecasting models based on MLR, ANN, LSTM, and TCN, respectively, to produce the forecast data. The following section presents the results of the forecast data produced by these forecasting models and their accuracy.
5.3. Prediction via our Different Forecasting Models on Cleaned Data via ETR Imputation Method
As mentioned in Section 3.5, the objective is to show through evaluation metrics that imputation methods improve the quality of forecast weather data generated by these weather forecasting models.
The accuracy results of the different weather forecasting models based on MLR, ANN, LSTM, and TCN, respectively, according to the anomaly rates imputed by the ETR method, are illustrated in Table 4 and Figure 15.
Anomaly rates between and were corrected in order to obtain cleaned data. This data was used by weather forecasting models based on MLR, ANN, LSTM, and TCN, respectively, to perform real-time weather forecasting simulations. According to Table 4 and Figure 15, their RMSEs range from to , which is very low. Their low RMSEs indicate smaller average forecast errors and, consequently, more accurate forecasts.
5.4. Proposal for an Architecture of a Weather Forecasting System
Figure 21 illustrates our proposed weather forecasting system, which is divided into two parts : data integration and data analysis. As part of data integration, we have four modules : the weather data collection module, the data transformation module (physical data to digital data), the storage module, and the real-time anomaly detection and correction module. This last module is responsible for cleaning the real-time data streams. The data analysis part contains the ML-based forecasting model. The forecasting model can receive cleaned data as input in order to obtain more accurate forecasts. Therefore, the cleaning of weather observation data is crucial to ensure the quality of forecast data generated by weather forecasting models.
Our proposed algorithm for real-time data cleaning is housed in the Real-time anomaly detection and correction module of our weather forecasting system. This algorithm is presented in the next session.
5.5. Proposal of a Real-Time Data Cleaning Algorithm
Our proposed algorithm is as follows:
The detection of abnormal values is carried out thru an abnormal value detection model based on Machine Learning. Similarly, the detection of missing values is carried out thru a missing value detection model based on Machine Learning. Furthermore, data imputation is carried out using a specific imputation method.
This algorithm processes weather data in real time to obtain cleaned weather observation data. These data will be used by the weather forecasting model.
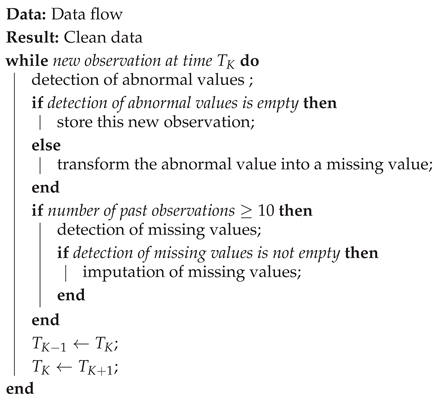
Algorithm 1: Detection and correction of anomalies
6. Discussion
The results of the simulations from step 1 of our methodological framework allowed us to see that the presence of anomalies in weather observation data makes weather forecasting models inaccurate. These results support the assertion of (Alejandro et al., 2022) [8], (Ravi et al., 2022) [18], and (Zhang et al., 2020) [19], hence the necessity to impute these anomalies in order to have better quality weather observation data that will subsequently be used by weather forecasting models, thereby improving the accuracy of these models.
The simulation results from step 2 of our methodological framework allowed us to see that the imputation methods used help avoid information loss while obtaining high-quality weather data.
Regarding the results of step 3 of our methodological framework, they allowed us to have cleaned weather data using the ETR imputation method, thereby making the forecasting models more precise. These results support the assertion of (Heinrig, 2020) [20] and (Bruyant et al., 2023) [52] which state that improving the accuracy of forecasts requires the availability of higher quality data.
Given that the real-time weather forecasting systems proposed by the authors can either take into account the monitoring of collected weather data, namely the real-time detection and removal of anomalies, or do so without monitoring this data, which can negatively affect the performance of weather forecasting models. Thus, we proposed in step 4 of our methodological framework an architecture for a weather forecasting system with a real-time anomaly detection and correction module. The particularity of this module is that it allows for the detection of anomalies in real-time and imputes them without losing information. And in step 5, we proposed an Anomaly Detection and Correction Algorithm.
However, although imputation methods contribute to the performance of weather forecasting models based on Batch Machine Learning as presented in section 3 and section 4, in the context of real-time weather forecasting, these models will not be able to adapt in real-time over time to new data structures related to the chaotic nature of the atmosphere (variations or climate changes) because the parameters of these models are static. To further improve the accuracy of forecast data, we propose in our future work an adaptive and evolving weather forecasting model based on Online Machine Learning that can adapt in real-time to new structures of weather observation data.
7. Conclusions
In summary, in the field of real-time weather forecasting, we have two categories of authors who have proposed weather forecasting systems whose weather forecasting models are based on ML. The first category of authors proposes weather forecasting systems that do not take into account anomaly management, thus the possibility of having anomalies present in the weather observation data. The second category offers weather forecasting systems that take into account anomaly management. This management is based on the detection and deletion of anomalies in real time. This data deletion leads to information loss and data reduction. These two categories can result in the inaccuracy of weather forecasting models. According to our various results, we first showed that the presence of anomalies in weather observation data streams can contribute to the degradation of weather forecasting models. We also conducted performance evaluation studies on imputation methods, namely LR, MICE, KNNI, ETR, DTR, and BR. The performance of these methods was very conclusive, allowing for high-quality meteorological data. Subsequently, the cleaned data was used to perform real-time weather forecasting simulations using forecasting models based on MLR, ANN, LSTM, and TCN, respectively. We also proposed the architecture of a weather forecasting system as well as a real-time anomaly detection and correction algorithm. However, although imputation methods contribute to the performance of batch machine learning-based weather forecasting models, in the context of real-time weather forecasting, these models will not be able to adapt in real-time to new data structures related to the chaotic nature of the atmosphere (variations or climate changes) because the parameters of these models are static. To further improve the accuracy of weather forecast data, we propose in our future work an adaptive and evolving weather forecast model based on online machine learning that can adapt in real-time to new structures of weather observation data due to variations or climate changes.
References
- Wang, Z.; Mujib, M. The Weather Forecast Using Data Mining Research Based on Cloud Computing. Journal of Physics Conference Series 2016, 910, 012020. [Google Scholar] [CrossRef]
- Verma, G.; Mittal, P.; Farheen, S. Real Time Weather Prediction System Using IOT and Machine Learning. IEEE 2020. [Google Scholar] [CrossRef]
- Min-Ki, L.; Seung-Hyun, M.; Yong-Hyuk, K.; Byung-Ro, M. Correcting Abnormalities in Meteorological Data by Machine Learning. IEEE 2014, 888–893. [Google Scholar] [CrossRef]
- Garima, J.; Bhawna, M. A Review on Weather Forecasting Techniques. International Journal of Advanced Research in Computer and Communication Engineering 2016, 5, 177–180. [Google Scholar] [CrossRef]
- Planchon, V. Traitement des valeurs aberrantes : concepts actuels et tendances générales. Biotechnol. Agron. Soc. Environ. 2005, 9, 19–34. [Google Scholar]
- Salvador, G.; Luengo, J.; Herrera, F. Data Preprocessing in Data Mining; Springer : Cham Heidelberg New York Dordrecht London, USA, 2015 pp. 1–315. [CrossRef]
- Daniele, S.; Massimiliano, C.; Milan, A. Boosting a Weather Monitoring System in Low Income Economies Using Open and Non-Conventional Systems: Data Quality Analysis. Sensors 2019, 19, 1185. [Google Scholar] [CrossRef]
- Alejandro, M.; Gonzalo, N.; Agnieszka, J.; Yamisleydi, S.; Koen, V. Online learning of windmill time series using Long Short-term Cognitive Networkd. Expert Systems With Applications 2022, 205, 117721. [Google Scholar] [CrossRef]
- Zemicheal, T.; Dietterich, G. Anomaly Detection in the Presence of Missing Values for Weather Data Quality Control. ACM 2019. [Google Scholar] [CrossRef]
- Charlène, B.; Aziza, E.O.; Majid, B. A new data imputation technique for efficient used car price forecasting. International Journal of Electrical and Computer Engineering (IJECE) 2024, 15, 2364–2371. [Google Scholar] [CrossRef]
- Nabanita, M.; Tanuja, S. A framework for cloud cover prediction using machine learning with data imputation. International Journal of Electrical and Computer Engineering (IJECE) 2024, 14, 600–607. [Google Scholar] [CrossRef]
- Amit, K. Machine Learning Based Solution for Asymmetric Information in Prediction of Used Car Prices. International Conference on Intelligent Vision and Computing 2023, 409–420. [Google Scholar] [CrossRef]
- Muhammed, N.A.; Abdul, K. M. M. A Probabilistic Approach for Missing Data Imputation. Complexity 2024, 1–15. [Google Scholar] [CrossRef]
- Alexandre, P.-L.; Gael, V.; Marine, L.M.; Julie, J.; Jean-Baptiste, P. Benchmarking missing-values approaches for predictive models on health databases. GigaScience 2022, 11, 1–22. [Google Scholar] [CrossRef] [PubMed]
- Jiahang, L.; ShuXia, G.; RuLin, M.; Jia, H.; XiangHui, Z.; DongSheng, R.; YuSong, D.; Yu, L.; LeYao, J.; Jing, C.; Heng, G. Comparison of the effects of imputation methods for missing data in predictive modelling of cohort study datasets. BMC Medical Research Methodology 2024, 24, 1–9. [Google Scholar] [CrossRef]
- Ajina, A.; Christiyan, J.K. Prediction of weather forecasting using artificial neural networks. Journal of Applied Research and Technology 2023, 21, 205–211. [Google Scholar] [CrossRef]
- Author 1, T. The title of the cited article. Journal Abbreviation 2008, 10, 142–149. [Google Scholar]
- Ravi, V.V.; Reddy, M.M.; Teja, K.S.; Niteesh, C.S.; Babu, B.S. Weather Prediction. IJRASET 2022, 10, 459–462. [Google Scholar] [CrossRef]
- Zhang, M.; Guo, J.; Li, X.; Jin, R. Data-Driven Anomaly Detection Approach for Time-Series Streaming Data. Sensors 2020, 20, 5646. [Google Scholar] [CrossRef]
- Heinrigs, P. Incidences sécuritaires du changement climatique au Sahel : perspectives politiques. Available online : https://www.wathi.org/incidences-securitaires-du-changement-climatique-au-sahel-perspectives-politiques/ (accessed on 25 July 2025).
- Shruti, D.; Vibhakar, P.; Rohit, M.; Ruchi, D. Machine learning for weather forecasting. 2021, 161–174. [CrossRef]
- Ardilouze, C. , Impact de l’humidité du sol sur la prévisibilité du climat estival aux moyennes latitudes. 2019. [Google Scholar]
- OMM. ATLAS DE LA MORTALITÉ ET DES PERTES ÉCONOMIQUES DUES À DES PHÉNOMÈNES MÉTÉOROLOGIQUES, CLIMATIQUES ET HYDROLOGIQUES EXTRÊMES (1970-2019). 2021. Available online: https://www.uncclearn.org/wp-content/uploads/library/1267_Atlas_of_Mortality_FR.pdf (accessed on 01 March 2025).
- BANQUE MONDIALE. Creating an Atmosphere of Cooperation in Sub-Saharan Africa by Strengthening Weather, Climate and Hydrological Services. 2015. Available online: https://www.worldbank.org/en/news/speech/2015/06/02/transforming-weather-climate-and-hydrological-services-in-africa (accessed on 01 March 2025).
- Abdulraheem, M.; Awotunde, J.B.; Adeniyi, A.E.; Oladipo, I.D.; Adekola, S.O. Weather prediction performance evaluation on selected machine learning algorithms. IAES International Journal of Artificial Intelligence (IJ-AI) 2022, 11. [Google Scholar] [CrossRef]
- ONACC. Etat des lieux du réseau d’observation météorologique dans la Région de l’Adamaoua. 2019, 61–121. Available online: https://files.aho.afro.who.int/afahobckpcontainer/production/files/Profil_ONACC_ADAMAOUA_.pdf (accessed on 4 June 2025).
- Fente, D.N.; Singh, D.K. Weather Forecasting Using Artificial Neural Network. 2018. [CrossRef]
- Jain, G.; Mallick, B. A Review on Weather Forecasting Techniques. IJARCCE 2016, 5, 177–180. [Google Scholar] [CrossRef]
- Marcos, A.P.-J.; Carlos, V.-F.; David, T.-P.; George, P.-M. Diseño de una estación meteorológica automática para registrar las variables solar y eólica. Revista Arbitrada Interdisciplinaria Koinonía, 5, 937. [CrossRef]
- Vaumi, J.P.T. Système d’analyse de données pour la prévision des inondations dans les pays en voie de développement. University of Ngaoundere, 19 July 2019.
- NiuBoL. Available online: https://www.niubol.com/All-products/meteorological-station-equipment.html (accessed on 04 January 2025).
- Larraondo, P.R.; Application of machine learning techniques to weather forecasting. University of the Basque Country UPV/EHU. 22 December 2018. Available online: https://addi.ehu.es/bitstream/handle/10810/32532/TESIS_ROZAS_LARRAONDO_PABLO.pdf (accessed on 10 January 2025).
- Prutor. UNDERSTANDING DATA PROCESSING. 2023.
- Atul, K.; Debajyotti, M. Internet of Things Based Weather Forecast Monitoring System. Indonesian Journal of Electrical Engineering and Computer Science 2018, 9, 555–557. [Google Scholar] [CrossRef]
- Aditya, T. The role of Data Processing in Machine Learning. 2023. Available online: https://niveussolutions.com/role-of-data-processing-in-machine-learning/ (accessed on 10 March 2025).
- Heinrigs, P. Incidences sécuritaires du changement climatique au Sahel : perspectives politiques. 2010. Available online: https://www.wathi.org/incidences-securitaires-du-changement-climatique-au-sahel-perspectives-politiques/ (accessed on 10 March 2025).
- Kaya, M.S.; Isler, B.; Abu-Mahfouz, M.A.; Rasheed, J.; Ashammari, A. An Intelligent Anomaly Detection Approach for Accurate and Reliable Weather Forecasting at IoT Edges: A Case Study. Sensors 2023, 23, 2426. [Google Scholar] [CrossRef]
- Garima, J.; Bhawma, M. A Review on Weather Forecasting Techniques,» International Journal of Advanced Research in Computer and Communication Engineering. IJARCCE 2016, 5, 177–180. [Google Scholar] [CrossRef]
- Goncalo, M.; Antonio, R.; Helder, D. , Sergio, S.; Hamid, K.; Shabnam, P.; Pedro, M.; Ricardo, H. An Intelligent Weather Station. Sensors 2015, 15, 31005–31022. [Google Scholar] [CrossRef]
- Kothapalli, S.; Totad, S.G. A Real-Time Weather Forecasting and Analysis. In Proceedings of Conference: 2017 IEEE International Conference on Power, Control, Signals and Instrumentation Engineering (ICPCSI); 1567–1570. [Google Scholar] [CrossRef]
- Parashar, A. IoT Based Automated Weather Report Generation and Prediction Using Machine Learning. In Proceedings of Conference: 2019 2nd International Conference on Intelligent Communication and Computational Techniques (ICCT). [Google Scholar] [CrossRef]
- Pradeep, H.; Ardhendu, B.; Marcello, T.; Ella, P.; Morteza, G.; Francesco, P.; Yonghuai, L. Temporal convolutional neural (TCN) network for an effective weather forecasting using time-series data from the local weather station. Soft Computing 2020, 2020, 16453–16482. [Google Scholar] [CrossRef]
- Masoud, S.; Tao, H.; Claude, M. Temperature Anomaly Detection for Electric Load Forecasting. International Journal of Forecasting 2020, 36, 324–333. [Google Scholar] [CrossRef]
- Shruti, D.; Vibhakar, P.; Rohit, M.; Ruchi, D. Machine learning for weather forecasting. 2021, 161–174. [CrossRef]
- Adela, B.; Alin, G.V.; Simona-Vasilica, O. Anomaly Detection in Weather Phenomena: News and Numerical Data-Driven Insights into the Climate Change in Romania’s Historical Regions. International Journal of Computational Intelligence Systems 2024, 134, 1–26. [Google Scholar] [CrossRef]
- MINEPAT. ELABORATION DU SCHEMA REGIONAL D’AMENAGEMENT ET DE DEVELOPPEMENT DURABLE DU TERRITOIRE DE L’ADAMAOUA : ATLAS CARTOGRAPHIQUE DE L’ADAMAOUA. Le groupement AGORA Consulting, CID, MINEPAT : Cameroon, 2018; pp. 1–45. Available online: https://minepat.gov.cm/wp-content/uploads/2024/09/1.1.-SRADDT-AD-Diagnostic-territorial-Atlas-cartographique.pdf (accessed on 31 July 2025).
- Sadio, F.H. LE TOURISME DANS LE DEPARTEMENT DE LA VINA (ADAMAOUA-CAMEROUN) : Mythe ou Réalité ?. Géographie et Pratique du Développement Durable, Université de Ngaoundéré, Cameroun, 2012. Available online: https://www.memoireonline.com/05/20/11825/m_Le-tourisme-dans-le-departement-de-la-vina-adamaoua-cameroun–mythe-ou-realite-0.html (accessed on 01 July 2025).
- Michel, T. Paysage géomorphologique, patrimoine socio-culturel et développement sur les hautes terres de l’Adamaoua au Cameroun. Espaces tropicaux 2003, 18, 67–75. Available online: https://www.persee.fr/doc/etrop_1147-3991_2003_act_18_9_1108 (accessed on 02 July 2025).
- Little, R.J.; Rubin, D.B. Analyse statistique avec données manquantes, 3rd ed.; Wiley: Hoboken, USA, 2019. [Google Scholar]
- Tlamelo, E.; Thabiso, M.; Dimane, M. , Thabo, S., Banyatsang, M.; Oteng, T. A survey on missing data in machine learning. Journal of Big Data 2021, 8, 1–37. [Google Scholar] [CrossRef]
- Cottrell, G.; Cot, M.; Mary, J.-Y. Multiple imputation of missing at random data: General points and presentation of a Monte-Carlo method. Revue d’Épidémiologie et de Santé Publique 2009, 57, 361–372. [Google Scholar] [CrossRef] [PubMed]
- Bruyant, A.; Guemann, M.; Malgoyre, A. Epidemiological study of major amputations of upper and lower limbs in France. Kinésithérapie, la Revue, 2023; 3–12. [Google Scholar] [CrossRef]
- Peng, L.; Elizaberth, A.S.; David, B.A. Multiple Imputation: A Flexible Tool for Handling Missing Data. JAMA 2015. [Google Scholar] [CrossRef]
- Thomas, B.-B. Chapiter 1 Introduction : From Batch to Online Machine Learning; Springer: Singapore, 2024. [Google Scholar] [CrossRef]
- Alban, F.; Marc, B.; Patrick, L.; Massimo, B.; Quentin, M. A comparison of combined data assimilation and machine learning methods for offline and online model error correction. Journal of Computational Science 2021, 55, 101468. [Google Scholar] [CrossRef]
Figure 1.
Weather station [31].
Figure 1.
Weather station [31].
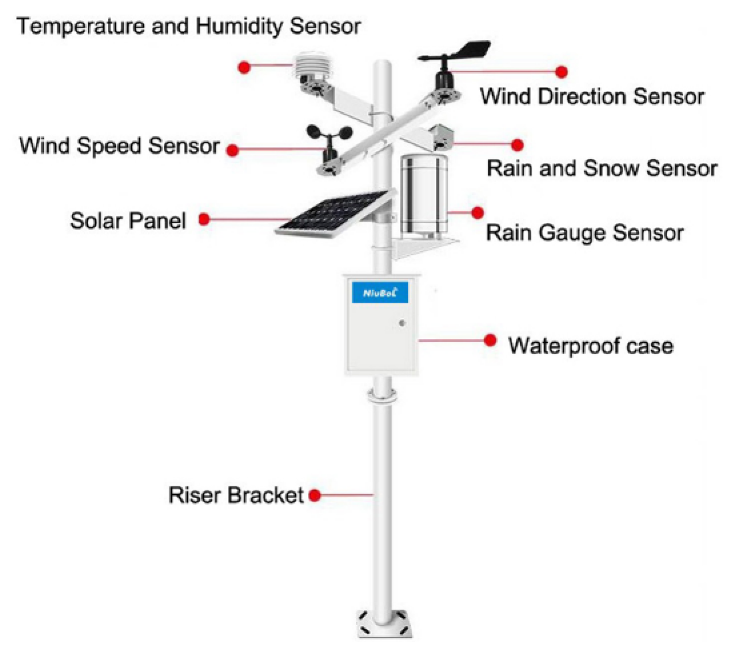
Figure 2.
Categories of real-time weather forecasting systems.
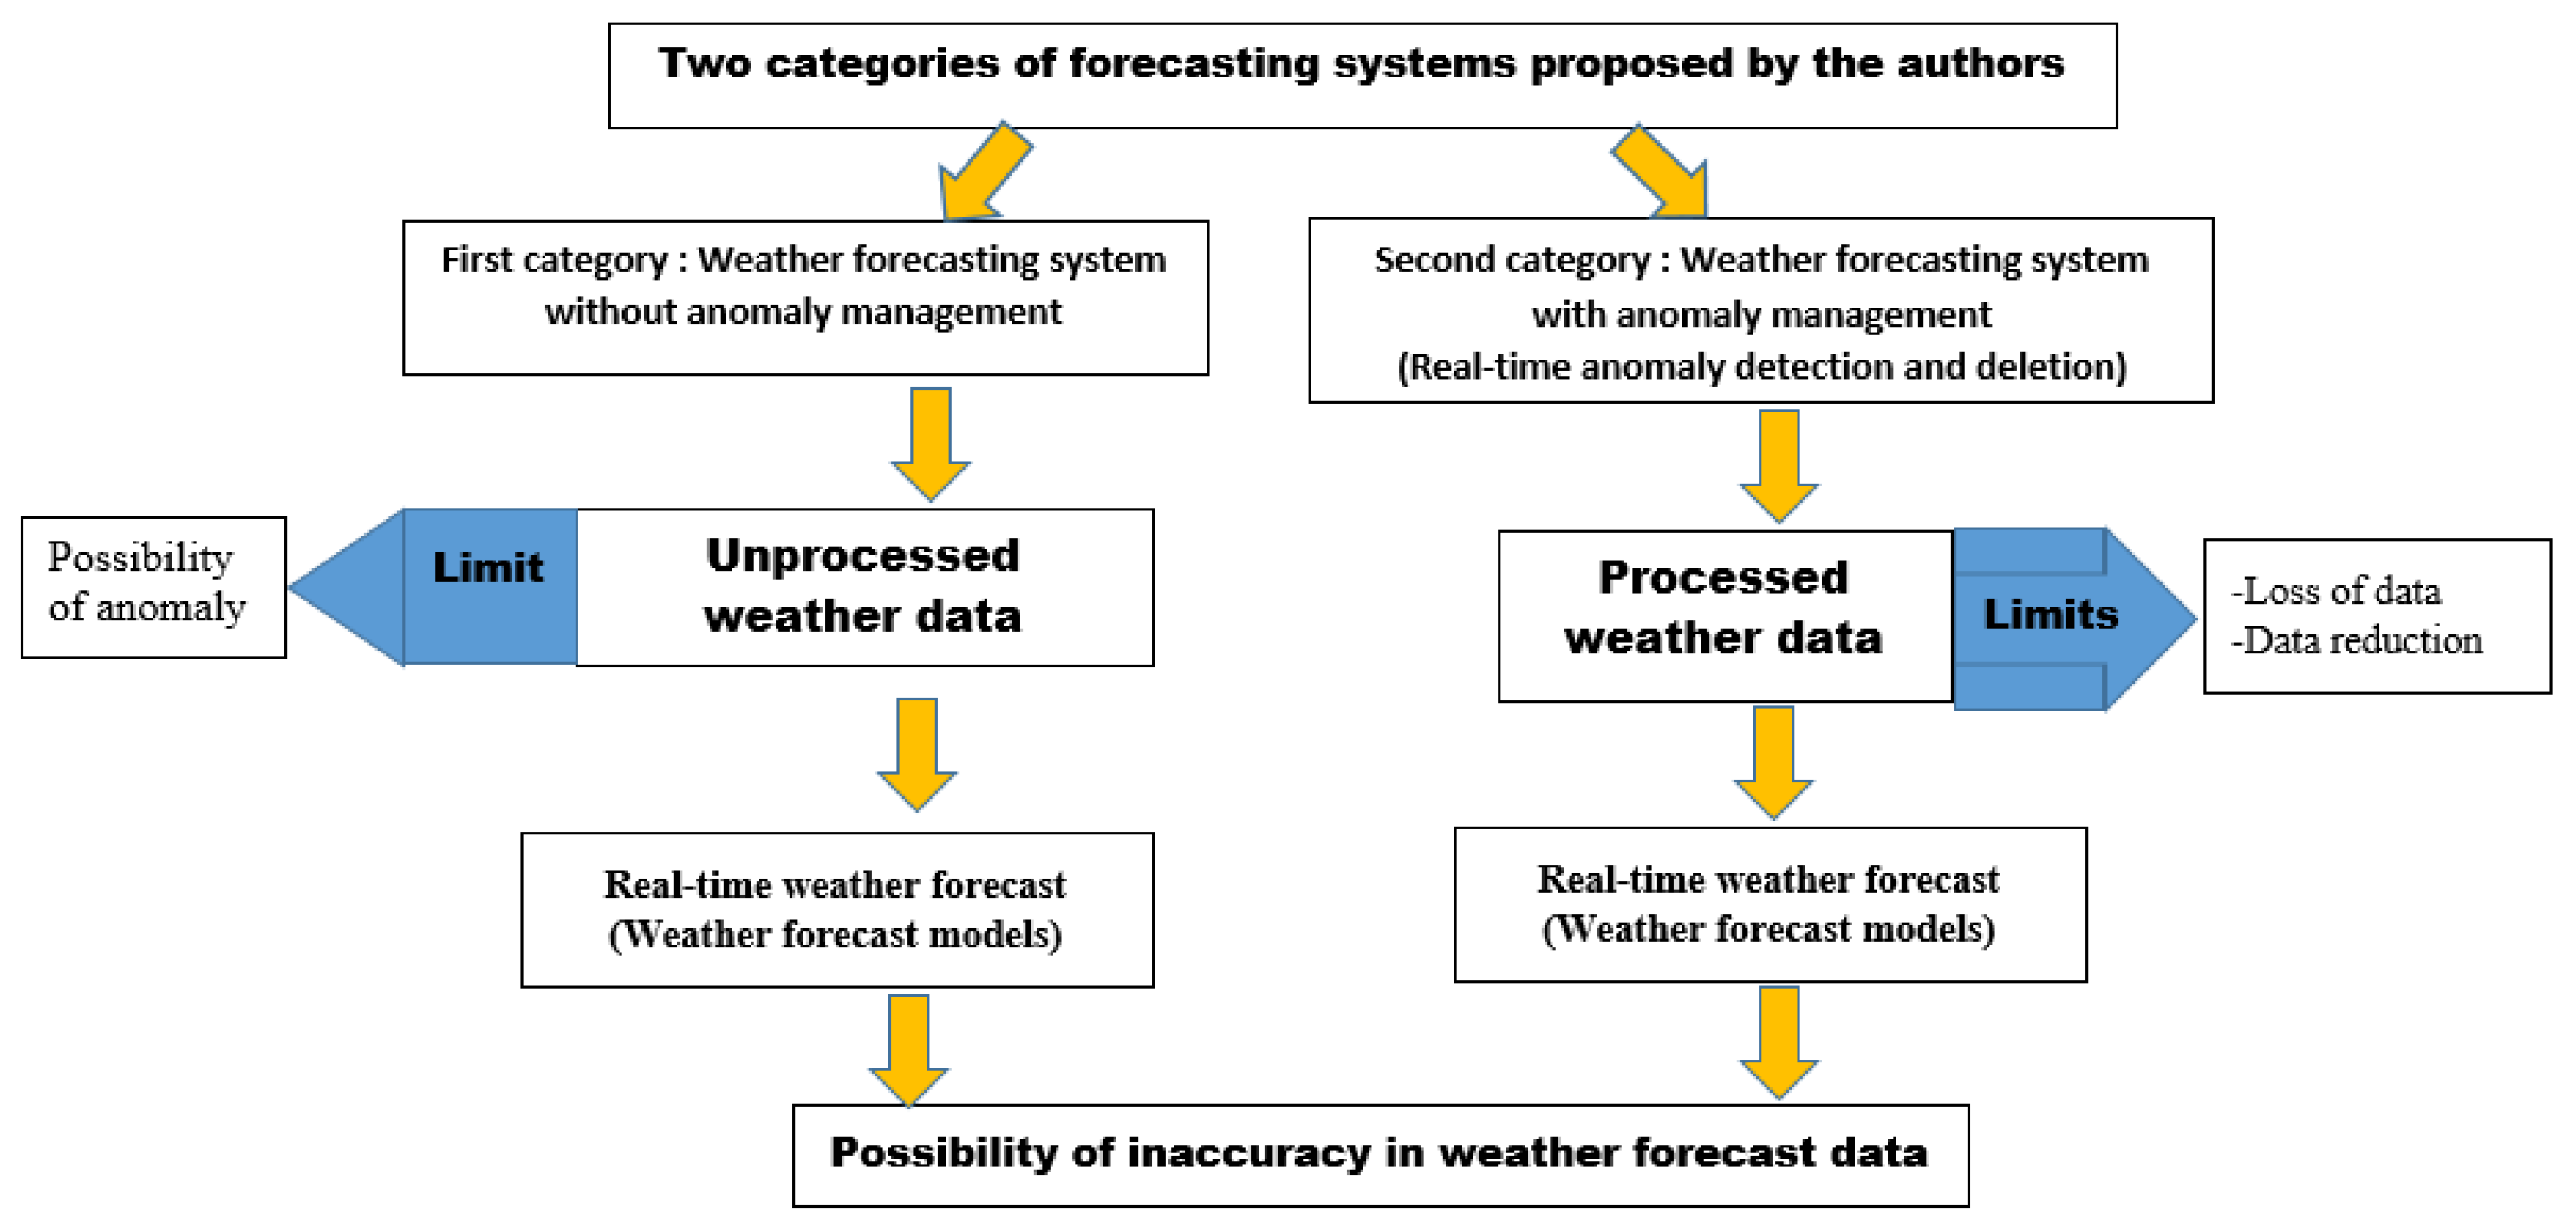
Figure 3.
Map of Cameroon’s Adamawa region
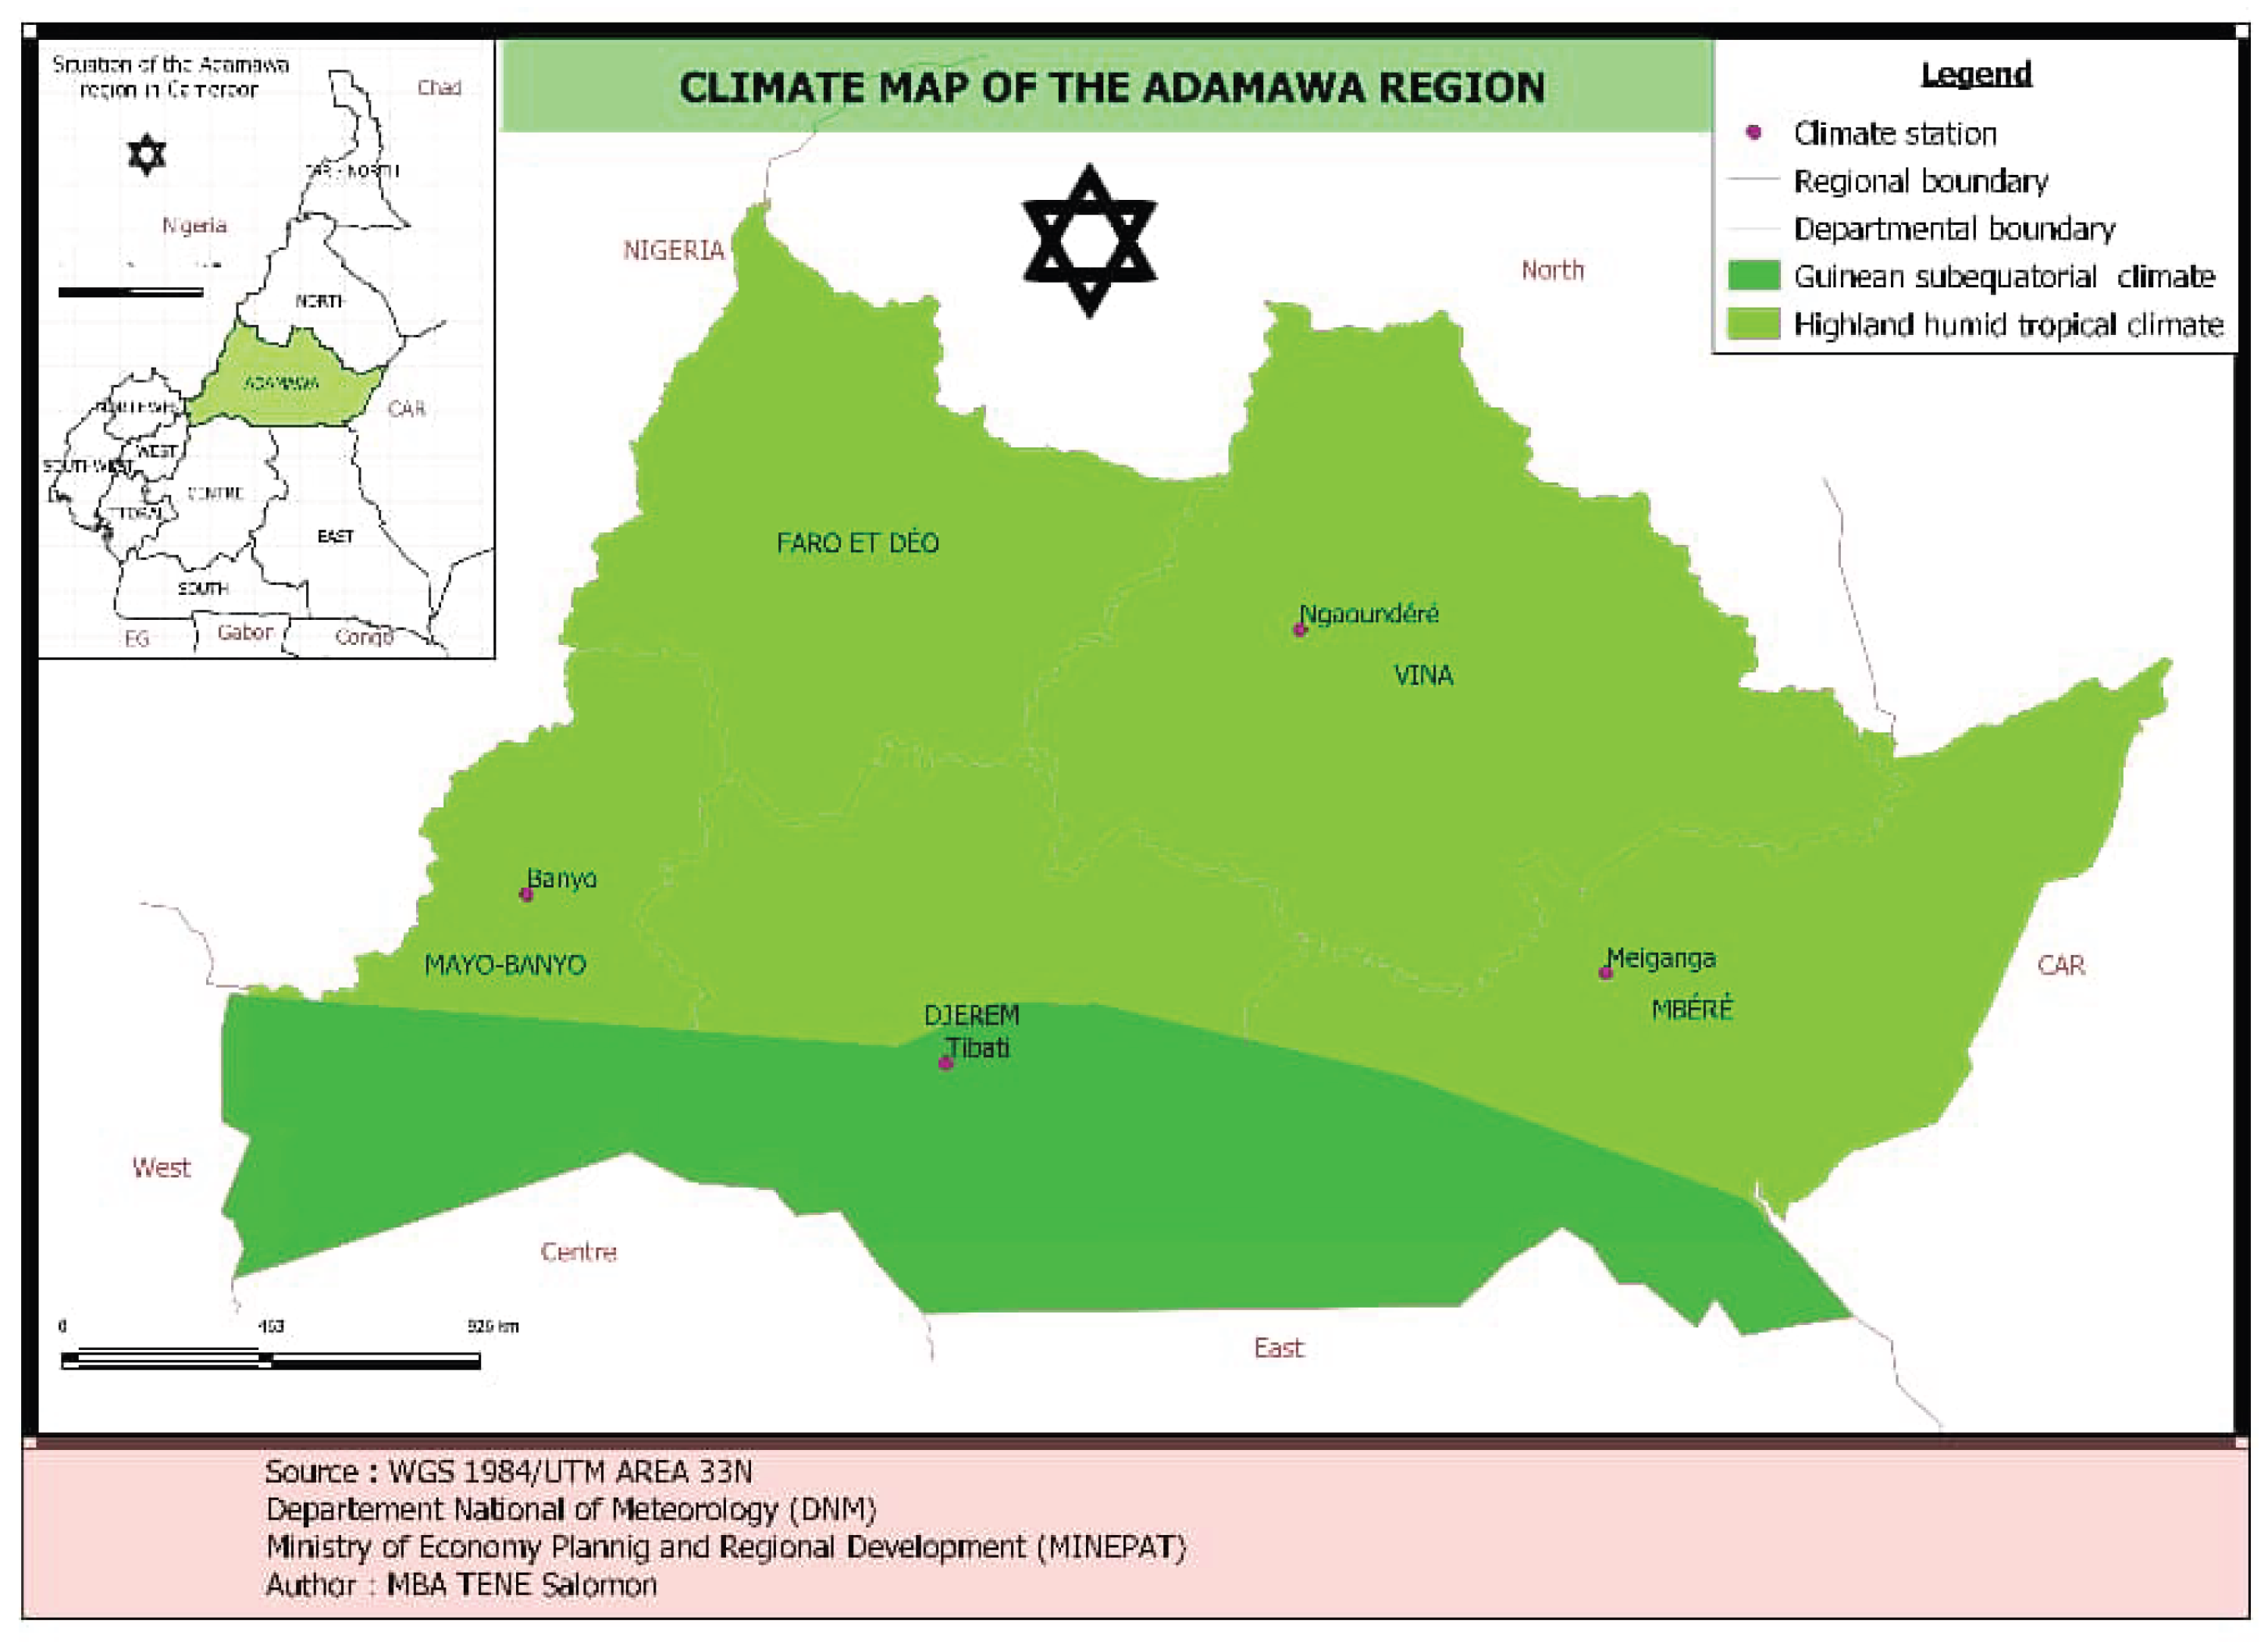
Figure 12.
An extract of the processed data flow.
Figure 13.
Weather forecast based on processed data.
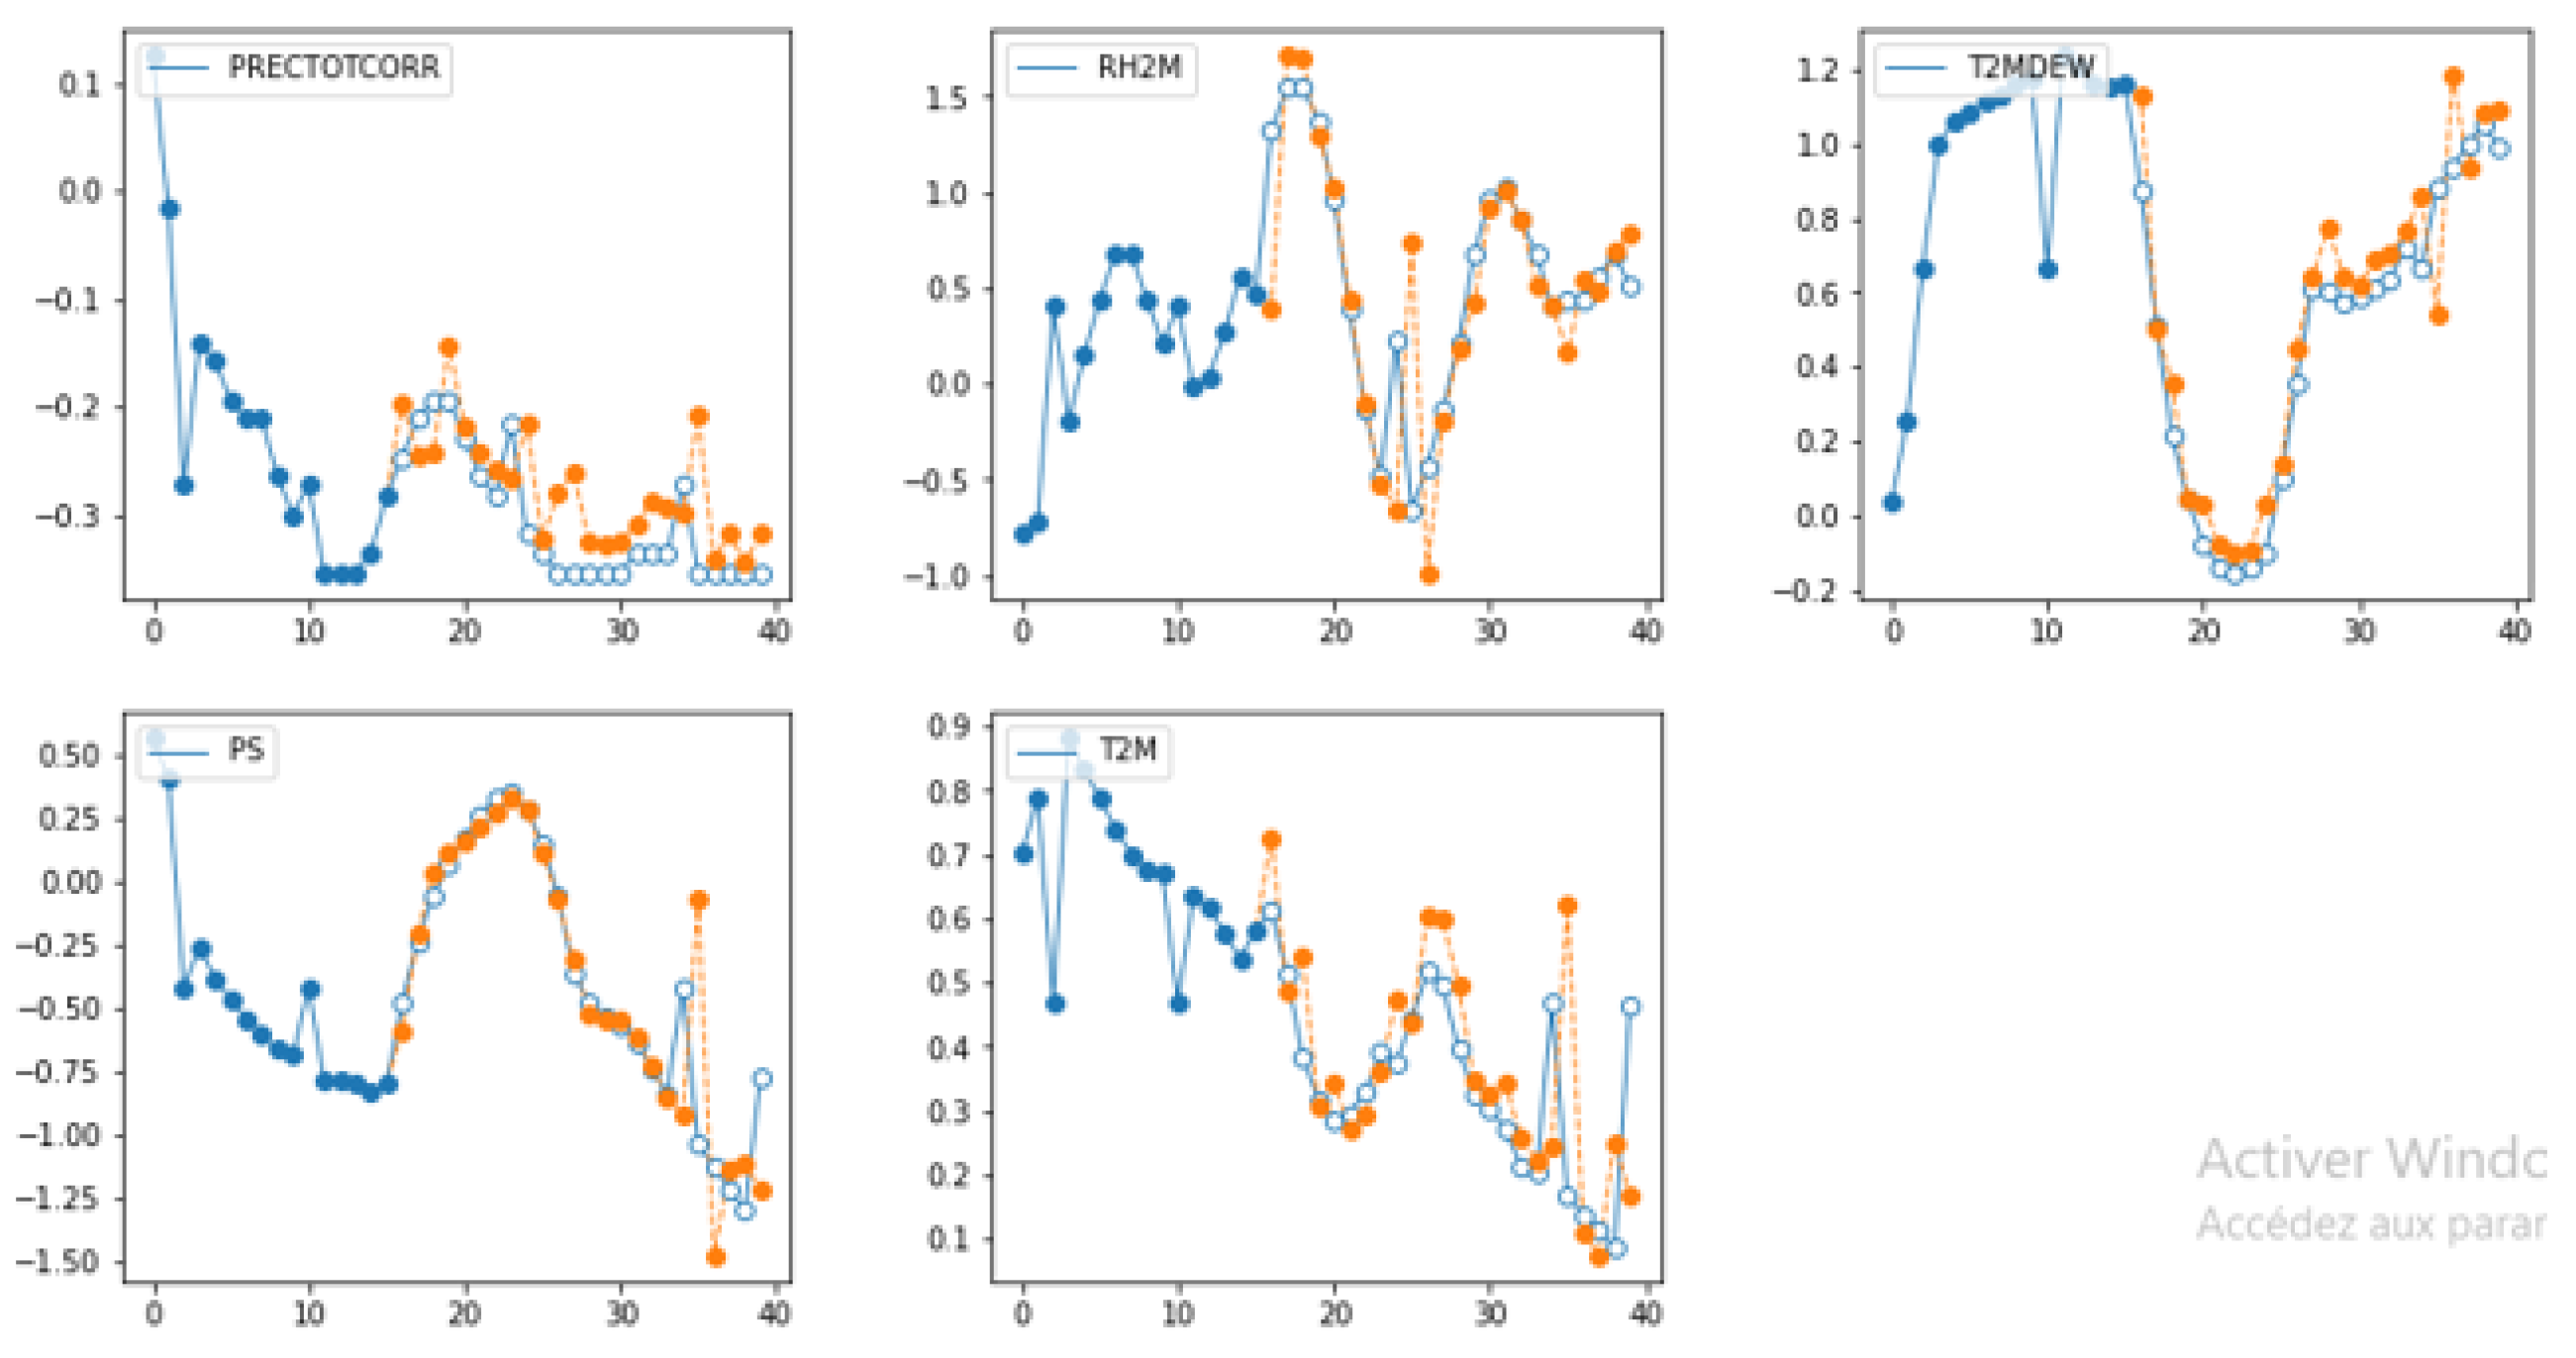
Figure 14.
Result for RMSE of Imputation Methods.
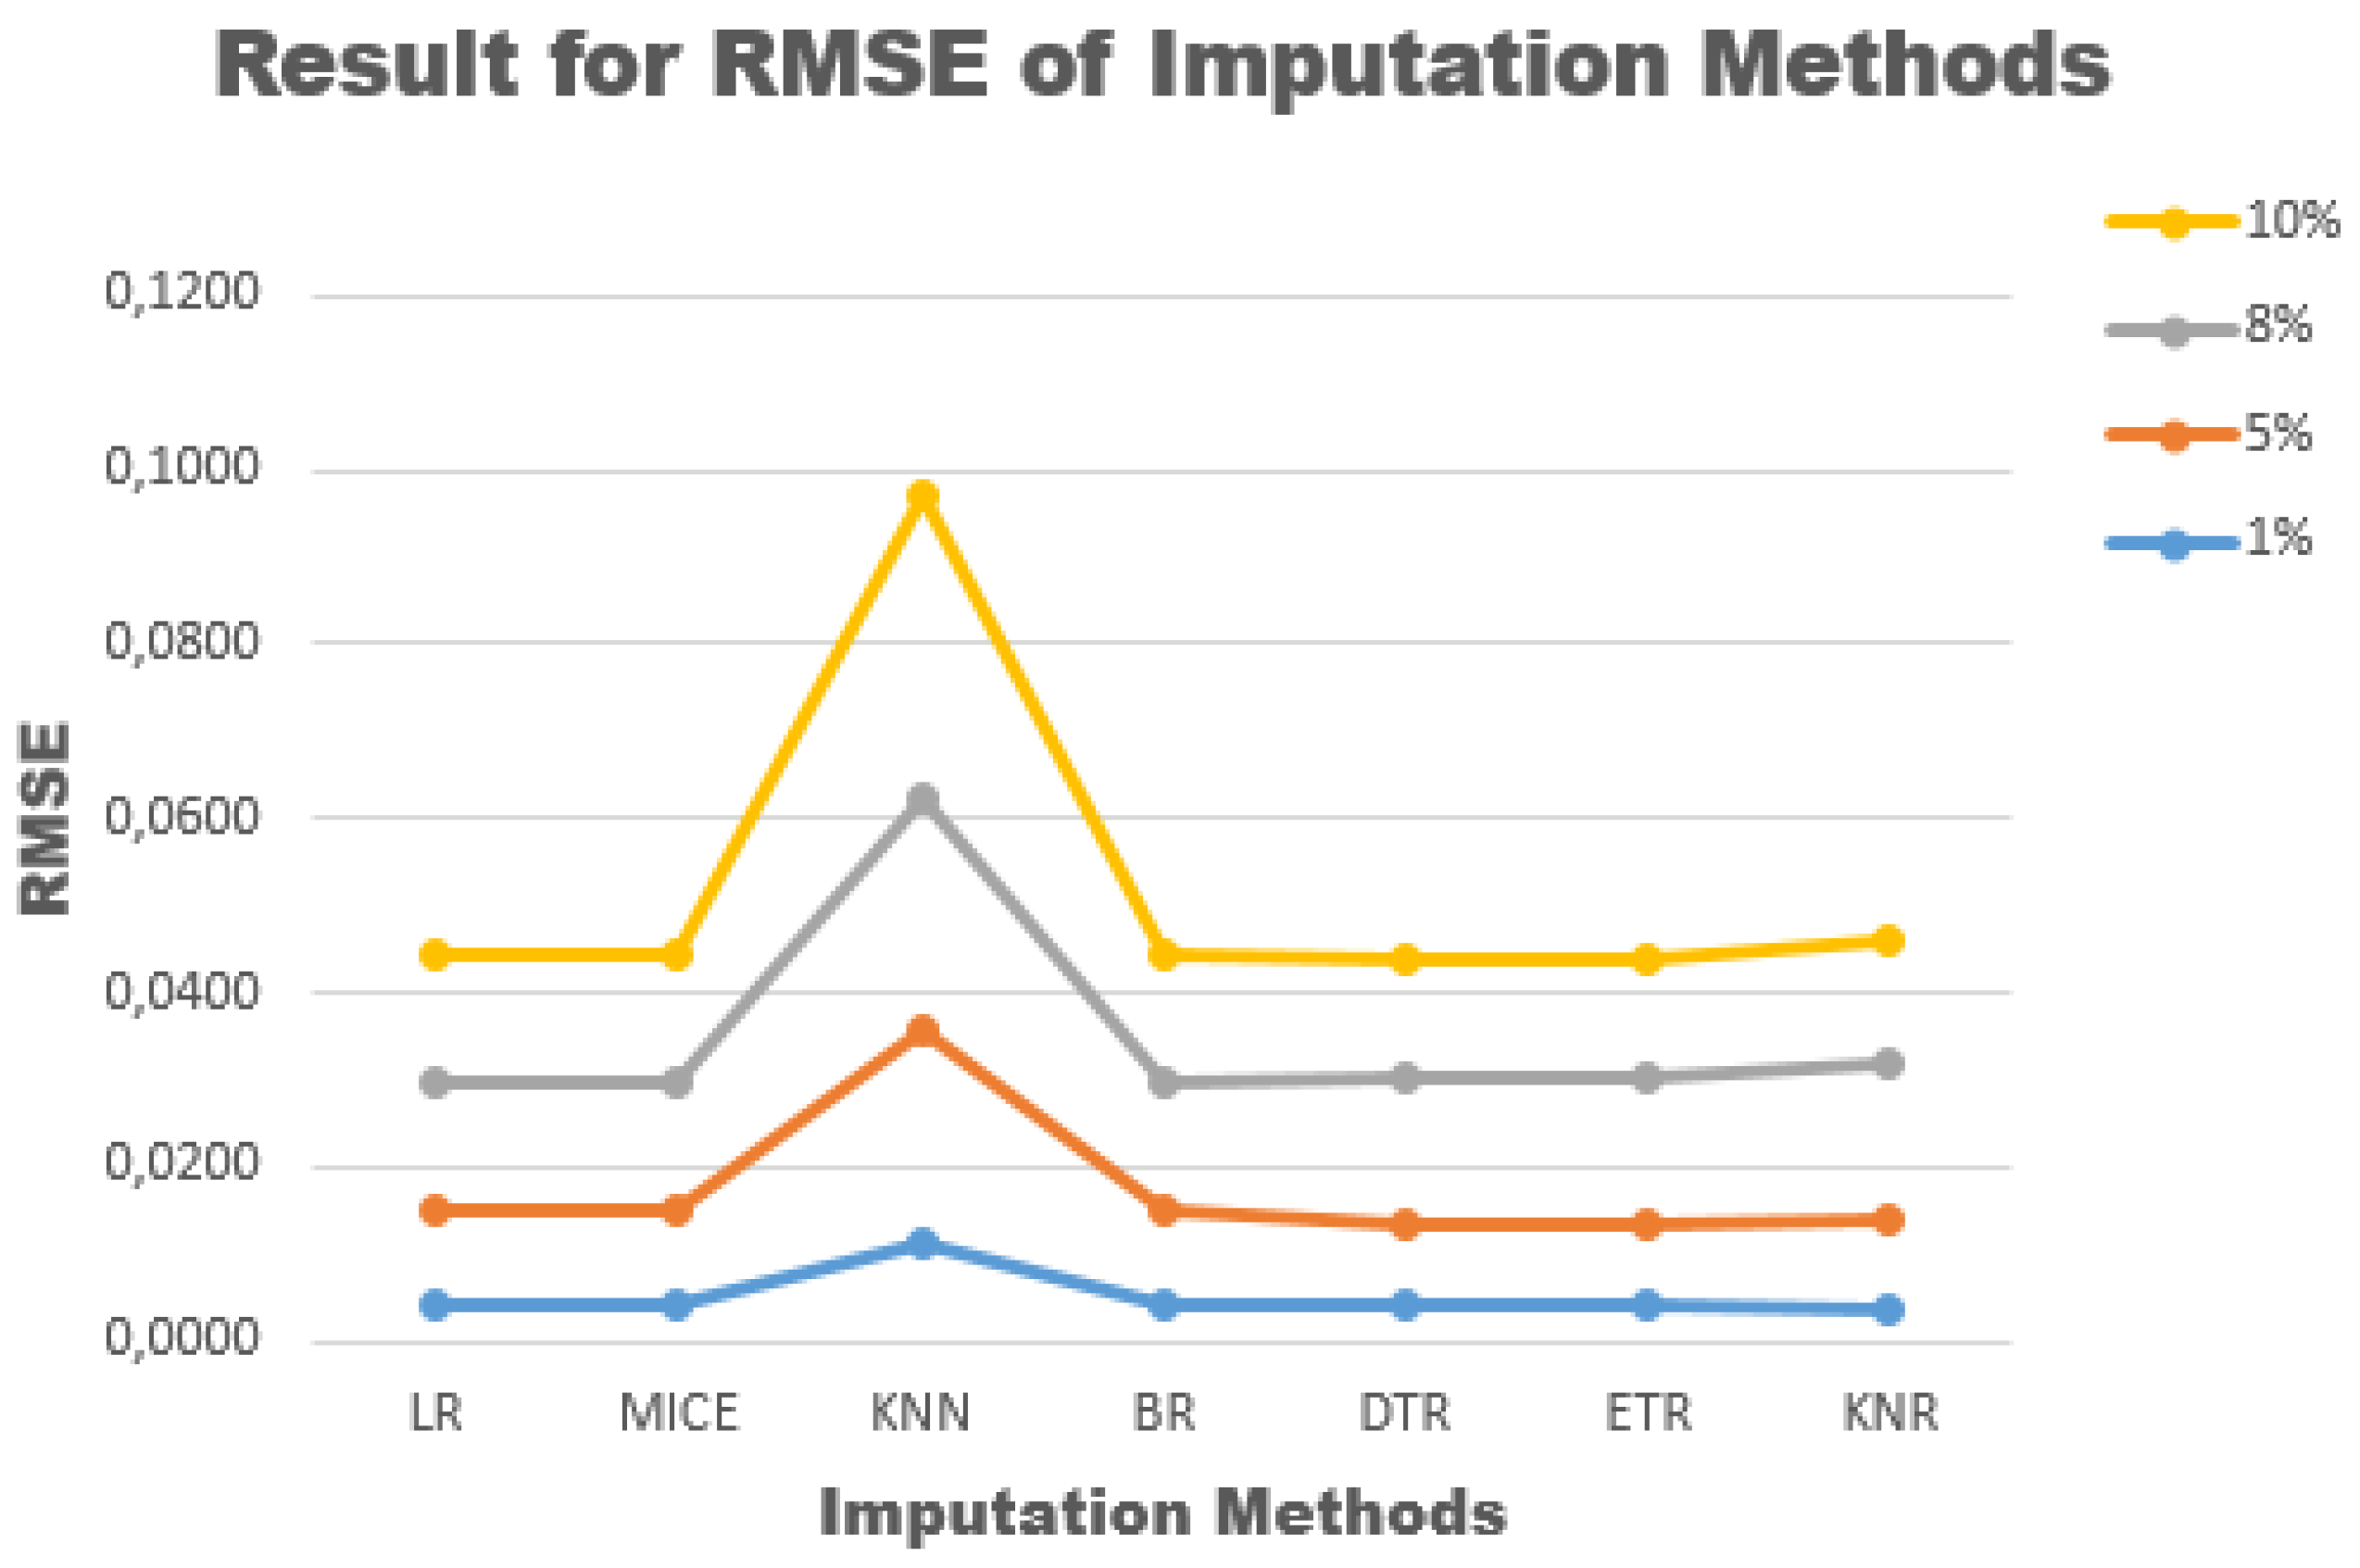
Figure 15.
Result for RMSE of forecasting models.
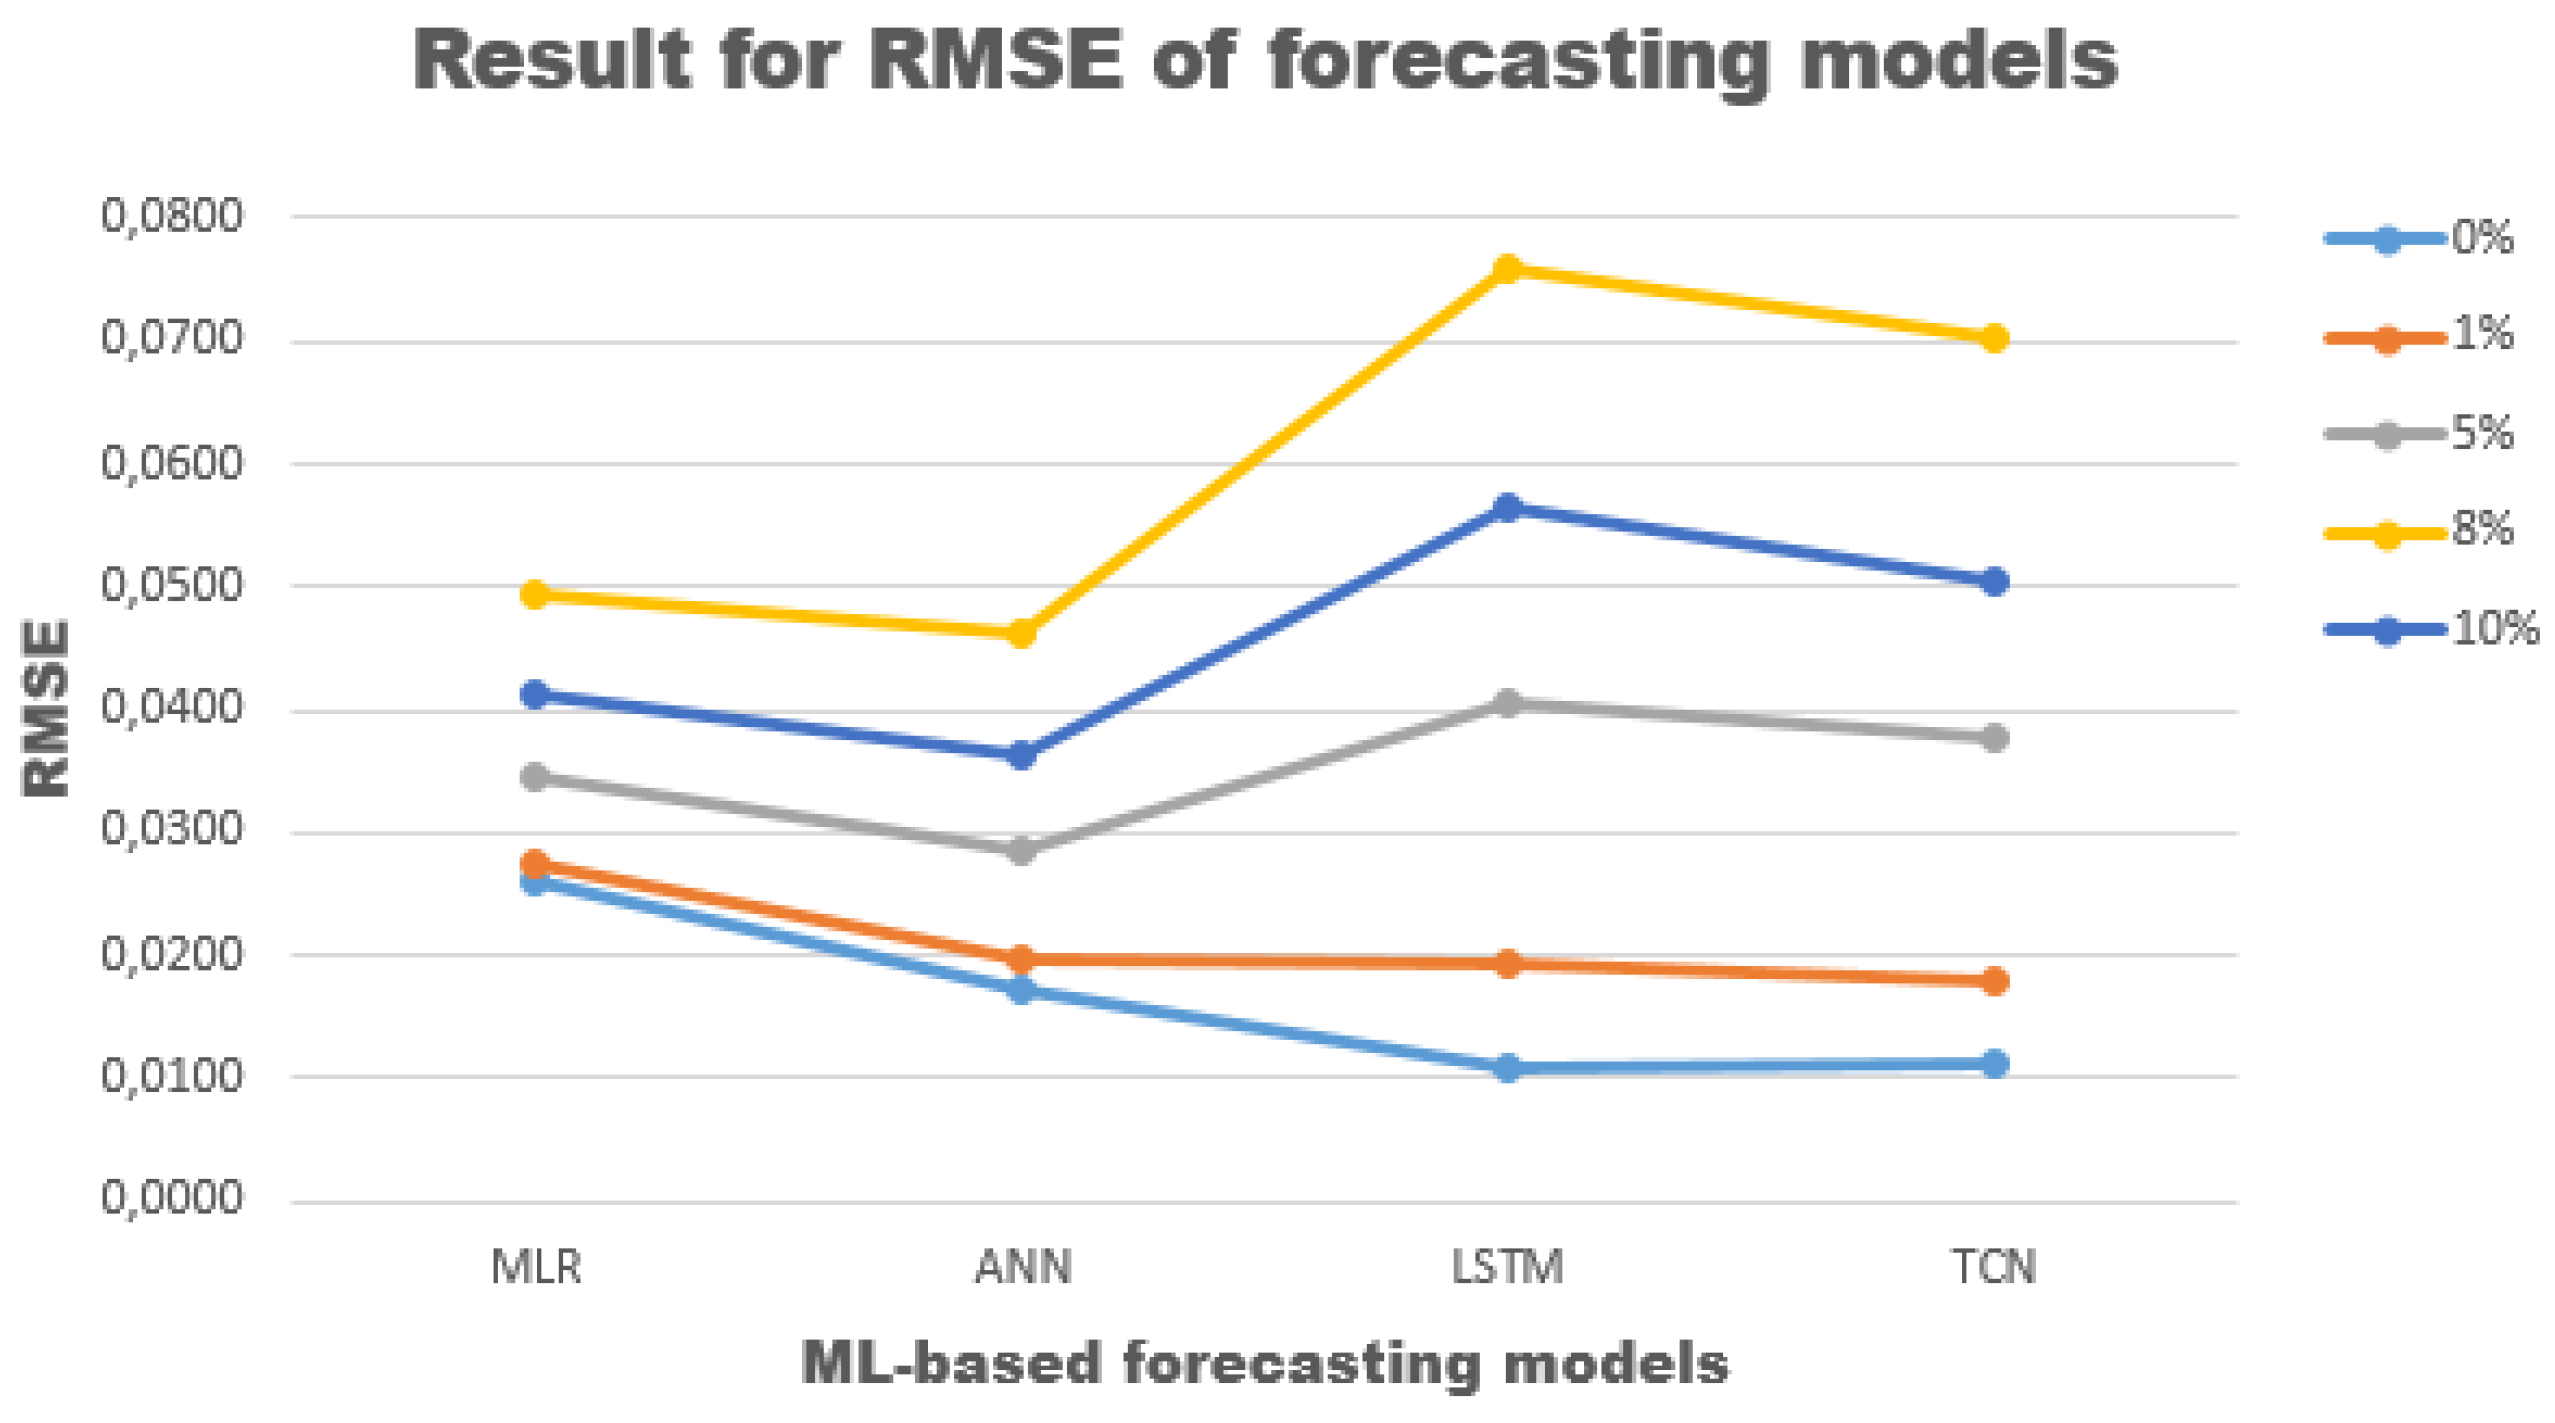
Figure 16.
Weather forecast based on weather observation data containing no anomalies.
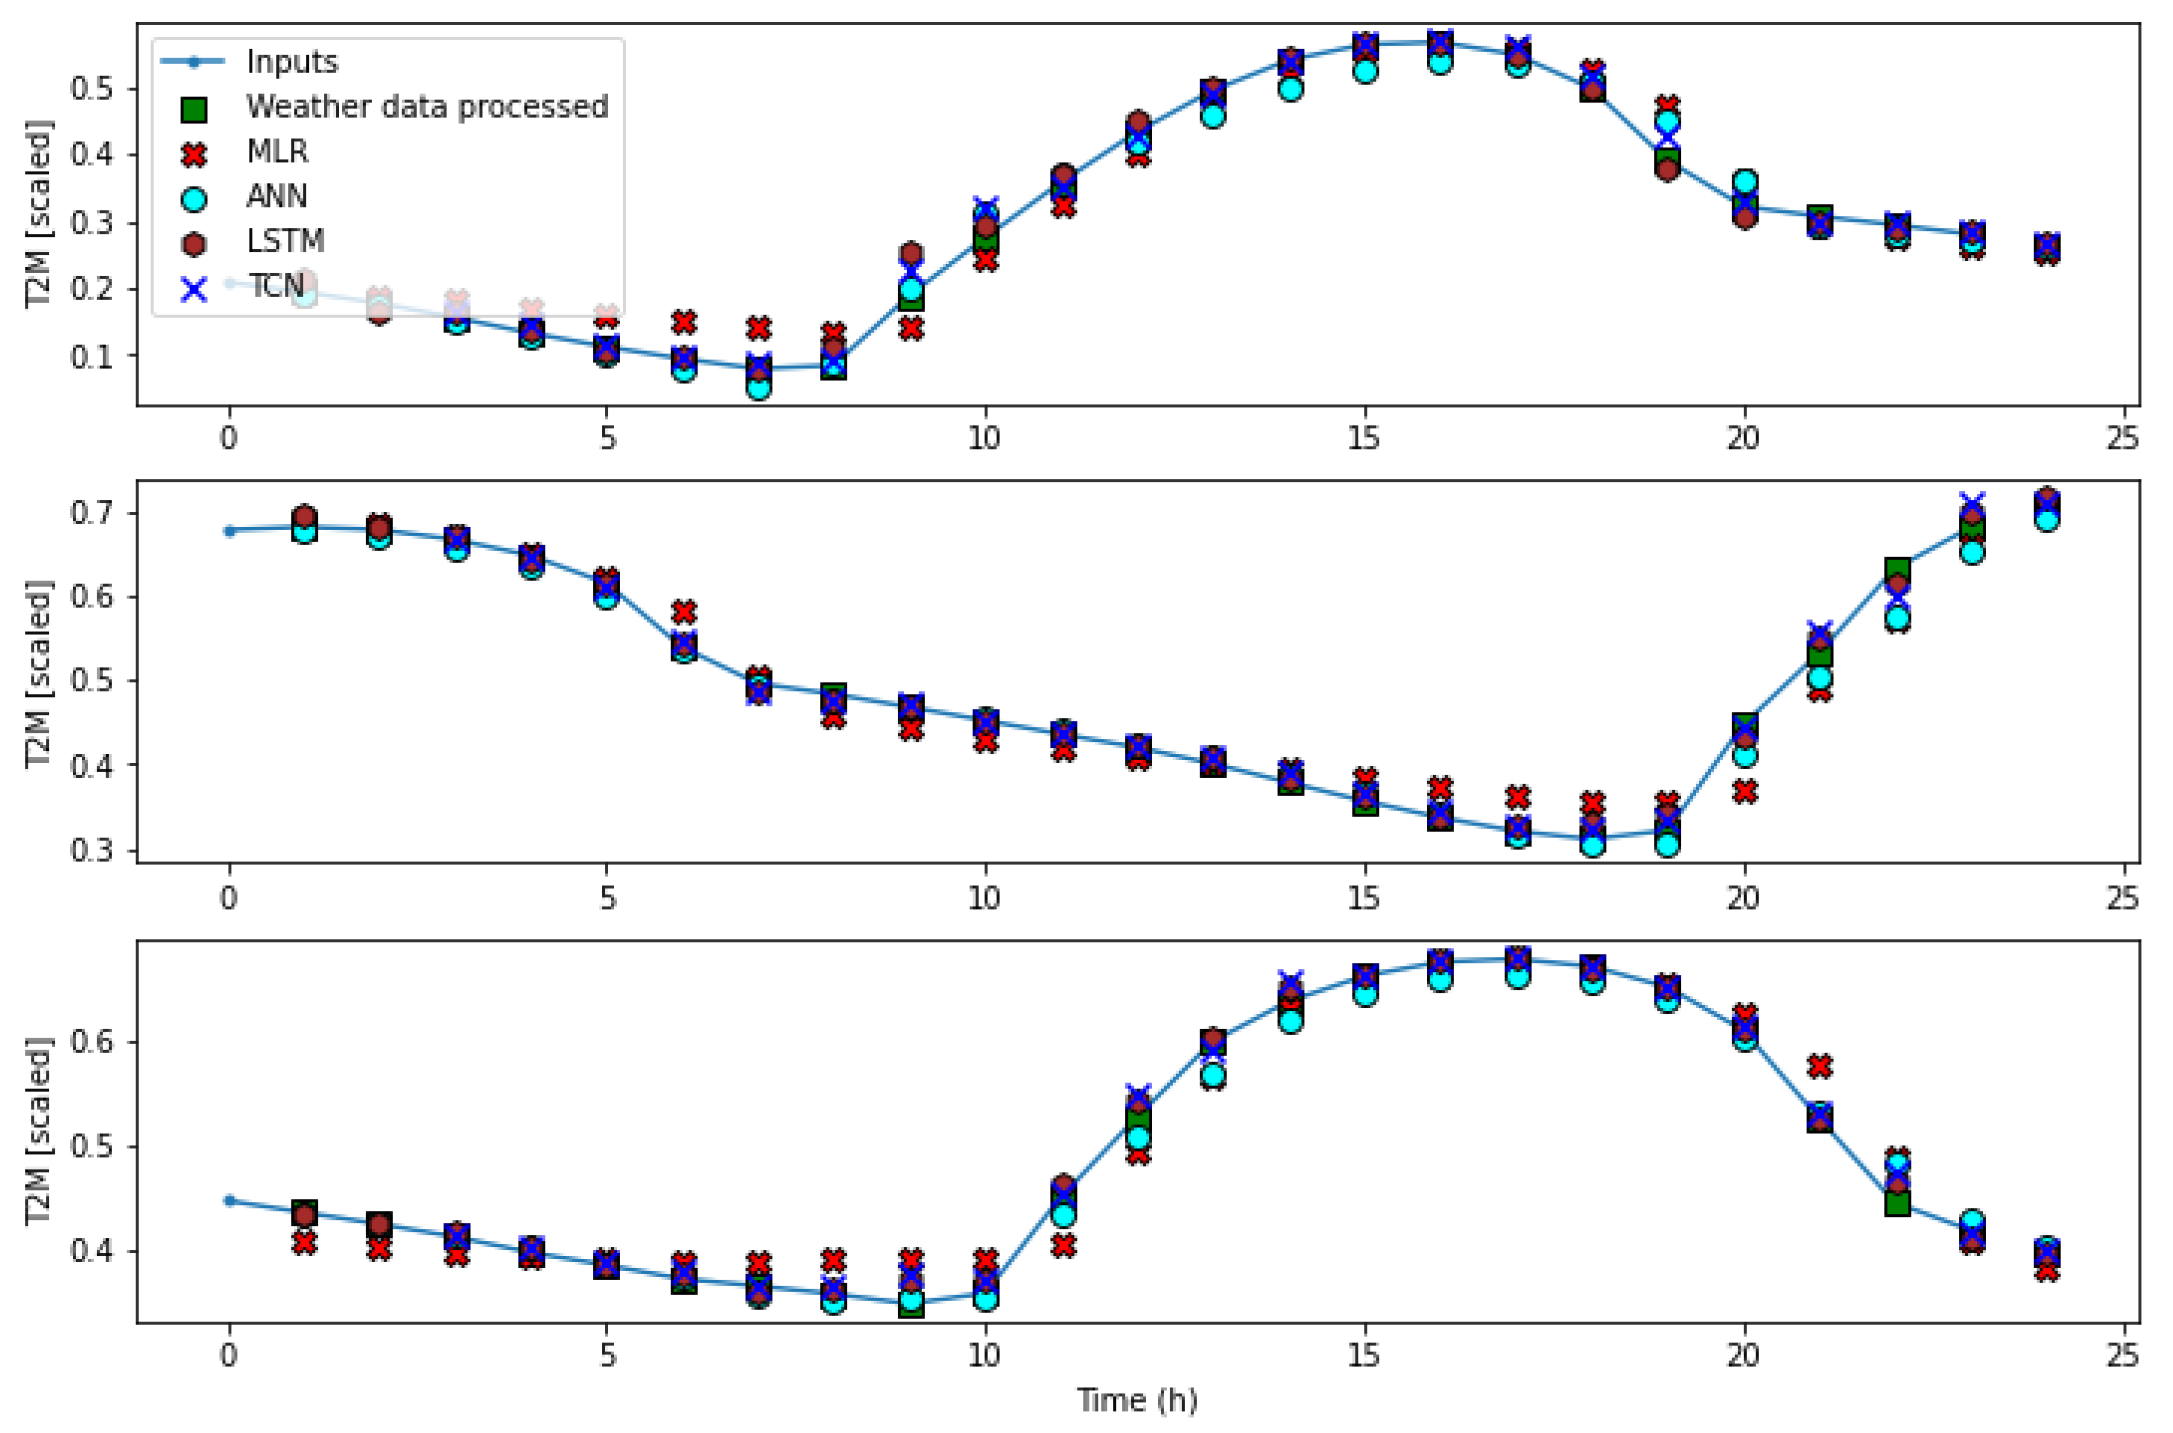
Figure 17.
Weather forecast from cleaned data with a prior anomaly rate of .

Figure 18.
Weather forecast from cleaned data with a prior anomaly rate of .
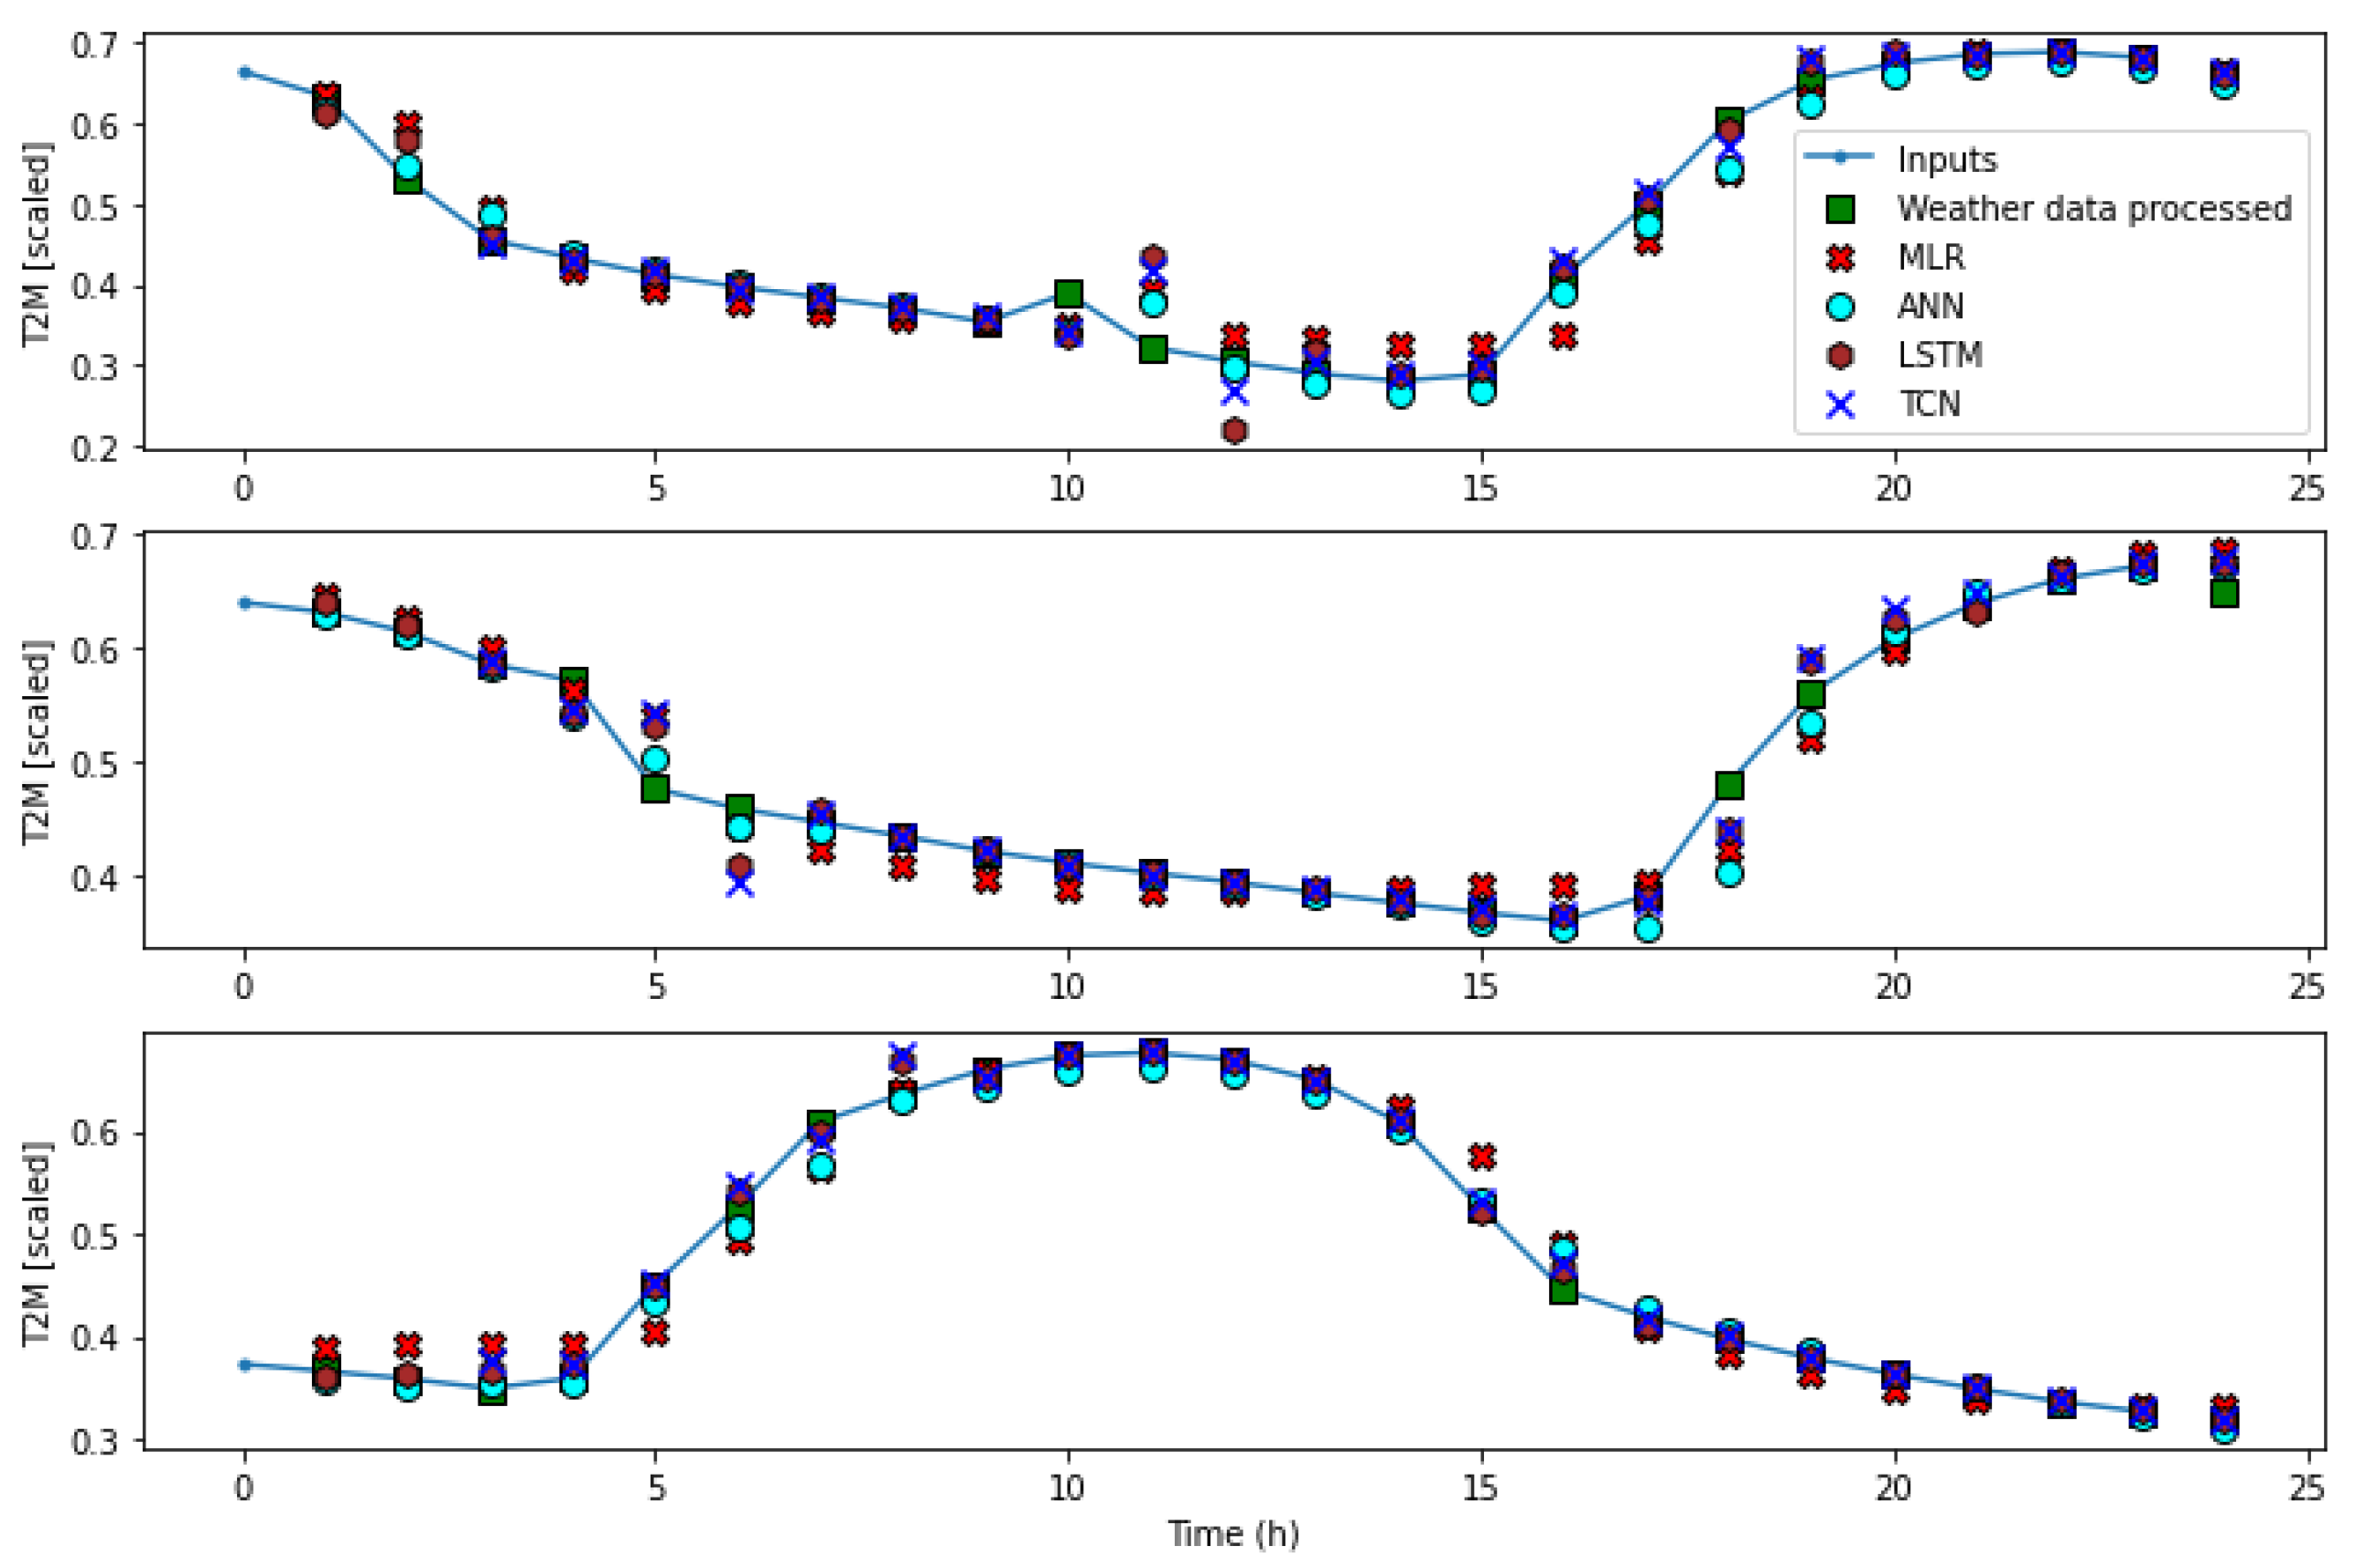
Figure 19.
Weather forecast from cleaned data with a prior anomaly rate of .
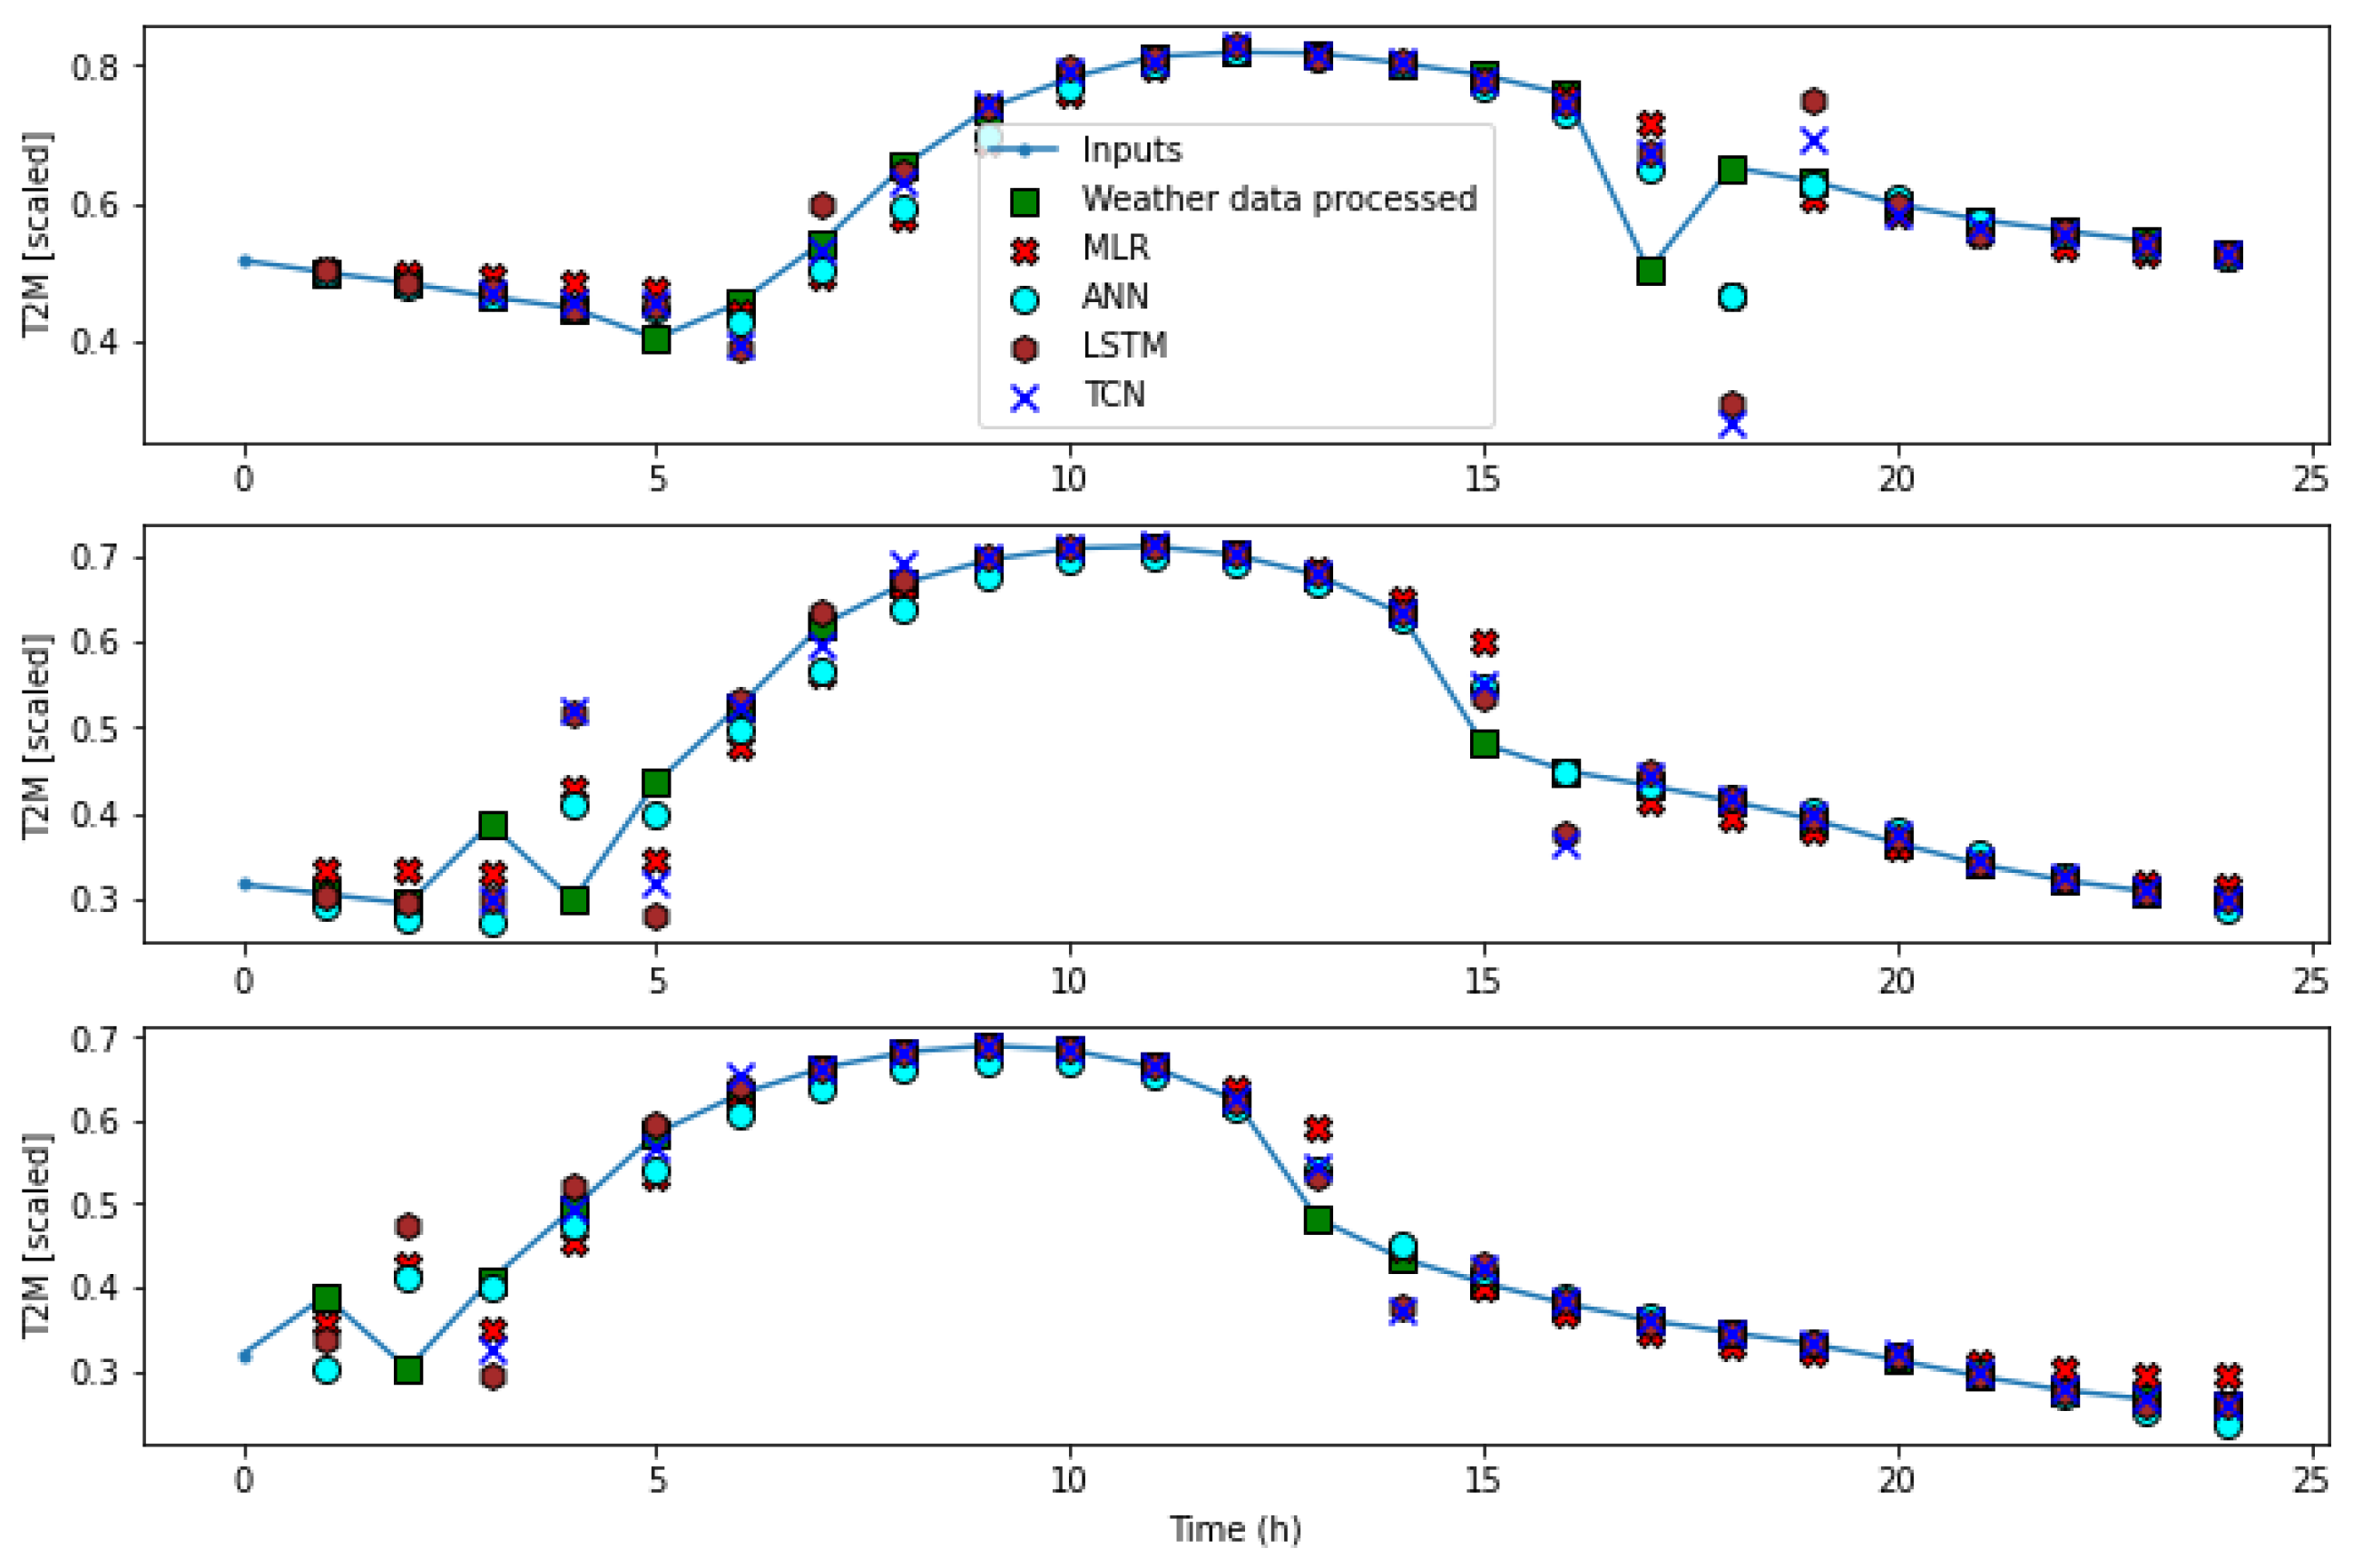
Figure 20.
Weather forecast from cleaned data with a prior anomaly rate of .
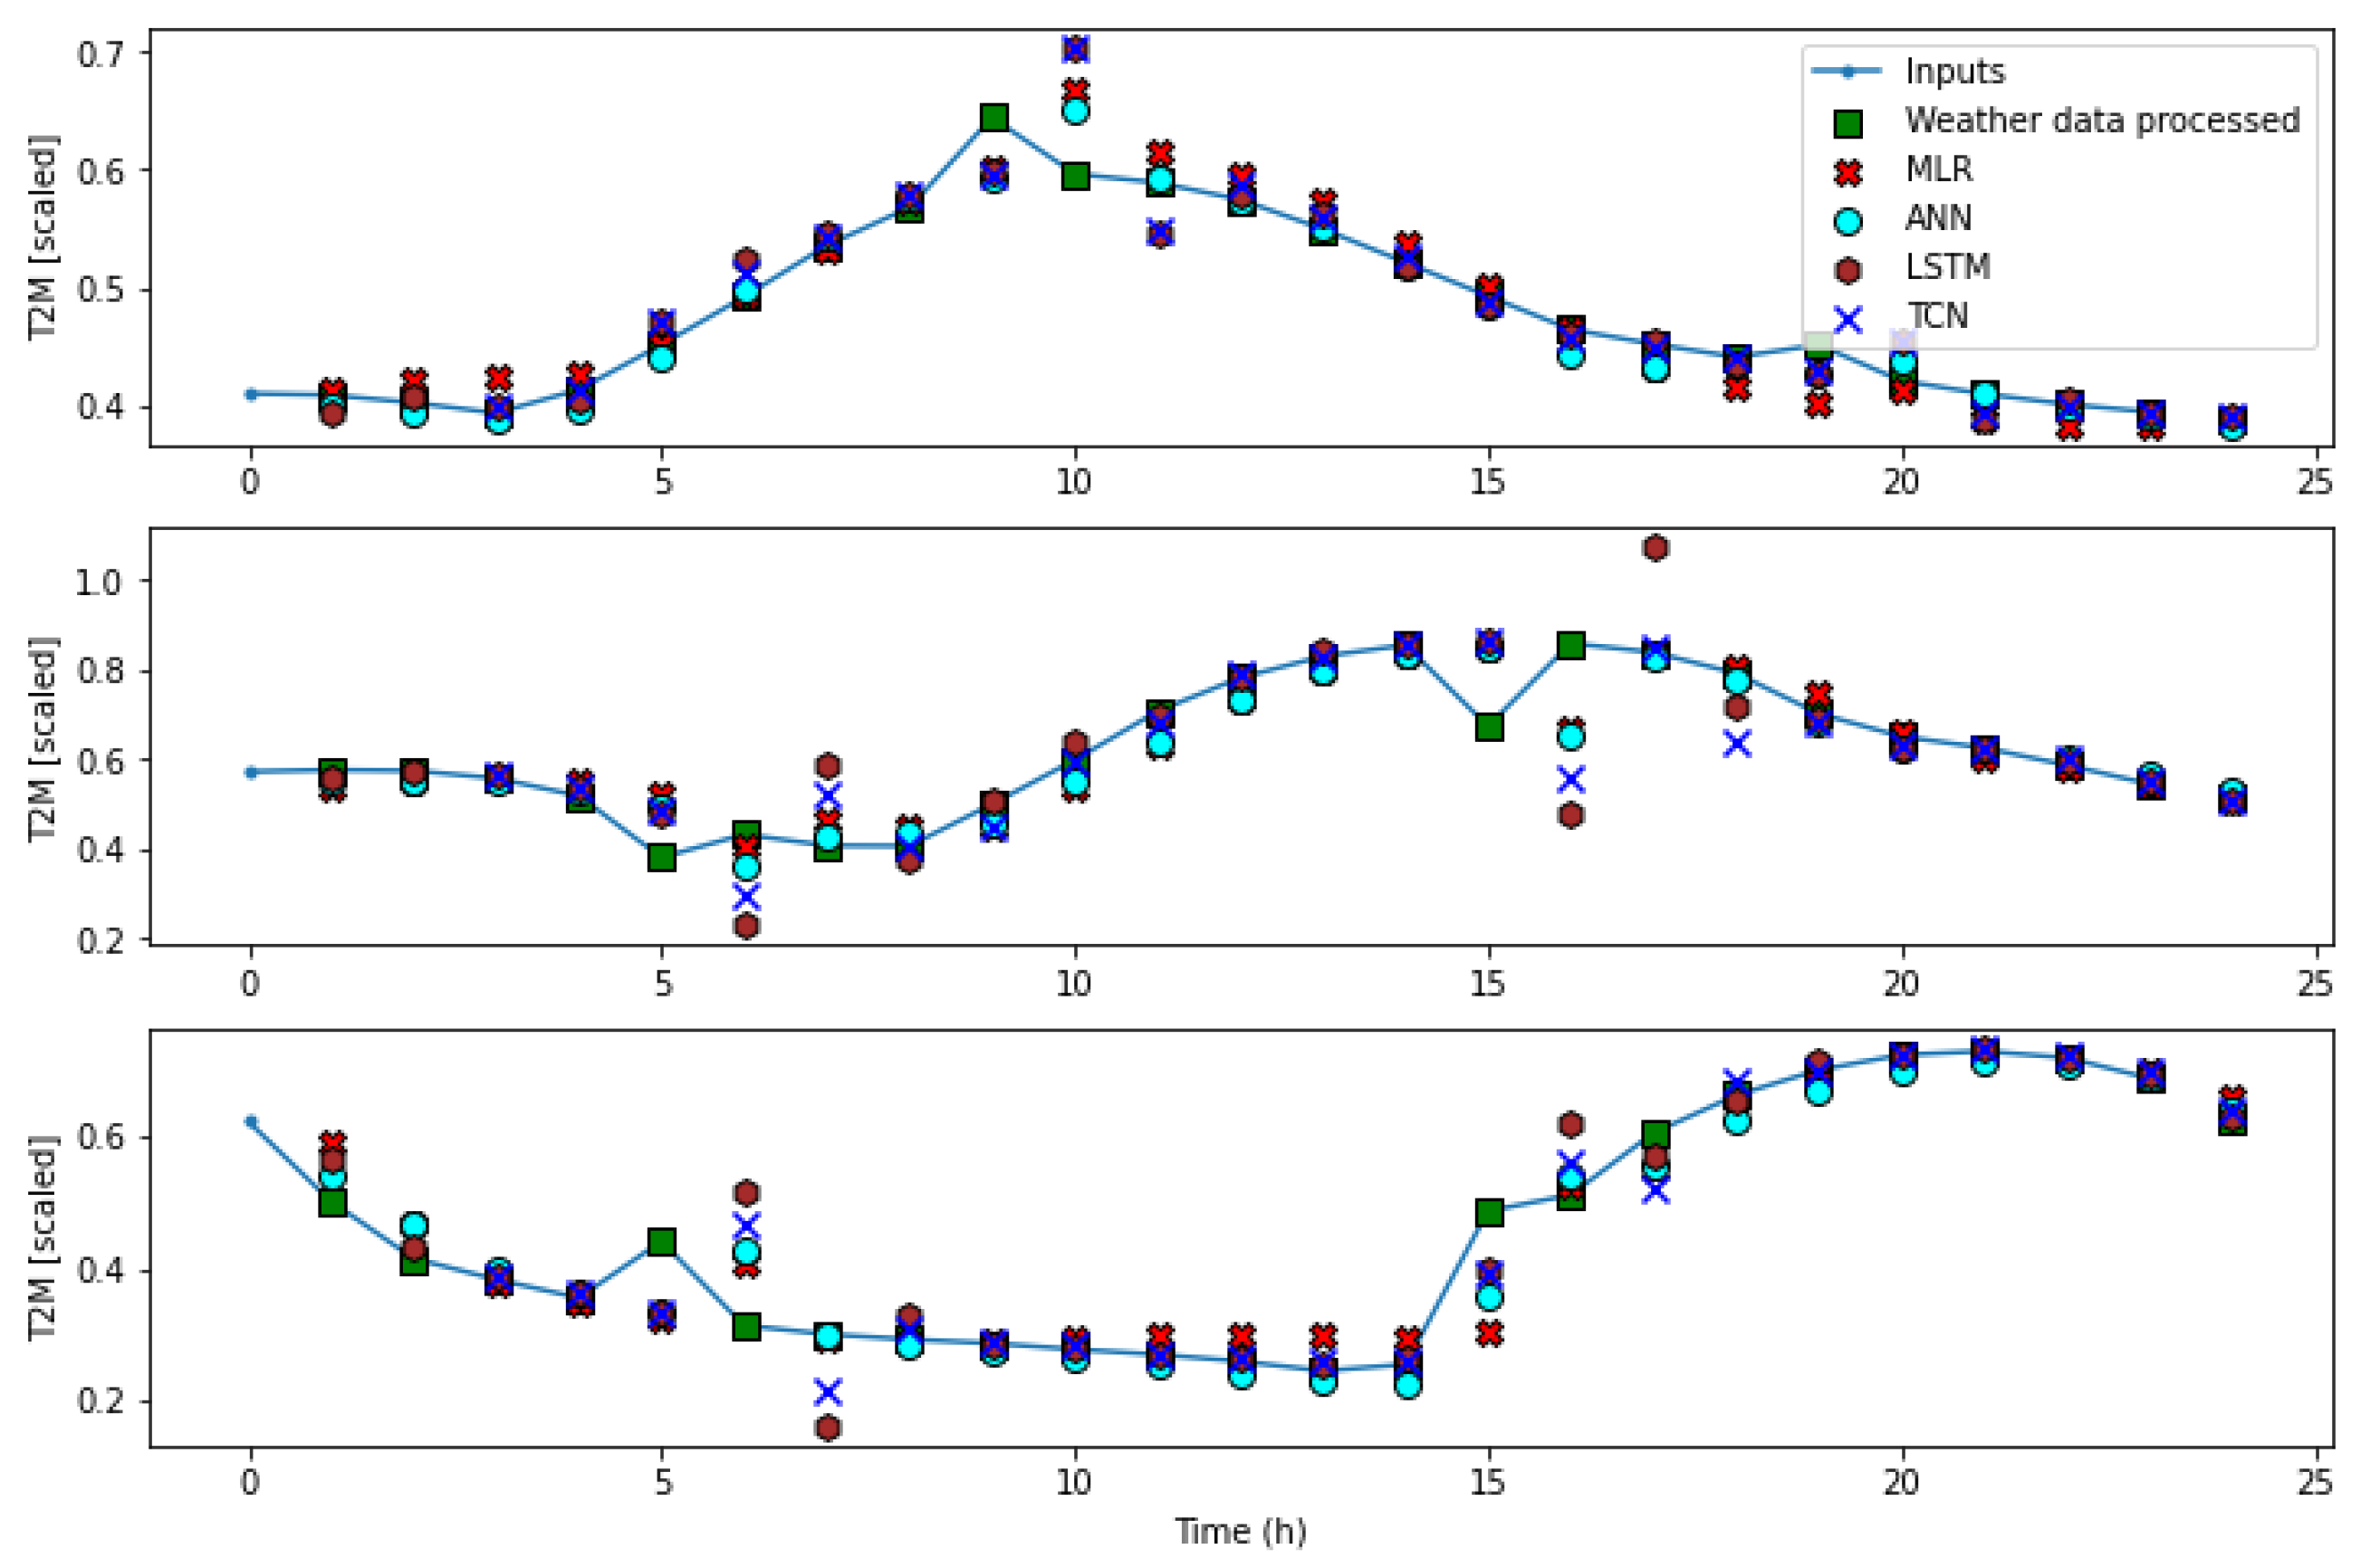
Figure 21.
Proposal for an architecture of a weather forecasting system.
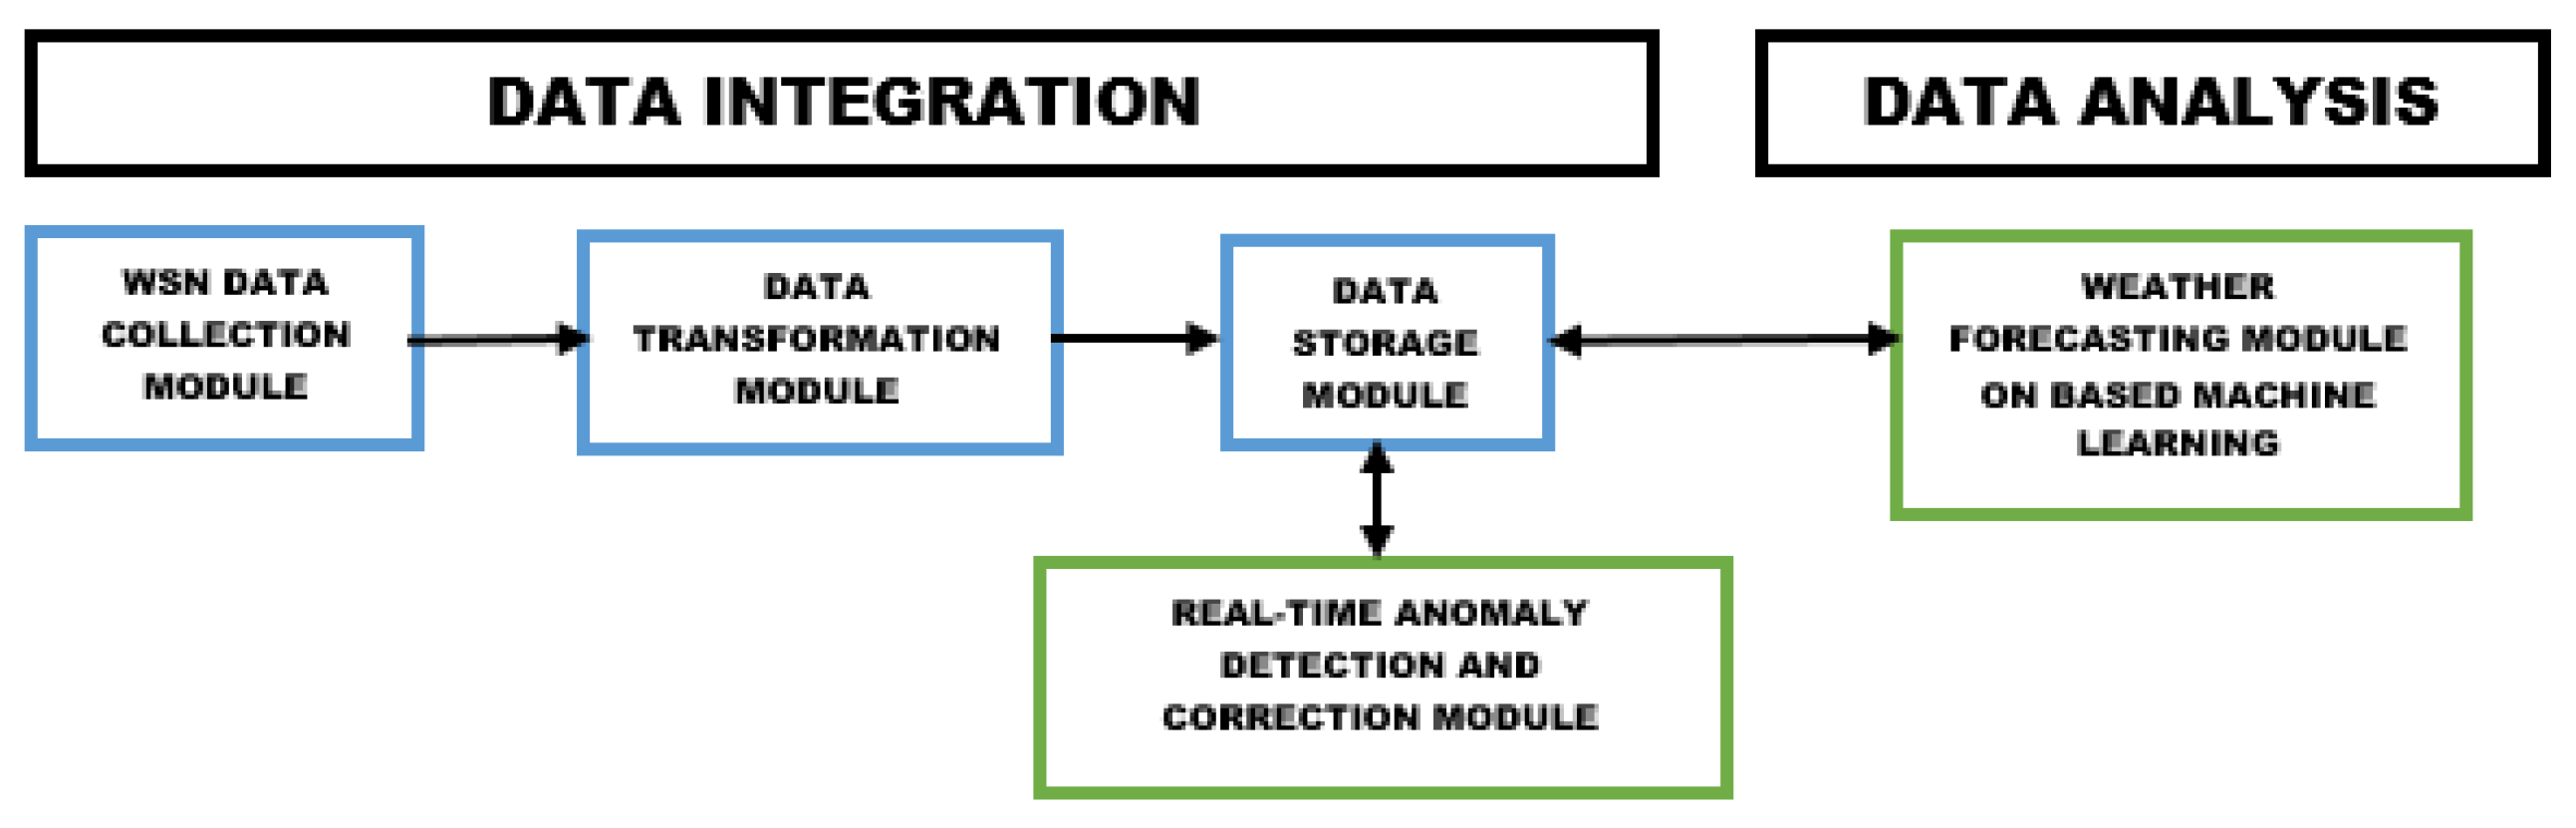
Table 2.
RMSE.
| Imputation | 1% | 5% | 8% | 10% |
|---|---|---|---|---|
| models | rate | rate | rate | rate |
| LR | ||||
| MICE | ||||
| KNNI | ||||
| BR | ||||
| DTR | ||||
| ETR | ||||
| KNR | ||||
| Interval |
Table 3.
Execution time (second).
| Imputation | 1% | 5% | 8% | 10% |
|---|---|---|---|---|
| models | rate | rate | rate | rate |
| LR | ||||
| MICE | ||||
| KNNI | ||||
| BR | ||||
| DTR | ||||
| ETR | ||||
| KNR | ||||
| Interval |
Table 4.
RMSE of forecasting models.
| ML-based weather forecasting models | 0% rate | 1% rate | 5% rate | 8% rate | 10% rate |
|---|---|---|---|---|---|
| MLR | |||||
| ANN | |||||
| LSTM | |||||
| TCN | |||||
| Interval |
Disclaimer/Publisher’s Note: The statements, opinions and data contained in all publications are solely those of the individual author(s) and contributor(s) and not of MDPI and/or the editor(s). MDPI and/or the editor(s) disclaim responsibility for any injury to people or property resulting from any ideas, methods, instructions or products referred to in the content. |
© 2025 by the authors. Licensee MDPI, Basel, Switzerland. This article is an open access article distributed under the terms and conditions of the Creative Commons Attribution (CC BY) license (http://creativecommons.org/licenses/by/4.0/).
Copyright: This open access article is published under a Creative Commons CC BY 4.0 license, which permit the free download, distribution, and reuse, provided that the author and preprint are cited in any reuse.


