
Submitted:
12 September 2025
Posted:
15 September 2025
You are already at the latest version
Abstract
To identify optimal water and fertilizer management for walnut trees under subsurface drip irrigation in Southern Xinjiang, a field experiment was conducted on 16-year-old ‘Wen 185’ walnuts in Aksu. Four irrigation levels—75% ETc (W1), 100% ETc (W2), 125% ETc (W3), and 150% ETc (W4)—and three fertilizer levels—N 270, P 240, K 300 kg·hm-2 (F1), N 360, P 320, K 400 kg·hm-2 (F2), and N 450, P 400, K 500 kg·hm-2 (F3)—were applied, resulting in 12 treatments. This study assessed the impact of different water and fertilizer treatments on walnut growth dynamics, yield, fruit quality, water and fertilizer use efficiency, and soil nitrate residue. Principal component analysis (PCA) was employed to develop comprehensive growth and photosynthesis indices (CGI and CPI). Pearson correlation analysis was used to identify parameters significantly correlated with yield and quality. A game theory-based combination weighting method was then applied to integrate six categories of indicators: growth, photosynthesis, yield, quality, resource use efficiency, and environmental impact. A coupled TOPSIS-GRA model was established for comprehensive evaluation, and binary quadratic regression was used to optimize the water and fertilizer application ranges. The results demonstrated that the W2F2 treatment provided the most effective synergistic enhancement in terms of growth, photosynthetic performance, yield, and quality. It also maintained high water use efficiency (WUE) and partial factor productivity of fertilizer (PFP), while effectively mitigating nitrate accumulation in deep soil layers. The CGI and CPI indices, developed through PCA, successfully quantified phenological growth and photosynthetic characteristics. Correlation analysis identified seven core parameters. Among these, IV-CPI showed the strongest correlation with yield, whereas II-CPI contributed notably to increasing single-fruit weight and reducing tannin content. Within the comprehensive evaluation system employing game theory-based combination weighting, yield was assigned the highest weight (0.215), and IV-CPI received the lowest (0.011). The TOPSIS-GRA model ranked W2F2 highest, with an optimal irrigation range of 5869.94–6519.81 m3·hm-2 and fertilizer application rate of 975.54–1107.49 kg·hm-2. The coupled TOPSIS-GRA model effectively balanced the objectives of high yield, superior quality, resource use efficiency, and environmental sustainability. It offers a solid theoretical basis and practical technical guidance for enhancing both the productivity and sustainability of walnut orchards under subsurface drip irrigation in the Southern Xinjiang region.
Keywords:
walnut
; water and fertilizer interaction
; TOPSIS-GRA
; subsurface drip irrigation
1. Introduction
As a globally important woody oil crop and economic forest species, walnut nuts are rich in nutrients such as crude protein, crude fat, and soluble sugars, endowing the tree with both ecological and economic value [1]. Benefiting from its temperate continental climate and unique light and heat resources, the Aksu region has become a major producing area of high-quality walnuts in China [2]. However, with an average annual precipitation of only 75.1–131.3 mm, aridity and water scarcity form a critical bottleneck restricting the scaled development of the walnut industry in this region [3]. As a core water-saving irrigation mode in arid areas, subsurface drip irrigation offers the advantages of reducing evaporative loss and enabling precise regulation of water and fertilizer conditions in the root zone [4]. The integration of this technology with scientific water and nutrient management is key to achieving the dual goals of enhancing quality and efficiency alongside water conservation and emission reduction in walnut cultivation.
The interaction between water and fertilizer is a critical management practice for regulating fruit tree growth, directly influencing walnut growth patterns, final yield, and quality [5]. Crop yield and quality are the result of cumulative growth and developmental processes over time [6]. Studies show that implementing mild regulated deficit irrigation during the flowering and fruit-setting period can effectively curb excessive vegetative shoot growth, promote the development of reproductive organs, and subsequently increase fruit yield [7]. Further research by Zhang [8] indicates that increasing the water supply during the fruit expansion stage enhances leaf photosynthetic performance and has a positive impact on yield.Meanwhile, Du [9] elucidated the soil microbiological mechanisms through which fertilization improves walnut yield and quality.Therefore, a precise understanding of the relationship between key growth indicators in each phenological stage and the final yield and quality is fundamental to optimizing water and fertilizer management strategies.For comprehensive evaluation, the Technique for Order Preference by Similarity to Ideal Solution (TOPSIS) and Grey Relational Analysis (GRA) are widely used to identify optimal water and fertilizer regimens [10,11]. These methods are favored because they simultaneously measure the proximity to an ideal solution and account for dynamic trends.However, current research often relies on static measurements taken only at the end of the growth cycle, neglecting the foundational role of early-stage development in determining final outcomes [12]. Furthermore, there are significant limitations in the selection and integration of evaluation indicators [13]. The multitude of dynamic growth indicators across different phenological stages can lead to information overlap and distorted weighting if directly incorporated into an evaluation model, ultimately compromising the accuracy and scientific validity of the assessment.
2. Materials and Methods
2.1. Site Description
The field experiment was conducted from March to September 2024 at the Arboriculture Experiment Base of Xinjiang Agricultural University, located at the Hongqipo Farm in Aksu Prefecture, Xinjiang (80°14’E, 41°16’N; altitude 1,133 m). See Figure 1 for the specific geographical location. The site is situated on the mid-southern foothills of the Tianshan Mountains, bordering Aksu City to the south and Wensu County to the west. The region experiences a typical temperate continental climate, characterized by an average annual solar radiation of 544.115–590.156 kJ/cm2, 2,855–2,967 hours of sunshine per year, and a frost-free period of 205–219 days. The mean annual precipitation is 42.4–94.4 mm, the mean annual temperature is 11.2 °C, and the annual effective accumulated temperature is 3,950 °C.
2.2. Experimental design
The experiment utilized 16-year-old ‘Wen 185’ walnut trees, planted with a spacing of 3 m × 5 m. The experimental plot was flat, and the trees exhibited uniform growth vigor. Based on local grower expertise, the growth cycle of the ‘Wen 185’ walnut in Aksu was divided into seven phenological stages: budburst, flowering and fruit set, fruit expansion, shell hardening, oil conversion, maturity, and leaf fall. The crop evapotranspiration (ETc, mm) for each irrigation cycle was calculated using data from the on-site weather station. The irrigation volume was then determined based on the calculated ETc. The water requirement for each growth stage was calculated as follows:
where ETci is the crop water requirement (mm) in time period i; ET0i is the reference evapotranspiration (mm) in time period i; and Kci is the crop coefficient for time period i. The Kci values for the walnut growth stages are as follows [14]: budburst, 1.05; flowering and fruit set, 1.15; fruit expansion, 1.18; shell hardening and oil conversion, 1.45; maturity, 1.18.
Four irrigation levels were established: 75% ETc (W1), 100% ETc (W2), 125% ETc (W3), and 150% ETc (W4). Fertilization rates were determined based on local practices, using urea (N 46.4%), monoammonium phosphate (P 46%), and potassium sulfate (K 57%). Three fertilizer levels were applied at an N:P:K ratio of 9:8:10: N 270-P 240-K 300 kg·ha-1 (F1), N 360-P 320-K 400 kg·ha-1 (F2), and N 450-P 400-K 500 kg·ha-1 (F3). This resulted in a total of 12 treatments. The irrigation interval was 10 days; the detailed irrigation and fertilization schedule is presented in Table 1.
For each treatment, three walnut trees with uniform growth, free from pests, diseases, frost damage, and with comparable trunk diameter and canopy size were selected as fixed sample trees, constituting three experimental replicates. A subsurface drip irrigation system was employed using Netafim’s anti-siphon DNCPI drip lines with a 16 mm diameter, 1 mm wall thickness, 50 cm emitter spacing, and a flow rate of 2 L/h. Two drip lines were installed per tree row, positioned 50 cm from the trees on each side and buried at a depth of 40 cm. A schematic diagram of the subsurface drip irrigation and fertigation system is shown in Figure 2.
2.3. Data Measurement and Method
2.3.1. Measurement of Growth Indicators
(1) New shoot growth (NSG). Four shoots were randomly selected and tagged in the east, south, west, and north directions of each sample tree. Their growth was measured every 10 days from April 20 to August 31, 2024, using a measuring tape. (2) Leaf area index (LAI). A 180° circular fisheye camera was used to capture hemispherical images facing upwards under the canopy. Images were taken 50 cm from the trunk in the four cardinal directions (east, south, west, north) of each sample tree every 10 days from April 27 to August 31, 2024. The images were processed using the HemiView digital plant canopy analysis system to determine the leaf area index. (3) Fruit volume (FV). Fruit volume was measured using a digital vernier caliper with an accuracy of 0.01 mm. Starting 20 days after fruit set, three representative fruits were selected from each sample tree. Their vertical and horizontal diameters were measured periodically until no further size increase was observed. The volume was calculated using the formula for an ellipsoid. (4) Relative chlorophyll content (SPAD). Relative chlorophyll content was measured using a SPAD-502 meter (Konica Minolta, Japan). From each sample tree, four leaves with similar growth were randomly selected from the four cardinal directions and tagged as fixed samples. From April 27 to August 31, 2024, measurements were taken every 10 days at three locations (base, middle, and tip) on each leaf, and the average value was calculated.
2.3.2. Measurement of Photosynthetic Parameters
Photosynthetic parameters were measured using a portable photosynthesis system (CIRAS-3, PP Systems, USA). Measurements were conducted on clear days during four key growth stages: flowering and fruit set, fruit expansion, shell hardening, and oil conversion. On each measurement day, data were collected from 10:00 to 20:00 at two-hour intervals. The parameters measured included the net photosynthetic rate (Pn), transpiration rate (Tr), stomatal conductance (Gs), and intercellular CO2 concentration (Ci) of walnut leaves.
2.3.3. Fruit Quality Indicators
At maturity, walnut fruits were analyzed for their content of crude protein, crude fat, soluble sugars, starch, and tannins. The crude protein content was determined using the Kjeldahl method. Crude fat was measured by Soxhlet extraction. Soluble sugar content was quantified with the anthrone reagent method. Starch content was analyzed using enzymatic hydrolysis, and tannin content was determined by colorimetry.
2.3.4. Yield Measurement
At maturity, walnuts were harvested from three trees selected for each treatment. The total number of nuts collected from each tree was counted. From each tree’s harvest, 100 walnuts were randomly selected. These were sun-dried, their green husks were removed, and the kernel mass of each individual nut was measured using an electronic scale with an accuracy of 0.01 g. The average kernel mass from the 100 nuts was then used to calculate the total yield.
2.3.5. Walnut Water Consumption
Walnut water use was calculated by measuring soil moisture and effective rainfall across different growth stages. The calculation followed this formula:
where ETt is the water use during a growth stage (mm); j is the number of a specific soil layer; n is the total number of soil layers; γj is the dry bulk density of the j-th soil layer (g/cm3); θj1 and θj2 are the soil water content at the beginning and end of the stage for the j-th layer, expressed as a percentage of dry soil weight; M is the amount of irrigation water applied during the period (mm); P0 is the effective rainfall during the period (mm); and K is the groundwater contribution during the period (mm). Due to the deep groundwater level in the study area, the value of K was considered zero.
2.3.6. Efficiency Indicators
Water use efficiency (WUE) was calculated as follows:
where Y is the walnut yield (kg·ha−1) and ET is the total water consumption during the growing season (m3·ha−1).
WUE=Y/ET
Partial factor productivity (PFP) was calculated as follows:
where F is the total amount of fertilizer applied during the walnut growing season (kg·ha−1).
PFP=Y/F
2.3.7. Soil Nitrate Nitrogen Residue
At the end of the growing season, one sample tree was selected from each replicate for soil sampling. Using an 8-cm diameter auger, soil samples were collected at 50 cm from the tree trunk. Sampling was conducted at 20 cm depth intervals to a total depth of 100 cm. After natural air-drying, the soil samples were passed through a 0.9 mm sieve. Soil nitrate nitrogen content was then determined using a high-precision multifunction analyzer (Model YT-TR60, China).
2.3.8. Meteorological Data
Meteorological parameters, including air temperature, solar radiation, rainfall, wind speed, and humidity, were automatically recorded throughout the walnut growing season using a WATCHDOG portable weather station. Measurements were taken at 30-minute intervals. The variations in air temperature, rainfall, and reference evapotranspiration ET0 during the 2024 growing season are shown in Figure 3.
2.4. Development of Comprehensive Growth Index (CGI) and Comprehensive Photosynthesis Index (CPI)
To establish a scientific evaluation system for water and fertilizer management decisions, a Comprehensive Growth Index (CGI) and Comprehensive Photosynthesis Index (CPI) were developed by integrating multi-dimensional indicators across growth stages. Growth indicators (NSG, FV, SPAD, LAI) and photosynthetic parameters (Pn, Tr, Gs, Ci) were analyzed using principal component analysis (PCA) to construct these indices. Following the methodology of Sun et al. [15] for key indicator selection in apple orchard evaluations, the indicator with the highest absolute loading value in each principal component was identified as the primary factor. Indicators with loadings within 10% of this primary factor’s value were selected as key parameters [16]. When multiple key parameters were identified within a single principal component, those showing strong correlations were replaced by the parameter with the highest loading value, while uncorrelated parameters were retained. The computational procedure consisted of the following steps.
(1) The values of key parameters in CGI and CPI were converted into scores using a sigmoid curve equation:
where S is the score of key parameters in the walnut CGI and CPI; a is the maximum score, set as 1 in this study; x is the value of key parameters in CGI and CPI; x0 is the mean value of key parameters in CGI and CPI; b is the slope parameter of the equation. Two types of indicators were considered in the principal components: “more-is-better” and “less-is-better” indicators. Accordingly, b values of -2.5 and 2.5 were assigned to “more-is-better” and “less-is-better” indicators, respectively.
(2) Standardized CGI and CPI:
where i denotes the i-th principal component;j represents the j-th key parameter within the i-th principal component; n is the total number of principal components; Vi is the cumulative variance of the i-th principal component from the extracted loadings; Wij is the weight of the j-th key parameter in the i-th principal component; Sij is the score of the j-th key parameter in the i-th principal component; and T represents the standardized CGI and CPI values.
2.5. Comprehensive Growth Evaluation of Subsurface Drip-Irrigated Walnuts Using TOPSIS-GRA Methodology
A comprehensive evaluation system for walnut growth was established by integrating CGI and CPI indices that showed significant correlations with final yield and quality through correlation analysis. This system holistically considers the growth process, yield, fruit quality, efficiency, and soil environment.
(1) Determination of Indicator Weights
Subjective weights were determined using the Analytic Hierarchy Process (AHP). Pairwise comparisons of indicator importance (on a 1-9 scale) were conducted via questionnaires to construct judgment matrices. The consistency index (CI) was then calculated, and the corresponding average random consistency index (RI) was referenced to derive the consistency ratio (CR). A CR value of less than 0.1 was considered acceptable for matrix consistency; otherwise, the matrix required revision. Detailed calculation methods are described in the literature. Objective weights were calculated using the CRITIC method, which integrates the contrast intensity, conflict, and information content among indicators. Generally, indicators conveying greater information are assigned higher weights. The specific calculation procedure is available in the literature. A game theory-based combination weighting method was employed to optimize the coefficients of the linear combination of basic weights, thereby reconciling discrepancies between subjective and objective weights and reducing bias from any single method [17]. This approach synthesizes both subjective and objective information, mitigates the limitations of individual weighting methods, and enhances the scientific rigor and reliability of weight allocation. The calculation is expressed as follows:
where W1j denotes the subjective weight; W2j represents the objective weight; and WT2j is the transpose of the objective weight matrix.
(2) Determining euclidean distance using the TOPSIS method
The normalized matrix was derived from the original data matrix comprising m evaluation indicators and n evaluation objects, expressed as follows:
The calculation formulas for the positive and negative ideal solution sets, denoted as and , are given below
where and represent the maximum and minimum values, respectively, of each evaluation indicator in matrix Z. The weighted Euclidean distances from the i-th evaluation object (i=1, 2, ..., n) to the positive and negative ideal solutions ( and ), denoted as and , are given by:
(3) Determination of Grey Relational Degree Using the GRA Method
In the normalized matrix Z, the grey relational coefficients between each evaluation object and the positive ideal solution with respect to the m-th indicator, denoted as and , are given by:
where is the distinguishing coefficient, typically set to 0.5. The grey relational degrees between the i-th (i=1, 2, ..., n) evaluation object and the positive/negative ideal solutions, denoted as and , were calculated as follows:
The parameters , , , and were normalized to dimensionless quantities, denoted as , , , and , using the following equations:
where represents the normalized parameters , , , and , while g denotes the original parameters , , , and .
(4) Comprehensive Evaluation Based on TOPSIS-GRA
A more robust relative closeness measure, comprising both positive and negative ideal solutions and denoted as and [18], was established by integrating the normalized weighted Euclidean distances with the grey relational degrees through a weighted synthesis approach. The calculations are expressed as follows:
where represents the decision-maker’s preference degree for position and shape, set to 0.5 in this study. Based on the relative closeness measure, comprehensive scores were calculated for different water and fertilizer treatments. These scores were then normalized to obtain standardized comprehensive scores , as expressed in the following equation:
2.6. Data processing
Data were analyzed using SPSS 25 for analysis of variance (ANOVA), multiple comparisons, and PCA. Microsoft Excel was used for data sorting, organization, and preliminary analysis. Correlation analysis and graphing were performed using Origin 2021, while the binary quadratic regression model was solved using Matlab 2021b.
3. Results
3.1. Effects of Water and Fertilizer Interaction on Growth Indicators in Subsurface Drip-Irrigated Walnuts
Walnut NSG, FV, LAI, and SPAD exhibited S-shaped growth patterns under all water and fertilizer treatments (Figure 4), though the response of these indicators to water and fertilizer regulation varied by growth stage. As shown in Figure 4a, NSG peaked during the fruit expansion stage. At this stage, the longest shoots were observed in the W4F3 treatment (18.3 cm), while the shortest were in W1F1 (11.7 cm). Compared to the flowering and fruit-setting stage, these values represented increases of 47.39% and 42.54%, respectively. By the maturity stage, shoot growth had ceased. The longest shoots remained under W4F3 (24.0 cm), and the shortest under W1F1 (18.2 cm).Irrigation amount, fertilizer application rate, and their interaction did not significantly affect NSG over the entire growth season (P > 0.05). However, distinct trends were observed: under the F1 and F2 fertilizer levels, NSG initially increased and then decreased with increasing irrigation, peaking in the W3F1 and W2F2 treatments (both 22.5 cm). Under the F3 fertilizer level, NSG continued to increase with irrigation, reaching its maximum in the W4F3 treatment. This indicates that increased irrigation can consistently promote new shoot growth under high fertilizer conditions.
As shown in Figure 4b, FV increased continuously throughout the growth stages, with the most significant expansion occurring during the fruit expansion stage. A significant water-fertilizer interaction was observed during the flowering and fruit-setting stage, where under the F1 fertilizer level, the W2 irrigation treatment resulted in the highest FV (19.91 cm3). During the fruit expansion stage, irrigation volume became the dominant regulating factor. Under the same fertilizer level, the W3 irrigation treatment yielded the optimal FV, with values of 51.89, 53.06, and 49.25 cm3 for the W3F1, W3F2, and W3F3 treatments, respectively. From the shell hardening to maturity stages, the growth rate slowed. The W2F2 treatment produced the highest FV (58.35 cm3), which was 29.44% greater than that of the W1F1 treatment (41.17 cm3). No significant differences were observed among the irrigation treatments during this period (P > 0.05).
As shown in Figure 4c, the leaf area index (LAI) was lowest during the flowering and fruit-setting stage, increased to a peak at the shell hardening stage as the fruit developed, and subsequently declined in the later stages due to nutrient redistribution to the fruits. Except during the flowering and fruit-setting stage, the W3 irrigation treatment significantly enhanced LAI under the same fertilizer level. At the shell hardening stage, LAI values reached 2.73, 2.84, and 2.86 in the W3F1, W3F2, and W3F3 treatments, respectively. Excessive irrigation (W4) suppressed LAI, with the W4F1, W4F2, and W4F3 treatments showing reductions of 16.5%, 15.5%, and 14.3%, respectively, compared to their corresponding W3 treatments. Increased fertilizer rates significantly promoted LAI. During the fruit expansion stage, the F3 fertilizer treatments increased LAI by an average of 22.9% compared to the F1 level, and a significant water–fertilizer interaction was observed during this period. The W3F3 treatment achieved the highest LAI (2.53) and consistently maintained the best performance throughout the entire growth season.
As shown in Figure 4d, the SPAD value followed a trend similar to that of LAI, peaking at the shell hardening stage and declining thereafter due to leaf senescence. Irrigation volume significantly affected SPAD values throughout the growing season. Under the F1 fertilizer level, the W3 treatment yielded the highest SPAD value (58.73). At the F2 and F3 fertilizer levels, the W2 treatment performed optimally, with SPAD values of 56.21 and 55.89 for W2F2 and W2F3, respectively. Both W1 (deficit) and W4 (excess) irrigation generally resulted in lower SPAD values, indicating that water stress in either form inhibited chlorophyll synthesis. Fertilizer amount had a significant impact only during the shell hardening stage, with the W3F1 treatment achieving the highest SPAD value (58.73). This treatment also maintained relatively high values in subsequent growth stages, highlighting the synergistic benefits of combining low fertilizer with medium irrigation in sustaining chlorophyll content.
3.2. Effects of Water and Fertilizer Interaction on Photosynthetic Indicators in Subsurface Drip-Irrigated Walnuts
The Pn, Tr, and Gs of walnuts exhibited unimodal curves during the growth season, peaking at the shell hardening stage, while the Ci continued to decline (Figure 5). As shown in Figure 5a, irrigation, fertilization, and their interaction significantly affected Pn throughout the growth season. Pn peaks generally occurred during the shell hardening stage, with the W2 and W3 irrigation treatments performing optimally. The W2F2 and W3F2 treatments reached values of 19.68 and 19.52 μmol·m-2·s-1, respectively. The fertilizer effect was dominated by the F3 level. During the shell hardening stage, the mean Pn under F3 fertilization was 18.60 μmol·m-2·s-1, higher than that under F1 (17.61 μmol·m-2·s-1) and F2 (18.22 μmol·m-2·s-1). A significant water-fertilizer interaction was observed, with the W2F2 combination maintaining the highest Pn during the flowering and fruit-setting, shell hardening, and oil conversion stages, at 15.34, 19.68, and 18.85 μmol·m-2·s-1, respectively.
As shown in Figure 5b, irrigation volume had a highly significant effect on Tr throughout the entire growth season. The Tr values also peaked during the shell hardening stage, with the W2 and W3 irrigation treatments performing best. The W2F2 and W3F2 treatments reached 9.56 and 9.75 mmol·m-2·s-1, respectively, representing increases of 12.3% to 14.1% compared to the W1 treatment (8.38 mmol·m-2·s-1). Under the F3 fertilizer level, Tr initially increased and then decreased with increasing irrigation, reaching a maximum of 9.42 mmol·m-2·s-1 in the W2F3 treatment and declining to 7.21 mmol·m-2·s-1 in W4F3. This indicates that moderate irrigation is more favorable for maintaining transpiration efficiency under high fertilizer conditions. Fertilizer application rate had a significant influence on Tr from the flowering and fruit-setting stage to the shell hardening stage. The mean Tr under the F2 fertilizer level was 8.73 mmol·m-2·s-1, which was higher than that under F1 (7.98 mmol·m-2·s-1) and F3 (8.21 mmol·m-2·s-1).
As shown in Figure 5c, irrigation volume and water-fertilizer interaction significantly affected Gs throughout the growth season. The variation pattern of Gs was consistent with those of Pn and Tr. During the shell hardening stage, the W3 irrigation treatment yielded the highest Gs, with the W3F2 treatment reaching 451.38 mmol·m-2·s-1. During the flowering and fruit-setting and oil conversion stages, the W2F2 treatment was optimal, with values of 296.57 and 406.74 mmol·m-2·s-1, respectively.
As shown in Figure 5d, irrigation volume had a significant effect on Ci only during the shell hardening stage. The mean Ci under the W3 irrigation treatment (258.13 μmol·mol-1) was higher than that under W1 (251.87 μmol·mol-1). Fertilizer application rate showed a significant effect only during the fruit expansion stage, with the mean Ci under the F3 fertilizer level (271.98 μmol·mol-1) exceeding that under F1 (266.02 μmol·mol-1). A significant water–fertilizer interaction was observed during both the fruit expansion and shell hardening stages. At the fruit expansion stage, the W1F3 treatment resulted in the maximum Ci value (276.39 μmol·mol-1), while W1F1 yielded the minimum (259.85 μmol·mol-1). During the shell hardening stage, the W2F2 treatment was the optimal combination (258.85 μmol·mol-1), showing a 5.4% increase compared to the minimum treatment, W1F1 (244.99 μmol·mol-1).
3.3. Effects of Water and Fertilizer Interaction on Fruit Quality in Subsurface Drip-Irrigated Walnuts
As shown in Table 2, irrigation, fertilization, and their interaction significantly regulated walnut fruit quality. Under the F1 and F2 fertilizer levels, crude protein content initially increased and then decreased with increasing irrigation, peaking under the W2 treatment. The W2F1 and W2F2 treatments reached 205.47 and 238.64 g·kg-1, respectively. In contrast, under the F3 fertilizer level, crude protein content increased continuously with irrigation, reaching 241.72 g·kg-1 in the W4F3 treatment—an increase of 11.4% compared to the W1F3 treatment (214.21 g·kg-1).
Crude fat content exhibited a unimodal trend with increasing irrigation under the same fertilizer level. Peaks occurred under the W3, W2, and W2 irrigation treatments for the F1, F2, and F3 levels, respectively, with values of 16.05, 13.51, and 16.73 g·kg-1 for the W3F1, W2F2, and W2F3 treatments. Crude fat generally decreased under W4 irrigation. Under the F3 fertilizer level, the W4F3 treatment declined to 12.02 g·kg-1, lower than most low-fertilizer treatments, indicating that high water and high fertilizer conditions are unfavorable for crude fat accumulation.
Soluble sugar content continuously decreased with increasing irrigation under the F1 fertilizer level, with the highest value in the W1F1 treatment (23.52 g·kg-1) and the lowest in the W4F1 treatment (17.57 g·kg-1). Under the F2 and F3 fertilizer levels, soluble sugar showed unimodal trends, peaking in the W2F2 and W3F3 treatments at 25.54 and 27.86 g·kg-1, respectively.
Starch content exhibited varying trends under different fertilizer levels. Under the F1 level, it continuously decreased with increasing irrigation, peaking in the W1F1 treatment at 12.40 g·kg-1. Under the F2 level, starch content initially decreased and then increased, reaching its maximum value among all treatments in the W4F2 treatment at 13.29 g·kg-1. Under the F3 level, starch content showed a continuous increasing trend with irrigation, with the W4F3 treatment reaching 11.53 g·kg-1.
Tannin content exhibited distinct trends under different fertilizer levels. Under the F1 level, it showed a significant decreasing trend with increasing irrigation, reaching the lowest value of 13.03 g·kg-1 in the W4F1 treatment. Under the F2 level, tannin content first decreased and then increased with irrigation, reaching its lowest point (10.35 g·kg-1) in the W2F2 treatment. Under the F3 level, tannin content fluctuated with increasing irrigation, with the W3F3 treatment yielding the minimum value of 9.35 g·kg-1—a reduction of 42.0% compared to the maximum value under the same fertilizer level (W2F3 treatment, 16.11 g·kg-1).
3.4. Effects of Water and Fertilizer Interaction on Yield Components, Water Use Efficiency, and Partial Factor Productivity of Fertilizer in Subsurface Drip-Irrigated Walnuts
As shown in Table 3, irrigation and fertilization significantly regulated walnut yield, single fruit weight, WUE, and PFP. Their interaction significantly affected single fruit weight and WUE.Under the F1 fertilizer level, yield increased continuously with irrigation, reaching 3223.42 kg·ha-1 in the W4F1 treatment. Under the F2 and F3 levels, yield showed unimodal trends, both peaking under W2 irrigation. The W2F2 treatment achieved the highest yield (3801.40 kg·ha-1), followed by W2F3 (3708.15 kg·ha-1). Yield decreased significantly under W4 irrigation, with the W4F2 treatment showing a 13.5% reduction compared to W2F2.
Under the F1 fertilizer level, WUE initially increased and then stabilized with increasing irrigation, rising from 0.75 kg·m-3 in W1 to 0.89 kg·m-3 in W2. Under the F2 level, WUE decreased continuously and significantly with irrigation, highest at W1 (0.92 kg·m-3) and declining to 0.68 kg·m-3 at W4. Similarly, under the F3 level, WUE decreased significantly with increasing irrigation, highest at W1 (0.82 kg·m-3) and lowest at W4 (0.53 kg·m-3). Notably, the highest-yielding combination (W2F2) had a WUE of 0.86, which was not the highest value. Conversely, the combination with the highest WUE (W1F2) yielded 3113.77 kg·ha-1, significantly lower than the high-yield combination. This indicates a trade-off between yield and efficiency objectives.
Under the F1 fertilizer level, PFP increased continuously with irrigation, peaking at 3.98 in the W4F1 treatment. Under the F2 level, PFP showed a unimodal trend, reaching a maximum of 3.52 at W2 and declining significantly to 3.04 at W4. Under the F3 level, PFP was generally low and exhibited an initial increase followed by a decrease with irrigation, peaking at 2.75 under W2 irrigation. Further increases to W3 and W4 resulted in slight declines, stabilizing around 2.46 and 2.43. It is noteworthy that even the peak value of 2.75 was lower than the PFP of most F1 or F2 treatments across irrigation levels. These results indicate that high fertilizer input inherently leads to lower PFP, and irrigation management has a limited ability to improve it, with only slight optimization observed under W2 conditions.
Under the F1 fertilizer level, single fruit weight initially increased and then stabilized with irrigation, reaching a maximum of 10.87 g at W2. Under the F2 and F3 levels, single fruit weight exhibited unimodal curves, both peaking at W2 irrigation. The W2F2 treatment yielded the highest value (11.73 g), followed by W2F3 (11.64 g). Notably, under the F3 fertilizer level, single fruit weights under W3 and W4 irrigation were even lower than those in most low-fertilizer treatments. This indicates that under high fertilizer input, maintaining medium irrigation (W2) is crucial for achieving larger fruits, while further increasing irrigation leads to smaller fruits.
3.5. Effects of Water and Fertilizer Interaction on Soil Nitrate Nitrogen Residue in Subsurface Drip-Irrigated Walnuts
As shown in Figure 6, the nitrate nitrogen (NO3−-N) residue in the 0-100 cm soil layer under different water and fertilizer treatments exhibited significant spatial heterogeneity. It was primarily regulated by irrigation and fertilization amounts, with no significant interactive effect observed. The mean NO3−-N residues in the 0-20, 20-40, 40-60, 60-80, and 80-100 cm soil layers were 11.33, 8.86, 11.21, 12.00, and 11.77 mg·kg-1, respectively. The highest residue was generally found in the 60-80 cm layer, which was 26.2% higher than the lowest residue in the 20-40 cm layer, indicating a risk of systemic leaching into deeper soil layers.Under the same fertilizer level, soil NO3−-N content generally decreased with increasing irrigation. Although a slight increase was observed in the W3F1 treatment under the F1 fertilizer level, the highest and lowest values consistently occurred under the W1 and W4 irrigation treatments, respectively. Notably, under the F3 fertilizer level, no significant differences in NO3−-N content were observed among irrigation treatments (P > 0.05), indicating that the regulatory effect of irrigation on NO3−-N residue diminishes under excessive fertilizer application.Furthermore, all treatments under F3 showed higher NO3−-N content than those under F1 and F2 fertilizer levels across irrigation regimes. This further demonstrates that excessive fertilization is the primary driver of soil NO3−-N accumulation, highlighting the need for coordinated optimization of water and fertilizer management to mitigate environmental risks.
3.6. Effects of the Comprehensive Growth Index (CGI) and Comprehensive Photosynthesis Index (CPI) on Yield and Quality Across Walnut Growth Stages
To establish a scientific evaluation system for water and fertilizer decision-making, a CGI and CPI were developed by integrating multi-dimensional indicators across growth stages, aiming to extract core physiological growth traits. Subsequently, correlation analysis was employed to reveal the relationships between CGI, CPI, and yield and quality, thereby identifying key input variables for the subsequent TOPSIS-GRA coupled model. Walnut growth indicators (NSG, FV, SPAD, LAI) and photosynthetic parameters (Pn, Tr, Gs, Ci) were used as analytical metrics, and principal component analysis was applied to construct the CGI and CPI. As shown in Figure 7a, during the flowering and fruit-setting stage, NSG showed significant correlations with all growth indicators, with the strongest correlation to SPAD (r=0.62). LAI was significantly correlated with all photosynthetic parameters, most strongly with Ci (r=0.60). Except for FV, Ci was significantly correlated with all growth indicators. Additionally, all photosynthetic parameters were significantly interrelated during this stage. During the fruit expansion stage (Figure 7b), significant correlations persisted among photosynthetic parameters, except between Pn and Ci. The correlation between NSG and LAI decreased, while correlations among other growth indicators increased compared to the flowering and fruit-setting stage. FV showed stronger correlations with photosynthetic parameters during this period, with the highest correlation to Tr (r=0.59). In the shell hardening stage (Figure 7c), significant correlations were observed between all growth and photosynthetic indicators, except between NSG and Pn. During the oil conversion stage (Figure 7d), the correlation between NSG and photosynthetic parameters further weakened, remaining significant only with Tr and Gs. The correlation between FV and Ci also decreased compared to the shell hardening stage.
As shown in Table 4, principal component analysis revealed three principal components for the CGI across all walnut growth stages. During the flowering and fruit-setting stage, the key attribute indicators for the three principal components were SPAD, FV, and LAI, with variance contributions of 39.51%, 26.26%, and 25.68%, respectively. During the fruit expansion stage, in the first principal component, NSG had the highest loading value (0.90), while FV’s loading value (0.84) exceeded 90% of 0.90. However, since FV showed significant correlation with NSG during this stage, NSG was selected as the key attribute indicator for the first principal component, which explained 43.62% of the variance. The key indicators for the second and third principal components were LAI and SPAD, with variance contributions of 26.91% and 23.81%, respectively. During the shell hardening stage, the key attribute indicators for the three principal components were SPAD, FV, and LAI, with variance contributions of 33.79%, 32.80%, and 26.46%, respectively. In the oil conversion stage, the key attribute indicators for the three principal components were NSG, SPAD, and LAI, accounting for 35.19%, 33.11%, and 26.78% of the variance, respectively. The unstandardized CGI was calculated by combining the key attribute indicators and their variance contributions from the three principal components. Using the flowering and fruit-setting stage as an example, the unstandardized CGI was computed as: CGI = 0.395 × SPAD + 0.263 × FV + 0.257 × LAI. The standardized CGI, weighted by variance contributions, was calculated as: CGI = 0.432 × SPAD + 0.287 × FV + 0.281 × LAI. The standardized CGI values for each growth stage are presented in Table 4.
As shown in Table 5, principal component analysis indicated two principal components for the CPI across all walnut growth stages. During the flowering and fruit-setting stage, Pn had the highest loading (0.98) in the first principal component. Although the loading values of Tr (0.88) and Gs (0.90) both exceeded 90% of 0.98, Pn showed significant correlations with both Tr and Gs during this stage. Therefore, Pn was selected as the key attribute indicator for the first principal component, which accounted for 70.46% of the variance. Ci was identified as the key indicator for the second principal component, explaining 28.60% of the variance. During the fruit expansion stage, the key attribute indicators for the two principal components were Pn and Ci, with variance contributions of 57.35% and 31.39%, respectively. In the shell hardening stage, Pn showed the highest loading (0.96) in the first principal component. Although Gs’s loading value (0.87) exceeded 90% of 0.96, the significant correlation between Pn and Gs led to the selection of Pn as the key attribute indicator for the first principal component, accounting for 62.93% of the variance. Ci served as the key indicator for the second principal component, explaining 35.29% of the variance. During the oil conversion stage, Pn again demonstrated the highest loading (0.97) in the first principal component. While the loading values of Tr (0.88) and Gs (0.90) both surpassed 90% of 0.97, the significant correlations between Pn and these parameters resulted in Pn being chosen as the key indicator for the first principal component, contributing to 65.30% of the variance. Ci was selected as the key indicator for the second principal component, accounting for 32.12% of the variance. The standardized CPI values for each growth stage are presented in Table 5.
To establish a comprehensive evaluation system for walnut growth across the entire growth cycle, Pearson correlation analysis was conducted between the previously developed CGI and CPI indices for each growth stage and the yield components and fruit quality indicators (Figure 8). The results showed that IV-CPI had the strongest promoting effect on yield, with a correlation coefficient r of 0.780. III-CGI and III-CPI also showed significant positive effects on yield, with correlation coefficients of 0.727 and 0.725, respectively. Regarding single fruit weight regulation, IV-CPI (r=0.654) and II-CPI (r=0.607) showed the most substantial contributions. Correlation analysis with quality indicators revealed that I-CPI showed a strong positive correlation with crude protein content (r=0.732), while III-CPI also significantly increased crude protein content (r=0.667). Both II-CPI (r=-0.628) and III-CPI (r=-0.585) demonstrated significant inhibitory effects on tannin content. Seven core parameters were identified through comprehensive screening: I-CPI, II-CGI, II-CPI, III-CGI, III-CPI, IV-CGI, and IV-CPI. Among these, IV-CPI showed the strongest positive effect on yield, while II-CPI demonstrated the best regulatory potential for increasing single fruit weight and reducing tannin content. These indices were systematically integrated as key growth and photosynthetic indicators into a comprehensive evaluation model for walnut growth across the entire growth cycle.
3.7. Comprehensive Growth Evaluation of Subsurface Drip-Irrigated Walnuts Based on TOPSIS-GRA Coupled Model
To investigate the comprehensive growth status of subsurface drip-irrigated walnuts under water and fertilizer interaction and develop optimal water and fertilizer management strategies for southern Xinjiang, a full-growth-period comprehensive evaluation system was established. This system comprises six dimensions: growth factor, photosynthetic factor, quality factor, yield factor, efficiency factor, and environmental factor, structured into objective, factors, and subfactors layers (Figure 9).
3.7.1. Determination of Indicator Weights in the Comprehensive Evaluation System for Walnut Growth Stages
The weights of indicators at all levels in the walnut evaluation system, calculated using the AHP, CRITIC, and game theory combination weighting methods, are presented in Table 6. The subjective weights determined by the AHP method showed that the consistency ratio (CR) for both the target and criterion layers was less than 0.1. At the target layer, yield indicators had the highest subjective weight (0.352), followed by efficiency and quality indicators, while environmental indicators had the lowest weight (0.061). At the criterion layer, yield received the highest subjective weight (0.235), followed by WUE (0.140), and IV-CPI had the lowest weight (0.009).The objective weights calculated using the CRITIC method indicated that PFP and WUE had relatively higher weights (0.098 and 0.094, respectively), while II-CPI and IV-CPI had lower objective weights (both 0.038). The combined weights derived from the game theory combination weighting method showed that yield had the highest combined weight (0.215), followed by WUE (0.136), while IV-CPI had the lowest combined weight (0.011).
3.7.2. Comprehensive Growth Assessment of Subsurface Drip-Irrigated Walnuts Using the TOPSIS-GRA Method
The Euclidean distances to the positive and negative ideal solutions (Ri+ and Ri-) for different water and fertilizer treatments, determined by TOPSIS, were as follows: Ri+={0.101, 0.081, 0.091, 0.103, 0.074, 0.050, 0.062, 0.093, 0.115, 0.080, 0.066, 0.066} and Ri={0.059, 0.079, 0.082, 0.056, 0.082, 0.106, 0.091, 0.062, 0.049, 0.085, 0.100, 0.092}. The grey relational degrees to the positive and negative ideal solutions (Yi+ and Yi-), determined by GRA, were: Yi+={0.693, 0.808, 0.848, 0.767, 0.743, 0.892, 0.842, 0.721, 0.626, 0.772, 0.861, 0.775} and Yi-={0.848, 0.718, 0.720, 0.770, 0.763, 0.645, 0.674, 0.802, 0.963, 0.756, 0.696, 0.754}. Based on these results, the compound proximity degrees (Si+ and Si-) were constructed through weighted synthesis: Si+={0.667, 0.826, 0.862, 0.694, 0.803, 1.000, 0.901, 0.696, 0.582, 0.834, 0.954, 0.868} and Si-={0.879, 0.725, 0.769, 0.848, 0.718, 0.552, 0.619, 0.821, 1.000, 0.740, 0.648, 0.700}. The comprehensive scores and rankings based on the TOPSIS and TOPSIS-GRA evaluation models are presented in Table 7. The W2F2 treatment ranked first in both the standalone TOPSIS and the integrated TOPSIS-GRA models, while the W1F1 treatment received the lowest scores in both methods. The maximum ranking difference between the two evaluation methods was 3 positions. Therefore, the TOPSIS-GRA coupled model can be effectively used to evaluate the comprehensive growth status of subsurface drip-irrigated walnuts.
3.8. Water and Fertilizer Regulation Model for Subsurface Drip-Irrigated Walnuts Based on Comprehensive Evaluation
A binary quadratic regression model was developed to fit the comprehensive scores under different water and fertilizer combinations. The regression model of comprehensive score versus water and fertilizer application amount showed a coefficient of determination (R2) of 0.82. The model is expressed as follows:
where F represents the comprehensive evaluation score, and x1 and x2 are the standardized coded values for irrigation amount and fertilizer application rate, respectively.
3.8.1. Analysis of Univariate and Marginal Effects of Water and Fertilizer
To investigate the individual effects of water and fertilizer on the comprehensive evaluation score of walnuts, dimensionality reduction and elimination were applied to Equation (23). This yielded univariate effect models for irrigation amount and fertilizer application rate on the comprehensive evaluation score, as follows:
where F1 and F2 represent the univariate effect functions of the comprehensive evaluation score with respect to irrigation amount and fertilizer application rate, respectively.
The effects of irrigation amount and fertilizer application rate on the comprehensive evaluation score are shown in Figure 10. Both univariate effect functions exhibited downward-opening parabolic curves. As irrigation and fertilizer application increased, the comprehensive score first increased and then decreased. The maximum comprehensive score was achieved at x1=0.110 and x2=-0.130.
3.8.2. Optimal Water and Fertilizer Application Rates for Comprehensive Growth of Subsurface Drip-Irrigated Walnuts
Optimization of the regression model was performed using MATLAB to determine the optimal water and fertilizer application rates, with the results shown in Figure 11. The function exhibited a downward-opening convex parabolic surface, indicating the existence of an optimal solution within the model. The comprehensive evaluation score of walnuts increased with higher water and fertilizer application rates up to a certain point, beyond which it began to decline. The maximum comprehensive score (F=0.1006) was achieved at coded values of (0.146, -0.181) for water and fertilizer, respectively. These coded values corresponded to an irrigation amount of 6218.80 m3·ha-1 and a fertilizer application rate of 1038.32 kg·ha-1. For comprehensive scores ranging from 0.10 to 0.11, the optimal application intervals were 5869.94–6519.81 m3·ha-1 for irrigation and 975.54–1107.49 kg·ha-1 for fertilizer. Within these ranges, subsurface drip-irrigated walnuts achieved optimal comprehensive growth, contributing to enhanced quality and efficiency.
4. Discussion
4.1. Effects of Water and Fertilizer Interaction on Walnut Growth and Photosynthetic Parameters
As a fundamental approach for regulating fruit tree development and biomass production, the interaction between water and fertilizer exhibits significant growth-stage specificity and synergistic effects on walnut growth indicators and photosynthetic characteristics. Analysis of growth indicator dynamics revealed that NSG accumulation followed a characteristic S-shaped curve, primarily occurring during the flowering and fruit-setting stages, and continued through to the fruit expansion stages. This pattern is consistent with the vegetative-reproductive growth transition pattern observed in woody crops. Consistent with findings by Li et al. [19] in grape studies, the fruit expansion stage represents a critical period for vegetative growth, characterized by high cell division activity and maintained sensitivity to water stress. It is noteworthy that the water-fertilizer interaction did not significantly affect NSG, potentially due to response latency or buffering capacity against environmental fluctuations. In perennial plants, particularly trees, shoot growth is often influenced by environmental conditions from previous years [20]. This study found that under F1 and F2 fertilizer levels, NSG showed an initial increase followed by a decrease with increasing irrigation, while under F3 conditions, NSG continued to increase. This suggests that elevated fertilizer application may mitigate the inhibitory effects of excessive irrigation by enhancing root water uptake capacity or reducing soil solution osmotic potential. Similar to observations by Zhou et al. [21] in apple trees, excessive irrigation reduced photosynthetic efficiency and root activity, leading to suppressed shoot growth. However, under the F3 fertilizer level, shoot growth increased linearly with irrigation without observable inhibition, as sufficient nutrient availability counteracted the stress effects of high water application.
Walnut FV increased continuously throughout the growth season, with the most rapid expansion occurring during the fruit enlargement stage. This phenomenon aligns with the general pattern of fruit development in plants, where rapid biomass accumulation occurs during specific developmental phases [22]. During the fruit enlargement stage, irrigation was the dominant factor influencing FV, and the W3 irrigation regimen consistently resulted in the highest values. This indicates that adequate and appropriate water supply is a key limiting factor determining fruit volume expansion during the rapid fruit growth phase [23]. During the shell hardening and oil conversion stages, the growth rate of FV slowed, but both irrigation and fertilizer effects became significant. The W3F2 treatment resulted in the highest FV. This observation is consistent with Wang [24] finding that differences among water and fertilizer treatments became more pronounced during the shell hardening stage compared to the fruit enlargement stage. This phase is characterized by substantial internal substance accumulation in walnut fruits, requiring a new balance of nutrient and water demands.
The trends in LAI and SPAD were closely synchronized, with both parameters peaking during the shell hardening stage. This indicates that this period represents the peak functional activity of walnut photosynthetic organs. LAI was significantly higher under the W3 irrigation treatment compared to other water levels and increased with higher fertilizer application. However, excessive irrigation (W4) reduced LAI by 14.3% to 16.5%. This aligns with Cheng et al. [25] observations in drip-irrigated walnuts, where LAI under the high (EI) irrigation treatment was significantly greater than under both low (DI) and medium (CI) irrigation treatments. The response of SPAD values was more dependent on water-fertilizer interaction. Under F2 and F3 fertilizer levels, SPAD reached its maximum at the W2 irrigation level, while both W1 and W4 irrigation inhibited chlorophyll synthesis. This inhibition of chlorophyll synthesis under both water deficit (W1) and water excess (W4) is consistent with the findings of Zhang et al. [14] on regulated deficit irrigation.
Plant photosynthetic activity is the fundamental basis for biomass production and yield formation. Its intensity and dynamics are directly regulated by the interaction between water and nutrient availability. Throughout the growth stages, Pn, Tr, and Gs exhibited unimodal curve patterns, peaking during the shell hardening stage. This stage is critical for fruit development, as kernel formation and oil synthesis require substantial energy and photosynthetic products. To meet these substantial metabolic demands, plants enhance their photosynthetic activity, a response that is consistent with previous findings in pome fruit trees [26]. Moderate irrigation (W2-W3) during this stage significantly enhanced Pn and Gs. In contrast, W1 irrigation reduced CO2 supply, primarily due to decreased Gs, resulting in a more than 12% reduction in Pn compared to W2 and W3. Although W4 did not significantly suppress Pn, this treatment only produced a secondary peak in Pn under high fertilizer conditions. Li et al. [27] reported that net photosynthetic rate and stomatal conductance under full irrigation were significantly higher than those under moderate and severe drought conditions, a finding that supports the view that appropriate water supply benefits photosynthetic performance. In this study, the W2F2 treatment achieved simultaneous peaks in Pn, Tr, Gs, and Ci during the shell hardening stage. This mechanism aligns with the conclusions of Li [28] regarding water and fertilizer effects on grape photosynthesis, where the W2F2 treatment also resulted in maximum Pn, Tr, and Gs in grape leaves, while excessive irrigation and fertilization did not enhance photosynthesis. However, unlike that study, the W2F2 treatment here showed synchronized peaks in Gs (451.38 mmol·m-2·s-1) and Pn (19.68 mmol·m-2·s-1), but the increase in Gs was slightly greater than that in Pn compared to other treatments. This led to incomplete consumption of the additional CO2 supply, ultimately resulting in elevated Ci. Furthermore, studies have shown that stomatal conductance increases under high carbon dioxide concentrations in hot and dry environments [29]. This finding corresponds with our observations during the shell hardening and oil conversion stages, when temperatures reached 41 °C, and the W2F2 treatment exhibited simultaneously highest Gs and Ci levels.
4.2. Water and Fertilizer Interaction on Walnut Quality
The application of water and fertilizer exhibited a significant synergistic effect on the formation of walnut fruit quality. This effect is achieved by influencing carbon and nitrogen metabolism, secondary metabolite synthesis, and nutrient partitioning pathways. These physiological processes ultimately manifest as dynamic changes in key quality indicators, including crude protein, crude fat, soluble sugars, starch, and tannins. In this study, the W4F3 treatment significantly increased the crude protein content (241.72 g·kg-1). This finding aligns with the results of Wang [30] on water-fertilizer combinations in chestnuts. Their study also reported the highest protein content under high water and high fertilizer conditions on chestnut protein, whose study also reported the highest protein content under high water and high fertilizer conditions, alongside a significant increase in leaf nitrogen content for that treatment. Together, these results indicate that conditions of high water and high fertilizer are more conducive to promoting nitrogen translocation to the fruit [31]. Notably, the crude protein content under the W2F2 treatment (238.64 g·kg-1) in this study was not significantly different from that of the high water and fertilizer treatment (241.72 g·kg-1). This suggests that optimized moderate water and fertilizer management can serve as an effective substitute for resource-intensive practices, which is consistent with the findings of Tang et al. [32] for optimized water and fertilizer management in carrots, where significant reductions in resource inputs were achieved while maintaining quality. Crude fat content peaked under the W2F3 treatment (16.73 g·kg-1), whereas the W4F3 treatment significantly inhibited fat accumulation, resulting in a reduction of 28.2%. This phenomenon may be related to the role of moderate water reduction during the oil conversion stage in promoting fatty acid desaturase activity [33]. This result is consistent with the conclusion of Ma [34] on the water-fertilizer interaction effects on crude fat in oil sunflower. Their study also found that crude fat content followed a unimodal trend, first increasing and then decreasing with increasing irrigation quota, reaching its maximum under a medium water and medium fertilizer treatment. An antagonistic interaction between water and fertilizer was observed for the accumulation of soluble sugars and starch. Under the F1 fertilizer level, increasing the irrigation amount significantly suppressed the content of both soluble sugars and starch. This indicates that under nitrogen-limited conditions, increased water application dilutes the allocation intensity of photosynthetic products to the fruit, while simultaneously promoting vegetative growth which consumes more assimilates [35]. This aligns with the findings of Zhou et al. [36], who reported that increased irrigation under low nitrogen conditions reduced soluble sugar content in apples. However, a unique finding of this study was that under the F3, increasing irrigation significantly enhanced the content of soluble sugars (peaking at 27.86 g·kg-1 under W3F3) and starch. This is likely because under high nitrogen supply, adequate water can increase carbon source supply by enhancing the LAI and Pn [37]. In this study, the W3F3 treatment maintained the highest LAI throughout the entire growth period and achieved a maximum Pn of 19.20 μmol·m-2·s-1, which corroborates this proposed mechanism. Tannins, as defensive secondary metabolites, reached their lowest concentration (9.35 g·kg-1) under the W3F3 treatment, representing a 54.3% reduction compared to the highest value observed under W1F1. This finding is consistent with Zhang et al. [38], who found that moderately increasing water application reduced tannin concentration in walnut fruits.
4.3. Effects of Water and Fertilizer Interaction on Walnut Yield Components, Water and Partial Factor Productivity of Fertilizer, and Soil Nitrate Nitrogen
The synergistic improvement of yield and resource use efficiency constitutes a fundamental goal of sustainable agricultural development. The water-fertilizer interaction is a key mechanism for achieving this goal. Yield increased continuously with increasing irrigation under the F1 fertilizer level. However, under both the F2 and F3 fertilizer levels, yield exhibited a unimodal curve, peaking at the W2 irrigation level.The W2F2 combination achieved the maximum yield (3801.40 kg·hm-2). Furthermore, at any given irrigation level, yield was consistently highest under the F2 fertilizer treatment. This result confirms the general principle that a “threshold exists for the water-fertilizer synergistic effect”. Liu [39] found that water was the dominant limiting factor for subsurface drip-irrigated Korla fragrant pears under low fertilizer conditions, while under high fertilizer conditions, yield also showed a unimodal trend in response to irrigation. Furthermore, this study highly aligns with the conclusions of Lin et al. [40] on jujube trees. When the fertilizer application rate was F2 or F3, yield peaked only at the W2 irrigation level, demonstrating that both insufficient and excessive irrigation limit yield under excessive fertilization. Single fruit weight, a core component of yield, also peaked under the medium water and medium fertilizer combination (W2F2). This further illustrates that increasing single fruit weight is a key pathway to achieving high yield. WUE showed a significant dependence on fertilizer level. Under the F1 level, increasing irrigation to W3 improved WUE, as adequate water promoted root absorption of the limited nutrients [41]. In contrast, under the F2 and F3 levels, increased irrigation reduced WUE, primarily because excessive fertilization led to increased transpiration without a proportional conversion of water into biomass [42]. The research by Hou et al. [43] on cotton was more explicit: increasing irrigation amount led to decreased water use efficiency because high nitrogen exacerbated water leakage and evaporation losses. PFP, however, exhibited a decreasing pattern with increasing fertilizer application rate, regardless of the irrigation level. This is because under high fertilizer conditions, even with sufficient water, excess nutrients accumulate as they exceed the crop’s demand [44], leading to a decrease in PFP. This is consistent with the observation in this study that soil nitrate nitrogen residue under the F3 fertilizer level was significantly higher than under F1 and F2. Furthermore, a clear inflection point exists for the positive effect of irrigation amount on PFP. When the fertilizer application rate was the same, increasing irrigation to W2 significantly improved PFP, which is consistent with the findings of Zhong et al. [45]. It is noteworthy that the W2F2 treatment in this study achieved the highest yield while maintaining relatively high levels of WUE and PFP. This indicates that a combination of moderate fertilizer and irrigation provides a quantitative basis for achieving the dual goals of high yield and high resource use efficiency in the management of subsurface drip-irrigated walnuts in Southern Xinjiang.
The characteristics of soil nitrate nitrogen residue directly indicate nitrogen use efficiency and environmental risk. In this study, residue were highest in the 60-80 cm soil layer, exceeding those in the 20-40 cm layer by 26.2%. Irmak et al. [46] reported accumulation of soil nitrate nitrogen in the 60-120 cm layer under subsurface drip irrigation, indicating a risk of deep leaching. This finding is consistent with the results of the present study. The fertilizer application rate was the dominant factor influencing nitrate residue. Nitrate nitrogen residue under the F3 treatment was higher than under F1 and F2, with the W1F3 treatment reaching 70.60 mg·kg-1. This aligns with the findings of Lu et al. [47], who showed that a 30% reduction in fertilizer application effectively decreased the deep accumulation of soil nitrate nitrogen.
4.4. Comprehensive Growth Evaluation of Subsurface Drip-Irrigated Walnuts Based on the TOPSIS-GRA Coupled Model
This study evaluated the comprehensive growth status of subsurface drip-irrigated walnuts using a coupled TOPSIS-GRA model. Its core innovation lies in overcoming the limitation of traditional evaluation models that directly use final growth and photosynthetic indicators, instead establishing a comprehensive evaluation system based on the dynamic characteristics across growth stages. Yang et al. [48] found that early-stage indicators, such as stem diameter during the vine growth stage and net photosynthetic rate during the flowering and fruit-setting stage, were significantly correlated with the final yield in melons. They constructed a dynamic multi-growth-stage comprehensive evaluation system for melons by screening indicators related to final yield and quality. This study shares methodological commonalities with theirs; however, a key difference is that our research employed PCA to integrate growth and photosynthetic indicators from each growth stage, constructing the CGI and CPI. This approach not only preserves the core information from each stage but also assigns weights based on variance contribution rates, achieving dimensionality reduction and aggregation of multi-dimensional indicators [49]. This study found that physiological processes from the budburst to the oil conversion stages exhibit a cascading effect on final yield and quality formation. The III-CGI and III-CPI dominated yield formation with highly significant correlations (P<0.01) of 0.727 and 0.725, respectively. Furthermore, the regulatory effect of the IV-CPI on single fruit weight was significantly higher than that during other growth stages. This indicates that traditional final-stage evaluation models may overlook the spatiotemporal heterogeneity of water and nutrient requirements across different walnut growth stages [50], resulting in a weak biological basis for water and fertilizer management decisions.
The TOPSIS-GRA coupled model reconciled the conflict between subjective and objective weights through game theory-based combination weighting. Consistent with Bai [51] comprehensive evaluation study on jujube, the combined weight for the yield indicator (0.215) was the highest. Notably, the objective weight assigned to nitrate nitrogen residue by the CRITIC method (0.088) was 1.44 times that assigned by the AHP method (0.061). This reflects the model’s ability to scientifically balance high-yield objectives against environmental risk. Compared to relying solely on subjective weighting, this approach better aligns with the multi-objective optimization requirements of green agricultural development [52]. Both this study and the research by Chang et al. [53] focused on optimizing water and fertilizer interaction for subsurface drip-irrigated walnuts in Southern Xinjiang’s arid region; each identified W2F2 as the optimal treatment. This finding aligns with Zhao et al. [54], who found medium irrigation (100% ETc) beneficial for increasing walnut yield, as well as with Fu et al. [55], who concluded that medium fertilizer levels enhance quality and efficiency in drip-irrigated walnuts. This suggests a consistent pattern of water-fertilizer synergy for walnuts in the arid region of Southern Xinjiang. The regression model based on the TOPSIS-GRA comprehensive scores yielded an optimal water and fertilizer regulation interval of 5869.94–6519.81 m3·hm-2 for irrigation and 975.54–1107.49 kg·hm-2 for fertilizer. This differs from the optimal irrigation amount (4620 m3·hm-2) and fertilizer rate (2334 kg·hm-2) found by Piao [56] in a study on water-fertilizer parameters for enhancing yield and quality of ‘Wen 185’ walnuts. This discrepancy is primarily attributable to differences in local climate, soil conditions, and evaluation index systems between the experimental sites. It confirms the regional specificity of water and fertilizer management highlighted by Xing et al. [57] and underscores the refined advantage of this study’s focus on full growth-stage dynamics.
5. Conclusions
(1) Water and fertilizer interaction exerted significant regulatory effects on walnut growth, photosynthesis, yield quality, resource use efficiency, and soil environment, with different indicators showing varying responses. The W2F2 treatment demonstrated superior performance in synergistically optimizing growth indicators, photosynthetic performance, yield, and quality. Concurrently, this combination maintained high water use efficiency and partial factor productivity of fertilizer, while effectively inhibiting the accumulation of nitrate nitrogen in deep soil layers.
(2) The CGI and CPI indices, constructed based on principal component analysis, effectively integrated multi-dimensional indicators to quantify the physiological characteristics of each growth stage. Seven core parameters (I-CPI, II-CGI, II-CPI, III-CGI, III-CPI, IV-CGI, IV-CPI) were identified through correlation screening. Among these, IV-CPI showed the strongest correlation with yield, while II-CPI exhibited the greatest regulatory potential for increasing single fruit weight and reducing tannin content.
(3) The TOPSIS-GRA coupled model, utilizing game theory-based combination weighting, scientifically integrated multiple categories of indicators—including growth, photosynthesis, yield quality, efficiency, and soil environment—enabling an objective evaluation of the comprehensive growth status of walnuts. Within this model, yield (0.215) and water use efficiency (0.136) carried the highest weights. The W2F2 treatment achieved the highest comprehensive score (0.104). Optimization via a binary quadratic regression model determined the optimal water and fertilizer regulation intervals for subsurface drip-irrigated walnuts in Southern Xinjiang to be an irrigation amount of 5869.94–6519.81 m3·hm-2 and a fertilizer application rate of 975.54–1107.49 kg·hm-2. This provides a quantitative management basis for enhancing the quality and efficiency of local walnut production.
Author Contributions
Conceptualization, J.X., J.Z and T.Y.; methodology, J.X.; software, J.X.; validation, J.X., J.Z, T.Y, M.H, L.M and Q.F.; formal analysis, J.X and J.Z.; investigation, J.X.; writing—original draft preparation, J.X and J.Z.; writing—review and editing, J.X and J.Z.; visualization, J.X and J.Z.; supervision, J.Z, T.Y, M.H, L.M and Q.F.All authors have read and agreed to the published version of the manuscript.
Funding
This research was funded by the Tianshan Talent Training Program: Backbone Talent Project in Agriculture, Rural Areas, and Farmers, grant number 2024SNGGGCC021; the Academician and Expert Workstation of the Department of Water Resources of Xinjiang Uygur Autonomous Region, grant number 2025.D-002; the Xinjiang Water Conservancy Engineering Safety and Water Disaster Prevention Key Laboratory, grant number ZDSYS-YJS-2022-03.
Data Availability Statement
Data are contained within the article. The data that support the findings of this study is available from the corresponding author
Conflicts of Interest
The authors declare no conflicts of interest.
References
- Mortier, E., Lamotte, O., Martin-Laurent, F., Recorbet, G. Forty years of study on interactions between walnut tree and arbuscular mycorrhizal fungi. A review. Agron. Sustain. Dev. 2020, 40, 6. [CrossRef]
- Wu, S., Ni, Z., Wang, R., Zhao, B., Han, Y., Zheng, Y., Liu, F., Gong, Y., Tang, F., Liu, Y. The effects of cultivar and climate zone on phytochemical components of walnut (Juglans regia L.). Food Energy Secur. 2020, 9, 2. [CrossRef]
- Guiqing, X., Jinyao, L., Haifang, H., Tuqiang, C. Effect of deficit irrigation on physiological, morphological and fruit quality traits of six walnut tree cultivars in the inland area of Central Asia. Sci. Hortic. 2024, 329, 112951. [CrossRef]
- Wang, J., He, X., Gong, P., Heng, T., Zhao, D., Wang, C., Chen, Q., Wei, J., Lin, P., Yang, G. Response of fragrant pear quality and water productivity to lateral depth and irrigation amount. Agric. Water Manag. 2024, 292, 108652. [CrossRef]
- Wang, B., Zhang, J., Pei, D., Yu, L. Combined effects of water stress and salinity on growth, physiological, and biochemical traits in two walnut genotypes. Physiol. Plant. 2021, 172, 176–187. [CrossRef]
- You, Y., Tian, H., Shi, H., Xu, R., Pan, S., Ren, W., Lu, C., Zhang, J., Yang, J., Miao, R., Pan, N., Bian, Z., Huang, Y., Yu, Q. Improving Crop Yield Simulation by Better Representing the Dynamic Crop Growth Processes and Management Practices. In AGU Fall Meeting Abstracts (Vol. 2021, pp. GC25D-0688). [CrossRef]
- Qiang, W., Zhao, J. H., Fu, Q. P., Hong, M., Ma, Y. J. Effects of regulated deficit irrigation on the growth and yield of drip-irrigated walnut trees. J. Arid Land Resour. Environ. 2018, 32, 186–190. [CrossRef]
- Zhang, J.Y. Study on the Effects of Regulated Deficit Irrigation on Physio-Ecological Characteristics and Root System Simulation of Drip-Irrigated Walnut Trees. Master’s Thesis, Xinjiang Agricultural University, Urumqi, China, 2021. [Google Scholar] [CrossRef]
- Du, T.Y. Soil Microbiological Mechanisms Underlying the Effects of Long-Term Fertilization on Walnut Yield and Quality. PhD Dissertation, Northwest A&F University, Yangling, China, 2024. [Google Scholar] [CrossRef]
- Han, W., Sun, J., Zhang, K., Mao, L., Gao, L., Hou, X., Cui, N., Kang, W., Gong, D. Optimizing drip fertigation management based on yield, quality, water and fertilizer use efficiency of wine grape in North China. Agric. Water Manag. 2023, 280, 108188. [CrossRef]
- Wang, Z., Yu, S., Zhang, H., Lei, L., Liang, C., Chen, L., Su, D., Li, X. Deficit mulched drip irrigation improves yield, quality, and water use efficiency of watermelon in a desert oasis region. Agric. Water Manag. 2023, 277, 108103. [CrossRef]
- ZHA, Y., CHEN, F., WANG, Z., JIANG, S., CUI, N. Effects of water and fertilizer deficit regulation with drip irrigation at different growth stages on fruit quality improvement of kiwifruit in seasonal arid areas of Southwest China. J. Integr. Agric. 2023, 22, 3042–3058. [CrossRef]
- Fu, Y., Ding, G., Quan, W., Zhao, X., Tao, Q. Coupling optimization of water-fertilizer for coordinated development of the environment and growth of Pinus massoniana seedlings. Agric. Water Manag. 2024, 300, 108895. [CrossRef]
- Zhang, J. Y., Zhao, J. H., Pang, Y., Liao, K. Effects of regulated deficit irrigation on water consumption and yield of drip-irrigated walnut trees. Acta Agric. Boreali-Occident. Sin. 2021, 30, 1674–1684. [CrossRef]
- Sun, G., Chen, S., Zhang, S., Chen, S., Liu, J., He, Q., Hu, T., Zhang, F. Responses of leaf nitrogen status and leaf area index to water and nitrogen application and their relationship with apple orchard productivity. Agric. Water Manag. 2024, 296, 108810. [CrossRef]
- Andrews, S. S., Karlen, D. L., Mitchell, J. P. A comparison of soil quality indexing methods for vegetable production systems in Northern California. Agric. Ecosyst. Environ. 2002, 90, 25–45. [CrossRef]
- Qu, F., Zhang, Q., Jiang, Z., Zhang, C., Zhang, Z., Hu, X. Optimizing irrigation and fertilization frequency for greenhouse cucumber grown at different air temperatures using a comprehensive evaluation model. Agric. Water Manag. 2024, 273, 107876. [CrossRef]
- Sun, Y., Cai, Y. A Flexible Decision-Making Method for Green Supplier Selection Integrating TOPSIS and GRA Under the Single-Valued Neutrosophic Environment. IEEE Access. 2021, 9, 83025–83040. [CrossRef]
- Li, X., Liu, H., Li, J., He, X., Gong, P., Lin, E., Li, K., Li, L., Binley, A. Experimental study and multi–objective optimization for drip irrigation of grapes in arid areas of northwest China. Agric. Water Manag. 2020, 232, 106039. [CrossRef]
- Tang, J., Ji, X., Li, A., Zheng, X., Zhang, Y., Zhang, J. Effect of Persistent Salt Stress on the Physiology and Anatomy of Hybrid Walnut (Juglans major × Juglans regia) Seedlings. Plants.2024, 13, 1840. [CrossRef]
- Zhou, H., Ma, L., Zhang, S., Zhao, L., Niu, X., Qin, L., Xiang, Y., Guo, J., Wu, Q. Effect of Water-Fertilizer Coupling on the Growth and Physiological Characteristics of Young Apple Trees. Agronomy. 2023, 13, 2506. [CrossRef]
- Baldi, P., Orsucci, S., Moser, M., Brilli, M., Giongo, L., Si-Ammour, A. Gene expression and metabolite accumulation during strawberry (Fragaria × ananassa) fruit development and ripening. Planta. 2018, 248, 1143–1157. [CrossRef] [PubMed]
- Xue, Q., Li, H., Chen, J., Du, T. Fruit cracking in muskmelon: Fruit growth and biomechanical properties in different irrigation levels. Agric. Water Manag. 2024, 293, 108672. [CrossRef]
- Wang, Z.R. Study on the Coupling Effects of Water and Fertilizer on Yield and Quality of Drip-Irrigated Walnut Trees. Master’s Thesis, Xinjiang Agricultural University, Urumqi, China, 2016. [Google Scholar]
- Chen, T., Xu, G., Li, J., Hu, H. Hydraulic Trait Variation with Tree Height Affects Fruit Quality of Walnut Trees under Drought Stress. Agronomy. 2022, 12, 1647. [CrossRef]
- Zhang, C. F., Hao, H. L., Wang, S. W., Xing, C. J., Guo, T. Characteristics of Photoassimilares in Walnut Leaves and Their Transport to Fruit. Erwerbs-Obstbau. 2023, 65, 277–288. [CrossRef]
- Li, J., Liang, Z., Li, Y., Wang, K., Nangia, V., Mo, F., Liu, Y. Advantageous spike-to-stem competition for assimilates contributes to the reduction in grain number loss in wheat spikes under water deficit stress. Agric. Water Manag. 2024, 292, 108675. [CrossRef]
- Li, Q.Q. Effects of Different Water and Fertilizer Combinations on the Growth, Yield, and Quality of ‘Centennial Seedless’ Grapevines in Yutian County. Master’s Thesis, Xinjiang Agricultural University, Urumqi, China, 2024. [Google Scholar] [CrossRef]
- Purcell, C., Batke, S. P., Yiotis, C., Caballero, R., Soh, W. K., Murray, M., McElwain, J. C. (2018). Increasing stomatal conductance in response to rising atmospheric CO2. Ann. Bot. 2018, 121, 1137–1149. [CrossRef] [PubMed]
- Wang, Y.Q. Effects of Different Water and Fertilizer Combinations on the Ratio of Female to Male Inflorescences and Fruit Yield and Quality in Chestnut. Master’s Thesis, Beijing Forestry University, Beijing, China, 2019. [Google Scholar] [CrossRef]
- Fischer, W. Amino acid transport in plants. Trends Plant Sci. 1998, 3, 188–195. [Google Scholar] [CrossRef]
- Tang, W., Zhang, C., Zhang, P., Zhao, Y., Guo, M., Li, Y., Chi, R., Chen, Y. Optimized Fertilizer–Water Management Improves Carrot Quality and Soil Nutrition and Reduces Greenhouse Gas Emissions on the North China Plain. Horticulturae. 2024, 10, 151. [CrossRef]
- Hu, Y., Zhang, Y., Liu, J., Chen, X., Zhang, J., Yao, Y. Nitrogen-rich animal and plant wastes as fertilizer improve the soil carbon/nitrogen ratio and plant branching and thickening of young walnut trees under deficit irrigation conditions. Arch. Agron. Soil Sci. 2023, 69, 2966–2981. [CrossRef]
- Ma, F.P. Effects of Coupled Water-Fertilizer-Heat under Furrow Drip Irrigation on Yield Increase, Quality Improvement, Water Saving, and Salt Control in Oil Sunflower. Master’s Thesis, Ningxia University, Yinchuan, China, 2024. [Google Scholar] [CrossRef]
- Yin, C., Pang, X., Chen, K., Gong, R., Xu, G., Wang, X. The water adaptability of Jatropha curcas is modulated by soil nitrogen availability. Biomass Bioenergy. 2012, 47, 71–81. [CrossRef]
- Zhou, H. M., Ma, L. S., Sun, Q. L., Chen, J. G., Li, J. C., Su, Y. M.,... Wu, Q. Comprehensive regulation of water and nitrogen for apple based on multi-objective comprehensive evaluation. Sci. Agric. Sin. 2024, 57, 3654–3670. [CrossRef]
- Zhang, W., Li, Y., Xu, Y., Zheng, Y., Liu, B., Li, Q. Alternate drip irrigation with moderate nitrogen fertilization improved photosynthetic performance and fruit quality of cucumber in solar greenhouse. Sci. Hortic. 2023, 308, 111579. [CrossRef]
- Zhang, R., Zhang, Q., Chen, J. L., Zhang, H., Gao, S., Xu, C. Z. Effects of water and fertilizer coupling on photosynthetic characteristics and quality of walnut. J. Fruit Sci. 2015, 32, 1170–1178. [CrossRef]
- Liu, D.Z. Study on the Coupling Effects of Water and Fertilizer under Subsurface Drip Irrigation for Labor-Saving Cultivation of Korla Fragrant Pear. Master’s Thesis, Inner Mongolia University, Hohhot, China, 2024. [Google Scholar] [CrossRef]
- Lin, E., Liu, H., He, X., Li, X., Gong, P., Li, L. Water–Nitrogen Coupling Effect on Drip-Irrigated Dense Planting of Dwarf Jujube in an Extremely Arid Area. Agronomy. 2019, 9, 561. [CrossRef]
- Dong, J., Xue, Z., Shen, X., Yi, R., Chen, J., Li, Q., Hou, X., Miao, H. Effects of Different Water and Nitrogen Supply Modes on Peanut Growth and Water and Nitrogen Use Efficiency under Mulched Drip Irrigation in Xinjiang. Effects of Different Water and Nitrogen Supply Modes on Peanut Growth and Water and Nitrogen Use Efficiency under Mulched Drip Irrigation in Xinjiang. Plants. 2023, 12, 3368. [CrossRef]
- Cheng, M., Wang, H., Zhang, F., Wang, X., Liao, Z., Zhang, S., Yang, Q., Fan, J. Effects of irrigation and fertilization regimes on tuber yield, water-nutrient uptake and productivity of potato under drip fertigation in sandy regions of northern China. Agric. Water Manag. 2023, 287, 108459. [CrossRef]
- Hou, X., Fan, J., Zhang, F., Hu, W., Xiang, Y. Optimization of water and nitrogen management to improve seed cotton yield, water productivity and economic benefit of mulched drip-irrigated cotton in southern Xinjiang, China. Field Crops Res. 2024, 308, 109301. [CrossRef]
- Abudurezike, A., Liu, X., Aikebaier, G., Shawuer, A., Tian, X. Effect of different irrigation and fertilizer coupling on the liquiritin contents of the licorice in Xinjiang arid area. Ecol. Indic. 2024, 158, 111451. [CrossRef]
- Zhong, T., Zhang, J., Du, L., Ding, L., Zhang, R., Liu, X., Ren, F., Yin, M., Yang, R., Tian, P., Gan, K., Yong, T., Li, Q., Li, F., Li, X. Comprehensive evaluation of the water-fertilizer coupling effects on pumpkin under different irrigation volumes. Front. Plant Sci. 2024, 15. [CrossRef]
- Irmak, S., Mohammed, A. T., Drudik, M. Maize nitrogen uptake, grain nitrogen concentration and root-zone residual nitrate nitrogen response under center pivot, subsurface drip and surface (furrow) irrigation. Agric. Water Manag. 2023, 287, 108421. [CrossRef]
- LU, Y., KANG, T., GAO, J., CHEN, Z., ZHOU, J. Reducing nitrogen fertilization of intensive kiwifruit orchards decreases nitrate accumulation in soil without compromising crop production. J. Integr. Agric. 2018, 17, 1421–1431. [CrossRef]
- Yang, Z., Feng, Z., Kong, T., Xie, J., Zhang, Z. Optimal water and fertilizer amount for balancing greenhouse melon production efficiency and soil ecology based on TOPSIS-GRA coupling model. Comput. Electron. Agric. 2025, 229, 109797. [CrossRef]
- Zhang, J., Xiang, L., Liu, Y., Jing, D., Zhang, L., Liu, Y., Li, W., Wang, X., Li, T., Li, J. Optimizing irrigation schedules of greenhouse tomato based on a comprehensive evaluation model. Agric. Water Manag. 2024, 295, 108741. [CrossRef]
- Ma, M., Zhao, J., Yang, T., Liu, F., Yuan, Y., Ma, S., Chang, Z. Estimating comprehensive growth index for drip-irrigated spring maize in junggar basin via satellite imagery and machine learning. Agric. Water Manag. 2025, 318, 109651. [CrossRef]
- Effects of Different Water and Nitrogen Supply on Yield and Quality of Oasis Jujube under Sand Tube Irrigation. PhD Dissertation, Gansu Agricultural University, Lanzhou, China, 2024. [CrossRef]
- Cai, S., Zuo, D., Wang, H., Xu, Z., Wang, G., Yang, H. Assessment of agricultural drought based on multi-source remote sensing data in a major grain producing area of Northwest China. Agric. Water Manag. 2023, 278, 108142. [CrossRef]
- Chang, Z. K., Zhao, J. H., Wang, F., Hua, J. D. Comprehensive evaluation of water-fertilizer coupling effects for walnut under subsurface drip irrigation. J. Northwest A&F Univ. 2025, 10, 1–10. [CrossRef]
- Zhao, J.H. Research on Micro-Irrigation Technology and Root Zone Soil Moisture Simulation for Mature Walnut Trees in Arid Regions. PhD Dissertation, Xinjiang Agricultural University, Urumqi, China, 2016. [Google Scholar]
- Fu, Q. P., Zhao, J. H., Ma, L., Ma, Y. J. Optimal drip irrigation water and fertilizer amounts for densely planted walnut in the northwest margin of Tarim Basin. Bull. Soil Water Conserv. 2020, 40, 253–259. [CrossRef]
- Piao, H.Q. Water and Fertilizer Coupling Parameters for Increasing Yield and Improving Quality of ‘Wen 185’ Walnut. Master’s Thesis, Xinjiang Agricultural University, Urumqi, China, 2021. [Google Scholar] [CrossRef]
- Xing, Y., Chen, M., Wang, X. Enhancing water use efficiency and fruit quality in jujube cultivation: A review of advanced irrigation techniques and precision management strategies. Agric. Water Manag. 2025, 307, 109243. [CrossRef]
Figure 1.
Geographical location of the test area.
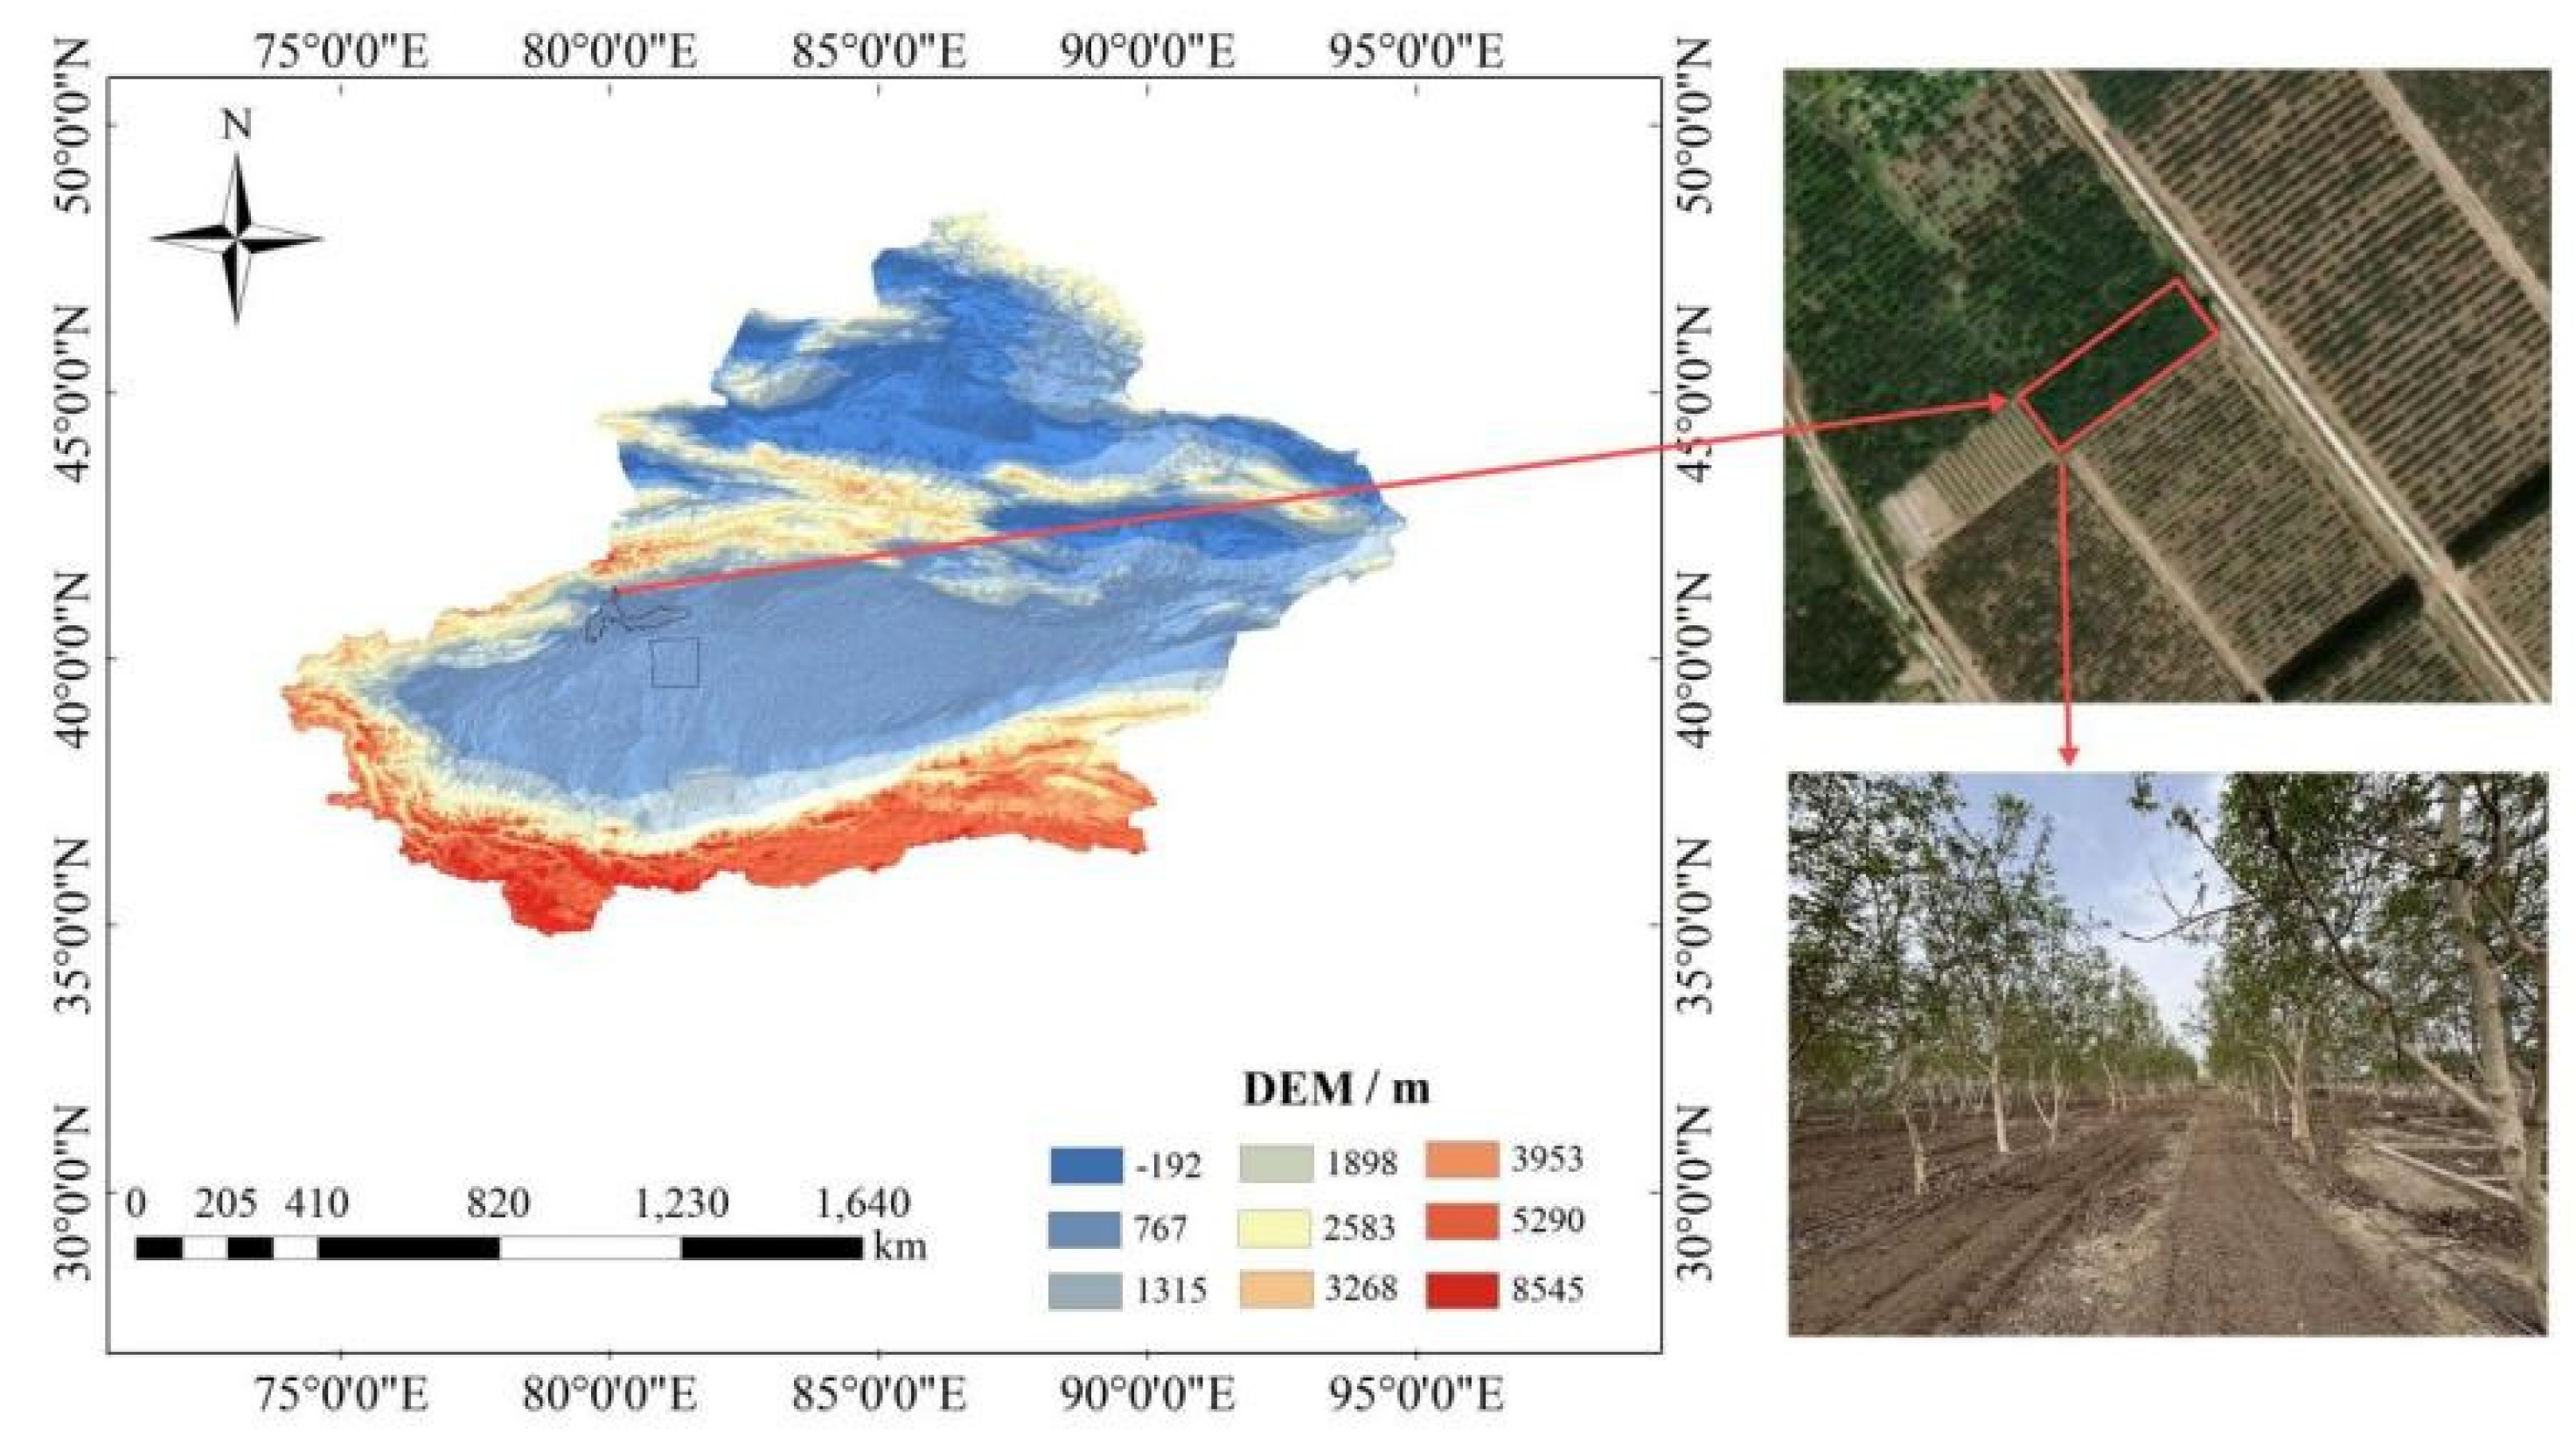
Figure 2.
Subsurface drip irrigation system for walnut trees.
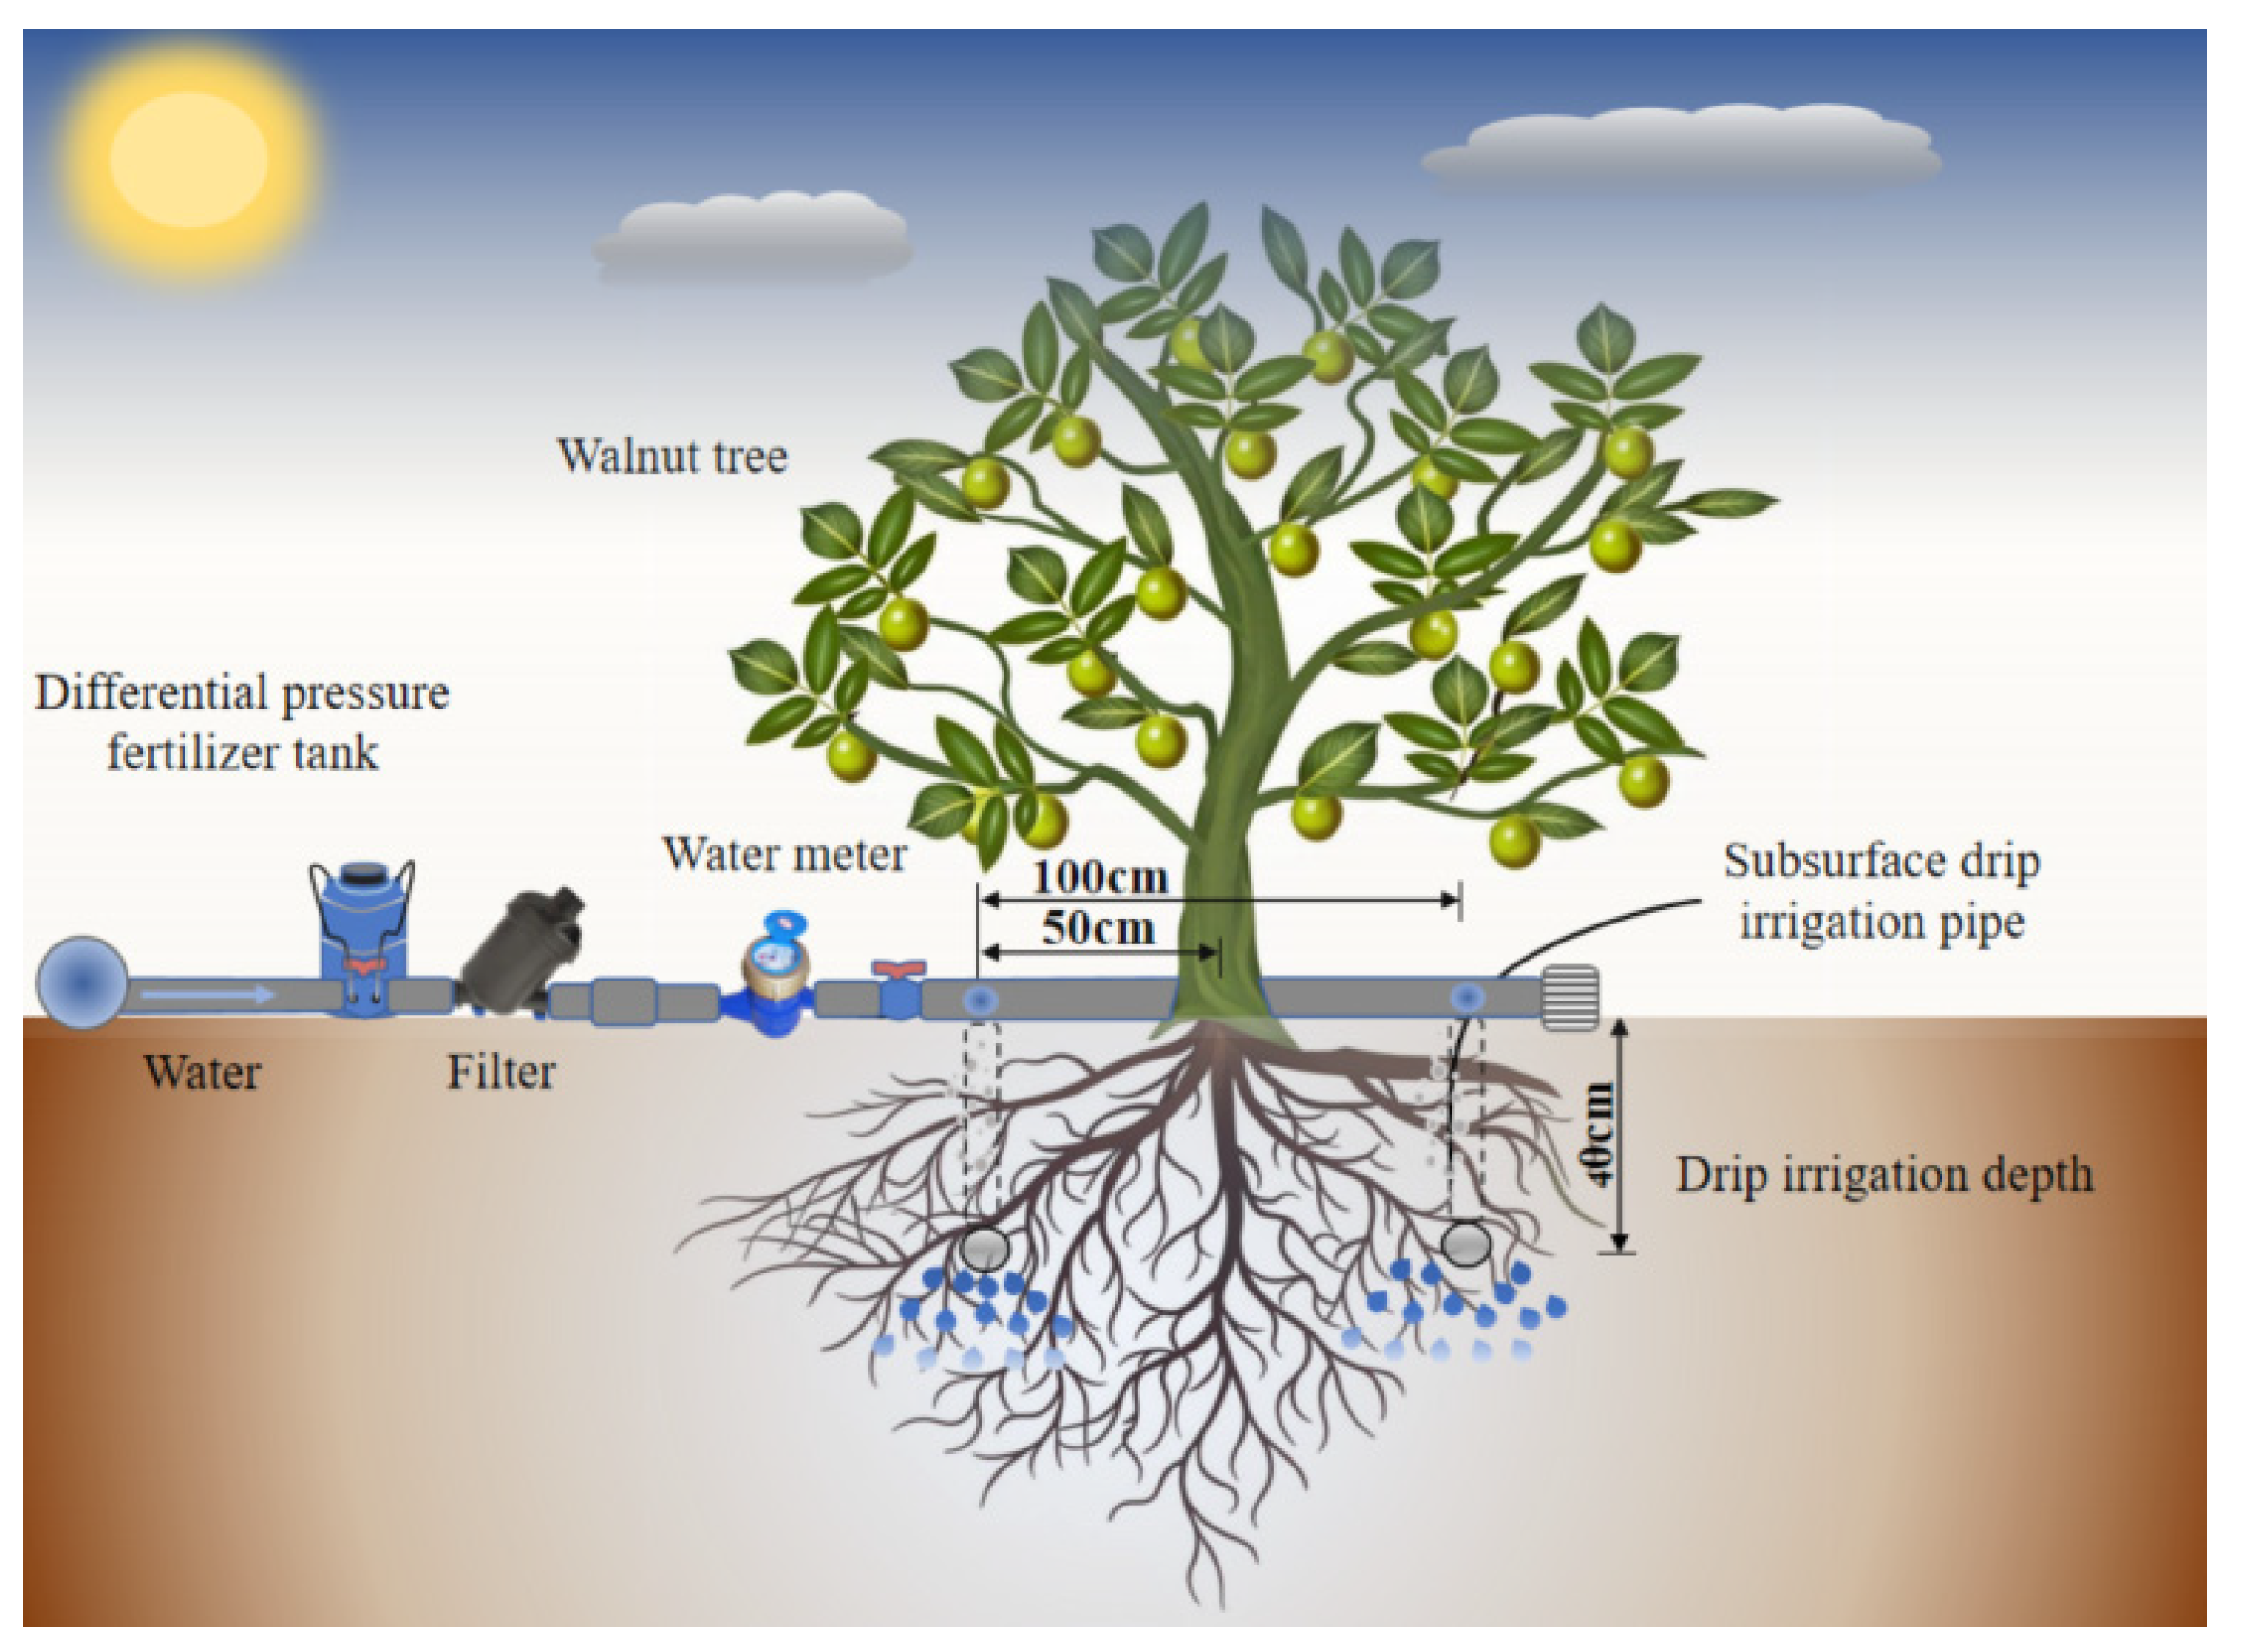
Figure 3.
Meteorological data during the walnut growing season from 2024.
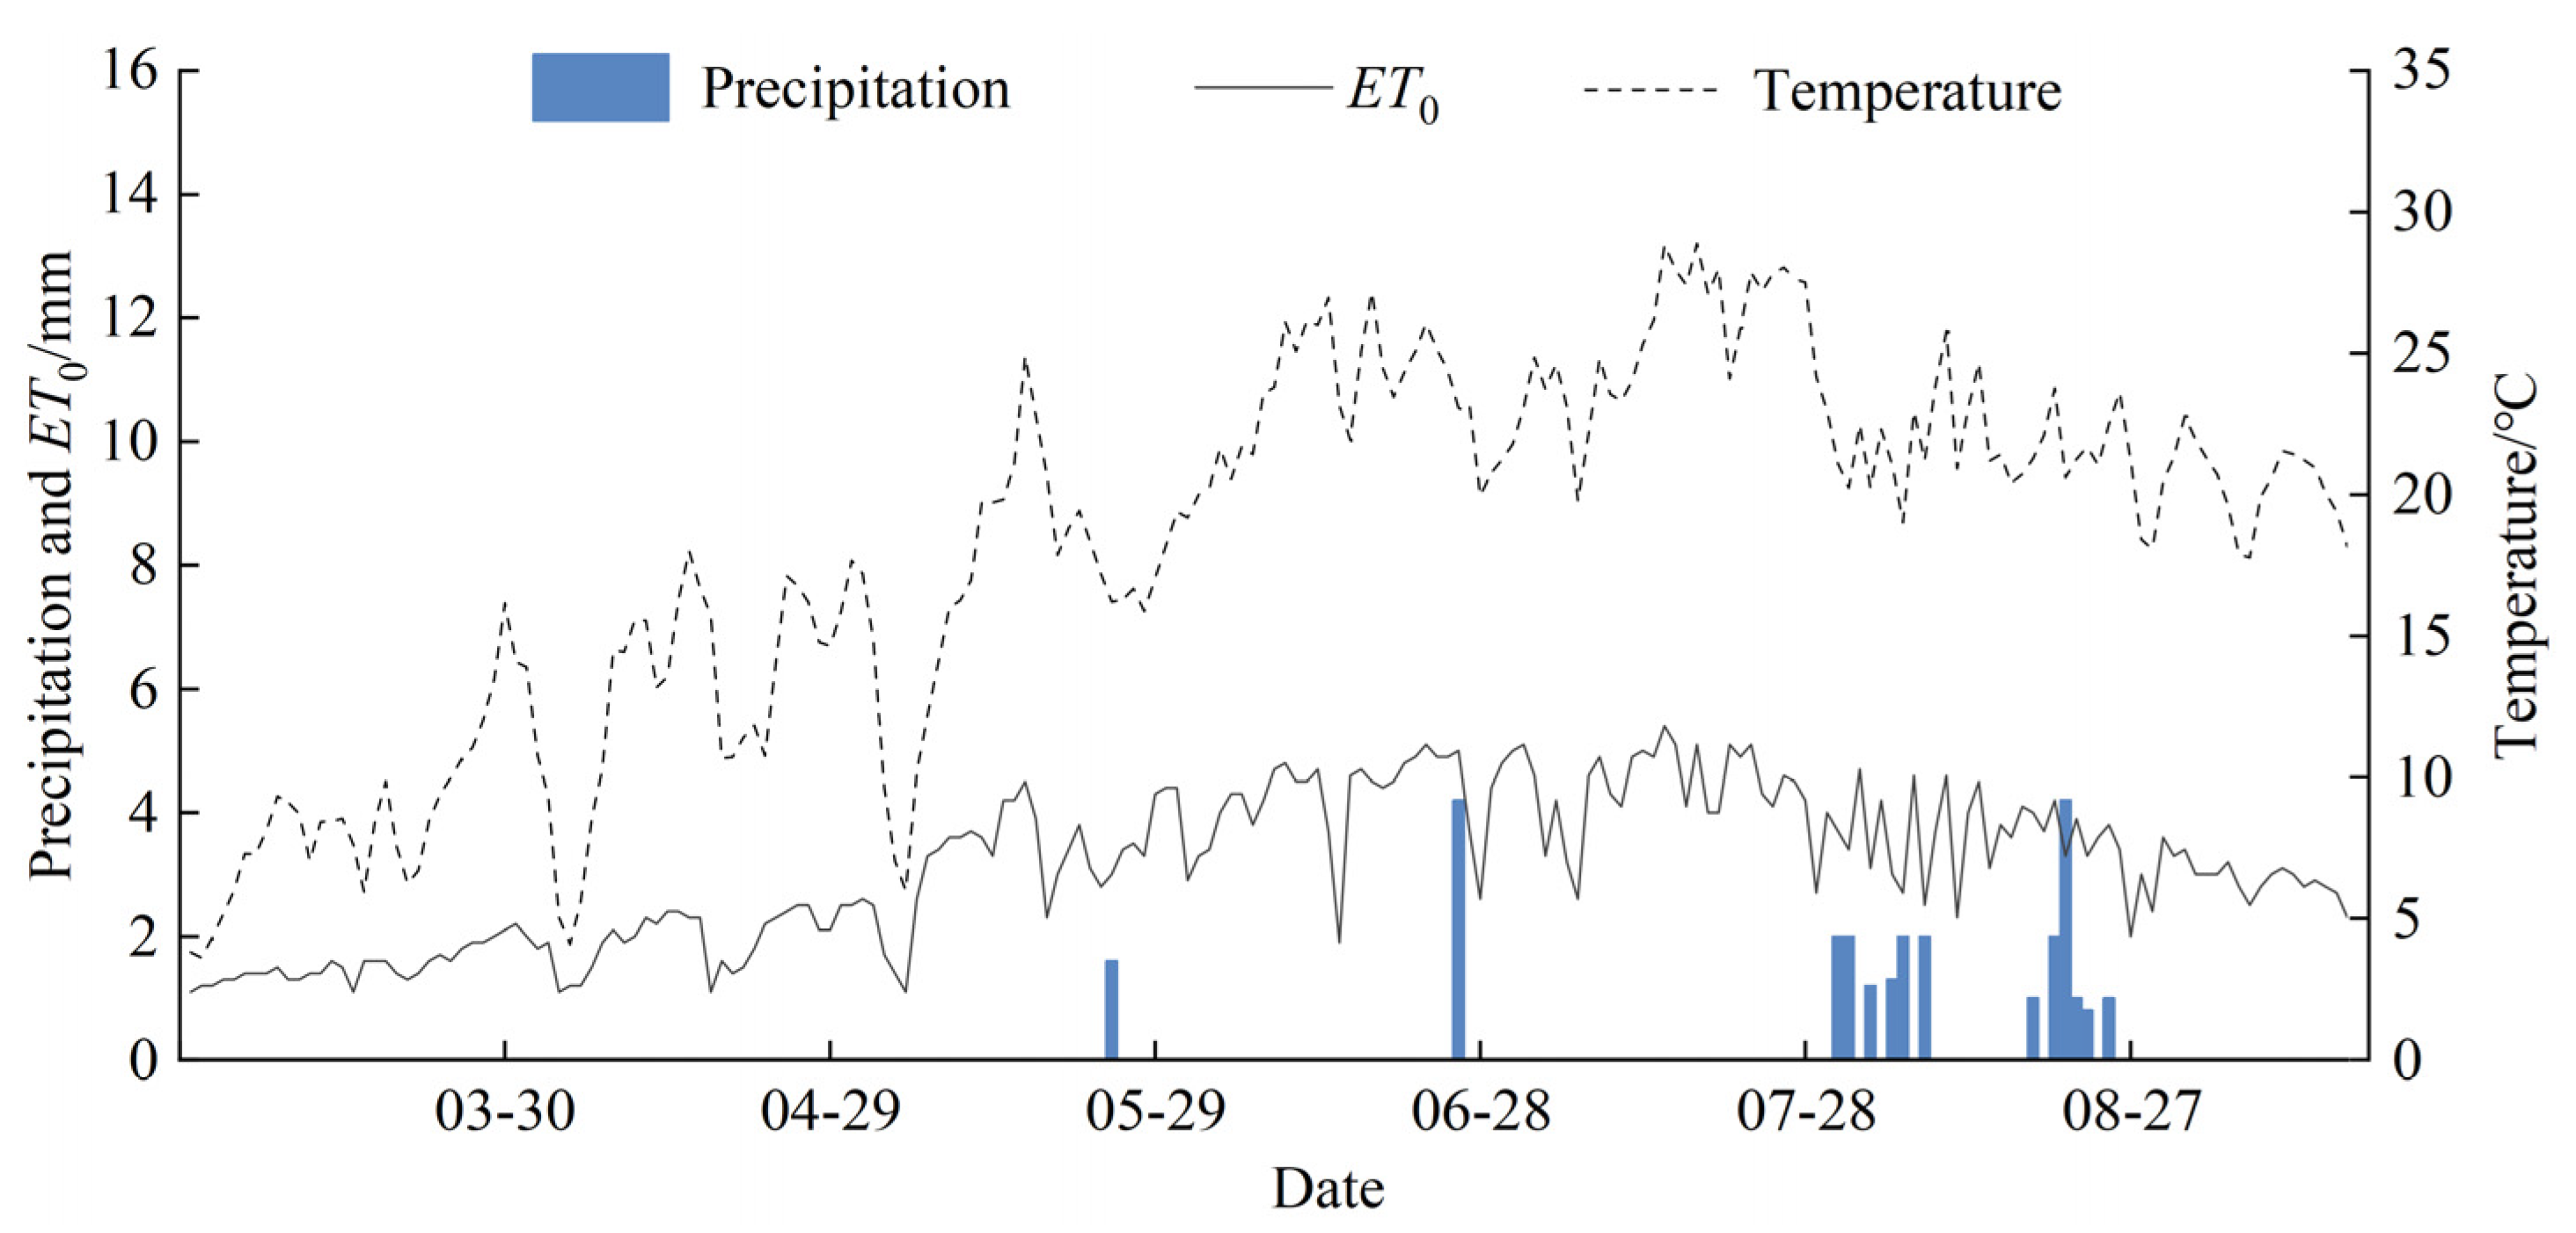
Figure 4.
Effects of water and fertilizer interaction on qalnut growth indicators at different growth stages. Note: W: irrigation amount; F: fertilizer application rate. For the same fertilizer level, different lowercase letters above bars indicate significant differences among irrigation treatments (P < 0.05), while the same letters indicate no significant difference (P > 0.05). *, **, and ns denote significant (P < 0.05), highly significant (P < 0.01), and non-significant differences, respectively. Roman numerals I, II, III, and IV represent the walnut growth stages: flowering and fruit-setting, fruit expansion, shell hardening, and oil conversion stages. NSG: new shoot growth; FV: fruit volume; SPAD: relative chlorophyll content; LAI: leaf area index. The same applies to the following figures.
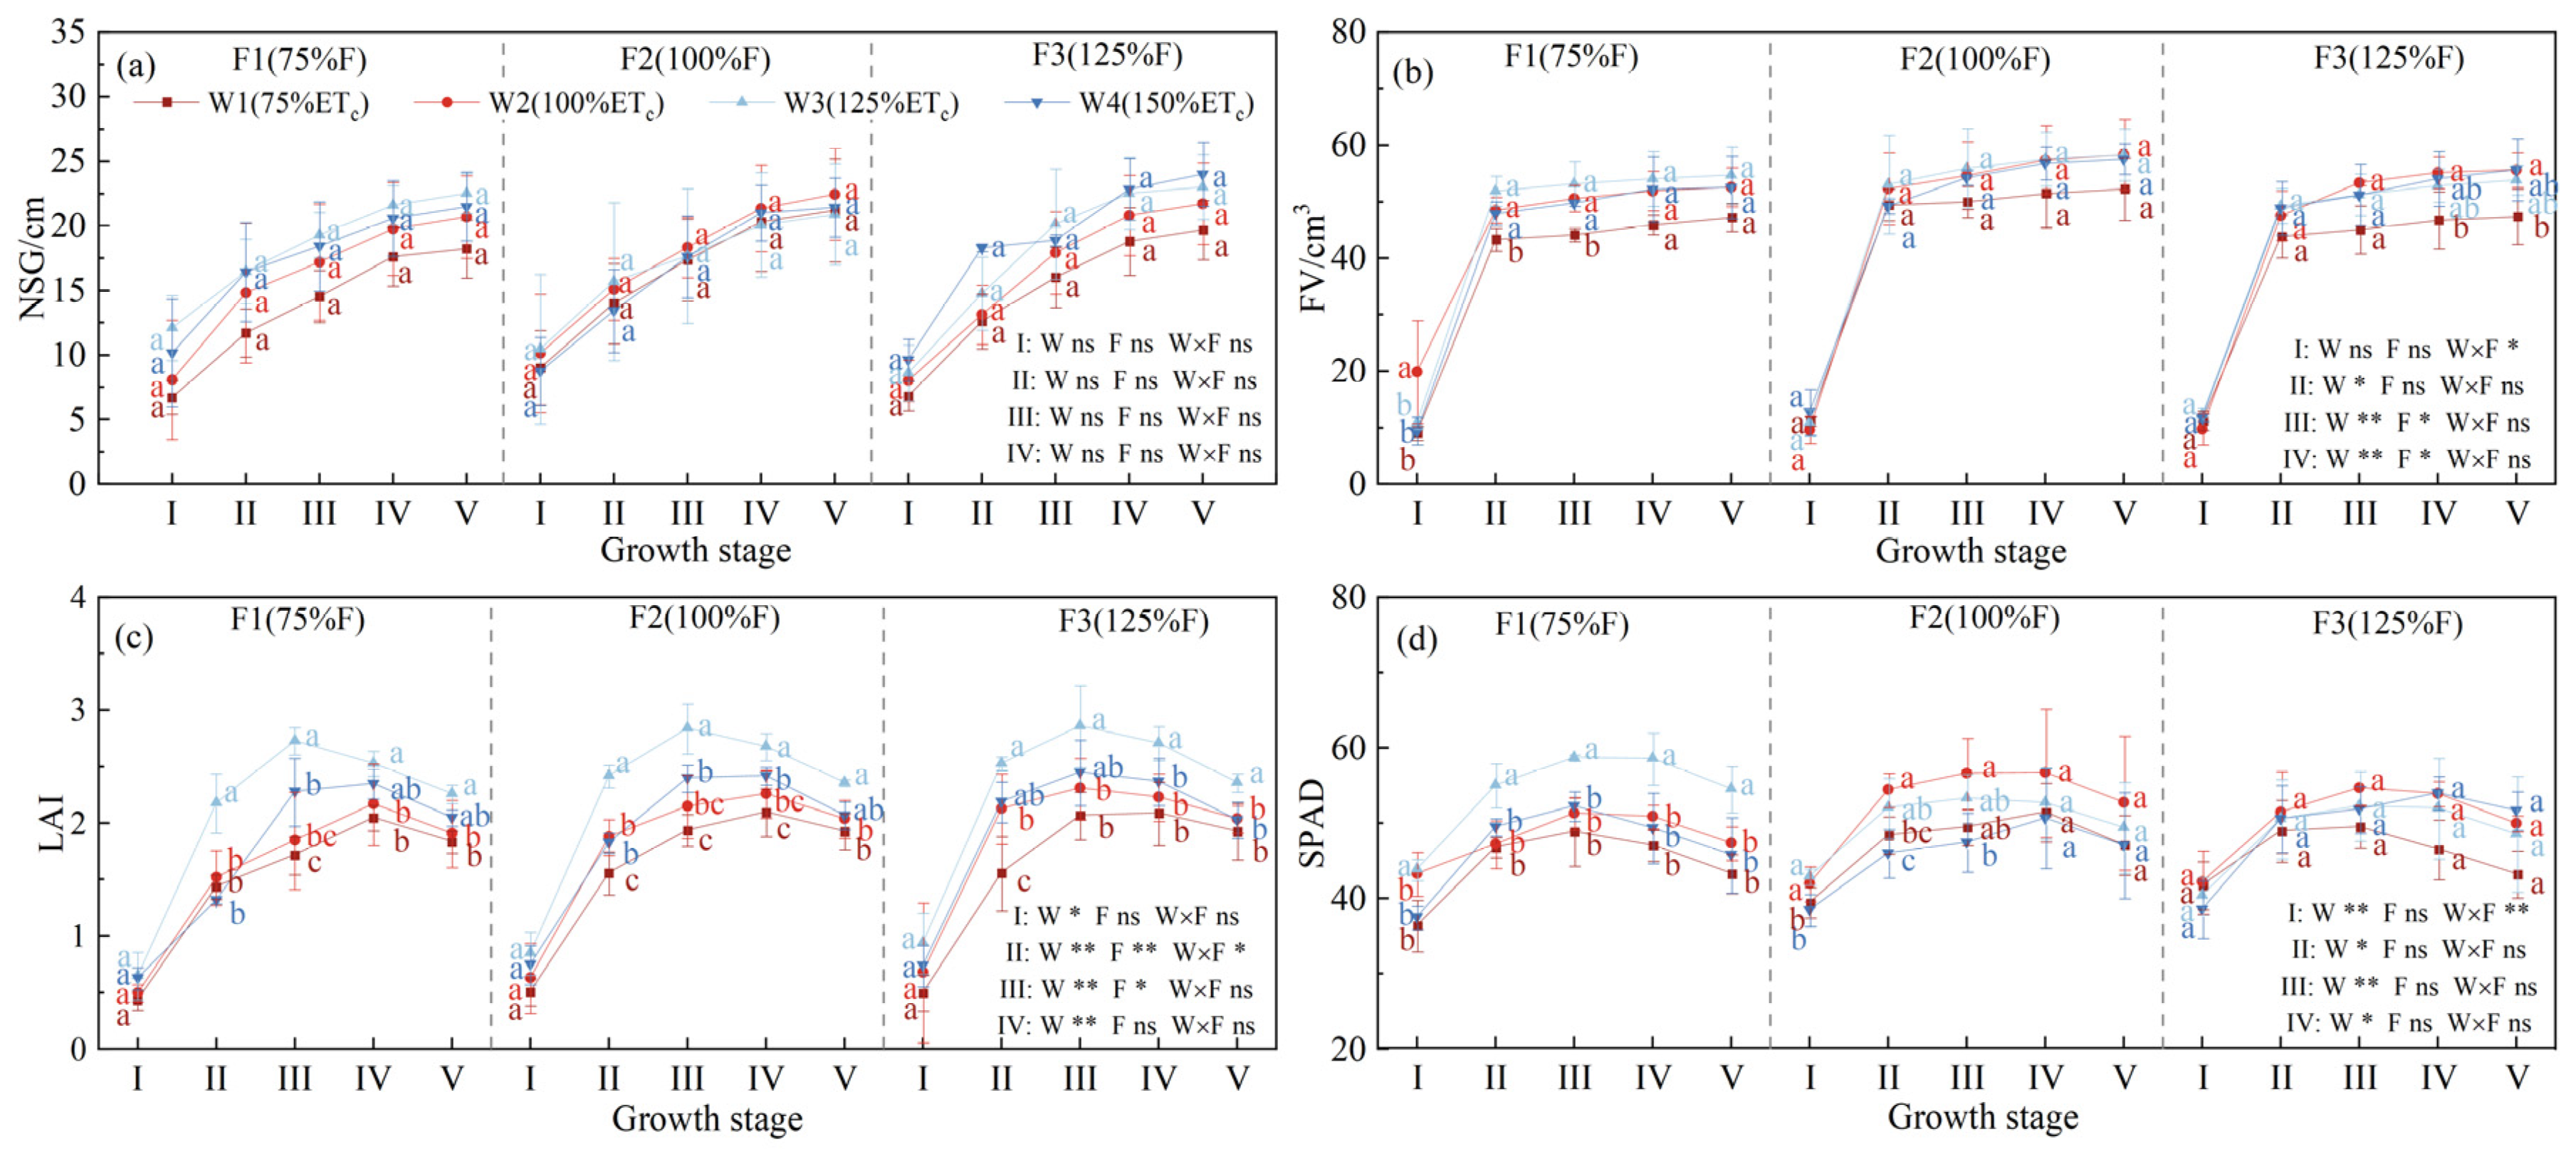
Figure 5.
Effects of water and fertilizer interaction on photosynthetic indicators of walnut at different growth stages. Note: Pn: net photosynthetic rate; Tr: transpiration rate; Ci: intercellular CO2 concentration; Gs: stomatal conductance. The same abbreviations are used in the following figures.
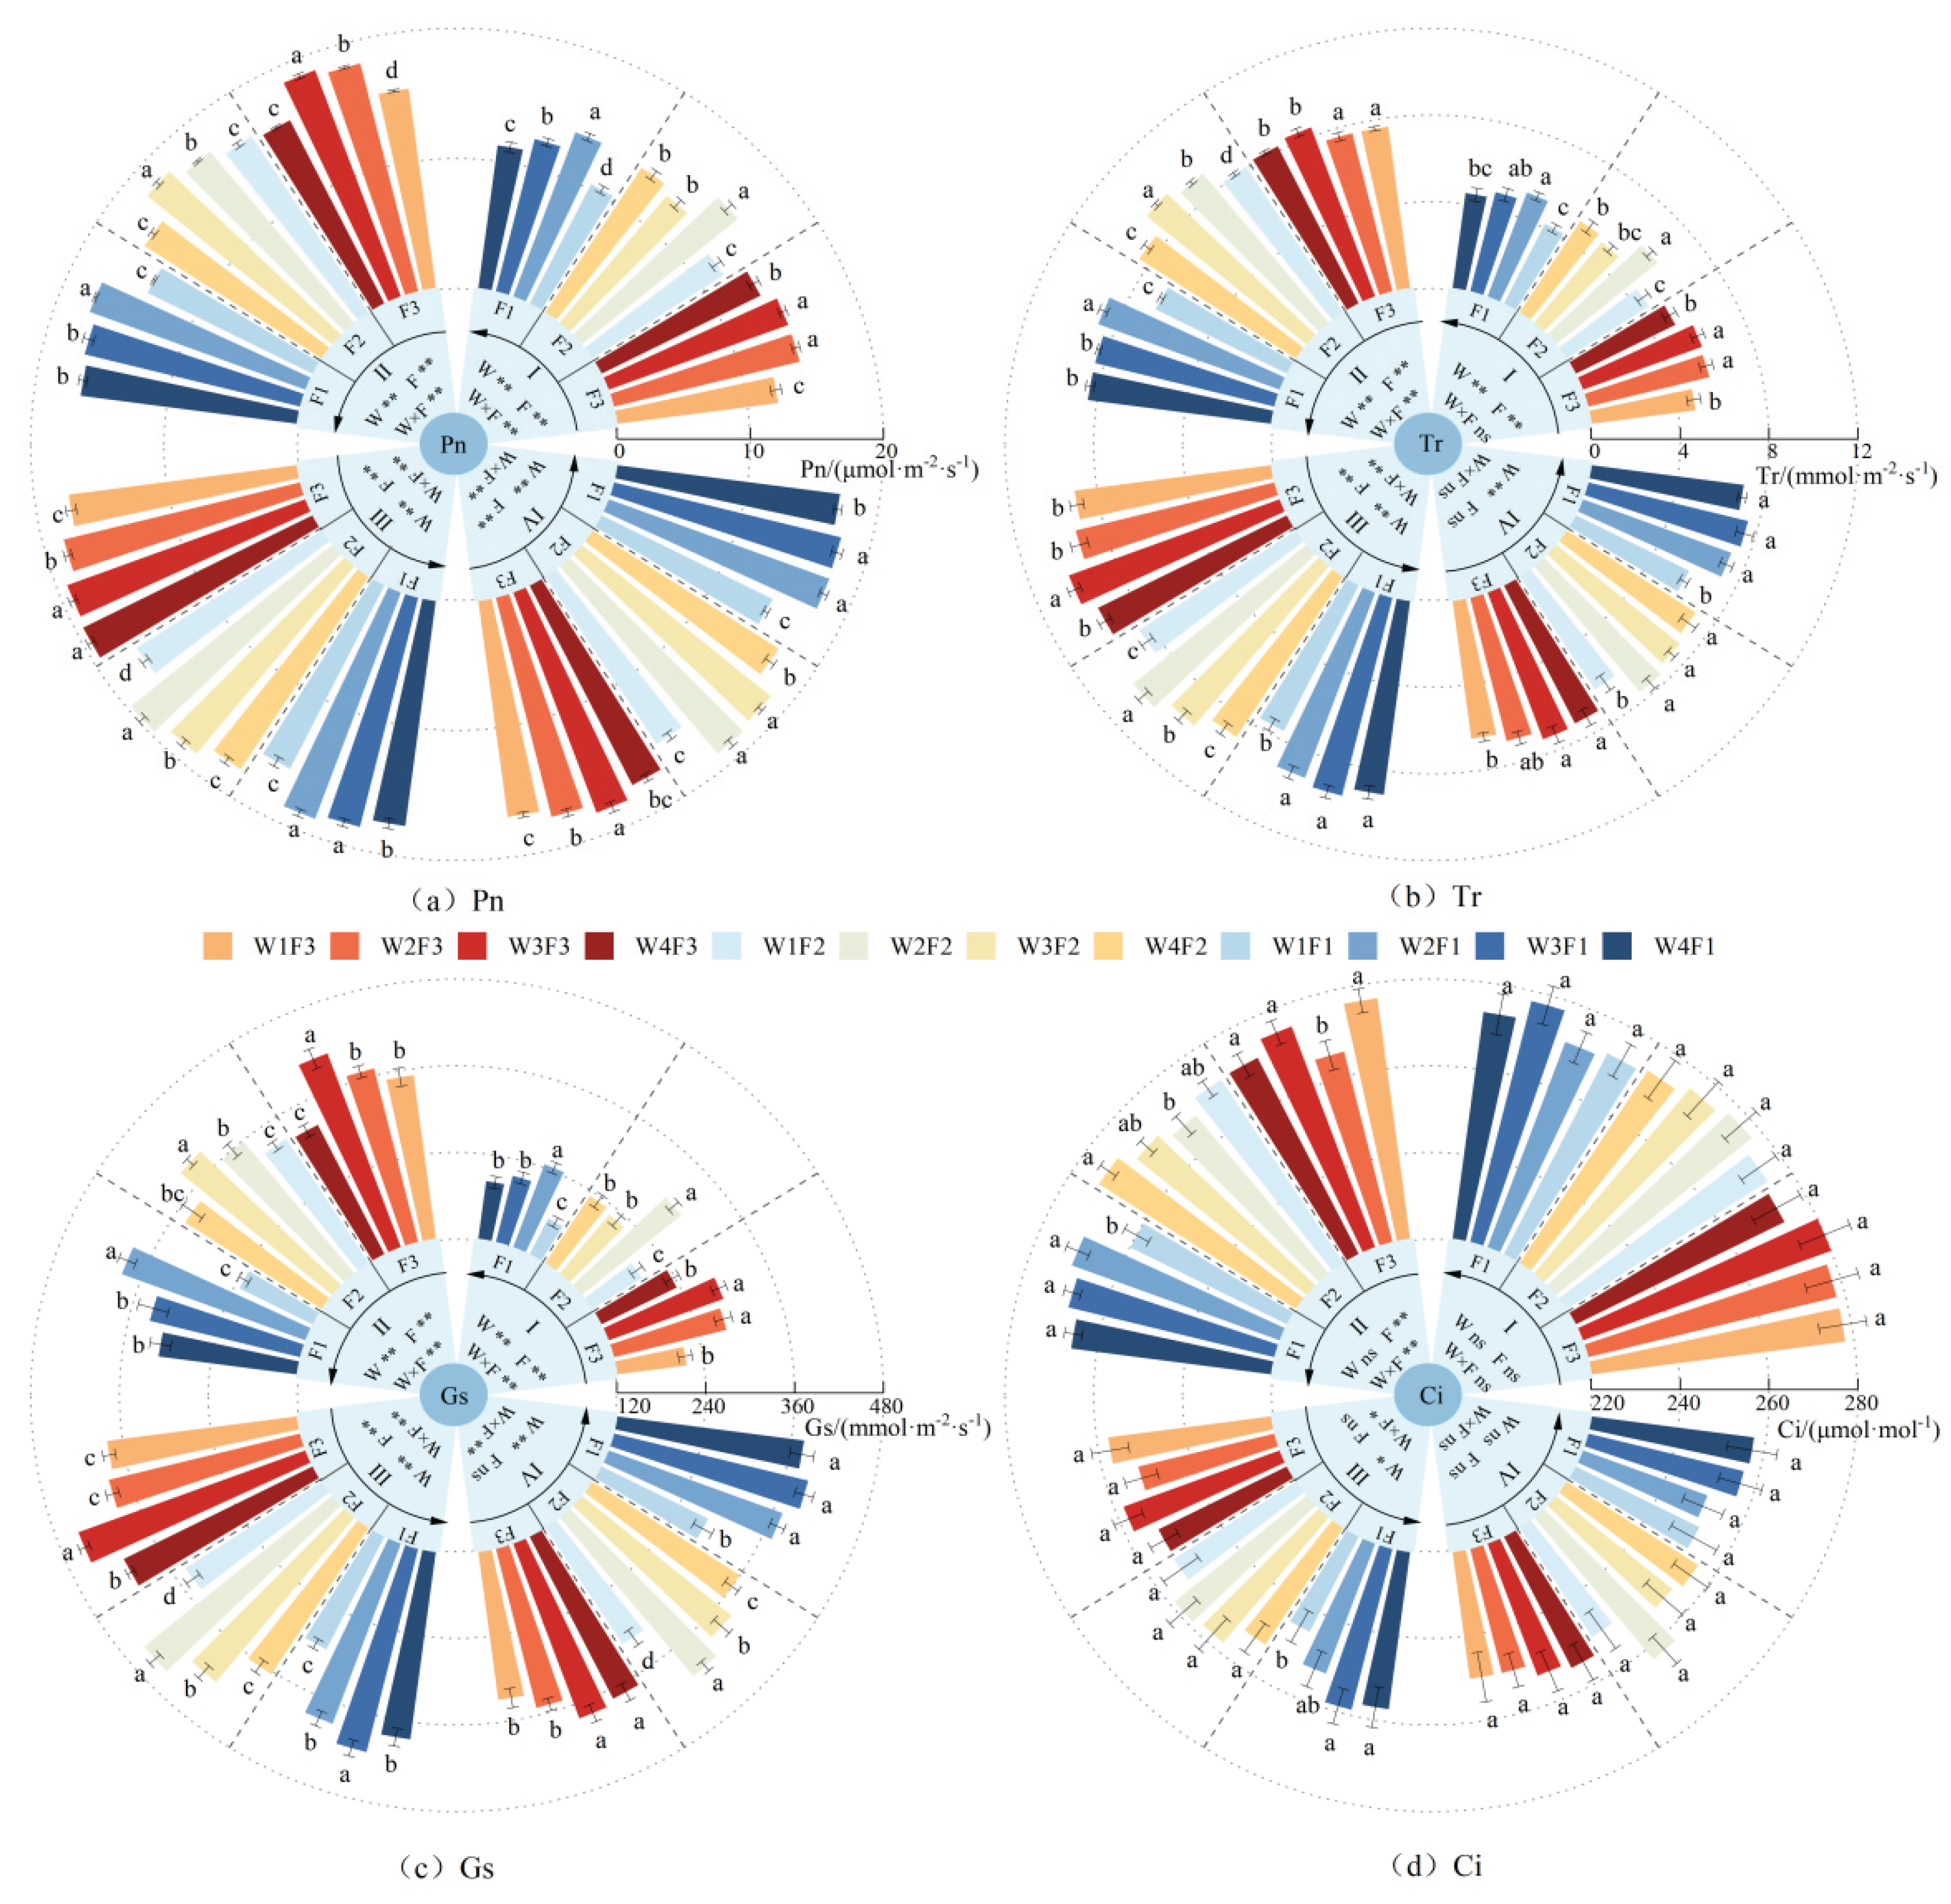
Figure 6.
Effects of water and fertilizer interaction on soil nitrate nitrogen residue in walnuts.
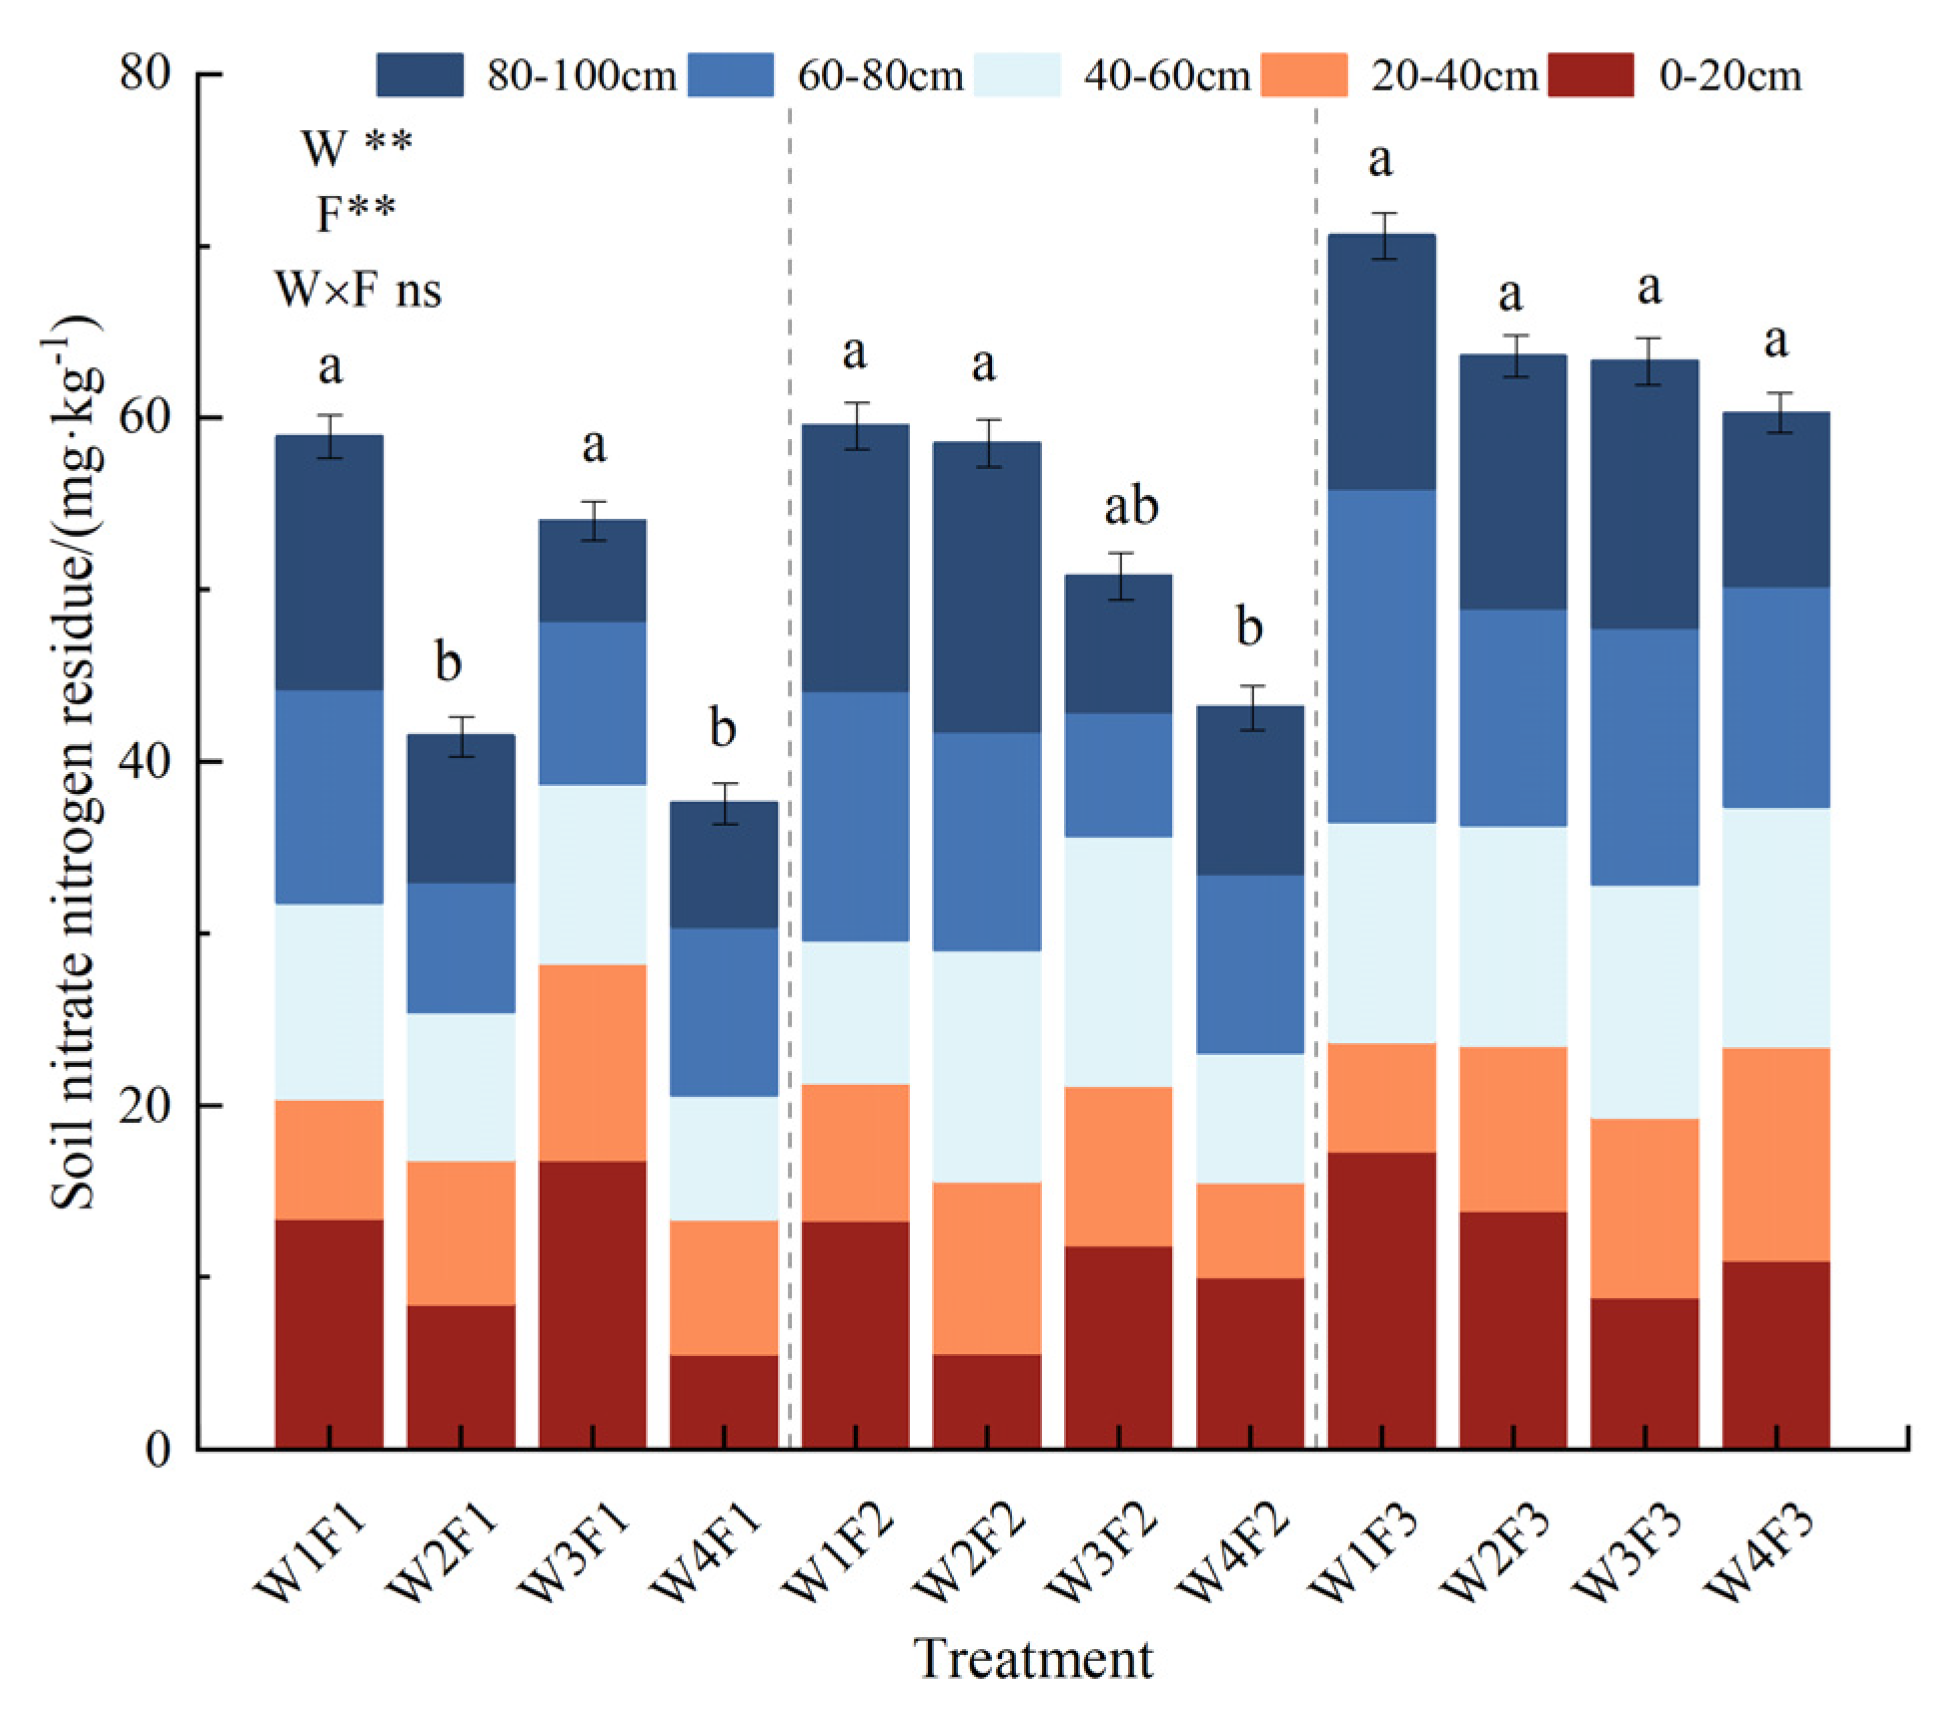
Figure 7.
Correlations between growth and photosynthetic indicators across different walnut growth stages. Note: * and ** indicate significant (P < 0.05) and highly significant (P < 0.01) correlations, respectively.
Figure 7.
Correlations between growth and photosynthetic indicators across different walnut growth stages. Note: * and ** indicate significant (P < 0.05) and highly significant (P < 0.01) correlations, respectively.
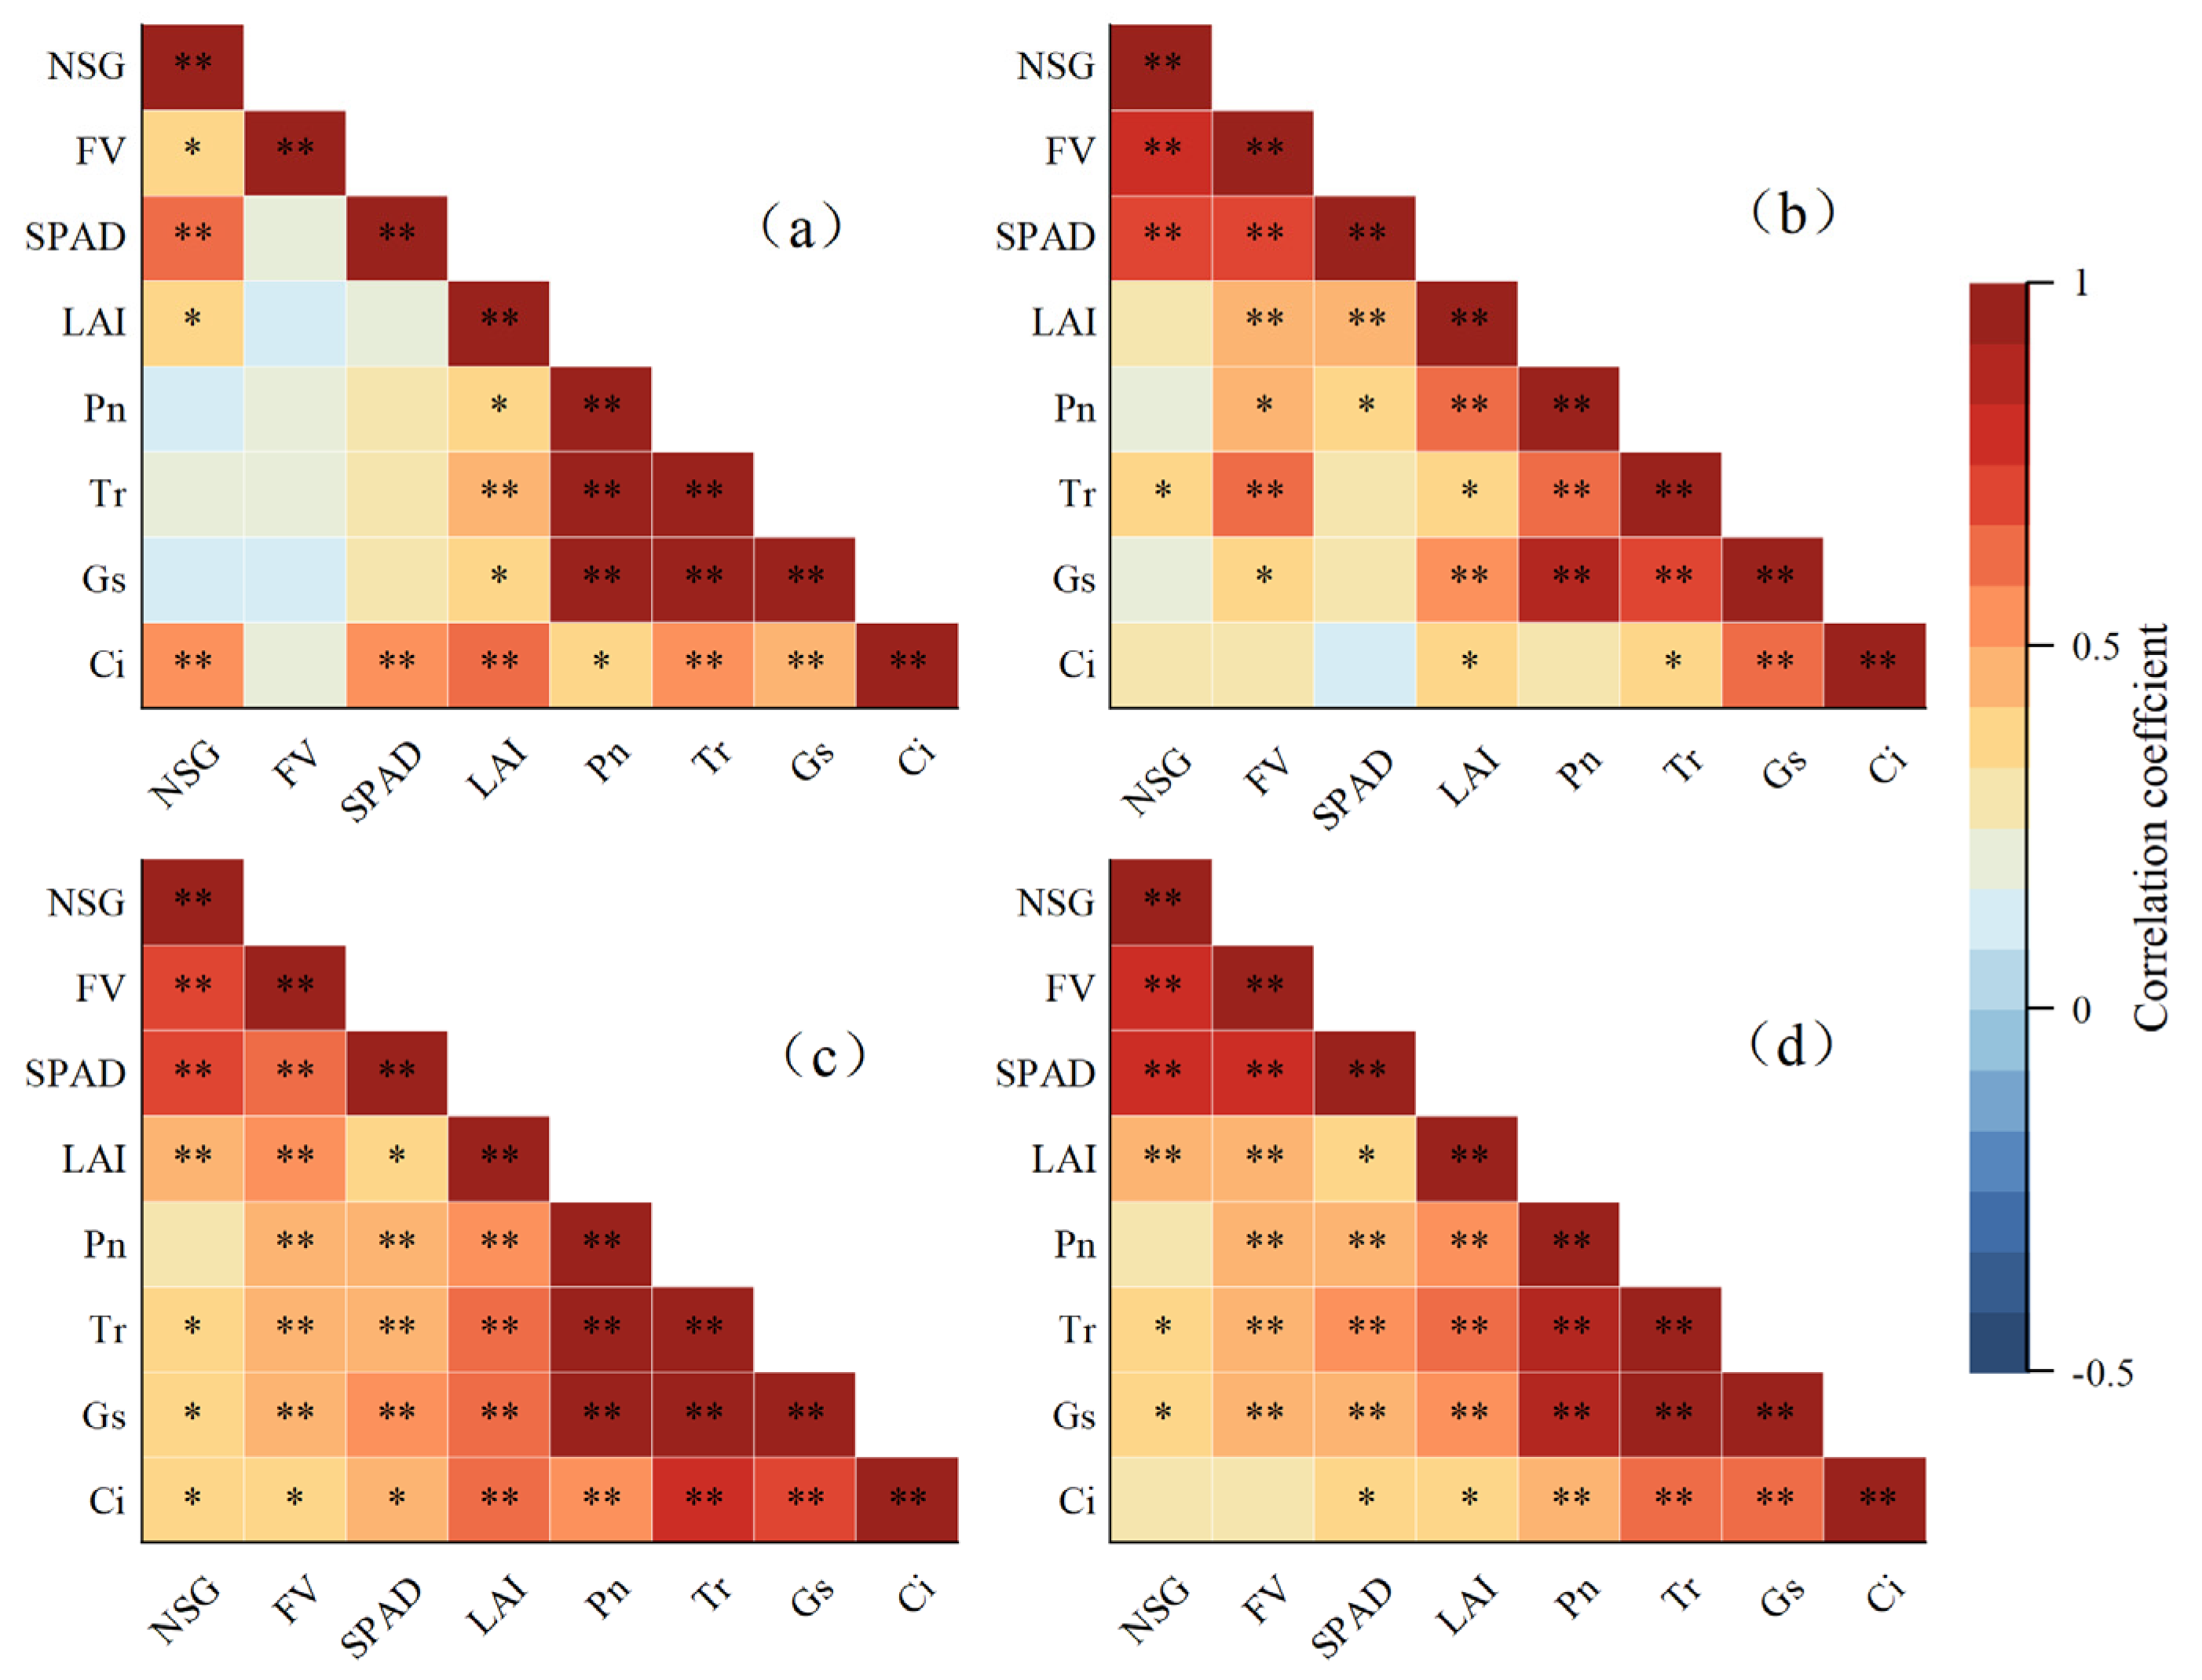
Figure 8.
Correlations between the CGI and CPI with yield components and fruit quality across walnut growth stages.
Figure 8.
Correlations between the CGI and CPI with yield components and fruit quality across walnut growth stages.
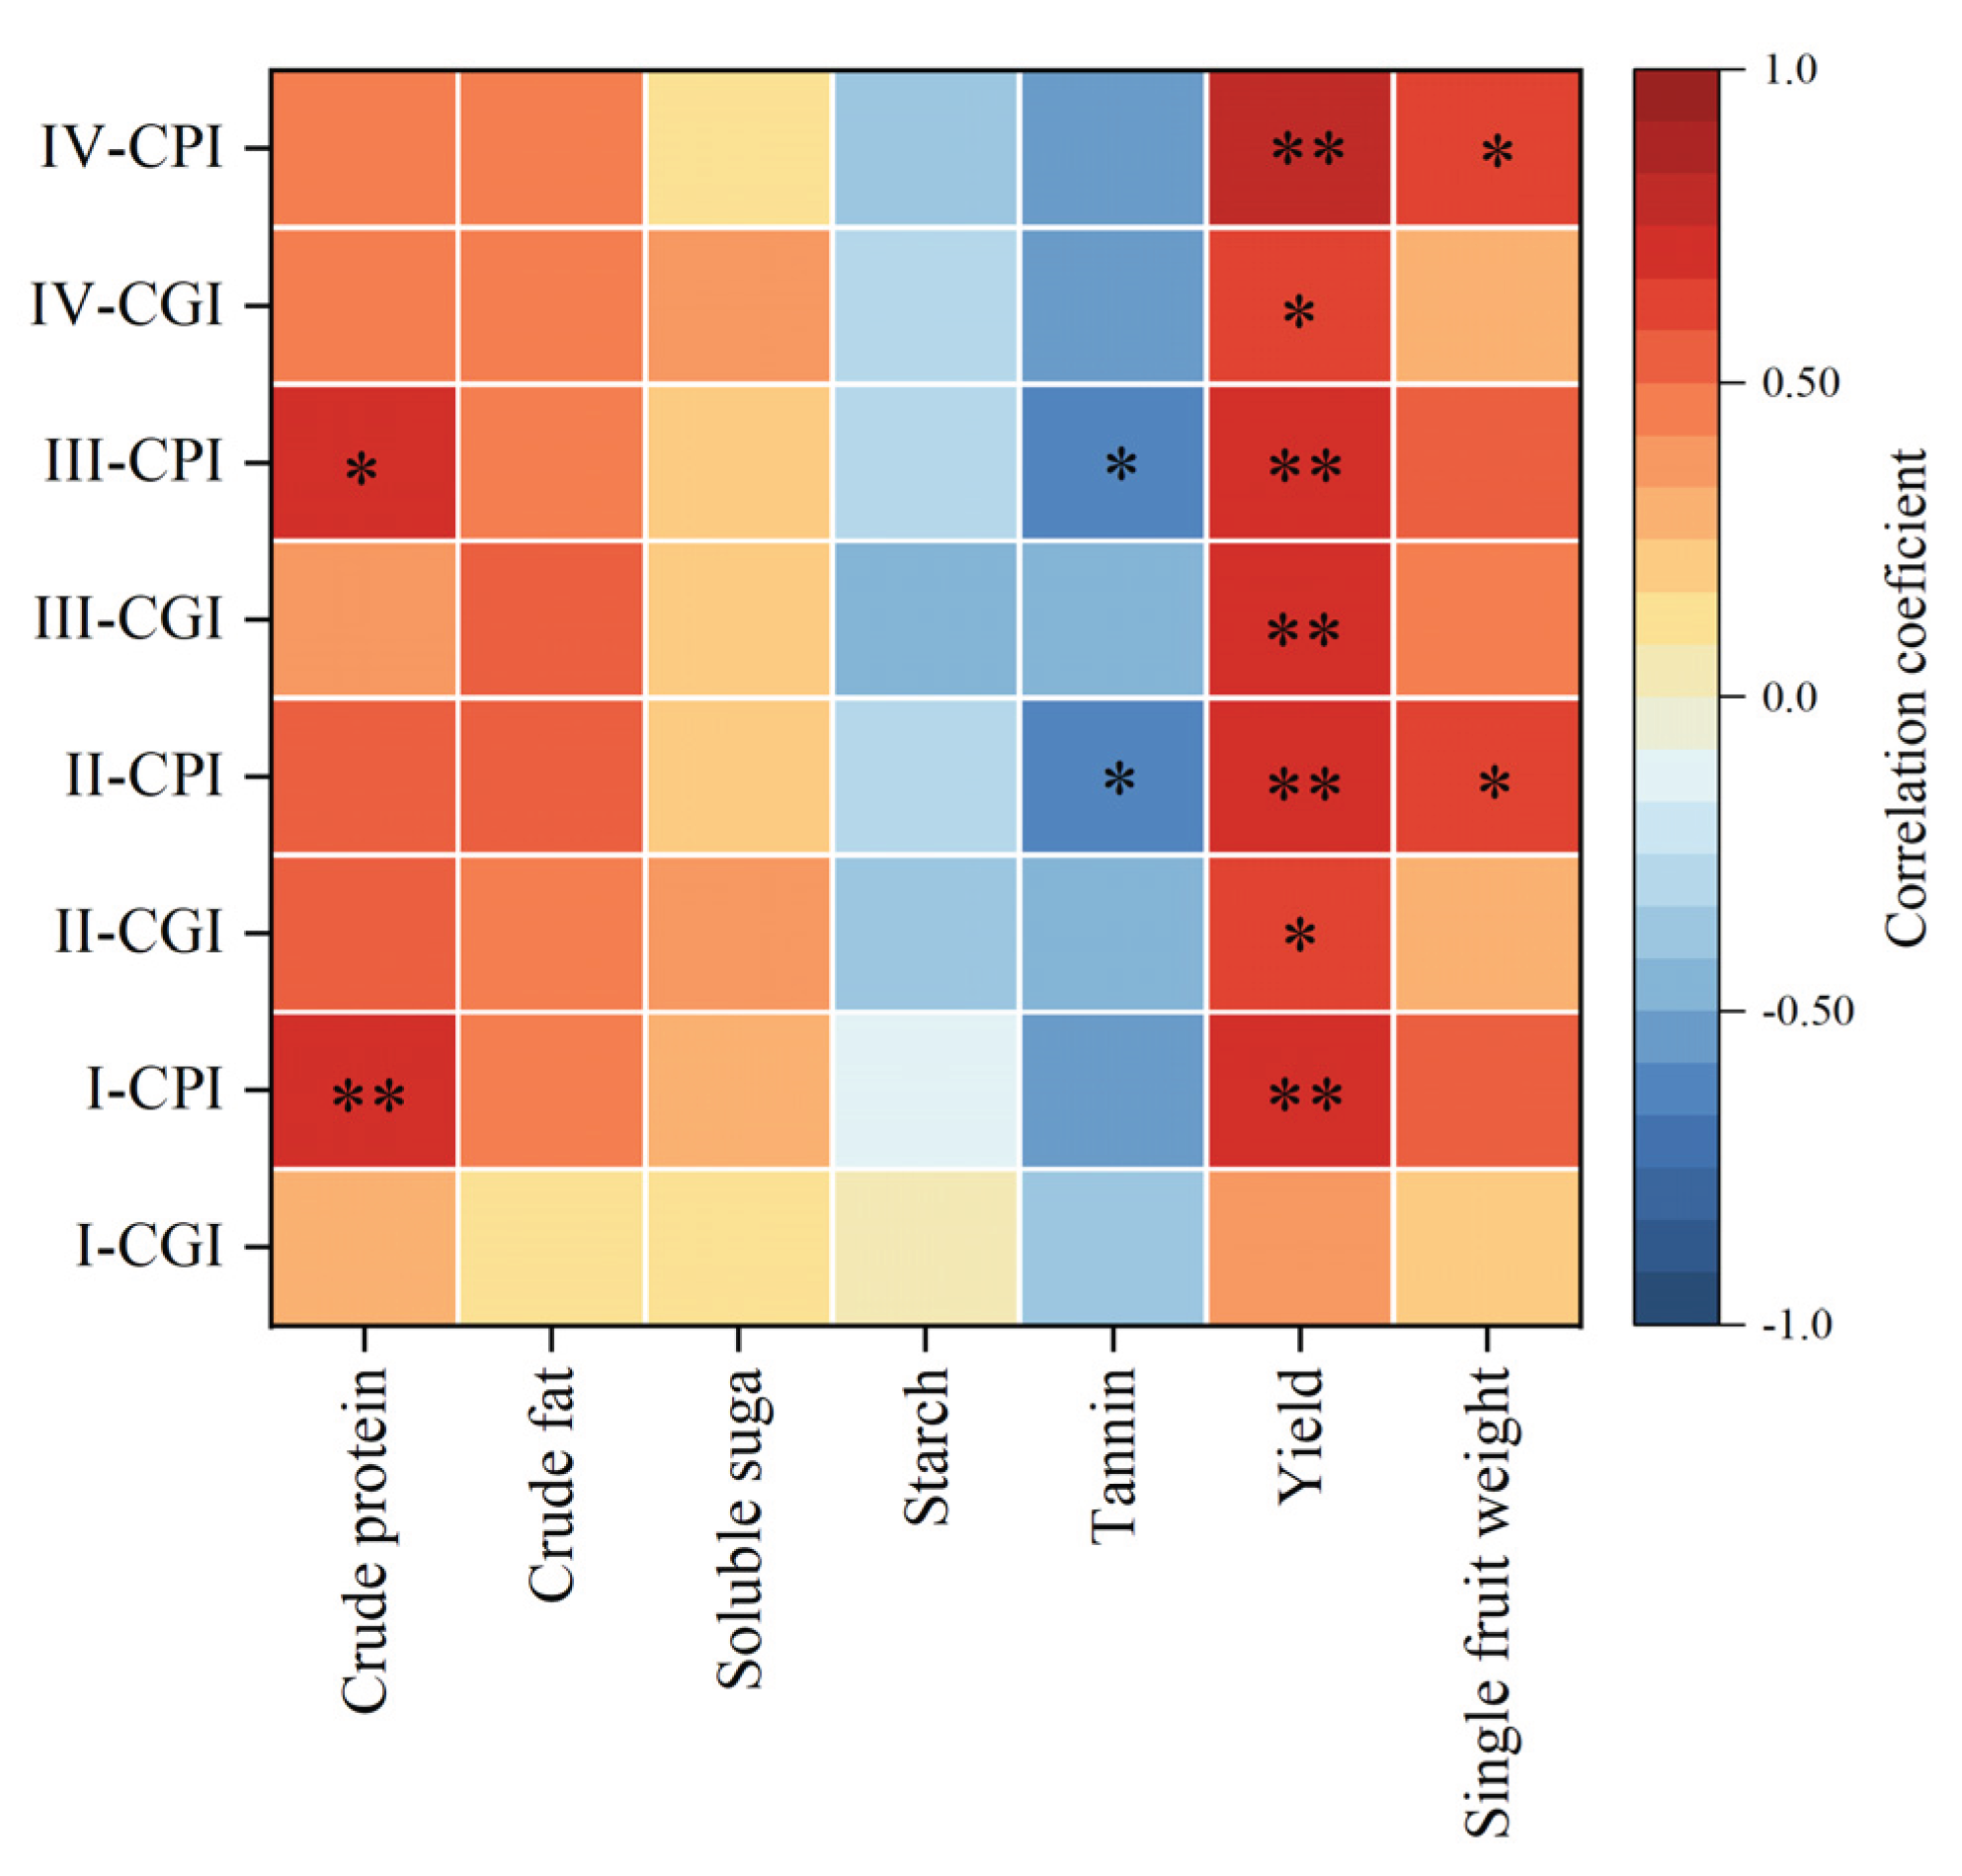
Figure 9.
Comprehensive growth evaluation system for subsurface drip-irrigation over the entire growth period of walnut. Note: A: comprehensive growth evaluation system for subsurface drip-irrigation over the entire growth period of walnut; B1: growth factor; B2: photosynthetic factor; B3: quality factor; B4: yield factor; B5: efficiency factor B6: environmental factor.
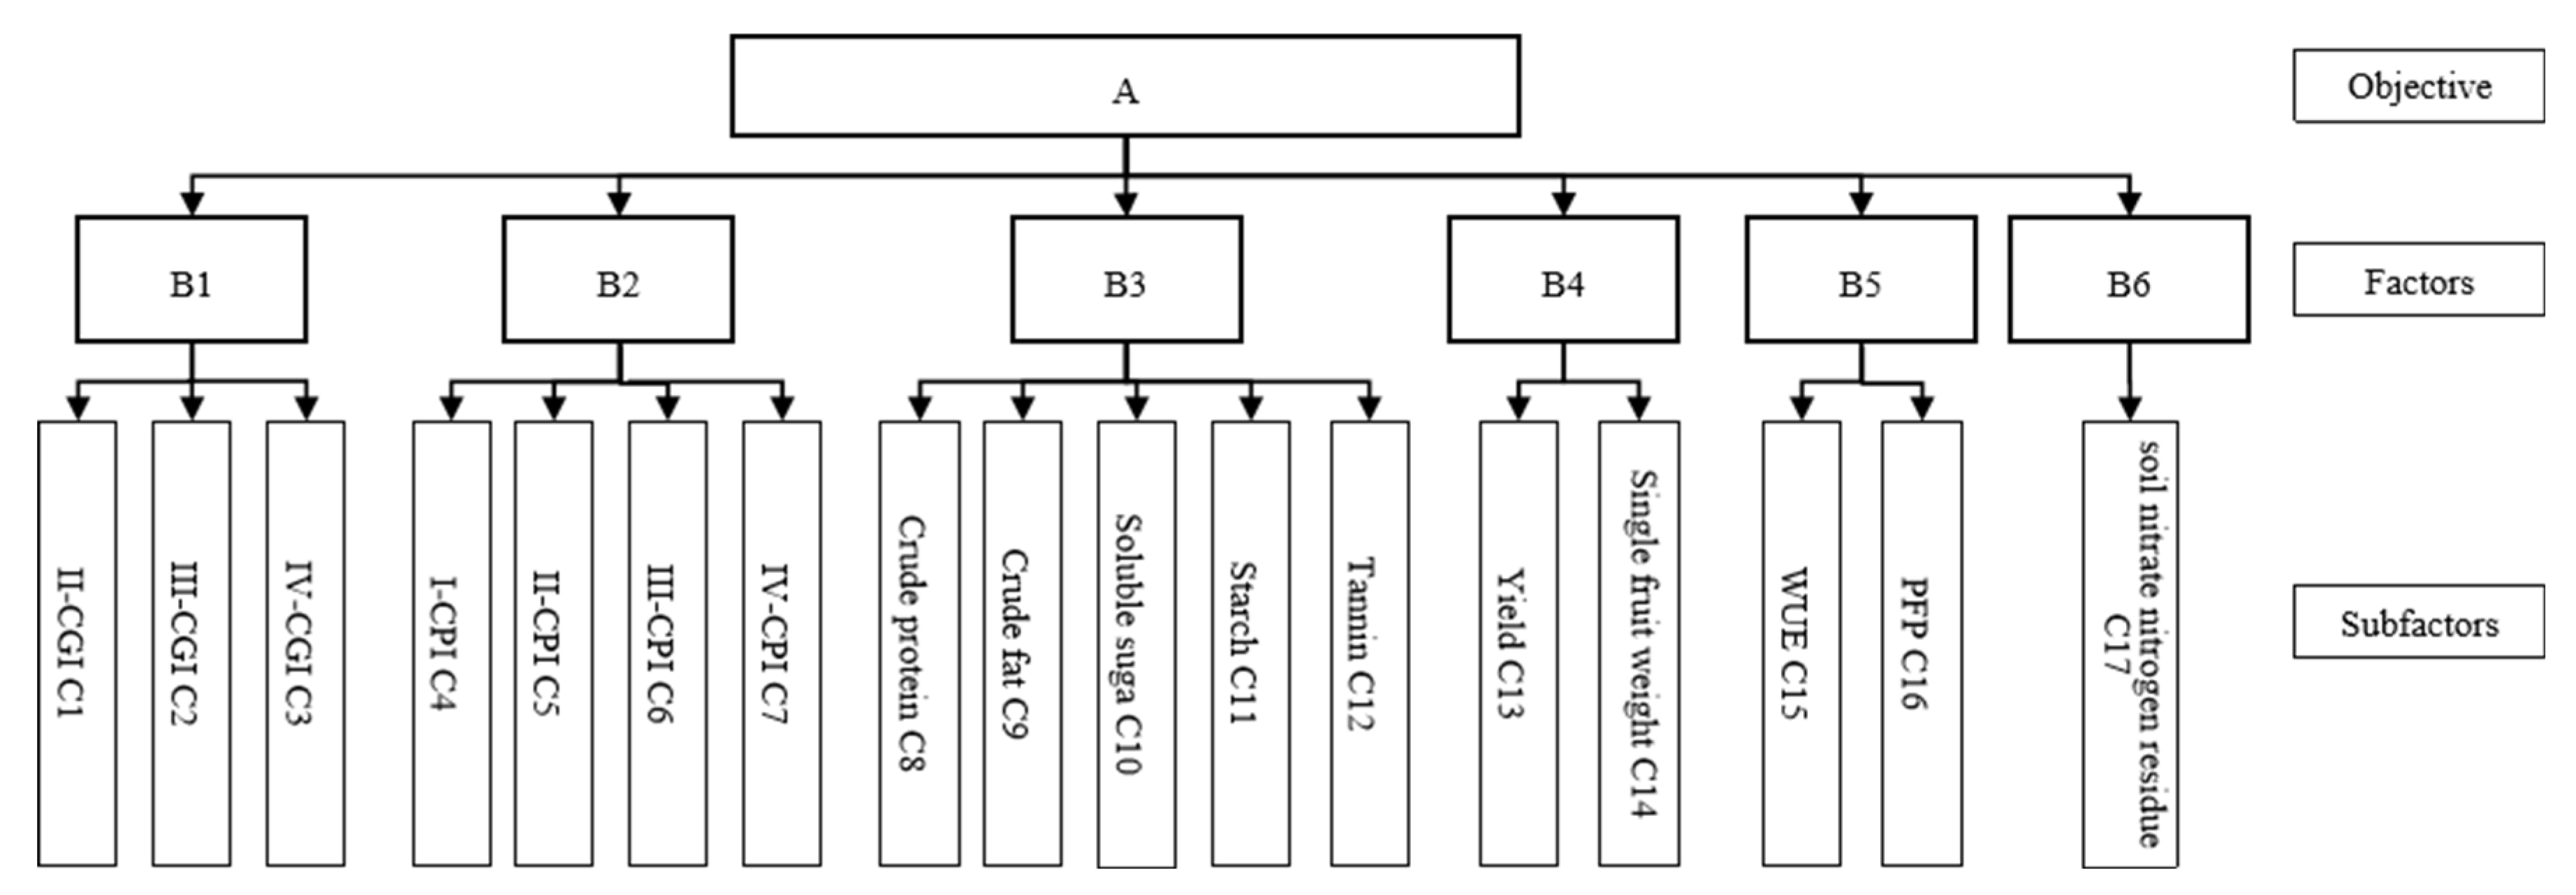
Figure 10.
Effects of water and fertilizer single factors on the comprehensive score of walnut.
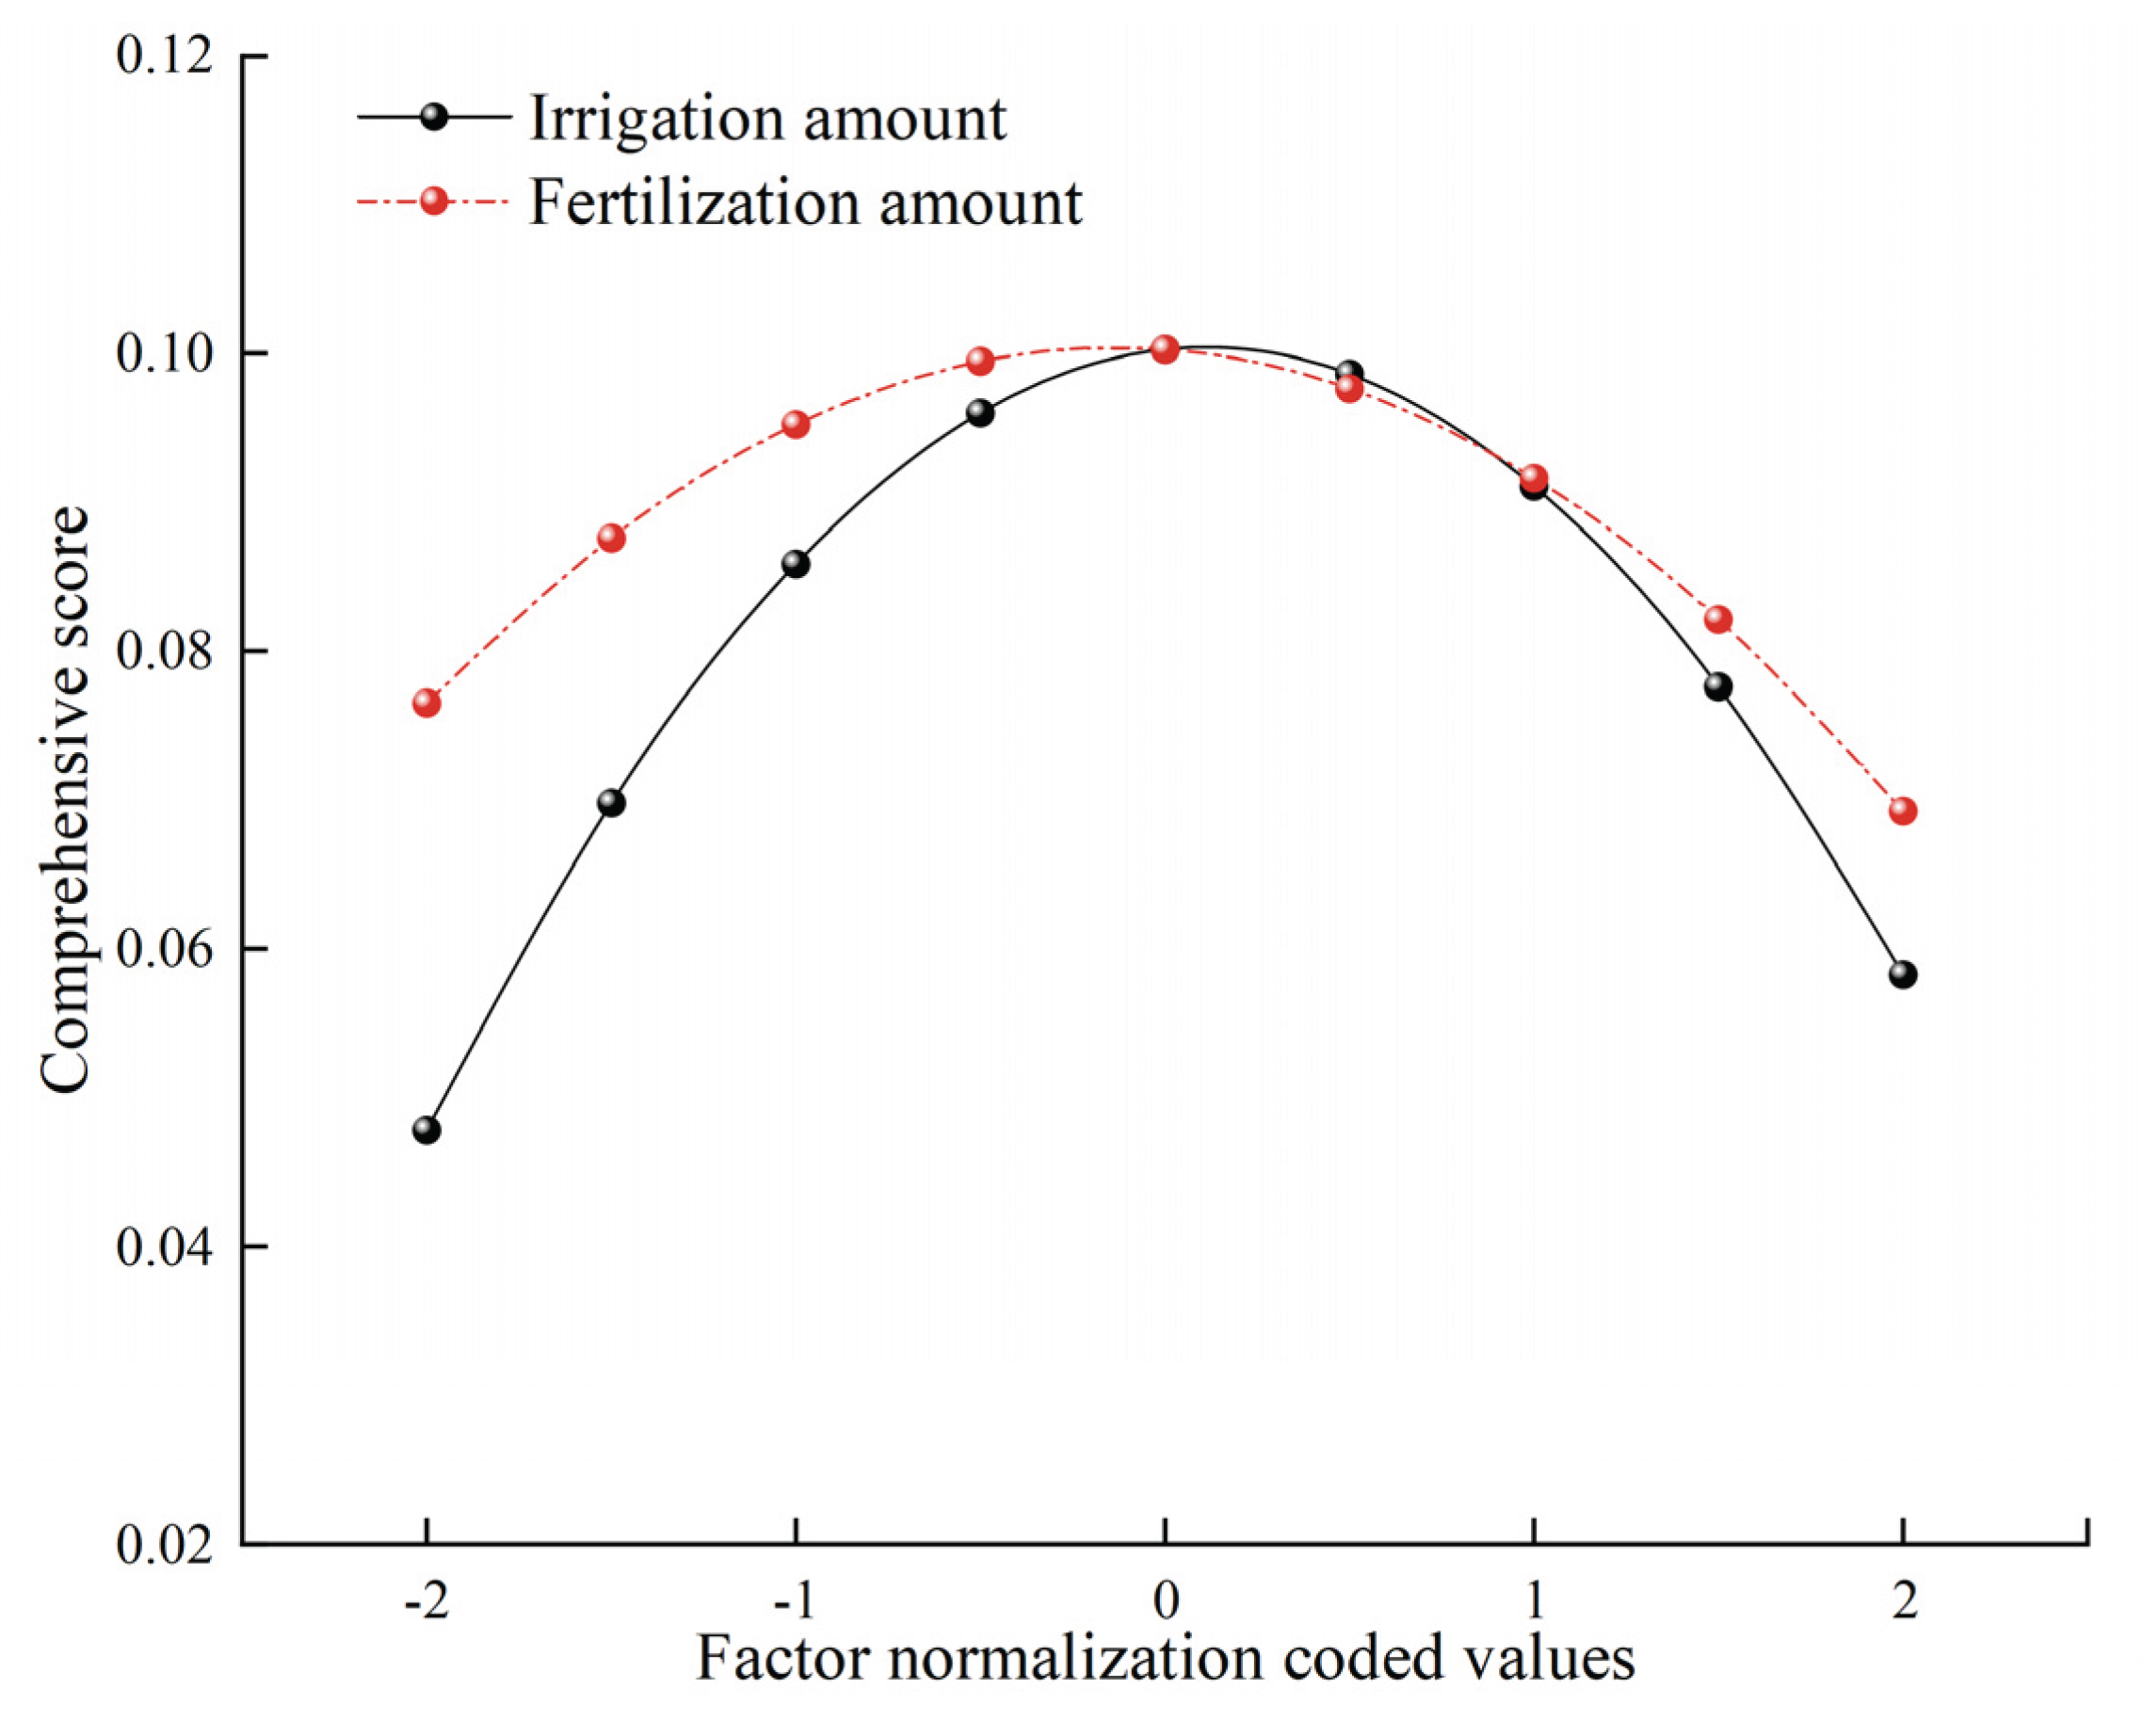
Figure 11.
Regulatory effects of water and fertilizer interaction on the comprehensive evaluation score of walnuts.
Figure 11.
Regulatory effects of water and fertilizer interaction on the comprehensive evaluation score of walnuts.
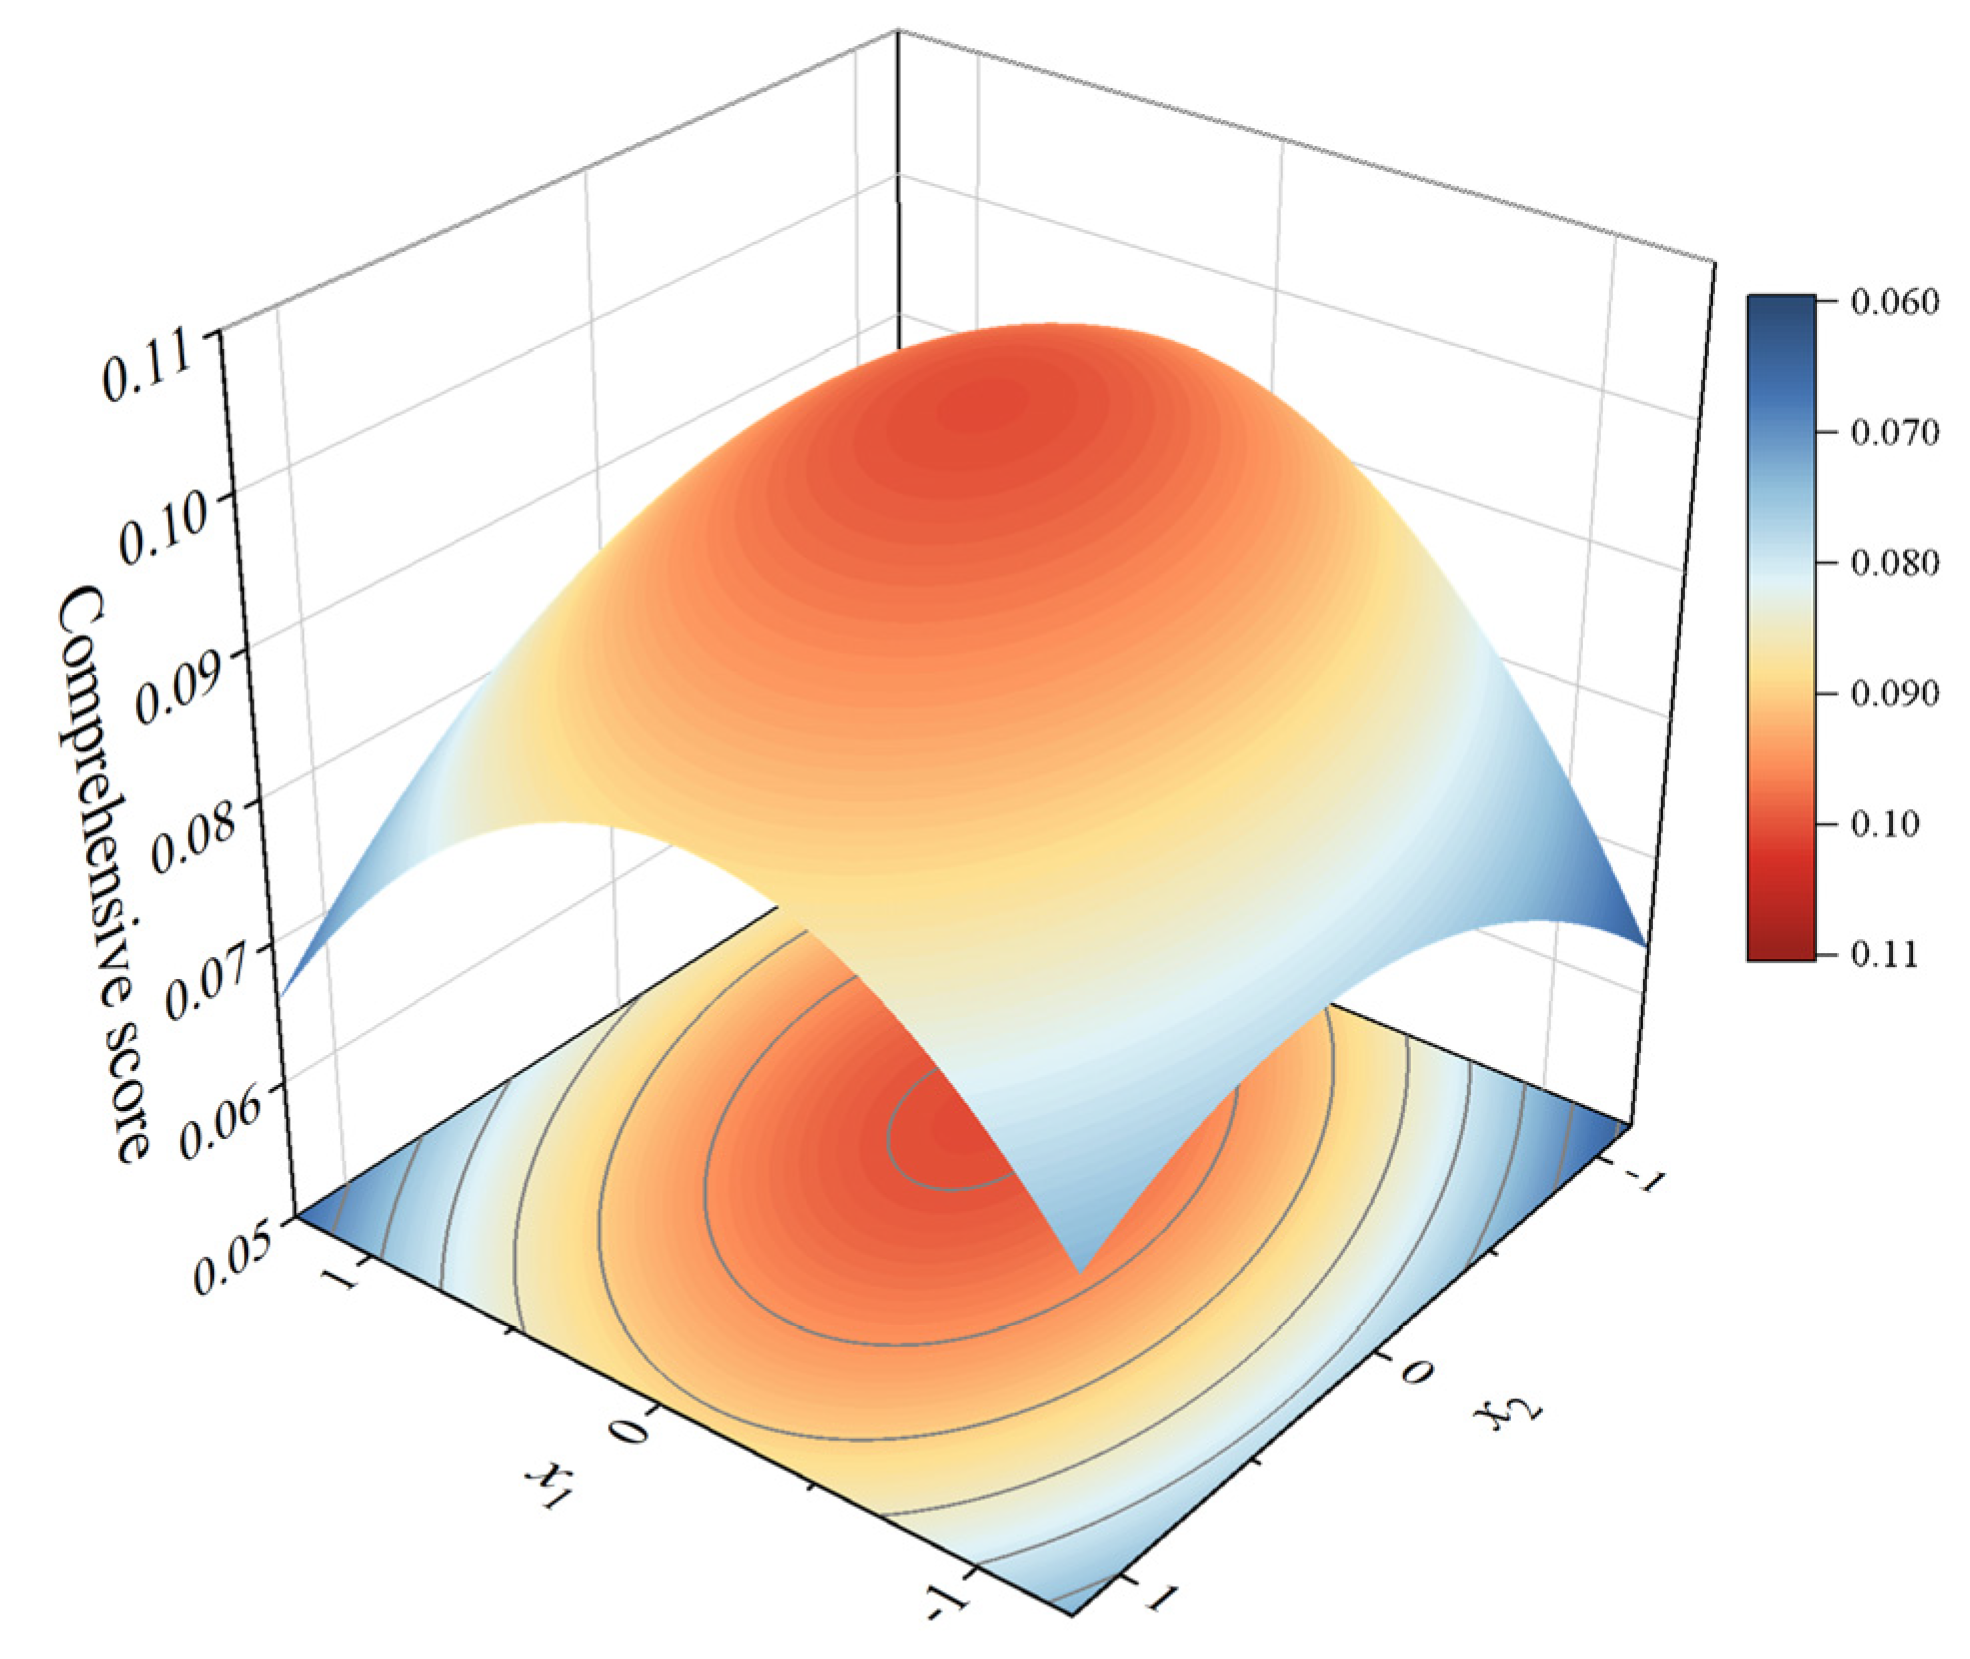

Table 1.
Experimental design of the walnut irrigation and fertilization experiment.
| Experimental treatment |
Irrigation allowance/ (m3·hm-2) |
Irrigation quota/ (m3·hm-2) |
Fertilizer application amount/(kg·hm-2) |
||
|---|---|---|---|---|---|
| N | P2O5 | K2O | |||
| W1F1 | 75%ETc | 3 993 | 270 | 240 | 300 |
| W2F1 | 100%ETc | 5 328 | 270 | 240 | 300 |
| W3F1 | 125%ETc | 6 656 | 270 | 240 | 300 |
| W4F1 | 150%ETc | 6 985 | 270 | 240 | 300 |
| W1F2 | 75%ETc | 3 993 | 360 | 320 | 400 |
| W2F2 | 100%ETc | 5 328 | 360 | 320 | 400 |
| W3F2 | 125%ETc | 6 656 | 360 | 320 | 400 |
| W4F2 | 150%ETc | 6 985 | 360 | 320 | 400 |
| W1F3 | 75%ETc | 3 993 | 450 | 400 | 500 |
| W2F3 | 100%ETc | 5 328 | 450 | 400 | 500 |
| W3F3 | 125%ETc | 6 656 | 450 | 400 | 500 |
| W4F3 | 150%ETc | 6 985 | 450 | 400 | 500 |
Table 2.
This is a table. Tables should be placed in the main text near to the first time they are cited.
Table 2.
This is a table. Tables should be placed in the main text near to the first time they are cited.
| Irrigation treatment | Fertilization treatment | Crude protein /(g·kg-1) |
Crude fat /(g·kg-1) |
Soluble sugar /(g·kg-1) |
Starch /(g·kg-1) |
Tannin /(g·kg-1) |
|---|---|---|---|---|---|---|
| F1 | W1 | 183.79±2.73d | 8.40±1.14c | 23.52±1.06a | 12.40±0.45a | 20.47±0.73a |
| W2 | 205.47±2.61a | 10.08±1.07bc | 18.69±1.16b | 10.94±0.31b | 16.06±0.93b | |
| W3 | 196.33±2.81b | 16.05±1.48a | 17.40±1.18b | 5.43±0.49d | 15.59±0.96b | |
| W4 | 189.19±2.64c | 11.16±1.19b | 17.57±1.15b | 9.97±0.51c | 13.03±0.74c | |
| F2 | W1 | 222.03±2.95b | 12.48±1.40a | 25.04±1.34a | 8.36±0.32b | 11.73±0.68b |
| W2 | 238.64±2.54a | 13.51±1.21a | 25.54±1.07a | 7.54±0.23c | 10.35±0.82c | |
| W3 | 214.76±3.00c | 12.51±1.37a | 24.19±1.38a | 8.38±0.43b | 14.50±0.68a | |
| W4 | 193.02±2.86d | 9.40±1.11b | 17.26±1.06b | 13.29±0.28a | 15.04±0.67a | |
| F3 | W1 | 214.21±2.78b | 15.15±1.22ab | 14.47±1.21d | 8.68±0.31b | 15.86±0.55a |
| W2 | 219.44±2.60b | 16.73±1.28a | 21.43±1.03c | 8.57±0.42b | 16.11±0.72a | |
| W3 | 240.44±3.01a | 14.29±1.22bc | 27.86±1.15a | 11.45±0.21a | 9.35±0.53c | |
| W4 | 241.72±2.85a | 12.02±1.20c | 24.74±1.33b | 11.53±0.50a | 14.51±0.73b | |
| F | W | 57.82** | 13.32** | 12.49** | 40.02** | 23.48** |
| F | 498.74** | 21.50** | 32.30** | 186.52** | 65.57** | |
| W×F | 96.29** | 10.55** | 54.13** | 52.67** | 55.32** |
Note: For the same fertilizer level, different lowercase letters indicate significant differences among irrigation treatments (P < 0.05), while the same letters indicate no significant difference (P > 0.05). *, **, and ns denote significant (P < 0.05), highly significant (P < 0.01), and non-significant differences, respectively. The same conventions apply to the following tables.
Table 3.
Effects of water and fertilizer interaction on yield components, water use efficiency, and partial factor productivity of fertilizer.
Table 3.
Effects of water and fertilizer interaction on yield components, water use efficiency, and partial factor productivity of fertilizer.
| Irrigation treatment | Fertilization treatment | Yield /kg·hm-2 |
Water use efficiency/kg·m-3 | Partial fertilizer productivity | Single fruit weight/g |
|---|---|---|---|---|---|
| F1 | W1 | 2776.23±248.23b | 0.75±0.08b | 3.43±0.31b | 7.94±0.71b |
| W2 | 3163.21±146.06a | 0.89±0.02a | 3.91±0.18a | 10.87±0.19a | |
| W3 | 3205.16±95.34a | 0.89±0.03a | 3.96±0.12a | 10.28±0.26a | |
| W4 | 3223.42±222.94a | 0.88±0.06a | 3.98±0.28a | 10.79±0.9a | |
| F2 | W1 | 3113.77±193.53b | 0.92±0.06a | 2.88±0.18b | 10.32±0.73b |
| W2 | 3801.4±51.56a | 0.86±0.04ab | 3.52±0.05a | 11.73±0.12a | |
| W3 | 3796.44±303.76a | 0.8±0.07b | 3.52±0.28a | 11.56±0.41a | |
| W4 | 3287.71±218.64b | 0.68±0.05c | 3.04±0.2b | 10.91±0.44ab | |
| F3 | W1 | 3012.84±123.16b | 0.82±0.03a | 2.23±0.09b | 10.4±0.41ab |
| W2 | 3708.15±460.05a | 0.74±0.08a | 2.75±0.34a | 11.64±1.38a | |
| W3 | 3325.78±228.47ab | 0.59±0.03b | 2.46±0.17ab | 9.31±0.6b | |
| W4 | 3279.75±151.21ab | 0.53±0.03b | 2.43±0.11ab | 9.64±0.81b | |
| F | W | 11.43** | 13.94** | 11.63** | 11.52** |
| F | 9.70** | 39.88** | 123.19** | 9.79** | |
| W×F | 1.53 | 11.01** | 1.58 | 5.46** |
Table 4.
Construction of the comprehensive growth index (CGI) for walnuts using principal component analysis.
Table 4.
Construction of the comprehensive growth index (CGI) for walnuts using principal component analysis.
| Growth stage | Principal component | Variance | Contribution rate | NSG | FV | SPAD | LAI | |
|---|---|---|---|---|---|---|---|---|
| I | PC1 | 39.51 | 39.51 | 0.82 | 0.14 | 0.93 | 0.17 | |
| PC2 | 26.26 | 65.77 | 0.29 | 0.98 | 0.01 | 0.06 | ||
| PC3 | 25.68 | 91.45 | 0.24 | 0.06 | 0.07 | 0.98 | ||
| II | PC1 | 43.62 | 43.62 | 0.90 | 0.84 | 0.46 | 0.16 | |
| PC2 | 26.91 | 70.52 | 0.08 | 0.27 | 0.25 | 0.97 | ||
| PC3 | 23.81 | 94.33 | 0.30 | 0.33 | 0.85 | 0.18 | ||
| III | PC1 | 33.79 | 33.79 | 0.62 | 0.30 | 0.92 | 0.19 | |
| PC2 | 32.80 | 66.60 | 0.62 | 0.89 | 0.28 | 0.24 | ||
| PC3 | 26.46 | 93.05 | 0.24 | 0.25 | 0.18 | 0.95 | ||
| IV | PC1 | 35.19 | 35.19 | 0.88 | 0.66 | 0.41 | 0.19 | |
| PC2 | 33.11 | 68.30 | 0.39 | 0.61 | 0.88 | 0.16 | ||
| PC3 | 26.78 | 95.08 | 0.21 | 0.25 | 0.17 | 0.97 | ||
| I-CGI | CGI=0.432×SPAD+0.287×FV+0.281×LAI | |||||||
| II-CGI | CGI=0.462×NSG+0.285×LAI+0.252×SPAD | |||||||
| III-CGI | CGI=0.363×SPAD+0.353×FV+0.284×LAI | |||||||
| IV-CGI | CGI=0.370×NSG+0.348×SPAD+0.282×LAI | |||||||
Note: Roman numerals I, II, III, and IV represent the walnut growth stages: flowering and fruit-setting, fruit expansion, shell hardening, and oil conversion stages. NSG: new shoot growth; FV: fruit volume; SPAD: relative chlorophyll content; LAI: leaf area index; CGI: comprehensive growth index. The same conventions apply to the following tables.
Table 5.
Construction of the comprehensive photosynthetic index (CPI) for walnuts using principal component analysis.
Table 5.
Construction of the comprehensive photosynthetic index (CPI) for walnuts using principal component analysis.
| Growth stage | Principal component | Variance | Contribution rate | Pn | Tr | Gs | Ci |
| I | PC1 | 70.46 | 70.46 | 0.98 | 0.94 | 0.97 | 0.24 |
| PC2 | 28.60 | 99.07 | 0.17 | 0.34 | 0.23 | 0.97 | |
| II | PC1 | 57.35 | 57.35 | 0.95 | 0.81 | 0.84 | 0.21 |
| PC2 | 31.39 | 88.74 | 0.11 | 0.22 | 0.49 | 0.98 | |
| III | PC1 | 62.93 | 62.93 | 0.96 | 0.85 | 0.87 | 0.34 |
| PC2 | 35.29 | 98.22 | 0.25 | 0.51 | 0.45 | 0.94 | |
| IV | PC1 | 65.30 | 65.30 | 0.97 | 0.88 | 0.90 | 0.28 |
| PC2 | 32.12 | 97.42 | 0.16 | 0.43 | 0.40 | 0.96 | |
| I-CPI | CPI=0.711×Pn+0.289×Ci | ||||||
| II-CPI | CPI=0.646×Pn+0.354×Ci | ||||||
| III-CPI | CPI=0.641×Pn+0.359×Ci | ||||||
| IV-CPI | CPI=0.670×Pn+0.330×Ci | ||||||
Note: Pn: net photosynthetic rate; Tr: transpiration rate; Ci: intercellular CO2 concentration; Gs: stomatal conductance; CPI: comprehensive photosynthesis index.
Table 6.
Weights of indicators in the comprehensive evaluation system during walnut growth period.
| Consistency test parameter |
Local weights |
Subjective weight |
Objective weight |
Combination weight |
|
|---|---|---|---|---|---|
| A | CR=0.034<0.1 | 0.075 | 0.075 | — | — |
| 0.108 | 0.108 | ||||
| 0.193 | 0.193 | ||||
| 0.352 | 0.352 | ||||
| 0.211 | 0.211 | ||||
| 0.061 | 0.061 | ||||
| B1 | CR=0.051<0.1 | 0.159 | 0.012 | 0.052 | 0.016 |
| 0.589 | 0.044 | 0.046 | 0.045 | ||
| 0.252 | 0.019 | 0.048 | 0.022 | ||
| B2 | CR=0.012<0.1 | 0.229 | 0.025 | 0.049 | 0.027 |
| 0.137 | 0.015 | 0.038 | 0.017 | ||
| 0.556 | 0.060 | 0.040 | 0.058 | ||
| 0.079 | 0.009 | 0.038 | 0.011 | ||
| B3 | CR=0.017<0.1 | 0.219 | 0.042 | 0.069 | 0.045 |
| 0.109 | 0.021 | 0.063 | 0.025 | ||
| 0.190 | 0.037 | 0.078 | 0.041 | ||
| 0.190 | 0.037 | 0.059 | 0.039 | ||
| 0.291 | 0.056 | 0.047 | 0.055 | ||
| B4 | CR=0.000<0.1 | 0.667 | 0.235 | 0.045 | 0.215 |
| 0.333 | 0.117 | 0.051 | 0.111 | ||
| B5 | CR=0.000<0.1 | 0.667 | 0.140 | 0.094 | 0.136 |
| 0.333 | 0.070 | 0.098 | 0.073 | ||
| B6 | CR=0.000<0.1 | 1.000 | 0.061 | 0.088 | 0.064 |
Table 7.
Comprehensive growth evaluation of walnut based on TOPSIS and TOPSIS-GRA.
| Treatment | TOPSIS | TOPSIS-GRA | ||
|---|---|---|---|---|
| Score | Rank | Score | Rank | |
| W1F3 | 0.369 | 10 | 0.069 | 11 |
| W2F3 | 0.493 | 7 | 0.086 | 5 |
| W3F3 | 0.471 | 8 | 0.085 | 7 |
| W4F3 | 0.354 | 11 | 0.073 | 10 |
| W1F2 | 0.526 | 5 | 0.085 | 8 |
| W2F2 | 0.679 | 1 | 0.104 | 1 |
| W3F2 | 0.596 | 3 | 0.095 | 3 |
| W4F2 | 0.403 | 9 | 0.074 | 9 |
| W1F1 | 0.301 | 12 | 0.059 | 12 |
| W2F1 | 0.516 | 6 | 0.085 | 6 |
| W3F1 | 0.605 | 2 | 0.096 | 2 |
| W4F1 | 0.565 | 4 | 0.089 | 4 |
Disclaimer/Publisher’s Note: The statements, opinions and data contained in all publications are solely those of the individual author(s) and contributor(s) and not of MDPI and/or the editor(s). MDPI and/or the editor(s) disclaim responsibility for any injury to people or property resulting from any ideas, methods, instructions or products referred to in the content. |
© 2025 by the authors. Licensee MDPI, Basel, Switzerland. This article is an open access article distributed under the terms and conditions of the Creative Commons Attribution (CC BY) license (http://creativecommons.org/licenses/by/4.0/).
Copyright: This open access article is published under a Creative Commons CC BY 4.0 license, which permit the free download, distribution, and reuse, provided that the author and preprint are cited in any reuse.


