Submitted:
11 September 2025
Posted:
13 September 2025
You are already at the latest version
Abstract
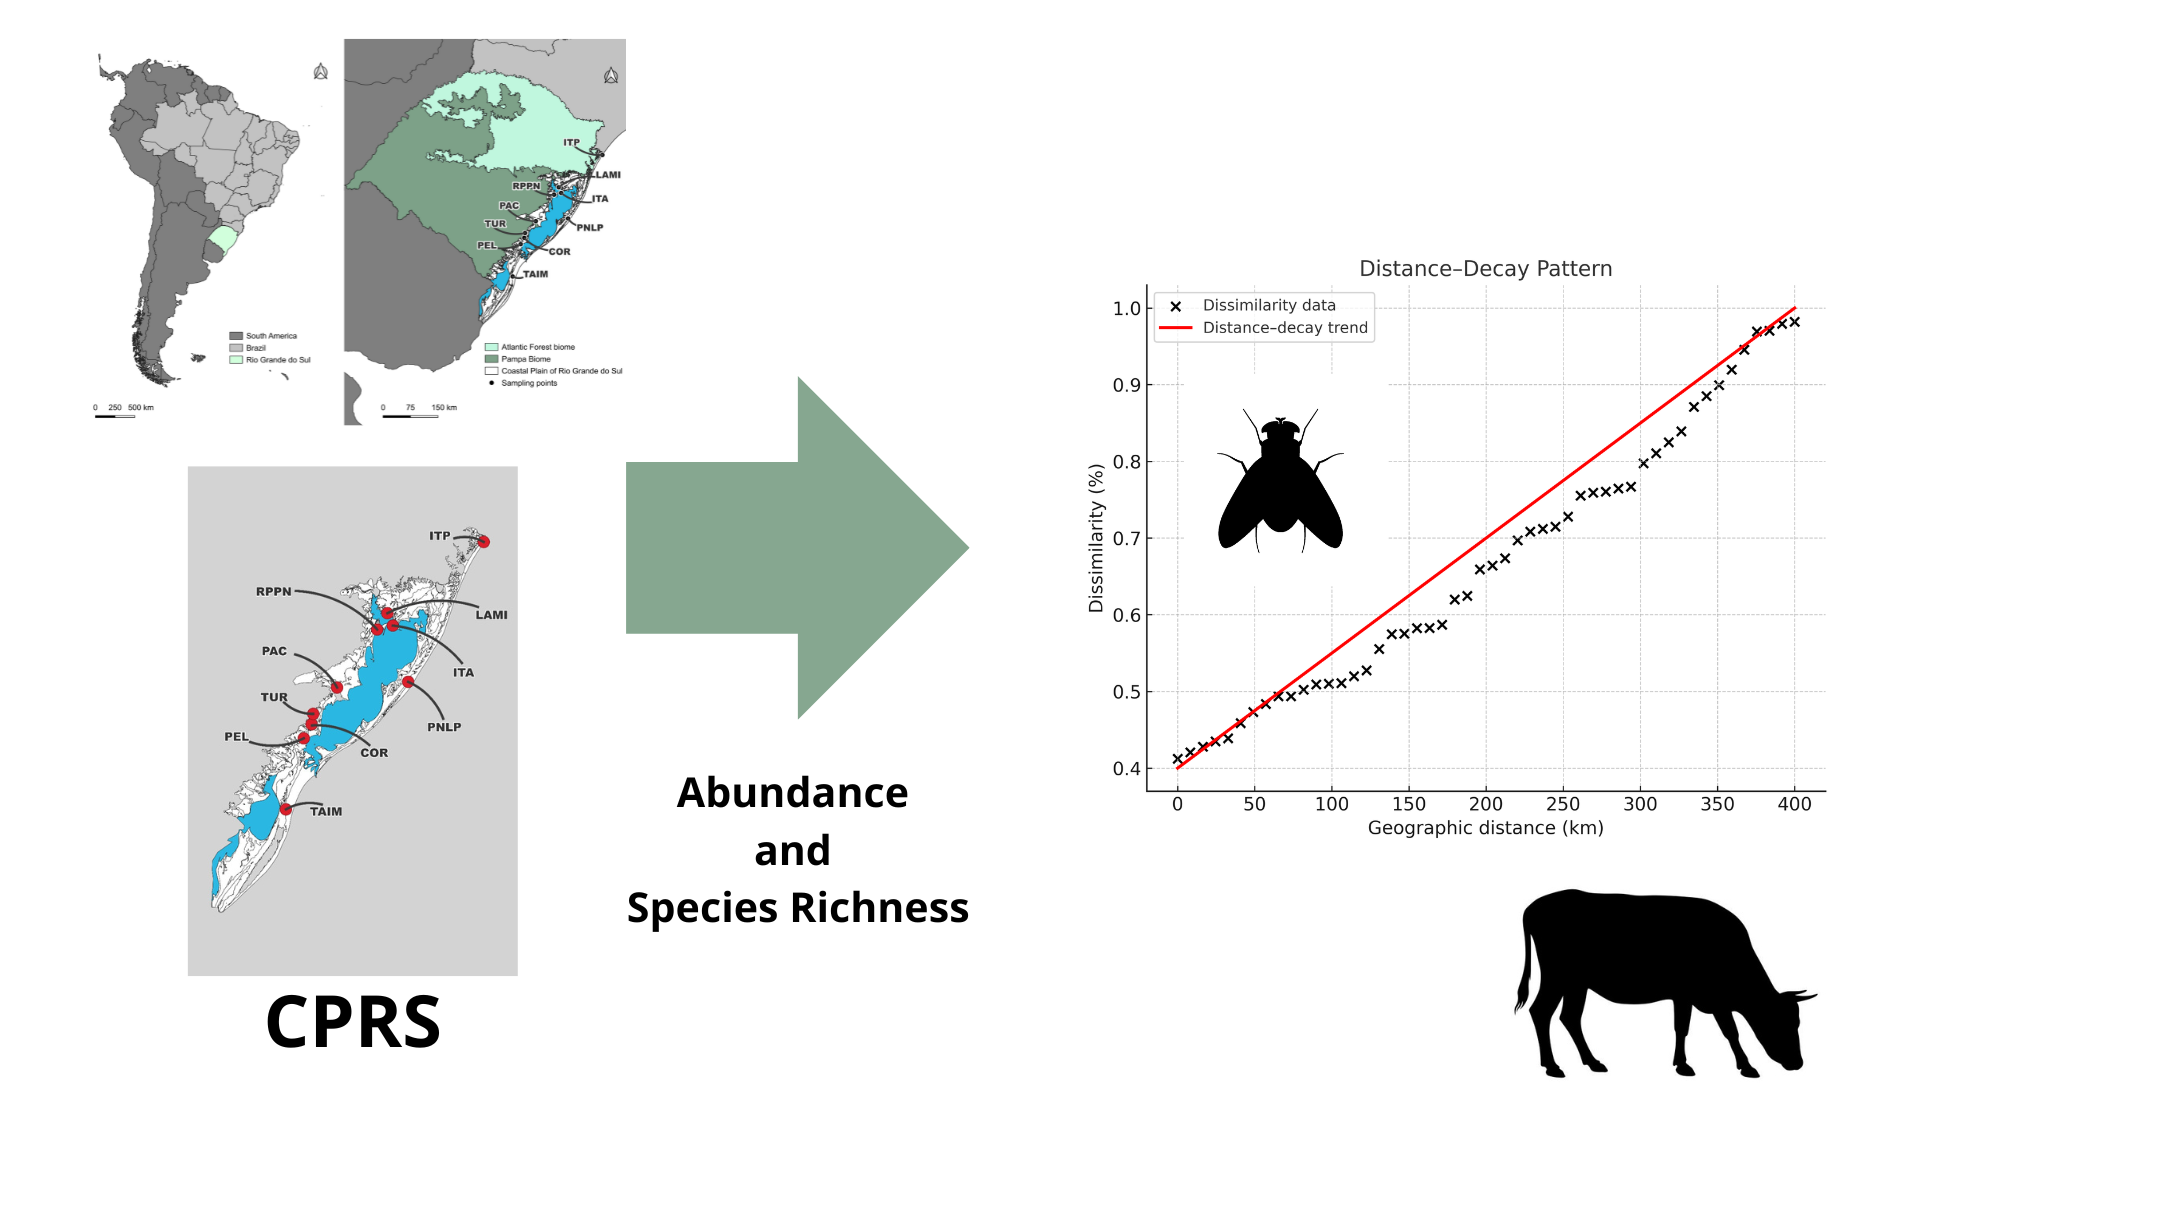
Horse flies (Tabanidae) negatively affect livestock by reducing productivity, compro-mising animal welfare, and serving as mechanical vectors of pathogens. However, the spatial processes shaping their community organization in southern Brazil’s Coastal Plain of Rio Grande do Sul (CPRS) remain poorly understood. To address this, we con-ducted standardized Malaise-trap surveys and combined them with historical–contemporary comparisons to examine distance–decay patterns in community compo-sition. We evaluated both abundance-based (Bray–Curtis) and presence–absence (Jac-card) dissimilarities using candidate models. Across sites, Tabanus triangulum emerged as the dominant species. Dissimilarity in community structure increased monotonically with geographic distance, with no evidence of abrupt thresholds. The square-root model provided the best fit for abundance-based data, whereas a linear model best described presence–absence patterns, reflecting dispersal limitation and environmental filtering across a heterogeneous coastal landscape. Sites within riparian forests and conservation units displayed higher diversity, emphasizing the ecological role of protected habitats and the importance of maintaining connected corridors. Collectively, these findings establish a process-based framework for surveillance and landscape management strategies to mitigate vector, host contact. Future directions include integrating remote sensing and host distribution, applying predictive valida-tion across temporal scales.
Keywords:
Tabanidae
; distance–decay
; Bray–Curtis
; Jaccard
; community turnover
; riparian corridors
; habitat fragmentation
; vector ecology
; conservation planning
1. Introduction
Tabanidae (Diptera) is a large cosmopolitan family of species whose females are hematophagous. Bites are painful, disturbing animals while grazing resulting in significant productivity losses. In many areas, Tabanidae also play a major role in the transmission of pathogens. These flies have been associated with the spread of equine and bovine trypanosomiasis, anaplasmosis, babesiosis, and equine infectious anemia [1,2,3,4,5,6]. Tabanidae is a highly diverse family, comprising 177 genera and 4,667 species worldwide [7]. In the Neotropical region, 71 genera and 1,205 species have been recorded [8,9]. In Brazil, the diversity of Tabanidae varies substantially across biomes, with the highest richness observed in the Amazon rainforest and a progressive decline toward the Pampa biome [10,11,12]. In the Pampa, 46 species have been recorded [8,11,12,13,14], whereas in the state of Rio Grande do Sul, this number is 56 species [12].
The Coastal Plain of Rio Grande do Sul (CPRS), its origin and evolution are linked to sea level fluctuations, led to the development of different coastal depositional environments, mainly large lagoonal and lacustrine bodies and extensive sand barriers [15]. Over the past century, it has been an ecologically important region severely impacted by human activities, including rice cultivation and urban development [16,17]. These anthropogenic pressures have fragmented natural habitats, with preserved areas restricted primarily to riparian forests and scattered conservation units [18,19,20]. These characteristics make the region particularly useful for analyzing how geographic distance and habitat fragmentation influence the similarity and diversity of horse fly communities.
Previous studies on Tabanidae in South America have typically focused on abiotic factors such as temperature and rainfall [11,21,22,23], but have rarely explored the role of spatial factors, such as the distance between habitats [24,25]. Moreover, few investigations have applied detailed statistical models to examine dissimilarity patterns [26], which can reveal saturation levels over longer distances, an important aspect for understanding geographic constraints on communities [27]. Bridging these gaps is essential for developing more effective and integrated conservation strategies.
In the context of vector ecology, analyzing such spatial patterns is crucial for understanding the dynamics of species of veterinary importance [28]. At the landscape scale, structure and connectivity influence the movement of organisms and cross-habitat interactions [29]. For example, in communities with low species richness and strong dominance by a single, highly aggressive tabanid, this species may expand its ecological range, exploiting multiple habitats and host types. Such behavior can disproportionately drive movements across habitat patches, increasing contacts between wildlife and livestock and facilitating the circulation of pathogens across ecological boundaries. Consequently, landscape configuration, particularly patch size and connectivity [29], can modulate vector–host encounter rates, with direct implications for the epidemiology of diseases affecting animal health and livestock productivity. These insights can inform targeted surveillance and environmental management strategies, such as designing ecological corridors to enhance habitat connectivity and mitigate fragmentation effects on vector communities.
This study aims to investigate how geographic distance influences the similarity and diversity of Tabanidae communities in the Coastal Plain of Rio Grande do Sul. It also assesses how habitat fragmentation contributes to the structuring of these communities.
2. Materials and Methods
The Sampling. Between October 2011 and February 2012, samples were collected from various localities within five regions of the Coastal Plain of Rio Grande do Sul (CPRS) (Supplementary Table S1, Supplementary Figure S1, Figure 1) using a Malaise trap [30] (see Supplementary Figures S2–S6 of each region). The environmental characteristics of each sampling area and region are described in the supplementary material (Supplementary Table S2) and in Zafalon-Silva et al. [31]. The Malaise trap was deployed in each locality for eight consecutive days (Supplementary Table S1).
Specimens of Tabanidae were identified based on the following taxonomic references: Lutz [32]; Kröber [33,34]; Coscarón & Philip [35]; Coscarón [36,37,38,39]; Coscarón & Fairchild [40]; Fairchild [41,42,43]; Henriques & Rafael [44]; Henriques & Krolow [45]; Krolow & Henriques [46]; Wilkerson & Fairchild [47]. The material is deposited at the Coleção de Entomologia da Universidade Federal do Tocantins (CEUFT), Porto Nacional, Tocantins, and in the Collection of the Laboratory of Ecology of Parasites and Vectors (CoLEPAV) at the Federal University of Pelotas, Rio Grande do Sul.
Data Analysis
Ecological indices (Shannon and Simpson) were calculated using the vegan package [48]. The diversity() function was used to measure species richness and evenness across different communities. To assess community similarity, the vegdist () function was used to compute Jaccard and Sørensen indexes. These indexes provided quantitative measures of similarity between sites, based on species presence and absence.
To evaluate the temporal stability of community composition and to control for seasonal variation, we compared our data with data obtained by Krüger & Krolow [11], derived from standardized collections conducted between 2002 and 2004 in the municipalities of Pelotas and Capão do Leão, within the CPRS (see the dataset D1 in the supplementary material). Subsets of the current data were selected to match equivalent periods and localities based on the sampling periods (Supplementary Table S1), allowing for a direct comparison of taxonomic composition and abundance structure. Analyses were based on Bray-Curtis (abundance) and Jaccard (presence/absence) dissimilarity indices, calculated from standardized and transposed species matrices. This approach allowed for the estimation of compositional changes and the evaluation of temporal community persistence in response to environmental and anthropogenic variation.
For each region, we selected historical samples from the database that corresponded to the same time of year as the current collections, based on the sampling periods described by Zafalon-Silva et al. [31] (Supplementary Table S1). This temporal equivalence allowed us to isolate the spatial component in the analysis of community dissimilarity, minimizing the influence of seasonal microclimatic variation.
The distm() function from the geosphere package [49] was used to compute a distance matrix between localities, based on geographic coordinates (in kilometers). This matrix quantified the distance between each pair of sites, which was essential for correlating biological dissimilarity with spatial separation.
We first assessed the correlation between community dissimilarity and geographic distance using Mantel tests implemented in the vegan package (function "mantel"). Dissimilarity among sites was computed from two matrices: Bray–Curtis for abundance data and Jaccard for presence/absence data. Using rank-based Mantel statistics with permutation testing, we evaluated whether biological similarity declines with increasing geographic distance. When appropriate, we also examined the partial association between dissimilarity and distance while conditioning on broad geographic regions using partial Mantel tests (mantel.partial).
To describe the distance–decay relationship explicitly, we fitted seven regression models to the pairwise data, analyzing abundance (Bray–Curtis) and presence/absence (Jaccard) separately. The candidate set comprised a linear model, a log–linear model using log(1 + distance) to retain pairs at zero distance, a square–root model using , a quadratic polynomial in distance, a saturating negative exponential model, an asymptotic Michaelis–Menten model, and a segmented (“hockey-stick”) piecewise linear model with an unknown breakpoint. The exact functional forms, notation, and parameter interpretations for all seven models are provided in Supplementary Table S3. In brief, D denotes predicted dissimilarity on the 0–1 scale and d denotes geographic distance in kilometers.
Linear, log–linear, square–root, and quadratic models were estimated by ordinary least squares; the negative exponential and Michaelis–Menten models were fitted by nonlinear least squares; and the segmented model was fitted with the segmented algorithm, with the presence of a breakpoint evaluated by Davies’ test. Model fit and parsimony were compared using Akaike’s Information Criterion (AIC) and ΔAIC. For the best-supported model we also derived characteristic distance scales, D50, D75, and D90, the distances at which the fitted curve reaches 0.50, 0.75, and 0.90 dissimilarity, together with 95% confidence intervals obtained by parametric simulation from the estimated parameter covariance.
All analyses were performed in R [50].
3. Results
This A total of 3,682 individuals, representing 25 species and 12 genera, was collected. Tabanus triangulum Wiedemann, 1828 was the dominant species, accounting for 62.7% of all specimens. Species with intermediate levels of abundance included Tabanus claripennis (Bigot, 1892), Tabanus occidentalis Linnaeus, 1758, Lepiselaga albitarsis Macquart, 1850, Chrysops varians Wiedemann, 1828, Dichelacera alcicornis (Wiedemann, 1828), Diachlorus bivittatus (Wiedemann, 1828), and Tabanus fuscofasciatus Macquart, 1838 (Table 1).
Horse fly diversity varied considerably among the sampled sites. Higher Shannon diversity indices were recorded at RPPN Barba Negra and Lami (1.77 and 1.71, respectively), indicating greater species richness and a more even distribution. In contrast, Itapeva State Park and the riparian forest of Pelotas stream exhibited the lowest Shannon values (0.18 and 0.23) and low Simpson indices (0.07 and 0.08), reflecting strong dominance by a few species (Table 1).
Similarity analyses based on species presence/absence and relative abundance revealed distinct local groupings with shared community structures (Supplementary Table S4; Supplementary Figure S7). In terms of composition, the riparian forests of the Corrientes, Turuçu, and Lami streams formed a high-similarity subgroup (dissimilarity < 50%), and Vila Pacheca (near the Camaquã River) grouped with RPPN Barba Negra in relative abundance, reinforcing ecological connectivity. Using temporally matched datasets to compare five CPRS regions with historical records from Pelotas and Capão do Leão (2002–2004), Bray–Curtis (abundance) and Jaccard (presence/absence) indices indicated pronounced spatial structuring, with a systematic increase in dissimilarity between current sites and historical localities; several comparisons showed high Bray–Curtis values (> 0.80), signaling strong shifts in relative abundances, whereas elevated Jaccard values (> 0.65) pointed to substantial taxonomic turnover (Table S5). Region 1 (south of Patos Lagoon, near the estuary) exhibited the lowest dissimilarities relative to historical sites (Bray–Curtis: 0.13–0.36; Jaccard: 0.28–0.62), Region 3 (farther south, near Mirim Lagoon) showed intermediate values (Bray–Curtis: 0.54–0.89; Jaccard: 0.50–0.60), and Regions 2, 4, and 5 displayed the highest dissimilarities, Region 2 (including Camaquã River and areas around the Guaíba River) with Bray–Curtis 0.42–0.88 and Jaccard 0.63–0.80, and Regions 4 (northern Patos Lagoon to Atlantic Forest-influenced coast) and 5 (mid-littoral between lagoon and ocean) with Bray–Curtis > 0.88 and Jaccard > 0.72, indicating structurally distinct communities (Supplementary Table S5).
Mantel tests based on Spearman rank correlation showed positive associations between pairwise geographic distance and community dissimilarity. For Bray–Curtis, r = 0.573 with P = 0.002 (999 permutations; upper null quantiles: 90% = 0.255, 95% = 0.337, 97.5% = 0.434, 99% = 0.507). For Jaccard, r = 0.509 with P = 0.010 (999 permutations; upper null quantiles: 90% = 0.321, 95% = 0.398, 97.5% = 0.447, 99% = 0.504). Partial Mantel tests controlling for broad regions yielded r = 0.556 with P = 0.002 for Bray–Curtis (upper null quantiles: 0.272, 0.358, 0.406, 0.474) and r = 0.499 with P = 0.017 for Jaccard (upper null quantiles: 0.293, 0.406, 0.451, 0.533; 999 permutations in both cases).
Among seven candidate distance–decay models (linear, log-linear, square-root, quadratic, exponential–saturating, Michaelis–Menten, and segmented), the best-supported model by AIC differed between dissimilarity metrics (see Supplementary Table S6 for the complete AIC and P-values). For Bray–Curtis, the square-root model had the lowest AIC (−24.5), followed by the log-linear model (−23.7; ΔAIC = 0.77) and the quadratic model (−22.7; ΔAIC = 1.78) (Figure 2). For Jaccard, the linear model ranked first (AIC = −42.6), followed by square-root (−41.1; ΔAIC = 1.54) and quadratic (−41.0; ΔAIC = 1.65); segmented (−39.8), log-linear (−38.2), Michaelis–Menten (−33.8), and exponential–saturating (−31.0) ranked lower (Figure 2). For the segmented fits, Davies’ tests returned P = 0.224 for Bray–Curtis and P = 0.790 for Jaccard (see Supplementary Table S6).
Characteristic distance scales derived for the top-ranked model of each metric are as follows (point estimate; 95% CI). For Bray–Curtis (square-root model): D50 = 2.57 km [0.013–43.1], D75 = 108 km [61.4–151], and D90 = 247 km [185–379]. For Jaccard (linear model): D50 = −65.9 km [0.44–36.5], D75 = 188 km [146–244], and D90 = 340 km [274–469]. An estimated breakpoint for the segmented formulation was 146 km for both metrics; confidence intervals from the model summaries are reported in Supplementary Table S7. Under the linear specification, predicted dissimilarity at zero geographic distance was D(0)=0.565 (95% CI 0.484–0.646) for Jaccard.
4. Discussion
4.1. Spatial Gradients and Dissimilarity Models
The main result of this study is the detection of a spatial gradient in Tabanidae community composition along the Coastal Plain of Rio Grande do Sul (CPRS). Significant Mantel correlations for both abundance (Bray–Curtis) and presence–absence (Jaccard) data indicate that biological dissimilarity increases with geographic distance. This pattern remains even after controlling for broad regional groupings, suggesting that it reflects species turnover rather than spatial clustering. Both indices support the conclusion that dispersal limitation and environmental filtering are central processes in community assembly. The use of standardized sampling over two years [11] minimizes temporal confounding and reinforces the inference that geographic and environmental gradientes, not seasonal variation, organize community structure. As land use intensifies across the CPRS, spatial turnover may increase, amplifying differentiation across sites. Comparable patterns have been documented for tsetse in East Africa, using random-forest models that couple trap data with satellite predictors. Relative densities increased with tree cover and decreased with precipitation and soil moisture, emphasizing the role of riparian/wooded corridors in sustaining biting-fly populations [51].
Model comparisons indicate that low-curvature forms best describe the distance–dissimilarity relationship in Tabanidae communities across the CPRS. For Bray–Curtis, the square-root model received the strongest support, followed by log-linear and quadratic forms. For Jaccard, the linear model ranked highest, with square-root and quadratic models also performing well. In contrast, saturating models showed lower support under AIC, and segmented models failed to detect slope changes, as confirmed by non-significant Davies tests. These results indicate a gradual, monotonic increase in dissimilarity with distance, without abrupt transitions or ecological thresholds.
Quantitatively, the square-root model for Bray–Curtis suggests that 50% dissimilarity is reached at approximately 2.6 km, and 75% at 108 km. For Jaccard, the linear model projects approximately 56.5% dissimilarity even at near-zero distance, reaching 75% at a distance of 188 km. These patterns reflect high local heterogeneity and support continuous spatial turnover, with no evidence of saturation. The lack of support for segmented or threshold models favors an interpretation of cumulative differentiation driven by dispersal limitation and environmental gradients. In practical terms, the square-root model offers an effective fit for abundance-based dissimilarity, capturing gradual changes without requiring complex curvature. For presence–absence data, the linear model reflects steady taxonomic turnover in a connected and environmentally heterogeneous landscape. These results align with the general theory of distance-decay [52], which emphasizes that most ecological communities exhibit continuous species replacement over space, rather than abrupt shifts.
Together, the consistent Mantel correlations, the strong performance of simple models, and the absence of spatial breakpoints support a model of progressive community differentiation, especially in terms of abundance structure. This pattern reinforces the role of continuous species turnover shaped by dispersal limitation and environmental gradients. The spatially structured nature of tabanid communities observed here provides a basis for targeted surveillance and vector control strategies in the CPRS. For example, place regional sentinel stations ~75–100 km apart along the coast–lagoon corridor to detect turnover, and cluster 3–5 traps within 2–5 km around high-risk ranches in the Pelotas–Turuçu–Taim wetlands.
Although the analytical framework differs, this approach aligns with the spatial principles advocated by Kitron [28], who emphasized the importance of identifying geographic heterogeneity in vector distribution to optimize surveillance and allocate control efforts more effectively. As proposed, understanding fine-scale spatial variation can improve the early detection of risk zones and enhance the precision of interventions. Methodologically, recent work upscaled vector relative abundance by integrating in-situ catches with satellite covariates via random forests, explaining ~41% of spatial variability and yielding national-scale maps; however, predictive reliability declined when extrapolating beyond the environmental envelope of the training data, with VSURF-based variable selection improving geographic realism [51]. Incorporating environmental covariates and implementing predictive validation in future studies will help refine inference and strengthen the integration of ecological data into epidemiological forecasting and spatial planning in veterinary entomology. Recent advances in metagenomic approaches have also demonstrated that high-resolution analysis of individual vectors can reveal substantial spatial heterogeneity in microbiota composition and pathogen presence, reinforcing the need for surveillance systems that are both spatially and biologically fine-scaled [53].
4.2. Ecological Mechanisms Underlying Spatial Dissimilarity
These spatial patterns raise questions about the ecological processes that underlie community dissimilarity. In particular, exploring which species dominate across space, and why, offers insights into the mechanisms driving distance decay.
Local variation in species abundance, rather than presence or absence alone, appears central to the spatial organization of Tabanidae communities across the CPRS. Tabanus triangulum accounted for more than 60% of all individuals, and between-site differences in relative abundance contributed strongly to overall community dissimilarity. Bray–Curtis values consistently exceeded those from Jaccard, highlighting the role of dominance patterns and abundance shifts beyond taxonomic turnover. These indices provide complementary perspectives: Jaccard captures species replacement and the influence of rare taxa, whereas Bray–Curtis emphasizes changes in relative abundance with direct ecological and epidemiological relevance [54,55].
Dominance-driven restructuring was evident even across short distances and in sites with similar species pools, suggesting ecological homogenization without full compositional replacement. This finding is consistent with observations from urban mosquito communities, where generalist species exhibit reduced differentiation across space [56], as well as comparisons between forested and open areas with or without horses in the Amazon forest [23,57]. In the CPRS, T. claripennis was present at all sites, supporting its generalist status [58,59], whereas Lepiselaga albitarsis was restricted to humid, forested environments, indicating environmental sensitivity. Caution may hower be warranted when extrapolating from trap data to epidemiological relevance. Capture rates do not correspond to host contact or feeding efficiency, as demonstrated by Muzari et al. [60] in Australia, where species that were abundant in traps showed low feeding success, and vice-versa. However, in the CPRS, the dominance of T. triangulum is likely ecologically and epidemiologically meaningful. Approximately one-third of the specimens collected in region 1 tested positive for Trypanosoma kaiowa DNA [61], indicating potential involvement in mechanical transmission under simpler ecological conditions.
Historical data from Pelotas and Capão do Leão [11] point to increasing spatial differentiation over time, likely driven by habitat alteration. Protected areas, such as the Barba Negra and Lami reserves, exhibited higher diversity and lower dominance, illustrating how landscape integrity contributes to more balanced assemblages. Regional contrasts further support this interpretation: in Santa Catarina, Dichelacera alcicornis dominates [62]; in Uruguay, Poeciloderas lindneri is more frequent [21]; and in protected areas of Paraná, assemblages are more evenly structured [63]. Although the sampling methods varied, the discussion here focuses on dominance patterns rather than absolute abundance or trap efficiency. While differences in bait type, fabric color, and trap configuration can influence capture rates for certain species {e.g., Hybomitra epistates (Osten Sacken, 1878)} [64], the patterns of species dominance cited in these studies are consistent within each respective region. Therefore, despite methodological variation, the observed contrasts reinforce the influence of environmental filtering in shaping tabanid assemblages across landscapes with differing levels of disturbance and protection.
4.3. Implications for Disease Transmission and Vector Surveillance
The observed dominance patterns are not only ecologically significant but also carry important implications for veterinary epidemiology. Changes in species composition and abundance can influence vectorial capacity and contact rates with hosts, especially in altered landscapes.
Two non-exclusive mechanisms may link the spatial restructuring of Tabanidae communities to increased pathogen transmission risk. First, the dominance of one or a few horsefly species with effective transmission capacity can elevate contact rates with livestock [65]. Second, land-use change may shift ecological niches and alter which species dominate locally [66]. These hypotheses are testable by comparing encounter rates in landscapes converted from forested wildlife habitats to cattle-dominated systems, while controlling for host density and season.
Within the CPRS, the predominance of T. triangulum represents a potential entomological risk. Although its vector competence is considered limited, its numerical dominance, particularly in fragmented landscapes with reduced biodiversity, may increase mechanical transmission. This pattern aligns with the dilution-effect hypothesis, which posits that higher species richness can disrupt pathogen transmission by reducing effective vector–host encounters [67]. Analogous mechanisms have been demonstrated in other systems, such as Culex pipiens Linnaeus, 1758 and West Nile virus [68,69,70]. Land-use changes in the CPRS, notably the conversion of riparian forests into pasture, have likely contributed to the local dominance of a few vector species, reducing taxonomic and functional diversity. Several Tabanidae species with mechanical transmission potential were recorded, reinforcing the epidemiological relevance of this shift [2].
The quantified distance decay patterns based on Bray–Curtis dissimilarity enhance the predictive capacity of vector surveillance by revealing how community composition changes gradually across space in terms of species abundance. Even short-range ecological differences can result in substantial variation in vector dominance, which holds direct implications for mechanical transmission potential in livestock systems. These findings support the design of intra- and inter-property sampling grids that reflect microhabitat heterogeneity, especially near ecotones such as water margins, riparian zones, and forest edges. At broader spatial scales, the absence of abrupt dissimilarity thresholds reinforces the effectiveness of gradual surveillance strategies rather than rigid geographic zoning. This approach aligns with insights that advocate fine-scale sampling to detect local hotspots of vector activity while maintaining broader-scale continuity in monitoring efforts [71]. As land-use change continues to reshape vector habitats, transitional zones become especially important for early detection of epidemiological risk [66]. Shifts in vector community structure, particularly those involving dominance by a few species, can alter disease dynamics through increased host–vector contact rates and reduced ecological buffering [65]. In this context, abundance-based decay models provide a practical framework for anticipating spatial variation in entomological risk. Their integration into surveillance planning improves the ability to locate emergent hotspots, allocate resources more efficiently, and inform vector control strategies under changing environmental conditions.
4.4. Analytical Limitations and Future Research Directions
While these findings support practical applications for surveillance and control, they must be interpreted in light of certain analytical constraints and sampling limitations.
Some limitations contextualize the interpretation of the distance decay patterns observed in Tabanidae communities across the CPRS. The sampling design, involving 10 sites and generating 45 non-independent pairs, reduces the effective number of unique comparisons and can bias model selection toward simpler structures under AIC-based criteria [72]. The distribution of distances was skewed toward medium and long spatial separations, with relatively few short-distance comparisons. This is precisely the range where stronger initial curvature in dissimilarity patterns might be expected due to dispersal limitation or fine-scale environmental heterogeneity. This imbalance in pairwise distances can impair the detection of nonlinearities in spatial turnover, such as those described in community ecology literature [73]. Furthermore, the absence of high-resolution environmental covariates and fine-scale temporal matching across sites may contribute to unexplained variation in abundance-based dissimilarity, limiting ecological inference from the observed patterns. Pseudoreplication, due to repeated site pairings, reduces effective degrees of freedom, potentially inflating support for parsimonious models.
To refine inference, future studies should incorporate leave-one-site-out validation to reduce pairwise dependence and explore fits restricted to distances below 200 km to detect short-range curvature better. Additionally, approaches such as multiple regression on distance matrices (MRM) or generalized dissimilarity modeling may account for unmeasured environmental gradients and improve explanatory capacity. Including structured land-use histories could enhance model sensitivity to anthropogenic pressures.
Similar patterns of community shifts following land-use change have been reported in other biomes. For instance, in boreal forests of northwestern Ontario, Buckley et al. [74] observed that recently logged stands supported higher abundances of anautogenous tabanids, species more persistent in host seeking, while older stands maintained higher richness but lower abundance. These findings support the idea that disturbance increases vector pressure while reducing overall diversity. Observations from peri-urban and forested habitats in eastern Canada (Steve A. Marshall, pers. comm. with S. Mihok) indicate that community similarity can remain high across ~50 km in homogeneous environments but diverges in contrasting habitats such as bogs or boreal forests. Although sampling protocols vary, these insights underscore the value of incorporating habitat type and management history into future Tabanidae studies.
Despite current methodological constraints, the observed patterns in the CPRS align with findings from other systems where habitat simplification favors generalist vectors [23,57,75,76,77] and increases transmission risk [78]. In the CPRS, higher diversity and lower dominance in protected areas such as Barba Negra and Lami illustrate the ecological benefits of conservation. Analogous processes occur in South American livestock systems with Rhipicephalus (Boophilus) microplus (Canestrini, 1887) (Acari: Ixodidae). Landscape simplification through the replacement of native vegetation with exotic pastures has promoted the expansion and dominance of this tick [79]. Regional warming can intensify these dynamics by expanding thermal suitability, as suggested by the southward extension of R. microplus in southern Brazil [80], reinforcing the importance of integrated One Health approaches.
5. Conclusions
Despite methodological constraints, the results provide strong support for the ecological interpretation of distance-decay in Tabanidae communities and offer a valuable framework for applied surveillance and disease prevention.
The results demonstrate that Tabanidae community composition across the CPRS exhibits continuous spatial differentiation, primarily driven by species abundance patterns and gradual turnover, with no evidence of clear ecological thresholds. This spatial structure, shaped by dispersal limitation and environmental filtering, has direct implications for disease ecology and vector management.
The numerical dominance of T. triangulum in degraded areas, coupled with high local dissimilarity, indicates elevated risk of mechanical transmission under conditions of biodiversity loss. These findings highlight the importance of conserving structurally complex habitats to preserve ecological buffers against disease spread.
From a practical standpoint, we would revise the original survey to better resolve short-range turnover. Specifically, we would add 3–5 co-located traps per ranch along forest–pasture, wet margin transects (0, 250, and 500 m from water or marsh) to increase the number of <10–20 km pairs; enforce identical trap types and synchronized 48-h deployment windows; and record microclimate, livestock density, and pasture type at each site. These changes target the portion of the curve where distance–decay is steepest and reduce unexplained variance in abundance-based dissimilarity.
Going forward, we will adopt an operational design that links analysis to action. Within high-risk ranches, we will deploy short-range trap clusters (2–5 km radius) across ecotones and conduct repeat sampling after significant rainfall events. Across the CPRS, we will track temporal changes by comparing each round to its immediate predecessor at the same sites. Two simple triggers will guide intensified control: (i) relative abundance of T. triangulum >60% of catches, or (ii) a ≥0.20 increase in Bray–Curtis dissimilarity to the nearest neighbor within ≤10 km. When either threshold is met, we will add weekly trapping for four weeks and apply targeted measures (e.g., treated screens at watering points, relocating cattle away from riparian edges at peak biting times). This workflow converts the observed spatial structure into concrete surveillance and response steps for livestock systems in the CPRS.
Beyond operational implications, the study supports the integration of ecological metrics into veterinary public health policies and rural land-use planning, especially under a One Health framework. Incorporating spatially explicit surveillance models into policy can enhance the allocation of control resources, guide habitat restoration priorities, and inform zoning decisions in agricultural landscapes.
Supplementary Materials
The following supporting information can be downloaded at the website of this paper posted on Preprints.org, Supplementary Table S1. Averages of meteorological variables during the exposure periods of Malaise traps in the five sampled regions of the Coastal Plain of Rio Grande do Sul. Tmax: average maximum temperature; Tmin: average minimum temperature; RH%: average relative humidity. Data obtained from INMET. Supplementary Table S2 Description of the 35 points sampled in five regions of the Coastal Plain on Pampa Biome (CPPB). Locality: sampled areas (four Malaise traps per area) inside the regions; UC: law-protected area; coordinates: central coordinate of the sampled area; site description: a general description of the locality, including its phytophysiognomy and geology; climate: average temperature and relative humidity during the sampling period. APL: Pelotas stream; ACS: Corrientes stream; ATU: Turuçu stream; LAMI: Lami Biological Reserve; RCMQ: Camaquã river; RPPN: Private natural heritage reserve Barba Negra farm; TAIM: Taim Ecological Station ITPA: Itapuã State Park; PMTY: Tupancy Natural Municipality Park; PEJL: José Lutzenberger State Park; PEVA: Itapeva State Park; LPXE: Lagoa do Peixe National Park; region 1 (Oct-Nov, 2011); region 2 (Nov, 2011); region 3 (Dec, 2011); region 4 (Jan, 2012); region 5 (Feb. 2012). Supplementary Table S3. Candidate distance–decay models relating pairwise community dissimilarity (D) to geographic distance. For each model the table lists the English name, mathematical formula, model parameters, and a brief biological interpretation of the expected decay pattern; one additional column is intentionally left blank for bibliographic references. Here, D denotes Bray–Curtis or Jaccard dissimilarity (0–1), and Distance is great-circle separation (km). Parameters are interpreted as follows: a (or Vmax) = asymptotic dissimilarity; b (or Km) = characteristic distance at which D reaches half of a (i.e., D50); β₀ = intercept (predicted D at zero distance); β₁, β₂ = slopes/curvature terms; ψ = breakpoint (km) for the segmented model. Models were fitted separately for abundance (Bray–Curtis) and presence/absence (Jaccard) datasets and compared via AIC (see Supplementary Table S6 for rankings and statistics). Supplementary Table S4. Pairwise dissimilarity of Tabanidae communities among localities in the Coastal Plain of Rio Grande do Sul (CPRS). (a) Bray–Curtis dissimilarity based on relative abundance; (b) Jaccard dissimilarity based on presence–absence. Values range from 0 (identical composition) to 1 (no shared composition). Matrices are symmetric; the main diagonal equals 0. Supplementary Table S5. Dissimilarity between Tabanidae communities sampled in five regions of the Coastal Plain of Rio Grande do Sul (CPRS) and historical data from Pelotas and Capão do Leão (Krüger & Krolow, 2015). Bray-Curtis values are based on species abundance, while Jaccard values are based on species presence/absence. Supplementary Table S6. Distance–decay model comparison by dissimilarity metric. Model comparison for Bray–Curtis (abundance) and Jaccard (presence/absence) distance–decay fits. Columns show Akaike’s Information Criterion (AIC) and ΔAIC (difference from the best model per metric). Lower AIC indicates a better fit. The top-ranked model for each metric is shown in bold. Models tested: Linear, Log-linear, Square-root, Quadratic, Exponential–saturating, Michaelis–Menten, and Segmented. Supplementary Table S7. Model coefficients for the top-ranked fitted models used in the study. For each model and predictor term, we report the estimated coefficient (Estimate), uncertainty metrics (e.g., SE/Std. Error), test statistics (e.g., t, z, χ² or F where applicable), and p-values. When available in the source tables, information such as model family/link, AIC/AICc, ΔAICc, model weight, and goodness-of-fit (e.g., R²) are also provided. p-values < 0.001 are displayed as “<0.001”. Supplementary Figure S1. Geographic location of the study area in the Coastal Plain of Rio Grande do Sul (CPRS), southern Brazil. The left panel shows the position of the state of Rio Grande do Sul (highlighted in green) within Brazil and South America. The central panel displays the sampling sites (black dots) distributed along the CPRS (shaded in white), covering a gradient of protected and unprotected environments. The two maps on the right present enlarged views of the northern (top) and southern (bottom) sections of the CPRS, highlighting the sampling points in greater detail. Supplementary Figure S2. A, Malaise trap at one point of the Pelotas Stream; B, Transition area from the field to the riparian forest of the Pelotas Stream; C, Extension of the riparian forest of the Corrientes Stream and the surrounding field area; D, collection point next to the Turuçu Stream; E, Mouth of the Turuçu Stream next to Laguna dos Patos; F, Malaise trap installed in the forest of the Pelotas Stream. Supplementary Figure S3. A, Collection area in the riparian forest of the Camaquã River near Vila Pacheca; B, Malaise traps installed on Morro da Formiga in the Barba Negra Private Natural Reserve; C, The Arroinho collection area in the Barba Negra Private Natural Reserve, next to the dunes; D, Collection area in the riparian forest of the Camaquã River, next to a beef cattle field; E, Collection area in the Lami Biological Reserve; F, Collection area at the top of the dunes in the Barba Negra Private Natural Reserve. On the other side of the view, we observe Itapuã State Park and, between these points, the meeting of the waters of the Guaiba River and the Laguna dos Patos. Supplementary Figure S4. A, Arboreal restinga / shrub–grassland mosaic; B, Herbaceous freshwater marsh; C, Internal dune field along the Taim margin; D, Riparian restinga swamp forest with epiphytes; E, Arboreal restinga forest patch (low semideciduous forest); F, Forest interior (understory) with a Malaise trap. Supplementary Figure S5. A, Coastal dune field (restinga) near the Patos Lagoon; shrub–grassland restinga mosaic, Itapuã State Park; B, Restinga grassland–shrubland on a granitic slope; view toward Morro da Formiga (Barba Negra RPPN) across Lake Guaíba, Itapuã State Park; C, Herbaceous freshwater marsh/shallow lagoon with emergent macrophytes, Tupancy Natural Municipal Park; D, Forest interior (restinga forest understory) with a Malaise trap, Itapeva State Park; E, Coastal dune field with Atlantic Ocean view; herbaceous–shrub restinga, Itapeva State Park; F, Wet meadow/freshwater marsh with temporary standing water, José Lutzenberger State Park. Supplementary Figure S6. A, Fringing marsh/reedbed along Pai João Lagoon with emergent macrophytes in the northern sector of the park; B, Transition zone among pastures of Fazenda Bioadeiro within an anthropogenic matrix, bordered by forest patches (capões) along the park’s central margin; C, Restinga forest edge (grassland–forest ecotone); D, Interior of restinga/gallery forest with a closed understory in the southern sector of the park; E, Restinga forest understory with a Malaise trap (sampling point); F, Livestock management area/degraded pasture with exposed soil and watering troughs, surrounded by restinga forest patches. Supplementary Figure S7. Dendrograms of dissimilarity among horsefly (Tabanidae) communities in the Coastal Plain of Rio Grande do Sul, Brazil.
Author Contributions
Conceptualization, R.F.K., H.I.L.d.L.S. and T.K.K.; Methodology, R.F.K., H.I.L.d.L.S. and T.K.K.; Investigation, R.F.K. and H.I.L.d.L.S.; Species identification, H.I.L.d.L.S., R.d.F.R.M.D., T.K.K. and R.F.K.; Data analysis, R.F.K., P.P., M.F.A., R.d.F.R.M.D. and S.M.; Writing, original draft, all authors; Writing, review & editing, R.F.K., R.d.F.R.M.D., P.P., M.F.A., S.M. and T.K.K.; Supervision, R.F.K. All authors have read and agreed to the published version of the manuscript.
Funding
This research was funded by the Conselho Nacional de Desenvolvimento Científico e Tecnológico (CNPq), Brazil, grant numbers 422146/2023-4 and 444739/2024-6..
Institutional Review Board Statement
Field collections were conducted under SISBIO/ICMBio authorization number 29229-2 (issued to R.F. Krüger, Universidade Federal de Pelotas), covering sampling in the Estação Ecológica do Taim, Parque Nacional da Lagoa do Peixe, and other sites in the Coastal Plain of Rio Grande do Sul, Brazil.
Informed Consent Statement
Not applicable.
Data Availability Statement
The data that support the findings of this study are available on request from the corresponding author.
Acknowledgments
RFK thanks the Conselho Nacional de Desenvolvimento Científico e Tecnológico (CNPq) for the grants process numbers 422146/2023-4, 444739/2024-6, and 300899/2025-4. TKK thanks the Conselho Nacional de Desenvolvimento Científico e Tecnológico (CNPq) for the scholarship grant number 310214/2021-1.
Conflicts of Interest
The authors declare no conflict of interest.
References
- Krinsky, W.L. Animal disease agents transmitted by horse flies and deer flies (Diptera: Tabanidae). J. Med. Entomol. 1976, 13, 225–275. [CrossRef]
- Baldacchino, F.; Porciani, A.; Bernard, C.; Jay-Robert, P. Spatial and temporal distribution of Tabanidae in the Pyrenees Mountains: the influence of altitude and landscape structure. Bull. Entomol. Res. 2014, 104, 1–11. [CrossRef]
- Rodrigues, G.D.; Lucas, M.; Ortiz, H.G.; dos Santos Gonçalves, L.; Blodorn, E.; Domingues, W.B.; … Krüger, R.F. Molecular of Anaplasma marginale Theiler (Rickettsiales: Anaplasmataceae) in horseflies (Diptera: Tabanidae) in Uruguay. Sci. Rep. 2022, 12, 22460. [CrossRef]
- Dafka, S.; Osman, A.M.; Koua, H.K.; Vieira, R.F.; Rocklöv, J. Impact of climate change and variability on the occurrence and distribution of Trypanosoma vectors in The Gambia. Parasitol. Res. 2025, 124, 1–18. [CrossRef]
- Morales, D.F.; Parodi, P.; Dos Reis, L.F.V.; Nascimento, M.C.; Rodrigues, G.D.; Nunes, L.S.; … Krüger, R.F. First molecular detection of Babesia bigemina in horseflies from Uruguay. Acta Trop. 2025, 264, 107595. [CrossRef]
- Thieulent, C.J.; Carossino, M.; Reis, J.K.; Vissani, M.A.; Barrandeguy, M.E.; Valle-Casuso, J.C.; Balasuriya, U.B. Equine Infectious Anemia Virus Worldwide Prevalence: a 24-year retrospective review of a Global Equine Health Concern with Far-reaching Implications. Vet. Microbiol. 2025, 110548. [CrossRef]
- Evenhuis, N.L.; Pape, T. Systema Dipterorum (version 5.6). In Catalogue of Life Checklist 2025. Catalogue of Life Foundation, Amsterdam, Netherlands. [CrossRef]
- Coscarón, S.; Papavero, N. Catalogue of Neotropical Diptera. Tabanidae. Neotropical Diptera 2009, 16, 1–199.
- Henriques, A.L.; Krolow, T.K.; Rafael, J.A. Corrections and additions to Catalogue of Neotropical Diptera (Tabanidae) of Coscarón & Papavero (2009). Rev. Bras. Entomol. 2012, 56, 277–280. [CrossRef]
- Ferreira-Keppler, R.L.; Rafael, J.A.; Guerrero, J.C.H. Sazonalidade e uso de ambientes por espécies de Tabanidae (Diptera) na Amazônia Central, Brasil. Neotrop. Entomol. 2010, 39, 645–654.
- Krüger, R.F.; Krolow, T.K. Seasonal patterns of horse fly richness and abundance in the Pampa biome of southern Brazil. J. Vector Ecol. 2015, 40, 364–372. [CrossRef]
- Krolow, T.K.; Carmo, D.D.D.; Oliveira, L.P.; Henriques, A.L. The Tabanidae (Diptera) in Brazil: Historical aspects, diversity and distribution. Zoologia 2024, 41, e23074.
- Krolow, T.K.; Krüger, R.F.; Ribeiro, P.B. Chave pictórica para os gêneros de Tabanidae (Insecta: Diptera) do bioma Campos Sulinos, Rio Grande do Sul, Brasil. Biota Neotrop. 2007, 7, 0–0.
- Andrade, B.O.; Dröse, W.; Aguiar, C.A.D.; Aires, E.T.; Alvares, D.J.; Barbieri, R.L.; … Mendonça Junior, M.D.S. 12,500+ and counting: biodiversity of the Brazilian Pampa. Front. Biogeogr. 2023, 15, e60957.
- Buchmann, F.S.C.; Caron, F.; Lopes, R.P.; Ugri, A.; Lima, L.G. Panorama geológico da planície costeira do Rio Grande do Sul. Pesquisas em Geociências 2009, 36, 5–22.
- Ávila, A.C.; Boelter, T.; dos Santos, R.M.; Stenert, C.; Würdig, N.L.; Rocha, O.; Maltchik, L. The effects of different rice cultivation systems and ages on resting stages of wetland invertebrates in southern Brazil. Mar. Freshw. Res. 2014, 66, 276–285. [CrossRef]
- Sganzerla, C.; Dalzochio, M.S.; Prass, G.D.S.; Périco, E. Effects of urbanization on the fauna of Odonata on the coast of southern Brazil. Biota Neotrop. 2021, 21, e20201122. [CrossRef]
- Fernandes, F.A.; Fernández-Stolz, G.P.; Lopes, C.M.; Freitas, T.R.O. The conservation status of the tuco-tucos, genus Ctenomys (Rodentia: Ctenomyidae), in southern Brazil. Braz. J. Biol. 2007, 67, 839–847. [CrossRef]
- Rolon, A.S.; Homem, H.F.; Maltchik, L. Aquatic macrophytes in natural and managed wetlands of Rio Grande do Sul State, Southern Brazil. Acta Limnol. Bras. 2010, 22, 133–146.
- Kirst, F.D.; Marinoni, L.; Krüger, R.F. What does the Southern Brazilian Coastal Plain tell about its diversity? Syrphidae (Diptera) as a model. Bull. Entomol. Res. 2017, 107, 645–657. [CrossRef]
- Lucas, M.; Krolow, T.K.; Riet-Correa, F.; Barros, A.T.M.; Krüger, R.F.; Saravia, A.; … Diversity and seasonality of horse flies (Diptera: Tabanidae) in Uruguay. Sci. Rep. 2020, 10, 401. [CrossRef]
- Costa, M.V.; Henriques, A.L.; Rodrigues, G.D.; Krolow, T.K.; Krüger, R.F. Tabanidae (Diptera) collected on horses in a Cerrado biome in the state of Tocantins, Brazil. Rev. Bras. Parasitol. Vet. 2024, 33, e001924. [CrossRef]
- Zamarchi, T.B.O.; Henriques, A.L.; Krolow, T.K.; Krüger, R.F.; Rodrigues, G.D.; Guimarães, A.M.; … Camargo, L.M.A. Diversity and seasonality of horse flies (Diptera: Tabanidae) in Amazon Forest fragments of Monte Negro, Rondônia, Western Amazon. Parasitol. Res. 2024, 123, 288.
- Barros, A.T.M.; Foil, L.D. The influence of distance on movement of tabanids (Diptera: Tabanidae) between horses. Vet. Parasitol. 2007, 144, 380–384. [CrossRef]
- Soininen, J.; McDonald, R.; Hillebrand, H. The distance decay of similarity in ecological communities. Ecography 2007, 30, 3–12.
- Nekola, J.C.; Brown, J.H. The wealth of species: ecological communities, complex systems and the legacy of Frank Preston. Ecol. Lett. 2007, 10, 188–196. [CrossRef]
- Raes, J.; Letunic, I.; Yamada, T.; Jensen, L.J.; Bork, P. Toward molecular trait-based ecology through integration of biogeochemical, geographical and metagenomic data. Mol. Syst. Biol. 2011, 7, 473. [CrossRef]
- Kitron, U. Landscape ecology and epidemiology of vector-borne diseases: tools for spatial analysis. J. Med. Entomol. 1998, 35, 435–445. [CrossRef]
- Turner, M.G. Landscape ecology: The effect of pattern on process. Annu. Rev. Ecol. Syst. 1989, 20, 171–197. [CrossRef]
- Townes, H. A Light-weight Malaise Trap. Entomological News 1972, 83, 239–247.
- Zafalon-Silva, Â.; Kirst, F.D.; Krüger, R.F. Houseflies speaking for the conservation of natural areas: a broad sampling of Muscidae (Diptera) on coastal plains of the Pampa biome, Southern Brazil. Rev. Bras. Entomol. 2018, 62, 292–303.
- Lutz, A. Tabanidas do Brazil e alguns Estados visinhos. Mem. Inst. Oswaldo Cruz 1913, 5, 142–191.
- Kröber, O. Die Tabanidenuntergattung Phaeotabanus Lutz. Zool. Anz. 1930, 86, 1–30.
- Kröber, O. Das Tabanidengenus Catachlorops Lutz (Dipt.). Veröff. Deutsch. Kolon. Übersee-Museum Bremen 1939, 2, 211–232.
- Coscarón, S.; Philip, C.B. Key to the Neotropical species of Dasybasis Macquart. In: Segundas Jornadas Entomoepidemiológicas Argentinas 1967, 1, 95–103.
- Coscarón, S. Notas sobre tabánidos argentinos (Diptera) VI. El género Lepiselaga Macquart en la Argentina. Rev. Soc. Entomol. Argent. 1968, 30, 51–59.
- Coscarón, S. Notas sobre tabánidos argentinos X. El género Dichelacera Macquart (Diptera-Insecta). Rev. Soc. Entomol. Argent. 1974, 34, 229–250.
- Coscarón, S. Notas sobre tabánidos argentinos XV. El género Tabanus Linnaeus. Obra Centenaria del Museo de La Plata 1979, 6, 251–278.
- Coscarón, S. Notas sobre tabánidos argentinos XVI. El género Chrysops Meigen (Diptera-Insecta). Acta Zool. Lilloana 1979, 25, 365–392.
- Coscarón, S.; Fairchild, G.B. El género Poeciloderas Lutz en Argentina (Tabanidae, Diptera, Insecta). Physis 1976, 35, 293–401.
- Fairchild, G.B. Notes on Neotropical Tabanidae (Diptera). XVI. The Tabanus trivittatus complex. Studia Entomol. 1976, 19, 237–261.
- Fairchild, G.B. Notes on Neotropical Tabanidae (Diptera). XIX. The Tabanus lineola complex. Misc. Publ. Entomol. Soc. Am. 1983, 57, 1–50.
- Fairchild, G.B. Notes on Neotropical Tabanidae (Diptera). XX. The larger species of Tabanus of eastern South America. Contrib. Am. Entomol. Inst. 1984, 21, 1–50.
- Henriques, A.L.; Rafael, J.A. Revisão do gênero Neotropical Acanthocera Macquart (Diptera: Tabanidae). Acta Amaz. 1993, 23, 405–439. [CrossRef]
- Henriques, A.L.; Krolow, T.K. Description of a new species of Tabanidae (Diptera) from the Amazon region: Catachlorops (Rhamphidommia) dubius sp. nov. and a key to species of the subgenus. Zootaxa 2009, 2295, 64–68. [CrossRef]
- Krolow, T.K.; Henriques, A.L. Taxonomic revision of the New World genus Chlorotabanus Lutz, 1913 (Diptera: Tabanidae). Zootaxa 2010, 2656, 1–40.
- Wilkerson, R.C.; Fairchild, G.B. Five new species of Diachlorus (Diptera: Tabanidae) from South America, with a revised key to species and new locality records. Proc. Entomol. Soc. Wash. 1982, 84, 636–650.
- Oksanen, J.; Simpson, G.L.; Blanchet, F.G.; Kindt, R.; Legendre, P.; Minchin, P.R.; O’Hara, R.B.; Solymos, P.; Stevens, …Weedon, J. vegan: Community Ecology Package. R package version 2.7-1, 2025-06-05. DOI: 10.32614/CRAN.package.vegan. Available online: https://cran.r-project.org/package=vegan.
- Hijmans, R.J.; Bican, J.; Dyba, K.; … terra: Spatial Data Analysis. R package version 1.7–78. 2024. Available online: https://CRAN.R-project.org/package=terra.
- R Development Core Team. R: A Language and Environment for Statistical Computing. R Foundation for Statistical Computing: Vienna, Austria, 2025.
- Gachoki, S.M.; Groen, T.A.; Vrieling, A.; Skidmore, A.K.; Masiga, D. Towards accurate spatial prediction of Glossina pallidipes relative densities at country-scale in Kenya. Ecol. Inform. 2024, 81, 102610.
- Nekola, J.C.; White, P.S. The distance decay of similarity in biogeography and ecology. J. Biogeogr. 1999, 26, 867–878. [CrossRef]
- Batson, J.; Dudas, G.; Haas-Stapleton, E.; … Metagenomic analysis of individual mosquitoes reveals dynamics of microbiota and host–pathogen interactions. Nat. Microbiol. 2021, 6, 659–672.
- Rousseau, R.; Delooz, L.; Dion, E.; Quinet, C.; Vanwambeke, S.O. Environmental determinants of Anaplasma phagocytophilum infection in cattle using a kernel density function. Ticks Tick-Borne Dis. 2021, 12, 101814.
- Qiu, J.; Li, X.; Zhu, H.; Xiao, F. Spatial epidemiology and its role in prevention and control of swine viral disease. Animals 2024, 14, 2814.
- Wen, T.H.; Tsai, C.T. Evaluating the role of disease importation in the spatiotemporal transmission of indigenous dengue outbreak. Appl. Geogr. 2016, 76, 137–146.
- Zamarchi, T.B.O.; Henriques, A.L.; Krolow, T.K.; Krüger, R.F.; Rodrigues, G.D.; Guimarães, A.M.; … Camargo, L.M.A. Diversity and seasonality of horse flies (Diptera: Tabanidae) in Amazon Forest fragments of Monte Negro, Rondônia, Western Amazon. Parasitol. Res. 2023, 123, 288.
- Barros, A.T.M. Seasonality and relative abundance of Tabanidae (Diptera) captured on horses in the Pantanal, Brazil. Mem. Inst. Oswaldo Cruz 2001, 96, 917–923. [CrossRef]
- Marques, R.; Jiménez-García, D.; Escobar, L.E.; Krolow, T.K.; Krüger, R.F. Spatial epidemiology of Tabanus (Diptera: Tabanidae) vectors of Trypanosoma. Parasites Vectors 2025, 18, 128. [CrossRef]
- Muzari, M.O.; Skerratt, L.F.; Jones, R.E.; Duran, T.L. Alighting and feeding behaviour of tabanid flies on horses, kangaroos and pigs. Vet. Parasitol. 2010, 170, 104–111. [CrossRef]
- Rodrigues, G.D.; Blodorn, E.; Zafalon-Silva, Â.; Domingues, W.; Marques, R.; Krolow, T.K.; … Krüger, R.F. Molecular detection of Trypanosoma kaiowa in Tabanus triangulum (Diptera: Tabanidae) from the coastal plain of Rio Grande do Sul, southern Brazil. Acta Parasitol. 2022, 67, 518–522.
- Miletti, L.C.; Colombo, B.B.; Cardoso, C.P.; Stalliviere, F.M.; Tavares, K.C.S.; Komati, L.K.O.; … Ramos, C.J.R. Prevalence, seasonality and behaviour of Tabanidae (Diptera) captured on a horse in the Planalto Serrano of Santa Catarina State, Brazil. Int. J. Trop. Insect Sci. 2011, 31, 122–126.
- Dutra, R.R.; Marinoni, R.C. Insetos capturados com armadilha Malaise na Ilha do Mel, Baía de Paranaguá, Paraná, Brasil: II. Tabanidae (Diptera). Rev. Bras. Zool. 1994, 11, 247–256.
- Mihok, S.; Lange, K. Performance of the Nzi and other traps for biting flies in North America. Bull. Entomol. Res. 2012, 102, 515–529.
- Guo, X.; Li, C.X.; Deng, Y.Q.; Xing, D.; Liu, Q.R.; Wu, Q.; … Xu, J. Metagenomic analysis of individual mosquitoes reveals the ecology of mosquito viromes and their potential influence on vector competence. Nat. Commun. 2018, 9, 1–12.
- Rulli, M.C.; D’Odorico, P.; Galli, N.; Gross, M. Land Use Change and Infectious Disease Emergence: Mechanisms and Evidence from Global Case Studies. Rev. Geophys. 2025, 63, e2023RG000840.
- Ostfeld, R.S.; Keesing, F. Biodiversity series: the function of biodiversity in the ecology of vector-borne zoonotic diseases. Can. J. Zool. 2000, 78, 2061–2078. [CrossRef]
- Chaves, L.F.; Hamer, G.L.; Walker, E.D.; Brown, W.M.; Ruiz, M.O.; Kitron, U.D. Climatic variability and landscape heterogeneity impact urban mosquito diversity and vector abundance and infection. Ecosphere 2011, 2, 1–21.
- Bennett, K.L.; Almanza, A.; McMillan, W.O.; Saltonstall, K.; Vdovenko, E.L.; Vinda, J.S.; Loaiza, J.R. Habitat disturbance and the organization of bacterial communities in Neotropical hematophagous arthropods. PLoS ONE 2019, 14, e0222145.
- Farner, J.E.; Howard, M.; Smith, J.R.; Anderson, C.B.; Mordecai, E.A. Local tree cover predicts mosquito species richness and disease vector presence in a tropical countryside landscape. Landsc. Ecol. 2025, 40, 1–17.
- Shen, J.; Wang, Y.; Liu, X.; Zhang, L. Integrating spatial scale into vector-borne disease modeling: A framework for surveillance in heterogeneous landscapes. Parasites Vectors 2025, 18, 45.
- Legendre, P.; Fortin, M.-J.; Borcard, D. Spatial analysis of ecological data. In Encyclopedia of Life Support Systems (EOLSS); UNESCO/EOLSS Publishers: Oxford, UK, 2005.
- Martin-Devasa, V.; González-Maya, J.F.; Aide, T.M. A multi-scale analysis of distance decay in Neotropical mammal communities: implications for conservation planning. Biodivers. Conserv. 2021, 30, 777–795.
- Buckley, J.; Beresford, D.V.; Marshall, S.A.; Lindsay, R. Horse fly and deer fly (Diptera: Tabanidae) species and abundance following logging in northwestern Ontario. For. Ecol. Manag. 2023, 544, 121158. [CrossRef]
- Multini, L.C.; de Souza, A.L.D.S.; Marrelli, M.T.; Wilke, A.B.B. The influence of anthropogenic habitat fragmentation on the genetic structure and diversity of the malaria vector Anopheles cruzii (Diptera: Culicidae). Sci. Rep. 2020, 10, 18018.
- Orlandin, E.; Santos, E.B.; Schneeberger, A.H.; Souza, V.O.; Favretto, M.A. Habitat use by Neotropical mosquitoes (Diptera: Culicidae): vegetation structure and edge effects. Austral Entomol. 2020, 59, 541–548.
- Corrêa-Neto, J.J.; Henriques, A.L. Horse Flies (Diptera: Tabanidae) in Mangrove Forests and Estuarine Floodplains on Marajó Island, Brazil. Neotrop. Entomol. 2023, 52, 571–583.
- Zittra, C.; Vitecek, S.; Obwaller, A.G.; Rossiter, H.; Eigner, B.; Zechmeister, T.; Fuehrer, H.P. Landscape structure affects distribution of potential disease vectors (Diptera: Culicidae). Parasites Vectors 2017, 10, 1–13. [CrossRef]
- Estrada-Peña, A.; Mallón, A.R.; Bermúdez, S.; De La Fuente, J.; Domingos, A.; García, M.P.E.; … Venzal, J.M. One health approach to identify research needs on Rhipicephalus microplus ticks in the Americas. Pathogens 2022, 11, 1180. [CrossRef]
- Marques, R.; Krüger, R.F.; Peterson, A.T.; de Melo, L.F.; Vicenzi, N.; Jiménez-García, D. Climate change implications for the distribution of the babesiosis and anaplasmosis tick vector, Rhipicephalus (Boophilus) microplus. Vet. Res. 2020, 51, 81. [CrossRef]
Figure 1.
Geographic location of the study area in the Coastal Plain of Rio Grande do Sul (CPRS), southern Brazil. Left panel: Position of the state of Rio Grande do Sul (outlined in green) within Brazil and South America. Right panel: Sampling sites (black dots) distributed along the CPRS (shaded in white), encompassing a gradient of protected and unprotected environments.
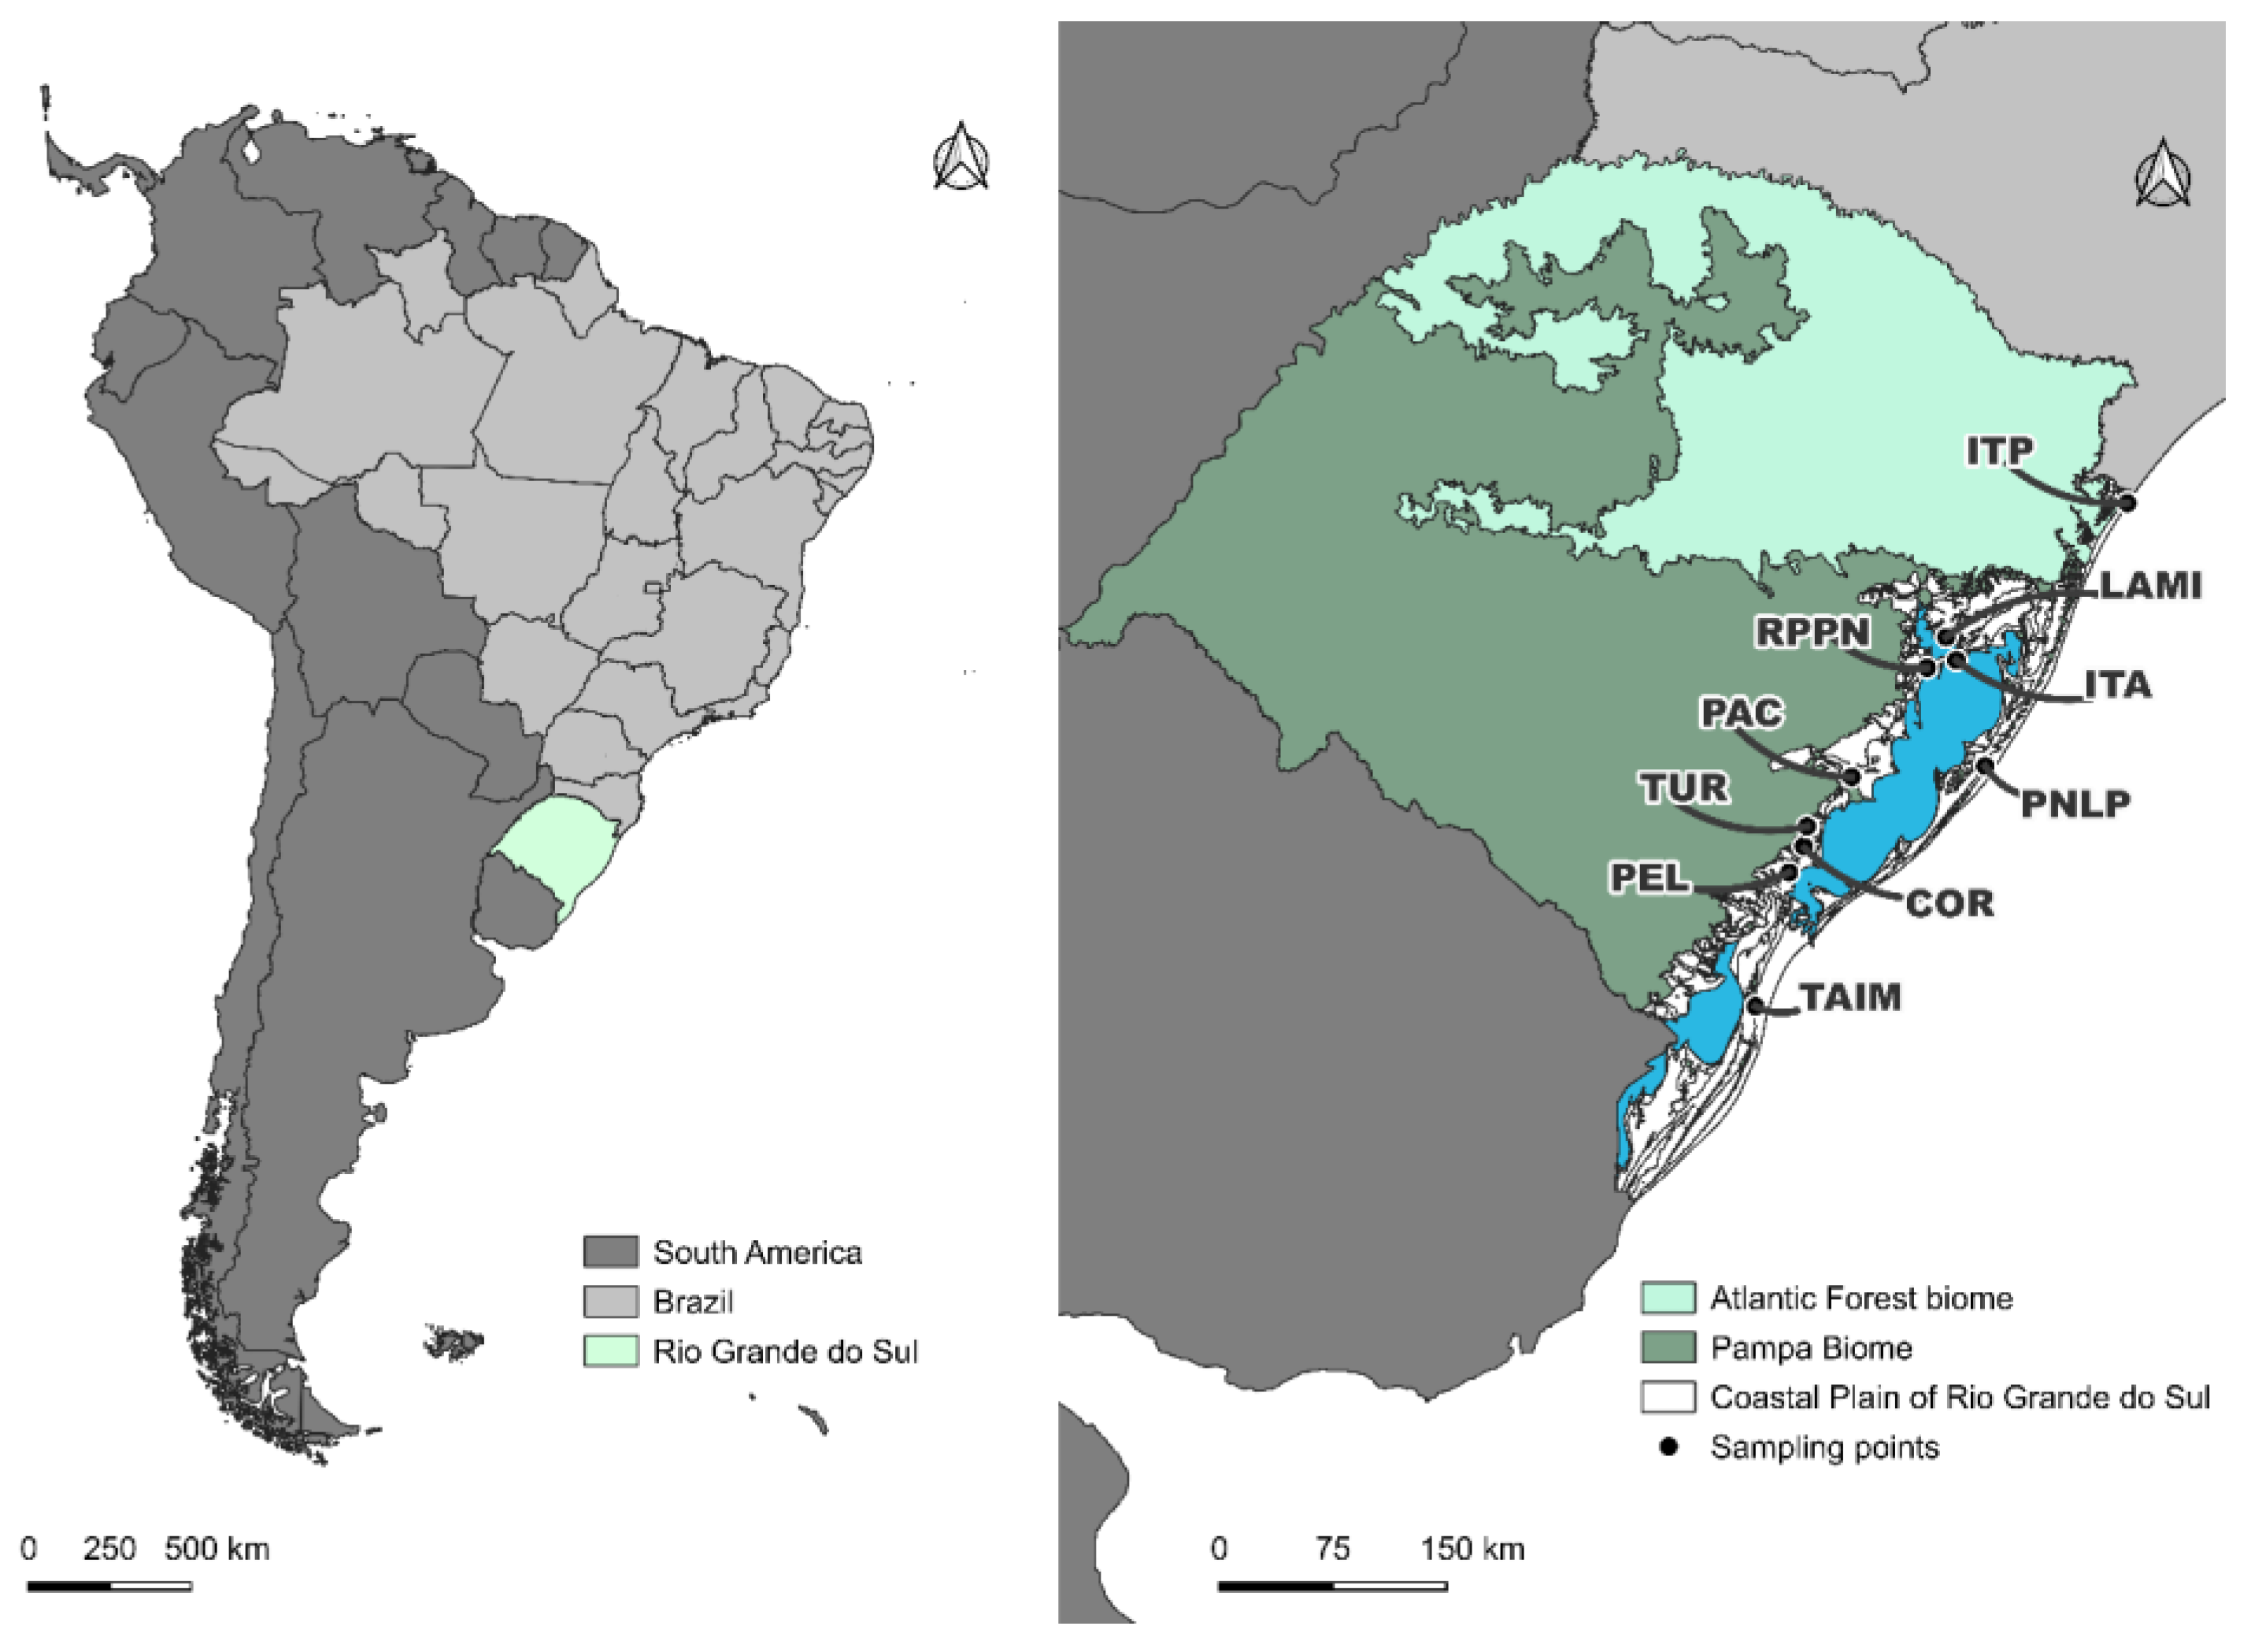
Figure 2.
Relationship between geographic distance and dissimilarity in Tabanidae communities from the Coastal Plain of Rio Grande do Sul, Brazil. Top: Abundance-based dissimilarity (Bray-Curtis); Bottom: Presence/absence-based dissimilarity (Jaccard). Data are shown for three of the top models: linear (red), exponential (purple), and Michaelis-Menten (black). The Michaelis-Menten model showed the best fit in both cases.
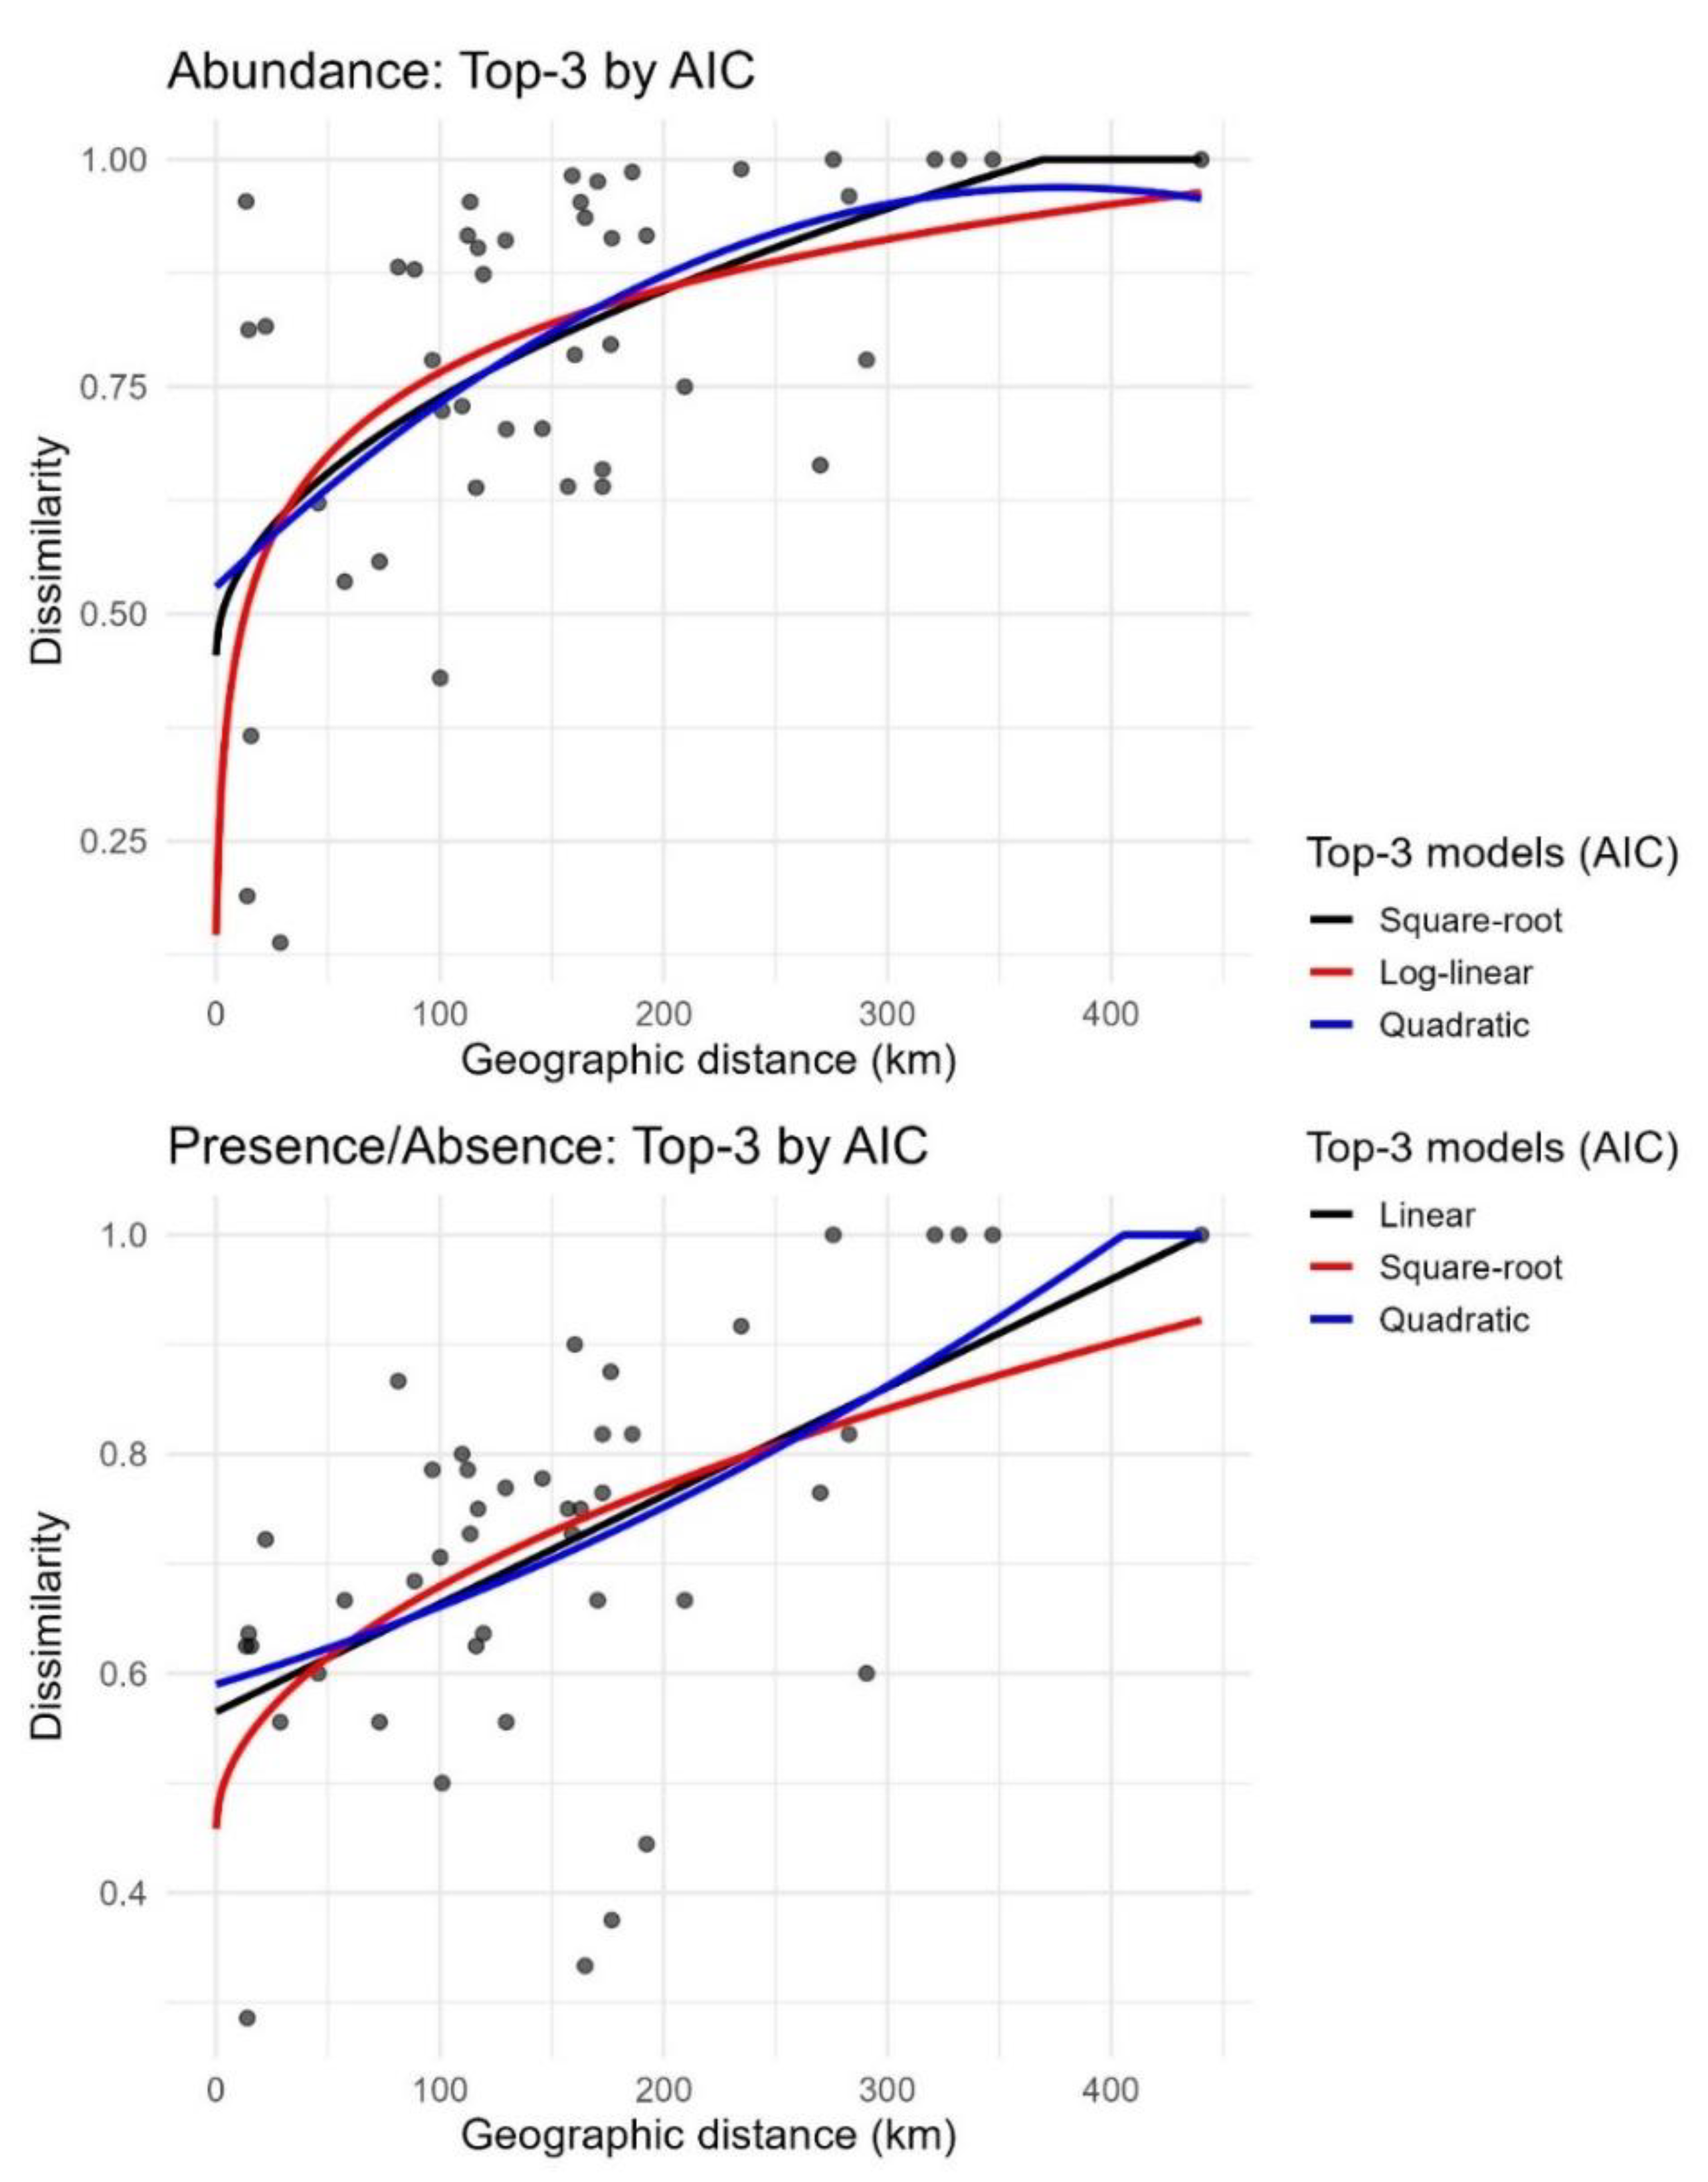

Table 1.
Abundance, distribution, and diversity of Tabanidae communities sampled in the Coastal Plain of Rio Grande do Sul (CPRS). For each of the 10 localities (PEL = Pelotas stream; COR = Corrientes stream; TUR = Turuçu stram; RPPN = RPPN Barba Negra; LAMI = ReBio Lami; PAC = Pacheca village; TAIM = Taim Ecological Station; ITA = Itapuã State Park; ITP = Itapeva State Park; PNLP = National Park of Lagoa do Peixe), values represent the number of individuals per species collected at each site. UC (protected area status): P = protected; NP = not protected. The total number of Malaise traps deployed per locality is indicated in the second row. Columns “abund” and “(%)” indicate total abundance and relative frequency of each species, respectively; S is species richness. Shannon and Simpson indices were calculated from the relative abundance of species at each locality; higher values indicate greater species diversity and evenness.
| Species | PEL | COR | TUR | RPPN | LAMI | PAC | TAIM | ITA | ITP | PNLP | abund | (%) |
| NP | NP | NP | P | P | NP | P | P | P | P | ____ | ___ | |
| N Malaise | 10 | 7 | 8 | 16 | 4 | 3 | 22 | 9 | 4 | 15 | 98 | |
| S | 6 | 5 | 7 | 15 | 7 | 7 | 6 | 7 | 3 | 10 | ____ | ___ |
| Shannon | 0.228 | 0.714 | 0.629 | 1.768 | 1.706 | 1.135 | 1.355 | 1.558 | 0.181 | 1.405 | ____ | ___ |
| Simpson | 0.081 | 0.467 | 0.375 | 0.756 | 0.781 | 0.601 | 0.699 | 0.738 | 0.071 | 0.634 | ____ | ___ |
| Chrysops nigricorpus Lutz, 1911 | 0 | 0 | 0 | 0 | 0 | 0 | 0 | 0 | 0 | 1 | 1 | 0.03 |
| Chrysops varians Wiedemann, 1828 | 0 | 3 | 8 | 6 | 4 | 0 | 19 | 3 | 0 | 75 | 118 | 3.20 |
| Chrysops variegatus (De Geer, 1776) | 3 | 0 | 1 | 0 | 2 | 6 | 0 | 0 | 0 | 0 | 12 | 0.33 |
| Fidena marginalis (Wiedemann, 1830) | 0 | 0 | 0 | 0 | 0 | 0 | 0 | 0 | 0 | 1 | 1 | 0.03 |
| Acanthocera aureoscutellata Henriques & Rafael, 1992 | 0 | 0 | 0 | 2 | 0 | 1 | 0 | 0 | 0 | 0 | 3 | 0.08 |
| Acanthocera exstincta (Wiedemann, 1828) | 0 | 2 | 1 | 0 | 2 | 0 | 0 | 0 | 0 | 0 | 5 | 0.14 |
| Acanthocera longicornis (Fabricius, 1775) | 0 | 0 | 0 | 0 | 0 | 0 | 0 | 0 | 0 | 6 | 6 | 0.16 |
| Catachlorops aff. fuscinevris (Macquart, 1838) | 0 | 0 | 0 | 8 | 0 | 0 | 0 | 0 | 0 | 0 | 8 | 0.22 |
| Catachlorops potator (Wiedemann, 1828) | 0 | 0 | 0 | 3 | 0 | 0 | 0 | 0 | 0 | 0 | 3 | 0.08 |
| Chlorotabanus inanis (Fabricius, 1787) | 0 | 0 | 0 | 4 | 0 | 0 | 0 | 0 | 0 | 0 | 4 | 0.11 |
| Dasybasis missionum (Macquart, 1838) | 0 | 0 | 2 | 0 | 0 | 0 | 1 | 0 | 0 | 0 | 3 | 0.08 |
| Diachlorus bivittatus (Wiedemann, 1828) | 0 | 0 | 0 | 82 | 0 | 0 | 0 | 0 | 0 | 1 | 83 | 2.25 |
| Dichelacera alcicornis (Wiedemann, 1828) | 0 | 0 | 0 | 50 | 13 | 0 | 0 | 1 | 53 | 0 | 117 | 3.18 |
| Dichelacera fuscipes Lutz & Neiva, 1915 | 0 | 0 | 0 | 0 | 0 | 6 | 0 | 8 | 0 | 0 | 14 | 0.38 |
| Lepiselaga albitarsis Macquart, 1850 | 2 | 0 | 0 | 0 | 15 | 0 | 113 | 0 | 0 | 0 | 130 | 3.53 |
| Phaeotabanus litigiosus (Walker, 1850) | 0 | 0 | 0 | 6 | 0 | 0 | 0 | 1 | 0 | 0 | 7 | 0.19 |
| Poeciloderas quadripunctatus (Fabricius, 1805) | 4 | 0 | 0 | 2 | 0 | 0 | 15 | 0 | 0 | 3 | 24 | 0.65 |
| Tabanus claripennis (Bigot, 1892) | 15 | 217 | 199 | 1 | 1 | 17 | 48 | 0 | 0 | 10 | 508 | 13.80 |
| Tabanus fuscofasciatus Macquart, 1838 | 0 | 0 | 0 | 52 | 0 | 27 | 0 | 0 | 0 | 0 | 79 | 2.15 |
| Tabanus fuscus Wiedemann, 1819 | 0 | 0 | 0 | 1 | 0 | 0 | 0 | 12 | 1 | 11 | 25 | 0.68 |
| Tabanus sorbillans Wiedemann, 1828 | 0 | 0 | 0 | 0 | 0 | 0 | 0 | 0 | 1 | 0 | 1 | 0.03 |
| Tabanus occidentalis Linnaeus, 1758 | 5 | 2 | 1 | 37 | 7 | 155 | 0 | 1 | 0 | 0 | 208 | 5.65 |
| Tabanus pungens Wiedemann, 1828 | 0 | 0 | 0 | 0 | 0 | 0 | 0 | 0 | 0 | 1 | 1 | 0.03 |
| Tabanus sp. | 0 | 0 | 0 | 5 | 0 | 0 | 0 | 0 | 0 | 0 | 5 | 0.14 |
| Tabanus triangulum Wiedemann, 1828 | 669 | 403 | 659 | 187 | 22 | 229 | 119 | 4 | 0 | 24 | 2316 | 62.90 |
| Local abundance | 698 | 627 | 871 | 446 | 66 | 441 | 315 | 30 | 55 | 133 | 3682 |
Disclaimer/Publisher’s Note: The statements, opinions and data contained in all publications are solely those of the individual author(s) and contributor(s) and not of MDPI and/or the editor(s). MDPI and/or the editor(s) disclaim responsibility for any injury to people or property resulting from any ideas, methods, instructions or products referred to in the content. |
© 2025 by the authors. Licensee MDPI, Basel, Switzerland. This article is an open access article distributed under the terms and conditions of the Creative Commons Attribution (CC BY) license (http://creativecommons.org/licenses/by/4.0/).
Copyright: This open access article is published under a Creative Commons CC BY 4.0 license, which permit the free download, distribution, and reuse, provided that the author and preprint are cited in any reuse.


