
Submitted:
11 September 2025
Posted:
15 September 2025
You are already at the latest version
Abstract
Virtual Machine Introspection (VMI) is a powerful technology used to detect and analyze malicious software inside Virtual Machines (VMs) from outside. Asynchronously accessing the VM’s memory can be insufficient for efficiently monitoring what is happening inside of a VM. Active VMI introduces breakpoints to intercept VM execution at relevant points. Especially for frequently visited breakpoints, and even more so for production systems, it is crucial to keep their performance overhead as low as possible. In this paper, we present an empirical study that compares the performance of four VMI breakpoint implementation variants–EPT switching (SLAT view switching) with and without fast single-stepping acceleration, instruction repair and instruction emulation–from two VMI applications (DRAKVUF, SmartVMI), with the XEN hypervisor, on 20 Intel Core i processors ranging from the 4th to the 13th generation. Regarding the time required to process a breakpoint hit, we found that on all platforms: instruction repair > EPT switching EPT switching fast single-step > instruction emulation. More modern processors such as the Intel Core i7 12700H and Intel Core i9 13900HX achieved median breakpoint processing times as low as 15μs.
Keywords:
virtual machine introspection
; performance
; benchmarking
1. Introduction
Code introspection methods, such as software debugging, play a critical role in analyzing and understanding program and system behavior. They enable the detection, diagnosis, and mitigation of issues, e.g., security-related problems, or facilitate execution performance measurements. Virtual Machine Introspection (VMI) encompasses techniques for monitoring, analyzing, and manipulating the internal guest state of a VM from external environments such as the host system or other VMs. Introspection tools realize these techniques by reading and, if necessary, changing the values of the virtual CPU (vCPU) registers and data in the main memory of the monitored VM combined with its semantic interpretation. Garfinkel and Rosenblum initially introduced VMI as a concept in 2003 [1]. VMI allows administrators and defenders to detect and analyze malicious activities within VMs, so the security and forensic fields made practical use of VMI [1]. Hence, there is significant interest in applications within the fast-growing cloud computing environment [2]. Dynamic malware analysis—manually or highly automated in sandboxes—also make use of VMI-based tracing mechanisms [3,4].
VMI-based intrusion detection or malware analysis systems have several advantages over kernel-mode or user-mode methods that run on the same system (inside the same VM) that is to be monitored. Two important aspects include i) isolation (sensor isolation from the analysis target) and ii) transparency (sensor invisible for the analysis target). Virtualization ensures strong isolation between the guest software to be monitored and the sensor software. This separation makes detecting and manipulating the monitoring software significantly more difficult for an attacker [5], allowing for more resilient observation. However, a key challenge for VMI applications is to bridge the semantic gap [6], i.e., accurately interpret the guest software semantics based on guest memory. Typically, this involves an in-depth understanding of OS and application data structures [7], possibly derived from debugging symbols or via complex reverse engineering efforts, particularly when facing closed-source guest software. When this key challenge is successfully addressed, VMI monitoring enables comprehensive event tracing and memory analysis, providing critical information on the behavior of the system and application.
Modern VMI solutions primarily perform inspections in response to VM events (e.g., page faults, Control Register 3 (CR3) writes, or breakpoint interrupts). Dangl et al. [8] refer to this reactive approach as active (or synchronous) VMI, while passive VMI tasks are scheduled asynchronously by the outer monitoring software. A key method of active VMI is to place breakpoints at particular locations inside the guest code. Whenever the guest in the VM triggers such a breakpoint, the VMI software can analyze the guest state related to the intercepted execution (e.g., reading the function arguments of an invocation). Beyond placing breakpoints, more invasive manipulations of the guest state can be useful. For example, the VMI application DRAKVUF [9] uses function call injections to interact with the guest Operating System (OS) Application Programming Interface (APIs) to perform data transfers between the target VM and outer environments, or to invoke process starts (called process injection)—valuable functionality in malware-analysis sandboxes.
The attempt to create a first standard of a low level VMI API as an interface between VMI applications and hypervisors with access capabilities led to the LibVMI project [10]. This library focuses on accessing VM memory and vCPU registers. It can deal with Guest Virtual Addresses (GVAs) of the guest process address spaces and is able to translate them into Guest Physical Addresses (GPAs) of the VM. In contrast to Host Physical Addresses (HPAs), GPAs are also virtual addresses from the host’s point of view, but from guest’s perspective they are the physical addresses (of the VM). The bottom line is that LibVMI enables data access addressed via both guest process-related GVAs and GPAs. For translating GVAs into GPAs, the library performs a page table walk on the tables managed by the guest OS in software, efficiently implemented with software-side caching. The existing prerequisite is that LibVMI is aware of the guest OS and is able to interpret the required internal data structures of the guest OS. Unfortunately, LibVMI does not cover breakpoint handling. The library only provides a minimal trap interface, allowing control flow interception when a VM event occurs, e.g., page faults, CR3 writes, or breakpoint interrupts. The handling of breakpoints is typically implemented in the VMI application, if at all. As a result, various concepts and implementations have emerged over time.
Building on our work developing a VMI infrastructure for the KVM hypervisor to realize security monitoring for Windows guests, we investigate, among other things, the various breakpoint handling mechanisms employed in different VMI applications. The VMI software stack on that we focus consists of the virtualization stacks KVM / QEMU and XEN / QEMU, and the VMI applications SmartVMI and DRAKVUF. SmartVMI [11] is a VMI application software, which was developed in the SmartVMI research project [12] by VMI researcher D. Eikenberg (GDATA) and partners. Because it is based on LibVMI, it is compatible with both KVM and Xen. It provides a plugin interface and guest access functionalities to implement custom VMI monitoring logic. There are a VMI-based guest memory YARA scanner and a guest API call tracer available as plugins. DRAKVUF [13] is a plugin-agnostic VMI application software for monitoring guest behavior, too. It was developed by T. Lengyel with the focus on stealthiness [14]. There are a lot of plugins and libraries available, targeting different use cases of automated malware analysis used in sandbox solutions. DRAKVUF is also built on top of LibVMI but currently only supports the XEN hypervisor as virtualization back end.
In most use cases, runtime performance is critical for different reasons. For sandboxes, minimizing the overhead from VMI sensor interceptions is advantageous, because the additional cycles spent while the vCPUs are paused extend the real-world execution time without affecting the effective execution time within the VM. Longer execution times reduce the analysis throughput in Sandbox clusters, or provide angles for timing-based evasion checks [15], and should be avoided. Similarly, for VMI on endpoint VMs with user interactions, low latency VMI interceptions are very important because applications with soft real-time requirements do not tolerate long interruptions. This is especially true for graphical user interface activities in the case of VMs operated by human users. Customers of VMI-monitored VMs expect their systems to be responsive.
In this paper, we address the research question: How do the existing breakpoint implementations compare in terms of performance? This seemingly simple question reveals upon closer examination quite a few facets, which we discuss in the following chapters. In summary, we make the following contributions.
- We prepared a portable disk image containing recent releases of Ubuntu, XEN with QEMU, DRAKVUF, SmartVMI, our benchmark tool bpbench, and tools for VM snapshot management. We make the image available to reproduce our measurements on matching hardware or repeat the measurements on other systems.
- We provide breakpoint-benchmark results measured with the previously mentioned disk image on 20 devices with Intel Core processors ranging from the 4th to the 13th generation.
The rest of this paper is structured as follows: Section 2 provides a thorough explanation of the breakpoint handling implementations. Section 3 first discusses all the aspects to consider when trying to answer the research question and eventually introduces our measurement study in detail. We give an overview of the utilized hardware platforms in Section 4 before presenting and interpreting measurement results in Section 5. Section 6 highlights relevant existing works. Finally, Section 7 concludes the paper by summarizing, discussing the results, and giving an outlook to future work.
2. Background
Virtual Machine Introspection (VMI) is a technique that allows the state and behavior of a virtual machine (VM) to be monitored and analyzed from the outside —i.e., from the host environment (type 2 VM), a control VM (type 1 HV) or a special monitoring VM - without having to install agent software within the VM itself. This is often used for security monitoring in malware sandboxes or malware analysis. In the scientific community, there are a few generally useful open source applications for performing security-related VM behavior monitoring on different virtualization platforms. We have identified two of these, which were designed for use as malware sandbox sensors, as particularly relevant. First there is DRAKVUF [13] by Tamas Lengyel a plugin agnostic framework for writing VMI applications with a lot build in monitoring features for Linux and Windows guest software supporting the XEN-QEMU virtualization platform [14]. The other nominee is SmartVMI [11] a also plugin based VMI software for Windows guests developed by GDATA CyberDefense AG as a member of the SmartVMI research project [12]. SmartVMI supports the two virtualization platforms XEN-QEMU (type 1 HV) and KVM-QEMU (type 2 HV). For the last one, KVMI a VMI patch set for Linux KVM is needed.
2.1. VMI Software Architecture
The architecture of VMI software can typically be divided into several layers or components. The foundation is the virtualization platform consisting of a hypervisor (e.g., XEN, KVM, etc.) and a Virtual Machine Monitor (e.g., QEMU, CloudHypervisor, etc.). The virtualization platform implements access functions to the registers of the virtual CPUs (vCPUs) and the guest physical memory of the VMs to be monitored, as well as an event system with which traps can be configured and notifications on VM exits can be set up. These functionalities can be referred to as VMI infrastructure, which is provided by the virtualization platform via interfaces to use by the VMI application software. For XEN (type 1 HV), the corresponding mechanisms are located in the hypervisor itself in the host and are accessed via hypercalls by VMI software within a VM. For KVM (type 2 HV), the VMI infrastructure functions (KVMI) are also located in the hypervisor, i.e., in the KVM driver in the Linux kernel of the host system. The KVM driver is used by the Virtual Machine Monitor (VMM) process for the VM (QEMU process). The VMI application software communicates with the QEMU process or rather with the KVM driver inside the Kernel part of the QEMU process via an UNIX domain socket. An implementation of VMI infrastructure functions within the VMM software would theoretically be conceivable, but no implementations are known.
The VMI application software builds on and utilizes the VMI infrastructure. It is the core of a VMI software stack and implements the sensor logic used to interpret the the guest software state (semantic gap) for monitoring guest systems behavior. In the open source VMI ecosystem, there is the LibVMI library [10] used by many VMI applications that implements VMI access procedures and trap handling. LibVMI forms an intermediate layer between the VMI application or sensor logic and the VMI infrastructure of the hypervisor. It generalizes the VMI access API to provide the VMI software an uniform API independent of the underlying hypervisor. However, LibVMI also plays a central role in dealing with the semantic gap. It implements address translation from guest virtual addresses (GVA) to guest physical addresses (GPA). This allows the VMI software to work with virtual addresses from the address spaces of the guest processes. To do this, LibVMI reads and interprets the guest page tables and does the page table walk in software. The mechanism is implemented in an efficient way with software-side caching.
2.2. Hyper-Breakpoint Handling
Modern VMI-based monitoring methods use active VMI as an instrumentation method, which enables event-based monitoring of the guest software. In order for VMI software to respond to events in the guest software (active VMI), traps must be installed. One of the most important types of traps are code breakpoints realized by breakpoint instructions (INT3 on x86) patched into the guest code.
The VMI software uses the hypervisor to configure the virtual CPUs of the VM to be monitored via Virtual Machine Control Structure (VMCS) structs so that code breakpoints lead to a VM exit and a handling by the hypervisor and the VMI software. The hypervisor checks whether the breakpoint is a hyper breakpoint installed by the VMI software or a debug breakpoint set by guest software within the VM. In the former case, the VMI software is notified to handle the breakpoint. In the latter case, the breakpoint is injected as an interrupt into the VM during the VM resume process so that the guest software that installed the breakpoint can handle it.
A significant difference between hyper breakpoints and classic in-VM breakpoints with regard to inserting the breakpoint instruction is that, due to the copy-on-write (COW) policy for shared user mode code pages within the guest systems, inserting an in-VM breakpoints results in a copy of the page. The new copy is private for the target process and will be patched with the breakpoint, which means that the breakpoint only takes effect in the user address space of the target process. In contrast, such guest page policies do not exist for hyper breakpoints, which means that breakpoints in shared code pages are effective in all processes in which the corresponding shared and patched page is mapped.
To complete code breakpoint handling after the VMI sensor logic has processed the event, the original instruction that was destroyed by the patching with the breakpoint instruction must be executed before execution can continue with the next instruction of the guest code. To ensure that the original instruction is executed, there are three basic concepts in VMI-based breakpoint handling. First there is the repair mechanism that restores the origin instruction in main memory. As an alternative to change the data in memory, the instruction can be emulated, which is the second method. The third method only works in the context of virtualization and is based on the fact that the hypervisor can give a vCPU different views of the memory.
Table 1 provides an overview of the three breakpoint handling concepts, named Instruction Repair, Instruction Emulation and Second Level Address Translation (SLAT) View Switch, all of which will be discussed in the following subsections. The first column contains the concept name as used throughout this work, accompanied by a concise identified for its implementation. The subsequent columns reflect concept properties – such as multiprocessor-safety, reliance on single-stepping, or the kind of trap mechanism employed – and provide a summary of the corresponding processing sequence.
2.2.1. Instruction Repair (1)
In the case of the instruction repair mechanism, after the breakpoint has been processed by the VMI sensor logic, the original byte of the instruction that was overwritten by setting the breakpoint instruction INT3 is written back to VM’s memory. The original instruction is thus restored or repaired. However, before returning to the VM to execute the repaired original instruction, the interrupted vCPU must be set to single stepping mode. This is done via the Monitor Trap Flag (MTF) in the VMCS of the vCPU managed by the hypervisor. The MTF in the VMCS configures the vCPU to operate in virtualized single step mode, executing only one command of the guest software and then automatically triggering a VM exit again. The MTF thus corresponds to the Trap Flag (TF) of the RFLAGS register in classic non-virtualized environments. After the repaired command of the guest software has been executed, the VMI software can patch the instruction again with the breakpoint instruction INT3 in response to the single step VM exit, so that the breakpoint trap is also set for future executions again.
During the period in which the original instruction is persistent in memory without a breakpoint, parallel executions could pass the code location without triggering the trap. For this reason, it should be ensured that no parallel executions exist, e.g., by deactivating all other vCPUs of the VM for this period or by strictly avoiding multiprocessing (single vCPU VM). This solution must therefore be considered as non-multiprocessor-safe.
Another disadvantage of this method is that single stepping requires switching between the VM to be monitored and the VMI software in a total of two times (at least four VM transitions). In the case of a type 2 hypervisor such as XEN, this number doubles to eight VM transitions, as the VMI software itself executes within a VM that must be entered and exited. These additional VM transitions, along with the required communication between the hypervisor and the VMI software, introduce considerable overhead and significantly increase execution latency.
2.2.2. Instruction Emulation (2)
To avoid the single-step overhead of the instruction repair mechanism and to create a hyper-breakpoint handling method that is multiprocessing-safe, it is better to find a way without touching the VM’s memory with the patched guest code. The alternative is to emulate the original instruction outside the VM by using a software emulator that operates like a CPU instead of executing it on the real CPU. The emulation contains the original instruction from the guest code before the breakpoint patch from the VMI software and executes it on the state (registers, memory) of the vCPU. Afterwards, the vCPU can be resumed (VMRESUME) to continue execution with the next command of the guest software. Practical implementations of hyper-breakpoint handling using instruction emulation in VMI software utilize the x86/IA32/AMD64 instruction emulation that is integrated into the KVM and XEN hypervisors.
This method is multiprocessor-safe because the patched code with the breakpoint that is seen by other parallel vCPUs is never modified. The number of context switches and VM transitions also remains minimal (Type 1 HV: 4, Type 2 HV: 2) and single-step overhead is avoided.
Nevertheless, a notable limitation is that the emulation implementation may be incomplete and, as a result, diverge from actual CPU execution. The extent of this issue largely depends on the quality of the selected emulation and its commitment to completeness and correctness. The x86/IA32/AMD64 instruction emulation integrated in KVM, XEN, and QEMU can be assumed to be highly accurate, as these systems are mature, widely used, and have undergone extensive testing over time. However, specific edge cases involving certain instructions and argument combinations may arise, in which emulation is best avoided. When designing the VMI sensor logic, the approach can be aware of which guest software instruction is being patched with a hyper-breakpoint. This knowledge allows the issue to be largely mitigated by avoiding the placement of breakpoints on extremely rare instructions where emulation may be unreliable or faulty.
2.2.3. SLAT View Switch (altp2m) (3)
Second Level Address Translation (SLAT) – implemented by Extended Page Table (EPT) in Intel x86-64 processors – provides possibilities for realizing execution context-dependent manipulations of guest software by VMI software. This enables another option for handling hyper-breakpoints, which is only possible for hyper-breakpoints in virtualized environments, however. The reason for this is that it is based on SLAT, which forms the basis of address translation in virtualization solutions. SLAT is the translation stage in the host that enables guest physical addresses of the VM to be translated into host or machine physical addresses of the host.
Using multiple EPT page table sets for one VM or one vCPU, the hypervisor can implement multiple views of the memory from the perspective of a vCPU (SLAT views). By configuring the VMCS, the hypervisor can change the vCPU’s view of its memory. This allows a page of the VM memory to be mapped to several different page frames of the machine memory, depending on the view. This possibility can be used for breakpoint handling. The page of VM’s memory that should be patched with a hyper breakpoint is mapped to two different page frames via two SLAT views. One page frame contains the original version of the code without the breakpoint instruction, while the other contains the patched version with the INT3 instruction. The hypervisor configures the vCPUs in such a way that the modified version with the breakpoint is used during normal execution, causing it to trigger when executed. During breakpoint handling, the view of the original version is changed for the interrupted vCPU and the original instruction is executed in single stepping mode. After the original instruction has been executed, single stepping interrupts again and the VMI software can change the view of the interrupted vCPU back to the patched version with the breakpoint instruction. Then execution of the guest code can be continued.
Using this method, the original instruction is executed in hardware on the real CPU without the need for emulation. Real execution on CPUs is faster and more reliable in terms of correctness compared to emulation. In addition, this method is also multiprocessing-safe, as each vCPU has its own configuration specifying which EPT page table set to use and which view of the memory should be active. However, there again is the disadvantage that the VMI software and/or the hypervisor must intervene twice to switch the memory view back and forth. This again results in the mentioned single-step overhead, requiring 4 switches between VM execution and VMI software (type 1 HV: 8 VM transitions; type 2 HV: 4 VM transitions).
Another major advantage of SLAT View Switching in the VMI context is that breakpoint traps can be enabled and disabled by switching views, as required by the VMI software. For example, breakpoints in operating system libraries in user-mode processes can be enabled or disabled for a vCPU depending on the process or thread that is currently being executed. This allows monitoring to be restricted to individual threads and processes of a system, thereby filtering out unimportant behavior noise. Especially for hyper-breakpoints in shared libraries, whose code is mapped in different process address spaces and where breakpoints are therefore also effective in different processes, SLAT View Switching can still be used to differentiate between individual enablements.
In order for VMI Software to use SLAT View Switching for its purposes, the hypervisor must offer the feature via its VMI infrastructure API. In the XEN hypervisor project, the function is referred to the acronym ”altp2m” (alternative guest physical memory to machine physical). SLAT View Switching as a method for hyper breakpoint handling was first used in the VMI Framework DRAKVUF, which was developed at the same time as the VMI infrastructure functions in XEN in the same comunity, which has established the term ”altp2m” as a synonym for SLAT View Switching in the VMI context.
2.3. Acceleration: Breakpoint Handling by the Hypervisor
In addition to the breakpoint handling methods themselves, the layer within the VMI stack on which the method is implemented and executed also has a significant impact on execution speed. Theoretically, the mechanisms described (repair, emulation, SLAT view switching) can be implemented either within the VMI application (SmartVMI, DRAKVUF, LibVMI) or within the VMI infrastructure as part of the hypervisor or VMM. The last option has the advantage that after the instruction is executed by single step, the hypervisor does not have to communicate with the VMI application that these can finish breakpoint handling. Instead, breakpoint handling is finished directly in the hypervisor. Communication between the hypervisor and the VMI process is at least interprocess communication, which represents additional avoidable overhead that carries the risk of delays and thus higher latencies. In the case of a Type 2 hypervisor such as KVM, this involves interprocess communication between the VMM process (QEMU) and the VMI process (SmartVMI). With a Type 1 hypervisor such as XEN, the overhead is significantly greater, as hyper-communication must take place between the VM with the VMI software and the hypervisor in the host, requiring additional VM transitions.
To avoid this overhead, DRAKVUF offers the Fast-Singlestep (FSS) option, whereby breakpoint handling when switching SLAT views is not performed by DRAKVUF itself, but instead by the XEN hypervisor which provides the necessary VMI infrastructure feature. The DRAKVUF feature is only available for breakpoint handling and is not used to accelerate read traps in relation to breakpoint hiding.
2.4. Hiding Breakpoints for Stealth
When using VMI-based monitoring in a security context, it may be important that the attacker or the malware to be monitored cannot detect the monitoring. Examples here would be malware sandboxes or high interaction honeypots. Code integrity checks, in which software reads the code and checks its integrity, are not only performed by malware or attackers to find monitoring hooks or breakpoints. Benign software also performs such checks to protect itself against malicious hooks and breakpoints. For example, the Windows kernel is protected against changes to the kernel code, e.g., by breakpoints, using Kernel Patch Protection (KPP), also known as PatchGuard. Therefore, a VMI-based instrumentation solution must provide mechanisms to hide set INT3 breakpoint instructions from read accesses by the guest software.
In principle, breakpoint instructions can be hidden using the same three concepts described above, which are also used for breakpoint handling (repair, emulation, SLAT view switching), with the same advantages and disadvantages. In breakpoint handling, the original instruction is executed; in breakpoint hiding, the original instruction must be read. For that a read trap is set up using EPT permissions for the page in which the breakpoint is located in order to intercept a corresponding read access by the guest software. EPT permissions on the page works with page-granularity, so not only read operations on the memory location where the breakpoint is set will be trigger the trap, also all other read operations performed on the page with any hyper-breakpoint lead to an interception by the hypervisor and VMI software. There are now two ways how the VMI software could handle the intercepted read operation. Either every read operation on the page is handled as if it were a read of the breakpoint location, or the VMI software checks the read address to see if it is the breakpoint location and handles the read operation differently. Both options result in correct implementation of breakpoint hiding. The latter option may offer potential for performance optimizations.
If the breakpoint instruction is read, the guest execution trapped and the read operation must be given special treatment by the VMI software so that the original code is read instead of the breakpoint. To do this, SmartVMI uses the read emulation available in XEN and KVM via LibVMI. The hypervisor is provided with the original bytes of the patched instruction, which it uses to emulate the read operation of the guest software with the advantages of multiprocessing safety and no single-step overhead. DRAKVUF, on the other hand, does not use emulation but instead it uses SLAT View Switching (alternative guest physical to machine translation (altp2m)). Read access is handled in such a way that the memory view of the reading vCPU is first switched to the original page without the breakpoint. Then, single stepping is used to execute the one read instruction on the CPU. The single stepping leads to another VM exit and interruption by the hypervisor and the VMI software, during which the memory view is switched back to the page with the breakpoint before guest execution can continue. The method is also multiprocessing-safe, but it has the disadvantage known from altp2m that the necessary single stepping causes considerable overhead.

Table 2.
Breakpoint hiding concepts.
| Name | VMI Software | MP-safe | Single-step | Trap | Sequence |
|---|---|---|---|---|---|
| Repair Instruction | (not implemented) | no | yes | EPT read trap | repair instruction, single step read, patch instriction (INT3) |
| Read Emulation | SmartVMI | yes | no | EPT read trap | emulate read |
| SLAT View Switch | DRAKVUF | yes | yes | EPT read trap | SlatSwitch(origin), single step read, SlatSwitch(patched) |
3. Approach
This section describes our considerations and decisions about how to design the measurement study. The relevant topics are metrics, hypervisor, as well as hardware and software setup.
3.1. A Metric for Breakpoint Performance
Our main research question is as follows: How do the existing breakpoint implementations compare with respect to performance?. As noted earlier, addressing this seemingly straightforward question entails a variety of nontrivial considerations. This section discusses the relevant aspects, from which the foundations for our measurement study are derived.
What does performance mean for a breakpoint implementation? Beierlieb et al. [16] address this question in detail and identify three key aspects: the execution time required to handle a breakpoint hit, the execution time for processing a read operation at a breakpoint location, and the overhead incurred even when no breakpoint is triggered. Since the overhead is independent of the specific breakpoint implementation, it is excluded from consideration in this paper. The read-handling execution time depends on the stealth mechanism and thus on the breakpoint handling mechanism. Typically, this metric is less important than the time to handle a breakpoint hit, because reads of code regions typically only happen due to occasional code-integrity checks. Nonetheless, we include this metric in our evaluation. Thus, the remaining relevant metric is the handling time of breakpoint hits, which we regard as the most significant factor in assessing breakpoint performance. We use bpbench to measure the execution and read times.
3.2. Choosing the Hypervisor
Using the same hypervisor is a necessity to ensure that measurement results are comparable. As a type 1 hypervisor, XEN incurs more VM entries and exits during transitions from the guest to the VMI application than KVM, a type 2 hypervisor. Consequently, the same breakpoint implementation is expected to exhibit different execution times across the different hypervisors. Measuring two implementations on different hypervisors makes them incomparable because the performance influence of the approach cannot be differentiated from the influence of the hypervisor. KVM is excluded from this study, because it is not supported by DRAKVUF. However, there are more reasons to discard KVM from such measurements, at least currently. The kernel with the KVMI patchset is based on Linux 5.4.24 (released in March 2020) and might subsequently have trouble working on more modern hardware. KVMI/LibVMI also do not work perfectly with breakpoints in userspace processes. We had to rewrite the breakpoint logic to support only a single breakpoint for our preliminary measurements in the bpbench paper [16], because the interrupt event resulting from a breakpoint did not report the corresponding instruction pointer, which typically allows identification of a breakpoint. Further, only the instruction-repair implementation works on KVM, because LibVMI currently does not support instruction emulation for KVMI. On the other hand, all implementations work flawlessly on XEN, establishing it as the most suitable hypervisor for this study.
3.3. Hardware Platform Evaluation Set
The same principle applies to hardware: evaluating different implementations on different hardware platforms prevents any reliable conclusions regarding the impact of the implementation itself. Breakpoint handling requires operations such as VM exits, VM entries, system calls, context switches between processes, inter process communication, EPT view switches, and regular instructions. All operations depend on the CPU clock speed, but architectural changes between CPU generations could affect the speed of some operations regardless of the clock frequency. Thus, only measurements of different implementations conducted on the same hardware setup are directly comparable. We performed the same measurements on 20 systems with Intel Core i processors ranging from the 4th (released 2014) to the 13th generation (released 2023), spanning nine years. Section 4 provides a detailed overview.
3.4. Software Setup
We prepared a disk image (approximately 18 GB in compressed form) containing the type 1 hypervisor XEN with the control VM (Dom0) including Ubuntu 24.04.3 LTS running on Linux kernel 6.14.0-28-generic as host OS. The image is configured with the XEN hypervisor (version 4.20) in combination with the QEMU emulator as VMM (version 9.1.0). The control VM (Dom0) is a quad-core virtual machine that is pinned to the first four real processor cores (no SMT) if available. In addition to the Dom0 VM, the image includes a guest VM (DomU), which is configured as a single-core virtual machine running Windows 10 Education 22H2 (Build 19045.2006) that is pinned to the fourth real processor core (no SMT). So the fourth processor core is shared between the Dom0 VM and the DomU VM.
On Dom0 VM, a modified version of DRAKVUF is installed to support the evaluation of EPT and EPT-Fast breakpoints. For benchmarking instruction repair and instruction emulation breakpoints, we rely on SmartVMI, which is built using the NIX package available on GitHub [17]. This setup respectively loads the appropriate SmartVMI variants for each breakpoint mechanism [18,19].
The Windows VM is provisioned with the bpbench.exe binary, placed on the desktop, which serves as the central workload for executing the Hyper-Breakpoint benchmark. An overview of all software components used in this environment is provided in Table 3.
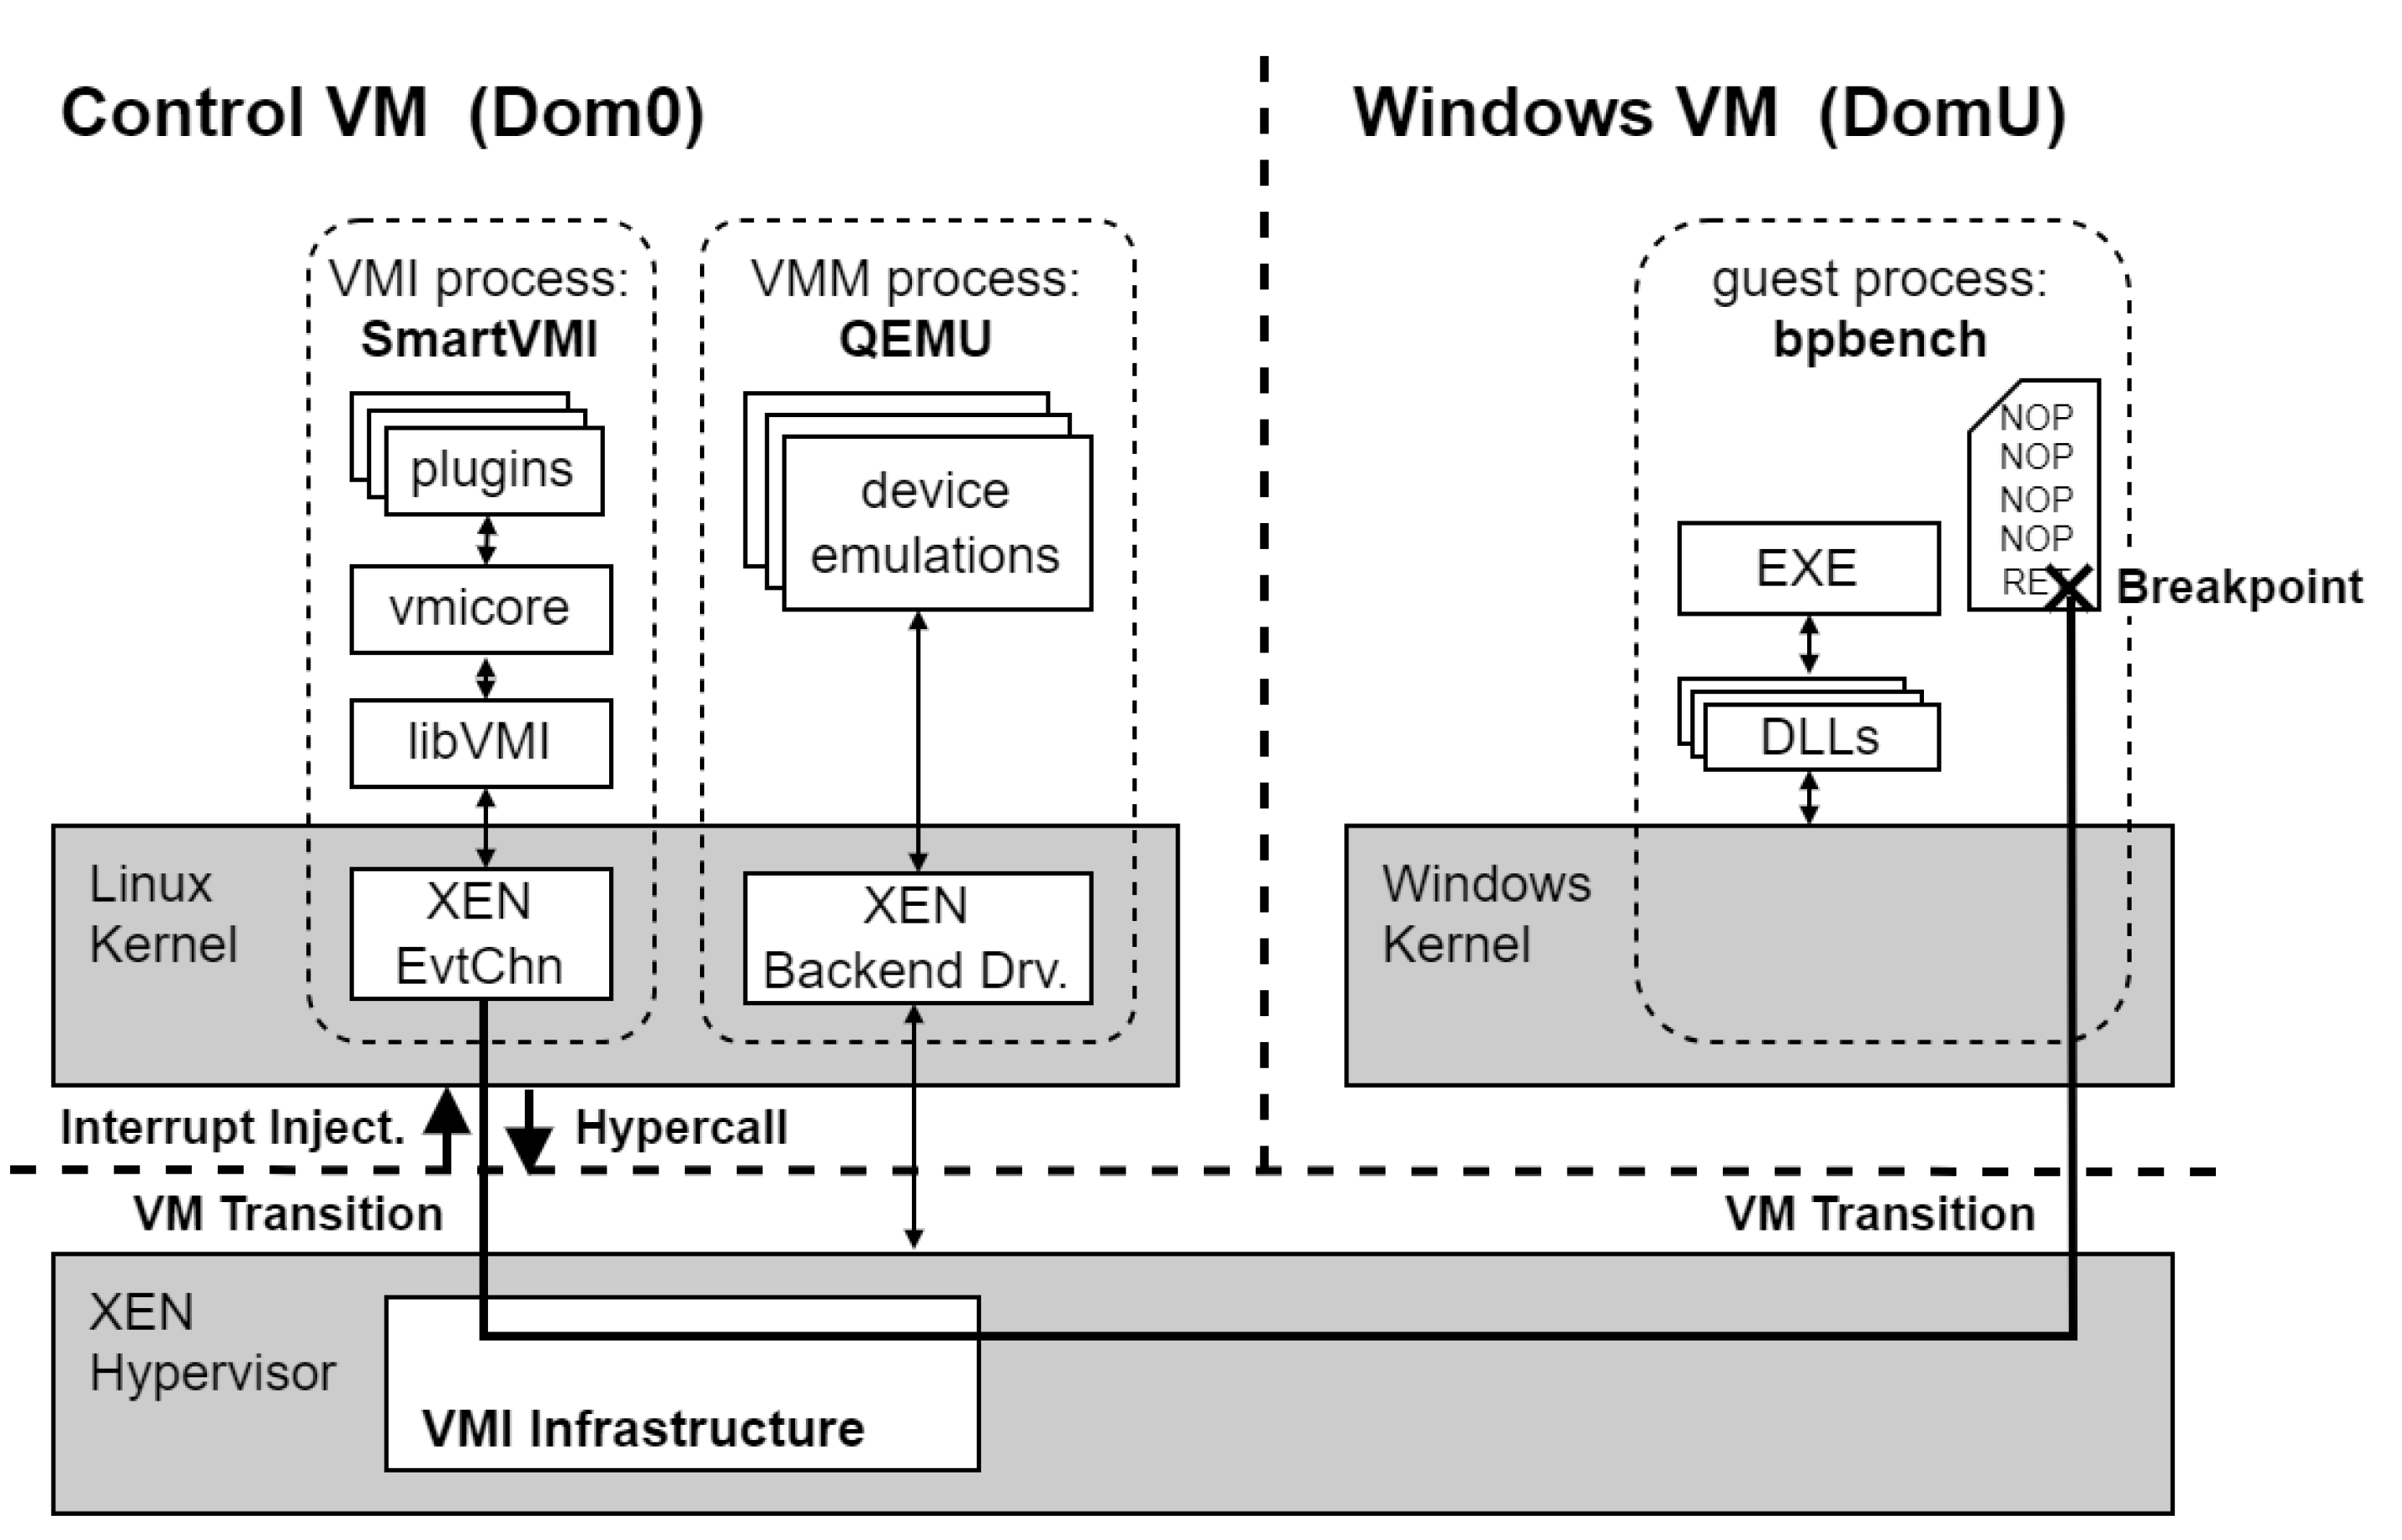
Figure 1.
Software architecture for the benchmark using SmartVMI as an example.
3.5. The bpbench Benchmark Tool
Our benchmatk tool bpbench allocates a new page-aligned memory region in user space, sized at one page (4 KiB) with read, write and execute permissions. Then, it fills the whole page with a sequence of NOP instructions. The last byte of the memory region is written to with a RET instruction. The hyper breakpoint should be set on this return instruction. To do that, bpbench reports its process ID and the virtual address where the hyper breakpoint should be placed to the user and waits for confirmation from the user.
The user communicates the information on the breakpoint location to the MOCK-Breakpoint plugins of SmartVMI and DRAKVUF developed for this experiment. The VMI plugins install the hyper breakpoint (code breakpoint via INT3) in the address space of the bpbench process at the specified location. To handle the breakpoint event by the VMI software, both plugins register an empty callback function. The breakpoint handling mechanism is not the responsibility of the plugin and is handled by code in the core logic of the SmartVMI/DRAKVUF framework or in the LibVMI library. The breakpoint handling sequence is performed by the VMI software after returning from the empty callback function. To investigate and measure the various breakpoint handling methods for this experiment, we perform several measurement runs with bpbench, configuring DRAKVUF differently and loading different versions of SmartVMI. We use our own versions of both DRAKVUF and SmartVMI, which contain changes to support the various breakpoint handling methods and are extended with our plugins.
After the VMI software has installed the breakpoint trap, the user starts the benchmark process in bpbench. The various workloads are applied to the selected breakpoint handling configuration one after the other. Depending on the workload, either the return instruction (RET) with the breakpoint or the first NOP instruction of the written will be jumped directly by a CALL instruction. This triggers the hyper breakpoint to be measured. Before and after execution of the CALL instruction, a timestamp is determined via the Windows API using the QueryPerformanceCounter function. The process is repeated 200’000 times, with each individual time span being logged.
For stealth-related workloads, bpbench does not perform a jump into the page, instead, the page is read, which should trigger the breakpoint hiding mechanism, where the read operation will be handled in special by the VMI software. To do this, related to the two workloads the RET instruction on the one hand and the entire page on the other hand are read each 200,000 times with measurement and logging the execution time of the read operation.
In order to have a reference for the accuracy of our time source, we also determine the time required to query the timestamp via the Windows API function QueryPerformanceCounter and report this value as a reference in all our measurement results.
3.6. Configurations to Improve Measurement Accuracy
This subsection describes four configuration aspects intended to improve measurement accuracy and avoid side effects.
3.6.1. Focus on Process Priority
A breakpoint event is signaled by an injected interrupt from the XEN hypervisor into the control VM (Dom0) and the resulting wake-up of the DRAKVUF/SmartVMI thread by the interrupt handler of the XEN event system driver within Dom0. Between this wake up of the thread and its dispatch with continuation of execution, other threads of the Ubuntu system within the Dom0 can be dispatched and executed. To minimize such delays in breakpoint handling, the threads of the VMM process (QEMU) and the VMI software (DRAKVUF/SmartVMI) should be executed with higher priority. This gives them precedence over other threads in the Dom0 during the dispatch procedure. To ensure this, we start QEMU for the Windows VM with a nice value of -5 and DRAKVUF and SmartVMI with a nice value of -10, which increases the process priority by 5 and 10, respectively.
3.6.2. CPU Pinning
To ensure that there is always a free CPU core available for running the Windows VM and our VMI software, we configure the CPU affinity for processes in Dom0 and the allocation of vCPUs from Dom0 and DomU to the real CPU cores. The first 4 real CPU cores are assigned to the vCPUs of the control VM for this purpose. The Windows VM vCPU is pinned to the 4th real CPU core, resulting in shared use between Dom0 and DomU. The VMM process (QEMU) within Dom0 is also pinned to the fourth CPU core. This configuration is beneficial because the execution related to a VM per vCPU or per VM thread can be run either in the VM or out of the VM in the VMM process. At the same time, data that can be used by both the guest and the VMM can be located in the cache of the same CPU which increases performance. The same principle applies to TLB entries and other CPU-local resources. Although it would be reasonable to assume that the VMI software should also be executed on the fourth core, we have determined that we get the best performance when SmartVMI and DRAKVUF will be assigned the second core. That is why we are also using this CPU affinity configuration with the VMI software on the second core for the experiment. All other system processes and threads that could be assigned were assigned to the remaining cores so that the cores for the VM, VMM and VMI are kept free.
3.6.3. Disabling SMT
To ensure that only true physical cores were used, Simultaneous Multithreading (SMT) — commonly known as Hyper-Threading on Intel x86 architectures — was disabled through the firmware settings. On newer Intel Core i processors of the 12th and 13th generations, which feature two types of CPU cores, the slower efficiency cores were also disabled via firmware configuration, leaving only the first four performance cores for the experiment.
3.6.4. Fix CPU Clock Speed
An important aspect for accurate measurements is that the speed of the CPU cores involved in the experiment does not change while the measurement is running. To ensure this, all processors in our evaluation hardware were configured to operate continuously at their model-specific base clock frequency. We used the firmware settings to disable all CPU features that increase the speed above the base clock speed (Turbo Boost) or decrease it below the base clock speed (SpeedStep, energy-saving modes, etc.). In cases where the firmware did not provide the appropriate settings, we attempted to set the clock frequency to the base clock level (P0 without Turbo, P3 with Turbo) using the configuration parameters of the XEN hypervisor.
3.7. Workloads
We identify the following four specialized workloads, each focusing on a different aspect of the measured breakpoint handling and hiding implementations, and, when their results are put together, can provide a full overview of the overhead the different breakpoint handling and hiding implementations cause. The first two workloads, WL1 and WL2, focus on the execution of the breakpoint and its handling. The last two workloads, WL3 and WL4, are related to measuring the breakpoint hiding methods by reading data from the page where the breakpoint is placed.
- WL1: Execute the breakpoint. This workload is supposed to measure how long it takes the whole VMI stack to handle a breakpoint. There are a multitude of factors that comprise this latency: VM transitions (exits and entries), processing in the hypervisor, communication between the hypervisor and the VMI application, processing in the VMI application.
- WL2: Execute the page with the breakpoint. Techniques such as altp2m make changes to the EPT configuration of individual vCPUs, which could also impact caching and TLB performance. If it has an impact on performance, this may be noticeable when other instructions are executed on the same page where the breakpoint is located. The previous workload does not reflect that, so this one is supposed to measure the latency of executing the breakpoint as well as additional instructions (NOP) that are located on the same page.
Table 4.
Workloads: Breakpoint execution.
| Breakpoint handling method | VMI software | WL1: execute breakpoint | WL2: execute page with breakpoint |
|---|---|---|---|
| Instr_Repair | SmartVMI | exec_bp_rep | exec_page_rep |
| Instr_Emulation | SmartVMI | exec_bp_emul | exec_page_emul |
| Altp2m | DRAKVUF | exec_bp_altp2m | exec_page_altp2m |
| Altp2m_FSS | DRAKVUF | exec_bp_altp2m_fss | exec_page_altp2m_fss |
- WL3: Reading the breakpoint. The stealth-related breakpoint hiding methods using EPT permissions to realize the read trap on the page where the breakpoint is located cause overhead for the same reasons as mentioned in WL1. This workload is designed to quantify this latency by reading from the exact same memory location where the breakpoint is placed.
- WL4: Reading the page with the breakpoint. The used read trap based on EPT permissions has page-granularity. This trap not only intercepts and handles the read operation at the address where the breakpoint is located, but it also triggers for every other read operation on the page. This workload reflect this fact and perform multiple read operation on all bytes of the whole page where the breakpoint is located. The statement that code pages are practically hardly ever read is not true in every case. There is a real use case for this workload, because code integrity checks, such as those performed by KPP / PathGuard, involve reading entire code pages.
Table 5.
Workloads: Reading page with hidden breakpoint.
| Breakpoint hiding method | VMI software | WL3: read breakpoint | WL4: read page with breakpoint |
|---|---|---|---|
| Read_Emulation | SmartVMI | read_bp_emul | read_page_emul |
| Altp2m | DRAKVUF | read_bp_altp2m | read_page_altp2m |
4. Hardware Platforms
In this section, we describe the hardware platforms utilized for the Hyper-Breakpoint benchmark. Our selection encompasses Intel Core processors from the fourth generation onward, with the exception of the fifth generation, for which no representative CPU was available. To capture a broader performance spectrum, we also include comparatively weak devices, such as the Intel Core i3-6100 and the Intel Core i5-7300U, both limited to two cores. The complete set of devices employed in the experiments is summarized in Table 6.
For all systems, we attempted to establish stable operating conditions for the processor by adjusting the firmware settings. As far as the corresponding CPU features were available on the devices and the UEFI firmware setup allowed them to be disabled, the following functions were disabled:
- all Efficient-cores (on processors with performance and efficient cores)
- Simultaneous Multithreading (SMT) aka Intel Hyperthreading (Intel HT)
- Intel SpeedStep
- Intel SpeedShift
- Intel Turbo Boost Mode
- CPU Power Management
- CPU Power Saving Mode (C-states)
The firmware setup did not provide the settings to disable the aforementioned features on all systems. On systems that had no corresponding settings options, the features remained enabled. Table 7 provides an overview of which features could be disabled on which systems. In one case (ThinkPad T14 Gen3), SpeedStep was intentionally kept enabled (ENABLED), because of operational issues with disabled SpeedStep. There were two other cases where SpeedStep could not be disabled, but instead a performance policy could be set via the firmware setup. In these cases, the processor performance was set to maximum (max perf.).
4.1. Special Cases
-
Intel NUC7i5DNHE (7th gen i5 7300U)
- -
- Processor model has only two cores (0,1)
- -
- We chose to run system threads on core 0 and the VM, VMM process and VMI software on core 1.
- -
- The system has only 8GB main memory. We had to configure both VMs down to give 4GB to the control VM (Dom0) and 3.6GB to the Windows VM (Domu).
-
Fujitsu ESPRIMO D757 (6th gen i3 6100)
- -
- Processor model has only two cores (0,1)
- -
- Similar pinning/memory management as the previous device
-
Lenovo ThinkPad L14 Gen3 (12th gen i7 1265U)
- -
- Processor model has only two performance cores (0,1) and 8 efficient cores (2,3,4,5,6,7,8,9).
- -
- Control VM (dom0) was running on CPU 0,1,2,3 (two performance cores, two efficient cores).
- -
- SmartVMI and DRAKVUF were running on CPU 1 (performance core).
- -
- Windows VM with bpbech and VMM were running on CPU 2 (efficiency core).
- -
- All other system processes were pinned to CPU 0,1,3.
-
InfinityBook Pro Gen8 (13th gen i7 13700H)
- -
- Hyperthreading (SMT) could not be disabled via firmware setup.
- -
- We enforced that only one logical CPU of each HT core was used by assigning only the first logical CPU of each core to the VMs via XEN config, with the effect that Hyperthreading was not used.
4.2. XEN Performance Adjustments
Since it could not be ensured via the firmware settings that all processor models would use their base clock speed consistent (SpeedStep and Power Management disabled), an attempt was made to set the clock speed to the base clock speed via the performance settings of the XEN hypervisor to prevent any form of dynamic clock speed adjustments. This worked for most models where the firmware setup approach failed. Details can be found in Table 8.
5. Measurements
As described in the previous section, the time measurements for the four breakpoint handling methods and two breakpoint hiding mechanisms were performed with the four workloads on all 20 systems.
5.1. Initial Analysis and Filtering
Here is a box plot showing the execution times of the SLAT View switching method for both breakpoint handling (breakpoint execution) and breakpoint hiding (breakpoint reading) as measured on the ThinkPad X390 (i7 8665U) system. The plot is an example. Corresponding plots also exist for all other methods and systems (measurement results are publicly available in a raw and aggregated variant as well as plots at https://github.com/lbeierlieb/bpbench_measurement_study/tree/f441dfda25e4ee7ef07c122fa3efa15fa1eabfab/plots/individual).
Figure 2.
The Measurement Results for the altp2m_fss Methods on ThinkPad X390 (i7 8665U).
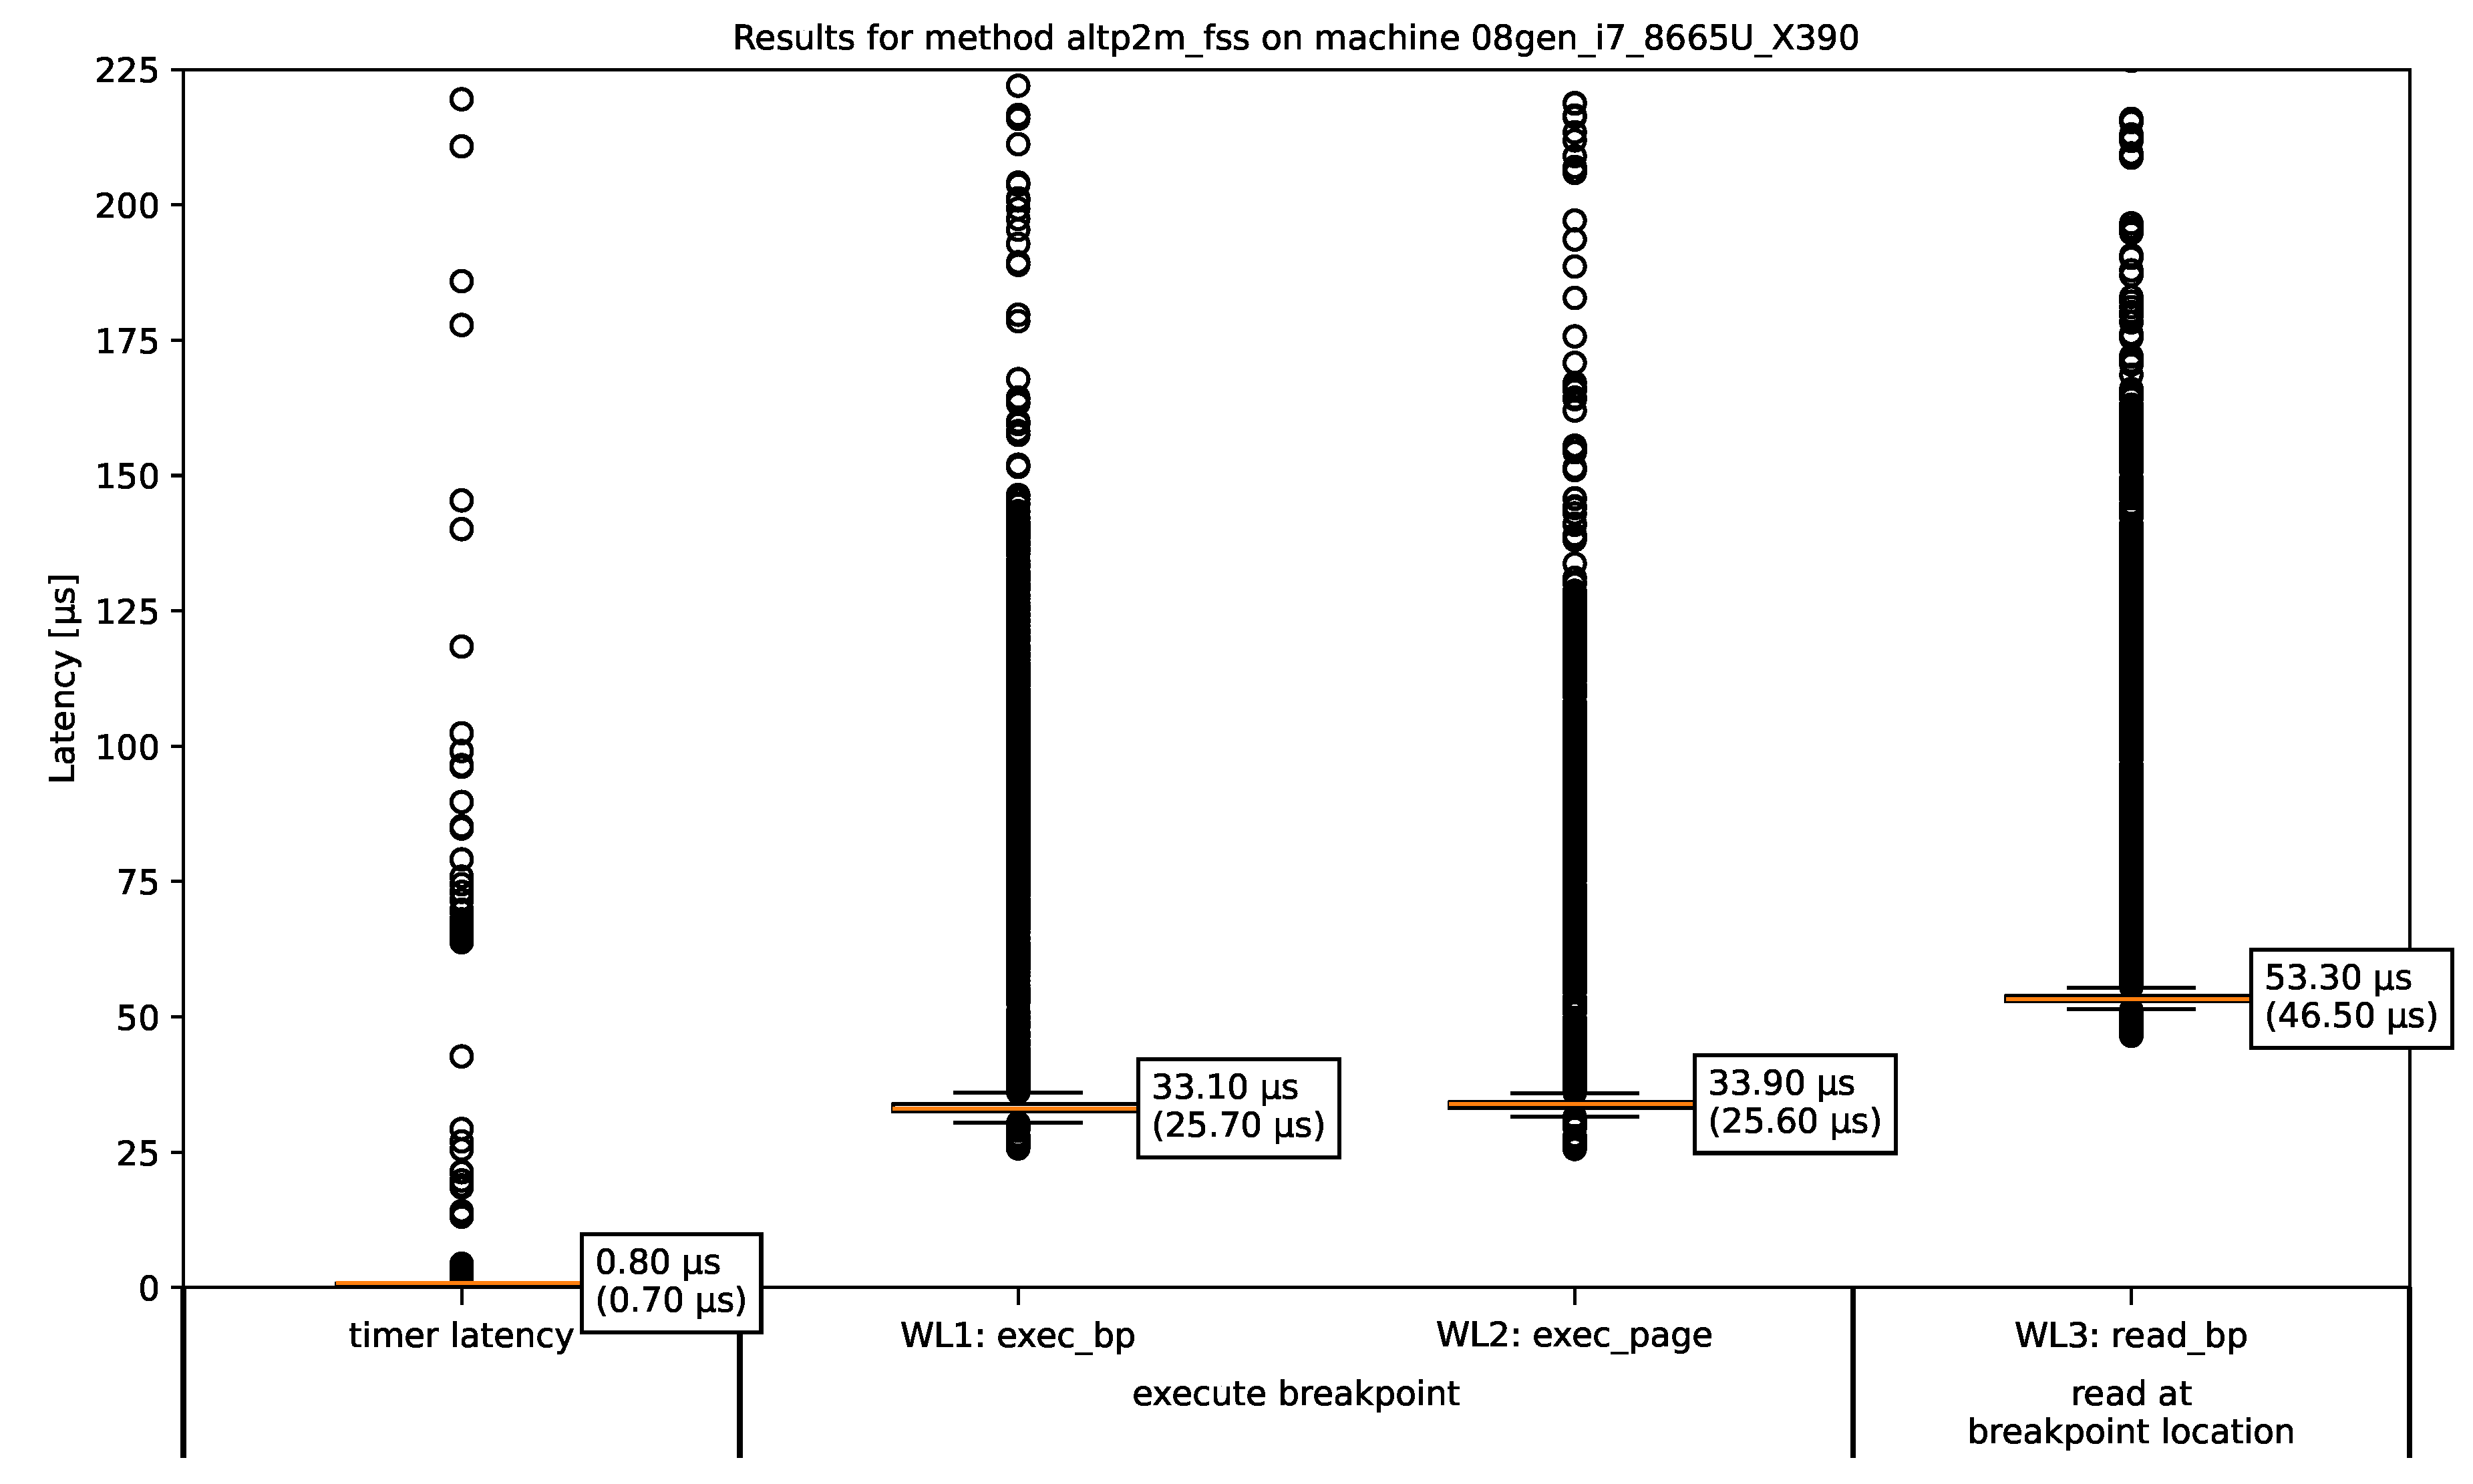
The figure shows a boxplot of the measured latencies of the two breakpoint–execution-related workloads WL1 (column 2) and WL2 (column 3) and the stealth-related workload WL3 (column 4). Workload WL4 aiming at the “read a while page with a breakpoint” metric is not plotted, because 4096 VMI-intercepted one byte read operations to read the whole read-protected page lead to much longer times than the other measured workloads, so that the time are in range of milliseconds. Due to the scaling, they can not be meaningfully displayed in this kind of plot. Column 1 provides reference information regarding the accuracy of the time source used. The values indicate how much time is required to query the timestamp. The bounds of the boxes show the InterQuartile Range (IQR), which encloses the middle 50% of the measured values. Inside every box an orange line represents the median item, whose value is also noted right to the line. The “whiskers” (shorter horizontal lines below and above of the orange one) extend from the boxes to the smallest and largest values within 1.5 times the IQR. Any values outside of this range are considered outliers and plotted individually as a circle. In all the shown boxplots, there are outliers that are not displayed because they are many orders of magnitudes too large for plots’ scaling. They occur as results from measurements during which interrupts or context switches inside the Windows VM pausing bpbench’s execution. However, all measurements with all outliers included are used to calculate the IQR and median value. The median value and minimum value (in brackets) of the respective measurement series are shown next to each box of the boxplot. The minimum value is the lowest time that was measured and thus represents the technical limit of each method that can reached in the best case.
Across all measurements we can see that the timer overhead (column 1) is usually very low. Its in the range of 0.5µs to 2.5µs for all regular runs on standard CPU cores or performance cores. On the exceptional candidate ThinkPad L14 (i7 1265U) the values are a little bit higher, because the Wndows VM must run on an efficiency core, because not enough performance cores exists. The timing overhead will be measured again on every bpbench run for every method. The timer overhead values of the two DRAKVUF runs (altp2m, altp2m_fss) and the two SmartVMI runs (instr_rep, instr_emul) are always very close together. However, there are differences between the timer overhead of the SmartVMI runs and the DRAKVUF runs. Thus we can only merge the values measured in runs with the same VMI application, so that we get one timer latency results for each VMI application on each system.
Furthermore, we can see across all measurement results that workload WL2 aiming at “execution a page with a breakpoint” metric shows always approximately the same values than workload WL1 (executing the breakpoint) for all four breakpoint handling variants. WL2 is the same than WL1 plus the execution of 4095 NOP instructions. Therefore, we will discard the metric in future plots.
5.2. Comparison of the Breakpoint Methods
The values of the individual measurements from the various methods for every machine were aggregated with a little filtering to produce a common result plot for each machine. Now, we take a look at the corresponding result plot for the ThinkPad X390 (i7 8665U) machine as an example. All aggregated benchmark results for each machine are publicly available at https://github.com/lbeierlieb/bpbench_measurement_study/tree/f441dfda25e4ee7ef07c122fa3efa15fa1eabfab/plots/machines.
Figure 3.
The Summarized Measurement Results for ThinkPad X390 (i7 8665U).
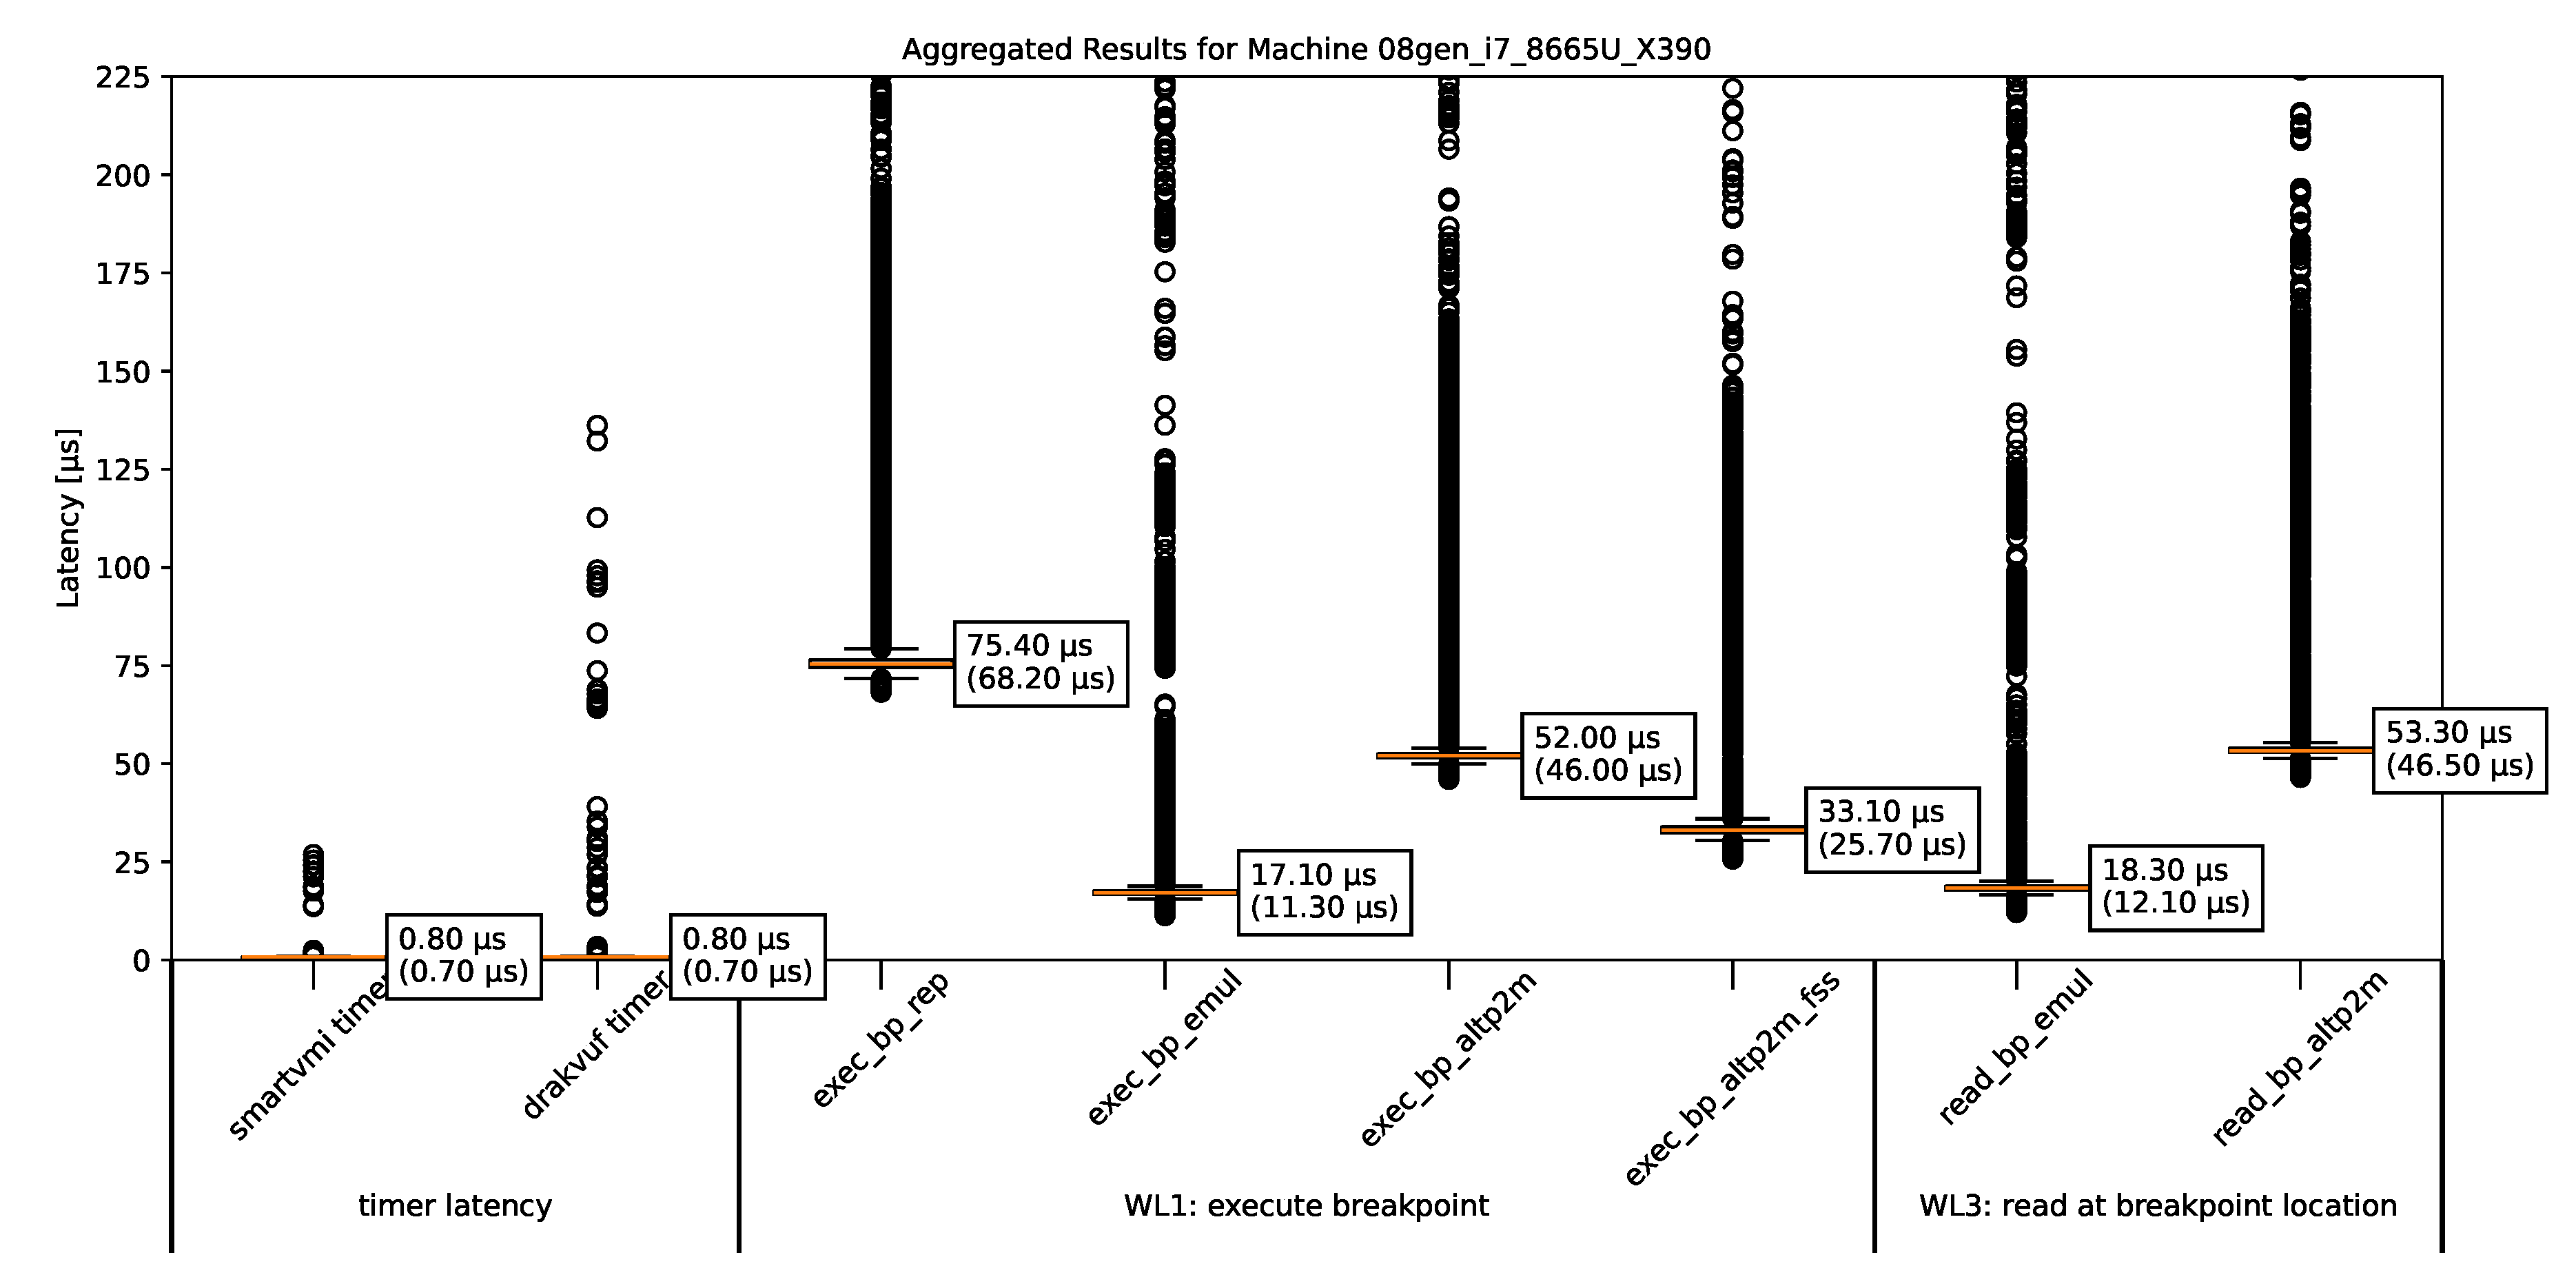
The timer latencies were determined during each run of bpbench for each method. They are all very low and similar across all platforms, and therefore are not shown separately. Instead, we have combined them into a common timer latency time set.
Each time bpbench is run, all four workloads are executed. This results in four measurement results for breakpoint hiding mechanisms (WL3, WL4) on each machine using the tested methods. However, since there are only two breakpoint hiding mechanisms in our experiments with the selected VMI software, certain methods appear twice. We present only the read_bp_altp2m, since DRAKVUF with and without fast-singlestep mode produces essentially equivalent values, bcause fast-singlestep is not implemented for breakpoint hiding, so every time it is the same method read_bp_altp2m. Similarly, only read_bp_emul is shown, because this is the only breakpoint hiding method that is implemented in SmartVMI. A breakpoint hiding mechanism using instruction repair does not exist.
We can see:
- Breakpoint handling mechanism using SLAT view switching (exec_bp_altp2m, exec_page_altp2m) incurs the same tempral costs than the SLAT view switching based breakpoint hiding method (read_bp_altp2m, read_page_altp2m). This makes sense because both based on the same approach and operations (EPT switch, single-step execution, EPT switch back).
- The fast single-step extension (FSS) XEN provides makes the breakpoint handling quite a bit faster. We may be able to estimate the costs of switching from XEN to DRAKVUF and back again by comparing the measurement results from exec_bp_altp2m and exec_bp_altp2m_fss, because it is precisely this switch that is made unnecessary by the FSS optimization. The FSS option in DRAKVUF only optimizes the breakpoint handling, for the stealth-related mechanism of read operation trapping FSS will not be used. So the measurements of read_bp_altp2m show the same results regardless of whether FSS is enabled.
- The instruction repair method (exec_bp_rep) is quite a bit slower than the SLAT view switching variant (exec_bp_altp2m). This is in line with our expectations, because the repair mechanism has the same number of transitions as the SLAT view switching approach, but instead of the VMCS manipulation, a writing to guest memory will be performed, which apparently is a more expensive operation.
- The emulation of the origin instruction as a breakpoint handling method (exec_bp_emul) has roughly the same speed as the stealth-related read emulation (read_bp_emul) in all measurements on all machines, which seems reasonable.
5.3. SmartVMI Anomalies
But before we go to compare hardware platforms, we have to investigate some anomalies.
Figure 4.
The summarized measurement results for ThinkPad T14 (i5 10310U).
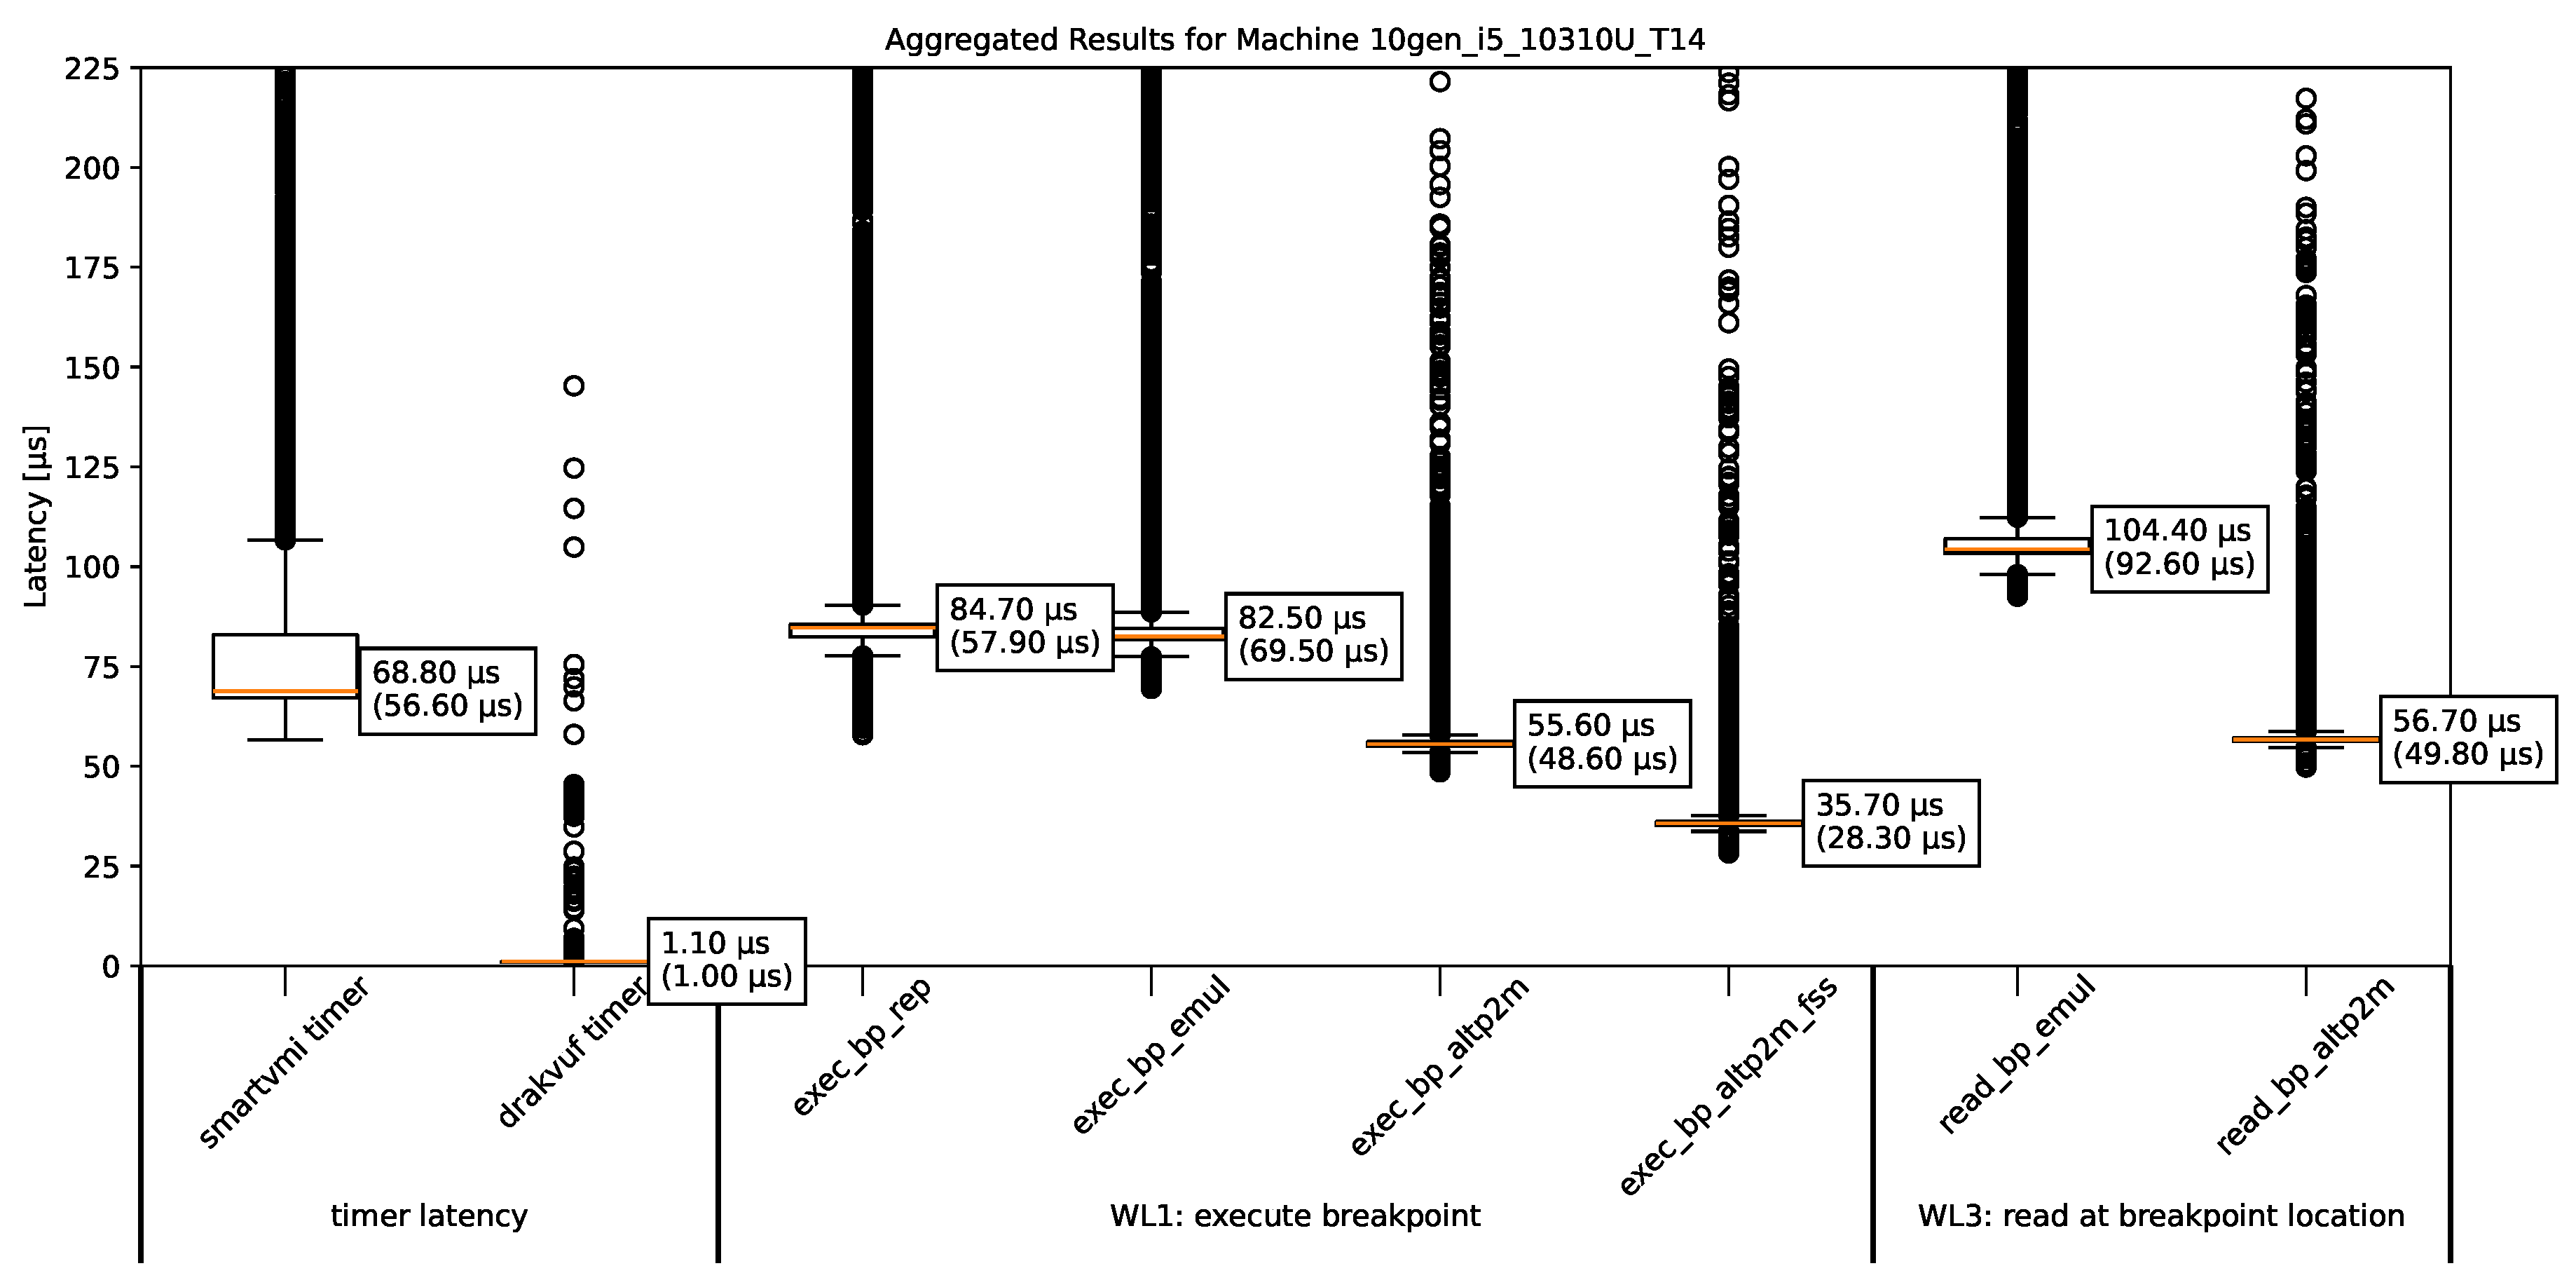
We can see that the timer latency with SmartVMI is very high, even the lowest measurement is roughly equal to the median of the SLAT view switching breakpoint handling methods (altp2m). Although there is no breakpoint that could trigger involved in determining the timer latency. SmartVMI also registers handlers for CR3 writes (context switches) to disable process-specific breakpoints for inactive processes. We can only assume that this causes the problem. The measurments of the SmartVMI-based breakpoint handling methods are then also very different than on the runs with normal timer latencies, so we have to discard these measurements because we do not know how much of the time is spent on breakpoint handling and how much on the requests of timestamps before and after workload execution. Mostly affected are older processor models and models with less performance like i5 and i3 series, but the Intel Core i7 9750H certainly does not fall into those categories.
5.4. Measurements on All Hardware Platforms
To find out how different processor models influence the measurement results, we summarize the results from the individual measurements for each machine in an aggregated form. The aim here is not to compare the different hardware platforms with each other. Instead, the aim is to determine whether the pattern of the method comparison remains the same across different systems or changes visibly.
As described in Section 5.3, a few runs of SmartVMI showed very high timer latencies, so that the results were unusable. Such SmartVMI results are excluded whenever the timer latency appeared suspicious.
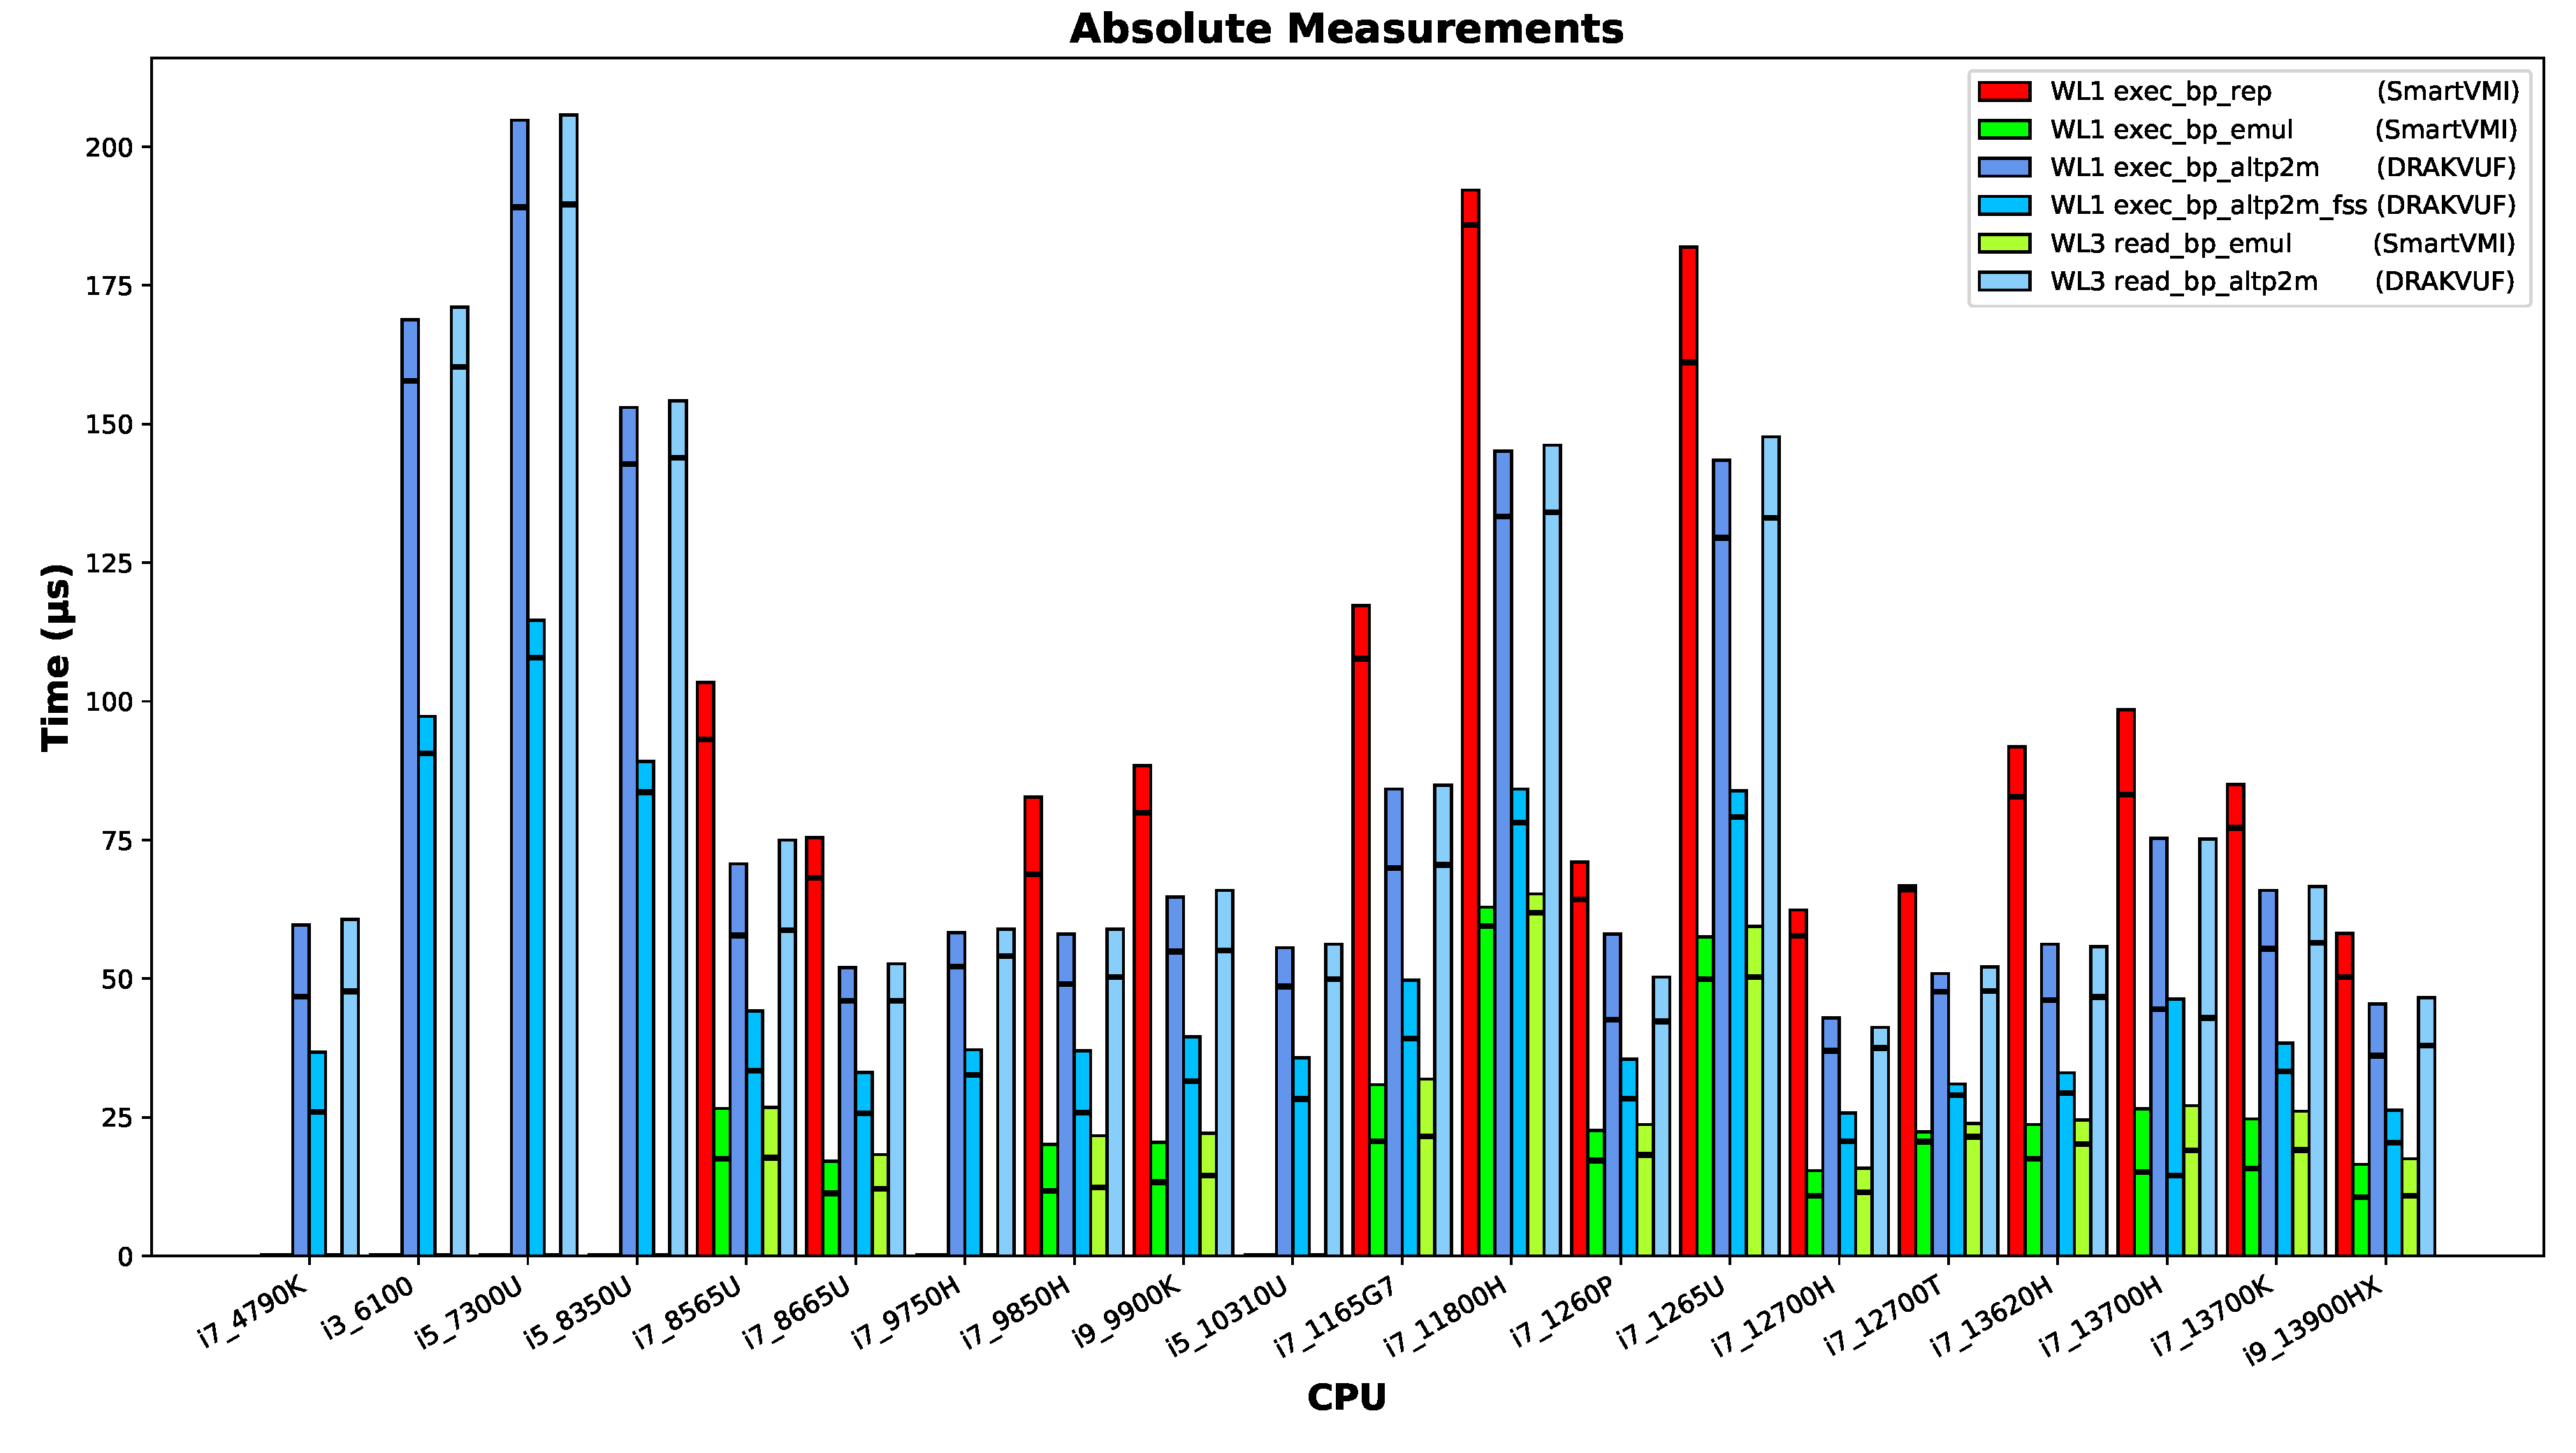
The measurement results presented are absolute/raw values of the measured temporal periods.
The height of each bar indicates the median value of all measurement points of a workload run. The horizontal black line within each bar provides the minimum measured time as a technical limit value for each measurement.
Figure 5.
The measurement results of the different machines.
Since the exec_bp_emul mechanism was the fastest in all experiments on all machines, it can be used as a baseline for normalizing the time measurements of all methods. However, this requires removing all machines from the dataset for which no valid measurements are available for the exec_bp_emul method, because of suspicious timer latencies discussed in Section 5.3.
Figure 6.
The measurement results of the different machines normalized against exec_bp_emul.
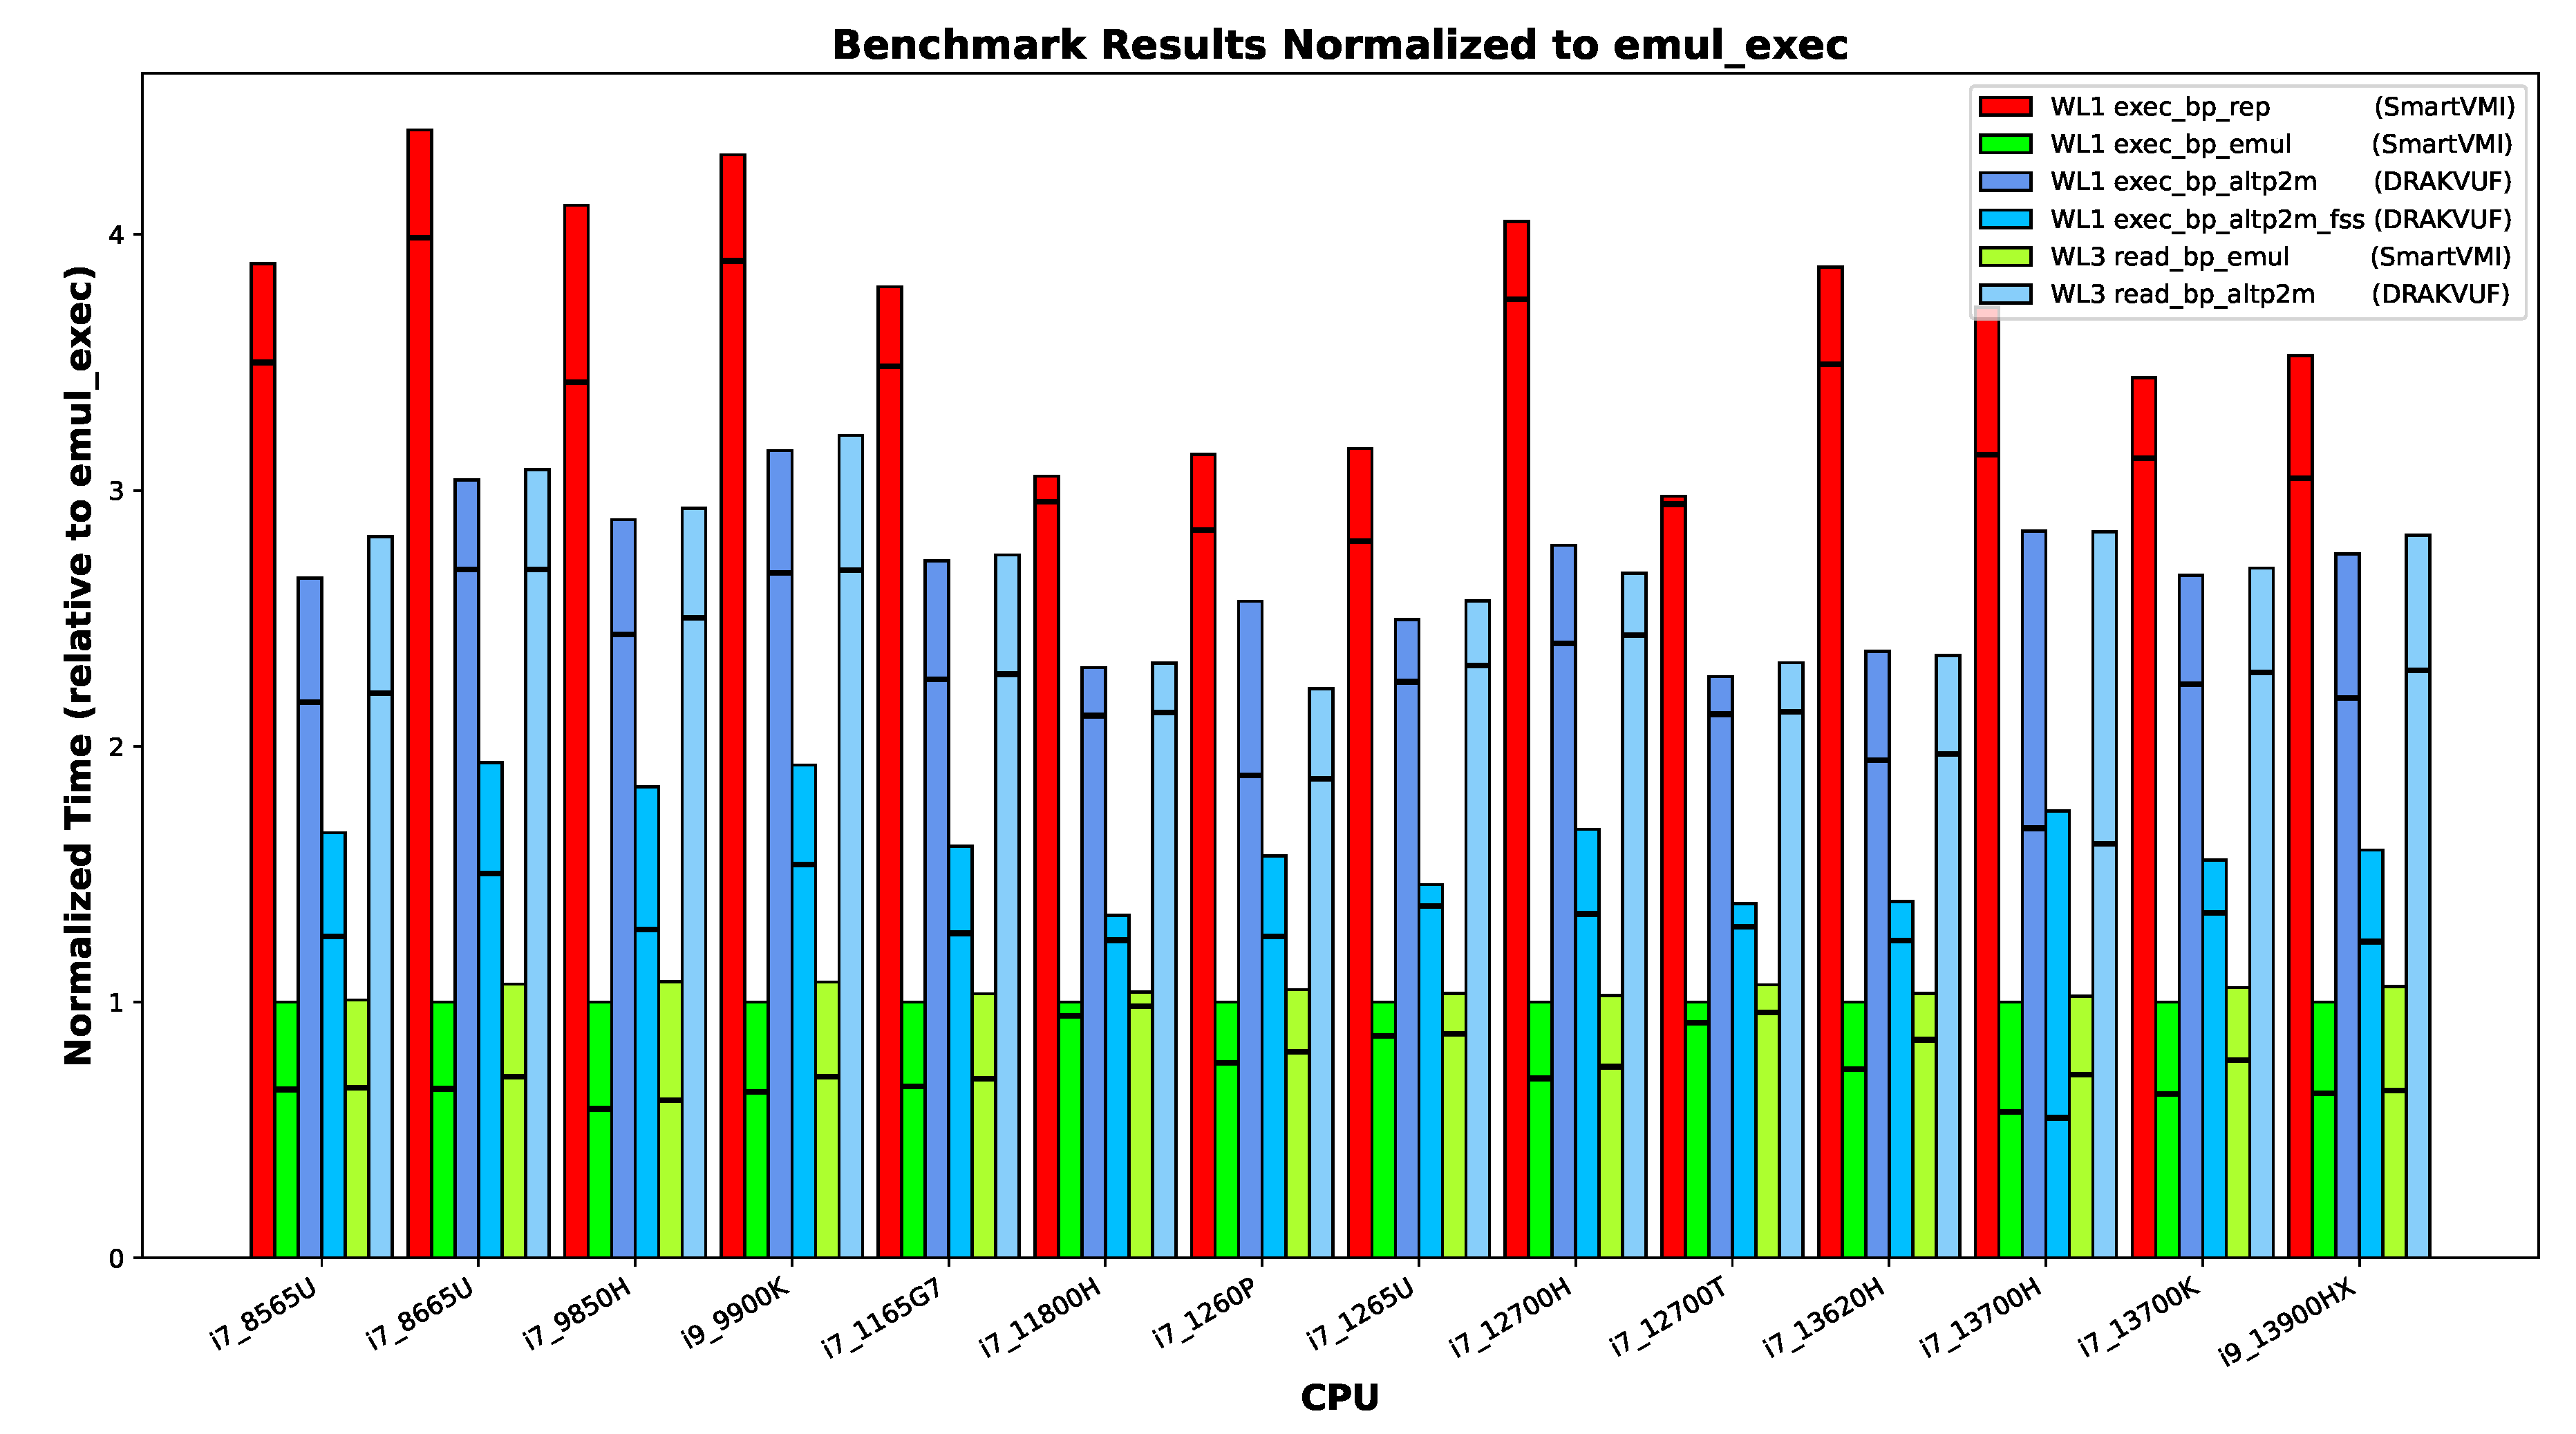
Turning to common patterns across systems, we can confidently state that instruction emulation incurs lower overhead than SLAT view switching (altp2m) because of the missing single-stepping overhead. The two SLAT view switching variants with and without fast-singlestep (altp2m vs. altp2m_fss) acceleration are both slower than emulation. However, in any case, with fast-singlestep mode (FSS) enabled the procedure is faster than without it. The instruction repair mechanism consistently shows the highest temporal overhead. These relative differences are remarkably consistent across all tested platforms.
However, the exceptions among the machines are also clearly visible in the diagram. Both the Intel Core i3-6100U and Intel Core i5-7300U processors exhibit relatively slow performance. These CPUs each have only two cores, which prevents us from applying the default pinning scheme (core 1 for VMI software, and core 3 for the VM and VMM process, and all other system threads on core 0 and 2). On other machines, we observed performance degradation when the VM and VMI software were pinned to the same core. The Intel Core i7-1265U processor runs the VM on an efficiency core, which explains its comparatively lower speed as expected. For the Intel Core i7-11800H, however, the cause of its performance behavior remains unclear; since it was connected to external power during measurement, battery power management can be ruled out.
5.5. Does Hardware Advancement Have an Effect?
We aimed to investigate whether advancements in processor architecture have led to improvements in the performance of breakpoint-handling and -hiding methods, and whether these developments result in changes to the observed outcomes.
However, making direct comparisons proves challenging in many cases, as laptops typically employ aggressive speed-stepping techniques and often operate at reduced frequencies. Additionally, disabling Intel TurboBoost functionality appears to be rarely supported on newer models. Furthermore, querying the actual CPU frequency using standard Linux tools is not easy feasible in our setup, since we run our VMI tools within the control VM Dom0 and our measurement tool inside an other VM and we can only observe virtual CPU information that does not reflect true hardware frequencies. For these reasons, we limit our comparison to a small subset of processors for which we can ensure comparability. Specifically, we select the Intel Core i7-4790K and Intel Core i7-13700K as representative examples; both systems have TurboBoost disabled and operate at fixed frequencies of 4 GHz and 3.4 GHz, respectively. Intel certainly improved the CPU architecture in regards to computational performance. The 13th gen processor more than makes up for the clock speed deficit, probably with a combination of higher Inter-Process Communication (IPC) and better branch prediction, achieving a single-core sysbench score of 2921, while the 4th gen processor achieved only 1292 points. However, the speed-ups do not carry over to breakpoint-handling performance.
Figure 7 shows the same measurements for the two processors as Figure 5, but the results are easier to visually compare here. Additionally, we added bars on the right that show the times of the 4790K as if the CPU would run at 3.4 GHz (assuming the performance scales linearly). The 4790K slightly outperforms the 13700K in the EPT–switching-based workloads. Comparing the 13700K and slower-scaled 4790K, then the 13700K is faster, at least in the median results.
From these measurements and calculations, we cannot conclude whether there are architectural speed-ups when it comes to the crucial operations VM context switches, EPT table switch, single-stepping. If there are speed-ups, they are only marginal, especially compared to the increase in compute performance.
6. Related Work
Related work can be classified into three different categories, (i) papers related directly to our work on the different techniques for (hyper-) breakpoint mechanisms and their performance, (ii) papers presenting security implementations where hyper breakpoints are utilized to collect data about a guest system, and (iii) are papers with architectural proposals for designing hyper-breakpoints in the CPU.
In our previous work [16] we presented the existing implementations for hyper-breakpoints, discussing their strengths, limitations and trade-offs. Furthermore, we proposed and implemented a benchmark for x86_64 breakpoints, which is suitable for measuring the execution performance of a VMI-based breakpoint implementations. This paper differs from our earlier work mainly because now we are able to benchmark and compare all breakpoint implementations, whereas previously only Instruction Emulation breakpoints could be tested on a single evaluation system with an Intel Core i5 7300U. While the present study provides a comparative benchmark of breakpoint handling across different Intel Core CPU generations.
Wahbe emphasizes in his work [20] the difference between data hardware- and software breakpoint implementations. He elaborates that hardware breakpoints can indeed deliver the best performance; nevertheless, they are more expensive to provide and support a very limited number of concurrent breakpoints. Software approaches, on the other hand, patch the debuggee’s code or insert checks at relevant write instructions. These are easier to deploy and scale to arbitrary numbers of breakpoints, but they incur higher runtime overhead and can perturb the program’s behavior. Wahbe also discusses a third category, using the virtual memory system to monitor writes, which strikes a balance between the two previous approaches but depends heavily on operating system support.
Wahbe et al. expands his work in [21] by presenting the design and implementation for new practical data breakpoints that improve the feasibility of software-based implementations. In particular, he introduces compiler optimizations and efficient run data structures, such as segmented bitmaps, to reduce the overhead of checking monitored memory locations. This approach makes data breakpoints more scalable and portable than hardware solutions, which achieving acceptable performance for interactive debugging.
Dangl et al. introduce RapidVMI to address multi-core and shared memory issues in active VMI. Their system presented in [8] implements process-bound and core-selective introspection by leveraging XEN’s alternative EPT mappings (altp2m). Breakpoints or injected code are mapped to shadow pages that apply only to a specific process or core to prevent unintended side effects across shared libraries or concurrent threads.
Spider Framework [22] emphasizes the importance of stealthiness during malware execution and that is why they introduces the concept of invisible breakpoints using VMI. In particular, it leverages EPT to maintain separate read and execute views of the code pages. The guest therefore sees unmodified instructions, while the hypervisor executes patched pages containing breakpoints. Once a breakpoint is hit, a VM exit is triggered and handled externally.
HyperDbg [23] is a modern hypervisor-assisted malware debugger that integrates breakpoint handling directly into its custom VMX-Root hypervisor. It uses EPT hidden hooks that avoid patching code directly, making breakpoints faster and stealthier than traditional INT3. HpyerDbg implements classic EPT hooks implemented by injecting a #BP (0xCC) to the target VM memory, as well as the Detours-Style hooks which redirect control flow with a jump to the patched instruction and then resumes normal execution after the callback.
Finally, Price proposes an architectural extension of Memory Management Unit (MMU) to overcome the inherent flaws of the existing breakpoints [24]. The paper identifies three core issues: (*) corruption of program bytes due to INT3 patching (”critical byte problem”), (**) detectability of both software patching and limited hardware debug registers, (***) inefficiency of fallbacks such as single-stepping or emulation. The solution is a buddy-frame mechanism, where each page table entry can reference a companion frame containing per-byte breakpoint metadata (read/write/execute flags). When the breakpoint bit is set in a page table entry, the MMU consults this buddy frame during instruction fetch or memory access, raising a trap if a breakpoint condition matches. This design removes the need to patch code, provides effectively unlimited and invisible breakpoints, and ensures robust and efficient debugging directly at the hardware level.
7. Conclusion
This section concludes this paper. In SubSection 7.1, we summarize the main takeaways from the paper, before we give an outlook into planned and potential future work in SubSection 7.2.
7.1. Summary and Discussion
In this work, we presented a measurement study that compares approaches of handling and hiding VMI breakpoints. We built a portable OS image containing Ubuntu, XEN, DRAKVUF, SmartVMI, and a Windows 10 VM with bpbench. On a range of devices with various Intel Core i CPUs ranging from the 4th to the 13th generation, we configured the UEFI firmware for more consistent measurements, booted the image, and performed breakpoint measurements for all handling approaches.
We stated the research question that led to the creation of this work in the introduction: How do the existing breakpoint implementations compare in terms of performance?
Fortunately, our measurement results allow us now to give a conclusive answer to this question. On all measured CPUs, instruction emulation is the fastest breakpoint handling approach, followed by EPT switching with fast single-stepping (FSS), EPT switching with normal single-stepping, and finally instruction repair in memory. When it comes to keeping breakpoints stealthy, read emulation is consistently faster than switching EPT tables and single-stepping the reading instruction.
Some devices did not allow us to disable TurboBoost technology, through the layer of Xen we did not have a feasible way of measuring the actually clock speeds, and the CPUs all came with different base frequencies and boosting behavior—all these factors make it difficult, if not impossible, to distinguish between the influences from CPU architecture and clock speed. Comparing the two desktop processors i7 4790K and i7 13700K, where we can be reasonably certain that they were running on the base frequencies, we could see that while the prime-number identification performance (as measured by sysbench) increased significantly, the breakpoint handling is only marginally affected, if at all.
7.2. Future Work
In this paper, we only considered the XEN hypervisor, because the breakpoint approaches either already existed for Xen or where easy to implement (SmartVMI instruction emulation). The only working implementation for introspection with KVM is SmartVMI’s default instruction repair mechanism. DRAKVUF is not compatible with KVM and we are unsure how much work it would take to make the two compatible. According to the maintainer, SmartVMI supports EPT switching, so implementing DRAKVUF’s altp2m approach in SmartVMI should be possible (see https://github.com/GDATASoftwareAG/smartvmi/issues/140#issue-2046303351). SmartVMI’s instruction emulation that we implemented for XEN does not directly work with KVM, because LibVMI is missing the implementation for instruction emulation. However, SmartVMI’s read emulation is functional with KVM, so we hope the required changes in LibVMI and KVMI are small and we can implement instruction–emulation-based breakpoint handling for KVM soon.
Finally, we want to improve the situation of VMI infrastructure deployment. Our prepared image for the measurements has a size of 18 GB. It has to be stored on a file server for sharing and making changes or updates is a tedious process (deploying image on a system, booting, updating, recreating a compressed image). Ideally, all components would be packaged with Nix, and we could simply share a NixOS configuration or NixOS module on GitHub, which could reproducibly build the OS locally and allow for simple configuration changes. XEN and SmartVMI are already usable with Nix, so mainly packaging for DRAKVUF is missing.
Author Contributions
Conceptualization, L.B.; investigation, L.B., A.S., A.K., and A.L.; methodology, A.S. and L.B.; software, A.S., L.B., A.K., and A.L.; validation, A.S. and L.B.; formal analysis, L.B.; resources, L.B., A.S., A.K., and A.L.; data curation, L.B.; writing—original draft preparation, L.B., A.S, and A.K.; writing—review and editing, C.D.; visualization, L.B. and A.S.; supervision, C.D.; project administration, L.B.; funding acquisition, L.B. and C.D. All authors have read and agreed to the published version of the manuscript.
Funding
This research was supported by the German Federal Ministry of Research, Technology and Space (BMFTR) as part of the HypErSIS project (grant ID 16KIS1745K and 16KIS1746). Additionally, Lukas Beierlieb was supported by Cyberus Technology GmbH. MDPI has kindly waived the submission fees for this paper.
Data Availability Statement
The original data presented in the study are openly available in the repositories specified in SubSection 3.4. The disk image containing the whole software stack (Ubuntu, XEN, DRAKVUF, SmartVMI... etc.) is available upon request
Acknowledgments
We thank Philipp Schuster and Werner Haas from Cyberus Technology GmbH for their work on the HypErSIS project, which made this publication possible in the first place. This work was supported by the German Federal Ministry of Research, Technology and Space (BMFTR) as part of the HypErSIS project (grant ID 16KIS1745K and 16KIS1746). Additionally, Lukas Beierlieb was supported by Cyberus Technology GmbH. MDPI has kindly waived the submission fees for this paper.
Use of Artificial Intelligence
The AI-assisted proofreading tool Writefull has been used to audit and improve this manuscript. ChatGPT’s PDF summarization feature has been used to select appropriate related work.
Conflicts of Interest
The authors declare no conflicts of interest. The funders had no role in the design of the study; in the collection, analyses, or interpretation of data; in the writing of the manuscript; or in the decision to publish the results.
References
- Garfinkel, T.; Rosenblum, M.; et al. A virtual machine introspection based architecture for intrusion detection. In Proceedings of the Ndss. San Diega, CA, 2003, Vol. 3, pp. 191–206.
- wook Baek, H.; Srivastava, A.; Van der Merwe, J. CloudVMI: Virtual Machine Introspection as a Cloud Service. In Proceedings of the 2014 IEEE International Conference on Cloud Engineering. IEEE, IEEE, 3 2014, pp. 153–158. [CrossRef]
- Jiang, X.; Wang, X.; Xu, D. Stealthy malware detection through VMM-based ‘out-of-the-box’semantic view. In Proceedings of the Proceedings of the 14th ACM conference on Computer and communications security. ACM, 10 2007, Vol. 10, CCS07, pp. 128–138. [CrossRef]
- Dinaburg, A.; Royal, P.; Sharif, M.; Lee, W. Ether: malware analysis via hardware virtualization extensions. In Proceedings of the Proceedings of the 15th ACM conference on Computer and communications security. ACM, 10 2008, CCS08, pp. 51–62. [CrossRef]
- Willems, C.; Hund, R.; Holz, T. Cxpinspector: Hypervisor-based, hardware-assisted system monitoring. Technical report, Ruhr-Universitat Bochum, 2013.
- Dolan-Gavitt, B.; Leek, T.; Zhivich, M.; Giffin, J.; Lee, W. Virtuoso: Narrowing the Semantic Gap in Virtual Machine Introspection. In Proceedings of the 2011 IEEE Symposium on Security and Privacy. IEEE, IEEE, 5 2011, pp. 297–312. [CrossRef]
- Jain, B.; Baig, M.B.; Zhang, D.; Porter, D.E.; Sion, R. SoK: Introspections on Trust and the Semantic Gap. In Proceedings of the 2014 IEEE Symposium on Security and Privacy, 5 2014, pp. 605–620. ISSN: 2375-1207, . [CrossRef]
- Dangl, T.; Taubmann, B.; Reiser, H.P. RapidVMI: Fast and multi-core aware active virtual machine introspection. In Proceedings of the Proceedings of the 16th International Conference on Availability, Reliability and Security, New York, NY, USA, 8 2021; ARES ’21, pp. 1–10. [CrossRef]
- Lengyel, T.K.; 3esca, S.; Payne, B.D.; Webster, G.D.; Vogl, S.; Kiayias, A. Scalability, fidelity and stealth in the DRAKVUF dynamic malware analysis system. In Proceedings of the Proceedings of the 30th Annual Computer Security Applications Conference. ACM, 12 2014, ACSAC ’14, pp. 386–395. [CrossRef]
- Tarral, M. LibVMI: Simplified Virtual Machine Introspection. https://github.com/libvmi/libvmi, 2007. Accessed: 2025-15-01.
- Eikenberg, D. SmartVMI. https://github.com/GDATASoftwareAG/smartvmi, 2021. Accessed: 2025-15-01.
- Reiser, H.P.; Eikenberg, D. SmartVMI - Virtual Machine Introspection (VMI) for memory forensics and machine-learning. http://www.smartvmi.org/, 2021. Accessed: 2025-15-01.
- Lengyel, T. DRAKVUF Black-box Binary Analysis. https://github.com/tklengyel/drakvuf, 2014. Accessed: 2024-12-19.
- Lengyel, T.K. Stealthy monitoring With xen altp2m. https://xenproject.org/blog/stealthy-monitoring-with-xen-altp2m/, 2016. Accessed: 2024-12-17.
- Roccia, T. Evolution of Malware Sandbox Evasion Tactics – A Retrospective Study, 2019.
- Beierlieb, L.; Schmitz, A.; Springer, R.; Dietrich, C.; Iffländer, L. Benchmarking Hyper-Breakpoints for Efficient Virtual Machine Introspection. Electronics 2025, 14. [CrossRef]
- Beierlieb, L. vmi-nix: Nix Packaging and NixOS Modules for VMI. https://github.com/lbeierlieb/vmi-nix/tree/e2f26e840bcb69e85cf790a3a40c790492cd6662, 2025.
- Beierlieb, L. REPAIR: vmi-nix: Nix Packaging and NixOS Modules for VMI. https://github.com/lbeierlieb/smartvmi/tree/c848275674ad19ad7df6fe972852ce2af5db4746, 2025.
- Beierlieb, L. EMULATION vmi-nix: Nix Packaging and NixOS Modules for VMI. https://github.com/lbeierlieb/smartvmi/tree/f0959d7776686a78b0fc7379aeb182a6bb3518a1, 2025.
- Wahbe, R. Efficient data breakpoints. ACM SIGPLAN Notices 1992, 27, 200–212. [CrossRef]
- Wahbe, R.; Lucco, S.; Graham, S.L. Practical data breakpoints: Design and implementation. In Proceedings of the Proceedings of the ACM SIGPLAN 1993 conference on Programming language design and implementation. ACM, 6 1993, Vol. 28, PLDI93, pp. 1–12. [CrossRef]
- Deng, Z.; Zhang, X.; Xu, D. SPIDER: stealthy binary program instrumentation and debugging via hardware virtualization. In Proceedings of the Proceedings of the 29th Annual Computer Security Applications Conference, New York, NY, USA, 2013; ACSAC ’13, p. 289–298. [CrossRef]
- Karvandi, M.S.; Gholamrezaei, M.; Khalaj Monfared, S.; Meghdadizanjani, S.; Abbassi, B.; Amini, A.; Mortazavi, R.; Gorgin, S.; Rahmati, D.; Schwarz, M. HyperDbg: Reinventing Hardware-Assisted Debugging. In Proceedings of the Proceedings of the 2022 ACM SIGSAC Conference on Computer and Communications Security, New York, NY, USA, 2022; CCS ’22, p. 1709–1723. [CrossRef]
- Price, G.M. Virtual Breakpoints for x86/64, 2019, [arXiv:cs.OS/1801.09250].
Figure 7.
i7 4790K vs. i7 13700K vs. i7 4790K scaled to 3.4GHz.
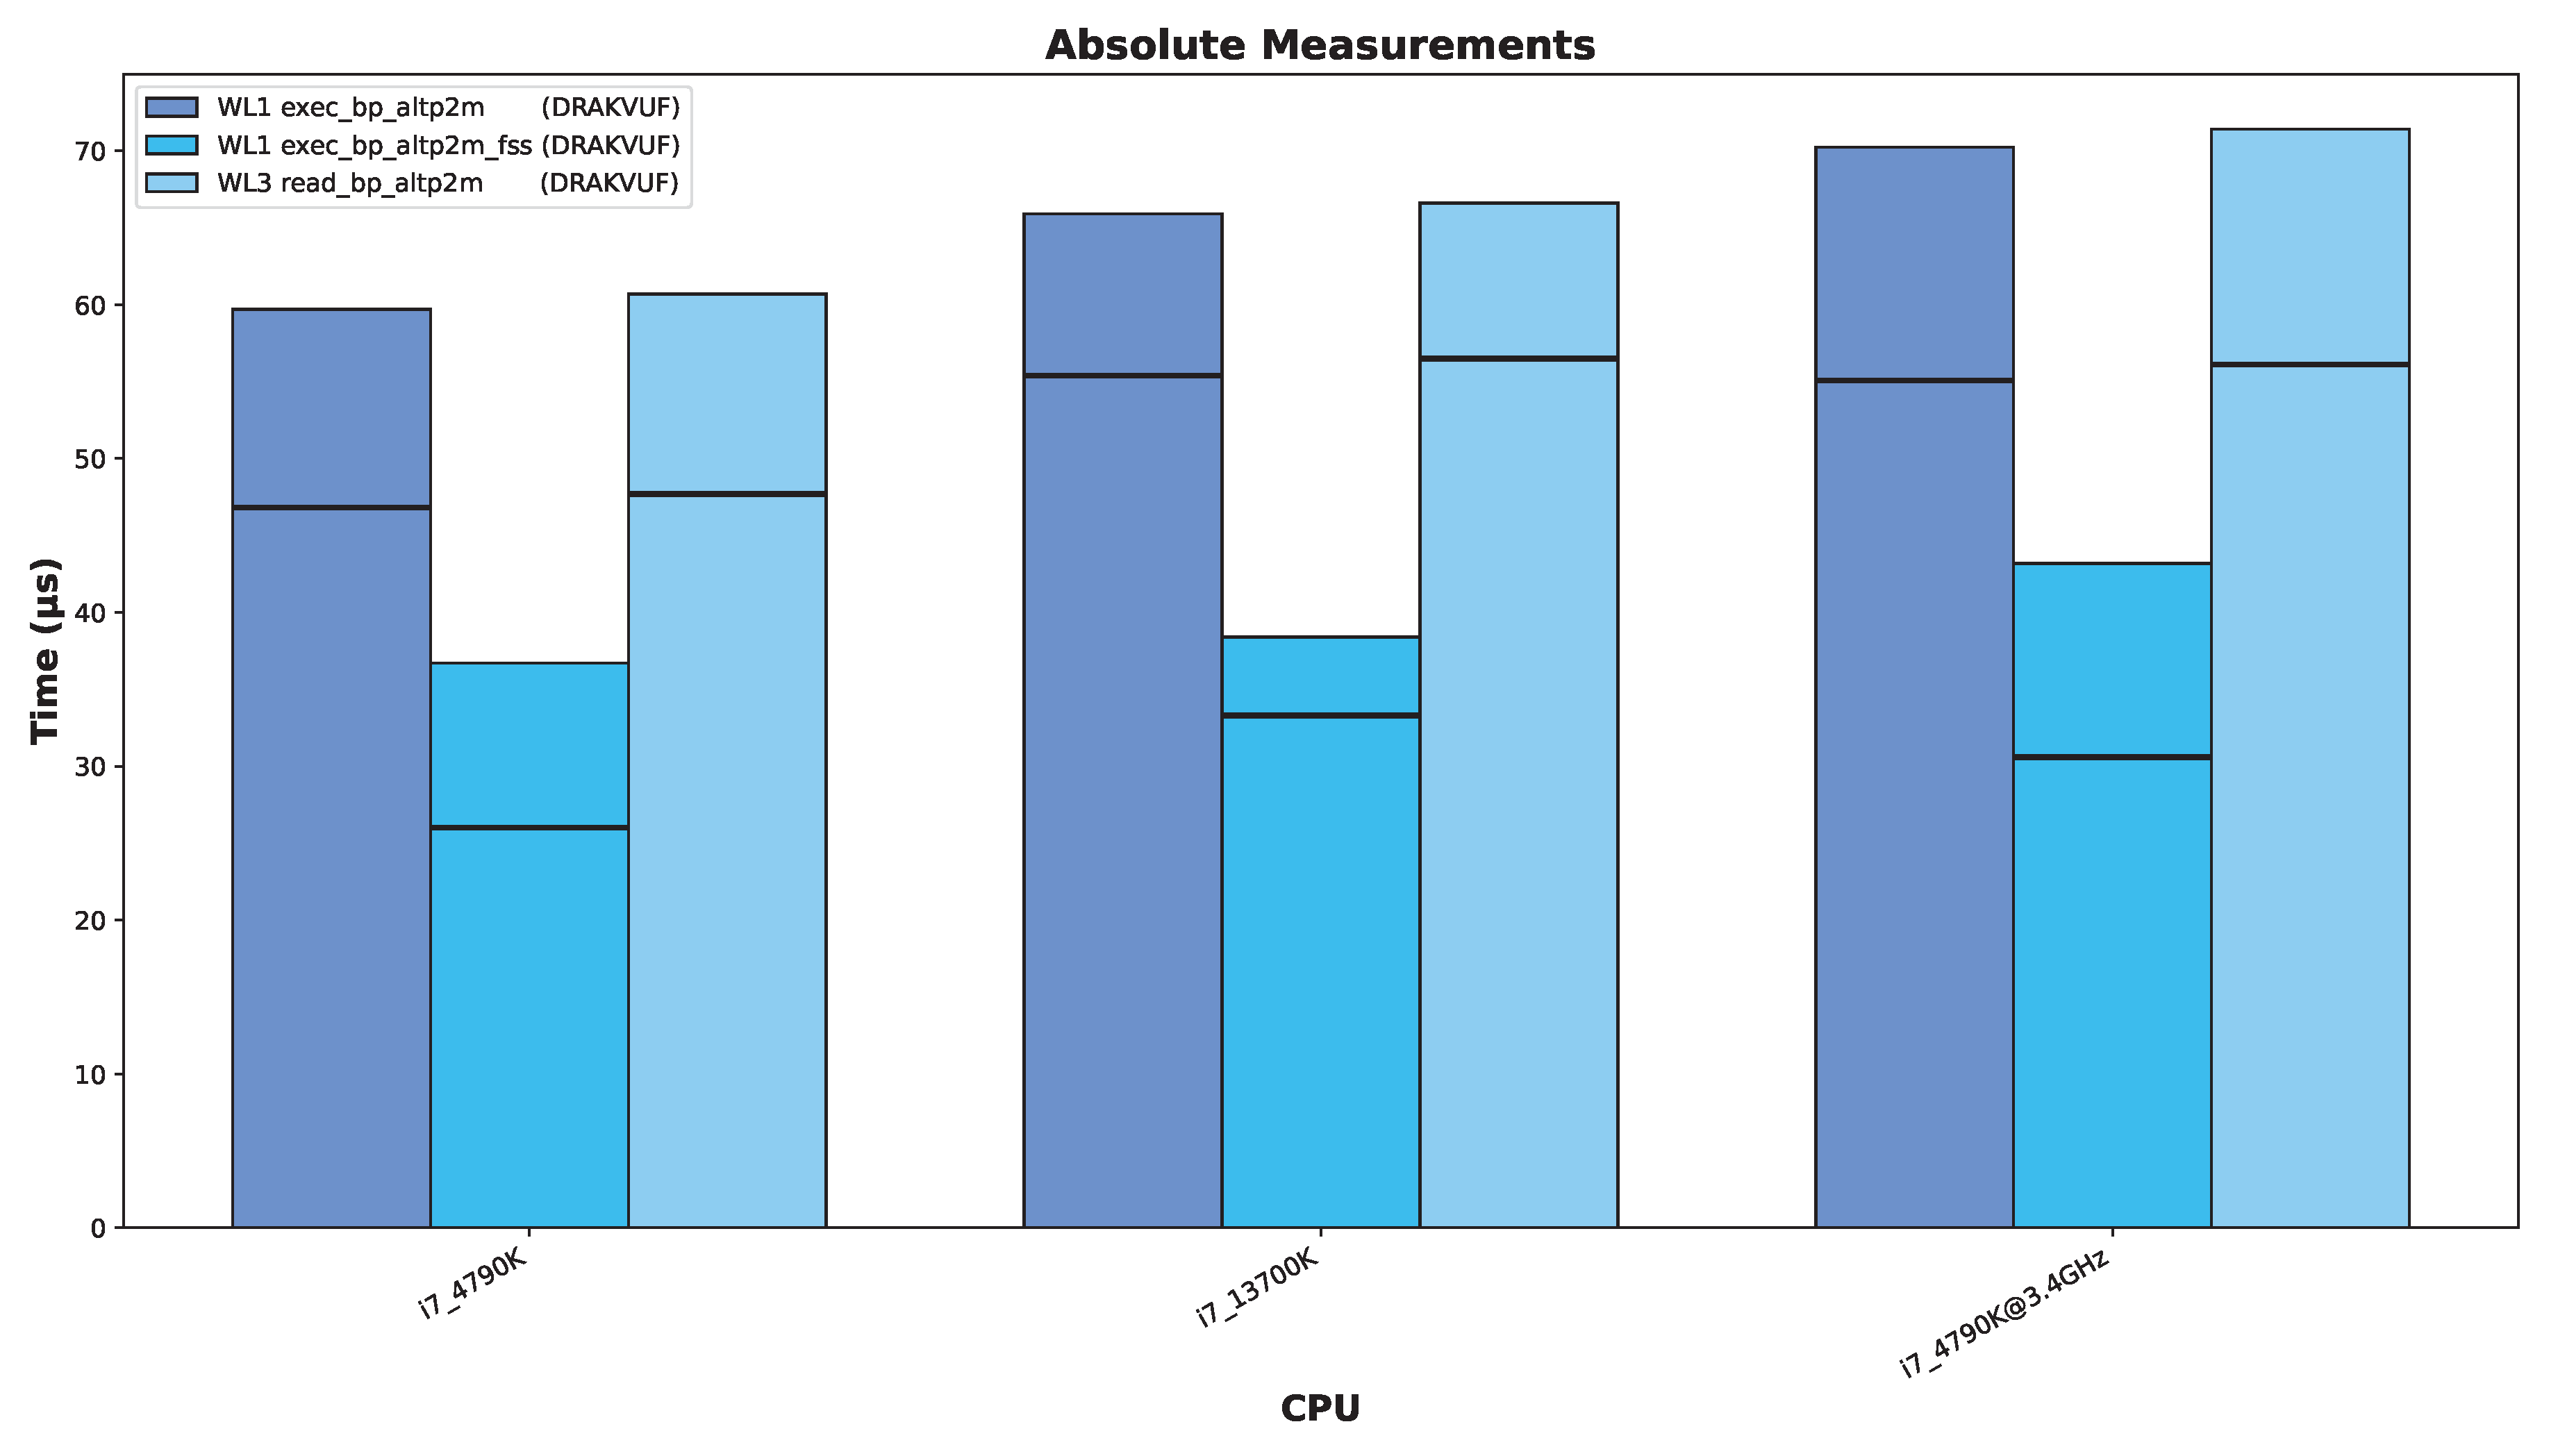
Table 1.
Breakpoint Handling Concepts.
| Name | Implementation | MP-safe | Single-step | Trap | Sequence |
|---|---|---|---|---|---|
| Instruction Repair (1) | SmartVMI Rep | no | yes | INT3 | repair instruction, single step execution, patch instruction (INT3) |
| Instruction Emulation (2) | SmartVMI Emul | yes | no | INT3 | emulate instruction |
| SLAT View Switch (3) | DRAKVUF altp2m (FSS) | yes | yes | INT3 | SlatSwitch(origin), single step execution, SlatSwitch(patched) |
Table 3.
Software stack used in the Hyper-Breakpoint benchmark environment
| Component | Version / Configuration |
|---|---|
| Host OS (Dom0) | Ubuntu 24.04.3 LTS, Linux kernel 6.14.0-28-generic |
| Hypervisor | XEN 4.20 |
| VMM | QEMU 9.1.0 |
| Guest OS (DomU) | Windows 10 Education 22H2 (Build 19045.2006) |
| Packet Manager | NIX 2.31.0 |
| BP: altp2m, altp2m_fss | DRAKVUF with LibVMI (internal version) |
| BP: instr_repair, instr_emulation | SmartVMI with LibVMI (NIX build) |
| Benchmark workload | bpbench.exe (Windows VM, Desktop) |
Table 6.
Hardware Platforms.
| Year | CPU Gen | CPU Model | Base Clock | System Vendor, Model | Sysbench score |
|---|---|---|---|---|---|
| 2014 | 4th | i7 4790K | 4000 MHz | (custom build desktop PC) | 1292.46 |
| 2015 | 6th | i3 6100 | 3700 MHz | Fujitsu ESPRIMO D757 | 1294.50 |
| 2016 | 7th | i5 7300U | 2600 MHz | Intel NUC7i5DNHE | 908.56 |
| 2017 | 8th | i5 8350U | 1700 MHz | Lenovo ThinkPad T480s | 1231.27 |
| 2018 | 8th | i7 8565U | 1800 MHz | Lenovo Yoga 730 15IWL | 1554.17 |
| 2019 | 8th | i7 8665U | 1900 MHz | Lenovo ThinkPad X390 Yoga | 1644.53 |
| 2019 | 9th | i7 9750H | 2600 MHz | HP OMEN 17 CB0XXX | 1356.64 |
| 2019 | 9th | i7 9850H | 2600 MHz | Lenovo ThinkPad P1 Gen2 | 1529.44 |
| 2018 | 9th | i9 9900K | 3600 MHz | custom build desktop PC | 1270.40 |
| 2020 | 10th | i5 10310U | 1700 MHz | Lenovo ThinkPad T14 Gen1 | 1467.40 |
| 2020 | 11th | i7 1165G7 | 2800 MHz | TUXEDO Book XP14 Gen12 | 2389.13 |
| 2021 | 11th | i7 11800H | 1900 MHz | MSI Katana GF76 11UE | 1961.76 |
| 2022 | 12th | i7 1260P | 2100 MHz | Lenovo ThinkPad T14 Gen3 | 3941.16 |
| 2022 | 12th | i7 1265U | 1800 MHz | Lenovo ThinkPad L14 Gen3 | 1265.30 |
| 2022 | 12th | i7 12700H | 2300 MHz | Lenovo IdeaPad 5 Pro 16IAH7 | 3877.77 |
| 2022 | 12th | i7 12700T | 1400 MHz | Lenovo ThinkStation P360 Tiny | 3867.40 |
| 2023 | 13th | i7 13620H | 2400 MHz | TUXEDO InfinityBook Pro Gen8 | 3602.98 |
| 2023 | 13th | i7 13700H | 2400 MHz | TUXEDO InfinityBook Pro Gen8 | 3453.76 |
| 2022 | 13th | i7 13700K | 3400 MHz | (custom built desktop PC) | 2921.45 |
| 2023 | 13th | i9 13900HX | 2200 MHz | TUXEDO Gemini Gen2 | 4352.94 |
Table 7.
Firmware Setup Feature Matrix.
| System | SMT (HT) | SpeedStep / SpeedShift | Turbo Boost | Power Mgmt |
|---|---|---|---|---|
| custom PC (i7 4790K) | disabled | disabled | disabled | not adjustable |
| ESPRIMO D757 (i3 6100) | disabled | disabled | not adjustable | not adjustable |
| NUC (i5 7300U) | disabled | max perf. | disabled | not adjustable |
| ThinkPad T480s (i5 8350U) | disabled | disabled | not adjustable | disabled |
| Yoga 730 15IWL (i7 8565U) | disabled | not adjustable | not adjustable | not adjustable |
| ThinkPad X390 Yoga (i7 8665U) | disabled | disabled | not adjustable | disabled |
| OMEN 17 CB0XXX(i7 9750H) | disabled | not adjustable | not adjustable | not adjustable |
| ThinkPad P1 Gen2 (i7 9850H) | disabled | disabled | not adjustable | disabled |
| custom PC (i9 9900K) | disabled | disabled | disabled | disabled |
| ThinkPad T14 Gen1 (i5 10310U) | disabled | disabled | not adjustable | disabled |
| Book XP14 Gen12 (i7 1165G7) | disabled | disabled | disabled | not adjustable |
| Katana GF76 11UE (i7 11800H) | disabled | disabled | not adjustable | disabled |
| ThinkPad T14 Gen3 (i7 1260P) | disabled | ENABLED | disabled | disabled |
| ThinkPad L14 Gen3 (i7 1265U) | disabled | disabled | not adjustable | disabled |
| IdeaPad 5 Pro 16IAH7 (i7 12700H) | disabled | max perf. | not adjustable | not adjustable |
| ThinkStation P360 Tiny (i7 12700T) | disabled | disabled | not adjustable | disabled |
| InfinityBook Pro Gen8 (i7 13620H) | disabled | not adjustable | not adjustable | not adjustable |
| InfinityBook Pro Gen8 (i7 13700H) | not adjustable | not adjustable | not adjustable | not adjustable |
| custom PC (i7 13700K) | disabled | disabled | disabled | not adjustable |
| Gemini Gen2 (i9 13900HX) | disabled | disabled | not adjustable | not adjustable |
Table 8.
XEN Performance Adjustments.
| System | force clock speed to base clock speed | SpeedStep and Power Mgmt disabled |
|---|---|---|
| custom PC (i7 4790K) | failed | not adjustable |
| ESPRIMO D757 (i3 6100) | failed | not adjustable |
| NUC (i5 7300U) | P0 2600 MHz | not adjustable |
| ThinkPad T480s (i5 8350U) | failed | disabled |
| Yoga 730 15IWL (i7 8565U) | P3 1800 MHz | not adjustable |
| ThinkPad X390 Yoga (i7 8665U) | failed | disabled |
| OMEN 17 CB0XXX(i7 9750H) | P1 2600 MHz | not adjustable |
| ThinkPad P1 Gen2 (i7 9850H) | failed | disabled |
| custom PC (i9 9900K) | failed | disabled |
| ThinkPad T14 Gen1 (i5 10310U) | failed | disabled |
| Book XP14 Gen12 (i7 1165G7) | P0 2800 MHz | not adjustable |
| Katana GF76 11UE (i7 11800H) | failed | disabled |
| ThinkPad T14 Gen3 (i7 1260P) | P3 2300 MHz | ENABLED |
| ThinkPad L14 Gen3 (i7 1265U) | failed | disabled |
| IdeaPad 5 Pro 16IAH7 (i7 12700H) | P3 2500 MHz | not adjustable |
| ThinkStation P360 Tiny (i7 12700T) | P0 1400 MHz | disabled |
| InfinityBook Pro Gen8 (i7 13620H) | P3 2700 MHz | not adjustable |
| InfinityBook Pro Gen8 (i7 13700H) | P3 2700 MHz | not adjustable |
| custom PC (i7 13700K) | P0 3400 MHz | not adjustable |
| Gemini Gen2 (i9 13900HX) | P0 2400 MHz | not adjustable |
Disclaimer/Publisher’s Note: The statements, opinions and data contained in all publications are solely those of the individual author(s) and contributor(s) and not of MDPI and/or the editor(s). MDPI and/or the editor(s) disclaim responsibility for any injury to people or property resulting from any ideas, methods, instructions or products referred to in the content. |
© 2025 by the authors. Licensee MDPI, Basel, Switzerland. This article is an open access article distributed under the terms and conditions of the Creative Commons Attribution (CC BY) license (http://creativecommons.org/licenses/by/4.0/).
Copyright: This open access article is published under a Creative Commons CC BY 4.0 license, which permit the free download, distribution, and reuse, provided that the author and preprint are cited in any reuse.


