
Submitted:
12 September 2025
Posted:
12 September 2025
You are already at the latest version
Abstract
Background/Objectives: Consumption of a Mediterranean Diet (MD) has been associated with reduced incidence of non-communicable diseases and reduced overall mortality, with epigenomic effects representing plausible mediators. The aim of this pilot study was to explore potential epigenetic associations between DNA methylation markers in blood and adherence to a MD in pregnancy. Methods: Fifty-two pregnant women with high- or low- adherence to a MD throughout pregnancy, who participated in the Biomood ORI-GINS study, were selected using an extremes of exposure design. DNA methylation (DNAm) profiles from whole blood were generated using the TWIST human methylome panel. We conducted both genome-wide and candidate gene-based differential meth-ylation analyses to identify epigenetic variations between the study groups. Furthermore, we explored potential associations between blood methylation patterns and circulating inflammatory markers (GlycA, GlycB and SPC) previously observed to exhibit differ-ential abundance in the same cohort of women. Results: There were no genome-wide significant differences in methylated dinucleotides between MD groups (p-value < 5e-8), however, 54 CpG dinucleotides met the threshold for a suggestive association with MD adherence. A candidate gene analysis of previously reported MD-associated genes de-tected small but statistically significantly different methylation of CpGs located within COL18A1 and PPARGC1B gene regions. We found statistical evidence of relationships between DNA methylation patterns and SPC inflammatory lipoproteins. Conclusions: We provide preliminary evidence for modest methylation changes in specific genes associated with adherence to MD.
Keywords:
Mediterranean Diet
; pregnancy
; epigenetics
; methylation
1. Introduction
The Mediterranean Diet (MD), characterized by a high intake of fruits, vegetables, whole grains, legumes, nuts, olive oil, and moderate consumption of fish and dairy products, has received attention for its health-promoting effects. Epidemiological studies consistently demonstrate that adherence to the MD is associated with a significantly reduced incidence of chronic non-communicable diseases (NCDs) such as cardiovascular disease, type 2 diabetes, and various cancers, and a lower all-cause mortality [1,2,3,4,5]. These protective effects are largely attributed to the MD diet’s anti-inflammatory properties, the ability to promote favourable gut microbiota, and the potential to modulate metabolic pathways [6]. Promoting adherence to a MD during pregnancy may be a promising prenatal strategy to support healthy pregnancies and for NCD risk reduction in both mother and the offspring. Inflammation in pregnancy can predispose to an elevated risk for pregnancy complications and NCDs in later life, and therefore reducing inflammation through dietary strategies could have beneficial effects on both mother and offspring. While specific mechanisms are still unclear, epigenetic changes may mediate MD diet effects on the host immune system.
Previous studies have shown that dietary metabolites typically associated with a MD can induce epigenetic changes in immune cells in proportion to the intake of various bioactive nutrients [7]. Flavonols, a class of phytochemicals, are found in high amounts in onions, broccoli and tomatoes and other fruits and vegetables commonly consumed in the MD and have been shown to influence miRNA expression patterns related to inflammation [8,9]. Sulforaphane (organosulfur compound) found in cruciferous vegetables, decreases DNA methylation levels in nuclear factor erythroid 2-related factor 2 (NRF2) promoter and has been shown to increase the antioxidant and anti-inflammatory capacity in neurodegenerative diseases [10,11]. Lignans, found in high quantities in extra-virgin olive oil, have been shown to influence epigenetic regulation, including DNA demethylation, and may indirectly affect histone modifications such as H3K9me3, which are associated with heterochromatin formation and chemo-preventive effects [12]. Adherence to MD in adults participating in the PREDIMED-Navarra randomized controlled trial was associated with differential methylation of CpG base modifications in COL18A1 gene encoding for the alpha chain of type XVIII collagen, and PPARGC1B transcription factor stimulant implicated in type 2 diabetes [13]. These diet-induced epigenetic modifications can impact the function and responsiveness of immune cells at the nuclear level, thereby influencing systemic inflammation.
BioMood is an observational study exploring how consumption of a MD during pregnancy influences the gut microbiome, metabolome and inflammation. Previous work by our group on this cohort has demonstrated that adherence to a MD during pregnancy is characterized by shifts in amino acids, increased concentration of gut-microbial metabolites and is inversely associated with biomarkers of systemic inflammation, GlycA and GlycB [14]. This study also demonstrated distinct differences in the inflammatory marker Supramolecular phosphocholine composite (SPC) , derived from phospholipid contained within the cardioprotective HDL-4 subfraction, which were modified in the HMDA group compared to the LMDA group [14].
The present study builds upon this work to explore whether genome-wide blood DNA methylation changes were detectable in women with high- versus low- adherence to MD throughout pregnancy. We conducted both hypothesis-free and hypothesis-driven analyses, examining whether serum metabolite changes observed in this cohort were associated with epigenetic changes in circulating immune cells. Our findings provide preliminary evidence for blood epigenetic changes that warrant further studies.
2. Results
2.1. Description of the Cohort
The demographic characteristics of those included in the study are depicted in Table 1. The ethnic profile of the cohort was mixed consisting of mostly Caucasian and South Asian ancestries. All women were taking common pregnancy supplements for iron, folate and vitamin D. Inflammatory morbidities (allergies, asthma, inflammatory bowel diseases) were generally low (less than 10% of the population) and equally distributed between groups.
2.1. Sequencing Quality Control and Exploratory Analysis
Whole blood DNA methylation sequencing depth averaged +196 million reads per sample. An average of 89.49% base calls per sample were of a quality score greater than or equal to Q30 (99.9% base call accuracy). During quality control analysis, four samples within the same target-capture pool were identified as poor quality based on visual inspection of Beta density plots and multidimensional scaling (MDS) analysis (Figure 1). These were removed from the data set and we retained 48 samples for analysis, with 7.7 million CpG measures. We derived principal components to understand major sources of variation in this data set and correlated the top five components with clinical measures of subject age, BMI and MDA group. Participant age was significantly correlated with component 2 (r=0.34, P = 0.02) and MDA group had weak evidence of anti-correlation with component 5 (r= -0.25, p= 0.08). Regression models were thus adjusted for the first four components as covariates.
2.2. Epigenome-Wide Association Analysis of MD Diet Group
We applied a genome-wide logistic regression analysis comparing MDA groups to initially search for associations across all chromosomes. No individual CpGs reached the threshold for genome-wide significance (p-value < 5e-8), however, 54 CpG sites met the threshold for a suggestive association (p-value < 1e-5), albeit the effect sizes were very small (Figure 2,Table 2).
2.3. Gene-Centric Analysis
To restrict the search space we also conducted a gene-centric analysis focusing on CpGs within gene promoter regions, as these are critical for gene regulation. Using the same regression model, we detected 16 CpGs located within promoter regions with suggestive associations with MDA (p value < 1e-5). A possible differentially methylated region (DMR), comprising 7 CpG units within a 44-bp window within the IFI30 gene encoded on Chromosome 19 exhibited a consistent gain of methylation in the HMDA group (Figure 3).
2.4. Candidate Gene Analysis of Previously Identified MD Genes
We also conducted a candidate gene analysis focusing on CpGs mapping to genes previously identified by Arpón et al. [13] as associated with MD adherance. We found moderate evidence (p value <= 1e-5 ) for differential methylation at two genes, COL18A1 and PPARGC1B however effect sizes were small (Figure 4, Table 3).
2.5. Association Between Inflammatory Markers and Methylation Levels
2.5.1. Glycoprotein Analysis
To supplement the binary logistic regression analysis of diet groups, we also conducted a more hypothesis-driven approach, employing linear regression to examine whether the circulating inflammatory markers - GlycA, GlycB, SPC1, SPC2 and SPC3 - that were previously shown to vary between the LMDA and HMDA groups [14], were associated with any changes in site-specific DNA methylation. To address potential co-linearity, we performed a correlation analysis of GlycA and GlycB which highly positively correlated (r = 0.9549, p-value < 0.01) and therefore we used GlycA as the independent variable. Genome-wide linear regression models revealed 57 CpG sites with suggestive associations (p-value <1e-5), 13 CpGs of which were located in promoter regions, but none surviving stringent multiple testing adjustment. A potential DMR with suggestive associations was identified within an intergenic region of chromosome 13 comprising four CpGs located within 37 bases of each other (Figure 5, Table 4).
2.5.2. SPC Lipoprotein Analysis
A Pearson correlation analysis between SPC identified that SPC2 and SPC3 levels are highly positively correlated (r = 0.8459, p-value < 0.01) and subsequent analysis focused on SPC3 only. Genome-wide linear regression detected one significantly different methylated CpG site within gene TSC2 with strong evidence for association with SPC3 circulating levels (p-value < 5e-8, Figure 6). A further 87 CpGs sites exhibited suggested associations with changes in SPC3 levels (Supplementary Table 2). A possible DMRs within ZFPM1 and an intergenic region of chromosome 6 were also identified (Table 5). We also repeated this analysis on SPC1 levels, which were independent of SPC2 and 3. No genome-wide significant associations were identified and 61 CpG modifications exhibited suggestive associations (Table 6).
3. Discussion
Summary of key findings.
This pilot study aimed to explore the relationships between Mediterranean diet adherence in pregnancy whole blood DNA methylation using a multi-faceted approach. The study was designed to generate hypotheses and assess feasibility as a prelude to larger-scale dietary methylome-wide association testing. Despite the limitations of a pilot study, robust signals were identified in specific areas with a priori biological plausibility, while broader genome-wide suggestive associations provide valuable hypotheses for larger-scale studies.
Genome-scale Analysis Findings.
Using stringent thresholds for genome-wide significant we did not identify any site-specific or regional associations with Mediterranean diet group. Despite this, 54 CpG sites met the criteria for suggestive associations, exhibiting small effect sizes. Collectively this indicates a lack of statistical power to detect small effects, as commonly observed in complex disease studies, using mixed tissues such as blood, and suggests true biological effects of diet on methylation are subtle. Future studies will require hundreds of samples to be sufficiently powered for robust associations at genome-scale. Narrowing the breadth of our search to include only gene-promoter regions identified suggestive regional associations on 7 consecutive CpGs, a possible differentially methylated region. These potential signals warrant further investigation, particularly since the IFI30 gene plays a vital role in immune function and is involved in immune-mediated diseases. Differentially methylated regions (DMR) are often more biologically relevant since the represent coordinated methylation changes across a genomic locus, potentially impacting gene regulation. Our results position this DMR as a strong candidate for subsequent studies, which should be conducted in purified relevant immune cell types to substantially improve statistical power.
Candidate gene analysis.
Similar to previously published findings [13], we observed moderate evidence for differential methylation within the inflammation-related genes COL18A1 and PPARGC1B. Again, effects sizes were small and not entirely consistent in direction (loss/gain) methylation, likely due to the mixed cell composition of the specimen. These genes play a role in adipogenesis, metabolism, and diabetes and perform functions associated with inflammation, which can be related to the described favourable effects of the Mediterranean Diet on the inflammatory response [15]. Collectively, these data generally align with pre-existing studies and provide stronger evidence for a true biological link.
We also investigated associations with circulating metabolite levels that were previously found to be modified by HMDA in this cohort, and we detected small effects on site-specific methylation [14]. Association testing with Glycoprotein levels revealed a potential DMR with chromosome 13, a non-coding region of the genome. Non-coding methylation changes can influence chromatin structure and potentiate gene expression through chromatin interactions. SPC3 levels were associated with significant genome-wide methylation changes within the gene TSC2, a tumour suppressor gene. Although the biological consequences of these epigenetic associations are unclear, they are strong candidates for further investigation and could aid in understanding the link between diet, metabolism and immune health.
Strengths and Limitations.
A novel aspect of this study was the methylation sequencing platform, which compared to microarrays that have typically be used in this field of study [13], offers inherently more quantitative count-level data, is less sparse and covers nearly five times more of the mammalian genome than current generation microarrays. A key strength of the study is the robustly selected cohort of women studied with prior evidence of metabolic changes associated with Mediterranean diet adherence scores. Despite this, the primary limitation of the study is the small sample size and mixed cell tissue type, which increases the change of false negative associations and small effect sizes. While our extremes of exposure design enriches for biological signals, the generalizability of the findings may be limited to the specific characteristics of the pilot cohort and replication in larger more diverse populations is needed. We were unable to disentangle effects of highly correlated phosphopipids or glycoproteins so further in-depth analysis is required. The cross-sectional design precludes causal inference, and we acknowledge the potential influence of unmeasured confounding factors.
Conclusion
This study provides valuable hypotheses for future exploration of epigenetic mechanisms associated with diet in pregnancy and suggests potential links between circulating inflammatory markers and blood methylation. Longitudinal studies with larger sample sizes, using purified cell populations would be needed to replicate associations and establish biological significance. Compelling preliminary findings around SPC3 associations and candidate genes COL18A1, IFI30 and PPARGC1B provide a foundation to guide future research.
4. Materials and Methods
Study Cohort
Participants included in the BioMood study were nested within the ORIGINS parent cohort, a longitudinal study of family health outcomes, commencing in pregnancy [16,17]. The present study utilized available whole blood samples collected at the 36-week of pregnancy time-point from eligible mothers. The BioMood study entry criteria have been previously published [14]. The pregnant women who were recruited to the BioMood study comprised women who had completed a modified 13-item Mediterranean Diet Questionnaire (MDQ) twice during pregnancy with scores that varied by no more than 2 points. A total of 52 women met eligibility criteria, which included 25 control participants within the Low Mediterranean Diet Adherence (LMDA) group (an MDQ score equal to or less than 4 at 2 timepoints) and 27 case participants within the High Mediterranean Diet Adherence (HMDA) group (an MDQ score equal to or greater than 8 at 2 timepoints). Participants were excluded if they did not have available biological samples for analysis, were exposed to antibiotics at any time during pregnancy, reported use of anti-depressant or anti-anxiety medication or had a pre-pregnancy BMI over 40kg/m2. Study groups were balanced for potential confounding variables which include age, parity, education, work status, pre-pregnancy weight and pre-pregnancy BMI.
Serum Inflammatory Marker Analysis
Metabolic profiles were generated using 1H Nuclear Magnetic Resonance (NMR) spectroscopy. Further details on the acquisition, processing and analysis of metabolic profiles are described in the BIOMOOD study [14]. The NMR signal intensities of interest were glycoprotein signals GlycA and GlycB, and supramolecular phospholipid composite (SPC) peaks, which correspond to small HDL phospholipids (SPC1 peak), larger HDL phospholipids (SPC2 peak) and LDL phospholipid particles (SPC3 peak).
DNA Extraction and Library Preparation
Genomic DNA was extracted from whole blood using either chemagic™ DNA Blood 400 Kit H96 (Cat. No. CMG-1091) on the chemagic™ 360 instrument (n = 49), or the DNeasy Blood & Tissue Kit (QIAGEN, Cat. No. 69504; n = 2), following manufacturers’ protocols. DNA concentration and purity were measured using Qubit ™ dsDNA High Sensitivity (HS) Assay Kit (Cat. No. Q33231, ThermoFisher Scientific, USA) on a Qubit fluorometer (ThermoFisher Scientific, USA).200 ng of genomic DNA per sample were fragmented to 275- 325bp using the Covaris E220 sonicator (Covaris, Woburn, MA, USA). Control DNA (0.5% methylated pUC19 and unmethylated lambda DNA) was included to assess enzymatic conversion efficiency.
Indexed pre-capture libraries were prepared using the NEBNext® Enzymatic Methyl-seq Library Preparation Protocol (Twist Bioscience and NEB) following manufacturers protocol. Eight libraries were pooled equimolarly for capture, balanced by diet group and BMI. Target enrichment was performed using the Twist Human Methylome Panel (Code: TWB105520), capturing 3.98 million CpG sites. Hybridization was carried out for 16 hours at 60°C, followed by washing and 6-cycle PCR amplification according to the Twist Targeted Methylation Sequencing Protocol Library size and concentration were assessedusing the Agilent 4200 TapeStation system with the D5000 ScreenTape Assay (Agilent Technologies, Santa Clara, CA).
Sequencing
Final libraries were sequenced by Genomics WA accredited facility on an Illumina NovaSeq 6000 (Illumina, CA, USA) using the XP workflow on an S4 flowcell (2x 150 (bp) reads. with a loading concentration of 253pM and a 10%PhiX spike-in.
Bioinformatic analysis: Pre-processing
Raw methylation FASTQ files were processed using the nf-core/methylseq v2.6.0 pipeline. Methylseq pipeline was executed under Nextflow v23.10.0 [18] and the Human Genome Reference Consortium Human Build 37 (GRCh37) using the bismark workflow. Binary Alignment/Map (BAM) Index files were constructed using samtools version 1.13 [19]. The nf-core methylseq pipeline was run under the profile singularity and a custom configuration file adopted from the pre-configured Pawsey Setonix HPC settings, specifying the compute resources required for the job scheduler (slurm) [20].
Statistical analysis
All statistical analyses were conducted in R language v4.4.1 and RStudio 2023.03.0+386 using base R functions (unless otherwise specified). Processing of Bismark methylation calls was performed using the bsseq package version 1.40.0 [21]. Bismark files were processed to filter any CpGs that were not represented in all samples, and with a coverage of less than 5, or greater than 500 reads. Non-standard and off-target chromosome reads were removed from the set. Sample quality was assessed by examining genome-wide methylation patterns. Raw methylation data were extracted using the getMeth function from the minfi package (v1.50.0) and visualized with densityPlot [22]. Sex was predicted based on median methylation values of loci on chromosomes X and Y, calculated using chrSelectBSseq, getMeth, and colMedians, with females identified as those with less than 0.25 difference in median methylation between chromosomes.
Methylation data, stored as a bsseq object, were annotated to the Twist Human Methylome Panel Target BED File (Twist Bioscience). Promoter regions, CpG islands, and enhancer regions were identified using build_annotations (annotatr package v1.30.0) and subsetByOverlaps [23]. For each region, methylation ratios were extracted using getMeth (bsseq package v1.40.0), and principal component analysis (PCA) was performed using prcomp. Samples identified as outliers in the PCA were excluded from further analysis (4 samples removed from the same capture pool). Methylation beta values were extracted using getMeth. M-values were calculated by log2- transforming the ratio of methylated to unmethylated read counts obtained via getCoverage. Batch effects were assessed by PCA on beta values. Associations between the top five principal components and clinical traits were evaluated using the WGCNA package (v1.72-5) [24]. Spearman correlations and corresponding p-values were calculated and visualized using labeledHeatmap. Pearson correlations between GlycA and GlycB, and among SPC1, SPC2, and SPC3, were assessed and visualized. Normality of metabolite distributions was also assessed using ggplots. SPC metabolites were log-transformed prior to correlation analysis.
Hypothesis testing
Genome-wide differential methylation analysis was performed using the limma package (v3.60.4) [25]. To identify CpG sites differentially methylated between low- and high-MDA groups, logistic regression models were fit M-values and adjusting for the first four principal components. Empirical Bayes statistics were calculated, and top-ranked differentially methylated sites were identified. Effect sizes are reported on the Beta value scale. Differentially methylated CpG sites were deemed statistically significant at unadjusted p values < 5x10⁻⁸ and suggestive at unadjusted p values < 1x10⁻⁵.
A ‘gene-centric’ analysis was performed by repeating the genome-wide analysis on the methylation dataset after pre-filtering to include only gene promoter regions using the annotatr annotation package(v1.30.0)[23].
An additional candidate gene analysis of CpG sites annotated to genes associated with MD published by Apron et al. [13] was conducted using logistic regression. Genes of interest included EEF2, RUNX3, IL4I1, MAPKAP2, COL18A1, LEPR, PLAGL1, IFRD1, PPARGC1B. Specific CpG sites annotated to these genomic coding regions based on genomic location (hg19 build) were extracted for analysis. The specific regions of interest and corresponding CpGs are available in the published codebase. Statistical significance was declared at a Bonferroni-corrected p value threshold of less than 0.05.
Linear regression models were used to test associations between genome-side CpG and metabolite levels (GlycA, GlycB, SPC1, SPC2, and SPC3), adjusting for MDA status and the first four principal components. As related metabolites were exhibited co-linearity, models were further adjusted by incorporating correlated metabolites as adjustment variables. Differentially methylated sites were visualized using manhattan_plot from the ggmanh package (v1.8.0) [26].
Supplementary Materials
The following supporting information can be downloaded at the website of this paper posted on Preprints.org.
Author Contributions
ND’V: conceptualization and methodology. GT, NK, DM: data generation, epigenetics. DM, NA, GT: Statistical analysis. JB, GT, NK, DM: writing – original draft preparation. ND’V and JN: funding acquisition. All authors contributed critical feedback and edits to the article and approved the submitted version.
Funding
ORIGINS has received core funding support from the Telethon Perth Children’s Hospital Research Fund, Joondalup Health Campus, the Paul Ramsay Foundation and the Commonwealth Government of Australia through the Channel 7 Telethon Trust. Substantial in-kind support has been provided by The Kids Research Institute Australian and Joondalup Health Campus. The authors thank the Science Sceptics of WA for the funding for this project, as well as Bruker Corporation, United States and the Channel 7 Telethon Trust, Western Australia. In addition the MRFF for funding the Australian National Phenome Centre for this and related work. They also thank Bruker and the Cooperative Research Centre Future Food Systems funding for CR, and MRFF Frontier Health and Medical Research, the Australian Research Council for Laureate Fellowship funding for EH, and the NHMRC MRFF grant (2014349).
Institutional Review Board Statement
The study was conducted in accordance with the Declaration of Helsinki, and approved by the Institutional Review Board of the Ramsay Health Care WA|SA Human Research Ethics Committee (REF: 2020/ETH/2041).
Informed Consent Statement
Informed consent was obtained from all subjects involved in the study.
Data Availability Statement
Analysis scripts have been made publicly available on github: https://github.com/ClinicalEpigenetics/BioMood_DNAm. The data presented in this study are available on request from the corresponding author due to restrictions on public deposition of DNA methylation data to accord with participant consent.
Acknowledgments
We are grateful to all the ORIGINS families who support the project. We would also like to acknowledge and thank the following teams and individuals who have made ORIGINS possible: ORIGINS project team; Joondalup Health Campus (JHC); members of ORIGINS Community Reference and Participant Reference Groups; Research Interest Groups and the ORIGINS Scientific Committee; The Kids Research Institute Australia; City of Wanneroo; City of Joondalup; and Professor Fiona Stanley. This study is a sub-project of ORIGINS. This unique long-term study, a collaboration between The Kids Research Institute Australia and Joondalup Health Campus, is one of the most comprehensive studies of pregnant women and their families in Australia to date, recruiting 10,000 families over a decade from the Joondalup and Wanneroo communities of Western Australia. We would like to acknowledge Professor Jeremy Nicholson and Elaine Holmes from the Australian National Phenome Centre for their assistance in deriving and interpreting glycoprotein and supramolecular phospholipid composite profiles.
Conflicts of Interest
The authors declare no conflicts of interest. The funders had no role in the design of the study; in the collection, analyses, or interpretation of data; in the writing of the manuscript; or in the decision to publish the results.
Abbreviations
The following abbreviations are used in this manuscript:
| BMI | Body mass index |
| DMR | Differentially Methylated Region |
| DNAm | DNA methylation |
| MD | Mediterranean Diet |
| MDQ | Mediterranean Diet Questionnaire |
| (L/H)MDA | (Low-/High-) Mediterranean Diet Adherence |
| NCD | Non-communicable diseases |
| NMR | Nuclear Magnetic Resonance |
| NRF2 | Nuclear factor erythroid 2-related factor 2 |
| PCA | Principal component analysis |
| SPC | Supramolecular phosphocholine composite |
References
- Martinez-Gonzalez, M. A.; de la Fuente-Arrillaga, C.; Nunez-Cordoba, J. M.; Basterra-Gortari, F. J.; Beunza, J. J.; Vazquez, Z.; Benito, S.; Tortosa, A.; Bes-Rastrollo, M. , Adherence to Mediterranean diet and risk of developing diabetes: prospective cohort study. BMJ 2008, 336, 1348–51. [Google Scholar] [CrossRef] [PubMed]
- Trichopoulou, A.; Costacou, T.; Bamia, C.; Trichopoulos, D. , Adherence to a Mediterranean diet and survival in a Greek population. N Engl J Med 2003, 348, 2599–608. [Google Scholar] [CrossRef] [PubMed]
- Trichopoulou, A.; Orfanos, P.; Norat, T.; Bueno-de-Mesquita, B.; Ocke, M. C.; Peeters, P. H.; van der Schouw, Y. T.; Boeing, H.; Hoffmann, K.; Boffetta, P.; Nagel, G.; Masala, G.; Krogh, V.; Panico, S.; Tumino, R.; Vineis, P.; Bamia, C.; Naska, A.; Benetou, V.; Ferrari, P.; Slimani, N.; Pera, G.; Martinez-Garcia, C.; Navarro, C.; Rodriguez-Barranco, M.; Dorronsoro, M.; Spencer, E. A.; Key, T. J.; Bingham, S.; Khaw, K. T.; Kesse, E.; Clavel-Chapelon, F.; Boutron-Ruault, M. C.; Berglund, G.; Wirfalt, E.; Hallmans, G.; Johansson, I.; Tjonneland, A.; Olsen, A.; Overvad, K.; Hundborg, H. H.; Riboli, E.; Trichopoulos, D. , Modified Mediterranean diet and survival: EPIC-elderly prospective cohort study. BMJ 2005, 330, 991. [Google Scholar] [CrossRef]
- Couto, E.; Boffetta, P.; Lagiou, P.; Ferrari, P.; Buckland, G.; Overvad, K.; Dahm, C. C.; Tjonneland, A.; Olsen, A.; Clavel-Chapelon, F.; Boutron-Ruault, M. C.; Cottet, V.; Trichopoulos, D.; Naska, A.; Benetou, V.; Kaaks, R.; Rohrmann, S.; Boeing, H.; von Ruesten, A.; Panico, S.; Pala, V.; Vineis, P.; Palli, D.; Tumino, R.; May, A.; Peeters, P. H.; Bueno-de-Mesquita, H. B.; Buchner, F. L.; Lund, E.; Skeie, G.; Engeset, D.; Gonzalez, C. A.; Navarro, C.; Rodriguez, L.; Sanchez, M. J.; Amiano, P.; Barricarte, A.; Hallmans, G.; Johansson, I.; Manjer, J.; Wirfart, E.; Allen, N. E.; Crowe, F.; Khaw, K. T.; Wareham, N.; Moskal, A.; Slimani, N.; Jenab, M.; Romaguera, D.; Mouw, T.; Norat, T.; Riboli, E.; Trichopoulou, A. , Mediterranean dietary pattern and cancer risk in the EPIC cohort. Br J Cancer 2011, 104, 1493–9. [Google Scholar] [CrossRef]
- Estruch, R.; Ros, E.; Salas-Salvado, J.; Covas, M. I.; Corella, D.; Aros, F.; Gomez-Gracia, E.; Ruiz-Gutierrez, V.; Fiol, M.; Lapetra, J.; Lamuela-Raventos, R. M.; Serra-Majem, L.; Pinto, X.; Basora, J.; Munoz, M. A.; Sorli, J. V.; Martinez, J. A.; Fito, M.; Gea, A.; Hernan, M. A.; Martinez-Gonzalez, M. A.; Investigators, P. S. , Primary Prevention of Cardiovascular Disease with a Mediterranean Diet Supplemented with Extra-Virgin Olive Oil or Nuts. N Engl J Med 2018, 378, e34. [Google Scholar] [CrossRef]
- Scaglione, S.; Di Chiara, T.; Daidone, M.; Tuttolomondo, A. , Effects of the Mediterranean Diet on the Components of Metabolic Syndrome Concerning the Cardiometabolic Risk. Nutrients 2025, 17. [Google Scholar] [CrossRef]
- Kenanoglu, S.; Gokce, N.; Akalin, H.; Ergoren, M. C.; Beccari, T.; Bertelli, M.; Dundar, M. , Implication of the Mediterranean diet on the human epigenome. J Prev Med Hyg 2022, 63 (2 Suppl 3), E44–E55. [Google Scholar]
- Wang, P.; Yamabe, N.; Hong, C. J.; Bai, H. W.; Zhu, B. T. , Caffeic acid phenethyl ester, a coffee polyphenol, inhibits DNA methylation in vitro and in vivo. Eur J Pharmacol 2020, 887, 173464. [Google Scholar] [CrossRef]
- Carlos-Reyes, A.; Lopez-Gonzalez, J. S.; Meneses-Flores, M.; Gallardo-Rincon, D.; Ruiz-Garcia, E.; Marchat, L. A.; Astudillo-de la Vega, H.; Hernandez de la Cruz, O. N.; Lopez-Camarillo, C. , Dietary Compounds as Epigenetic Modulating Agents in Cancer. Front Genet 2019, 10, 79. [Google Scholar] [CrossRef]
- Schepici, G.; Bramanti, P.; Mazzon, E. , Efficacy of Sulforaphane in Neurodegenerative Diseases. Int J Mol Sci 2020, 21. [Google Scholar] [CrossRef]
- Zhao, F.; Zhang, J.; Chang, N. , Epigenetic modification of Nrf2 by sulforaphane increases the antioxidative and anti-inflammatory capacity in a cellular model of Alzheimer's disease. Eur J Pharmacol 2018, 824, 1–10. [Google Scholar] [CrossRef]
- Liu, Y.; Hrit, J. A.; Chomiak, A. A.; Stransky, S.; Hoffman, J. R.; Tiedemann, R. L.; Wiseman, A. K.; Kariapper, L. S.; Dickson, B. M.; Worden, E. J.; Fry, C. J.; Sidoli, S.; Rothbart, S. B. , DNA hypomethylation promotes UHRF1-and SUV39H1/H2-dependent crosstalk between H3K18ub and H3K9me3 to reinforce heterochromatin states. Mol Cell 2025, 85, 394–412.e12. [Google Scholar] [CrossRef] [PubMed]
- Arpon, A.; Riezu-Boj, J. I.; Milagro, F. I.; Marti, A.; Razquin, C.; Martinez-Gonzalez, M. A.; Corella, D.; Estruch, R.; Casas, R.; Fito, M.; Ros, E.; Salas-Salvado, J.; Martinez, J. A. , Adherence to Mediterranean diet is associated with methylation changes in inflammation-related genes in peripheral blood cells. J Physiol Biochem 2016, 73, 445–455. [Google Scholar] [CrossRef] [PubMed]
- Rowley, C. E.; Lodge, S.; Egan, S.; Itsiopoulos, C.; Christophersen, C. T.; Silva, D.; Kicic-Starcevich, E.; O'Sullivan, T. A.; Wist, J.; Nicholson, J.; Frost, G.; Holmes, E.; D'Vaz, N. , Altered dietary behaviour during pregnancy impacts systemic metabolic phenotypes. Front Nutr 2023, 10, 1230480. [Google Scholar] [CrossRef]
- Schwingshackl, L.; Hoffmann, G. , Mediterranean dietary pattern, inflammation and endothelial function: a systematic review and meta-analysis of intervention trials. Nutr Metab Cardiovasc Dis 2014, 24, 929–39. [Google Scholar] [CrossRef]
- Silva, D. T.; Hagemann, E.; Davis, J. A.; Gibson, L. Y.; Srinivasjois, R.; Palmer, D. J.; Colvin, L.; Tan, J.; Prescott, S. L. , Introducing the ORIGINS project: a community-based interventional birth cohort. Rev Environ Health 2020, 35, 281–293. [Google Scholar] [CrossRef] [PubMed]
- D'Vaz, N.; Kidd, C.; Miller, S.; Amin, M.; Davis, J. A.; Talati, Z.; Silva, D. T.; Prescott, S. L. , The ORIGINS Project Biobank: A Collaborative Bio Resource for Investigating the Developmental Origins of Health and Disease. Int J Environ Res Public Health 2023, 20. [Google Scholar] [CrossRef]
- Di Tommaso, P.; Chatzou, M.; Floden, E. W.; Barja, P. P.; Palumbo, E.; Notredame, C. , Nextflow enables reproducible computational workflows. Nat Biotechnol 2017, 35, 316–319. [Google Scholar] [CrossRef]
- Danecek, P.; Bonfield, J. K.; Liddle, J.; Marshall, J.; Ohan, V.; Pollard, M. O.; Whitwham, A.; Keane, T.; McCarthy, S. A.; Davies, R. M.; Li, H. , Twelve years of SAMtools and BCFtools. Gigascience 2021, 10. [Google Scholar] [CrossRef]
- Beecroft, S.; Samaha, G. Pawsey Sentonix HPC Configuration. Available online: https://github.com/nf-core/configs/blob/master/conf/pawsey_setonix.config (accessed on day month year).
- Hansen, K. D.; Langmead, B.; Irizarry, R. A. , BSmooth: from whole genome bisulfite sequencing reads to differentially methylated regions. Genome Biol 2012, 13, R83. [Google Scholar] [CrossRef]
- Aryee, M. J.; Jaffe, A. E.; Corrada-Bravo, H.; Ladd-Acosta, C.; Feinberg, A. P.; Hansen, K. D.; Irizarry, R. A. , Minfi: a flexible and comprehensive Bioconductor package for the analysis of Infinium DNA methylation microarrays. Bioinformatics 2014, 30, 1363–9. [Google Scholar] [CrossRef] [PubMed]
- Cavalcante, R. G.; Sartor, M. A. , annotatr: genomic regions in context. Bioinformatics 2017, 33, 2381–2383. [Google Scholar] [CrossRef] [PubMed]
- Langfelder, P.; Horvath, S. , WGCNA: an R package for weighted correlation network analysis. BMC Bioinformatics 2008, 9, 559. [Google Scholar] [CrossRef] [PubMed]
- Ritchie, M. E.; Phipson, B.; Wu, D.; Hu, Y.; Law, C. W.; Shi, W.; Smyth, G. K. , limma powers differential expression analyses for RNA-sequencing and microarray studies. Nucleic Acids Res 2015, 43, e47. [Google Scholar] [CrossRef] [PubMed]
- Lee, J. ggmanh: Visualization Tool for GWAS Result. [CrossRef]
Figure 1.
Diagnostic plots of sample quality control (A) Densityplot illustrating the distribution of genome-wide methylation levels across all samples. The x-axis represents methylation ratios expressed as beta values, ranging from unmethylated (0) to fully methylated (1). The y-axis indicates the density of these ratios. Each sample is color-coded according to the microarray slide (capture pool) it was processed on, with eight samples per slide. (B) Principal component analysis (PCA) of methylation levels across CpG Island genomic regions. Each point represents an individual sample, plotted using the first two principal components. Samples are color-coded by capture pool and grouped according to MDA status. Four samples—BioMood35, BioMood24, BioMood50, and BioMood39—were identified as outliers.
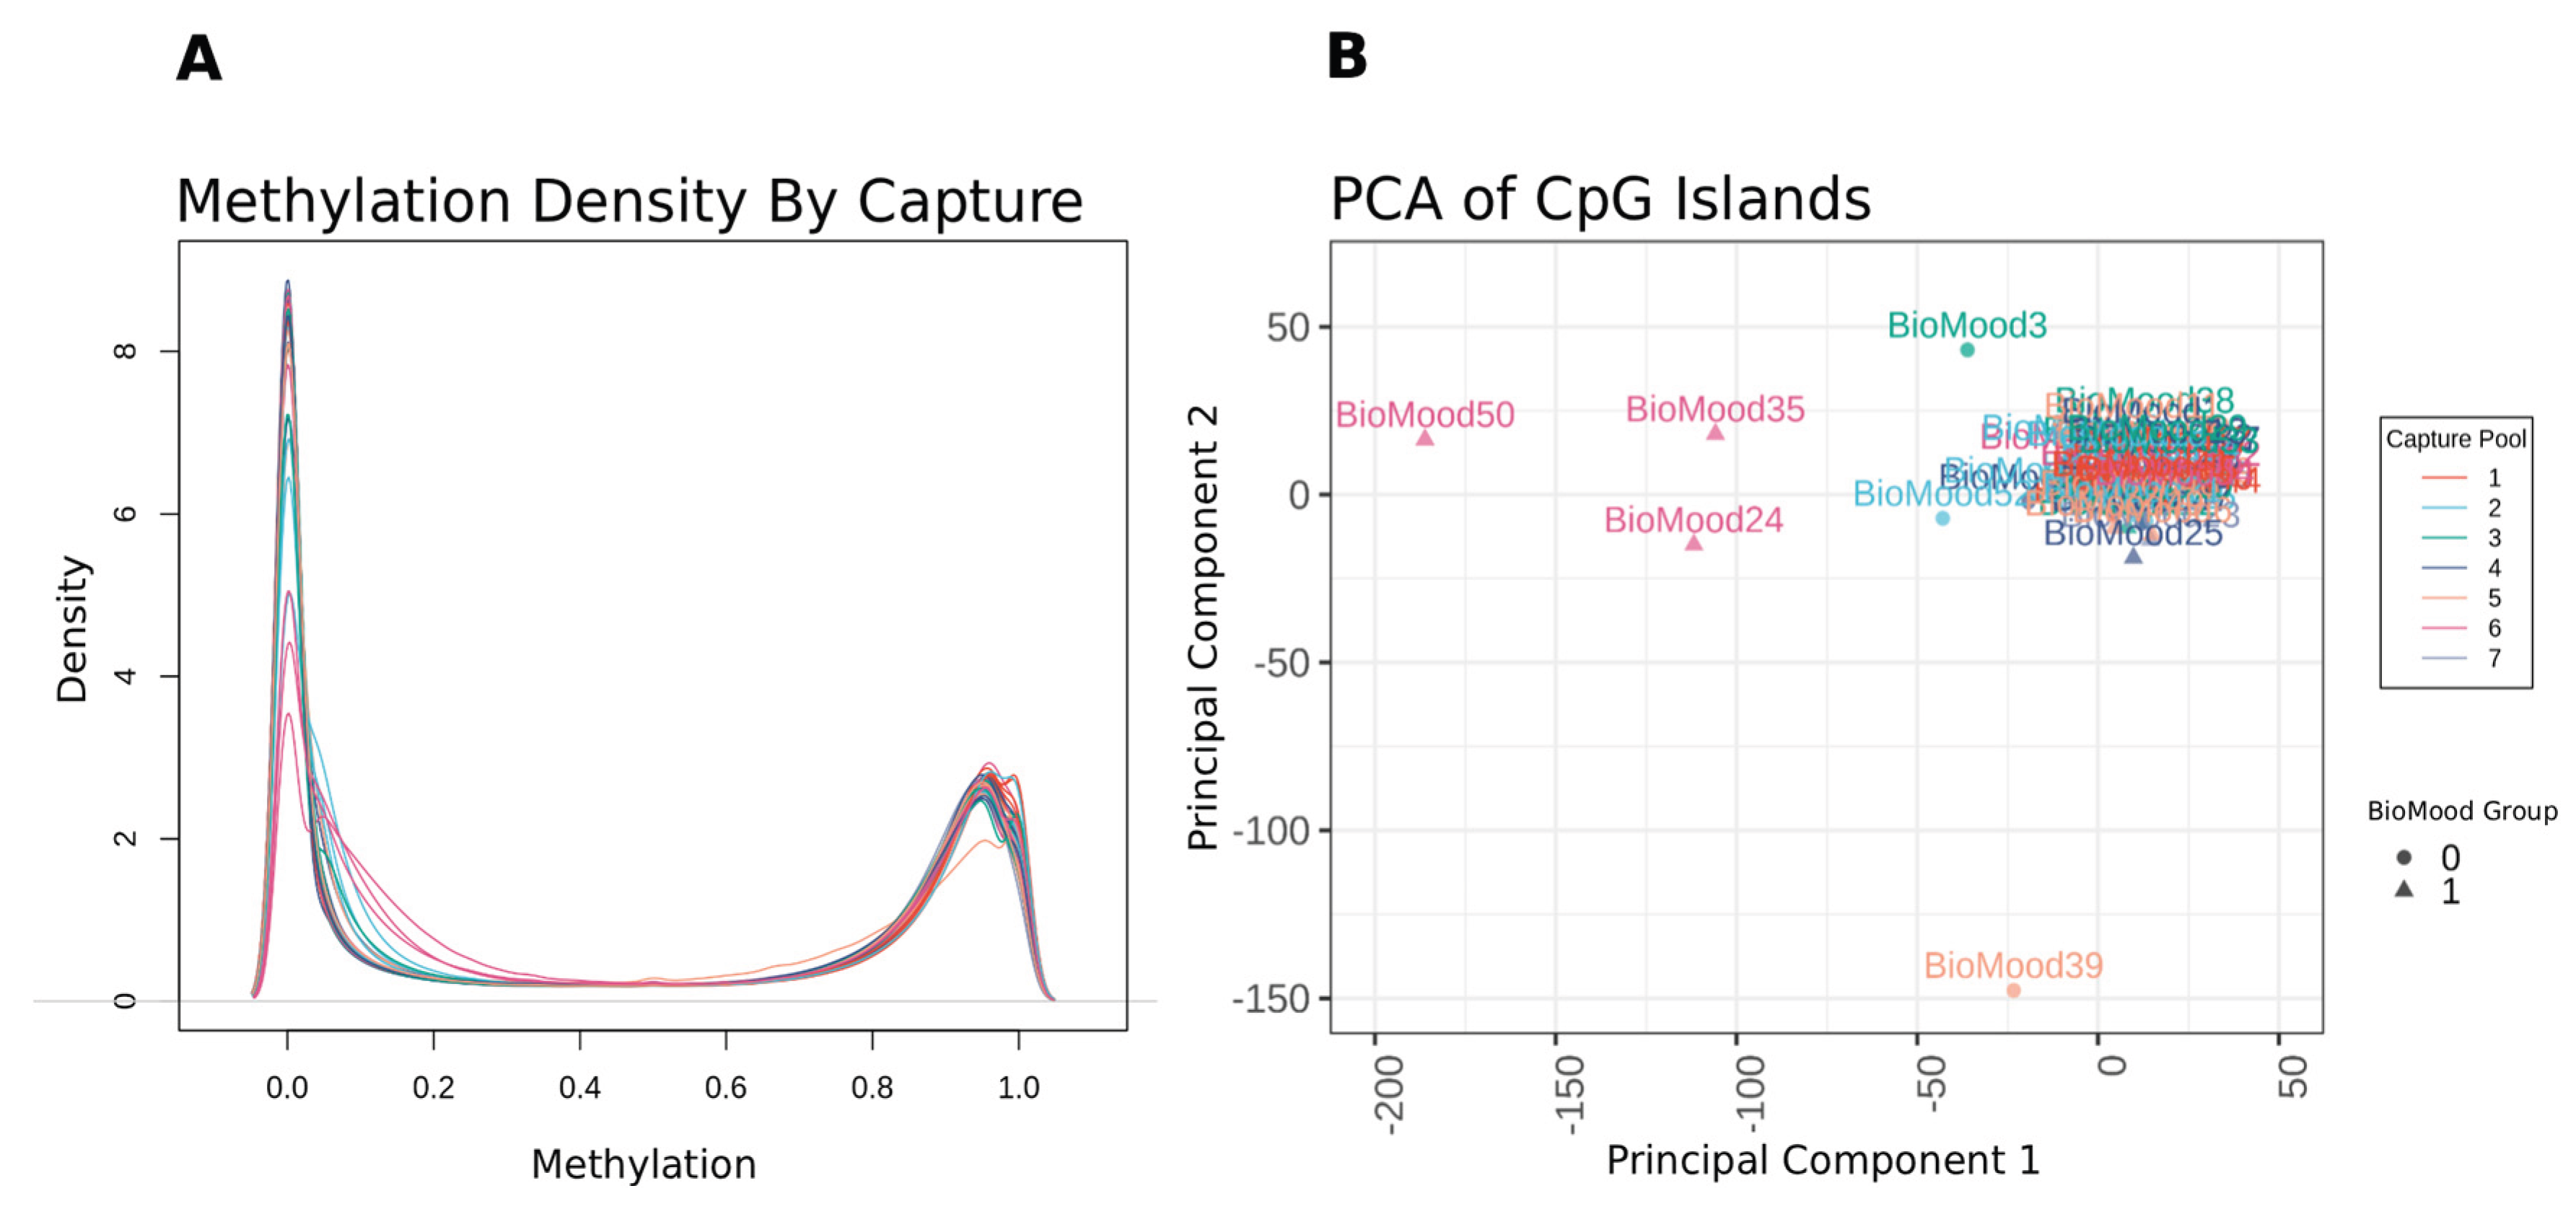
Figure 2.
Manhattan Plots of differentially methylated CpG sites associated with MDA. Vertical axis represents log_10(unadjusted p values) of the logistic regression analysis, horizontal axis showing the location of the CpG within each chromosome. Threshold for suggestive and significant associations shown as horizontal dashed lines. CpGs are coloured by chromosomes.
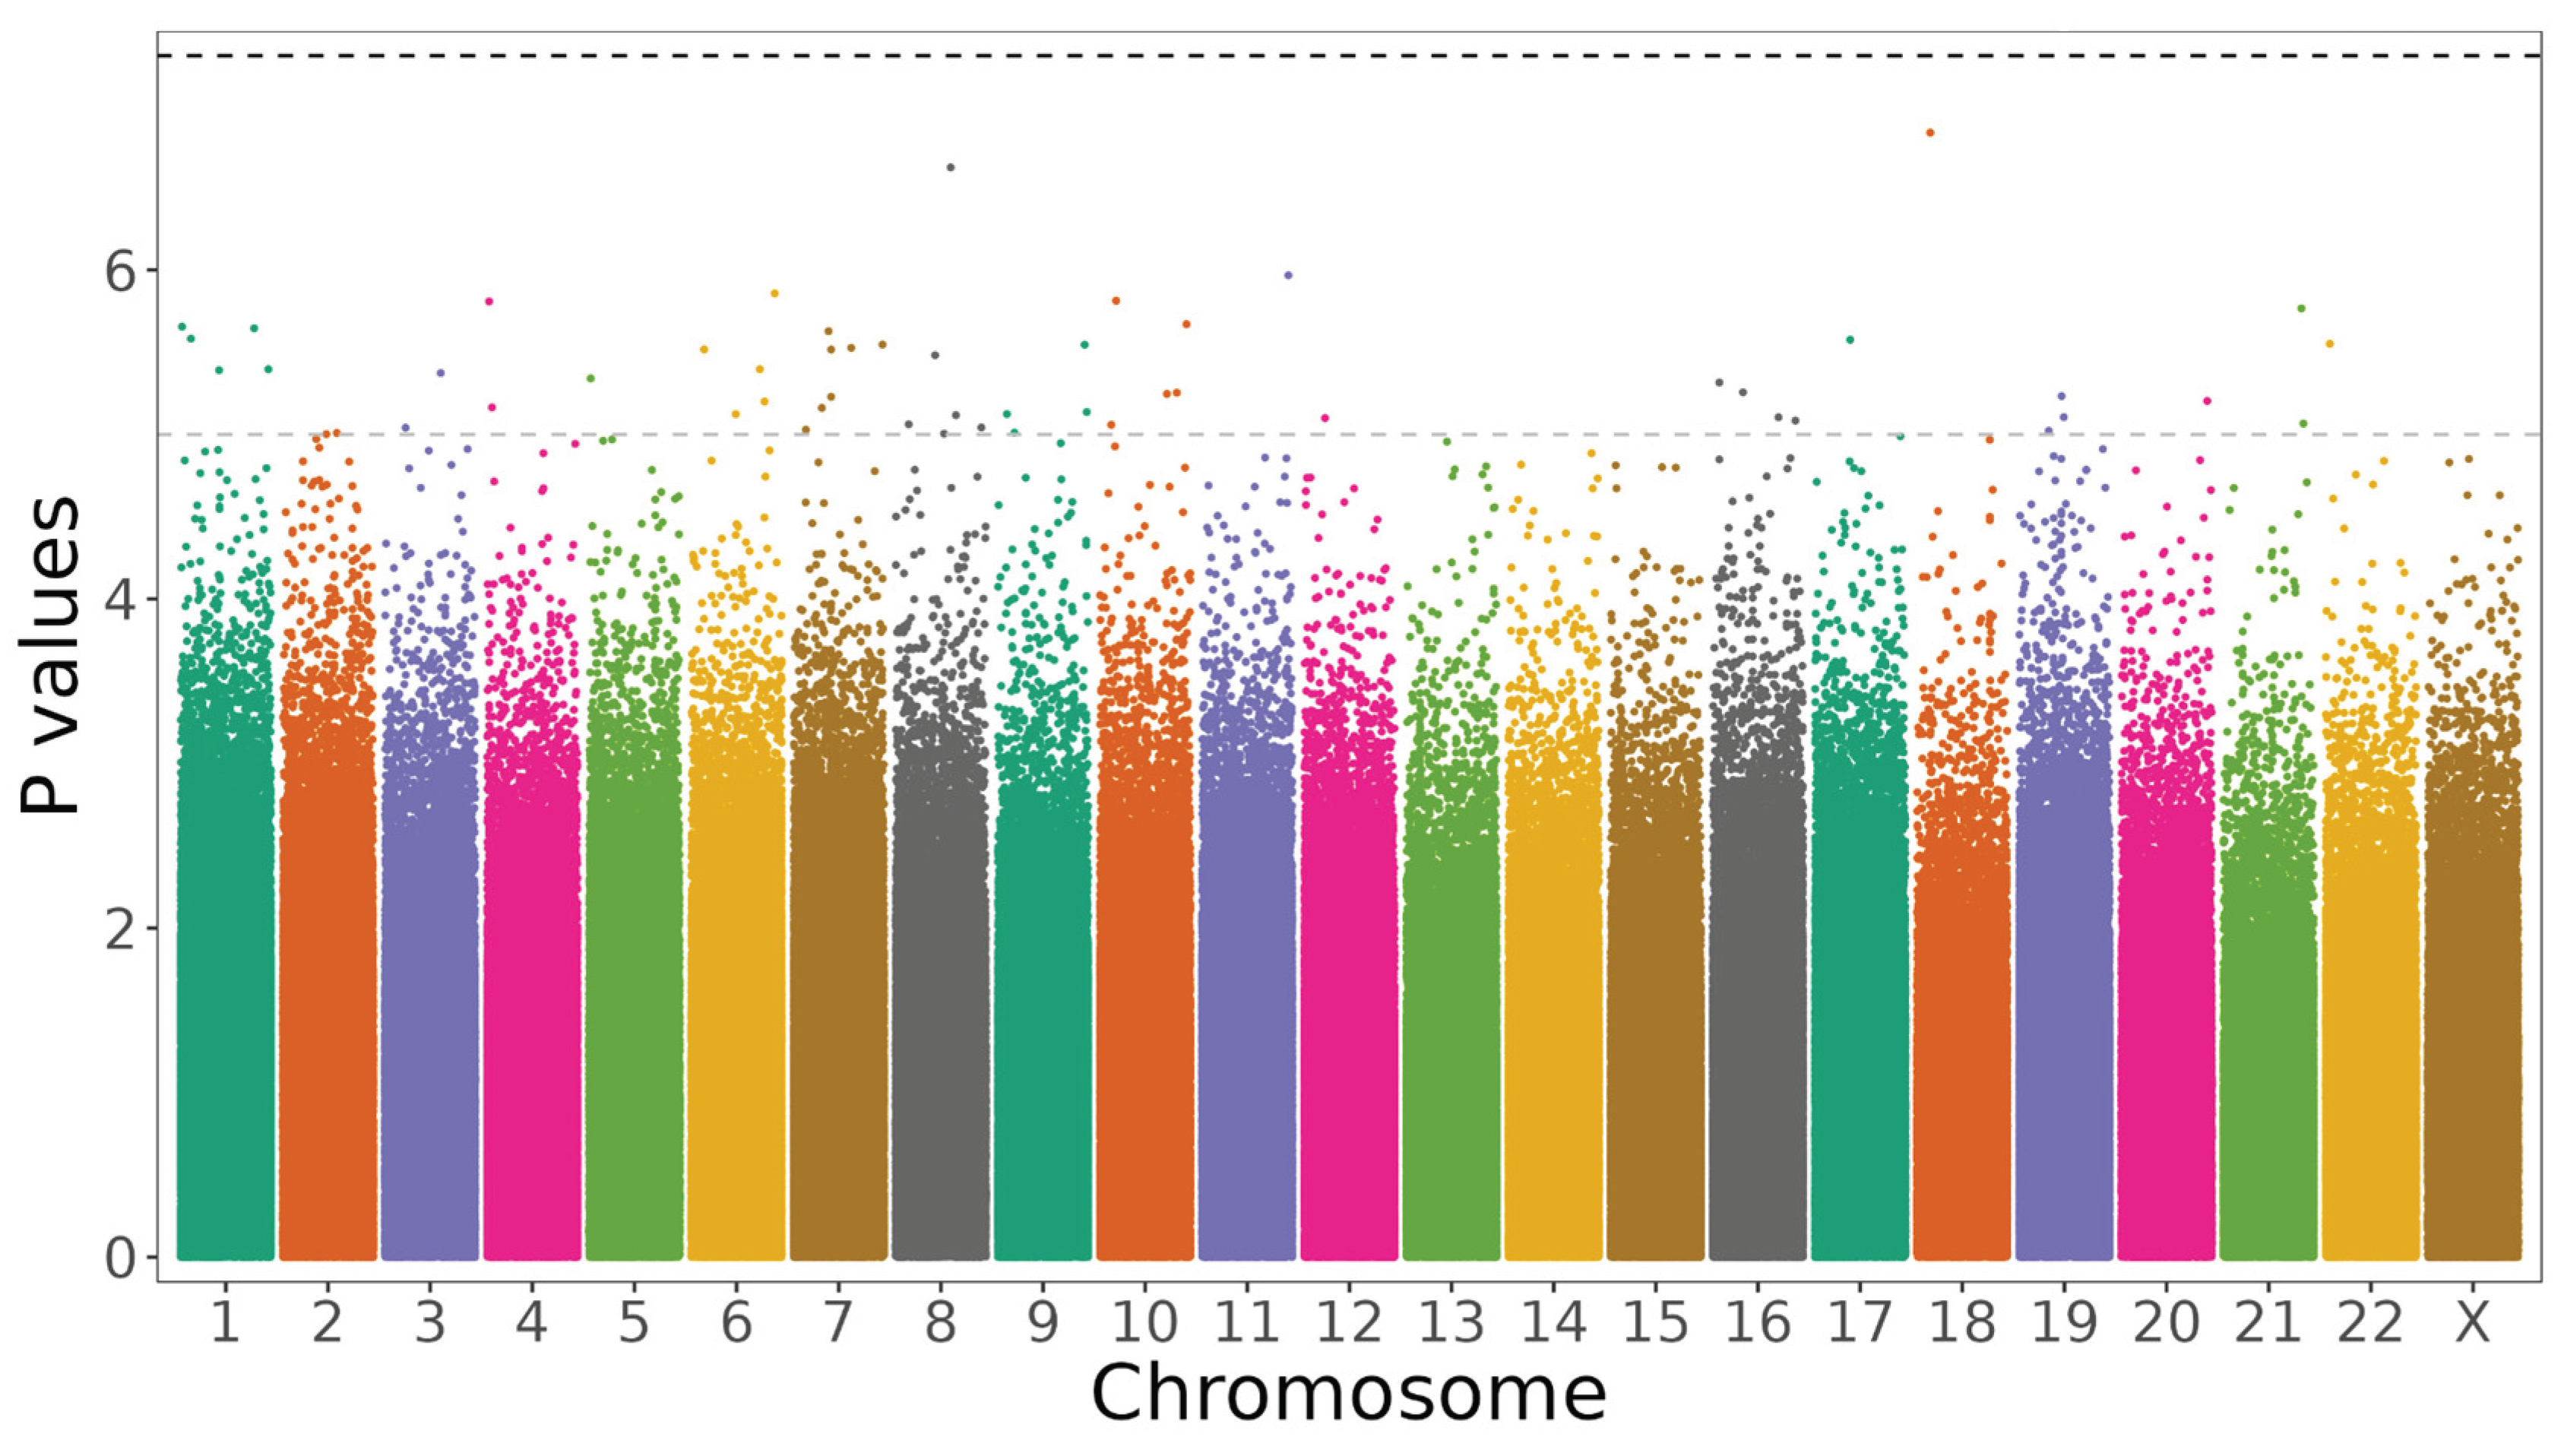
Figure 3.
Manhattan plot of differentially methylated CpG sites within promoter regions associated with MDA. Vertical axis represents log_10(unadjusted p values) of the logistic regression analysis, horizontal axis showing the location of the CpG within each chromosome. Threshold for suggestive and significant associations shown as horizontal dashed lines. Coloured by CpGs within IFI30 (violet) and CpGs with suggestive associations (blue). CpG sites with suggestive association within APCDD1 and COL18A1 are also labelled.
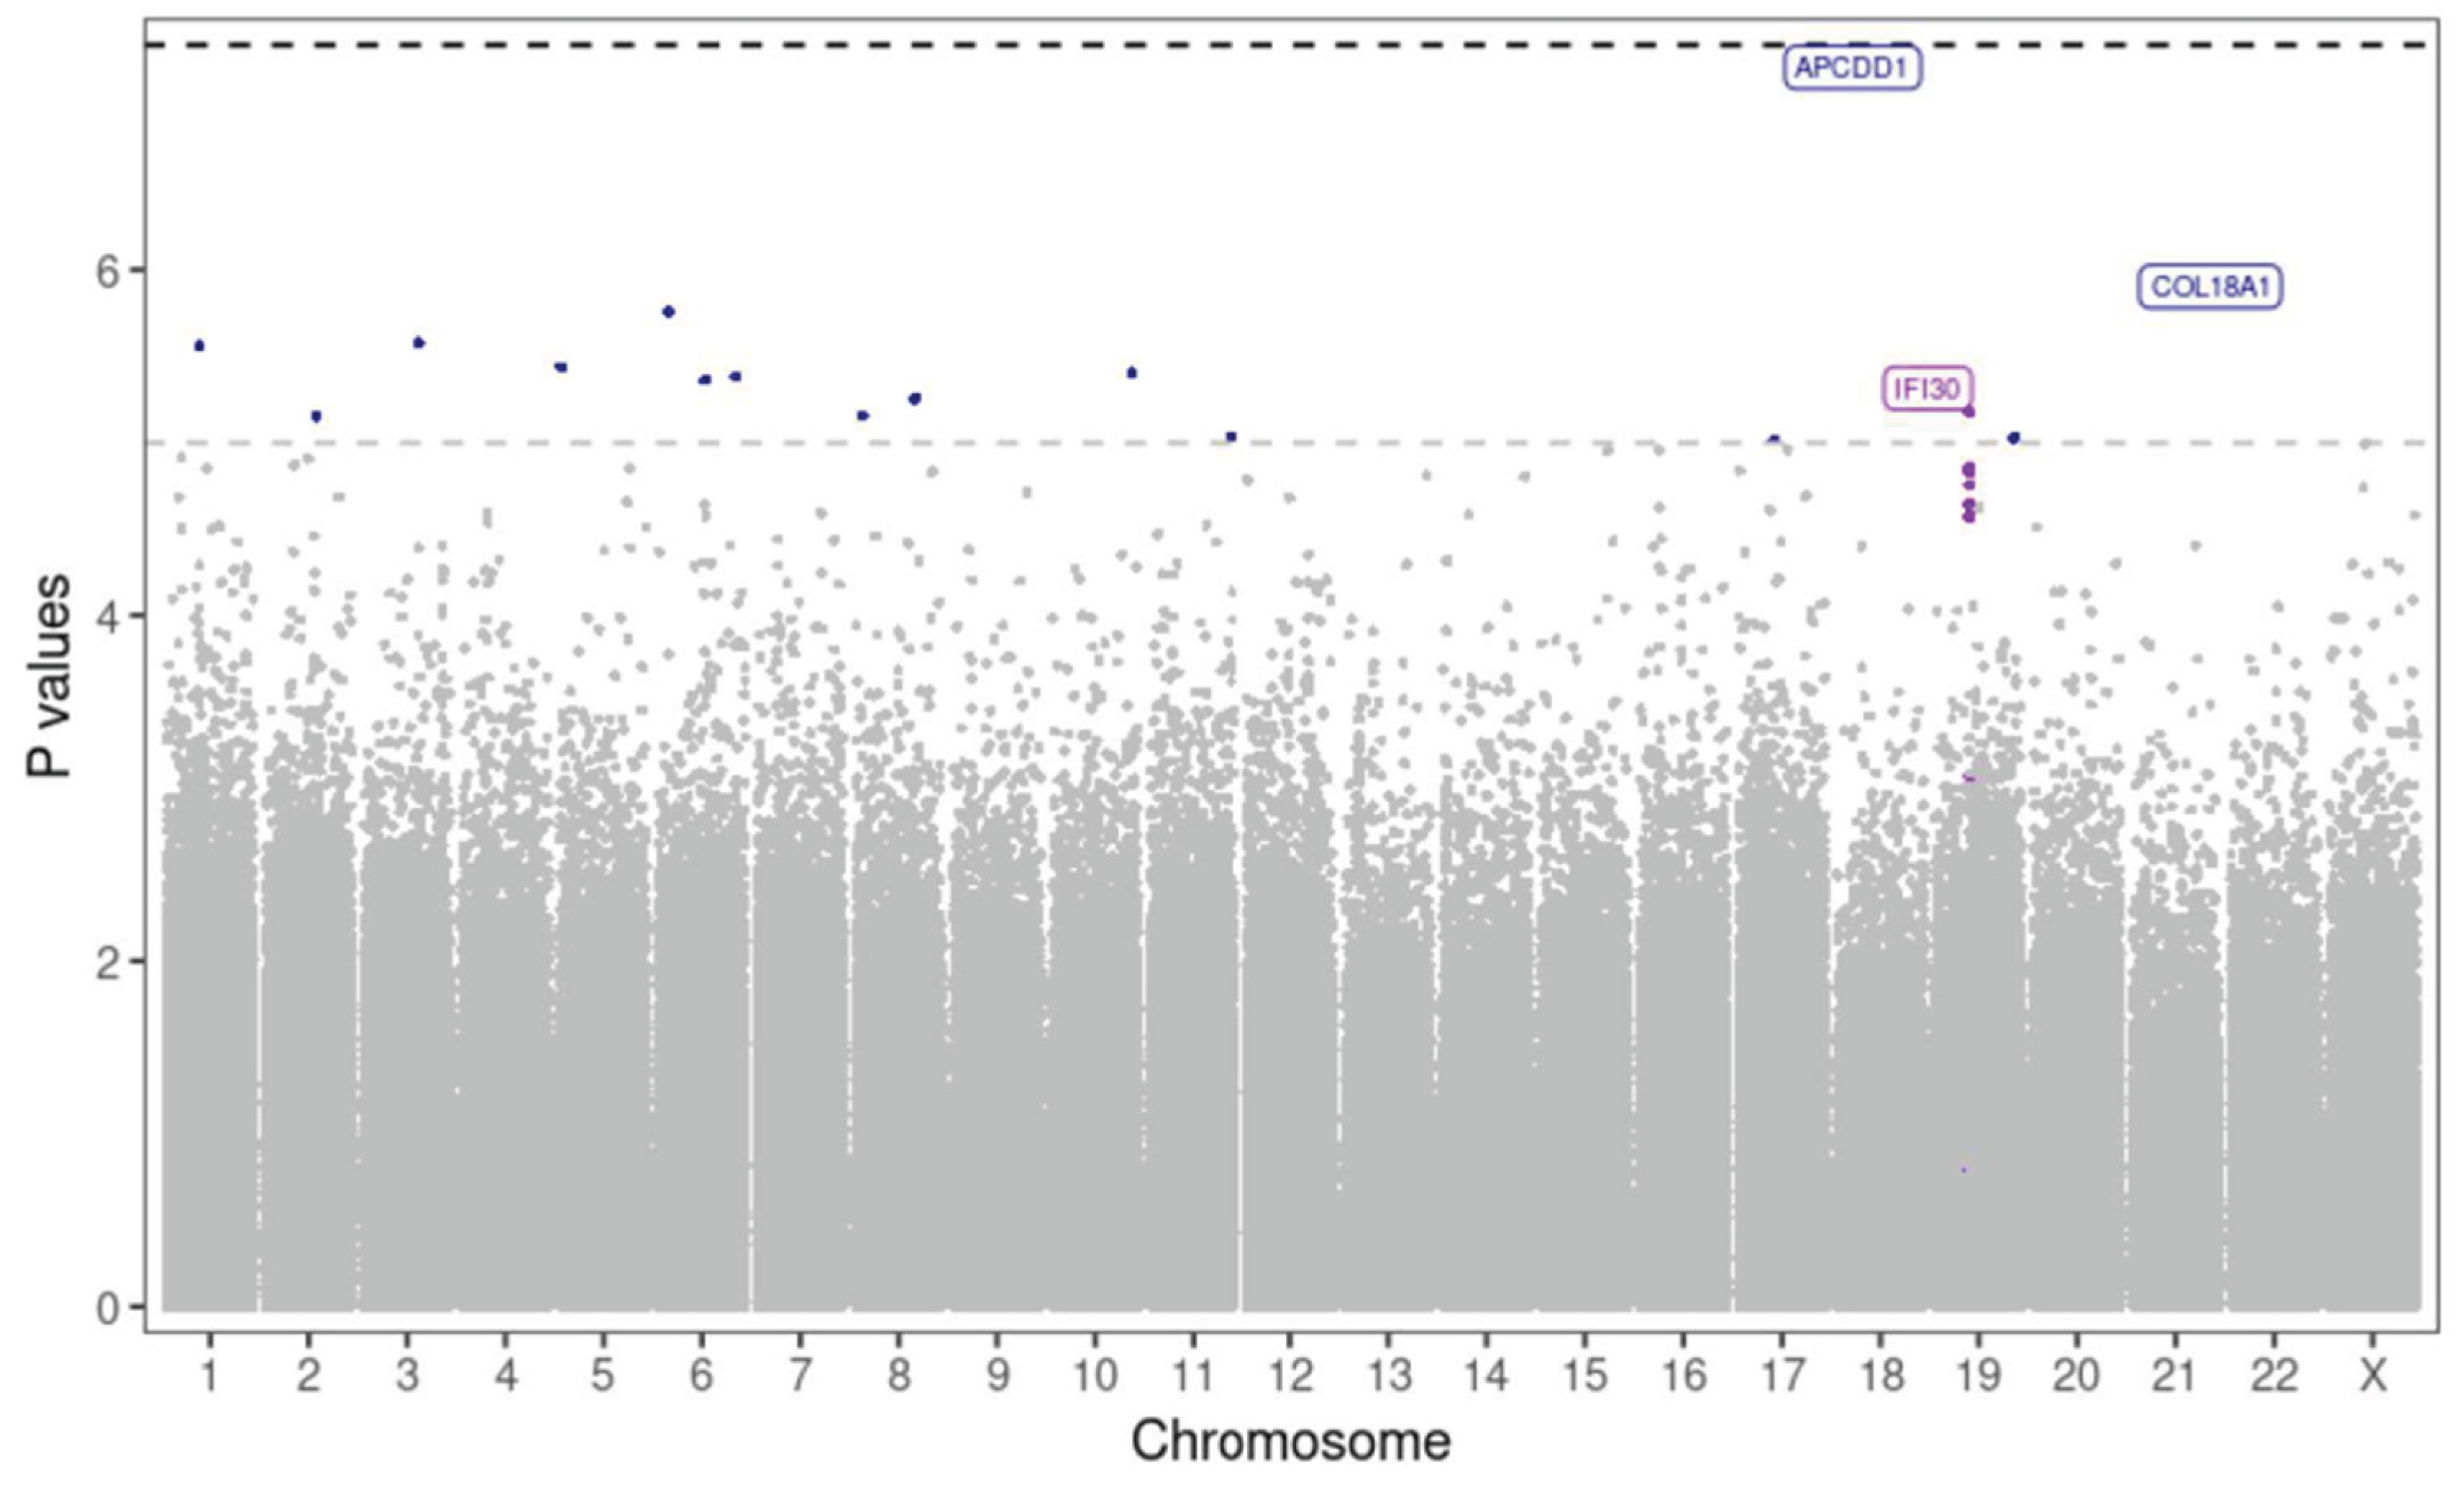
Figure 4.
Vertical axis represents log_10(unadjusted p values) of the logistic regression analysis, horizontal axis showing the location of the CpG within each chromosome. Threshold for significant gene-level associations shown as horizontal dashed line. a) Manhattan plot of CpGs located within chromosome 21, violet-coloured points denoting tested CpGs located within COL18A1. b) Manhattan plot of CpGs located within chromosome 5, violet-coloured points denoting CpGs located within PPARGC1B.
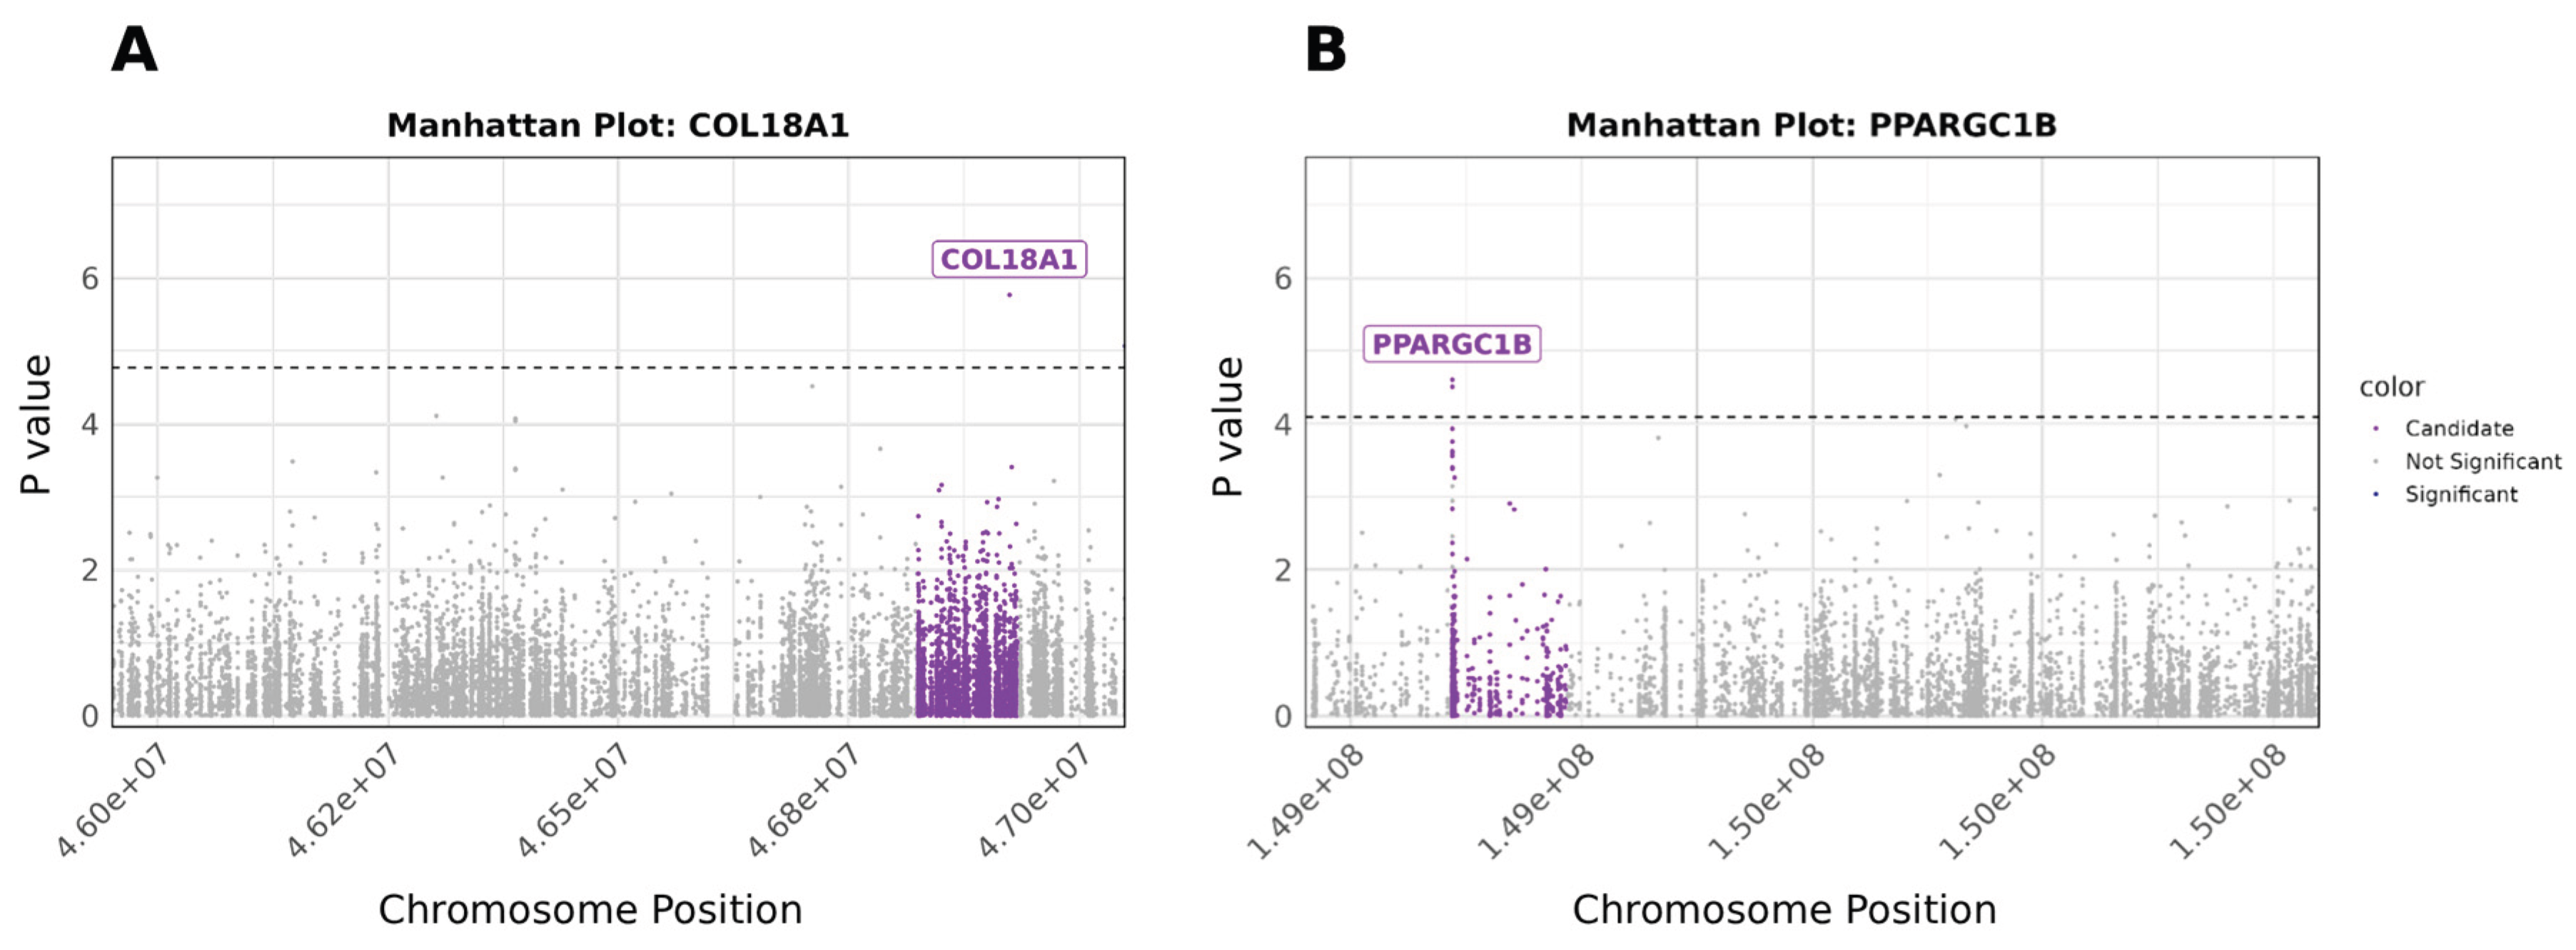
Figure 5.
Manhattan plot of differentially methylated CpG sites associated with GlycA levels. Vertical axis represents log_10(unadjusted p values) of the logistic regression analysis, horizontal axis showing the location of the CpG within each chromosome. Threshold for suggestive and significant associations shown as horizontal dashed lines. Coloured by CpGs within intergenic region and LINC02331 (violet) and CpGs with suggestive associations (blue).
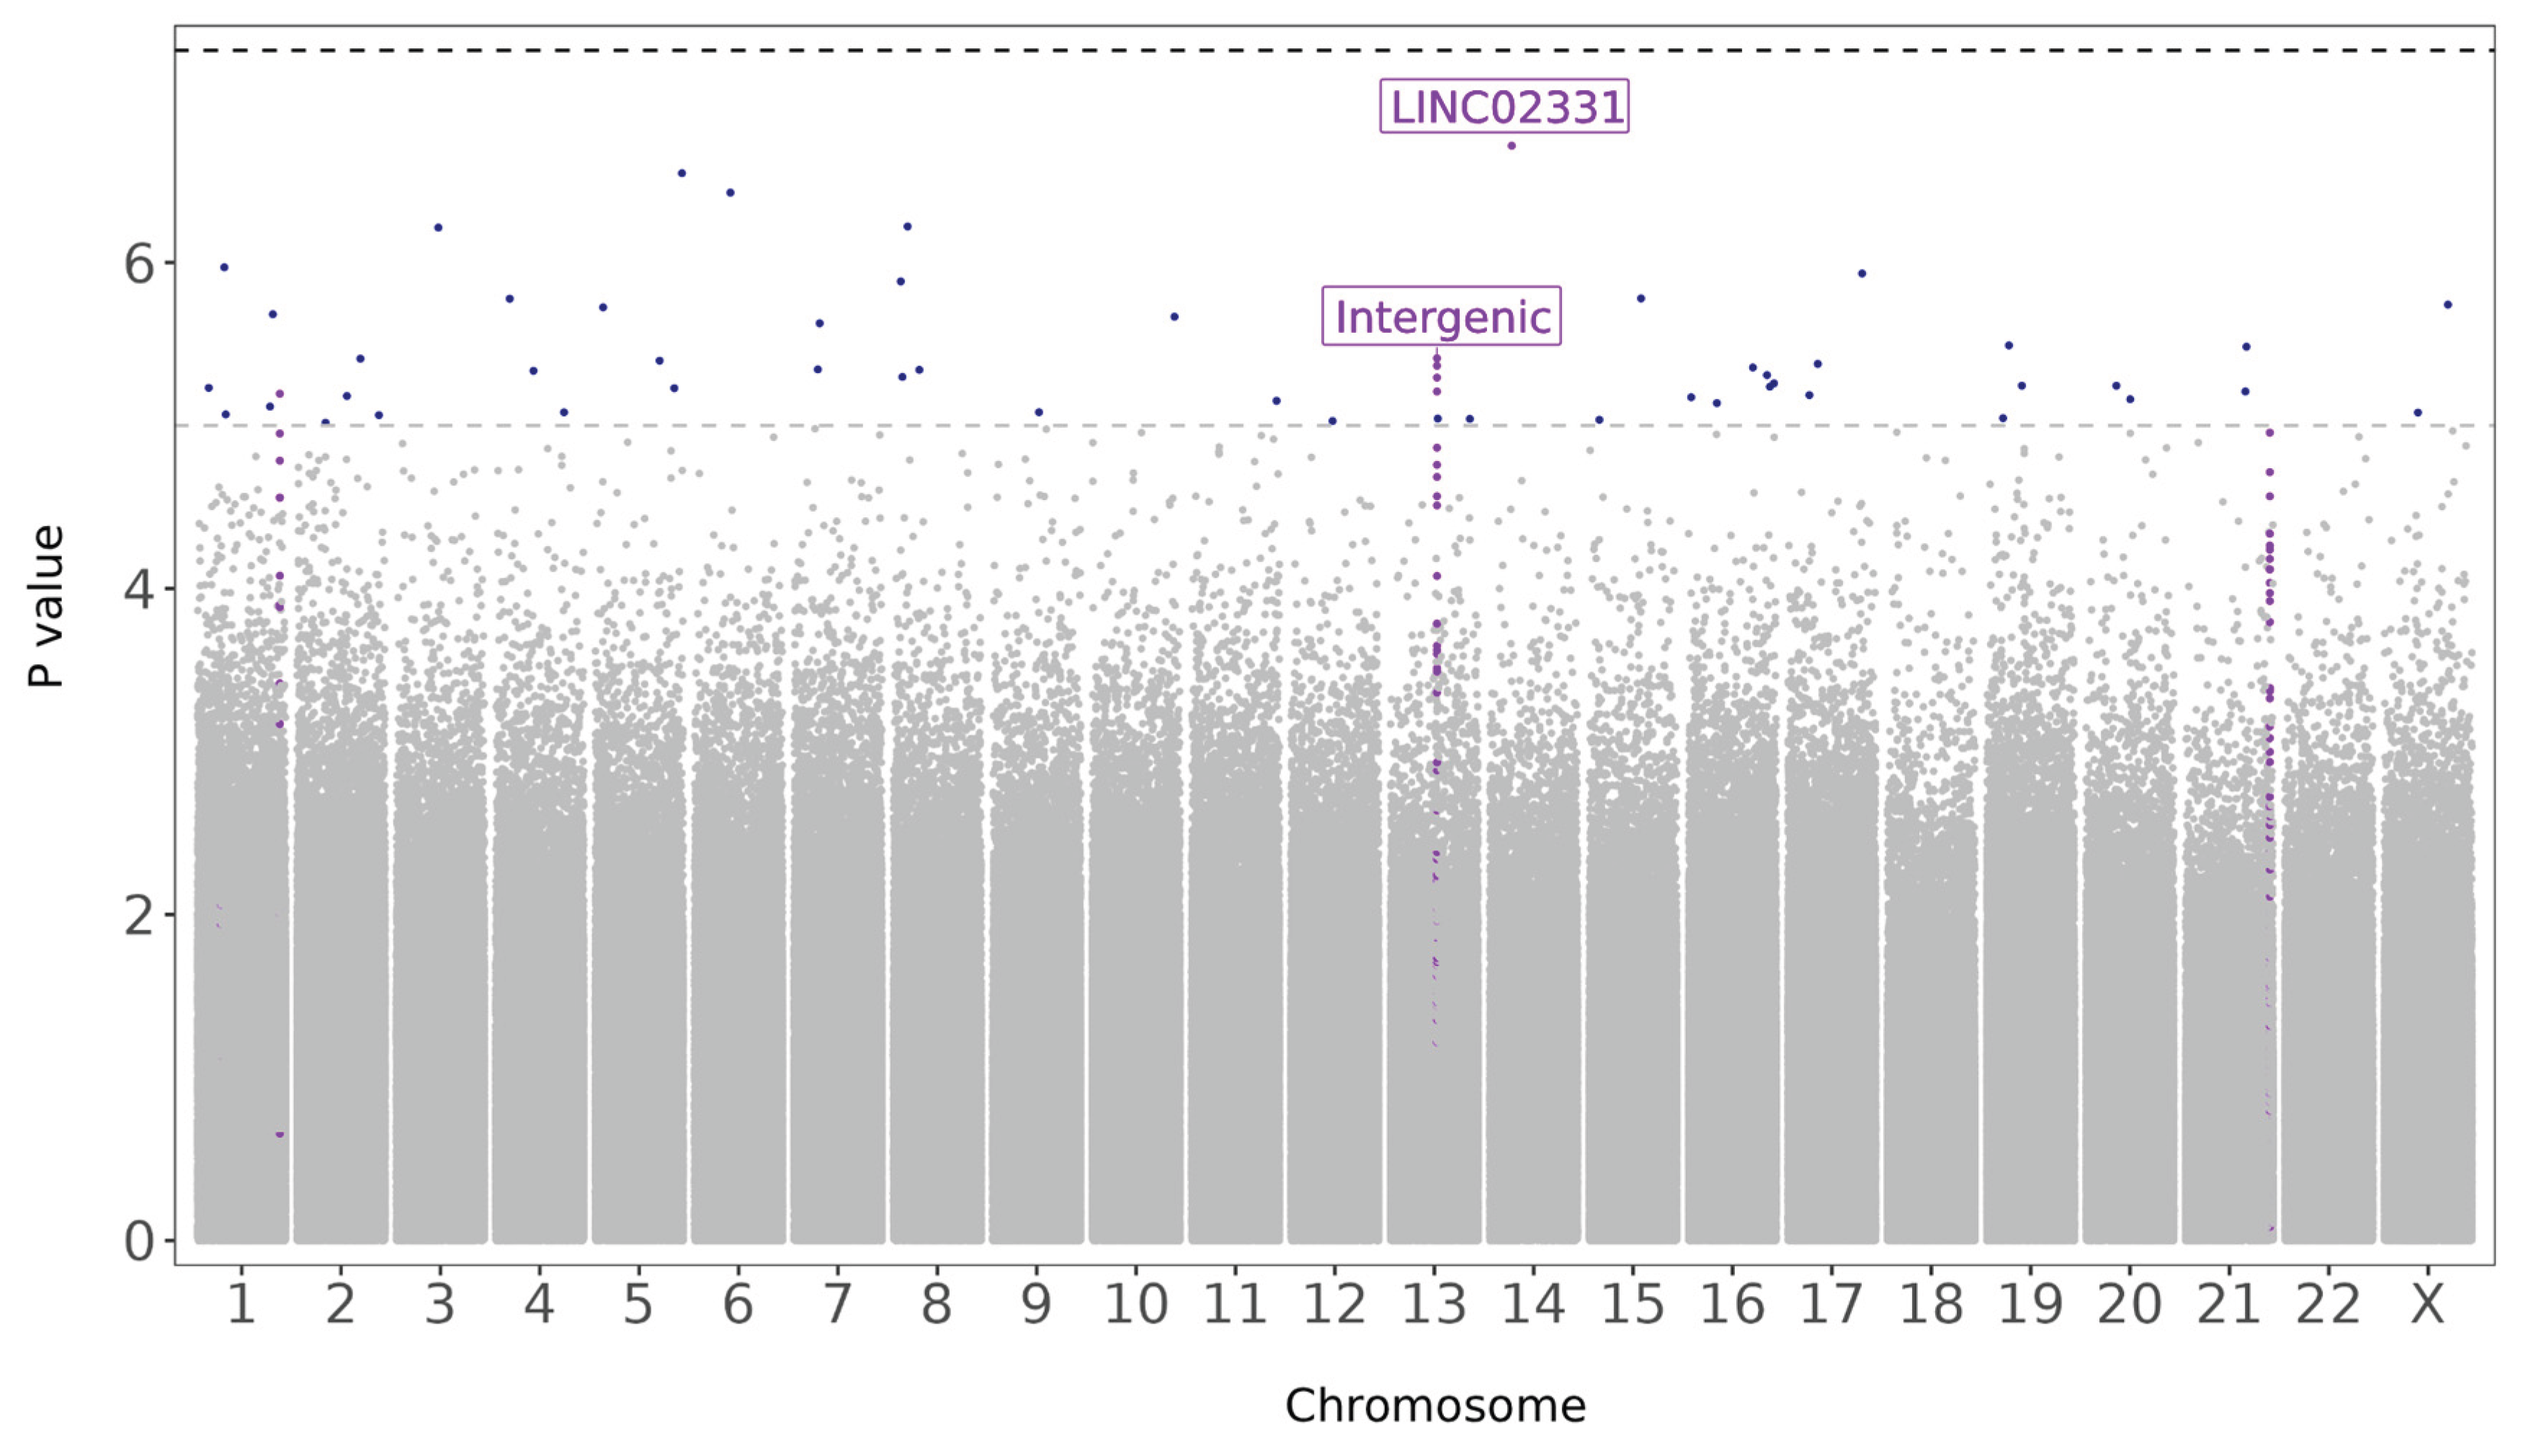
Figure 6.
Manhattan plot of differentially methylated CpG sites associated with SPC3 levels. Genome-wide linear regression detected one significantly different methylated CpG site within gene TSC2 with strong evidence for association with SPC3 circulating metabolite levels (p-value < 5e-8). A possible DMRs within ZFPM1 and an intergenic region of chromosome 6 were also identified.
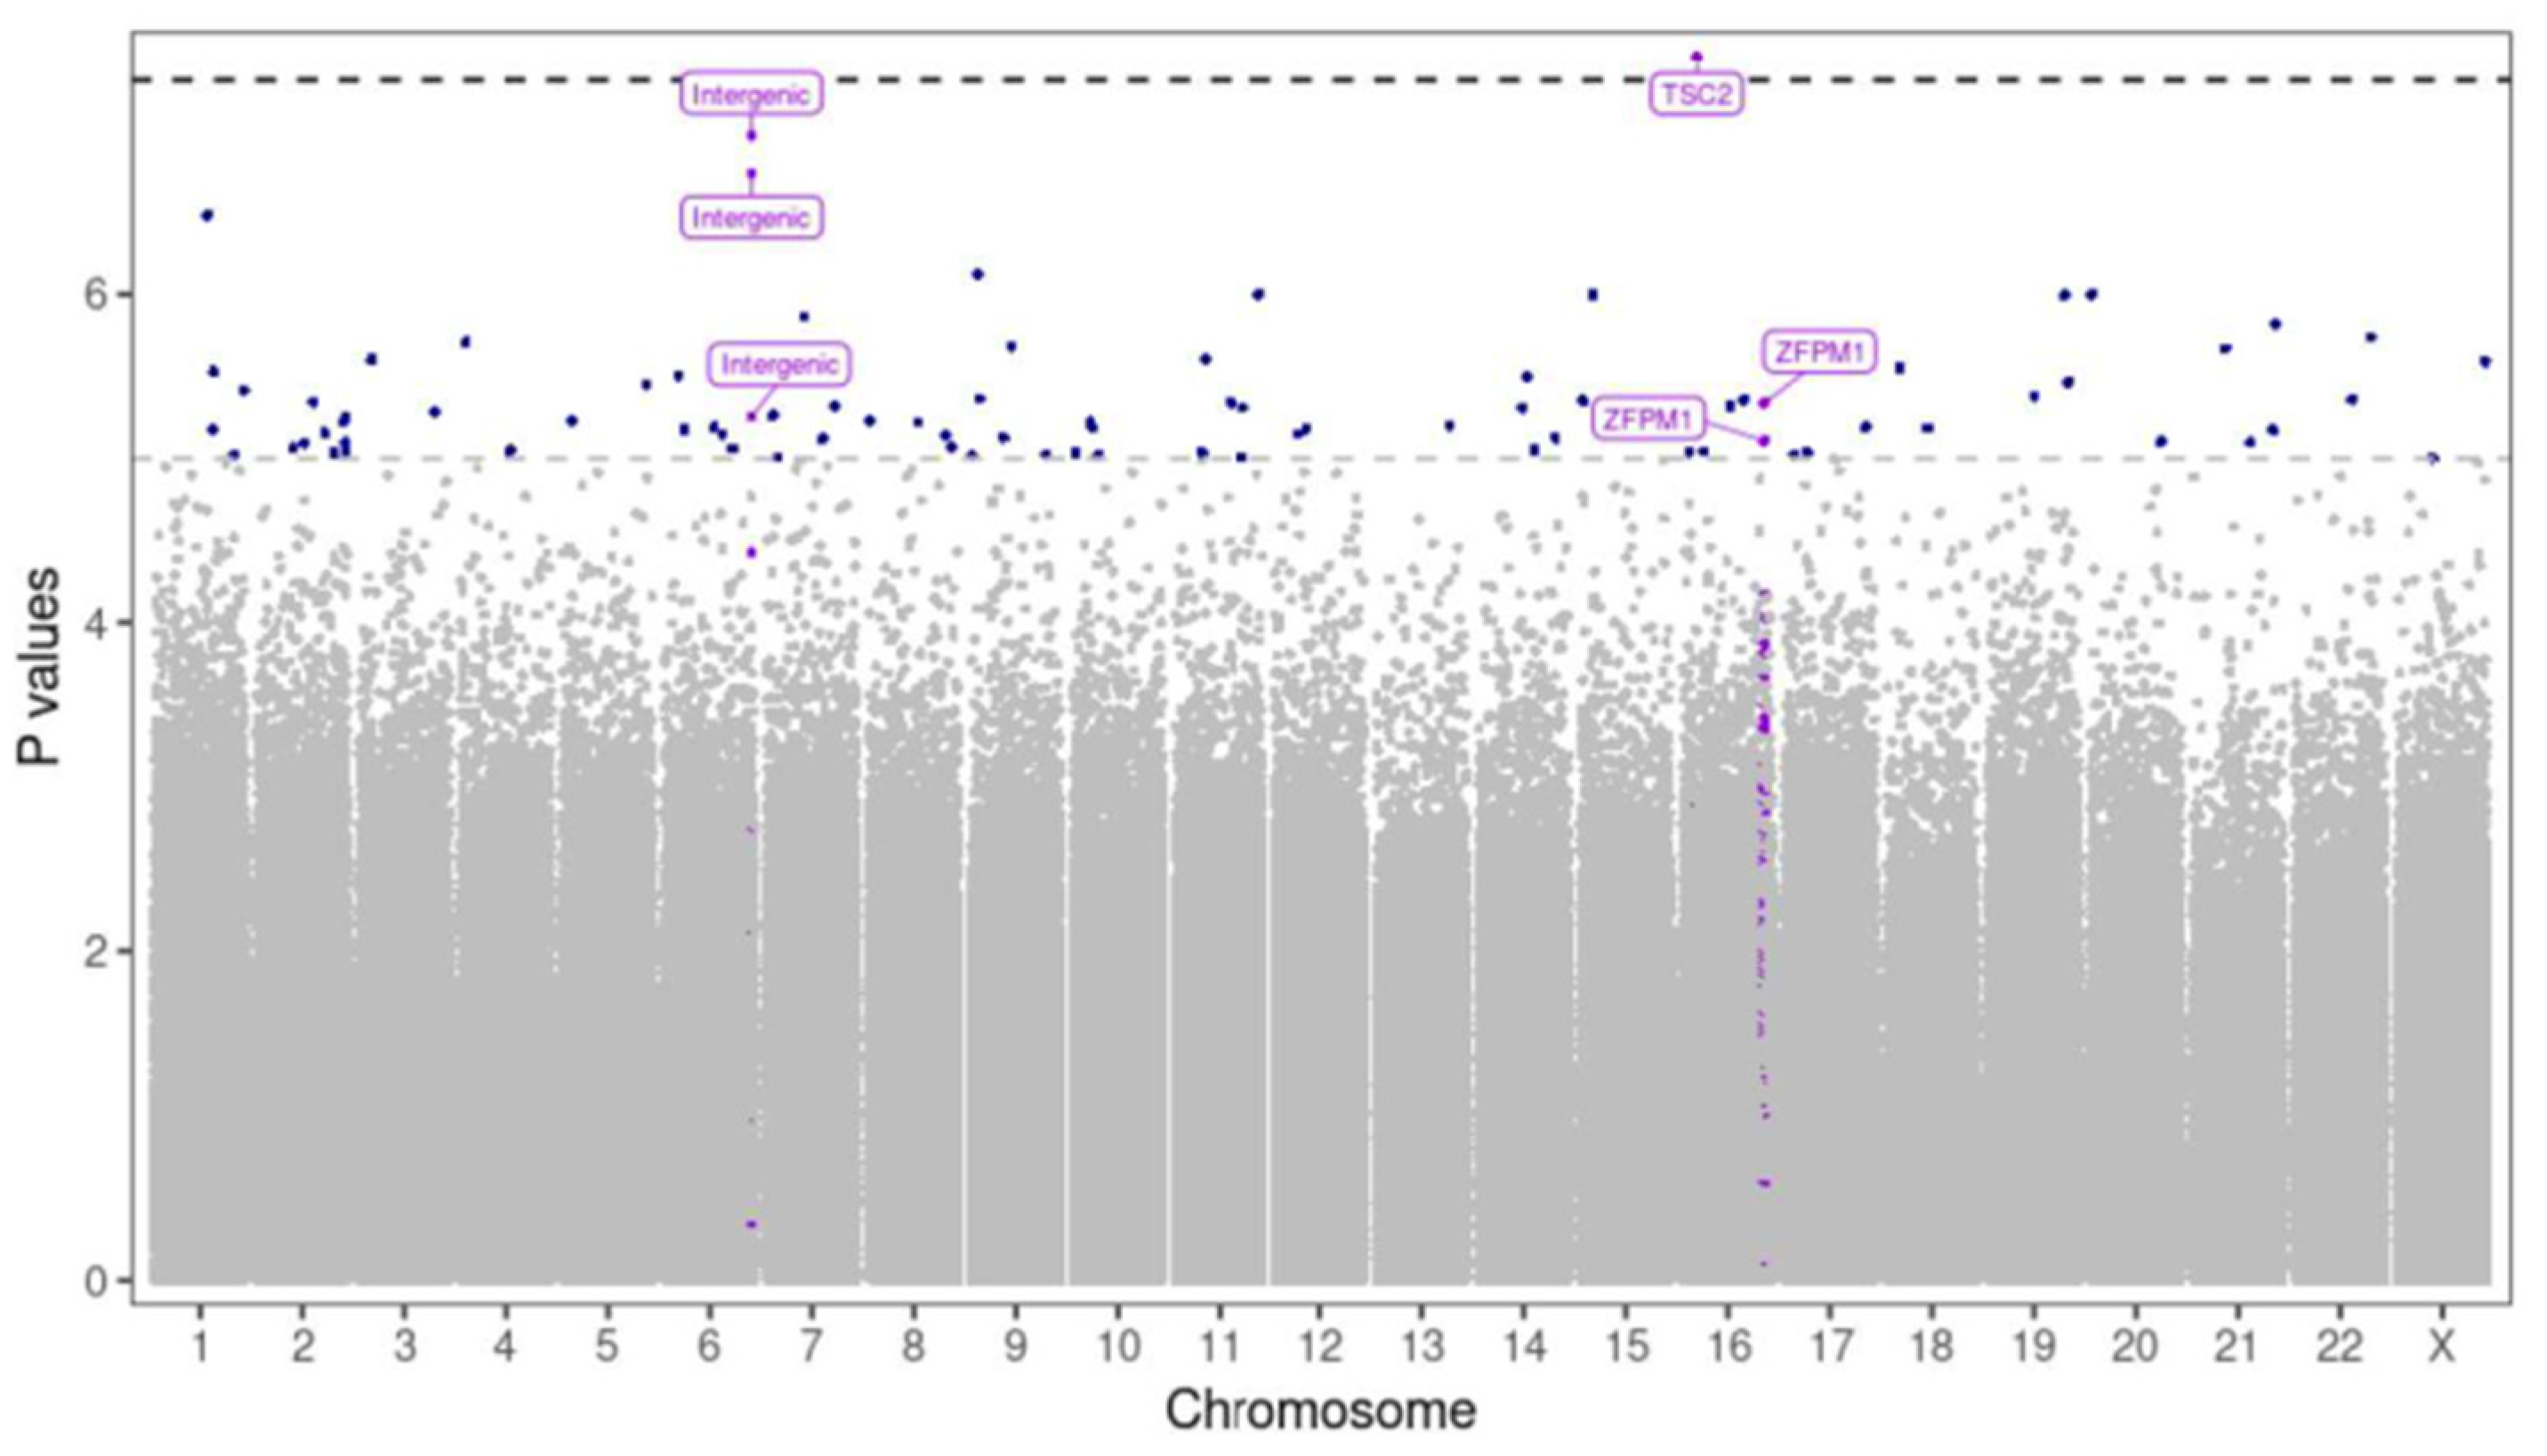

Table 1.
Demographic information of participants in the BioMood study.
| Mediterranean Diet Alignment | |||
|---|---|---|---|
| Variable | Low N = 25 | High N = 27 | p-value1 |
| Age in years, Mean (SD) | 31.3 (3.7) | 32.8 (3.9) | 0.154 |
| Pre-pregnancy weight, kg, Mean (SD) | 74 (12) | 71 (15) | 0.346 |
| Pre-pregnancy Body Mass Index (BMI), kg/m², Mean (SD) | 28.0 (4.2) | 25.3 (5.4) | 0.055 |
| Parity, n (%) | 0.601 | ||
| 0 | 14 (58%) | 13 (52%) | |
| 1 | 9 (38%) | 9 (36%) | |
| 2 | 1 (4.2%) | 3 (12%) | |
| Education, n (%) | 0.569 | ||
| Bachelor | 10 (40%) | 12 (44%) | |
| Other | 2 (8.0%) | 2 (7.4%) | |
| Postgrad | 6 (24%) | 8 (30%) | |
| Trade | 2 (8.0%) | 4 (15%) | |
| Year 10 | 1 (4.0%) | 0 (0%) | |
| Year 12 | 4 (16%) | 1 (3.7%) | |
| Ethnicity, n (%) | 0.244 | ||
| Asian | 0 (0%) | 3 (11%) | |
| Australian | 5 (20%) | 3 (11%) | |
| European | 19 (76%) | 20 (74%) | |
| New Zealander | 0 (0%) | 1 (3.7%) | |
| North American | 1 (4.0%) | 0 (0%) | |
| Pregnancy Morbidity, n (%) | 10 (67%) | 7 (47%) | 0.461 |
1p-values: t-test for continuous variables; Chi-square test for categorical variables. BMI missing for 3 participants: 2 in Low, 1 in High DietGroup.
Table 2.
Top Ten Differentially Methylated CpG Sites Associated with MDA.
| Chr | CpG location | Effect size | p value | Rank |
|---|---|---|---|---|
| 18 | 10,453,700 | -0.09 | 1.47e-07 | 1 |
| 8 | 99,318,378 | -0.05 | 2.39e-07 | 2 |
| 11 | 129,488,337 | -0.18 | 1.08e-06 | 3 |
| 6 | 167,504,840 | -0.05 | 1.39e-06 | 4 |
| 10 | 22,048,252 | -0.05 | 1.54e-06 | 5 |
| 4 | 719,927 | -0.04 | 4.00e-06 | 6 |
| 21 | 46,924,305 | 0.00 | 7.00e-06 | 7 |
| 10 | 134,829,071 | 0.05 | 8.00e-06 | 8 |
| 1 | 1,011,561 | 0.14 | 9.00e-06 | 9 |
| 20 | 1,749,312 | 0.12 | 1.00e-05 | 10 |
Note: Effect size = logFC of the methylation values from HMDA – LMDA. i.e. positive effect size means there is higher methylation associated with HMDA. Chr = chromosome.
Table 3.
Differentially methylated CpG sites within genes COL18A1 and PPARGC1B, associated with MDA.
Table 3.
Differentially methylated CpG sites within genes COL18A1 and PPARGC1B, associated with MDA.
| Gene | Chr | CpG location | Effect size | p value |
|---|---|---|---|---|
| COL18A1 | 21 | 46024305 | -0.1900 | 1.71e-06* |
| COL18A1 | 21 | 46028556 | -0.0800 | 3.91e-04 |
| COL18A1 | 21 | 4,850565 | -0.0500 | 6.86e-04 |
| COL18A1 | 21 | 46847759 | -0.0300 | 8.11e-04 |
| COL18A1 | 21 | 46912286 | 0.0500 | 1.07E-03 |
| PPARGC1B | 5 | 149109910 | -0.0008 | 2.48E-05* |
| PPARGC1B | 5 | 149109894 | 0.0056 | 3.10E-05* |
| PPARGC1B | 5 | 149109896 | -0.0049 | 1.16E-04 |
| PPARGC1B | 5 | 149109928 | 0.0048 | 1.74E-04 |
| PPARGC1B | 5 | 149109878 | 0.0033 | 2.35E-04 |
| PPARGC1B | 5 | 149109885 | 0.0037 | 2.50E-04 |
| PPARGC1B | 5 | 149109917 | 0.0078 | 2.75E-04 |
| PPARGC1B | 5 | 149109926 | 0.0127 | 3.93E-04 |
| PPARGC1B | 5 | 149109923 | 0.0131 | 4.12E-04 |
| PPARGC1B | 5 | 149112287 | -0.0461 | 5.42E-04 |
Note: Effect size = logFC of the methylation values from HMDA – LMDA. i.e. positive effect size means there is higher methylation associated with HMDA. Chr = chromosome. *Candidate gene-level significant association.
Table 4.
Differentially methylated CpG sites reaching a suggestive association with GlycA levels.
| CpG location | Effect size | p value | Rank |
|---|---|---|---|
| 14:54202884 | -1.79E-04 | 5.68E-08 | 1 |
| 14:54202883 | -1.88E-04 | 1.92E-07 | 2 |
| 5:180460233 | 2.24E-05 | 2.84E-07 | 3 |
| 6:41169918 | 5.91E-05 | 3.73E-07 | 4 |
| 8:17077631 | 1.97E-05 | 6.01E-07 | 5 |
| 3:96533874 | 8.01E-05 | 6.11E-07 | 6 |
| 1:27679907 | 4.50E-05 | 1.07E-06 | 7 |
| 17:77804121 | 7.97E-05 | 1.17E-06 | 8 |
| 8:4851534 | -4.82E-05 | 1.31E-06 | 9 |
| 15:74222816 | 4.86E-05 | 1.66E-06 | 10 |
| 4:3241906 | 1.23E-05 | 1.67E-06 | 11 |
| X:125298618 | 7.21E-05 | 1.81E-06 | 12 |
| 5:1809773 | 3.18E-05 | 1.89E-06 | 13 |
| 1:209738171 | -6.49E-05 | 2.08E-06 | 14 |
| 10:134567722 | -2.81E-05 | 2.15E-06 | 15 |
| 7:28446166 | -4.71E-05 | 2.36E-06 | 16 |
| 19:6731459 | 4.49E-05 | 3.22E-06 | 17 |
| 21:45595361 | 1.02E-04 | 3.29E-06 | 18 |
| 13:81229074 | -1.05E-04 | 3.87E-06 | 19 |
| 2:197122105 | 1.03E-04 | 3.89E-06 | 20 |
| 5:149212429 | -1.20E-04 | 4.00E-06 | 21 |
| 17:29889997 | 2.81E-05 | 4.19E-06 | 22 |
| 13:81229049 | -9.97E-05 | 4.30E-06 | 23 |
| 16:75302369 | 4.01E-05 | 4.41E-06 | 24 |
| 7:27161808 | -2.67E-05 | 4.53E-06 | 25 |
| 8:30366931 | 3.83E-05 | 4.56E-06 | 26 |
| 4:42317273 | 1.91E-05 | 4.62E-06 | 27 |
| 16:88162708 | -3.84E-05 | 4.91E-06 | 28 |
| 8:8749147 | -3.69E-05 | 5.04E-06 | 29 |
| 13:81229063 | -1.02E-04 | 5.08E-06 | 30 |
| 16:89608181 | 2.10E-05 | 5.51E-06 | 31 |
| 19:14582522 | -5.35E-05 | 5.70E-06 | 32 |
| 20:31768373 | 4.93E-05 | 5.70E-06 | 33 |
| 16:88799821 | 2.52E-05 | 5.78E-06 | 34 |
| 1:6270202 | -2.85E-05 | 5.87E-06 | 35 |
| 5:176522652 | 4.14E-05 | 5.90E-06 | 36 |
| 21:45547924 | 2.06E-05 | 6.18E-06 | 37 |
| 13:81229086 | -1.07E-04 | 6.19E-06 | 38 |
| 1:230312724 | 1.19E-04 | 6.39E-06 | 39 |
| 17:17723648 | 5.83E-05 | 6.51E-06 | 40 |
| 2:132919912 | 8.82E-05 | 6.59E-06 | 41 |
| 16:611931 | -2.77E-05 | 6.71E-06 | 42 |
| 20:42295412 | -5.40E-05 | 6.90E-06 | 43 |
| 11:130633293 | -3.95E-05 | 7.05E-06 | 44 |
| 16:14544012 | 3.59E-05 | 7.28E-06 | 45 |
| 1:203134670 | -3.66E-05 | 7.66E-06 | 46 |
| 9:124262475 | 4.90E-05 | 8.29E-06 | 47 |
| 4:142141163 | -3.33E-05 | 8.30E-06 | 48 |
| X:48930346 | 3.36E-05 | 8.33E-06 | 49 |
| 1:29587098 | -4.35E-05 | 8.55E-06 | 50 |
| 2:239974560 | 2.14E-05 | 8.64E-06 | 51 |
| 19:3942224 | 1.55E-05 | 9.01E-06 | 52 |
| 13:88326871 | -1.96E-05 | 9.07E-06 | 53 |
| 13:113812961 | 1.45E-04 | 9.11E-06 | 54 |
| 15:32999148 | 2.75E-05 | 9.22E-06 | 55 |
| 12:66134753 | 4.63E-05 | 9.38E-06 | 56 |
| 2:71607090 | -1.60E-04 | 9.61E-06 | 57 |
Chr = chromosome. Effect size = logFC.
Disclaimer/Publisher’s Note: The statements, opinions and data contained in all publications are solely those of the individual author(s) and contributor(s) and not of MDPI and/or the editor(s). MDPI and/or the editor(s) disclaim responsibility for any injury to people or property resulting from any ideas, methods, instructions or products referred to in the content. |
© 2025 by the authors. Licensee MDPI, Basel, Switzerland. This article is an open access article distributed under the terms and conditions of the Creative Commons Attribution (CC BY) license (http://creativecommons.org/licenses/by/4.0/).
Copyright: This open access article is published under a Creative Commons CC BY 4.0 license, which permit the free download, distribution, and reuse, provided that the author and preprint are cited in any reuse.


