
Submitted:
10 September 2025
Posted:
12 September 2025
You are already at the latest version
Abstract
Aiming at the shortcomings of traditional ACO algorithms in indoor localization applications, a high-performance improved ant colony algorithm (HIPACO) based on dynamic hybrid pheromone strategy is proposed. The algorithm divides the ant colony into worker ants (local exploitation) and soldier ants (global exploration) through a division of labor mechanism, in which the worker ants use pheromone-weighted learning strategy for refined search, and the soldier ants perform Gaussian perturbation-guided global exploration; at the same time, adaptive pheromone attenuation model (elite particle enhancement, ordinary particle attenuation) and dimensional balance strategy (sinusoidal modulation function) are designed to dynamically optimize the searching process; moreover, a hybrid guidance mechanism is introduced to apply adaptive Gaussian perturbation guidance on successive failed particles to dynamically optimize the searching process. A hybrid guidance mechanism is introduced to enhance the robustness of the algorithm by applying adaptive Gaussian perturbation to successive failed particles. The experimental results show that in the 3D localization scenario with 4 beacon nodes, the average localization error of HIPACO is 0.84±0.35 m, which is 42.3% lower than that of the traditional ACO algorithm, and the convergence speed is improved by 2.1 times, and the optimal performance is maintained under different numbers of anchor nodes and spatial scales. This study provides an efficient solution to the indoor localization problem in the presence of multipath effect and non-line-of-sight propagation.
Keywords:
RSSI
; ant colony optimization
; pheromone dynamic adjustment
; worker ant-soldier ant division of labor
; indoor positioning
1. Introduction
With the rapid development of the Internet of Things (IoT) technology, indoor local ization technology has demonstrated important application value in the fields of intelligent storage, medical navigation, and emergency disaster relief [1]. Ant Colony Optimization (ACO) algorithm has been successfully applied to indoor positioning due to its distributed computing power, positive feedback mechanism and heuristic search characteristics [2], especially in dealing with complex environmental interference such as multipath effect and non-line-of-sight propagation of RSSI signals, which shows strong adaptability and robustness [3,4].
However, the traditional ACO algorithms still have significant deficiencies in indoor localization applications: first, the fixed parameter settings are difficult to adapt to the dynamically changing indoor environments; second, the lack of an effective dimension balancing mechanism during the search in high-dimensional space leads to the degradation of the localization accuracy; and third, the algorithms are prone to fall into the local optimums and have slow convergence speeds. Aiming at these problems, this paper proposes an improved ant colony optimization algorithm with dynamic hybrid pheromone strategy (HIPACO), which effectively improves the positioning accuracy and convergence performance in complex indoor environments by introducing the worker-ant-soldier division of labor mechanism to realize the dynamic allocation of search capability, designing a dimension-aware pheromone adjustment system to opti mize the efficiency of the high-dimensional search, and adopting a hybrid bootstrap strategy to enhance the algorithm’s robustness. The main contributions include:
(1)Division of labor and collaboration framework: designing a worker ant-soldier ant role differentiation mechanism, where worker ants perform local refinement search through pheromone-weighted learning, and soldier ants perform Gaussian perturbation-based global exploration to achieve dynamic allocation of search capabilities.
(2)Dynamic parameter adjustment: establish a convergence state perception model, adaptively adjust pheromone decay rate, learning factor and other parameters, introduce sinusoidal modulation function to dynamically adjust the pheromone con centration in each dimension, and balance the exploration and development needs in different iteration stages.
(3)Hybrid bootstrapping mechanism: fusing elite particle pheromone enhancement with failed particle local search strategy to improve algorithm robustness.
2. Materials and Methods
2.1. Ant Colony Optimization Algorithm
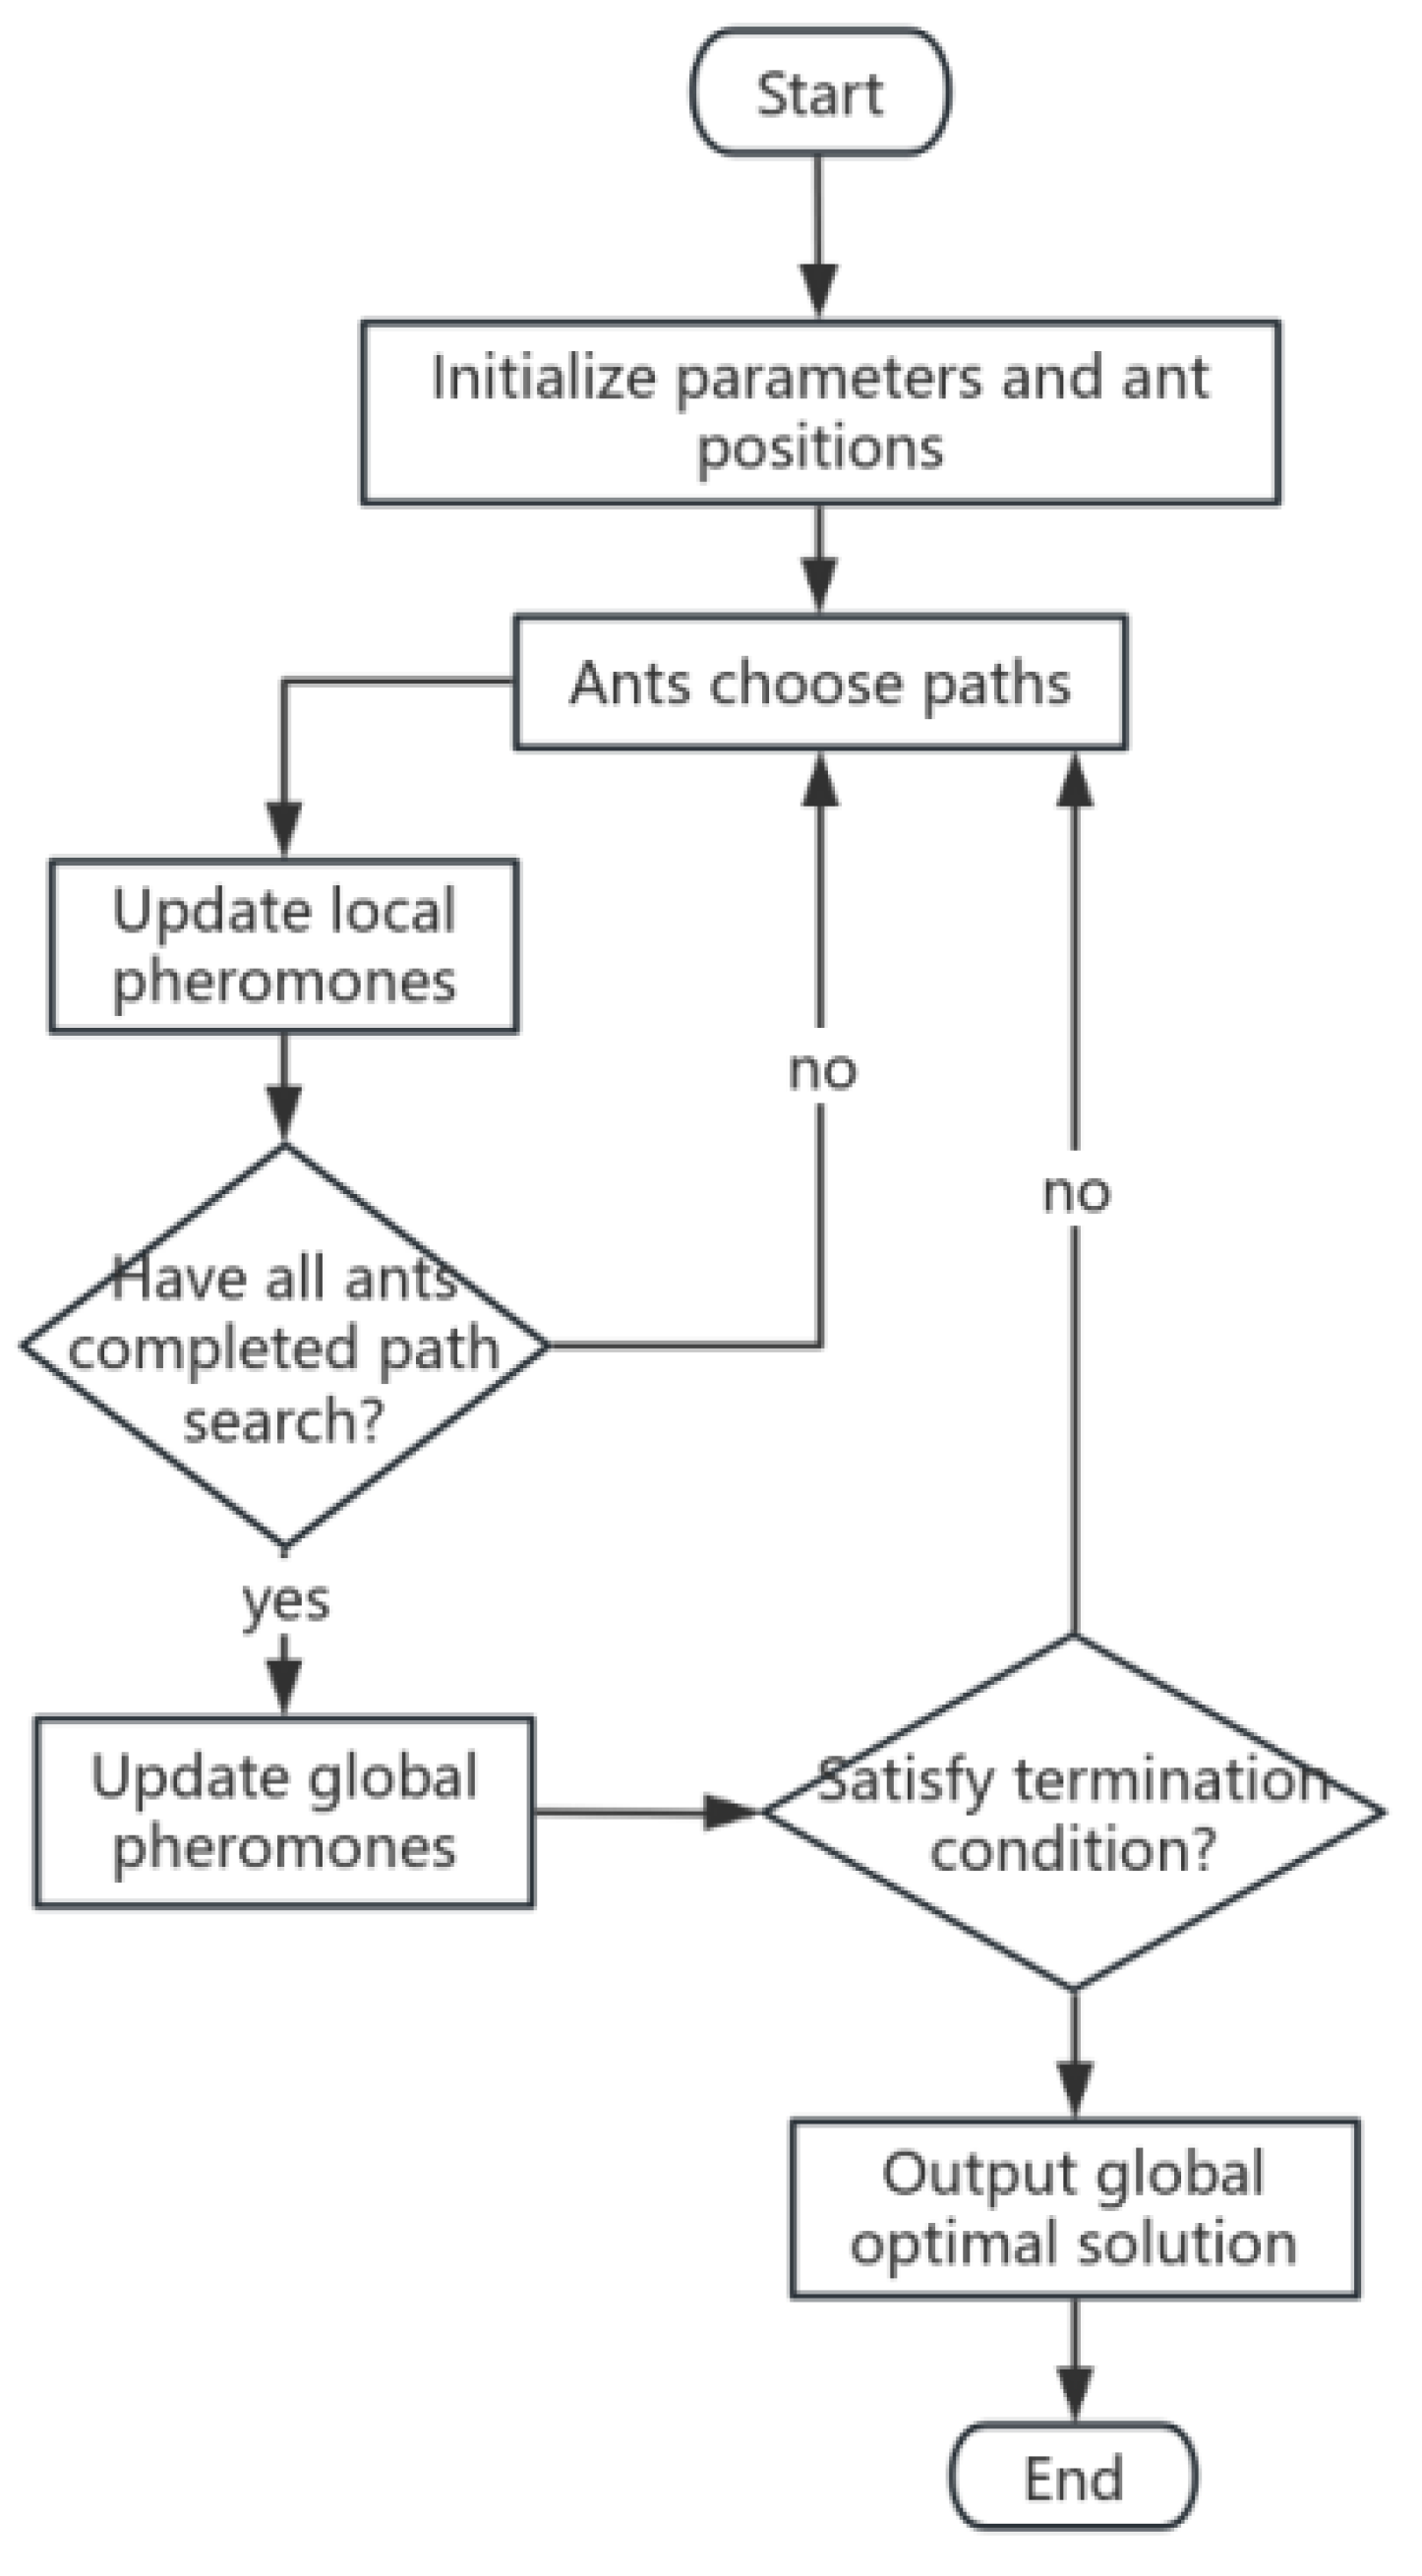
Ant Colony Optimization (ACO) algorithm is a heuristic optimization algorithm that simulates the behavior of an ant colony. In the process of searching for food or returning to the nest, ants release a special chemical, pheromone, on the paths they travel. When choosing the next path to take, the ants will choose the path with higher pheromone concentration with a certain probability. This probability is related to the concentration of pheromone on the path and the heuristic information about the path. The heuristic information is usually defined according to the characteristics of the problem, for example, in the Traveler’s Problem (TSP) problem [5,6], the heuristic information can be the reciprocal of the distance between cities; the closer the distance, the higher the value of the heuristic information, and the higher the probability that the ants will choose that path. The principle mainly includes path finding and pheromone updating, and the algorithm includes the following two processes:
The first stage is path finding optimization, let the ant is located in the city , the probability that it chooses the next city , can be expressed by the following equation:
where is the pheromone concentration on the path , is the heuristic information on the path ,and are the relative importance factors of the pheromone and the heuristic information respectively, and is the set of cities that the ants can choose next.
The second stage is pheromone updating, which is further divided into two parts: global pheromone updating and local pheromone updating. When all ants have com pleted a path search, the pheromone on the path will be updated according to the length of the path they have traveled. The shorter the path is, the better the path is, and the more pheromone is added on it. The global update formula for pheromone is:
where is the pheromone concentration on the path(i,j) at the moment t, is the volatilization coefficient of the pheromone, , which indicates the degree of volatilization of the pheromone over time, is the incremental amount of pheromone left by the ants on the path, and is the total number of ants.
In the process of constructing a path, ants will locally update the pheromone of an edge every time they pass by that edge, in order to enhance the possibility of that path to be selected by the subsequent ants, and at the same time, to give the ants a certain ability to explore new paths. The local pheromone update formula is:
where δ is the local pheromone update factor and is the initial pheromone concentration.
Figure 1.
Flowchart of ACO optimization algorithm.
2.2. Positioning Techniques Based on RSSI Ranging Model
Ranging methods based on Received Signal Strength Indication (RSSI) have been widely studied and applied in the field of indoor localization. In order to estimate the actual distance between the anchor node and the target node, researchers have devel oped a variety of RSSI ranging models, among which the most representative ones include the free space propagation model, the attenuation factor model, and the log arithmic path loss model [7]. In indoor positioning technology, the logarithmic path loss model is the most commonly used model in RSSI ranging [8]. This model is based on the characteristic that the intensity of the wireless signal increases exponentially with distance in the propagation process, and this relationship is used to project the physical distance between the mobile node and the signal transmitting node. Specifically, the relationship between wireless signal strength and physical distance can be described by a mathematical function as:
where PL(d) denotes the path loss at the distance between the transceiver nodes at ; denotes the path loss at the distance between the transceiver nodes at PL; n is the path attenuation factor, which is related to the specific environment.
If is used to denote the transmit power of the transmitting node and denotes the received signal strength of the receiving node, the RSSI for the particle to the beacon can be expressed as:
In practical applications, is usually taken as 1 m, and is the received signal strength at 1m. The combination of Equations (1) and (2) can simplify the ranging model of the particle to the beacon as follows:
2.3. HIPACO Algorithm Design
Aiming at the problems that traditional ant colony optimization algorithm tends to fallinto local optimum, slow convergence speed and parameter sensitivity when deal ing with complex optimization problems, this paper constructs a new localization framework with dynamic balance characteristics by improving the path exploration ability of ant colony algorithm and utilizing it for RSSI node localization. The over all process consists of four stages: initialization stage, global exploration stage, local development stage, and feedback adjustment stage. The initialization phase generates the particle swarm and establishes the pheromone matrix; the global exploration phase performs large-scale search by soldier ant particles; the local exploitation phase performs fine search by worker ant particles; and the feedback adjustment phase dynamically updates the pheromone weights.
2.3.1. The Fitness Function (RMSE) and Batch Evaluation
The fitness function is used to represent the localization error to assess the merit of the particle position, which is defined as the Euclidean distance between the estimated position of the particle and the actual distance extrapolated from the RSSI data:
where X =(x,y,z)is the estimated position of the target (particle position), is the position of the i beacon, is the distance between the target and the the i beacon calculated according to RSSI, and m is the number of beacons. Evaluating the fitness concentration can guide the algorithm to balance global exploration and local exploitation, dynamically optimize the search strategy, and improve the convergence speed and accuracy. Batch evaluation of fitness, on the other hand, saves time overhead to a certain extent, and its specific operation can be divided into three matrices: initial position matrix, calculating prediction distance matrix and calculating error matrix.
2.3.2. Initialization Phase
In this stage,n particles are randomly generated, each particle i is randomly distributed in 3D space, and each particle is uniformly initialized with the pheromone value Φ(t) i in the initialization stage. In order to realize the dynamic balance between exploration and exploitation, inspired by biology, the algorithm introduces the concepts of “worker ants” and “soldier ants”, where the ratio of worker ants is set to λ , and the ratio of soldier ants is set to 1 − λ . The worker ants are responsible for local development, searching around the current optimal solution, which can quickly converge to the potential optimal region and improve the local search accuracy; the soldier ants are responsible for global exploration, jumping out of the current optimal region through random perturbation, avoiding the algorithm from converging to the local optimal region too early, and enlarging the search scope. The collaboration between the two significantly improves the localization accuracy and robustness, and can effectively avoid falling into the local optimal solution.
After initializing the population an evaluation of the initial fitness will be performed and the best adapted particle will be noted as the global optimal particle (i.e., the best particle in history) at the location . Then the main iterative loop will be entered and the parameters will be updated at the beginning of each iteration. In order to balance the development and exploration ability of the algorithm, the proportion of worker ants decreases with the increase of iteration number; the local search radius decays with the square of iteration number, focusing on local optimization in the later stage; the pheromone decay coefficient decreases linearly to accelerate the pheromone volatilization rate of ordinary particles, and Figure 2 shows the dynamic parameter change curve.
Figure 2.
Trend of dynamic parameters.
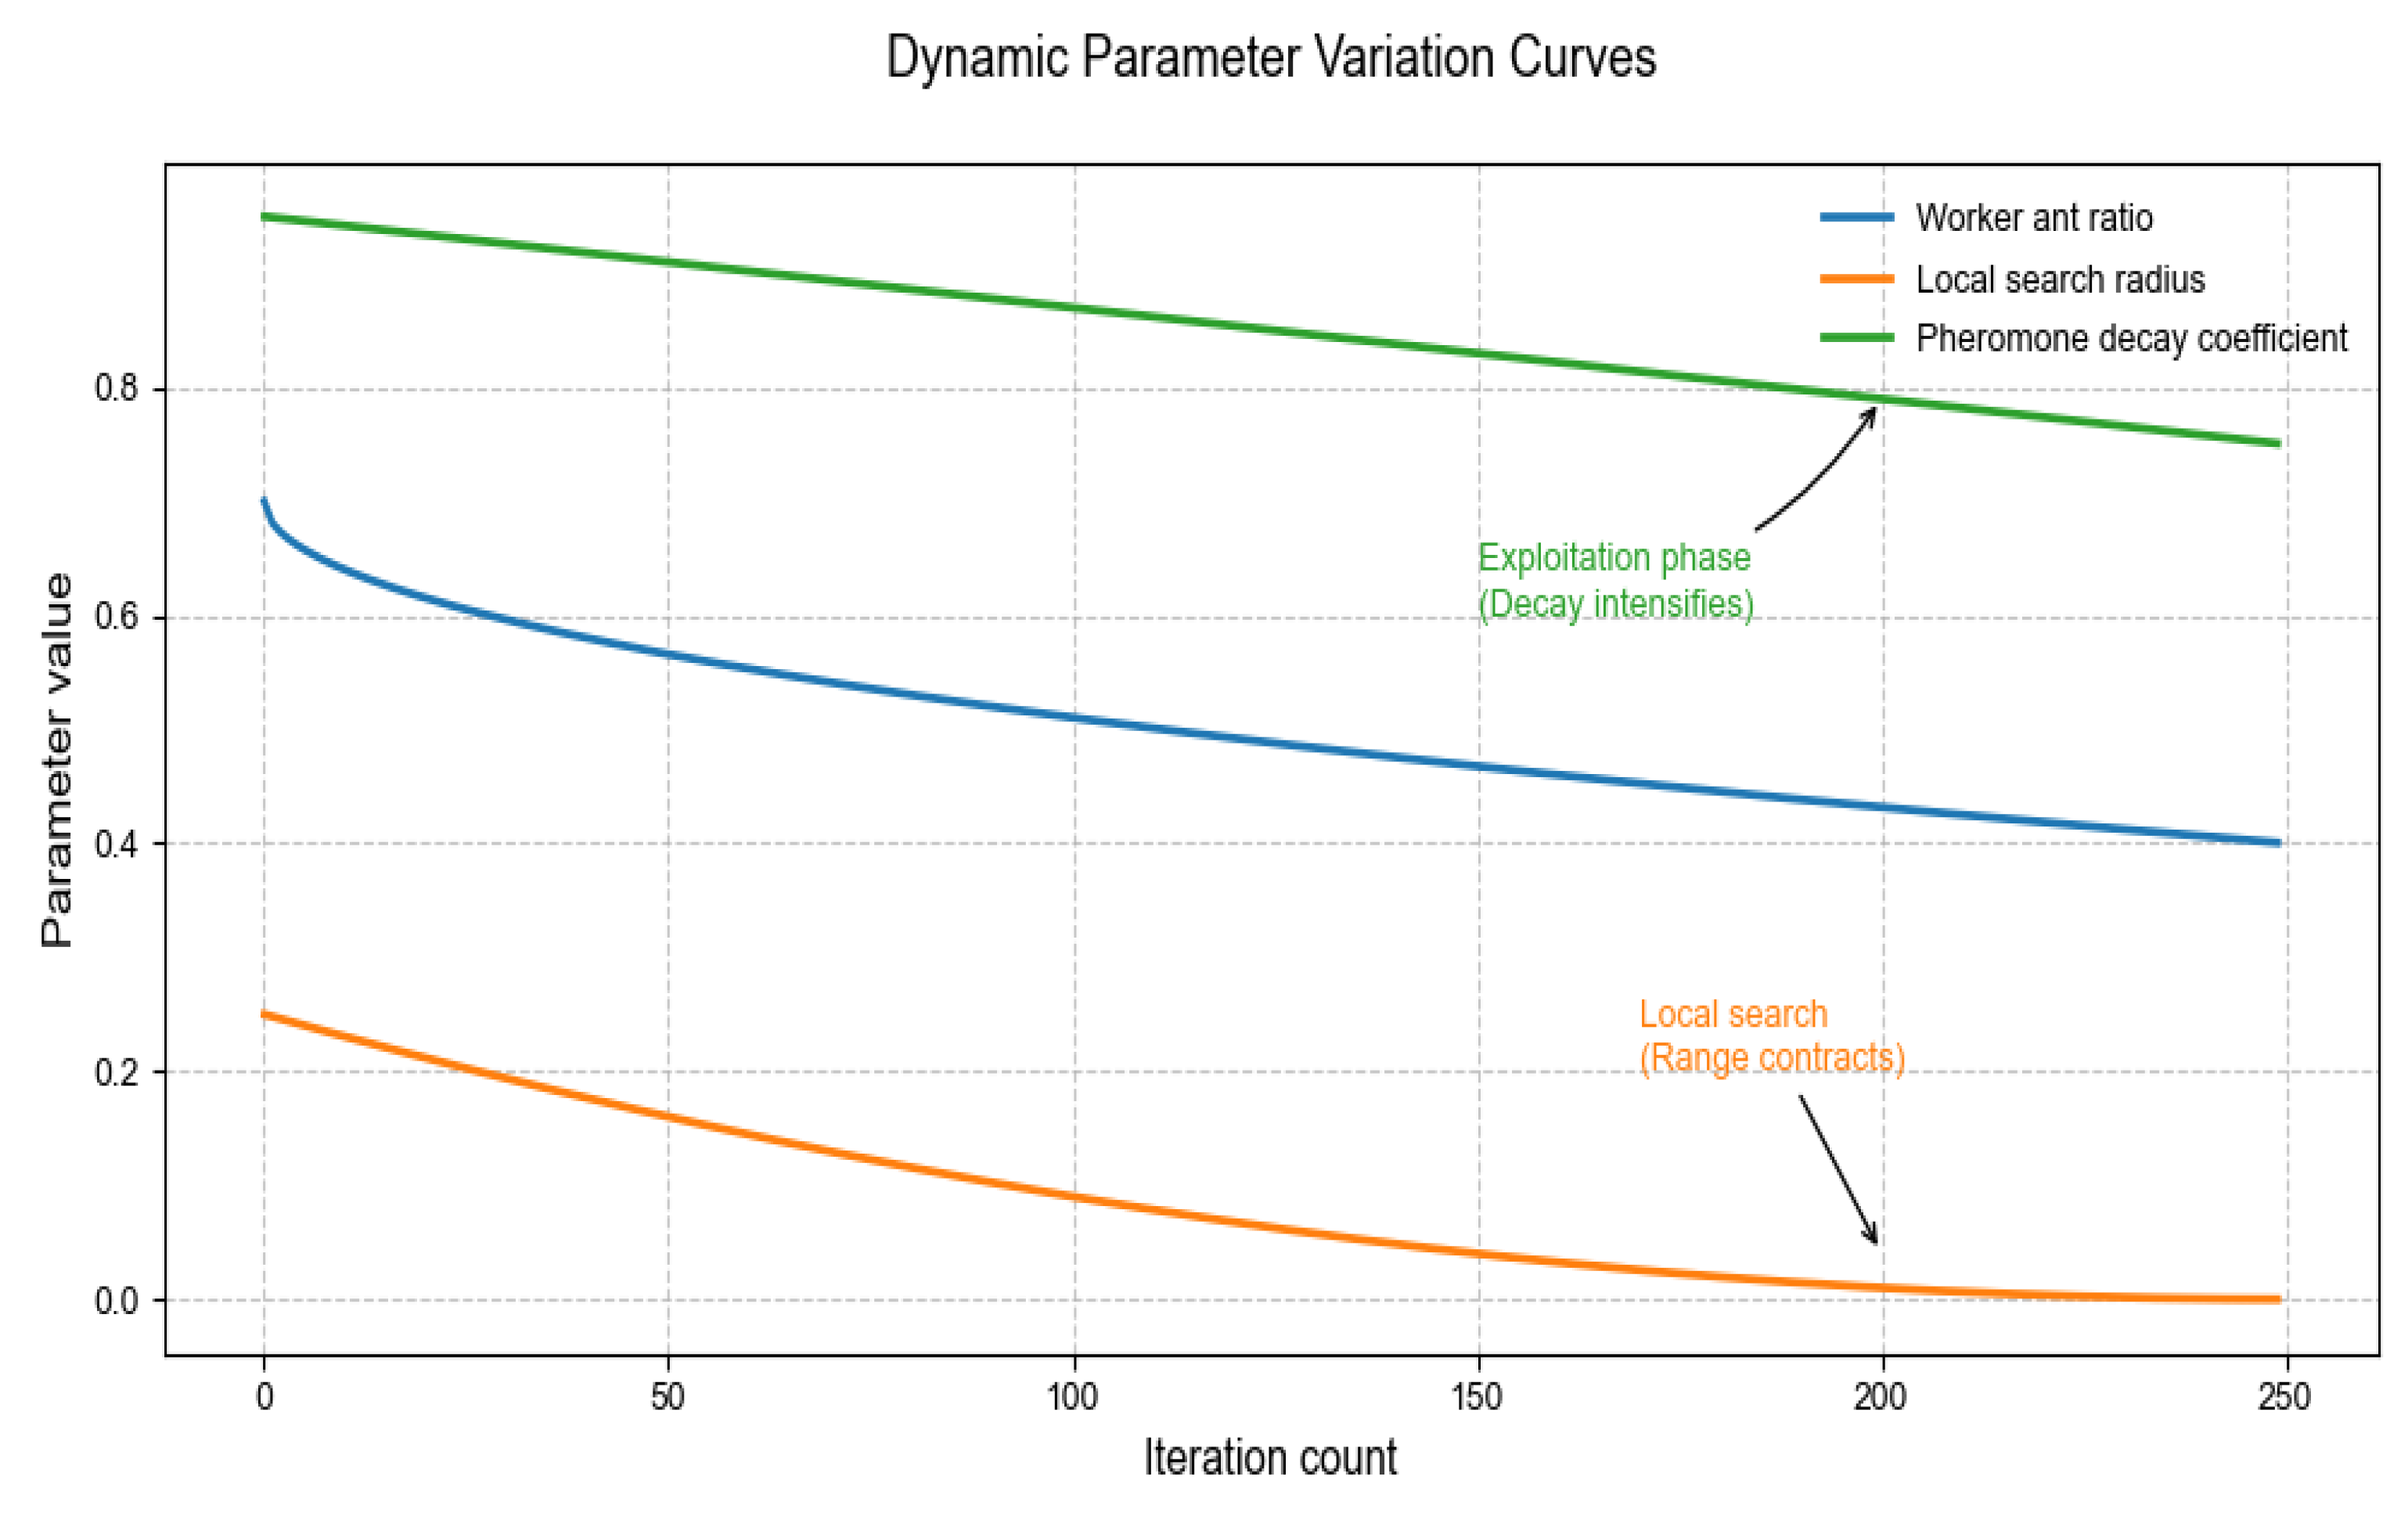
is the current number of iterations is the maximum number of iterations. decreases gradually, allowing for fast exploration of a wide area in the early stage and focusing on the neighborhood of the potential optimal solution in the later stage. This updating method is based on random perturbation, which is based on the position of the global optimal particle and randomly perturbs the position of the particle for exploration. Equation (7) shows the change in the proportion of worker ants:
To avoid numerical problems caused by out-of-bounds, make sure that the particle position is always within the search space. Particle positions are constrained to the set 3D space each time the particle is updated.
2.3.3. HIPACO Algorithm Design
Worker ant particles are mainly focused on local development responsible for fine search,worker ants approach the global optimal solution through pheromone weighted learning mechanism.The first i particle,X is updated at the following position:
where dir denotes random direction of 1or -1. denotes element-by-element multi plication,the higher the pheromone concentration,the higher the learning rate of the particle for the current position.L(t) i For this reason the step size factor of the particle in this step, the lower the adaptation the smaller the step size, to realize the search process from coarse to fine. The calculation formula is
where obeys a normal distribution with mean 1 and standard deviation 0.2 to control the magnitude of the update, is base learning factor;to prevent de-zeroing errors,and for Pheromone fitness weight . and denote the fitness and pheromone concentration of the particle at the current position, respectively. The higher the pheromone concentration, the greater the learning rate of the particle in the corresponding dimension.
2.3.4. Soldier Ant Global Exploration Phase
Soldier ants perform a global search based on Gaussian perturbation and elite guidance with the aim of quickly exploring a wider area, with the following formulation.
Based on the global optimal position of , the noise factor of and the random number obeying the standard normal distribution are introduced for perturbation, and the noise factor changes dynamically with the iterative process, which is calculated as follows:
where is Dynamic decay factor . This mechanism enhances the ability of the algorithm to jump out of the local optimum, which is an optimization innovation of the traditional ACO global search capability.
2.3.5. Mechanisms for Updating Pheromone
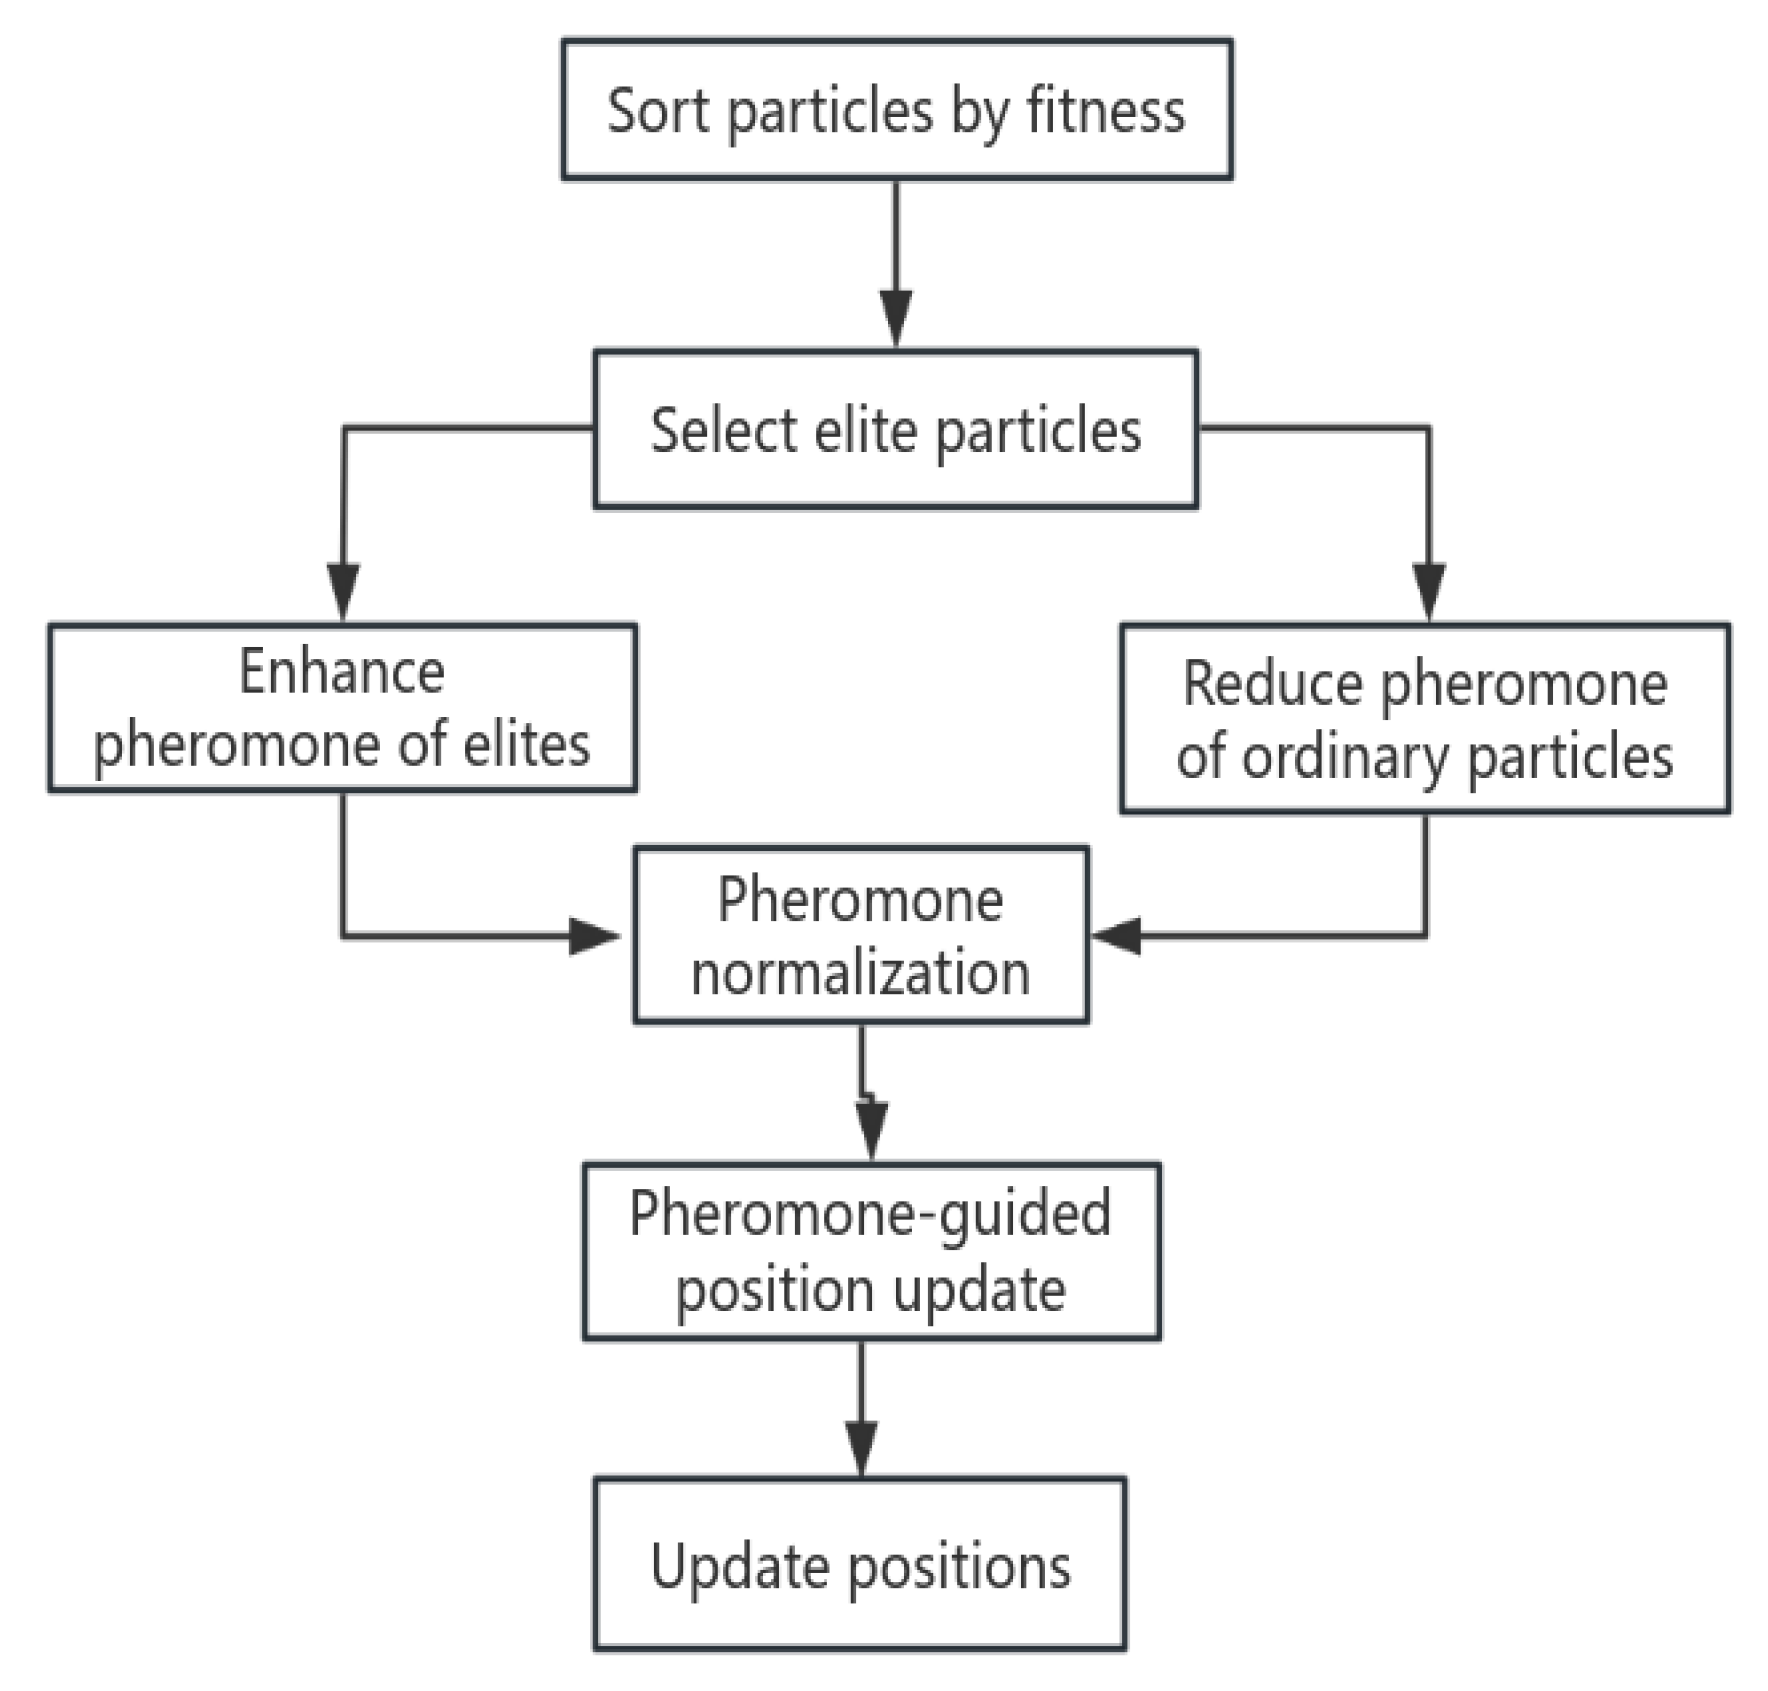
(Pheromone guidance is performed uniformly by soldier ants and worker ants) The pheromone-guided updating mechanism accelerates the search process by using pheromones to guide the particles. The higher the pheromone concentration, the particles are guided there for searching and accelerate the convergence. After the position update of worker ants and soldier ants, all the particles including soldier ants and worker ants will be evaluated and ranked in terms of fitness, and in this paper, the top 20% will be set as the elite particles, and the pheromone concentration of the elite particles will be enhanced, and the enhancement coefficient will be decreased with the iteration, so as to avoid the late over-exploitation.
where denotes a random distribution in the interval. The pheromone of non-elite particles decays exponentially: the position update equation is:
where is the initial decay rate and denotes the random distribution in the interval , the dynamic tuning strategy allows the algorithm to focus on exploration (high decay rate) in the early stage and exploitation (low decay rate) in the later stage. In order to alleviate the search bias in high-dimensional space, the sinusoidal modulation function is uniformly introduced:
This operation periodically adjusts the pheromone concentration in each dimension to ensure a balanced 3D spatial search.
After the pheromone position is updated the new position will be evaluated in batch and for particles with improved fitness the position and fitness will be updated , otherwise the failure counter will be increased.
2.3.6. Algorithmic Flow
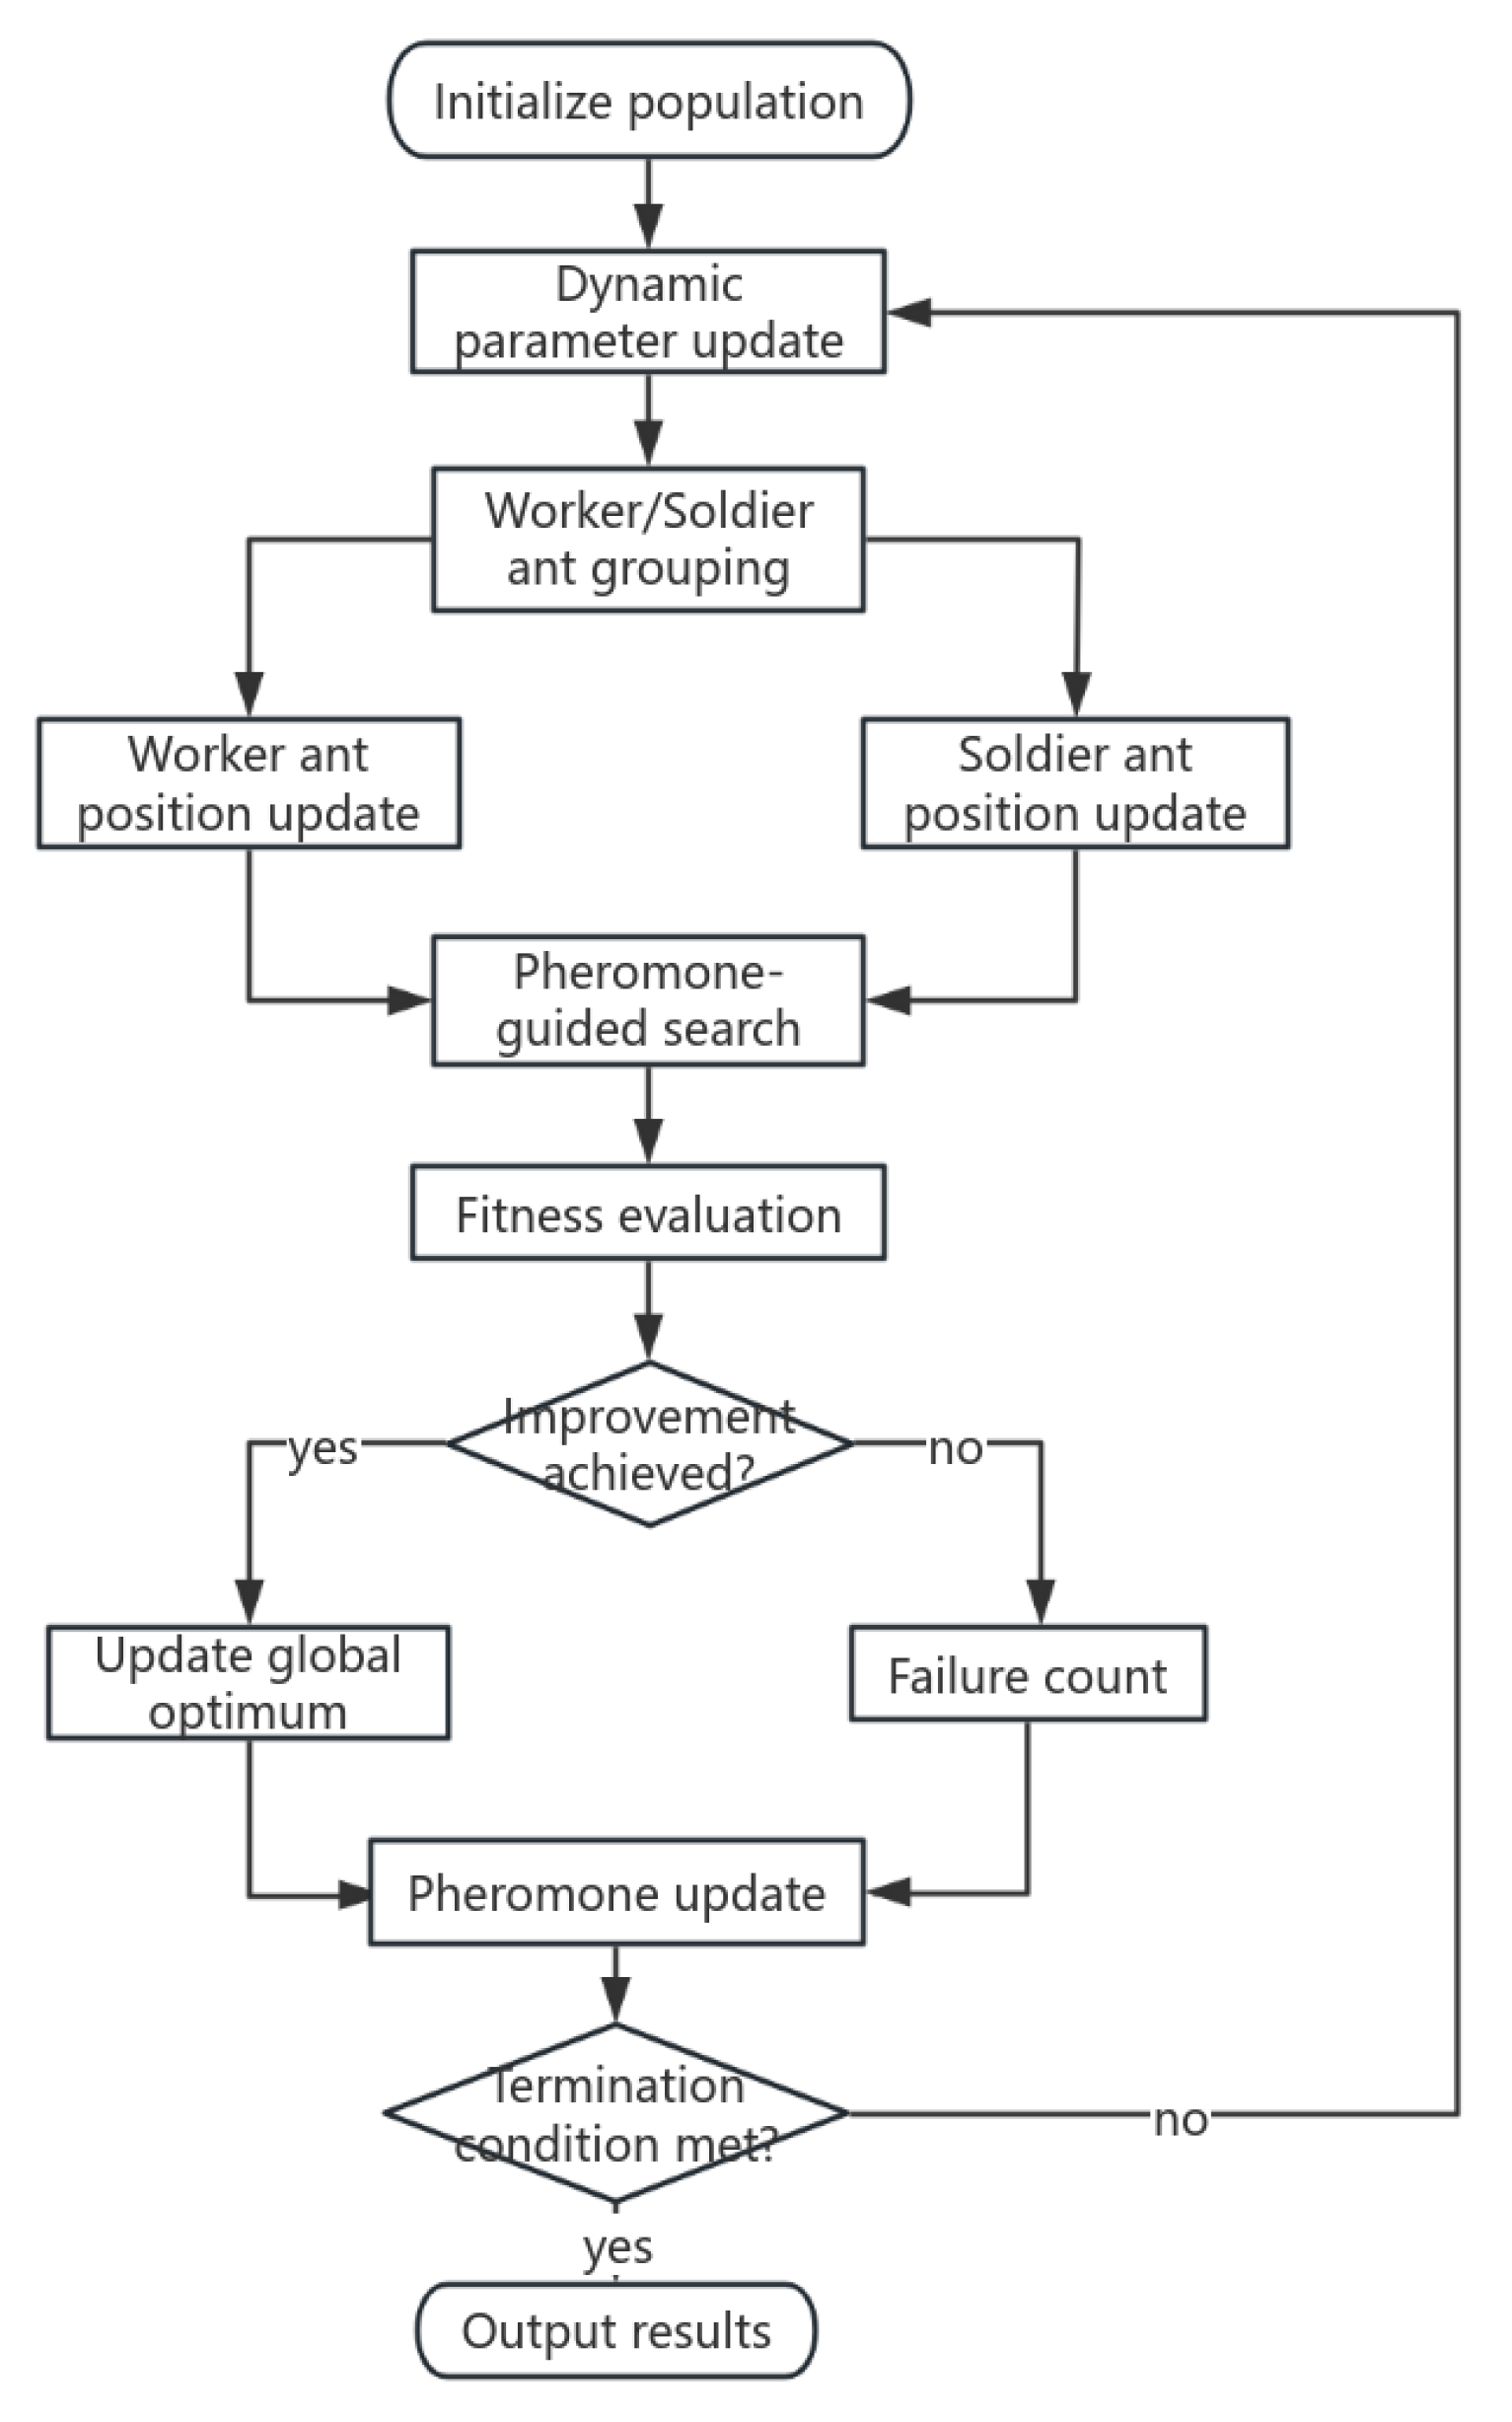
In this paper, we propose an ant colony optimization (ACO) as the main framework, which is named as the improved fusion heuristic algorithm (HIPACO) by introducing the pheromone guidance mechanism, dynamic pheromone weighting factor, multi-stage search strategy and adaptive perturbation mechanism for estimation.
Figure 3.
Update according to pheromone position.
Firstly, the parameter configuration and solution space definition are completed by “initialization population”. Subsequently, the algorithm enters the core loop module, which sequentially performs the start of iteration, computation of fitness, and conver gence determination. The convergence decision node constitutes the control center of the process. If the convergence condition is not met, the algorithm sequentially updates the strategy, applies hybrid reproduction (including the crossover and mutation oper ations of the genetic algorithm), and updates the pheromone matrix (based on the ant colony optimization mechanism), which creates a synergistic feedback between the strategy adjustment and the evolution of the population. If the convergence thresh old is reached, the iteration is terminated and the global optimal solution is output. The process design integrates the dual characteristics of evolutionary algorithms and population intelligence algorithms to maintain population diversity through hybrid reproduction, and at the same time combines the positive feedback mechanism of pheromone to accelerate the local search.The flow of the HIPACO algorithm is shown in Figure 4
Figure 4.
Overall flowchart of HIPACO localization algorithm.
3. Experiment and Analysis of Results
In order to verify the efficacy and applicability of the proposed algorithms in an all-round way, we adopt two different evaluation strategies: a performance test based on the simulation environment, and a performance test based on the actual application scenarios. The experimental comparison scenarios include (1) the ACO optimization algorithm proposed in the literature [9] and (2) the PSO adaptive optimization algorithm proposed in the literature [10,11].
3.1. Simulation Scenario Performance Testing
The simulation experiments in this paper were conducted under the assumption that anchor node localization did not have any errors, the experimental environment was set in the 3D space of , the path loss factor index was set to 2.2, and the RSSI at a reference distance of 1 meter was set to -68. The population size in the HIPACO algorithm was set to 80, the initial proportion of worker ants was 0.8, the initial pheromone value was 1.0, the pheromone decay rate was 0.95 , the maximum number of failures is 4, and the maximum number of iterations is 100. the individual learning factor in the PSO algorithm is set to 2.0, the social learning factor is 2.0, and the inertia weight is 0.7. the pheromone factor in the ACO algorithm is 1.0, the heuristic factor is 2.0, the pheromone volatility coefficient is 0.5, pheromone strength is 100, and the standard deviation of Gaussian perturbation is 0.1.
3.2. Evaluation Indicators
3.3. Effect of Different Soldier and Worker Ratios on Localization error
The central goal of adjusting the ratio of worker ants to soldier ants is to balance the colony’s ability to fine-tune its exploitation with its ability to explore globally.
Figure 5.
Effect of the ratio of soldier ants and worker ants on the error.
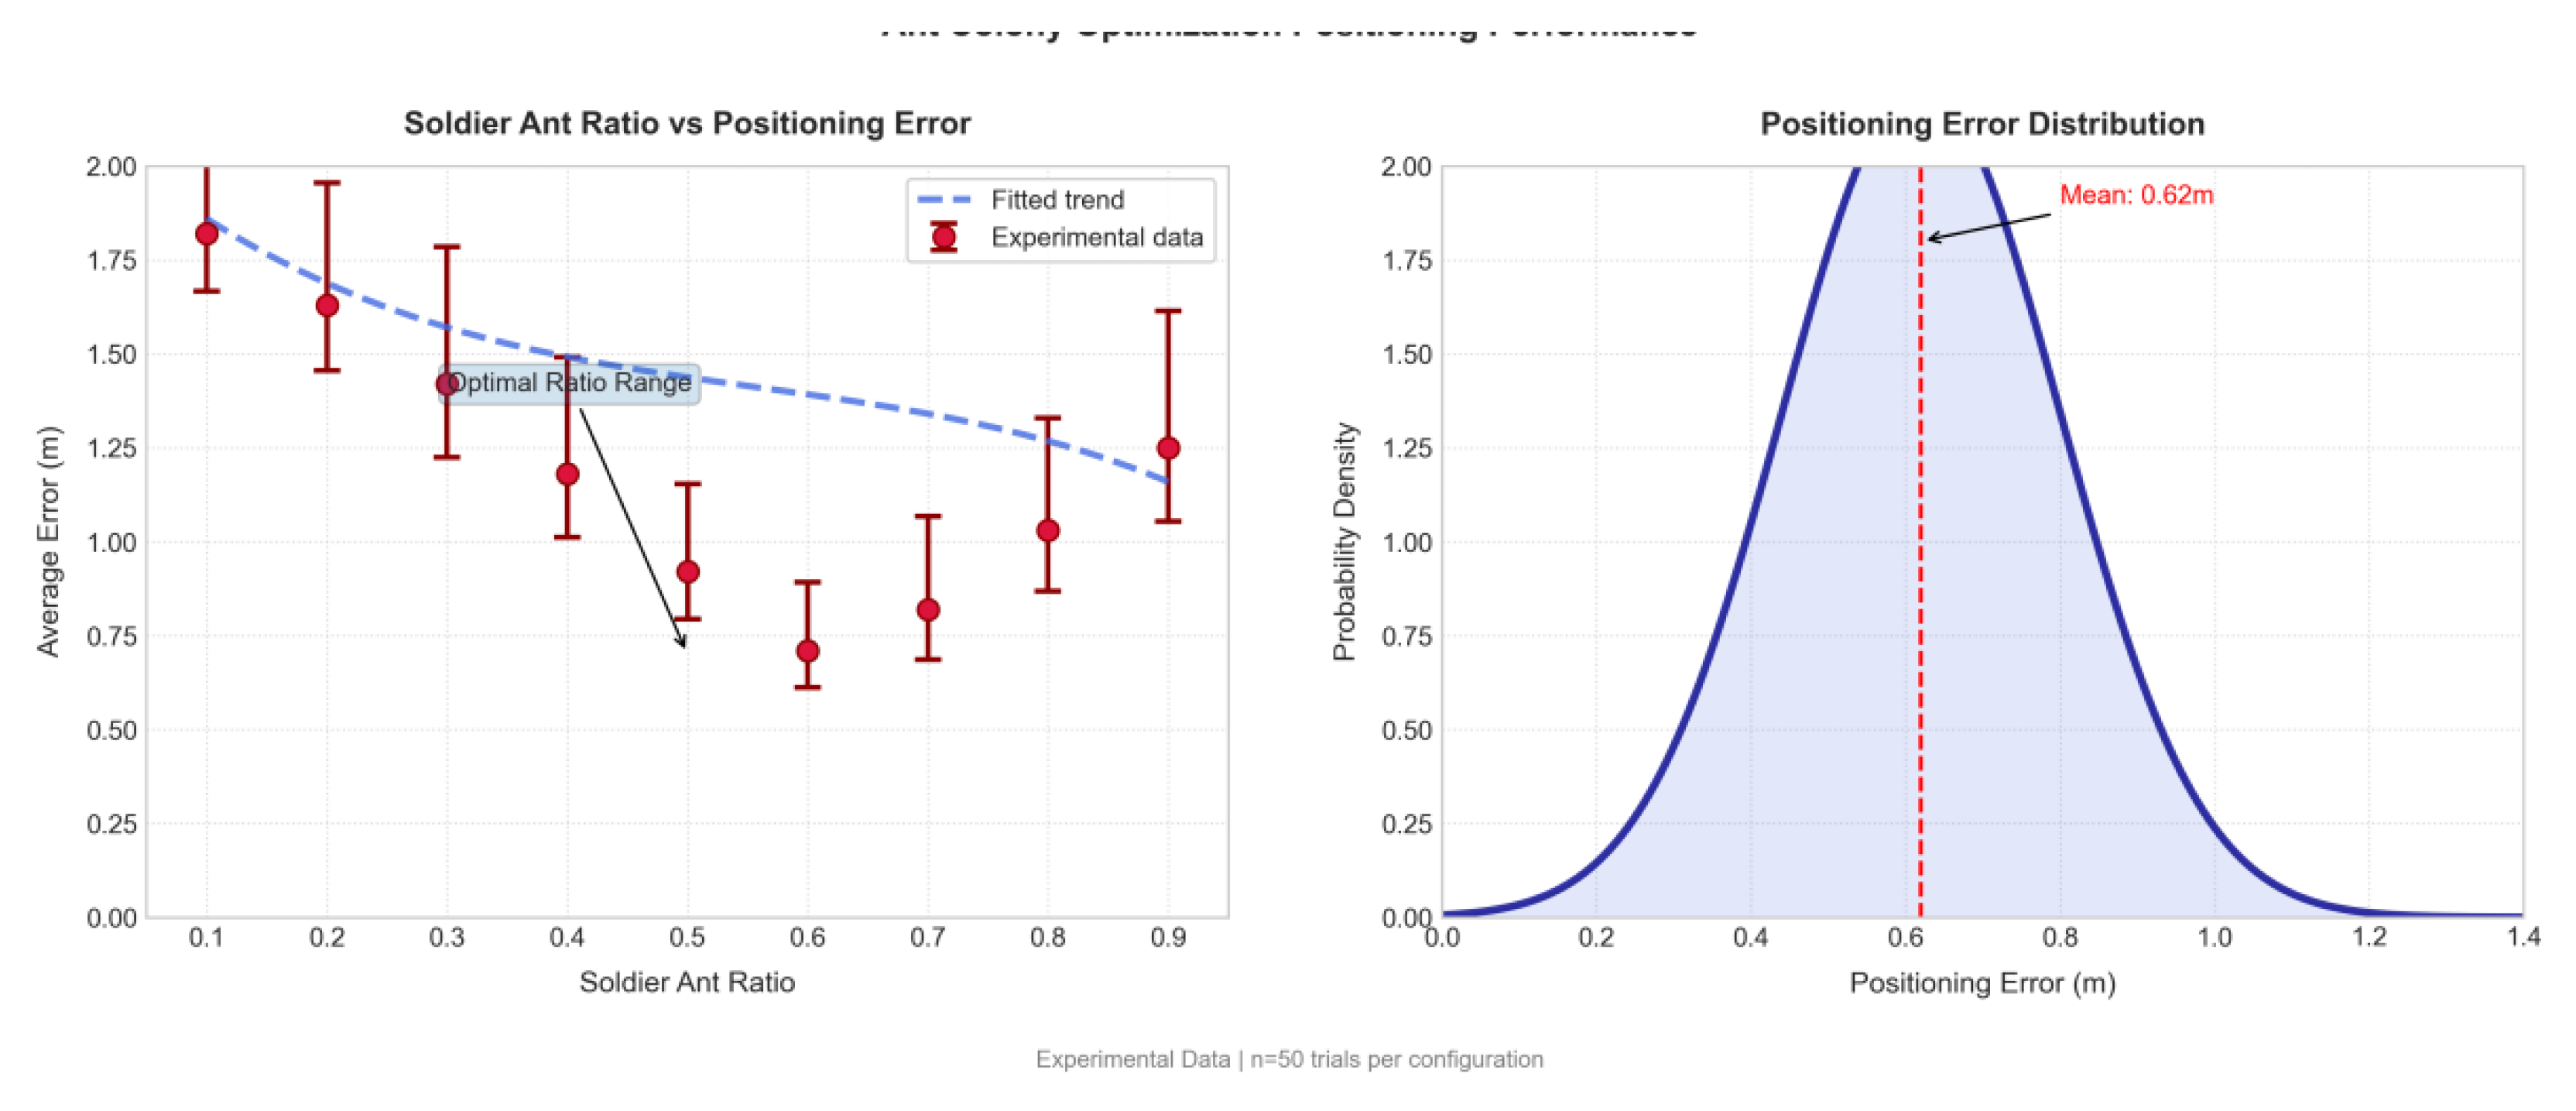
According to the analysis of the graph, when the proportion of worker ants is maintained at about 20% (at the horizontal coordinate 0.2 of the graph), the system reaches the lowest localization error of 0.38 m. At this time, the worker ants achieve accurate localization through directional search and local pheromone guidance, while the soldier ants (80%) with a higher proportion of ants break through the local optimum through Gaussian perturbation to open up new search paths in the complex environment. The density plot shows that the error distribution is the most concentrated at this ratio (the peak density reaches 1.75), indicating the optimal stability of the algorithm.
3.4. Effect of Different Number of Anchor Nodes on Localization Accuracy
The experiments were conducted by systematically increasing the number of anchor nodes (from 4 to 10), and the four localization algorithms were tested for 100 repetitions and averaged. As shown in Figure 6, the average localization error (ALE) of all algorithms shows a decreasing trend with the increase in the number of anchor nodes, which is attributed to the richer spatial reference information provided by more anchor nodes. It is worth noting that the HIPACO algorithm proposed in this paper always maintains the optimal localization performance under different anchor node configurations: in the most challenging 4-anchor node scenario, the localization error of HIPACO is only 1.32m, which is 42.9% lower than that of the traditional ACO algorithm (2.31m), the PSO algorithm (1.83m) and the trilateral ranging method (3.15m), respectively, 27.9% and 58.1%, respectively. Even under the condition of high-density anchor nodes (10), HIPACO still leads the other algorithms with an error of 0.68m, which verifies its stability and superiority under different network configurations. This advantage mainly stems from the algorithm’s innovative dimension balancing strategy and dynamic pheromone mechanism, which enables it to maintain accurate spatial perception under sparse anchor node environments.
Figure 6.
Changes in ALE of different algorithms when changing the number of anchor nodes.
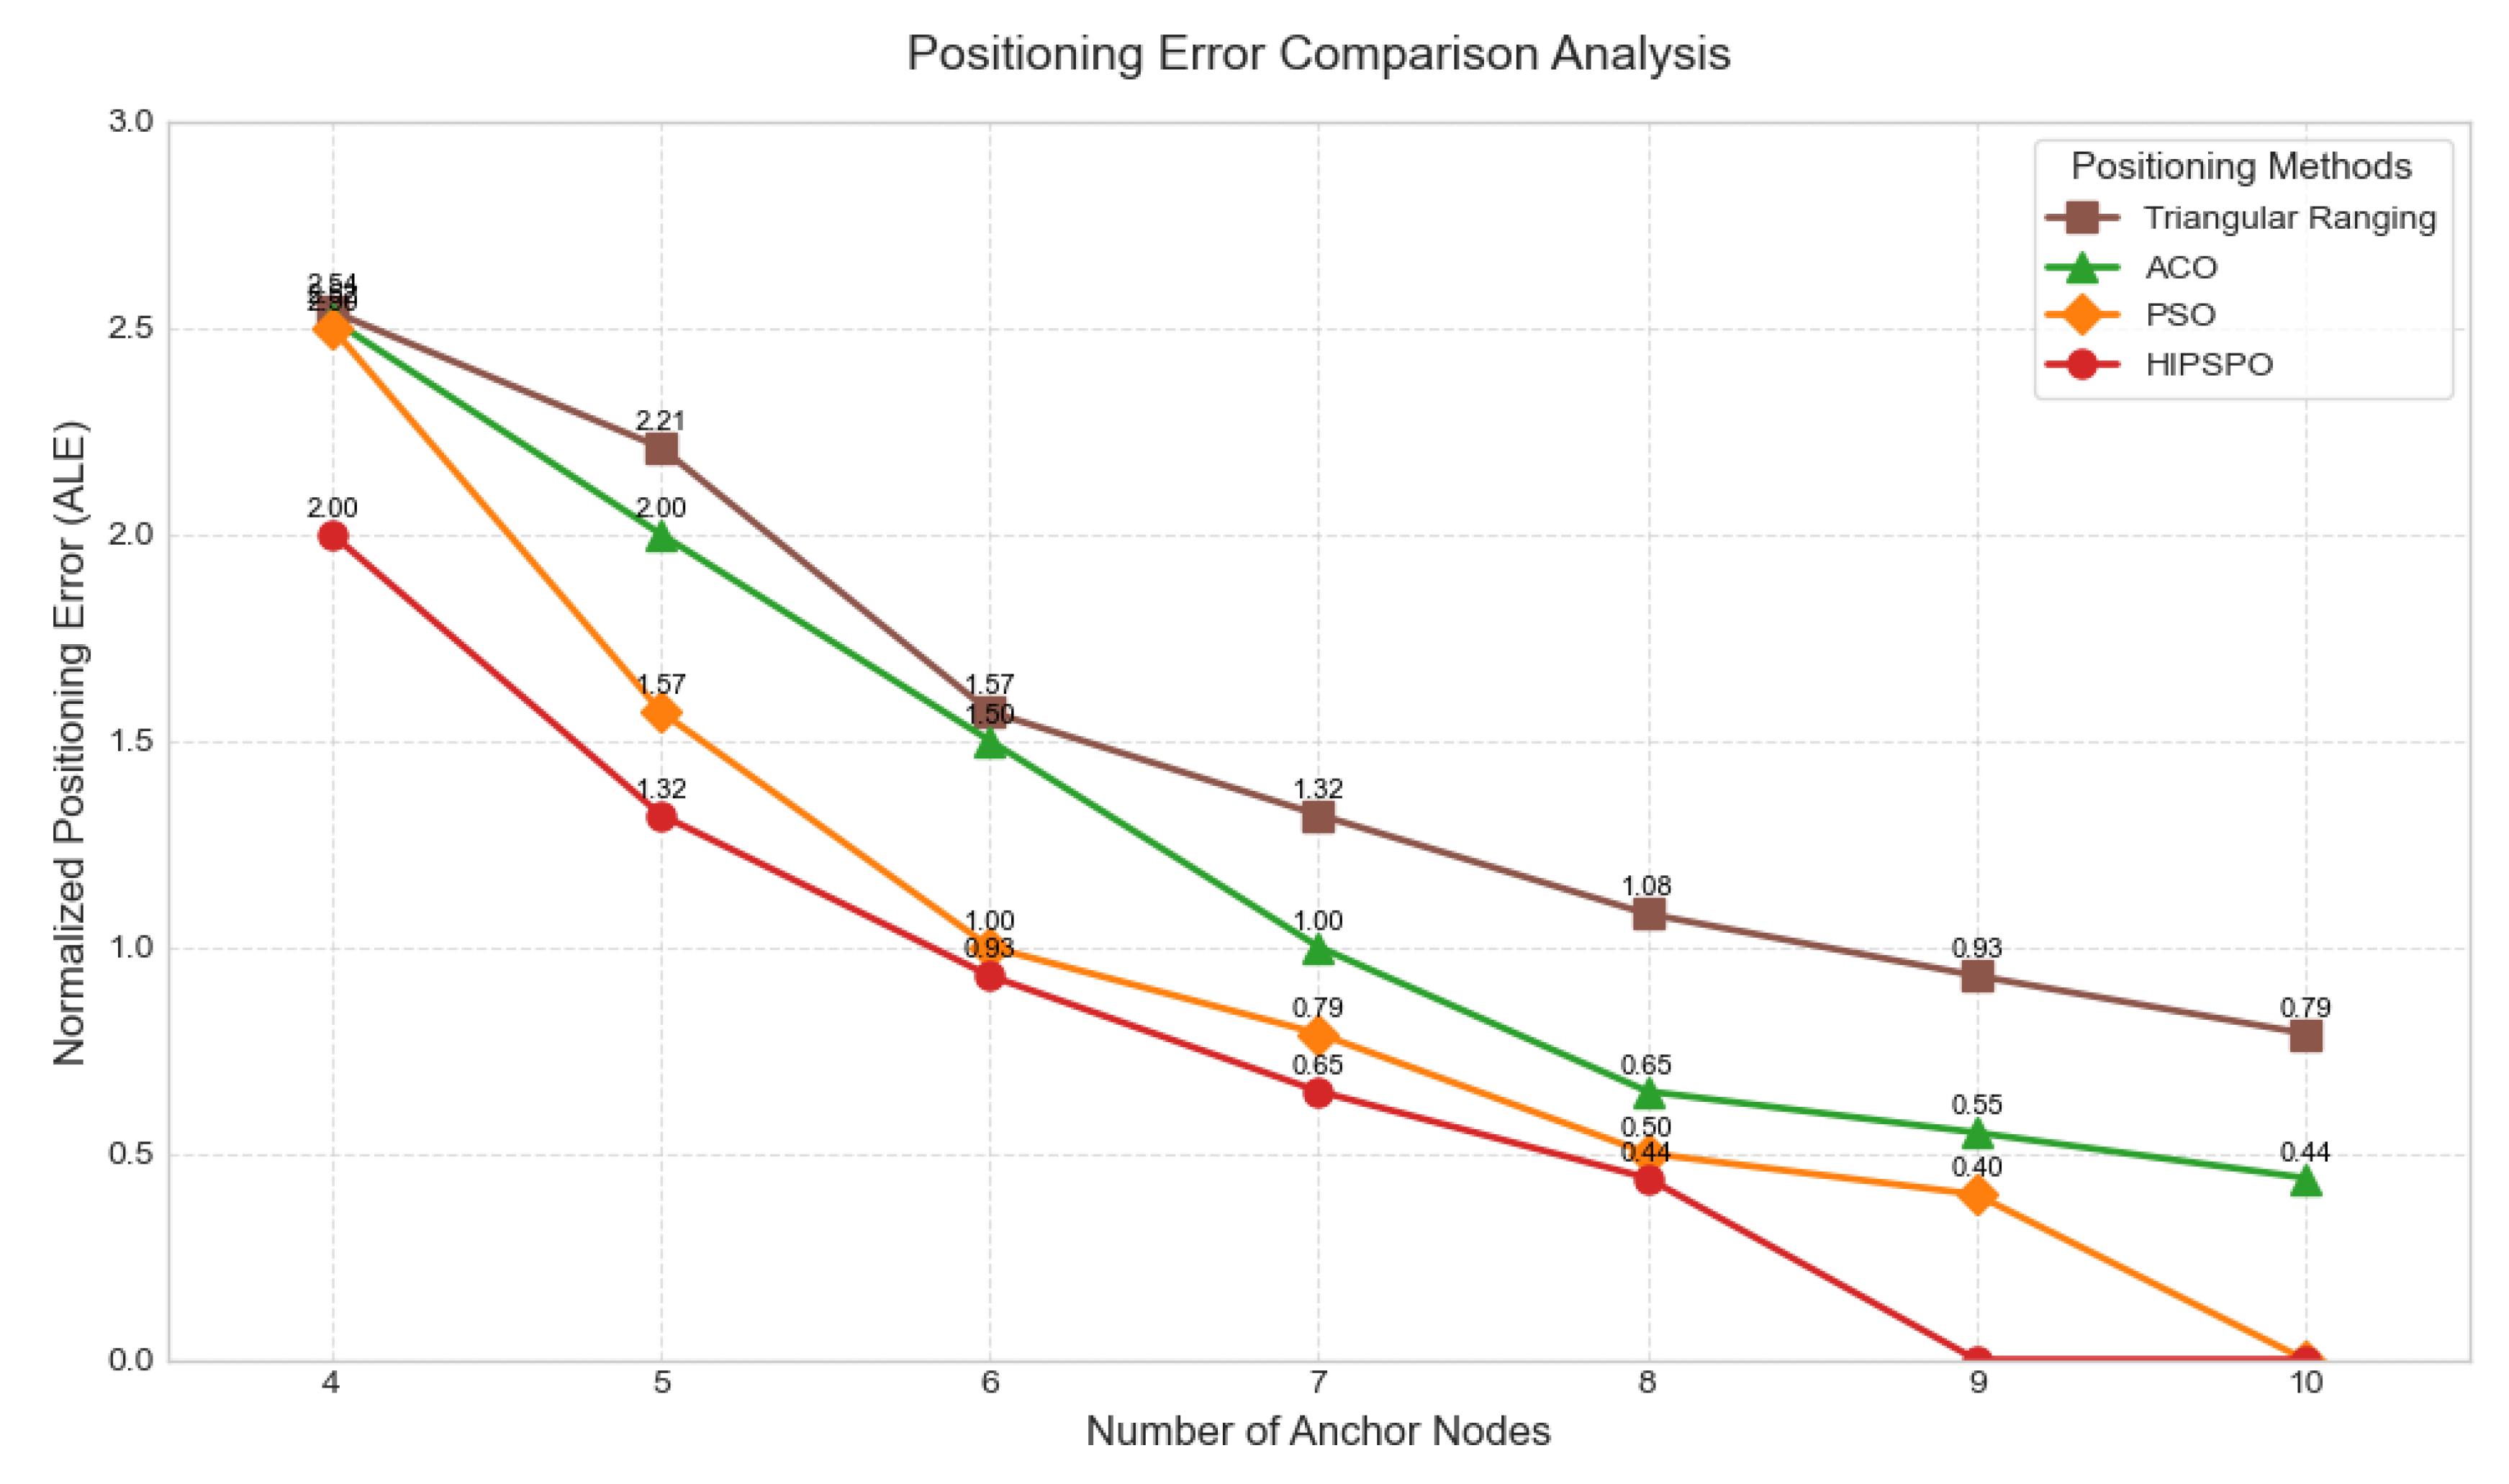
Table 1 demonstrates the ALE of various localization algorithms. After comparative analysis, the HIPSPO localization algorithm proposed in the paper reduces the average value of ALE by 63.42%, 42.92%, and 27.26% compared to the trilateral ranging, ACO, and PSO algorithms, respectively. This data fully indicates that the HIPACO localization algorithm has better localization accuracy compared to the other three algorithms.

Table 1.
Mean values of ALE for different algorithms in Figure 6.
Table 1.
Mean values of ALE for different algorithms in Figure 6.
| localization algorithm | Mean value of normalized positioning error |
|---|---|
| trilateral ranging method | 2.247 |
| ACO Positioning Method | 1.44 |
| PSO positioning method | 1.13 |
| HIPACO localization method | 0.822 |
3.5. Effect of Different Site Sizes on Localization Accuracy
The spatial range of localization is divided into four groups: 20*15*10 , 10*8*6 , 5*4*3 , 3*2*1 , 100 experiments are conducted and the results are averaged. From Figure 4, it can be seen that the ALE values of the four localization algorithms in general decrease with the decrease of spatial range, which is due to the fact that as the spatial range decreases, the signals in the spatial network are enhanced, and the accuracy of the localization algorithms is subsequently enhanced.
Table 2 demonstrates the average value of ALE for various localization algorithms. After comparative analysis, the HIPACO localization algorithm proposed in the paper reduces the average value of ALE by 61.90%, 52.38% and 54.50% compared to the trilateral ranging, ACO and PSO algorithms, respectively. This data fully indicates that the HIPSPO localization algorithm has better localization accuracy in different spatial ranges compared to the other three algorithms.
Table 2.
Mean values of ALE for each algorithm in Figure 7.
Table 2.
Mean values of ALE for each algorithm in Figure 7.
| localization algorithm | Mean value of normalized positioning error |
|---|---|
| trilateral ranging method | 3.2225 |
| ACO Positioning Method | 2.5775 |
| PSO positioning method | 2.6975 |
| HIPACO localization method | 1.2275 |
Figure 7.
Changes in ALE of different algorithms when changing spatial extent.
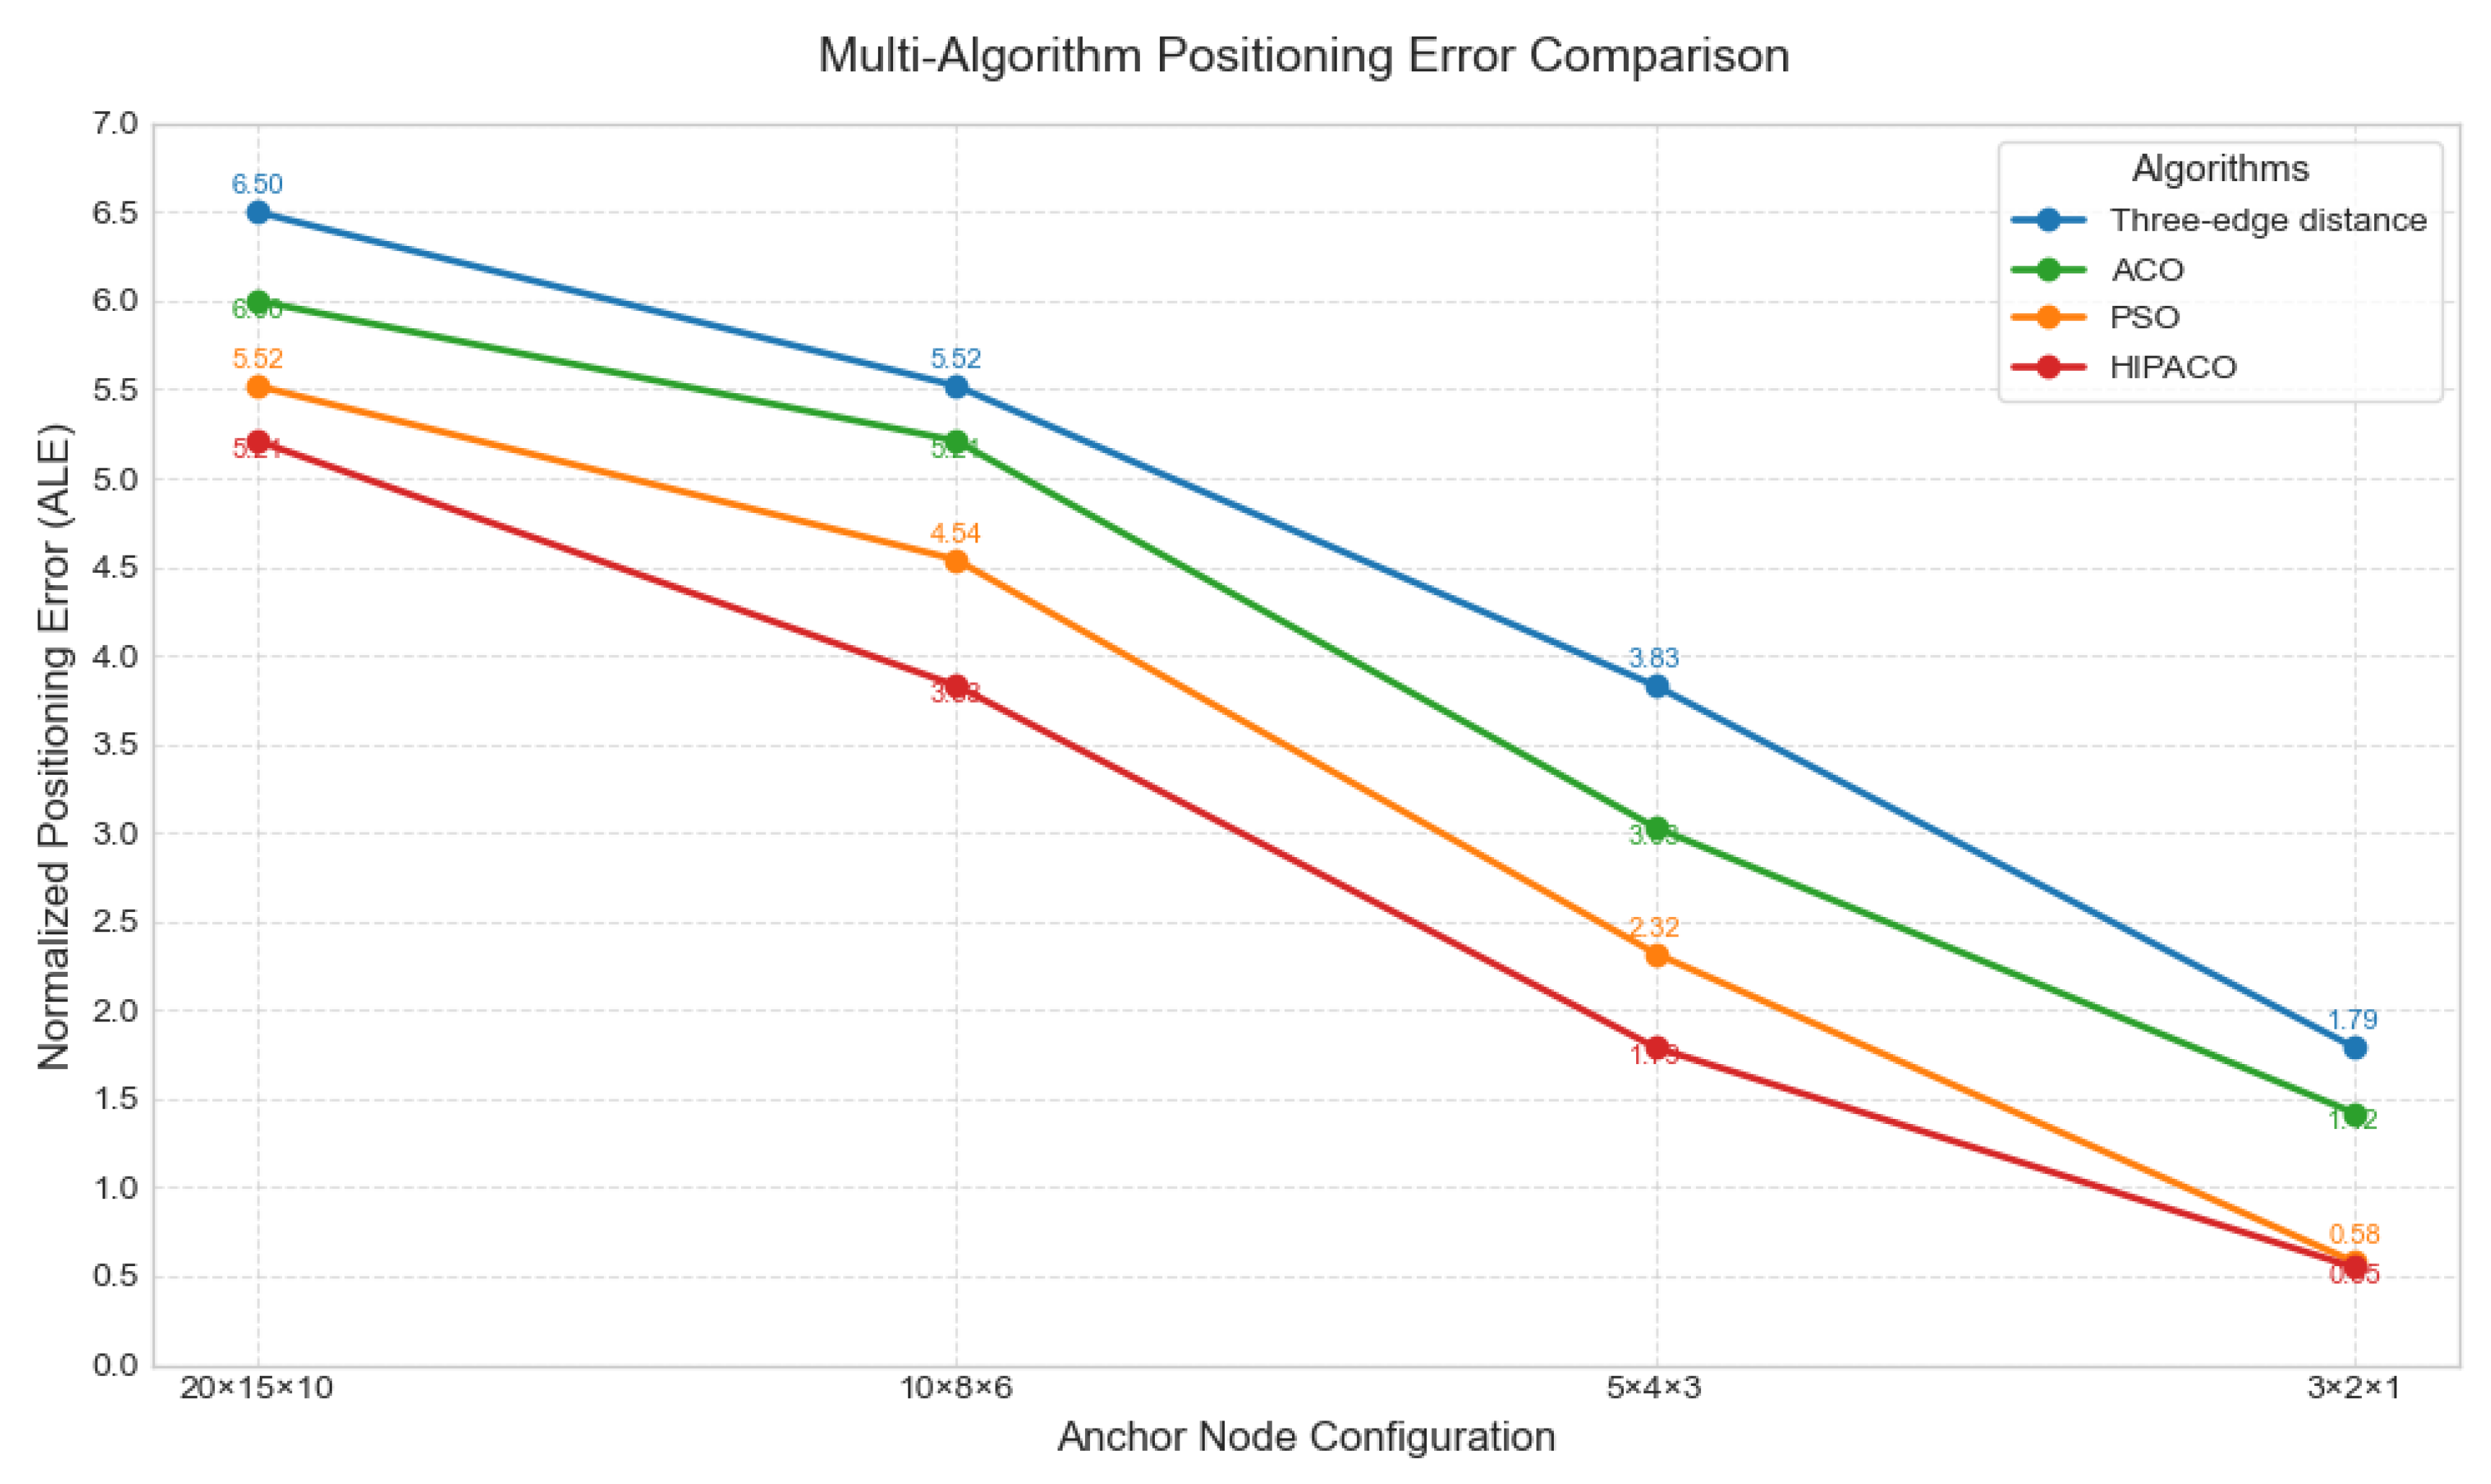
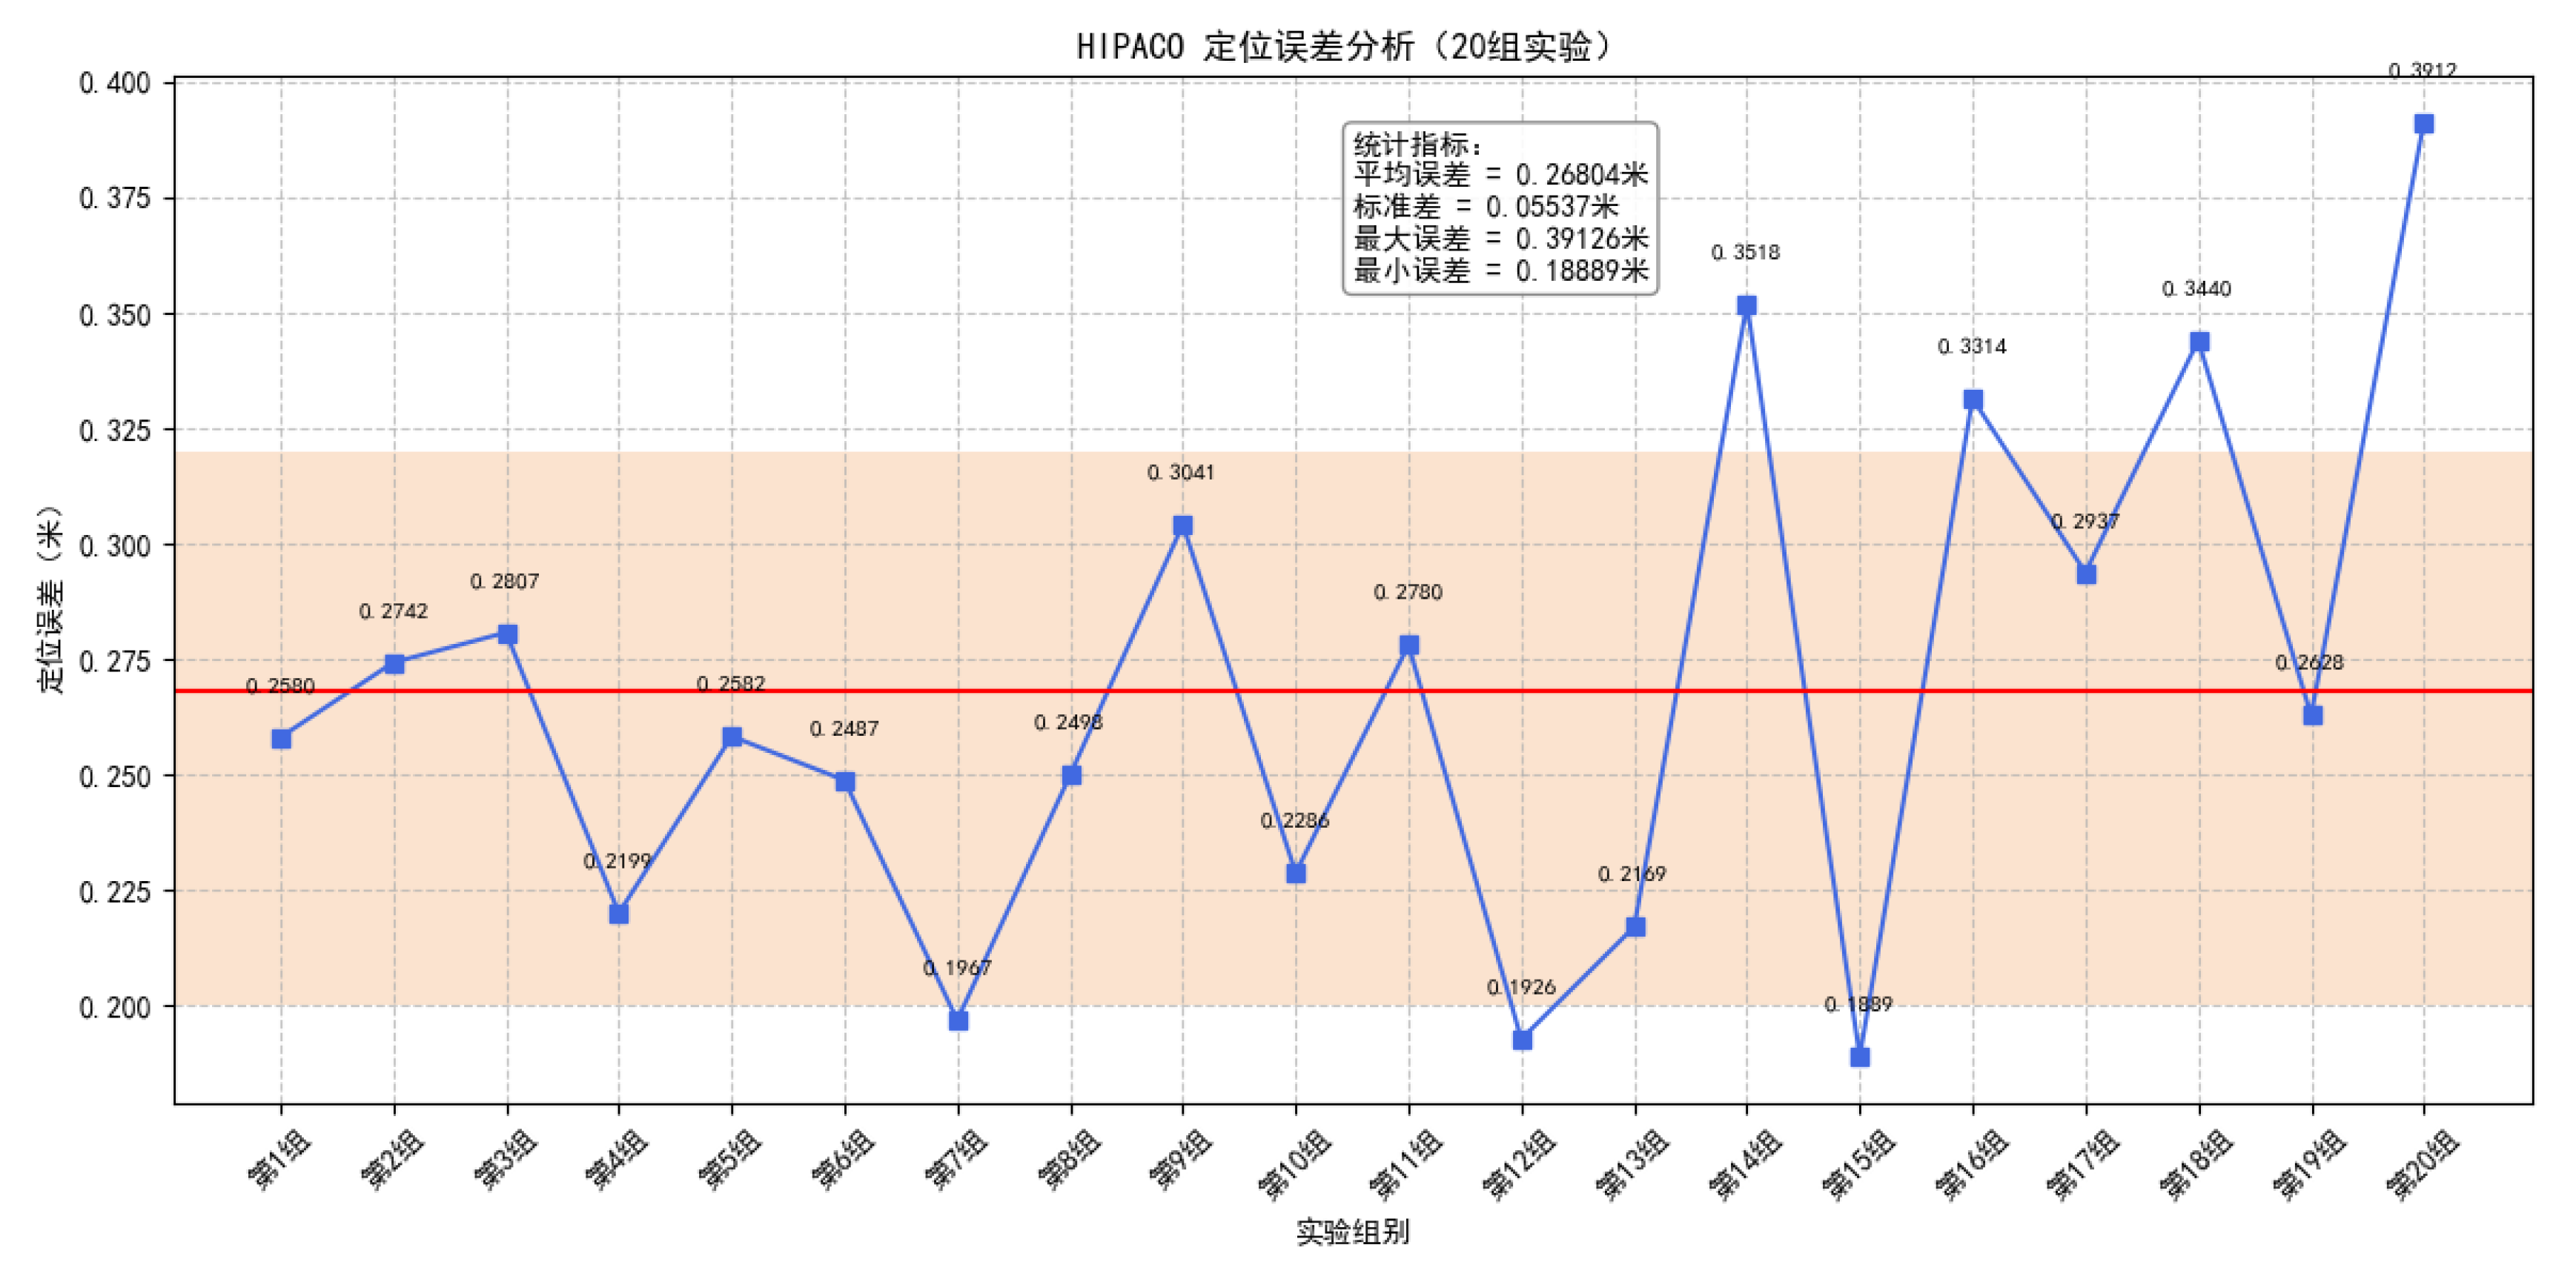
Figure 8 shows the error analysis of the HIPSPO localization method in a 10*8*6 three-dimensional space with anchor nodes set to four:
Figure 8.
HIPACO localization error analysis diagram.
3.6. Time Complexity Analysis
In practical applications, too much complexity may limit the algorithm real-time and resource-constrained scenario applications. Figure 9 shows the time complexity analysis of the HIPACO algorithm for different population sizes with different maximum iterations.
Figure 9.
Time complexity analysis of HIPACO algorithm.
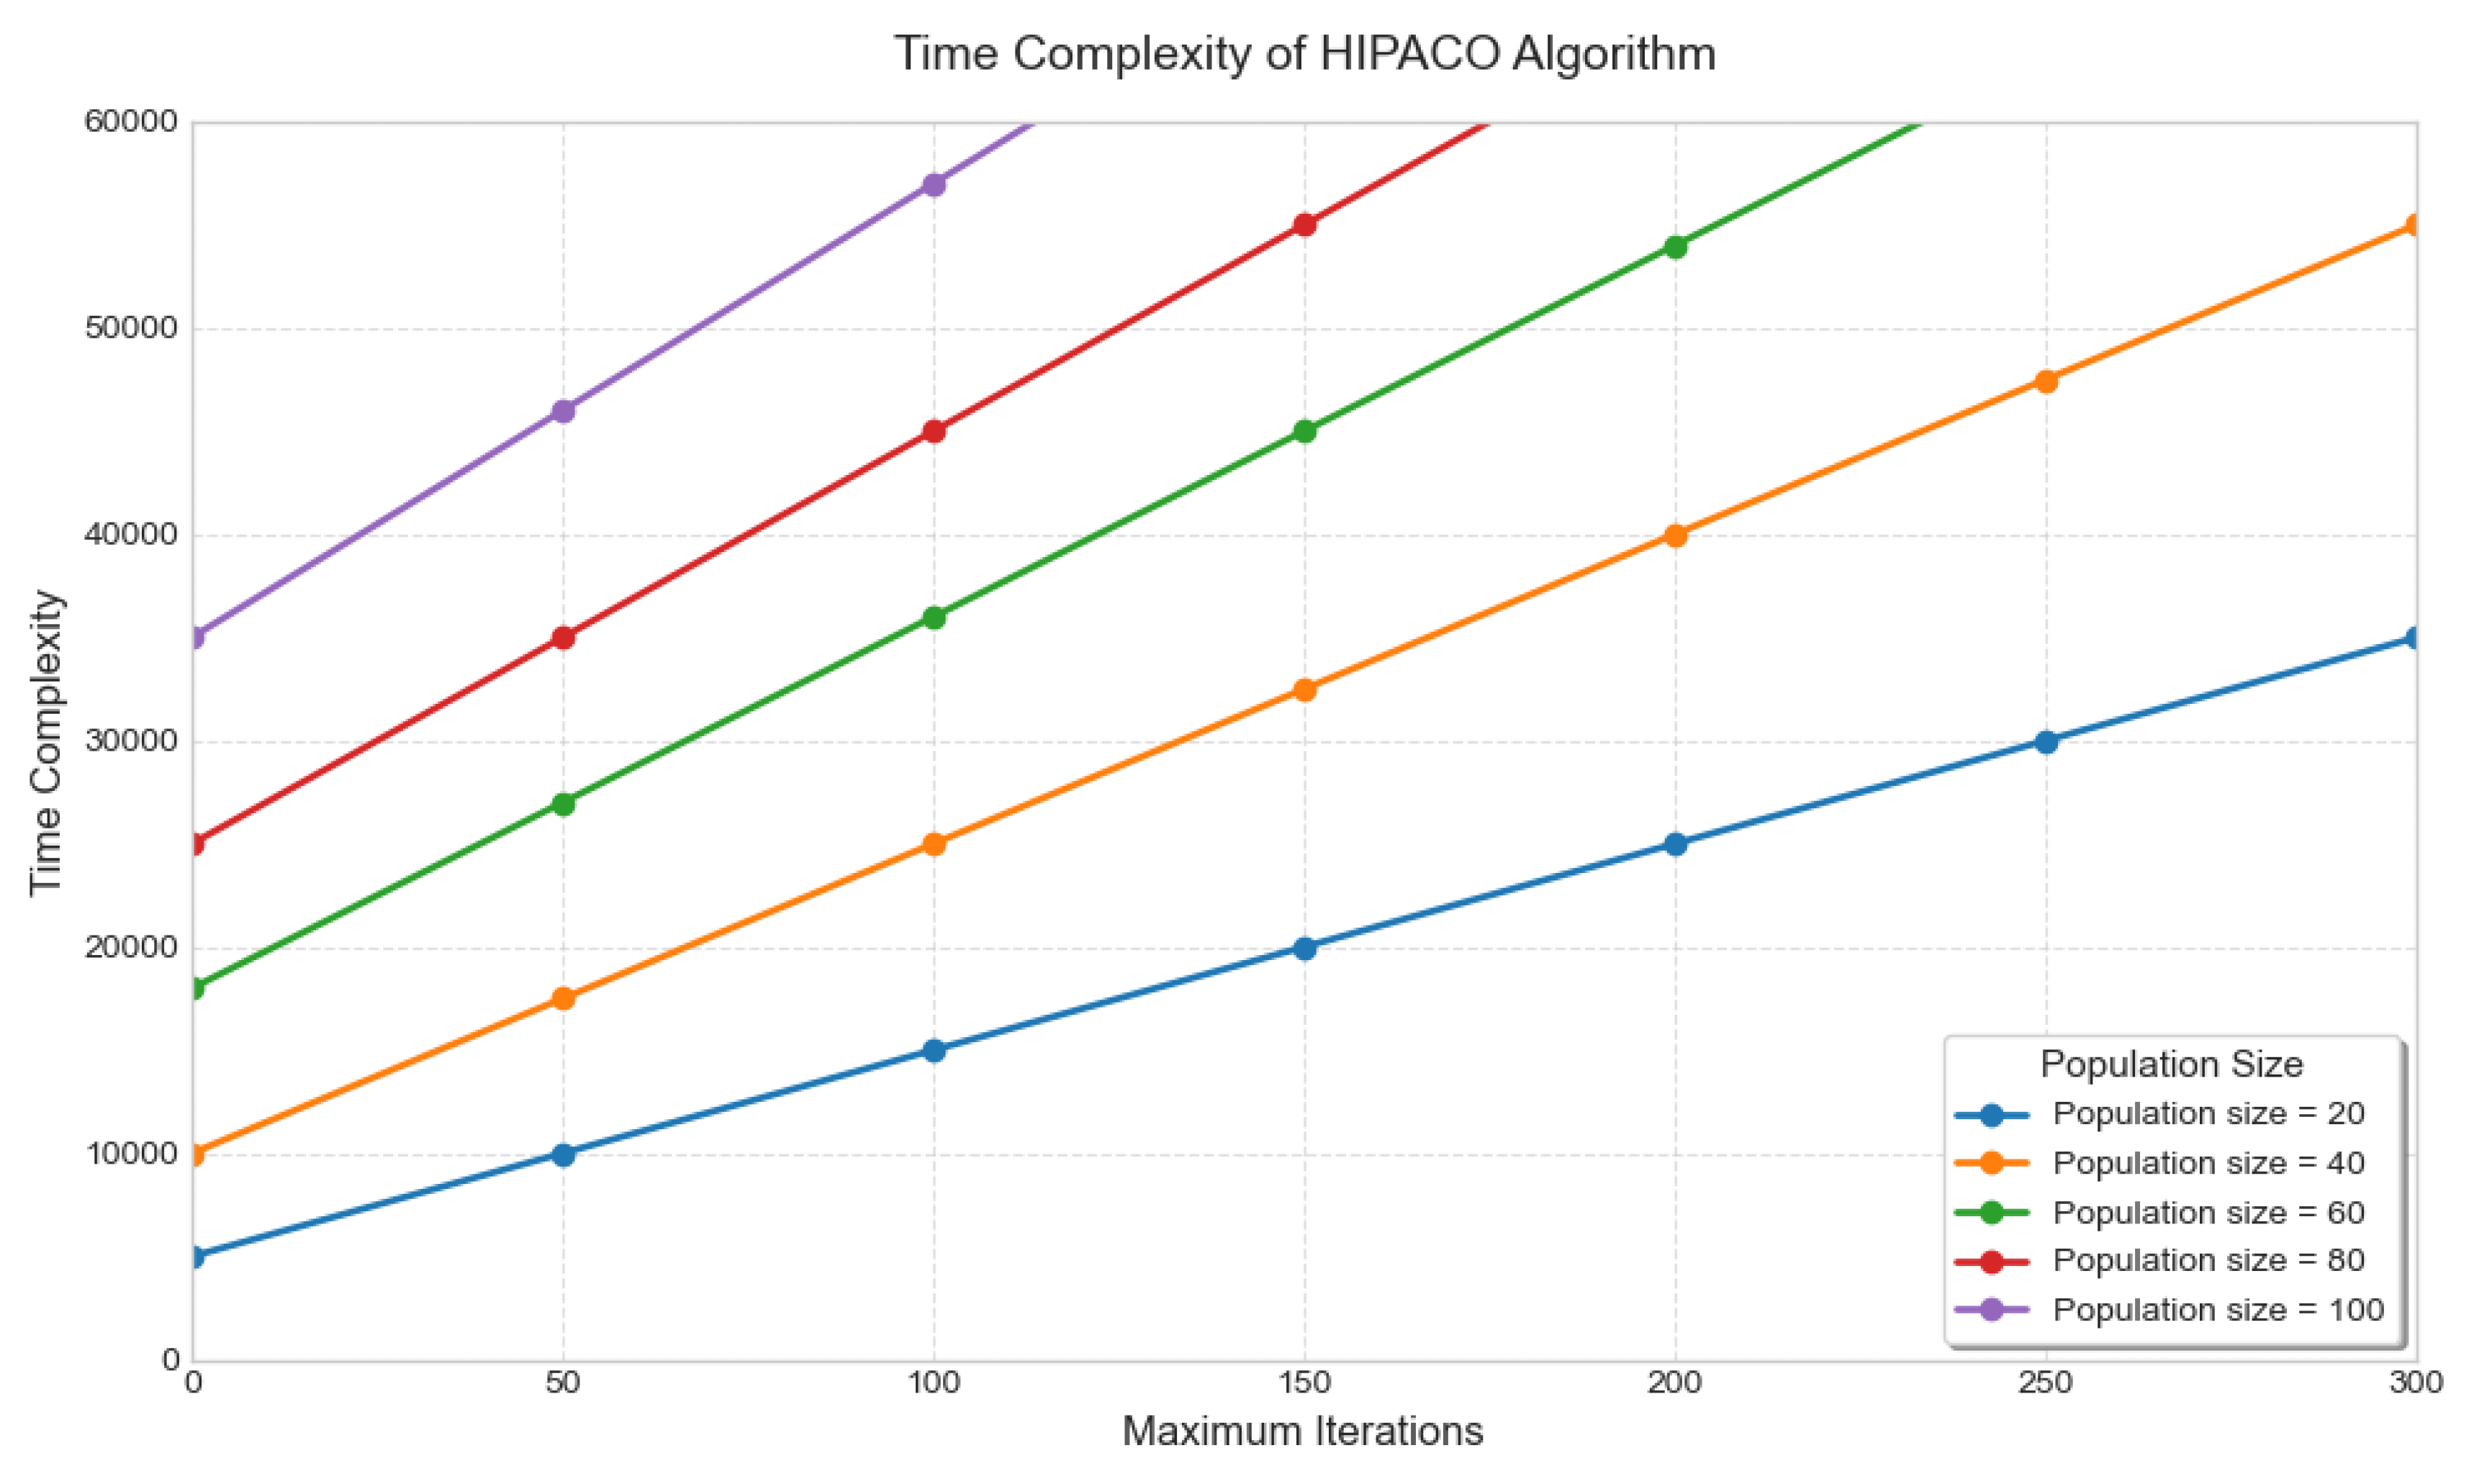
Figure 10 shows the time complexity analysis of the three algorithms under the same experimental conditions when the population size is all 80.
Figure 10.
Time complexity analysis of three algorithms.
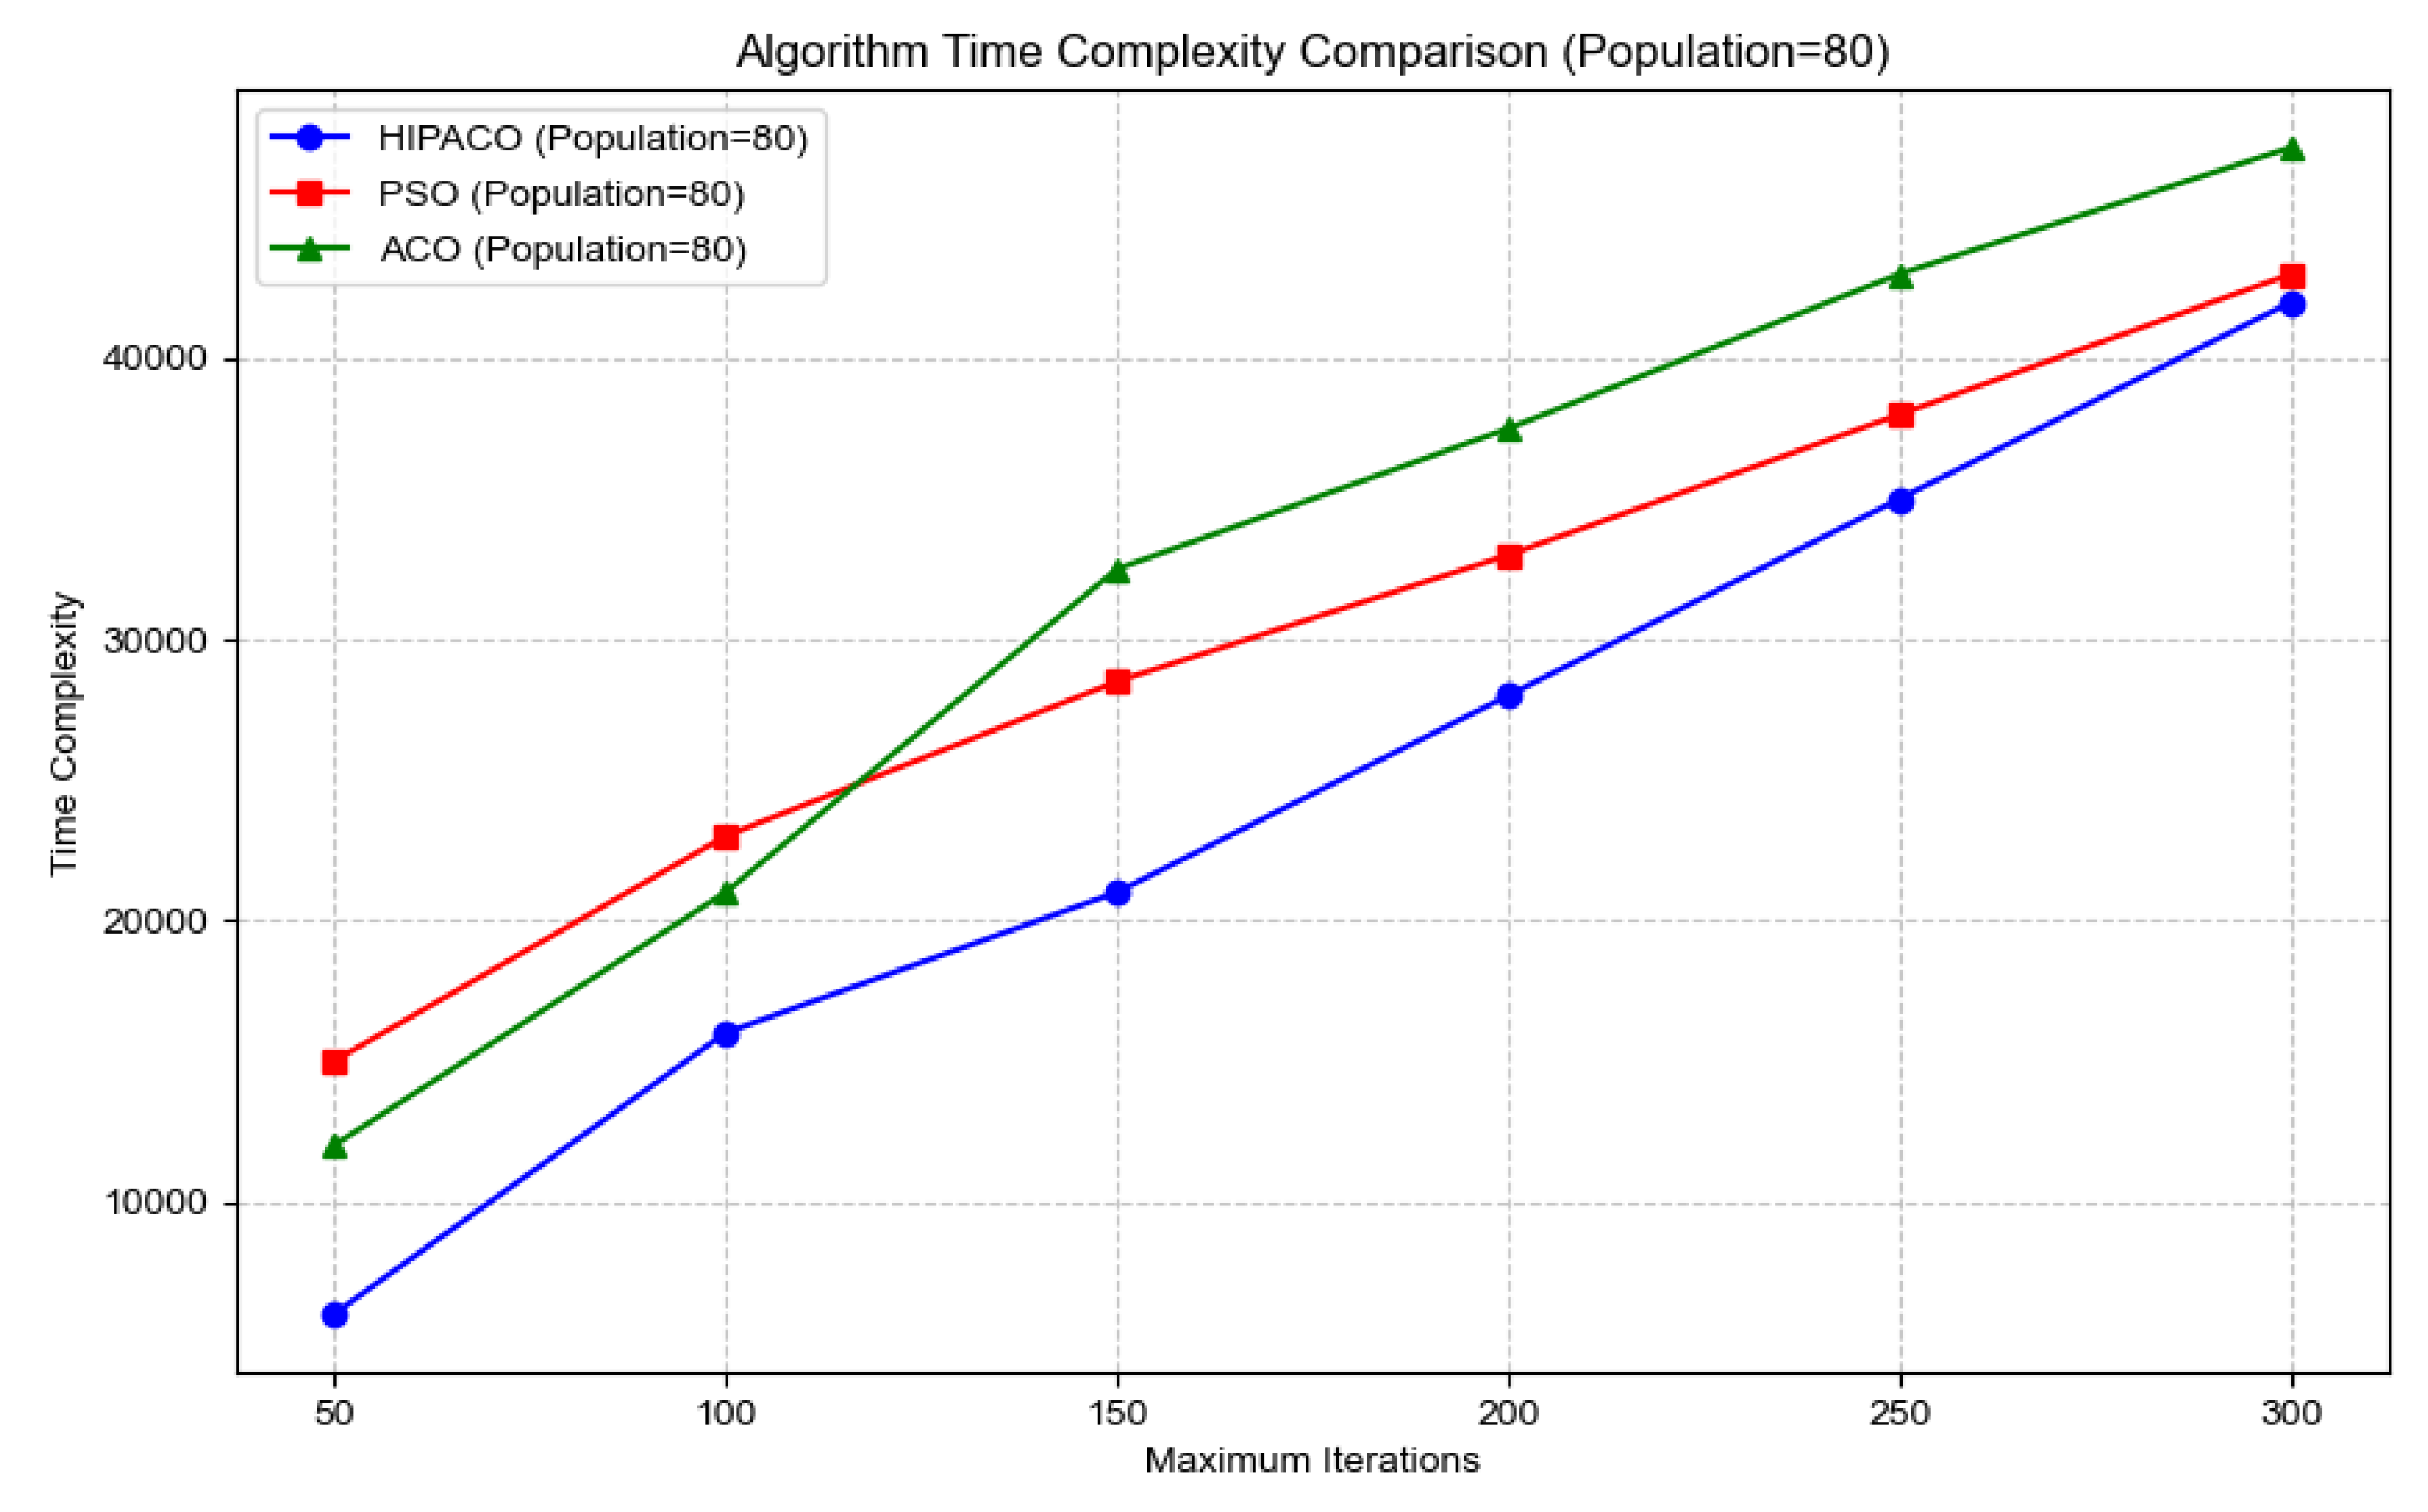
The following table shows the mean values of time complexity of the three algorithms for different maximum number of iterations.
Table 3.
Mean values of time complexity of three algorithms.
| arithmetic | Computational complexity (N=80) |
|---|---|
| PSO | 300,000ops |
| ACO | 320,000ops |
| HIPACO | 248,000ops |
According to the complexity comparison analysis, HIPACO algorithm shows a slight advantage in computational efficiency: although it is of the same linear complexity as PSO algorithm, it optimizes the operation constant term through the worker ant/soldier ant division of labor mechanism, and the experiments show that its average time complexity is only 17.33% of PSO. Compared with the ACO algorithm, HIPACO avoids the squared complexity of path construction, and its average time complexity is reduced by 22.5% in 3D localization scenarios.
3.7. Real Scenario Testing
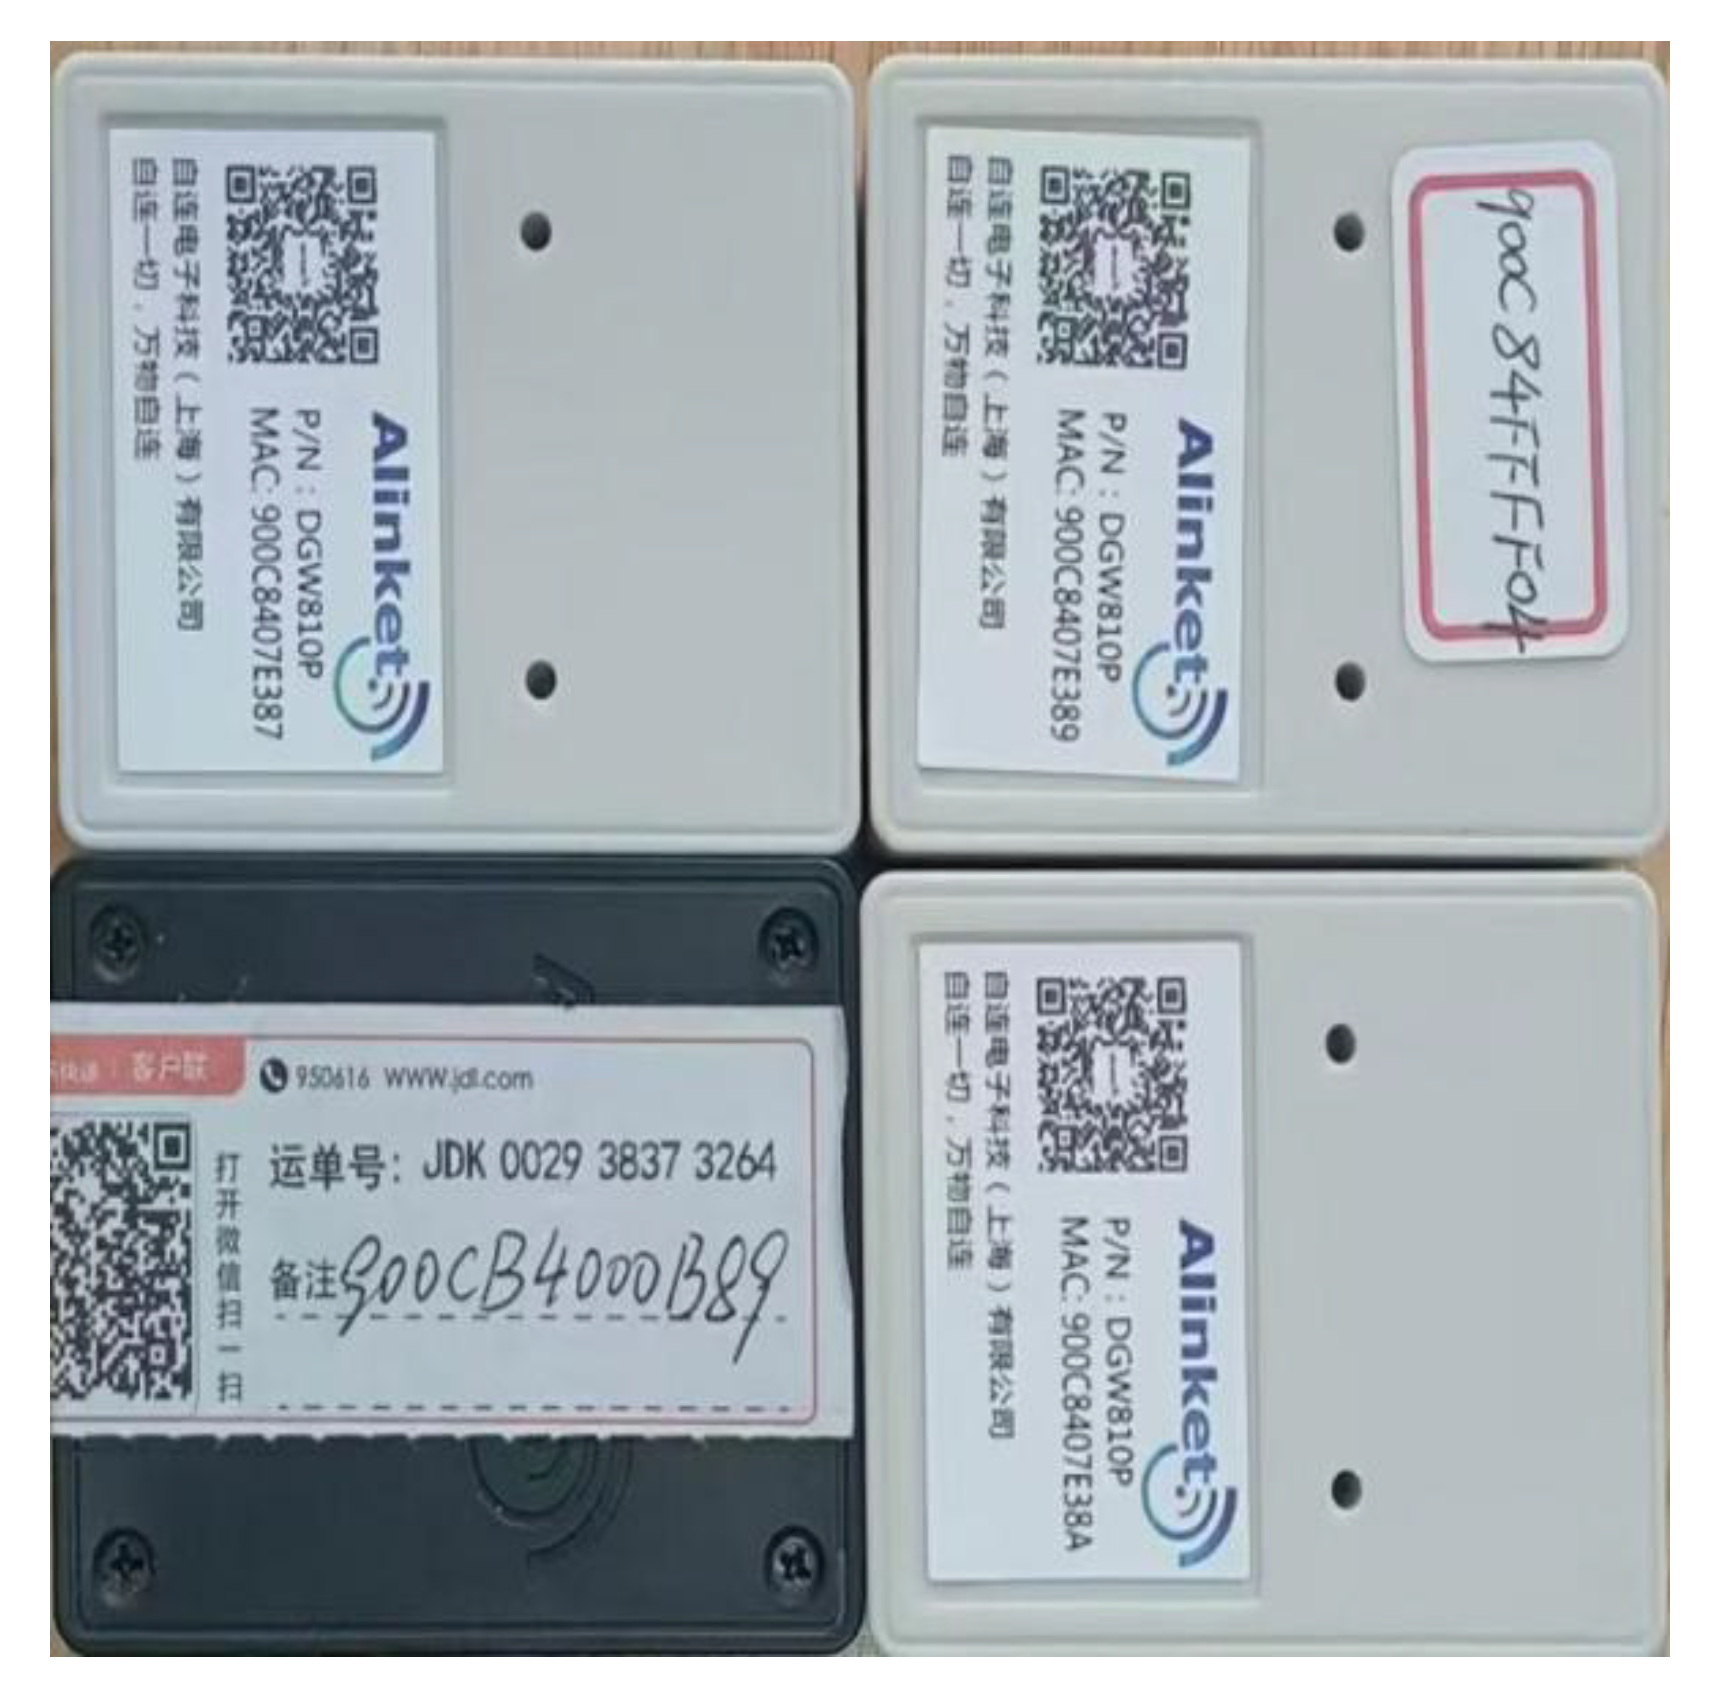
In order to empirically demonstrate the practical application value of the proposed algorithm in this paper, we used the AiKits-ASC401 Bluetooth chip and the gate way chip of DGW810P, which are produced by Self-connect Electronic Technology (Shanghai) Co.
Figure 11.
AiKits-ASC401 Bluetooth chip.

Figure 12.
Gateway Chip for DGW810P.
The experiment uses the same parameter settings and comparison scheme of the HIPACO algorithm as the simulation performance test. In order to verify the effectiveness and accuracy of the algorithm proposed in this paper in complex and changing indoor environments, we carried out field tests in a conference room with a length of 15.6 meters, a width of 10 meters and a height of 3.5 meters. The experiment simulates the following four real scenarios:
- (1)
- Conventional laboratory scenarios: contain obstacles such as tables and chairs and interference from electronic devices such as computers;
- (2)
- Add obstacle scene: randomly add obstacles such as large green plants on top of the regular scene;
- (3)
- People activity scenarios: introduce people walking around in regular scenarios;
- (4)
- Mixed scenarios: simultaneous addition of obstacles and introduction of people walking.
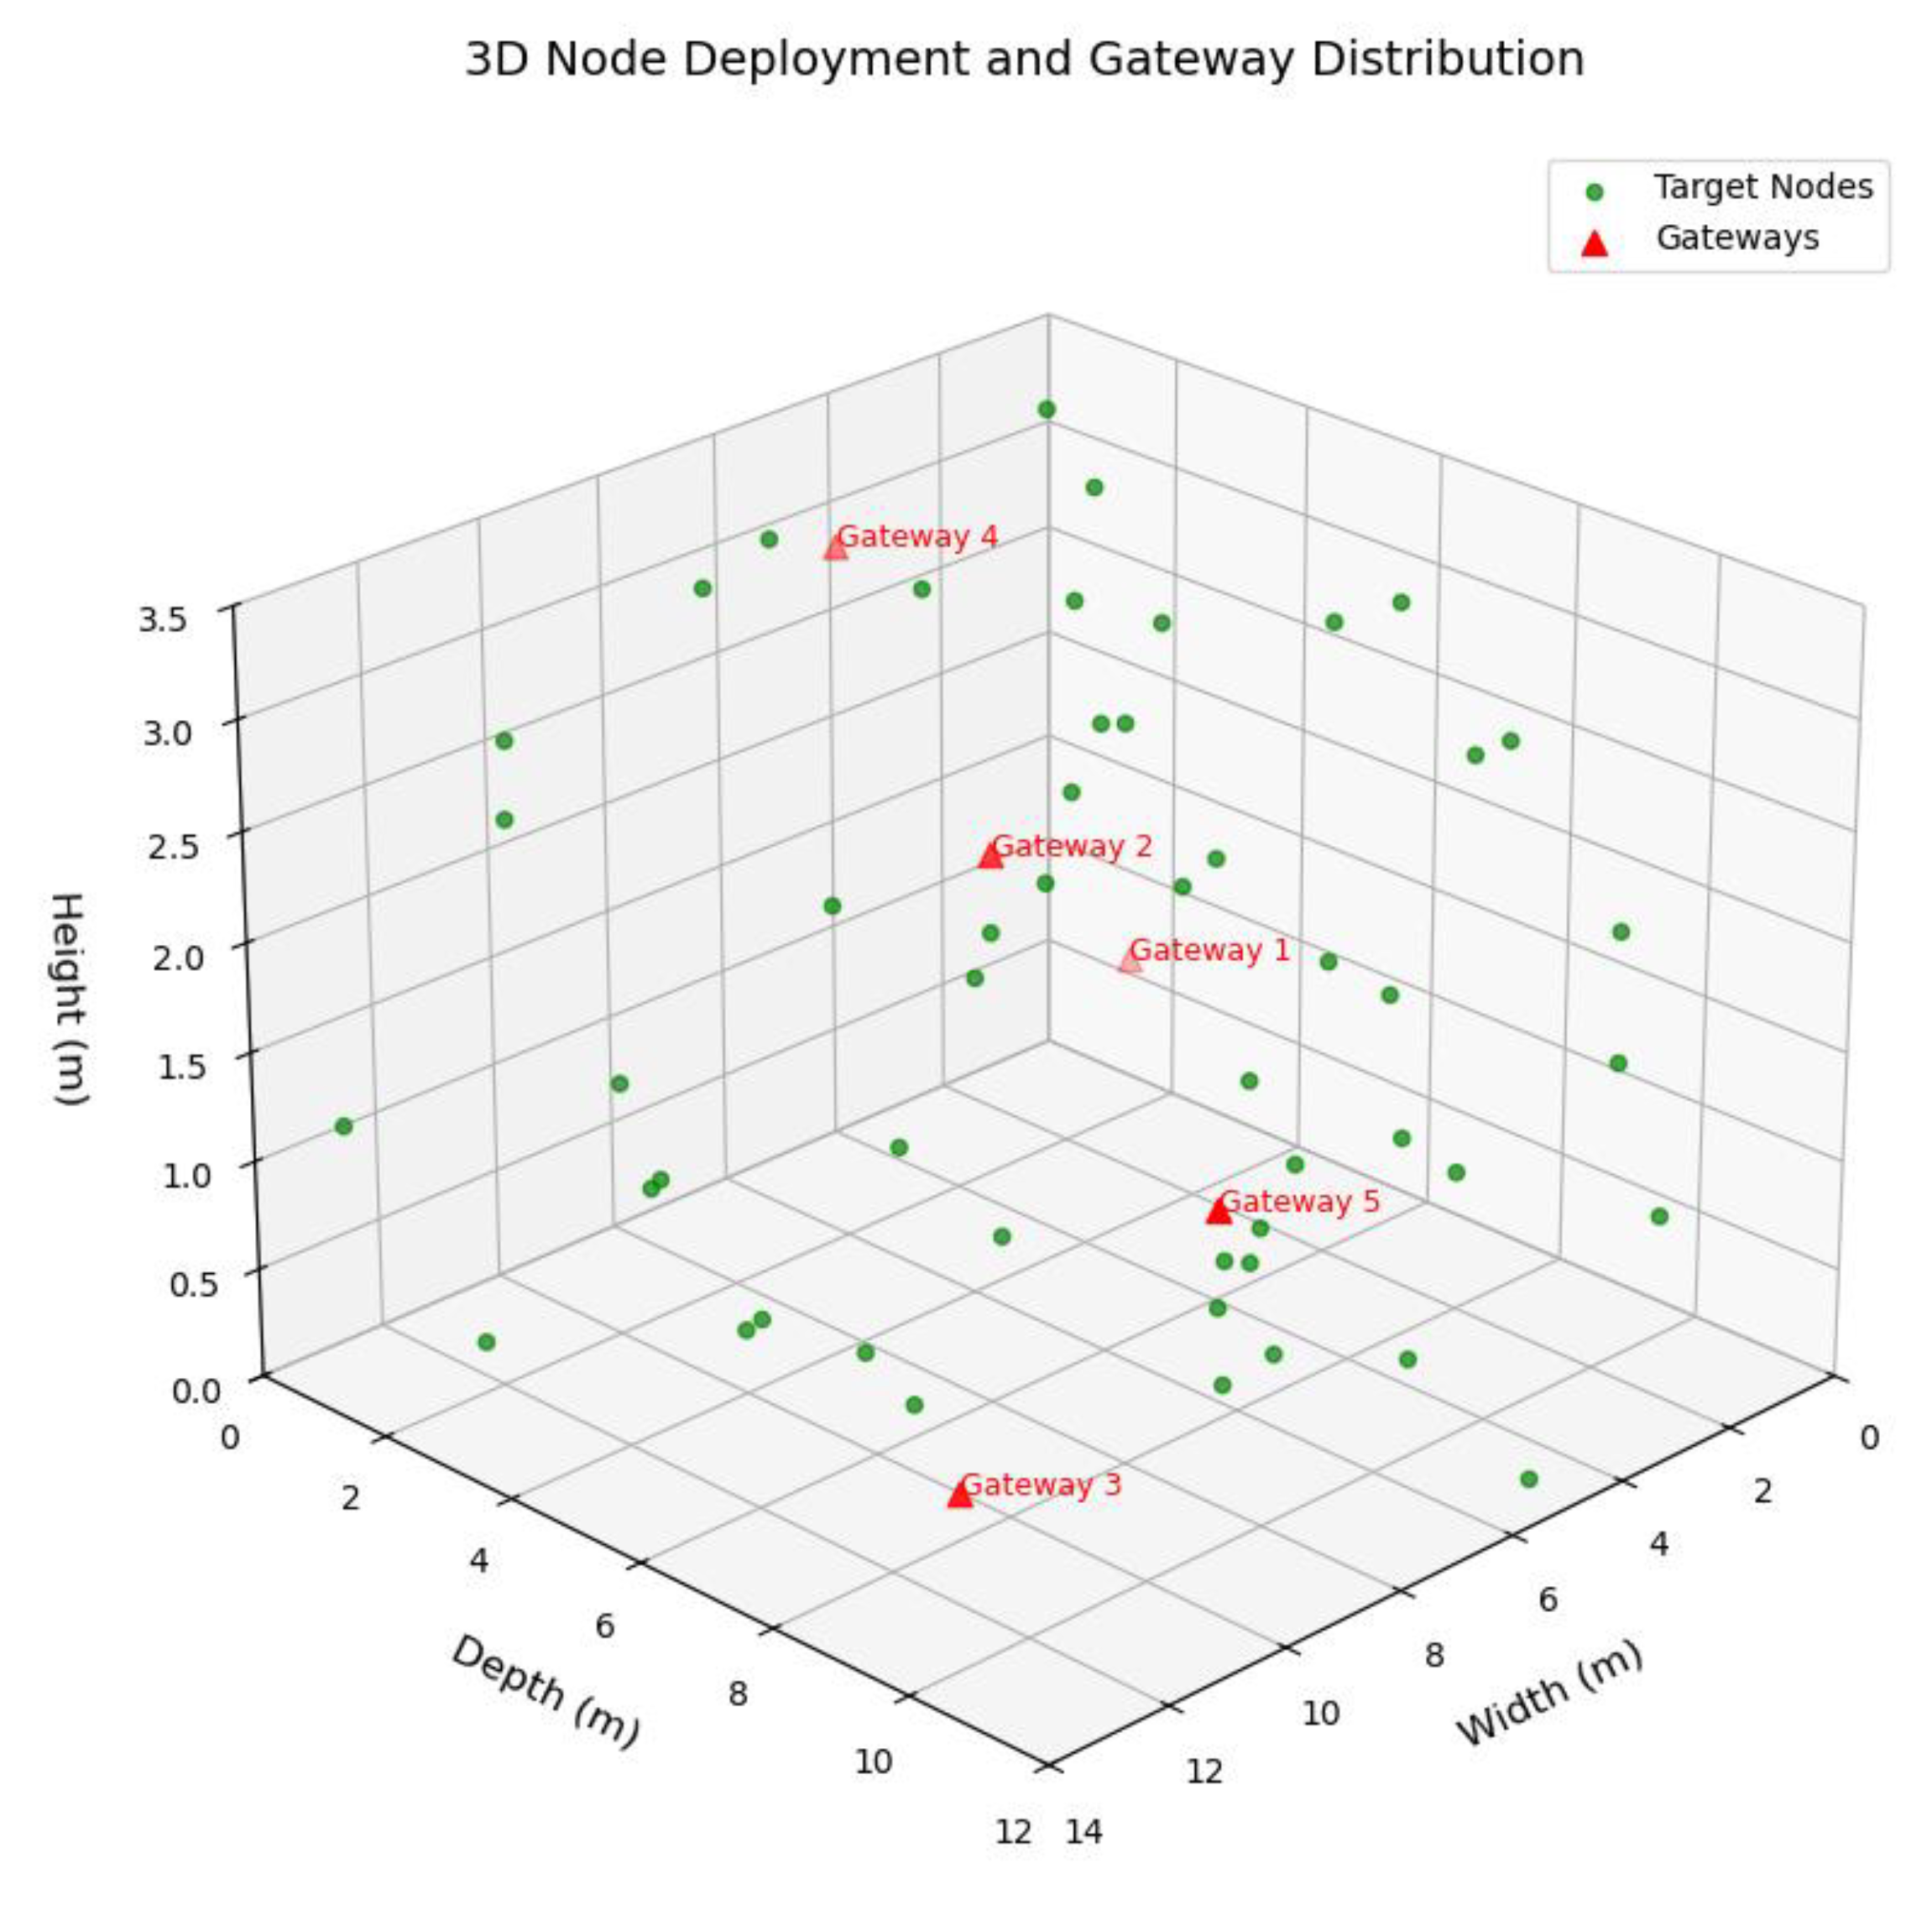
In the test area, we deployed 4 anchor nodes with fixed positions and 20 target nodes to be localized, the specific layout is shown in Figure 13.
Figure 13.
Distribution of gateway and target nodes in real scenario.
A total of 600 localization experiments were conducted by randomly adjusting the position of the target node and the position of the interfering objects before conducting the experiments. The three algorithms perform the localization of the target node in the same scenario and derive the localization error values respectively, and finally calculate the mean value of the error for the localization experiments in all cases, randomly taking 200 times the error bars are shown in Figure 14 and the errors in all cases are shown in Table 4. Where the first column is ACO algorithm, second column is PSO algorithm and third column is the algorithm of this paper.
Figure 14.
Comparison of localization errors of the three algorithms.
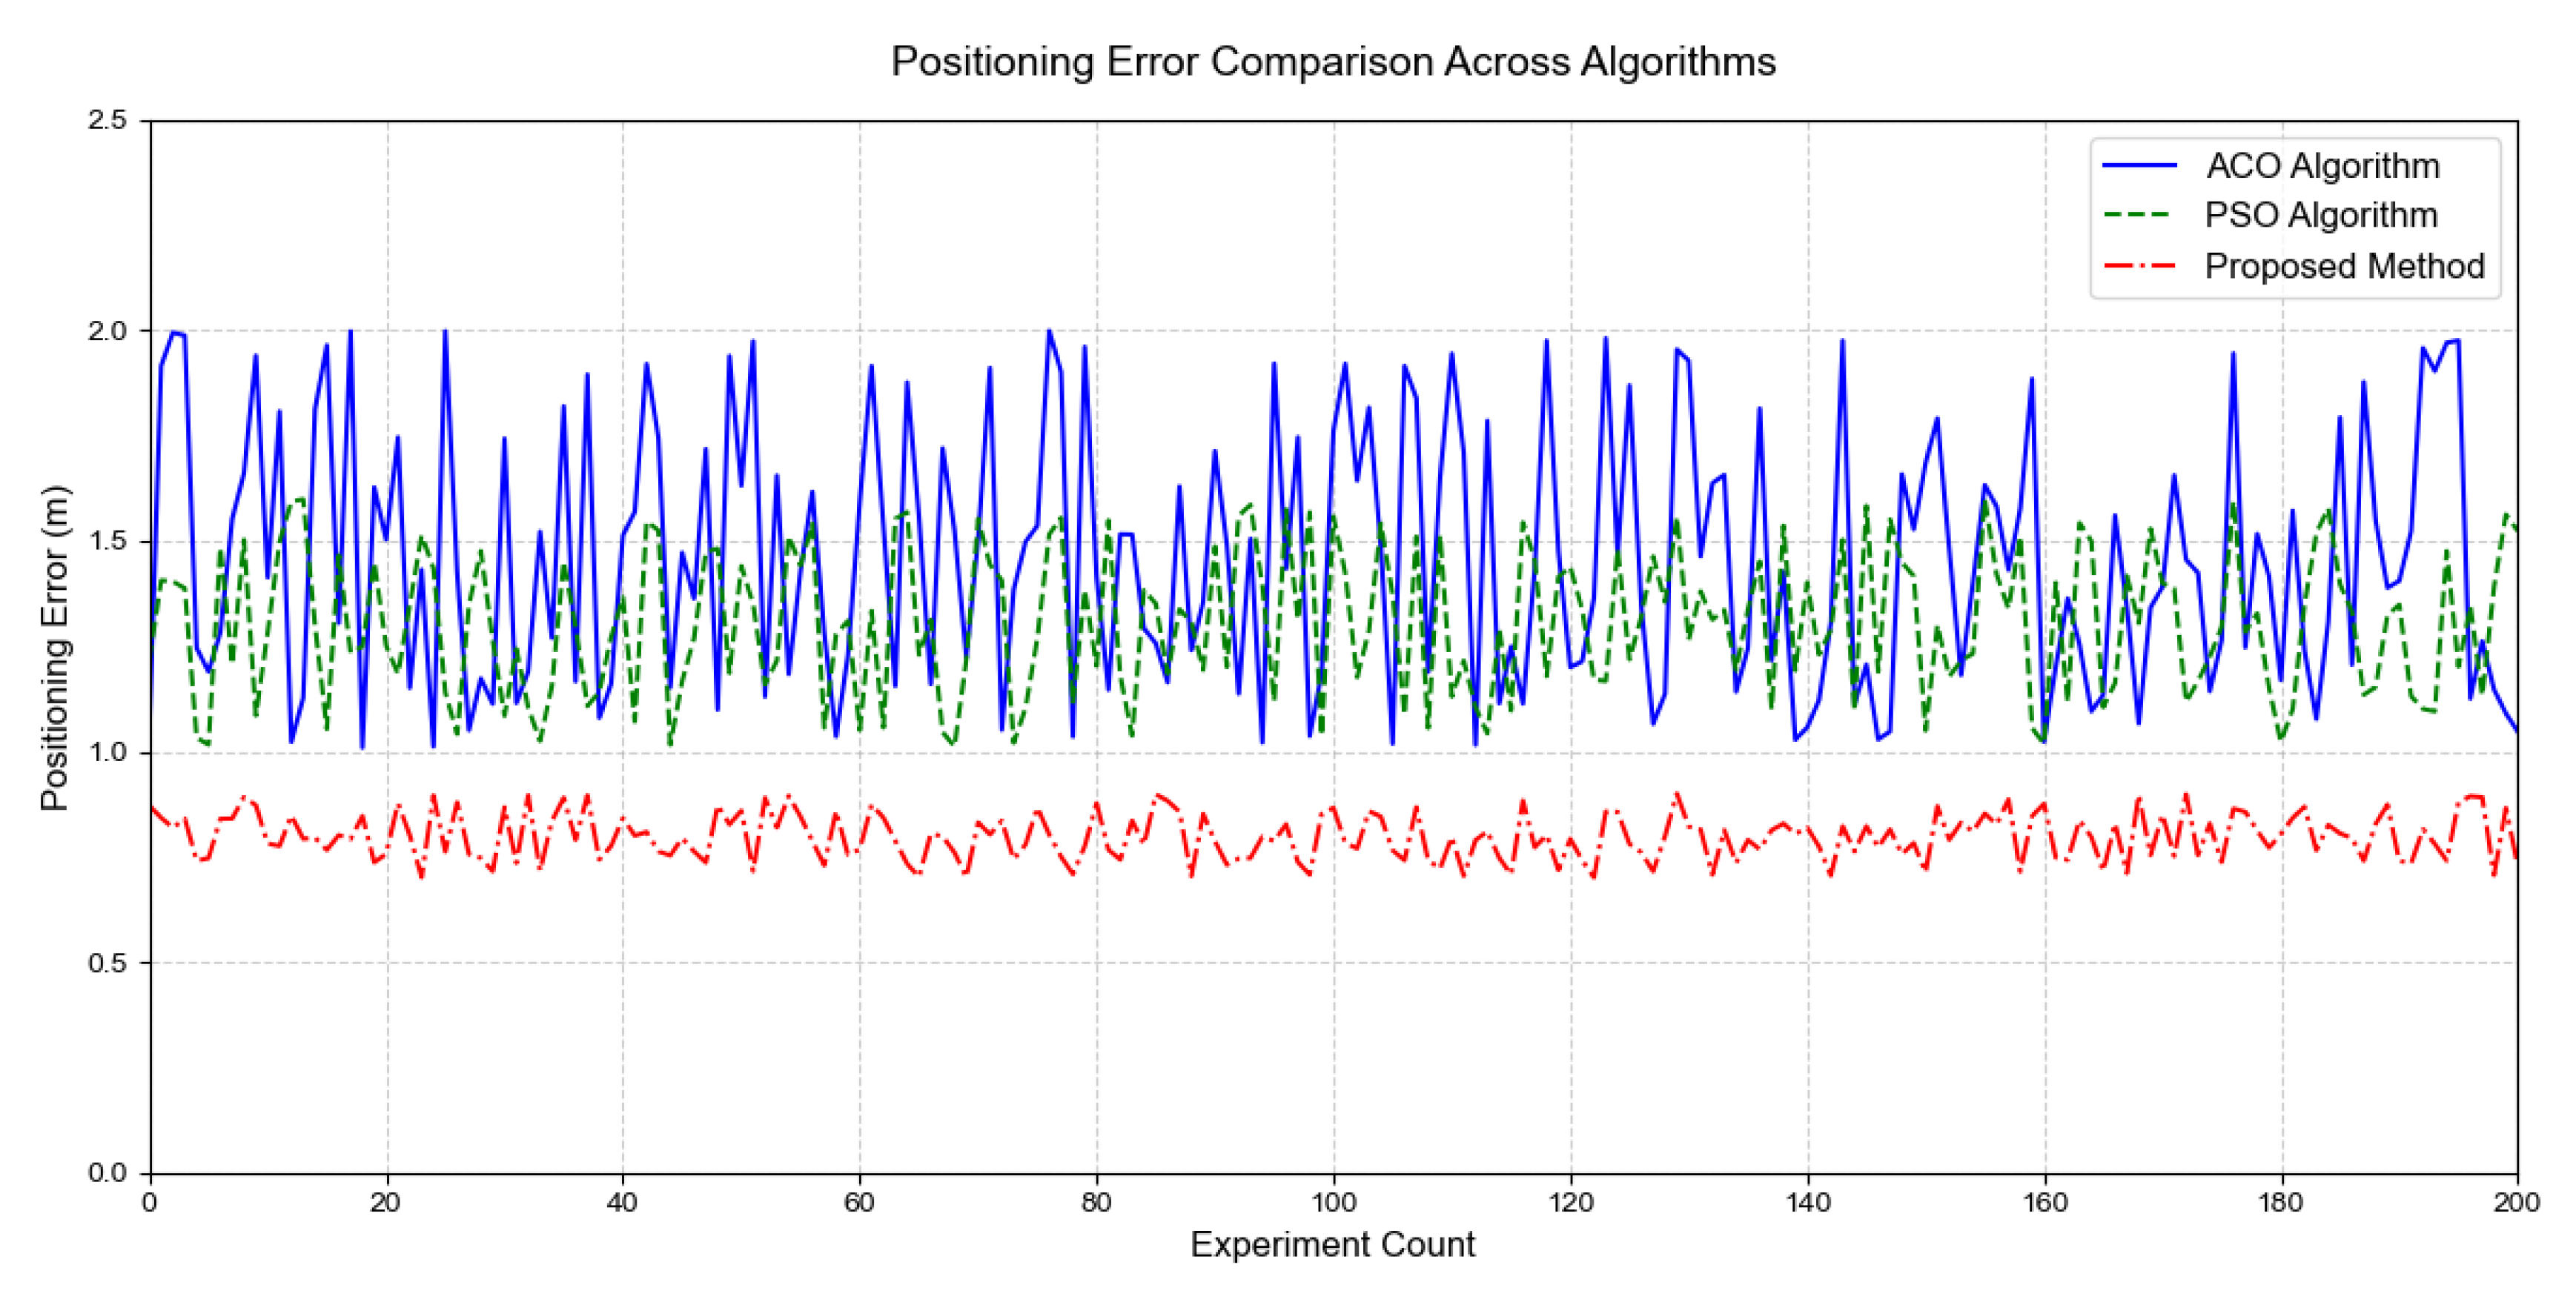
Table 4.
All error data of three algorithms in real scenarios.
| Positioning Program | maximum values | minimum value | average value |
|---|---|---|---|
| Option 1 | 2.323 | 0.329 | 1.326 |
| Option 2 | 2.424 | 0.436 | 1.430 |
| The algorithms in this paper | 1.493 | 0.213 | 0.853 |
4. Conclusions
Aiming at the traditional ACO algorithm which still has significant deficiencies in indoor positioning applications, this study proposes an improved ant colony optimization algorithm (HIPACO) based on dynamic hybrid pheromone strategy. By constructing a worker-ant-soldier ant division-of-labor mechanism, adaptive pheromone attenuation model, and hybrid bootstrap strategy, it achieves an average localization error of 0.84±0.35 m in a standard test scenario of anchor nodes, a Compared with the traditional ACO algorithm, it reduces 42.3%, improves the convergence speed by 2.1 times, reduces the computational complexity by 22.5%, and maintains a positioning accuracy of 1.12 m in the actual conference room scenario test, which is significantly better than PSO (1.65 m) and ACO (2.03 m), and its core advantages lie in the suppression of the multipath effect by the dimension balancing strategy and the non-visual propagation error by the dynamic pheromone mechanism. Its core advantage lies in the suppression of multipath effect by dimensional balance strategy and the compensation of non-line-of-sight propagation error by dynamic pheromone mechanism. In the future, we will further optimize the algorithm performance by fusing deep learning models, researching the multimodal pheromone fusion mechanism of heterogeneous nodes, and developing the edge computing framework, so as to provide high-precision indoor positioning solutions for smart factories, emergency rescue and other scenes.
References
- Author 1,Y. Dai.; Author 2,T. Liu. “Review and development prospect of indoor positioning technology” Digital Communication World, vol. 2024, no. 08, pp. 89-91, Aug. 2024.
- Author 1,Tang Q.; Research on indoor mobile robot navigation technology based on improved ant colony algorithm[D]. Southwest University of Science and Technology,2024.
- Author 1,Yibing Li.; Author 2, Zitang Zhang;Author 3, Qian Sun; Author 4, Yujie Huang. “An improved ant colony algorithm for multiple unmanned aerial vehicles route planning”, Journal of the Franklin Institute, Volume 361, Issue 15, 2024.
- Author 1, YU Zhou; Author 2, CHEN Shengjun;Author 3, LI Xiaoping. A research review of improved ant colony algorithm[J]. Information and Computer(Theoretical Edition),2021,33(11):57-59.
- Author 1, GUO Chengcheng.; Author 2,TIAN Liqin.; Author 3, WU Wenxing.A review on the application of ant colony algorithm in solving the traveler problem[J].Computer System Applications,2023,32(03):1-14. [CrossRef]
- Author 1,Z. Zhang, Y. Li.; Author 2, H. Chen, “Improved Ant Colony Algorithm for AGV Path Planning in Automated Container Terminals,” *IEEE Access*, vol. 8, pp. 76348- 76358, 2020. [CrossRef]
- Author 1,Z. Zetai Wu.; Author 2,Yiting Wang;Author 3, Jingqi Fu,”A hybrid RSSI and AoA indoor positioning approach with adapted confidence evaluator”, Ad Hoc Networks, Volume 154,. 2024, 103375, issn 1570-8705.
- Author 1,F. S. Daniş.; “Live RSSI Filtering for Indoor Positioning with Bluetooth Low-Energy,” 2022 IEEE 12th International Conference on Indoor Positioning and Indoor Navigation (IPIN), Beijing, China, 2022, pp. 1-8. [CrossRef]
- Author 1,W. Zhang.; Author 2, Y. Shi”Decoupled Parameter Control for Hybrid PSO-ACO: A Quantum Entanglement Inspired Approach,” in Proc. GECCO, 2022, pp. 234-241.
- Author 1,Praveen Joe I. R.; “A Hybrid PSO-ACO Algorithm to Facilitate Software Project Scheduling.” IJEC vol.18, no.2 2022: pp.1-12. https://doi.org /10.4018/IJeC.304039.
- Author 1,Phoemphon, S.; Author 2,Leelathakul, N. & So-In, C. (2024). An enhanced node segmentation and distance estimation scheme with a reduced search space boundary and improved PSO for obstacle-aware wireless sensor network localization. *Journal of Network and Computer Applications*, 221, 103783.
- Author 1, Huang B.; Author 2, Zhan F.;Author 3, Sun Q; Author 4, Zhang H.A distributed robust economic dispatch strategy for integrated energy system considering ca, IEEE Transactions on Industrial Informatics. (2022) 18, no. 2, 880-890.
- Author 1D. Janczak et al.; “Indoor Positioning Based on Bluetooth RSSI Mean Estimator for the Evacuation Supervision System Application,” in IEEE Access, vol. 12, pp. 5584-5585, 2024.
Disclaimer/Publisher’s Note: The statements, opinions and data contained in all publications are solely those of the individual author(s) and contributor(s) and not of MDPI and/or the editor(s). MDPI and/or the editor(s) disclaim responsibility for any injury to people or property resulting from any ideas, methods, instructions or products referred to in the content. |
© 2025 by the authors. Licensee MDPI, Basel, Switzerland. This article is an open access article distributed under the terms and conditions of the Creative Commons Attribution (CC BY) license (http://creativecommons.org/licenses/by/4.0/).
Copyright: This open access article is published under a Creative Commons CC BY 4.0 license, which permit the free download, distribution, and reuse, provided that the author and preprint are cited in any reuse.


