Submitted:
10 September 2025
Posted:
11 September 2025
You are already at the latest version
Abstract
The benefit of neoadjuvant chemotherapy (NAC) over upfront surgery (UFS) for resectable pancreatic ductal adenocarcinoma (PDAC) is increasingly recognized, yet prognostic biomarkers remain undefined. We evaluated tumor–stroma ratio (TSR), β-catenin (β-CTN) expression, and tumor budding (TB) in 84 resected PDACs (35 NAC, 49 UFS) using digital image analysis of multi-cytokeratin (m-CK) and β-CTN immunohistochemistry. TSR was defined as the proportion of malignant epithelial area within the tumor, and the β-CTN/m-CK index as the ratio of β-CTN to m-CK immunoreactivity in tumor tissue relative to intralobular ducts. TB was significantly less frequent in NAC than UFS (p=0.003), suggesting that NAC may indirectly modulate epithelial–mesenchymal transition, with TB regarded as its morphological correlate. In the NAC cohort, low TSR was associated with more favorable histological response (Evans IIa/IIb, median 7%; Evans I, 16%; p=0.009), likely reflecting NAC-induced tumor shrinkage with relative stromal predominance. In multivariable analysis, low β-CTN/m-CK index (< 0.5) predicted shorter relapse-free survival in both NAC (HR=2.516, p=0.043) and UFS (HR=2.230, p=0.025) subgroups. High TSR (≥13%) was associated with shorter cancer-specific survival (HR=2.414, p=0.034) in the overall cohort, indicating prognostic value complementing its association with NAC response. These results identify β-CTN/m-CK index and TSR as prognostic biomarkers in PDAC.
Keywords:
β-catenin
; pancreatic ductal adenocarcinoma
; digital image analysis
; immunohistochemistry
; neoadjuvant chemotherapy
; tumor budding
; tumor-stroma ratio
; upfront surgery
; whole-slide imaging
1. Introduction
The incidence of pancreatic cancer (PC) has increased over the past few decades, accounting for 2%–3% of all cancers [1,2]. It is highest in North America and Europe, followed by East Asia [3]. PC represents 5% of all cancer deaths worldwide [2,3], and its prognosis is extremely poor, with 5-year survival ranging from 2% to 13% [1,2]. For localized PC, surgical resection remains the mainstay of curative treatment [1,2,3]. The recent 5-year survival after surgery is ~15–25% [3], showing substantial improvement from 1.5% to 17.4% between 1975 and 2011 [2]. Given this progress, neoadjuvant chemotherapy (NAC) may improve outcomes by eradicating occult metastases and increasing resection rates [1,2], although its survival benefit remains controversial [4]. A meta-analysis of 11 studies showed similar overall survival in resectable PC with or without NAC [5], whereas a retrospective study of 1,175 NAC and 4,041 upfront surgery (UFS) cases showed multiagent NAC improved survival over UFS [6].
Phase III trials in Japan have shown that S-1, an oral prodrug of 5-fluorouracil, is non-inferior to continuous infusion 5-fluorouracil for gastric and colorectal cancers, establishing S-1 as an effective and more convenient oral alternative [7]. In PC, similar trends have emerged, with evidence indicating that S-1 provides efficacy comparable to gemcitabine (GEM) in metastatic or locally advanced disease and superior efficacy in the adjuvant setting [4]. In the Japanese multicenter PREP-02/JSAP-05 trial, NAC with S-1 plus GEM significantly improved survival in resectable PC [8]. Accordingly, the 2022 Clinical Practice Guidelines for PC from the Japan Pancreas Society recommend this regimen as a NAC option for resectable disease [9]. An early pilot study also reported safety and promising efficacy of S-1 plus GEM in a Caucasian population [10]; however, S-1 has not been widely adopted in Europe or the United States, largely because the maximum tolerated dose in Caucasians is lower than in Mongolians due to gastrointestinal toxicity [4,7]. While NAC is now integral to domestic treatment strategies, interest is growing in histopathological and immunohistochemical assessment of residual tumor aggressiveness as prognostic markers.
Among PC subtypes, pancreatic ductal adenocarcinoma (PDAC) is the predominant histological form, accounting for most cases [1,3]. Histopathologically, PDAC displays marked morphological heterogeneity and a dense desmoplastic stroma, which can constitute ~80–90% of tumor volume and strongly influence tumor progression and drug delivery [11,12]. Compared with endometrial, colorectal, esophageal, and gastric cancers, PDAC is distinguished by an exceptionally abundant stroma, yielding a lower tumor–stroma ratio (TSR), defined as the proportion of malignant epithelial cells to stroma, than in most other tumor types [13]. The prognostic significance of TSR has been established across various cancer types [13] and further validated in PDAC [14,15,16,17,18,19,20,21,22]. Against this background, computer-aided evaluation and image analysis techniques have been introduced to assess TSR in histologic PDAC specimens, enabling more precise and reproducible quantification compared with conventional visual assessment [15,17,18,19,20,21,22,23,24,25].
Accumulating evidence indicates that the stromal compartment is a key mediator of chemoresistance in PC [26,27,28,29]. Experimental evidence from preclinical models suggests that depletion of the stromal compartment facilitates improved intratumoral delivery and potentiates the efficacy of cytotoxic agents [28,29]. Notably, an S-1–based combination regimen suppressed tumor growth while reducing stromal components in vivo [29]; furthermore, those combinations can induce tumor-cell apoptosis in vitro [30]. Despite these insights, evidence on the clinical and prognostic relevance of TSR specifically in the context of NAC for PDAC remains poorly defined [18,20].
β-catenin (β-CTN) anchors cadherin complexes to the actin cytoskeleton and serves as a key effector of Wnt signaling [31]. In general, loss of β-CTN disrupts adhesion and drives invasion, with expression high in well-differentiated but low in poorly differentiated tumors [32]. Consistent with this functional role, immunohistochemical studies have demonstrated that a shift from membranous to predominantly cytoplasmic β-CTN expression is associated with advanced disease and unfavorable prognosis [33,34,35,36]. Experimental studies in murine PC models, extending these clinical observations, indicate that β-CTN overexpression at advanced stages contributes to chemoresistance [37]. These findings highlight the potential relevance of β-CTN in both disease progression and treatment response. Despite such insights, only a limited set of histological features have been systematically evaluated and notable examples including encapsulating fibrosis [20], co-expression patterns of β-CTN and PROX1 [34], expression of podocalyxin [38] and GATA6 status [39] have been explored in this context.
Tumor budding (TB), defined as single cancer cells or small clusters of up to four cells located at the invasive tumor front, represents a highly invasive tumor subpopulation [40,41]. TB provides morphological evidence of epithelial mesenchymal transition induction at the tumor-host interface [42], and is closely associated with the tumor microenvironment, including immune and stromal components such as cancer-associated fibroblasts in PDAC [43]. Although multiple studies have demonstrated that TB is an independent prognostic factor in PDAC [42,44,45,46,47,48], it has not yet been routinely incorporated into histopathology reports for PC, despite being a well-established prognostic marker in colorectal cancer [40,41]. The prognostic relevance of TB in PDAC treated with NAC remains to be fully elucidated, and, to the best of our knowledge, few studies have reported its significance in resected PDAC following preoperative chemoradiotherapy [44,45].
Against this background, we investigated the interrelations among TSR, β-CTN expression, and TB in resectable PDAC, examined their associations with clinicopathological variables, and evaluated their prognostic relevance, with particular attention to treatment response in NAC versus UFS cohorts, thereby extending current evidence on prognostic biomarkers in PDAC.
2. Materials and Methods
2.1. Patients and Materials
This retrospective study included 84 consecutive Japanese patients with PDAC who underwent curative-intent resection at Showa Medical University Hospital between January 2018 and December 2023. Patients with other histologies (e.g., acinar cell carcinoma, neuroendocrine neoplasms) were excluded. Patients with borderline-resectable PDAC and those undergoing conversion surgery, as previously defined [49,50], were also excluded. Of the 84 resectable cases, 35 received NAC consisting of two courses of S-1 (body-surface area <1.25 m2, 80 mg/day; 1.25–1.4 m2, 100 mg/day; ≥1.5 m2, 120 mg/day) for 14 consecutive days followed by a 1-week rest, plus GEM (1,000 mg/m2 on days 1 and 8 followed by a 2-week rest), and then underwent pancreatectomy (NAC group). The remaining 49 underwent UFS with no preoperative therapy (UFS group). A flow diagram illustrating patient selection is provided in Supplementary Figure S1. Adjuvant S-1 (four 28-day courses with a 2-week rest) was administered to 48/84 patients. The mean follow-up among survivors at last visit (n=48) was 732 days (range, 59–1,899). Clinicopathological data are summarized in Supplementary Table S1. Written informed consent was obtained from all patients. The study was approved by the Showa Medical University Ethics Committee (No. 2024-233-B) and conducted in accordance with the Declaration of Helsinki.
2.2. Histological Analysis
Resected specimens were fixed in 10% neutral-buffered formalin, sliced at 5-mm intervals, and embedded in paraffin. Tissue sections, 4 µm in thickness, were stained with hematoxylin and eosin (H&E). Two pathologists (H.M., S.M.), blinded to clinical data, reviewed all H&E slides. Pathological T and N categories and overall stage were assigned according to the UICC TNM classification (9th edition). The histological effect of NAC was graded by the Evans system [51], as follows: Grade I, little or no tumor cell destruction (<10%); Grade IIa, 10–50%; Grade IIb, 51–90%; Grade III, >90% with only single cells or small clusters remaining; Grade IV, no viable tumor cells. For IHC, one representative block from the largest tumor slice including adjacent pancreatic tissue was selected.
2.3. Immunohistochemstry (IHC)
From each representative block, serial sections (4 μm) were cut and placed on three slides; two for IHC and one for H&E. After heat-induced epitope retrieval (BOND Epitope Retrieval Solution 1, Leica Biosystems), slides were immunostained on an automated stainer (BOND-III, Leica Biosystems, Newcastle, UK) with mouse monoclonal multi-cytokeratin (m-CK) (clone AE1/AE3, 1:200; Leica) and monoclonal β-CTN (clone 17C2, prediluted; Leica). Detection used a horseradish peroxidase-labeled polymer (BOND compact polymer system). Immunoreactivity was visualized with 3, 3′-diaminobenzidine and counterstained with hematoxylin.
2.4. TSR
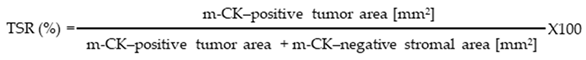
Whole slide images (WSIs) of H&E and m-CK IHC were acquired at ×40 using the NanoZoomer S60 (Hamamatsu Photonics, Hamamatsu, Japan) and saved as non-layered JPEGs. Using ImageJ (National Institutes of Health, Bethesda, MD, USA), tumor areas were annotated on m-CK WSIs with reference to serial H&E WSIs and reviewed in NDP.view2 (v2.9.29). Briefly, the tumor area on the m-CK WSI (corresponding to H&E) was outlined; non-tumorous surrounding tissue and intra-tumoral non-neoplastic parenchyma were removed; images were converted to 8-bit grayscale and then to binary. Annotation was performed by one observer (S.O.) and reviewed by a pathologist (H.M.). The lower threshold was set to zero and the upper threshold fixed at 140 across cases to suppress background while preserving true immunoreactivity. In the final binary image, m-CK-positive tumor area (white) and m-CK-negative stromal area (black) were quantified, and TSR (%) was calculated as:
The workflow is illustrated in Figure 1; ImageJ settings are detailed in the Supplementary Methods.
2.5. Assessment of β-CTN IHC
Nuclear/cytoplasmic and membranous β-CTN stainings were assessed separately. Distinct nuclear and/or cytoplasmic staining was considered positive regardless of intensity and dichotomized as negative (<1% positive cells) or positive (≥1%). Slides were assessed concurrently by two authors (S.O., H.M.) using a multi-head microscope, blinded to outcomes; disagreements (<10% of cases) were resolved by joint review.
2.5.β-. CTN/m-CK Index
WSIs of serial H&E, β-CTN, and m-CK stained slides were scanned, and five representative images of tumor and adjacent intralobular ducts were captured per case at ×5–10 magnification and saved as non-layered JPEGs. Using ImageJ, β-CTN and m-CK images were converted to 8-bit grayscale, and thresholds for binary conversion (black and white) were determined by two observers, including a pathologist (S.O. and H.M.). The maximum threshold was fixed at 140 across all analyses. In the resulting binary images, white areas corresponded to β-CTN–positive or m-CK–positive regions. The β-CTN/m-CK index was calculated as the ratio of β-CTN/m-CK in the tumor normalized to the corresponding ratio in intralobular ducts:

Stepwise analysis for a representative case with β-CTN/m-CK index < 0.5 is illustrated in Figure 2. Step 1: Tumor regions were scanned on β-CTN and m-CK WSIs corresponding to serial H&E sections. Step 2: Five representative tumor images were captured at ×10 magnification. Step 3: Grayscale (8-bit) images were generated. Step 4: Binary images were created, in which white areas represent β-CTN– or m-CK–positive tumor regions. Step 5: The β-CTN/m-CK ratio was calculated for each tumor image. The same procedure was applied to non-neoplastic intralobular ducts (Supplementary Figure S2). Representative analysis of a case with β-CTN/m-CK index ≥ 0.5 is shown in Supplementary Figure S3.
2.6. TB
TB was assessed on m-CK IHC slides to improve detectability. Following the consensus definition [41], TB was defined as single tumor cells or clusters of up to four cells without connection to the main tumor mass. Two authors (S.O., H.M.) screened the entire slide at low magnification to identify the hot spot (densest TB area), irrespective of location. TBs within the hot spot were counted at ×20 objective (field area 0.785 mm2). TB was dichotomized as low (<10 buds) or high (≥10 buds). Representative examples are provided in Supplementary Figure S4.
2.7. Statistical Analysis
Categorical variables were compared with the χ2 test or Fisher’s exact test; continuous variables with the Mann–Whitney U test. Spearman’s rho was used to assess non-parametric correlations. Cancer-specific survival (CSS) was measured from surgery to death from PDAC or last follow-up; deaths from other causes were censored. Relapse-free survival (RFS) was measured from surgery to the first event of locoregional recurrence, distant metastasis, or death from any cause. Kaplan–Meier curves were generated and compared using the log-rank test (and, where indicated, Wilcoxon). Multivariate analyses used Cox proportional hazards models with stepwise selection; candidate variables entered if univariate p<0.10. Hazard ratios (HRs) with 95% confidence intervals (CIs) were reported. Two-sided p<0.05 was considered statistically significant. Analyses were performed using JMP (SAS Institute, Cary, NC, USA).
3. Results
3.1. Clinicopathological Differences Between NAC and UFS
Patients in the UFS group were significantly older than those in the NAC group (p=0.040). The distribution of pT category approached significance (p=0.060); the NAC cohort included more pT1 and fewer pT2, with a modest excess of pT3 (NAC: pT1 13/35, 37.1%; pT2 13/35, 37.1%; pT3 9/35, 25.7% vs UFS: pT1 10/49, 20.4%; pT2 31/49, 63.3%; pT3 8/49, 16.3%). Margin status likewise showed a borderline difference (p=0.067), with margin-negative resections being more frequent after NAC (33/35, 94.3%) than UFS (39/49, 79.6%) and margin-positive resections correspondingly less frequent (NAC 2/35, 5.7% vs UFS 10/49, 20.4%). In contrast, TSR and the β-CTN/m-CK index did not differ between groups (Table 1). Kaplan–Meier analysis revealed no significant difference in CSS or RFS between NAC and UFS (data not shown).
3.2. β-CTN and m-CK IHC
In non-neoplastic pancreas, β-CTN was distinctly membranous in intralobular ducts but weak in acinar cells. In PDAC, tumors largely retained membranous expression, yet loss of membranous staining became evident with poor differentiation. Nuclear and cytoplasmic staining was uniformly absent (<1% of tumor cells). In contrast, m-CK showed uniformly strong staining across tumor and non-neoplastic components, largely preserved irrespective of differentiation.
3.3. Baseline Values of TSR, β-CTN/m-CK Index, and TB
The median TSR was 14% (range, 2–53) in the entire cohort, with similar values in the NAC (12%, range 2–51) and UFS groups (14%, range 2–53). The β-CTN/m-CK index showed a median of 0.5 (range, 0–12.3) overall, tending to be higher in the NAC group (0.8, range 0–12.3) compared with the UFS group (0.5, range 0–5.2). The median TB count per hotspot (×20, 0.785 mm²) was 15.5 (range, 1–250) overall, 10 (range, 1–250) in the NAC group, and 17 (range, 4–90) in the UFS group. Low TB was observed in 27% of cases (46% in NAC vs. 14% in UFS), while high TB (73% of cases) predominated (54% in NAC vs. 86% in UFS).
3.4. Association of TSR with Clinicopathological Features
Patients were dichotomized by TSR at 13% (pre-specified and approximating the cohort median) into <13% and ≥13% groups. Resection margin status showed a marginal trend with TSR in the overall cohort (p=0.058): margin-negative resections were 35/37 (94.6%) in the TSR <13% group versus 37/47 (78.7%) in the TSR ≥13% group. A similar pattern was observed in the UFS subgroup (p=0.070), with margin-negative resections 17/18 (94.4%) for TSR <13% compared with 22/31 (71.0%) for TSR ≥13% (Supplementary Table S2).
3.5. Association of β-CTN/m-CK Index with Clinicopathological Features
Patients were categorized into two groups according to the β-CTN/m-CK index (<0.5 vs ≥0.5). Overall, the index showed no significant associations with clinicopathological variables. Within the NAC subgroup, however, high index (≥0.5) was more frequent in younger (<75 years) than in older patients (younger 17/22, 77.3% vs older 6/13, 46.2%; p=0.079) (Supplementary Table S3). Although this dichotomization was not associated with tumor differentiation, stratified analysis showed significantly lower index values in poorly compared with well-differentiated tumors (median 0.3 vs 0.9; p=0.046).
3.6. Association of TB with Clinicopathological Features
In the overall cohort, peripancreatic fat invasion was more frequent with high vs low TB (53/61, 86.9% vs 14/23, 60.9%; p=0.014); perineural invasion and moderate/poor differentiation showed similar trends (50/61, 82.0% vs 14/23, 60.9%; p=0.082; 38/61, 62.3% vs 9/23, 39.1%; p=0.084). In the NAC subgroup, no association reached significance, though moderately/poorly differentiated tumors tended to show higher TB (14/19, 73.7% vs 7/16, 43.8%; p=0.094). In the UFS subgroup, age ≥75 years and peripancreatic fat invasion were enriched in the high-TB group (25/42, 59.5% vs 0/7, 0.0%; p=0.004; 38/42, 90.5% vs 3/7, 42.9%; p=0.009). No other variables showed significant or marginal associations (Supplementary Table S4).
3.7. Interrelationships Among β-CTN/m-CK Index, TSR, and TB in PDAC
By Spearman’s rank correlation, the β-CTN/m-CK index showed a weak inverse association with TB in the overall cohort (rho = –0.320, p=0.003), which was consistently recapitulated in the UFS subgroup (rho = –0.304, p=0.034). In contrast, TSR displayed a weak positive correlation with TB, evident in the overall cohort (rho = 0.279, p=0.010) and in the NAC subgroup (rho = 0.341, p=0.045) (Supplementary Figure S5).
3.8. NAC Response in Relation to TSR, β-CTN/m-CK Index, and TB
In the NAC cohort, low TSR was significantly associated with a more favorable histological response. Tumors attaining Evans IIa/IIb grades (n = 18) exhibited a lower median TSR of 7% (interquartile range [IQR], 5–15), compared with 16% (IQR, 3–19) in Evans grade I (n = 17; p=0.009). TB showed a marginal trend toward reduction in Evans IIa/IIb tumors (median 6; IQR, 2.5–16.5) relative to Evans I (median 15; IQR, 3–29; p=0.092). By contrast, the β-CTN/m-CK index did not vary by Evans grade (Evans I: median 0.8, IQR 0.01–2.1; Evans IIa/IIb: median 0.9, IQR 0.3–1.6; p= 0.974) (Figure 3).
3.9. Survival Analysis in the Overall Cohort
The set of candidate prognostic variables encompassed patient factors (age, sex), treatment variables (NAC and adjuvant chemotherapy), tumor-related parameters (location, pT and pN categories, tumor differentiation, and lymphovascular, perineural, and peripancreatic fat invasion, margin status), and histopathological biomarkers (TSR, β-CTN/m-CK index, and TB). On univariate analysis, TSR ≥13% (p=0.015), β-CTN/m-CK index <0.5 (p=0.009), and high TB (p=0.022), together with conventional factors such as age ≥75 (p=0.033), nodal involvement (pN1/2) (p=0.022), moderate/poor differentiation (p<0.001), peripancreatic fat invasion (p=0.015), and absence of adjuvant chemotherapy (p<0.001), were associated with worse CSS. For RFS, β-CTN/m-CK index <0.5 (p<0.001) and TSR ≥13% (p=0.020), along with conventional variables including absence of adjuvant chemotherapy (p=0.001), pT3 stage (p=0.046), nodal involvement (p=0.001), moderate/poor differentiation (p<0.001), lymphovascular invasion (p=0.004), and peripancreatic fat invasion (p=0.017), were significantly associated with worse outcomes (Supplementary Table S5). Multivariate models identified TSR ≥13% (HR 2.414, 95% CI 1.072–5.439; p=0.034) and β-CTN/m-CK index <0.5 (HR 2.028, 95% CI 1.120–3.670, p=0.020) as independent predictors of shorter CSS and RFS, respectively, together with all other conventional clinicopathological factors assessed (Table 2).
3.10. Survival Analysis in the NAC Subgroup
Univariate analysis identified high TB (p=0.022), male sex (p=0.022), moderate/poor differentiation (p=0.014), and positive resection margin (p<0.001) as factors associated with worse CSS, while β-CTN/m-CK index <0.5 (p=0.018) and positive margin (p=0.017) were significantly related to worse RFS (Supplementary Table S6). Multivariate analysis showed positive margin (HR 63.446, 95% CI 2.871–1402.272; p=0.009) and male sex (HR 18.054, 95% CI 1.614-201.926; p=0.019) as independent adverse factors for CSS, with high TB also demonstrating a marginal association (HR 6.008, 95% CI 0.847–42.627; p=0.073). For RFS, β-CTN/m-CK index <0.5 (HR 2.516, 95% CI 1.031–6.138; p=0.043) was the only independent adverse factor (Table 3).
3.11. Survival Analysis in the UFS Subgroup
On univariate analysis, both TSR ≥13% (CSS: p=0.025; RFS: p=0.020) and β-CTN/m-CK index <0.5 (CSS: p=0.032; RFS: p=0.006) were significantly associated with adverse outcomes. In addition, conventional prognostic factors including moderate/poor differentiation (CSS and RFS: both p<0.001), absence of adjuvant chemotherapy (CSS: p<0.001; RFS: p=0.009), nodal involvement (RFS: p=0.004), and lymphovascular invasion (RFS: p=0.036) were also significant (Supplementary Table S7). In multivariate models, β-CTN/m-CK index <0.5 (HR 2.230, 95% CI 1.106–4.500; p=0.025) was the independent predictor of shorter RFS, and TSR ≥13% showed marginal significance for CSS (HR 2.536, 95% CI 0.947–6.790; p=0.064). In addition, conventional prognostic factors including moderate/poor differentiation (CSS: HR 7.632, 95% CI 2.471–23.575; p<0.001; RFS: HR 5.006, 95% CI 2.178–11.508; p<0.001), peripancreatic fat invasion (CSS: HR 4.933, 95% CI 1.104–22.033; p=0.037), and absence of adjuvant chemotherapy (CSS: HR 5.539, 95% CI 1.882–16.306; p=0.002) were also identified (Table 4).
Kaplan–Meier curves for the overall PDAC cohort, NAC, and UFS subgroups stratified by TSR and β-CTN/m-CK index are shown in Figure 4. In the overall cohort, both TSR ≥13% and β-CTN/m-CK <0.5 were associated with shorter CSS and RFS (both p<0.05, log-rank). In the NAC subgroup, only β-CTN/m-CK <0.5 was associated with shorter RFS (p=0.018), whereas TSR showed no significant separation for either endpoint. In the UFS subgroup, TSR ≥13% predicted shorter CSS (p=0.025) and RFS (p=0.020), and β-CTN/m-CK <0.5 likewise predicted shorter CSS (p=0.032) and RFS (p=0.006).
4. Discussion
Resection remains the standard treatment for PC, with several studies suggesting survival benefits of NAC even in resectable disease [4,6,8,9], whereas other investigations found no clear advantage over UFS [4,5]. Consistent with the latter, our cohort showed no significant differences in survival between NAC and UFS. NAC patients tended toward lower pT stage (p=0.060) and more frequent margin-negative resections (p=0.067), findings concordant with nationwide and randomized evidence of improved resectability and higher complete resection rates [6,8]. Notably, the randomized trial used the same S-1 plus GEM regimen as in our cohort and demonstrated significantly higher rates of margin-negative resection together with improved survival in resectable PC [8]. Further studies likewise noted lower pT stages in post-NAC specimens, particularly with stronger histological response [38,39]. The absence of statistical significance in our cohort likely reflects the limited sample size and follow-up, thereby reducing power to detect differences.
To ensure reproducible TSR estimates, we applied a two-stage pipeline to m-CK–immunostained WSIs, enabling epithelial segmentation followed by H&E-based tumor delineation. This approach improves upon conventional visual assessment [17,19] and incorporates elements of recent deep learning workflows [15,23], thereby reducing region-of-interest bias and observer dependence. Using this approach, we found that high TSR (≥13%) was associated with a higher frequency of margin-positive resections, with borderline significance evident in both the overall cohort (p=0.058) and the UFS subgroup (p=0.070). Our finding that high TSR tended to associate with margin-positive resections is consistent with prior evidence. Supporting this notion, high TSR was independently associated with margin involvement in one series [19], and has further been linked to aggressive pathological features, particularly vascular invasion, perineural infiltration, and infiltrative growth patterns [14,16,20].
In our overall PDAC cohort, TSR ≥ 13% emerged as an independent predictor of shorter CSS (HR, 2.414; 95% CI, 1.072–5.439; p=0.034), while in the UFS subgroup it showed marginal significance (HR, 2.536; 95% CI, 0.947–6.790; p=0.064) in multivariate analysis. This aligns with reports linking a higher epithelial fraction to adverse outcomes in PDAC [14,16,17,19]. Of note, imaging–pathology studies have associated abundant stroma with more favorable survival [22], and higher stromal density has been shown to independently correlate with longer survival after adjustment for PC vaccine therapy in an adjuvant cohort [25], supporting the interpretation that stromal abundance (low TSR) confers a survival advantage, whereas epithelial predominance (high TSR) is linked to poorer prognosis. Taken together, these observations are consistent with our present results.
In our study, TSR had no demonstrable impact on survival within the NAC subgroup. In contrast, a low stromal ratio after NAC has been associated with early hepatic recurrence and shorter RFS [18]. Likewise, GEM-based NAC has been reported to yield lower TSR and more frequent encapsulating fibrosis than UFS [20]. It was further proposed that therapy-induced tumor-cell injury and suppression of activated myofibroblasts at the invasive front may underlie these stromal alterations. The prognostic relevance of stromal metrics may vary by treatment context; in surgically resected, NAC-naïve patients, a higher stromal component (low TSR) has been linked to poorer outcomes, whereas in locally advanced cases treated with GEM combination therapy, greater stromal content was paradoxically associated with improved survival [24]. Within our NAC cohort, a clear relationship emerged between stromal predominance and favorable histological response, as tumors achieving Evans IIa/IIb grades exhibited substantially lower TSR than those with Evans grade I (p=0.009). This association suggests that reduced TSR may serve as a surrogate of therapeutic efficacy in the neoadjuvant setting. Previous studies, however, have noted that abundant stroma can impede intratumoral GEM delivery [27] and contribute to chemoresistance in experimental models [26,52]. The desmoplastic reaction in PDAC has also been implicated in impaired vascular perfusion and restricted drug penetration [53]. On the other hand, its principal component, fibroblast-derived type I collagen, has been shown to restrain tumor progression and modulate the immune microenvironment [54], highlighting the context-dependent roles of the stroma.
Aberrant redistribution of β-CTN from the membrane to the cytoplasm and/or nucleus has been reported in subsets of PDAC, with studies describing decreased membranous expression and increased cytoplasmic or nuclear staining [32,34,36,37]. Other evidence indicates that nuclear accumulation is uncommon, most cases instead showing membranous loss rather than overt nuclear localization [31,35]. In our series, membranous β-CTN was largely preserved, with reduced expression mainly in poorly differentiated tumors. Stratified analysis confirmed significantly lower β-CTN/m-CK index values in poorly versus well-differentiated tumors (p=0.046), supporting the concept that dedifferentiation destabilizes adherens junctions and promotes invasion [31,32].
Discrepant nuclear staining reported previously may reflect artifacts related to antibody specificity, epitope recognition, or pre-analytical procedures [55]. Such signals should be interpreted cautiously, as they may not represent true nuclear translocation but rather nonspecific immunohistochemical artifacts. Consistent with this, we observed no nuclear translocation or strong nuclear accumulation of β-CTN, features typically regarded as Wnt/β-CTN pathway activation. Given the rarity of CTNNB1 mutations in clinical PDAC specimens, apparent redistribution is more likely methodological than mutation-driven [31,56]. By contrast, CTNNB1 mutations underlie β-CTN nuclear translocation in colorectal and endometrial carcinomas [31] and are almost universal in pancreatic solid-pseudopapillary neoplasms, conferring prominent nuclear accumulation [56].
To minimize inter-slide variability and confine quantification to epithelium, we normalized β-CTN to cytokeratin on serially aligned sections and derived a β-CTN/m-CK index. CK co-staining provided an internal reference that buffered pre-analytical and intensity fluctuations while preserving membrane-resolved readouts, consistent with CK-guided β-CTN assessment in prior work [57]. Using this approach, we conducted, to our knowledge, the first systematic comparison of this index between PDACs managed with NAC and those treated with UFS, where data remain scarce. Within the NAC subgroup, the index showed a marginal trend toward higher values (≥0.5) in younger (<75 years) patients but did not vary with histological response. Values were significantly lower in poorly differentiated than in well-differentiated tumors, although the limited sample size precludes firm conclusions.
Our multivariate analysis showed that a low β-CTN/m-CK index (<0.5) was significantly associated with shorter RFS across the entire cohort (HR 2.028; p=0.020) and in the NAC (HR 2.516; p=0.043) and UFS subgroups (HR 2.230; p=0.025). Prior studies have reported divergent links between β-CTN localization and survival in PDAC. In resected PDAC, high overall β-CTN expression has been associated with favorable prognosis [35]. Using different evaluation frameworks such as loss of membranous expression with cytoplasmic/nuclear accumulation has been associated with adverse outcomes [33,37], while no significant prognostic association was found in another study [36]. In the neoadjuvant setting, strong cytoplasmic staining correlated with improved survival among good responders, an effect absent in UFS cohorts [34]. In our NAC cohort, a low β-CTN/m-CK index predicted shorter RFS but showed no correlation with Evans’ histological response grade. The data highlight the context-dependent nature of prognostic significance of β-CTN in PDAC, influenced by treatment setting and subcellular distribution, and suggest that its evaluation may enrich understanding of tumor biology beyond morphological response.
TB is recognized as a robust marker of tumor aggressiveness across solid cancers, including PDAC, as demonstrated by meta-analyses [40] and standardized through international consensus recommendations [41]. In line with its association with aggressive characteristics, high TB has been consistently associated with adverse histopathological features, including poorer differentiation, higher grade, perineural and lymphovascular invasions, and peripancreatic infiltration [43,46,47]. In our cohort, high TB was significantly correlated with peripancreatic fat invasion (p=0.014), with similar trends for perineural invasion (p=0.082) and moderate/poor differentiation (p=0.084). High TB in UFS patients was additionally linked to older age (p=0.004) and peripancreatic fat invasion (p=0.009). In a large prospective trial cohort, TB independently predicted survival [48], whereas in our multivariate analysis its prognostic effect was only marginal and restricted to the NAC subgroup (HR 6.008; p=0.073).
Within this subgroup, TB was lower in Evans IIa/IIb than in Evans I tumors and correlated weakly and positively with TSR (rho = 0.341, p=0.045). These findings suggest that NAC may attenuate TB activity, with dedifferentiation restrained as a consequence of therapeutic efficacy, while the relationship between TB and stromal content under NAC appears paradoxical and complex. The dual action of NAC on tumor cells and stroma induces fibrosis and alters epithelial–mesenchymal plasticity [12,20,58]. As TB reflects epithelial–mesenchymal transition [42] and stromal–epithelial crosstalk [43], its reduction likely represents treatment-driven remodeling of invasion, highlighting the potential of TSR, the β-CTN/m-CK index and TB to complement Evans’ grade in capturing residual tumor biology.
Conventional clinicopathological variables also proved to be important prognostic determinants in our cohort. In the NAC subgroup, multivariable analysis identified positive margin (HR 63.446; p=0.009) and male sex (HR 18.054; p=0.019) as independent adverse factors for CSS, consistent with prior evidence that margin positivity [5,6] and male sex [24] remain prognostically detrimental even after NAC. In the UFS subgroup, moderate/poor differentiation (CSS: HR 7.632; p<0.001; RFS: HR 5.006; p<0.001) was a significant predictor, consistent with previous multivariate evidence [19]. Peripancreatic fat invasion (CSS: HR 4.933; p=0.037) also emerged as an adverse factor, in line with guideline-based evidence [4]. In addition, absence of adjuvant chemotherapy (CSS: HR 5.539; p=0.002; RFS: HR 2.013; p=0.057) was associated with poor outcomes, confirmed by randomized trial and registry data [8]. The survival benefit of adjuvant chemotherapy was confined to the UFS subgroup, reflecting that these patients receive their initial systemic therapy when tumors are presumed to be drug-sensitive. By contrast, patients resected after NAC are already selected by response, obscuring the benefit of adjuvant therapy. A similar pattern has been observed in conversion surgery after NAC [49].
This study has several limitations. First, it was conducted in a single institution with a relatively small sample size and retrospective design, which may limit generalizability. Second, the analyses were based exclusively on resected specimens; thus, the applicability of TB and β-CTN assessment to small preoperative biopsy samples remains uncertain. Finally, although the follow-up period was adequate considering the poor prognosis of PDAC, longer-term validation in larger multicenter cohorts will be necessary.
5. Conclusions
The β-CTN/m-CK index consistently served as an independent prognostic factor across NAC-treated and UFS PDAC. TSR was associated with histological response to NAC, and TB was also evidently reduced following NAC. TSR additionally predicted cancer-specific survival in the overall cohort. Few studies have examined biomarkers capturing both prognostic relevance and therapeutic response in NAC-treated PDAC, underscoring the novelty of our findings and suggesting that integrated biomarker assessment may improve risk stratification and guide personalized treatment strategies. In UFS, adjuvant chemotherapy improved survival, and these pathological indices may help identify patients most likely to benefit from it, with deep learning–based WSI analysis offering further refinement.
Supplementary Materials
The following supporting information can be downloaded at: Preprints.org, Figure S1: Correlation among β-CTN/m-CK index, TSR, and TB in PDAC, Figure S2: CONSORT-style flow diagram of case selection, Figure S3: Illustration of β-CTN/m-CK analysis for a non-neoplastic pancreatic intralobular duct in the same case shown in Figure 4, Figure S4: β-CTN/m-CK analysis in a representative high-index (≥ 0.5) case, Figure S5. Representative case of PDAC with TB, Table S1: Baseline patient characteristics, Table S2: Clinicopathological characteristics and their association with TSR between NAC and UFS groups in patients with PDAC, Table S3: Clinicopathological characteristics and their association with β-CTN / m-CK index between NAC and UFS groups in patients with PDAC, Table S4: Clinicopathological characteristics and their association with TB between NAC and UFS groups in patients with PDAC, Table S5: Univariate analysis of clinicopathological features associated with survival outcomes in PDAC, Table S6: Univariate analysis of clinicopathological features associated with survival outcomes in NAC-treated PDAC, Table S7: Univariate analysis of clinicopathological features associated with survival outcomes in UFS-treated PDAC.
Author Contributions
Shu Oikawa is the guarantor of the integrity of the entire study; Shu Oikawa, So Murai and Hiroyuki Mitomi contributed to the study concepts, study design, and literature research; Shu Oikawa, Seiya Chiba, Akihiro Nakayama, Shigetoshi Nishihara, and Yu Ishii contributed to resources and curation of clinical data; Hiroyuki Mitomi, So Murai, and Shu Oikawa reviewed histopathological specimens; Shu Oikawa and Hiroyuki Mitomi contributed to investigations of immunohistochemistry, image analysis, and statistics; Shu Oikawa and Hiroyuki Mitomi contributed to review and editing original draft; Toshiko Yamochi and Hitoshi Yoshida contributed to supervision of the study, and critical revision of the manuscript.
Funding
This research received no external funding.
Institutional Review Board Statement
The study was conducted in accordance with the Declaration of Helsinki, and approved by the Institutional Review Board and Ethics Committee of Showa Medical University (reference number: 2024-233-B).
Informed Consent Statement
The need for informed consent was waived by the Institutional Review Board and ethical committee of Showa Medical University School of Medicine.
Data Availability Statement
The data that support the findings of this study are not publicly available because they contain information that could compromise the privacy of research participants but are available from the corresponding author S.O. upon reasonable request.
Acknowledgments
We are grateful to Yosuke Sasaki, Department of Diagnostic Pathology, Showa Medical University, for technical assistance with the histopathological examination.
Conflicts of Interest
The authors declare no conflicts of interest.
Abbreviations
The following abbreviations are used in this manuscript (in alphabetical order):
| β-CTN | β-catenin |
| CI | confidence interval |
| CSS | cancer-specific survival |
| IHC | Immunohistochemistry |
| m-CK | multi-cytokeratin |
| NAC | neoadjuvant chemotherapy |
| PC | pancreatic cancer |
| PDAC | pancreatic ductal adenocarcinoma |
| RFS | relapse-free survival |
| TB | tumor budding |
| TSR | tumor–stroma ratio |
| UFS | upfront surgery |
| WSI | whole-slide image |
References
- Zhao, Z.; Liu, W. Pancreatic cancer: A review of risk factors, diagnosis, and treatment. Technol. Cancer Res. Treat. 2020, 19, 1533033820962117.
- Zottl, J.; Sebesta, C.G.; Tomosel, E.; Sebesta, M.C.; Sebesta, C. Unraveling the burden of pancreatic cancer in the 21st century: Trends in incidence, mortality, survival, and key contributing factors. Cancers (Basel) 2025, 17, 1607. [CrossRef]
- Klein, A.P. Pancreatic cancer epidemiology: Understanding the role of lifestyle and inherited risk factors. Nat. Rev. Gastroenterol. Hepatol. 2021, 18, 493–502. [CrossRef]
- Ei, S.; Takahashi, S.; Ogasawara, T.; Mashiko, T.; Masuoka, Y.; Nakagohri, T. Neoadjuvant and adjuvant treatments for resectable and borderline resectable pancreatic ductal adenocarcinoma: The current status of pancreatic ductal adenocarcinoma treatment in Japan. Gut Liver 2023, 17, 698–710. [CrossRef]
- Ye, M.; Zhang, Q.; Chen, Y.; Fu, Q.; Li, X.; Bai, X.; Liang, T. Neoadjuvant chemotherapy for primary resectable pancreatic cancer: A systematic review and meta-analysis. HPB (Oxford) 2020, 22, 821–832. [CrossRef]
- Sugawara, T.; Rodriguez Franco, S.; Sherman, S.; Torphy, R.J.; Colborn, K.; Franklin, O.; Ishida, J.; Grandi, S.; Al-Musawi, M.H.; Gleisner, A.; et al. Neoadjuvant chemotherapy versus upfront surgery for resectable pancreatic adenocarcinoma: An updated nationwide study. Ann. Surg. 2024, 279, 331–339.
- Sudo, K.; Nakamura, K.; Yamaguchi, T. S-1 in the treatment of pancreatic cancer. World J. Gastroenterol. 2014, 20, 15110–15118.
- Unno, M.; Motoi, F.; Matsuyama, Y.; Satoi, S.; Toyama, H.; Matsumoto, I.; Aosasa, S.; Shirakawa, H.; Wada, K.; Fujii, T.; et al. Neoadjuvant chemotherapy with gemcitabine and S-1 versus upfront surgery for resectable pancreatic cancer: Results of the randomized phase II/III Prep-02/JSAP05 trial. Ann. Surg. 2025. Online ahead of print.
- Okusaka, T.; Nakamura, M.; Yoshida, M.; Kitano, M.; Ito, Y.; Mizuno, N.; et al. Clinical practice guidelines for pancreatic cancer 2022 from the Japan Pancreas Society: A synopsis. Int. J. Clin. Oncol. 2023, 28, 493–511. [CrossRef]
- Winther, S.B.; Bjerregaard, J.K.; Schonnemann, K.R.; Ejlsmark, M.W.; Krogh, M.; Jensen, H.A.; Pfeiffer, P. S-1 (Teysuno) and gemcitabine in Caucasian patients with unresectable pancreatic adenocarcinoma. Cancer Chemother. Pharmacol. 2018, 81, 573–578. [CrossRef]
- McDonald, O.G. The biology of pancreatic cancer morphology. Pathology 2022, 54, 236–247. [CrossRef]
- biophysics in pancreatic ductal adenocarcinoma: Can we learn from breast cancer? Pancreas 2020, 49, 313–325.
- Pyo, J.S.; Kim, N.Y.; Min, K.W.; Kang, D.W. Significance of tumor–stroma ratio (TSR) in predicting outcomes of malignant tumors. Medicina (Kaunas) 2023, 59, 1258. [CrossRef]
- Chen, X.; Sun, S.; Zhao, J.; Yu, S.; Chen, J.; Chen, X. Tumor–stroma ratio combined with PD-L1 identifies pancreatic ductal adenocarcinoma patients at risk for lymph node metastases. Br. J. Cancer 2025, 132, 1131–1140. [CrossRef]
- Liao, H.; Yuan, J.; Liu, C.; Zhang, J.; Yang, Y.; Liang, H.; Jiang, S.; Chen, S.; Li, Y.; Liu, Y.; et al. Feasibility and effectiveness of automatic deep learning network and radiomics models for differentiating tumor–stroma ratio in pancreatic ductal adenocarcinoma. Insights Imaging 2023, 14, 223. [CrossRef]
- Lu, M.; Zou, Y.; Fu, P.; Li, Y.; Wang, P.; Li, G.; Luo, S.; Chen, Y.; Guan, G.; Zhang, S.; et al. The tumor–stroma ratio and the immune microenvironment improve the prognostic prediction of pancreatic ductal adenocarcinoma. Discov. Oncol. 2023, 14, 124. [CrossRef]
- Meng, Y.; Zhang, H.; Li, Q.; Liu, F.; Fang, X.; Li, J.; Yu, J.; Feng, X.; Lu, J.; Bian, Y.; et al. Magnetic resonance radiomics and machine-learning models: An approach for evaluating tumor–stroma ratio in patients with pancreatic ductal adenocarcinoma. Acad. Radiol. 2022, 29, 523–535. [CrossRef]
- Kawahara, K.; Takano, S.; Furukawa, K.; Takayashiki, T.; Kuboki, S.; Ohtsuka, M. The effect of the low stromal ratio induced by neoadjuvant chemotherapy on recurrence patterns in borderline resectable pancreatic ductal adenocarcinoma. Clin. Exp. Metastasis 2022, 39, 311–322. [CrossRef]
- Li, B.; Wang, Y.; Jiang, H.; Li, B.; Shi, X.; Gao, S.; Ni, C.; Zhang, Z.; Guo, S.; Xu, J.; et al. Pros and cons: High proportion of stromal component indicates better prognosis in patients with pancreatic ductal adenocarcinoma—A research based on the evaluation of whole-mount histological slides. Front. Oncol. 2020, 10, 1472. [CrossRef]
- Leppänen, J.; Lindholm, V.; Isohookana, J.; Haapasaari, K.M.; Karihtala, P.; Lehenkari, P.P.; Saarnio, J.; Kauppila, J.H.; Karttunen, T.J.; Helminen, O.; et al. Tenascin C, fibronectin, and tumor–stroma ratio in pancreatic ductal adenocarcinoma. Pancreas 2019, 48, 43–48. [CrossRef]
- Matsuda, Y.; Inoue, Y.; Hiratsuka, M.; Kawakatsu, S.; Arai, T.; Matsueda, K.; Saiura, A.; Takazawa, Y. Encapsulating fibrosis following neoadjuvant chemotherapy is correlated with outcomes in patients with pancreatic cancer. PLoS One 2019, 14, e0222155. [CrossRef]
- Koay, E.J.; Lee, Y.; Cristini, V.; Lowengrub, J.S.; Kang, Y.; Lucas, F.A.S.; Hobbs, B.P.; Ye, R.; Elganainy, D.; Almahariq, M.; et al. Visually apparent quantifiable CT imaging and feature identifies biophysical subtypes of pancreatic ductal adenocarcinoma. Clin. Cancer Res. 2018, 24, 5883–5894. [CrossRef]
- Vendittelli, P.; Bokhorst, J.M.; Smeets, E.M.M.; Kryklyva, V.; Brosens, L.A.A.; Verbeke, C.; Litjens, G. Automatic quantification of tumor–stroma ratio as a prognostic marker for pancreatic cancer. PLoS One 2024, 19, e0301969. [CrossRef]
- Shi, S.; Liang, C.; Xu, J.; Meng, Q.; Hua, J.; Yang, X.; et al. The strain ratio as obtained by endoscopic ultrasonography elastography correlates with the stroma proportion and the prognosis of local pancreatic cancer. Ann. Surg. 2020, 271, 559–565. [CrossRef]
- Bever, K.M.; Sugar, E.A.; Bigelow, E.; Sharma, R.; Laheru, D.; Wolfgang, C.L.; Jaffee, E.M.; Anders, R.A.; De Jesus-Acosta, A.; Zheng, L.; et al. The prognostic value of stroma in pancreatic cancer in patients receiving adjuvant therapy. HPB (Oxford) 2015, 17, 292–298. [CrossRef]
- Liang, C.; Shi, S.; Meng, Q.; Liang, D.; Ji, S.; Zhang, B.; Qin, Y.; Xu, J.; Ni, Q.; Yu, X.; et al. Complex roles of the stroma in the intrinsic resistance to gemcitabine in pancreatic cancer: Where we are and where we are going. Exp. Mol. Med. 2017, 49, e406. [CrossRef]
- Koay, E.J.; Truty, M.J.; Cristini, V.; Thomas, R.M.; Chen, R.; Chatterjee, D.; Kang, Y.; Bhosale, P.R.; Tamm, E.P.; Crane, C.H.; et al. Transport properties of pancreatic cancer describe gemcitabine delivery and response. J. Clin. Invest. 2014, 124, 1525–1536. [CrossRef]
- Olive, K.P.; Jacobetz, M.A.; Davidson, C.J.; et al. Inhibition of Hedgehog signaling enhances delivery of chemotherapy in a mouse model of pancreatic cancer. Science 2009, 324, 1457–1461. [CrossRef]
- Suenaga, M.; Yamada, S.; Fujii, T.; Tanaka, C.; Kanda, M.; Nakayama, G.; Sugimoto, H.; Koike, M.; Fujiwara, M.; Kodera, Y. S-1 plus nab-paclitaxel is a promising regimen for pancreatic cancer in a preclinical model. J. Surg. Oncol. 2016, 113, 413–419. [CrossRef]
- Morimoto, Y.; Takada, K.; Nakano, A.; Takeuchi, O.; Watanabe, K.; Hirohara, M.; Masuda, Y. Combination of S-1 and the oral ATR inhibitor ceralasertib is effective against pancreatic cancer cells. Cancer Chemother. Pharmacol. 2024, 94, 763–774. [CrossRef]
- Lin, W.H.; Cooper, L.M.; Anastasiadis, P.Z. Cadherins and catenins in cancer: Connecting cancer pathways and tumor microenvironment. Front. Cell Dev. Biol. 2023, 11, 1137013. [CrossRef]
- Borcherding, N.; Cole, K.; Kluz, P.; Jorgensen, M.; Kolb, R.; Bellizzi, A.; Zhang, W. Re-evaluating E-cadherin and β-catenin: A pan-cancer proteomic approach with an emphasis on breast cancer. Am. J. Pathol. 2018, 188, 1910–1920.
- Rosova, B.; Proks, J.; Filipova, A.; Hadzi Nikolov, D.; Chloupkova, R.; Richter, I.; Szabo, A.; Rozsypalova, A.; Matej, R.; Melichar, B.; et al. Favorable prognostic significance of membranous β-catenin expression and negative prognostic significance of cytoplasmic β-catenin expression in pancreatic cancer. Neoplasma 2023, 70, 796–803. [CrossRef]
- Eurola, A.; Ristimäki, A.; Mustonen, H.; Nurmi, A.M.; Hagström, J.; Kallio, P.; Alitalo, K.; Haglund, C.; Seppänen, H. β-catenin plus PROX1 immunostaining stratifies disease progression and patient survival in neoadjuvant-treated pancreatic cancer. Tumour Biol. 2022, 44, 69–84. [CrossRef]
- Saukkonen, K.; Hagström, J.; Mustonen, H.; Juuti, A.; Nordling, S.; Kallio, P.; Alitalo, K.; Seppänen, H.; Haglund, C. PROX1 and β-catenin are prognostic markers in pancreatic ductal adenocarcinoma. BMC Cancer 2016, 16, 472. [CrossRef]
- Wang, Z.; Ma, Q.; Li, P.; Sha, H.; Li, X.; Xu, J. Aberrant expression of CXCR4 and β-catenin in pancreatic cancer. Anticancer Res. 2013, 33, 4103–4110.
- Zhong, R.L.; Li, Y.; Fang, Z.; Fang, K.F.; Wang, L. PKR2 and β-catenin genes regulates pancreatic cancer chemosensitivity. Eur. Rev. Med. Pharmacol. Sci. 2017, 21, 48–54.
- Eurola, A.; Ristimäki, A.; Mustonen, H.; Nurmi, A.M.; Hagström, J.; Haglund, C.; Seppänen, H. Impact of histological response after neoadjuvant therapy on podocalyxin as a prognostic marker in pancreatic cancer. Sci. Rep. 2021, 11, 9896. [CrossRef]
- Kokumai, T.; Omori, Y.; Ishida, M.; Ohtsuka, H.; Mizuma, M.; Nakagawa, K.; Maeda, C.; Ono, Y.; Mizukami, Y.; Miura, S.; et al. GATA6 and CK5 stratify the survival of patients with pancreatic cancer undergoing neoadjuvant chemotherapy. Mod. Pathol. 2023, 36, 100102. [CrossRef]
- Lugli, A.; Zlobec, I.; Berger, M.D.; Kirsch, R.; Nagtegaal, I.D. Tumour budding in solid cancers. Nat. Rev. Clin. Oncol. 2021, 18, 101–115. [CrossRef]
- Lugli, A.; Kirsch, R.; Ajioka, Y.; Bosman, F.; Cathomas, G.; Dawson, H.; et al. Recommendations for reporting tumor budding in colorectal cancer based on the International Tumor Budding Consensus Conference (ITBCC) 2016. Mod. Pathol. 2017, 30, 1299–1311. [CrossRef]
- Kohler, I.; Bronsert, P.; Timme, S.; Werner, M.; Brabletz, T.; Hopt, U.T.; et al. Detailed analysis of epithelial–mesenchymal transition and tumor budding identifies predictors of long-term survival in pancreatic ductal adenocarcinoma. J. Gastroenterol. Hepatol. 2015, 30 (Suppl. 1), 78–84. [CrossRef]
- Zhou, T.; Man, Q.; Li, X.; Xie, Y.; Hou, X.; Wang, H.; et al. Artificial intelligence-based comprehensive analysis of immune-stemness-tumor budding profile to predict survival of patients with pancreatic adenocarcinoma. Cancer Biol. Med. 2023, 20, 196–217. [CrossRef]
- Hayasaki, A.; Mizuno, S.; Usui, M.; Kaluba, B.; Komatsubara, H.; Sakamoto, T.; et al. Tumor budding is an independent adverse prognostic factor of pancreatic ductal adenocarcinoma patients treated by resection after preoperative chemoradiotherapy. Pancreas 2025, 54, e340–e348. [CrossRef]
- Ibuki, E.; Kadota, K.; Kimura, N.; Ishikawa, R.; Oshima, M.; Okano, K.; et al. Prognostic significance of tumor budding in patients with pancreatic invasive ductal carcinoma who received neoadjuvant therapy. Heliyon 2023, 10, e23928. [CrossRef]
- Argon, A.; Öz, Ö.; Kebat, T.A. Evaluation and prognostic significance of tumor budding in pancreatic ductal adenocarcinomas. Indian J. Pathol. Microbiol. 2023, 66, 38–43. [CrossRef]
- Karamitopoulou, E.; Wartenberg, M.; Zlobec, I.; Cibin, S.; Worni, M.; Gloor, B.; et al. Tumour budding in pancreatic cancer revisited: Validation of the ITBCC scoring system. Histopathology 2018, 73, 137–146. [CrossRef]
- Lohneis, P.; Sinn, M.; Klein, F.; Bischoff, S.; Striefler, J.K.; Wislocka, L.; et al. Tumour buds determine prognosis in resected pancreatic ductal adenocarcinoma. Br. J. Cancer 2018, 118, 1485–1491. [CrossRef]
- Oba, A.; Del Chiaro, M.; Fujii, T.; Okano, K.; Stoop, T.F.; Wu, Y.H.A.; et al. “Conversion surgery” for locally advanced pancreatic cancer: A position paper by the study group at the joint meeting of the International Association of Pancreatology (IAP) & Japan Pancreas Society (JPS) 2022. Pancreatology 2023, 23, 712–720. [CrossRef]
- Isaji, S.; Mizuno, S.; Windsor, J.A.; Bassi, C.; Fernández-Del Castillo, C.; Hackert, T.; et al. International consensus on definition and criteria of borderline resectable pancreatic ductal adenocarcinoma 2017. Pancreatology 2018, 18, 2–11. [CrossRef]
- Evans, D.B.; Rich, T.A.; Byrd, D.R.; Cleary, K.R.; Connelly, J.H.; Levin, B.; Charnsangavej, C.; Fenoglio, C.J.; Ames, F.C. Preoperative chemoradiation and pancreaticoduodenectomy for adenocarcinoma of the pancreas. Arch. Surg. 1992, 127, 1335–1339. [CrossRef]
- Neumann, C.C.M.; von Hörschelmann, E.; Reutzel-Selke, A.; Seidel, E.; Sauer, I.M.; Pratschke, J.; Bahra, M.; Schmuck, R.B. Tumor–stromal cross-talk modulating the therapeutic response in pancreatic cancer. Hepatobiliary Pancreat. Dis. Int. 2018, 17, 461–472. [CrossRef]
- Gore, J.; Korc, M. Pancreatic cancer stroma: Friend or foe? Cancer Cell 2014, 25, 711–712. [CrossRef]
- Chen, Y.; Kim, J.; Yang, S.; Wang, H.; Wu, C.J.; Sugimoto, H.; LeBleu, V.S.; Kalluri, R. Type I collagen deletion in αSMA+ myofibroblasts augments immune suppression and accelerates progression of pancreatic cancer. Cancer Cell 2021, 39, 548–565.e6. [CrossRef]
- Kim, S.W.; Roh, J.; Park, C.S. Immunohistochemistry for pathologists: Protocols, pitfalls, and tips. J. Pathol. Transl. Med. 2016, 50, 411–418. [CrossRef]
- Kubota, Y.; Kawakami, H.; Natsuizaka, M.; Kawakubo, K.; Marukawa, K.; Kudo, T.; Abe, Y.; Kubo, K.; Kuwatani, M.; Hatanaka, Y.; et al. CTNNB1 mutational analysis of solid-pseudopapillary neoplasms of the pancreas using endoscopic ultrasound-guided fine-needle aspiration and next-generation deep sequencing. J. Gastroenterol. 2015, 50, 203–210. [CrossRef]
- Dolled-Filhart, M.; McCabe, A.; Giltnane, J.; Cregger, M.; Camp, R.L.; Rimm, D.L. Quantitative in situ analysis of β-catenin expression in breast cancer shows decreased expression is associated with poor outcome. Cancer Res. 2006, 66, 5487–5494. [CrossRef]
- Helms, E.; Onate, M.K.; Sherman, M.H. Fibroblast heterogeneity in the pancreatic tumor microenvironment. Cancer Discov. 2020, 10, 648–656. [CrossRef]
Figure 1.
Representative example of TSR analysis. Step 1: Tumor area scanned in hematoxylin and eosin staining. Step 2: Tumor area outlined by m-CK immunohistochemistry. Step 3: Surrounding non-tumorous areas eliminated. Step 4: Non-tumorous regions within the tumor mass delineated. Step 5: Zoomed view showing eliminated non-tumorous areas and m-CK–stained tumor regions. Step 6: Construction of gray-scale image. Step 7: Construction of binary image with a zoomed view of the boxed region. Black and white areas correspond to stroma (non-tumorous parenchyma) and tumor, respectively. Tumor and stroma areas were 30.6 mm² and 227.6 mm², respectively, yielding a TSR (= tumor / [tumor + stroma] × 100) of 12%. Scale bar = 5 mm. Abbreviations: TSR, tumor–stroma ratio; m-CK, multi-cytokeratin.
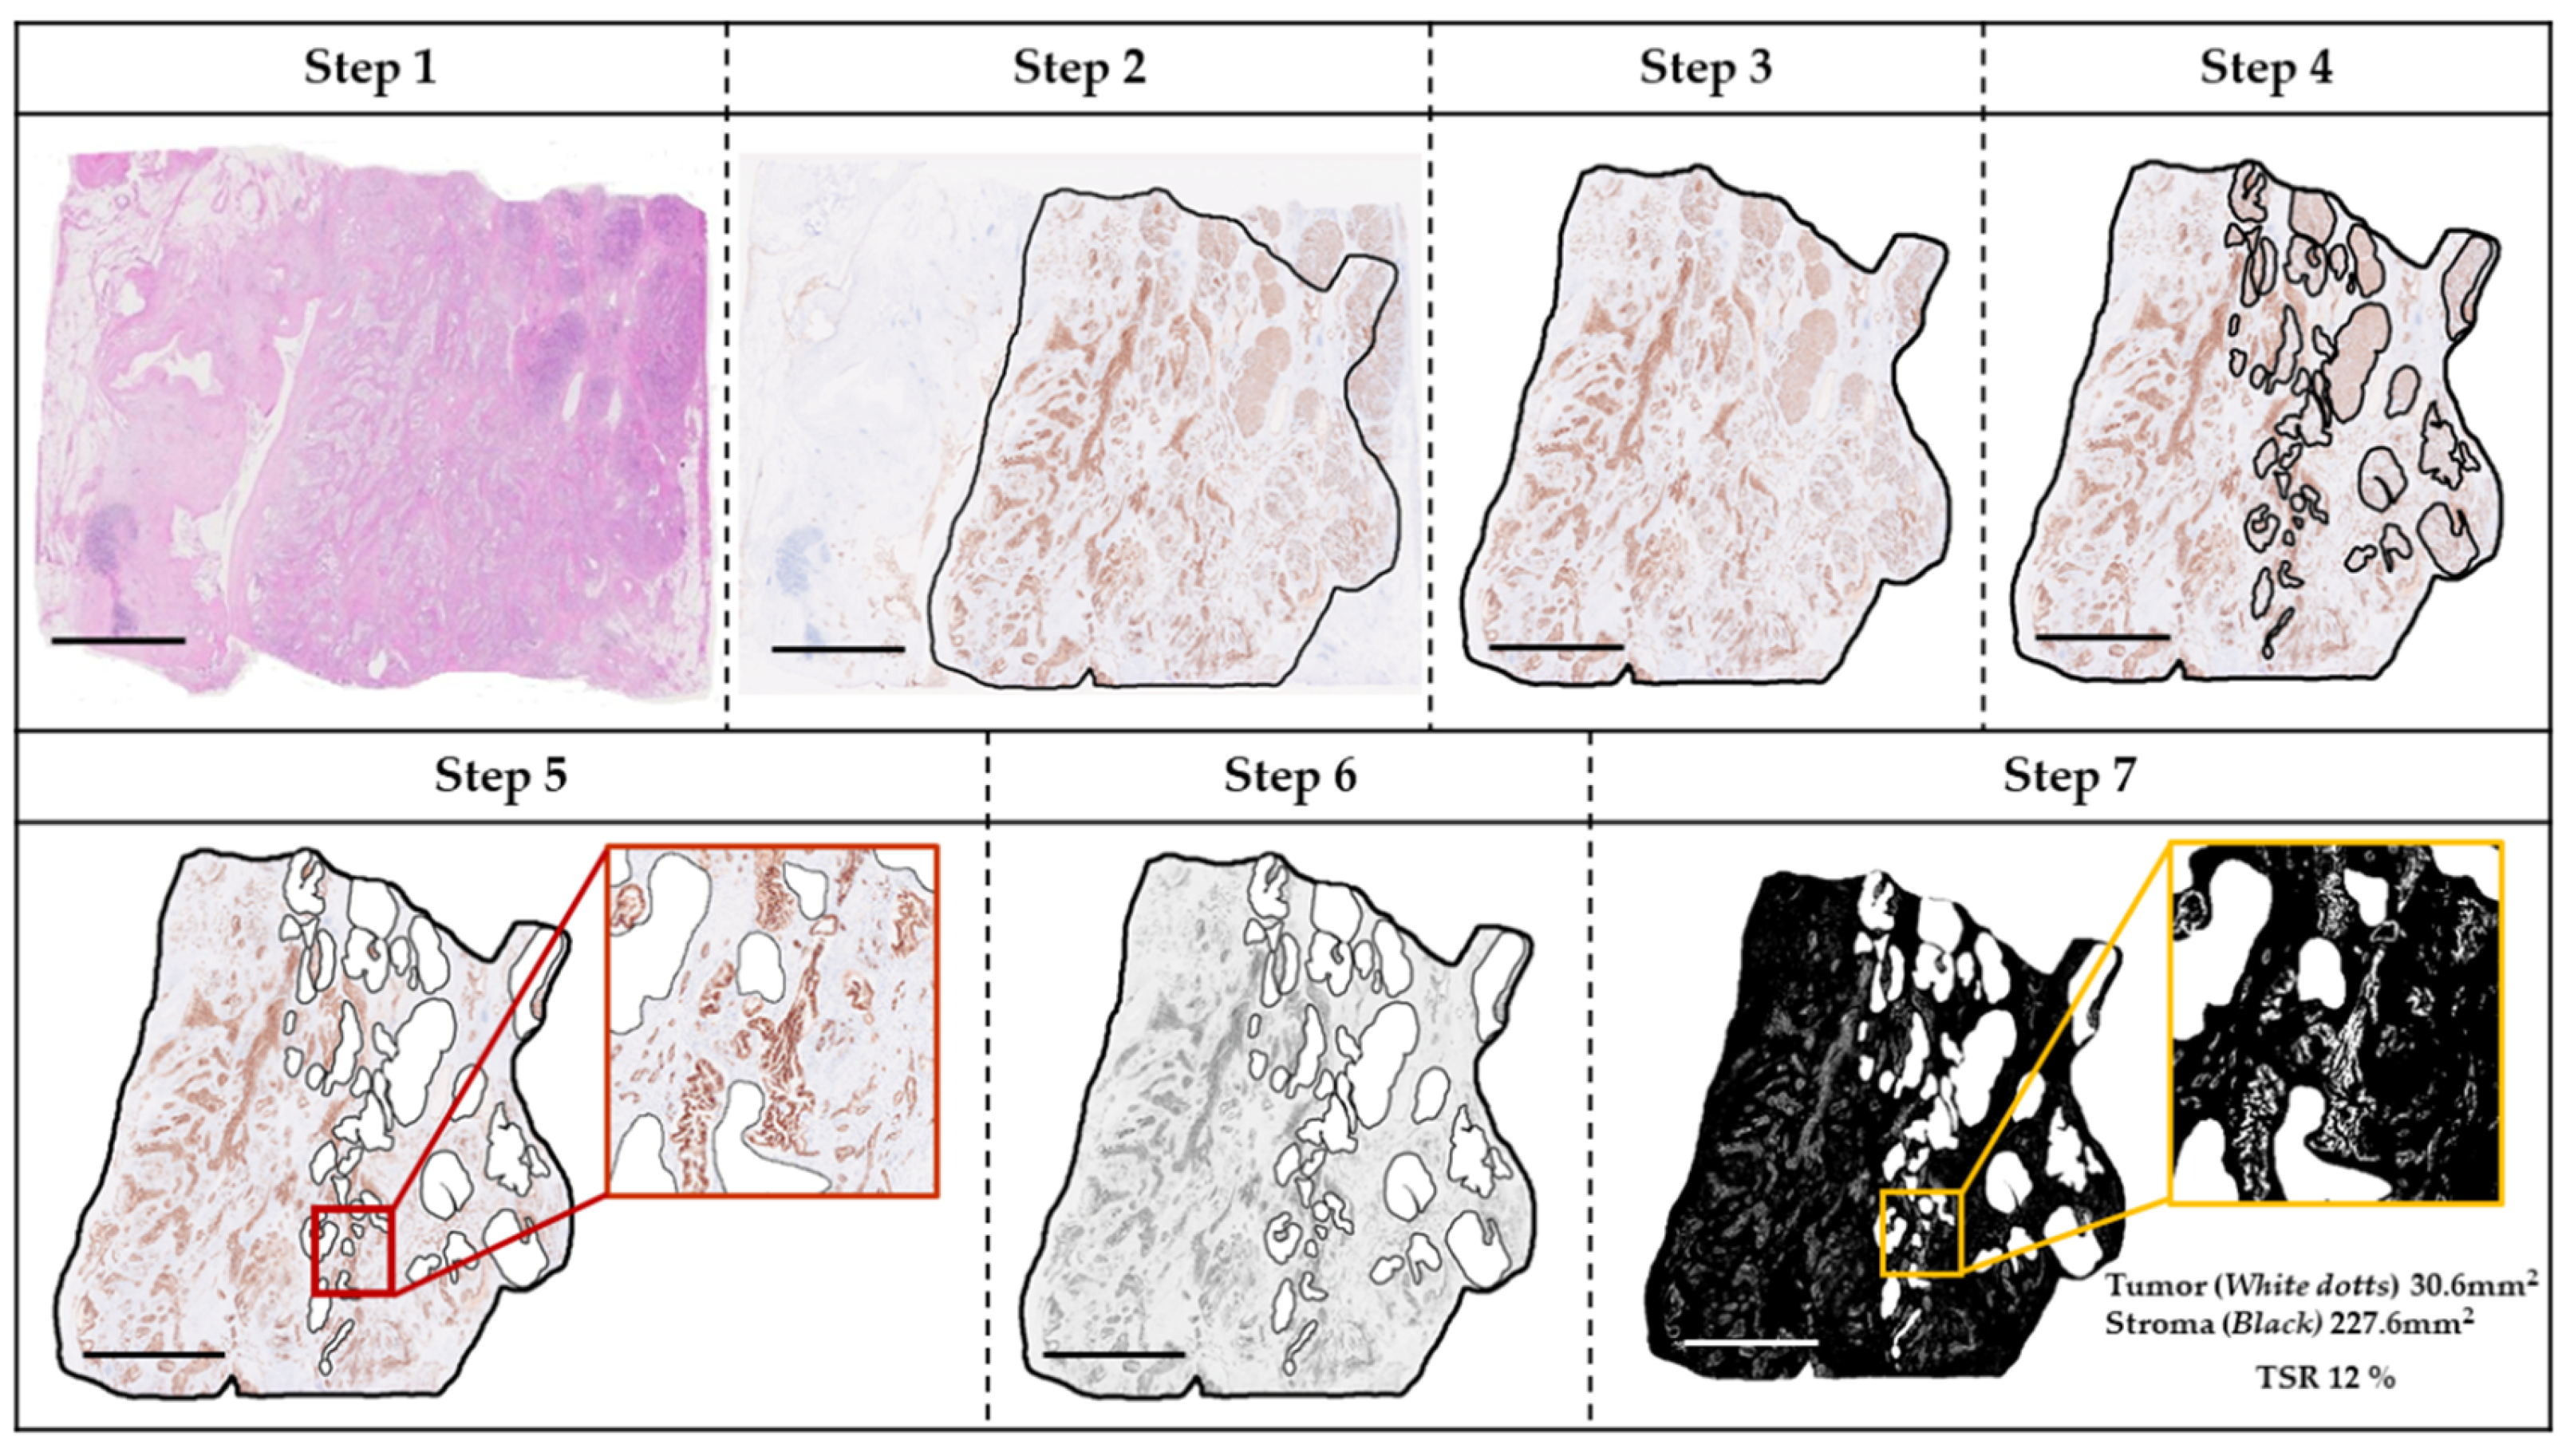
Figure 2.
Illustration of β-CTN/m-CK in a low-index (< 0.5) case. Step 1: Scanning of the tumor (scale bar = 5 mm). Step 2: Capture of representative image (scale bar = 200 µm) with higher magnification of the boxed region (scale bar = 50 µm). Step 3: Construction of gray-scale image (scale bar = 50 µm). Step 4: Construction of binary image (scale bar = 50 µm). White areas corresponding to tumor were measured as 0.001 mm² in β-CTN and 0.028 mm² in m-CK images, yielding a β-CTN/m-CK ratio of 0.04 for the tumor. The same stepwise analyses were applied to the non-neoplastic intralobular duct (shown in Supplementary Figure S2). The final β-CTN/m-CK index was 0.4. Abbreviations: β-CTN, β-catenin; m-CK, multi-cytokeratin.
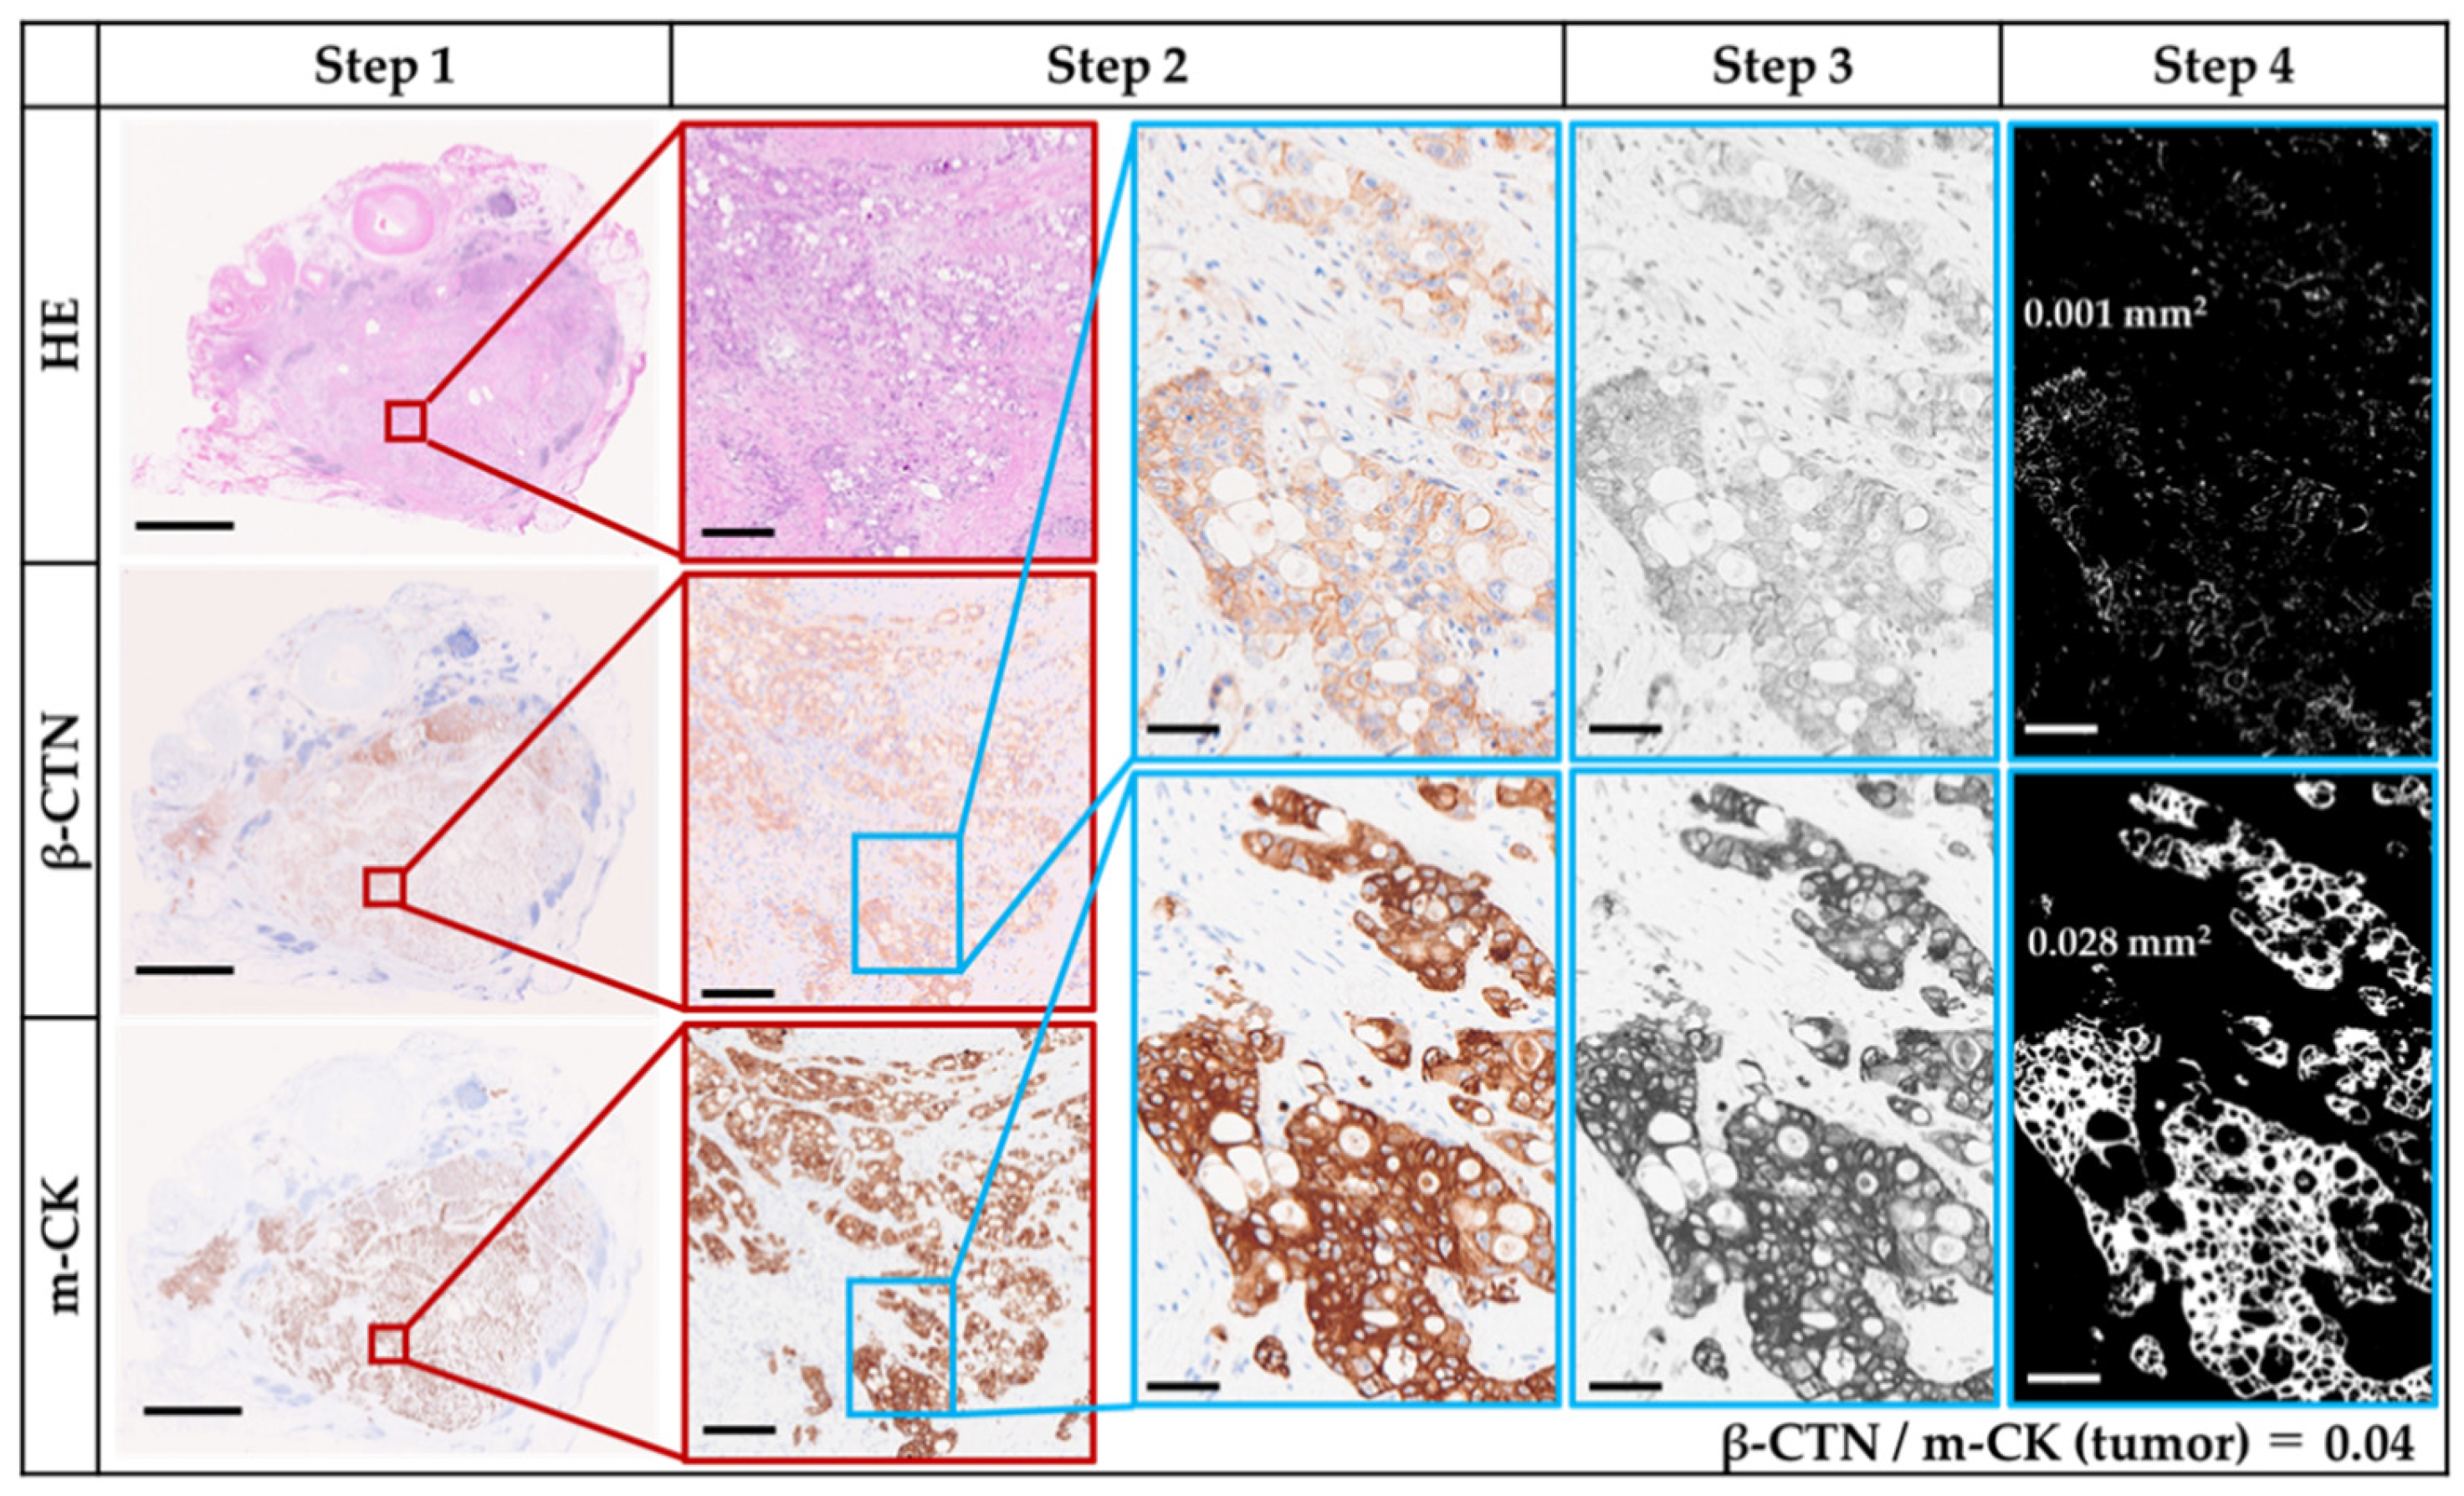
Figure 3.
Association of TSR, β-CTN/m-CK index, and TB with histological response after NAC in PDAC. Box plots compare Evans grade I (n=17; <10% tumor cell destruction) and Evans IIa (10–50%) / IIb (51–90%) grades (n=18), depicting the five-number summary: minimum, first (lower) quartile, median, third (upper) quartile, and maximum values. * p<0.05 was considered statistically significant. Abbreviations: TSR, tumor–stroma ratio; β-CTN, β-catenin; m-CK, multi-cytokeratin; TB, tumor budding; NAC, neoadjuvant chemotherapy; PDAC, pancreatic ductal adenocarcinoma.
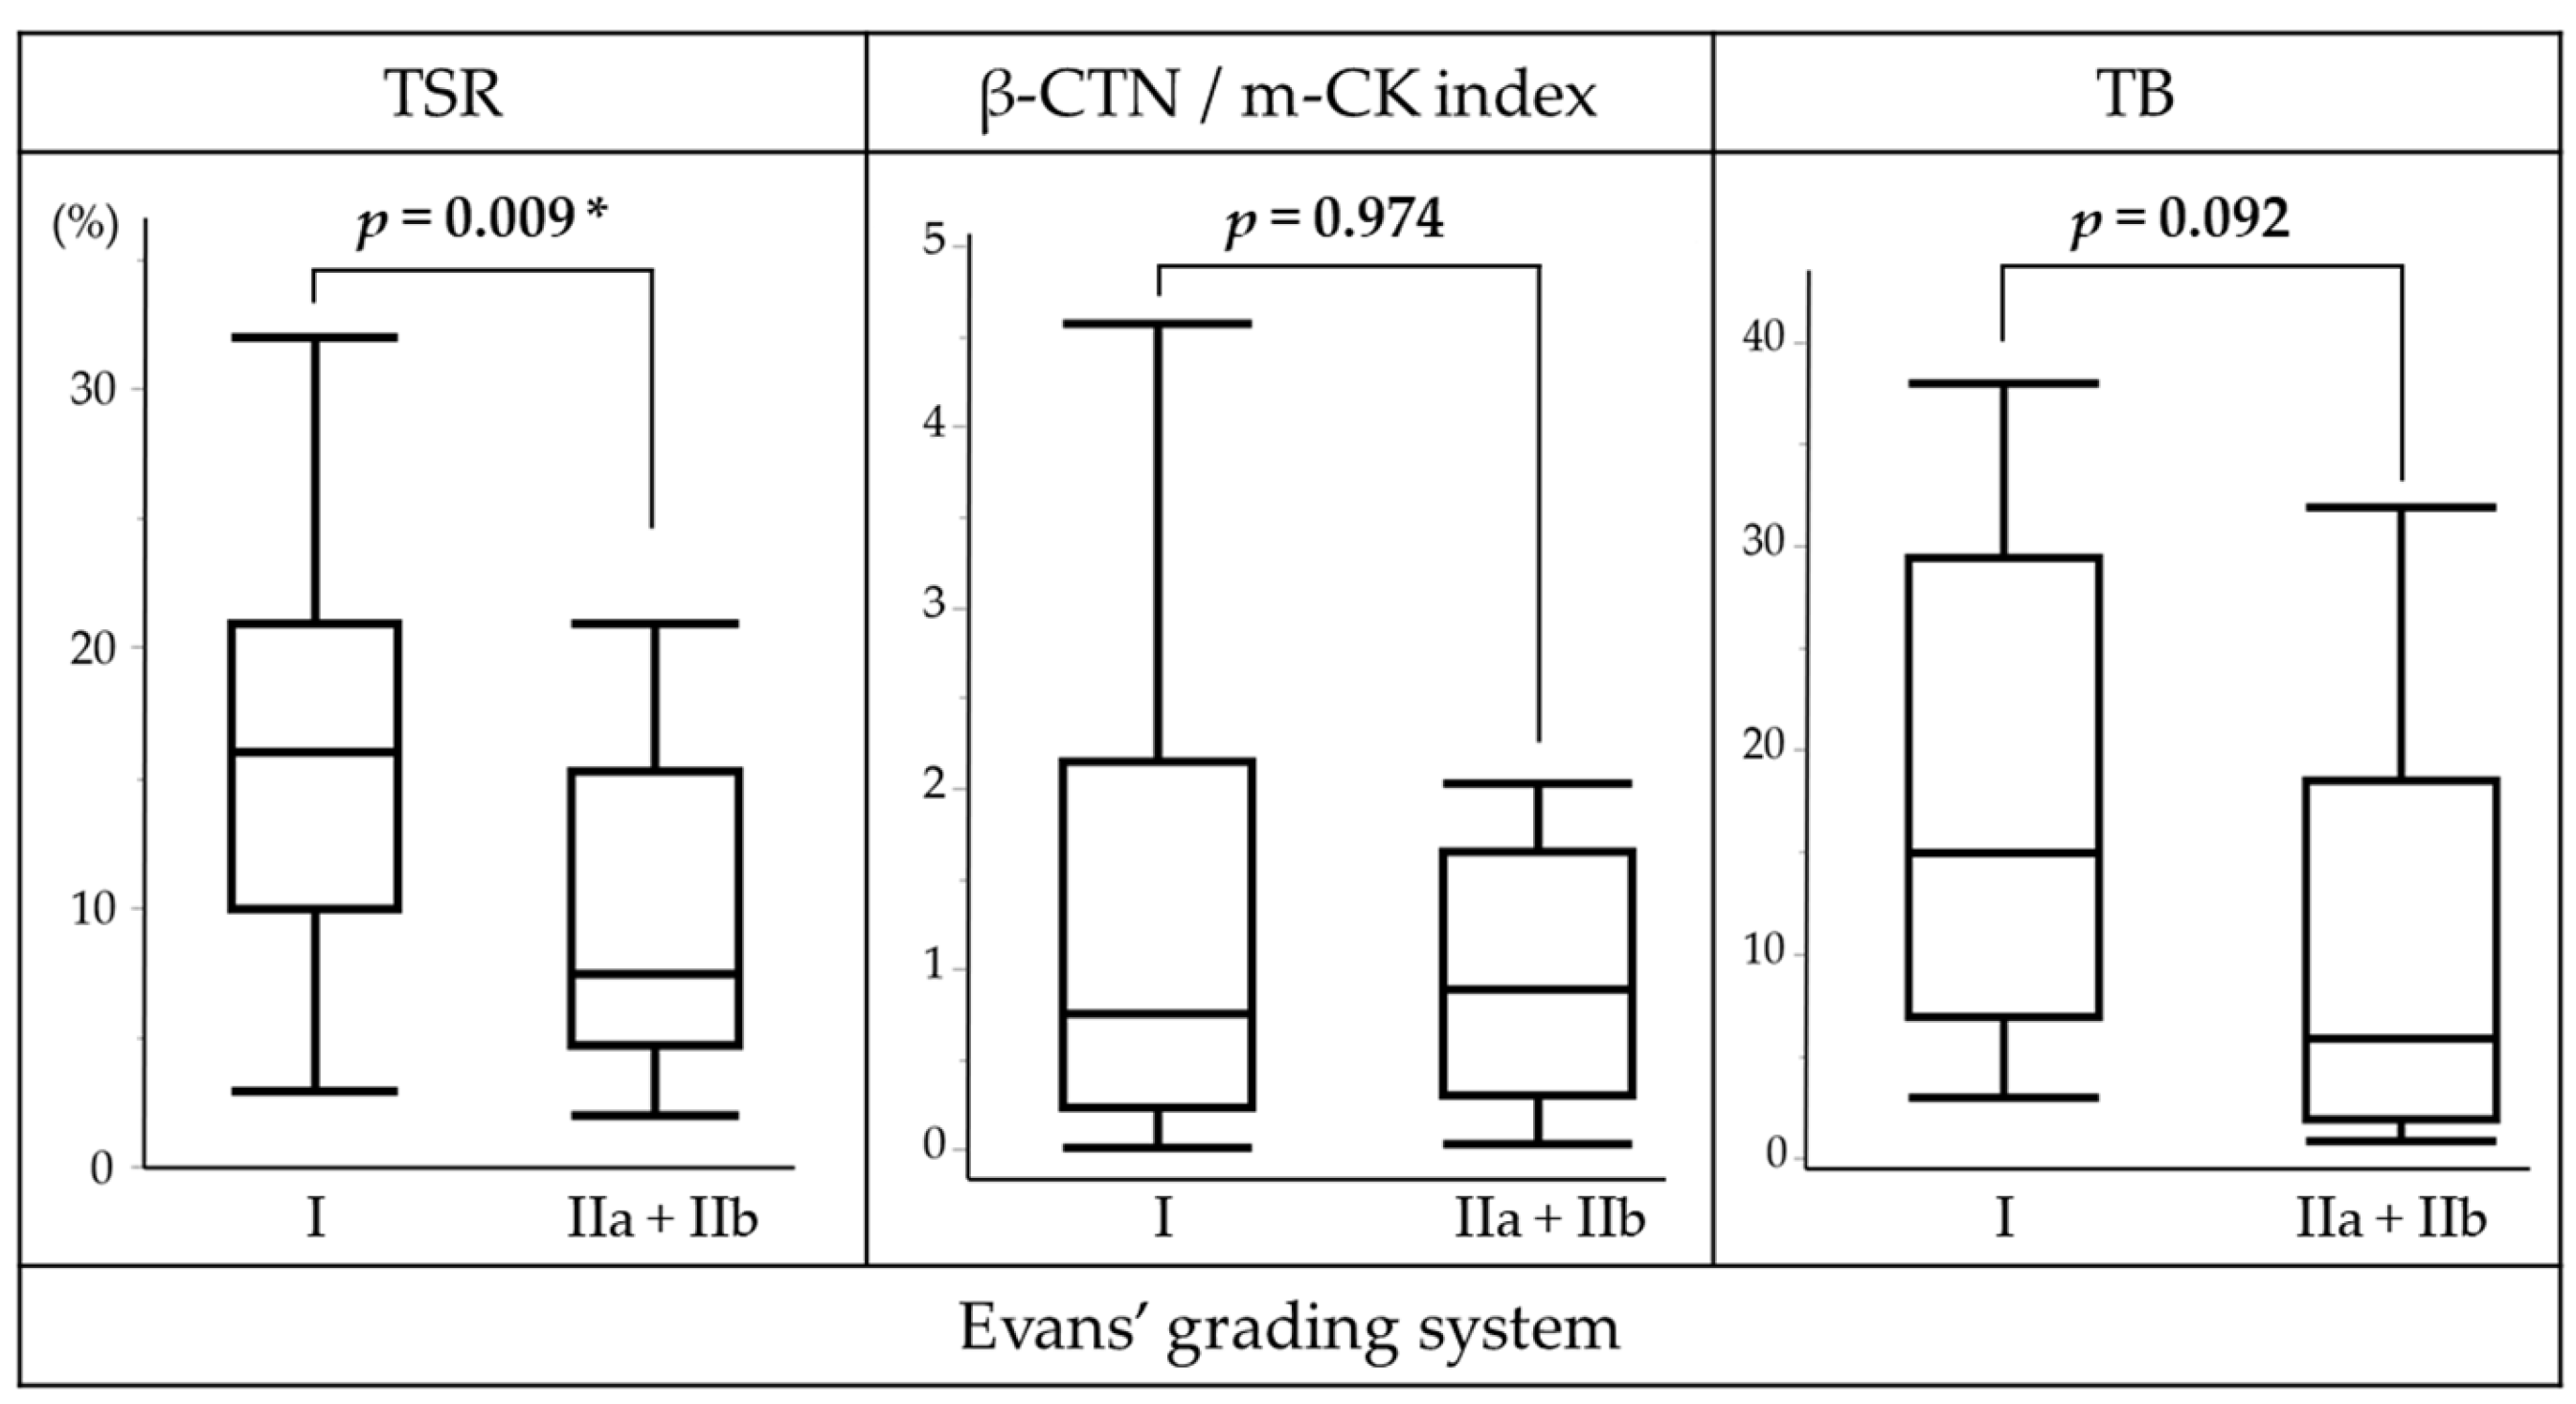
Figure 4.
Kaplan–Meier analysis of TSR and β-CTN/m-CK index in PDAC. * p<0.05 was considered statistically significant. Abbreviations: TSR, tumor–stroma ratio; β-CTN, β-catenin; m-CK, multi-cytokeratin; PDAC, pancreatic ductal adenocarcinoma; All, entire PDAC cohort; NAC, neoadjuvant chemotherapy–treated PDAC; UFS, upfront surgery–treated PDAC.
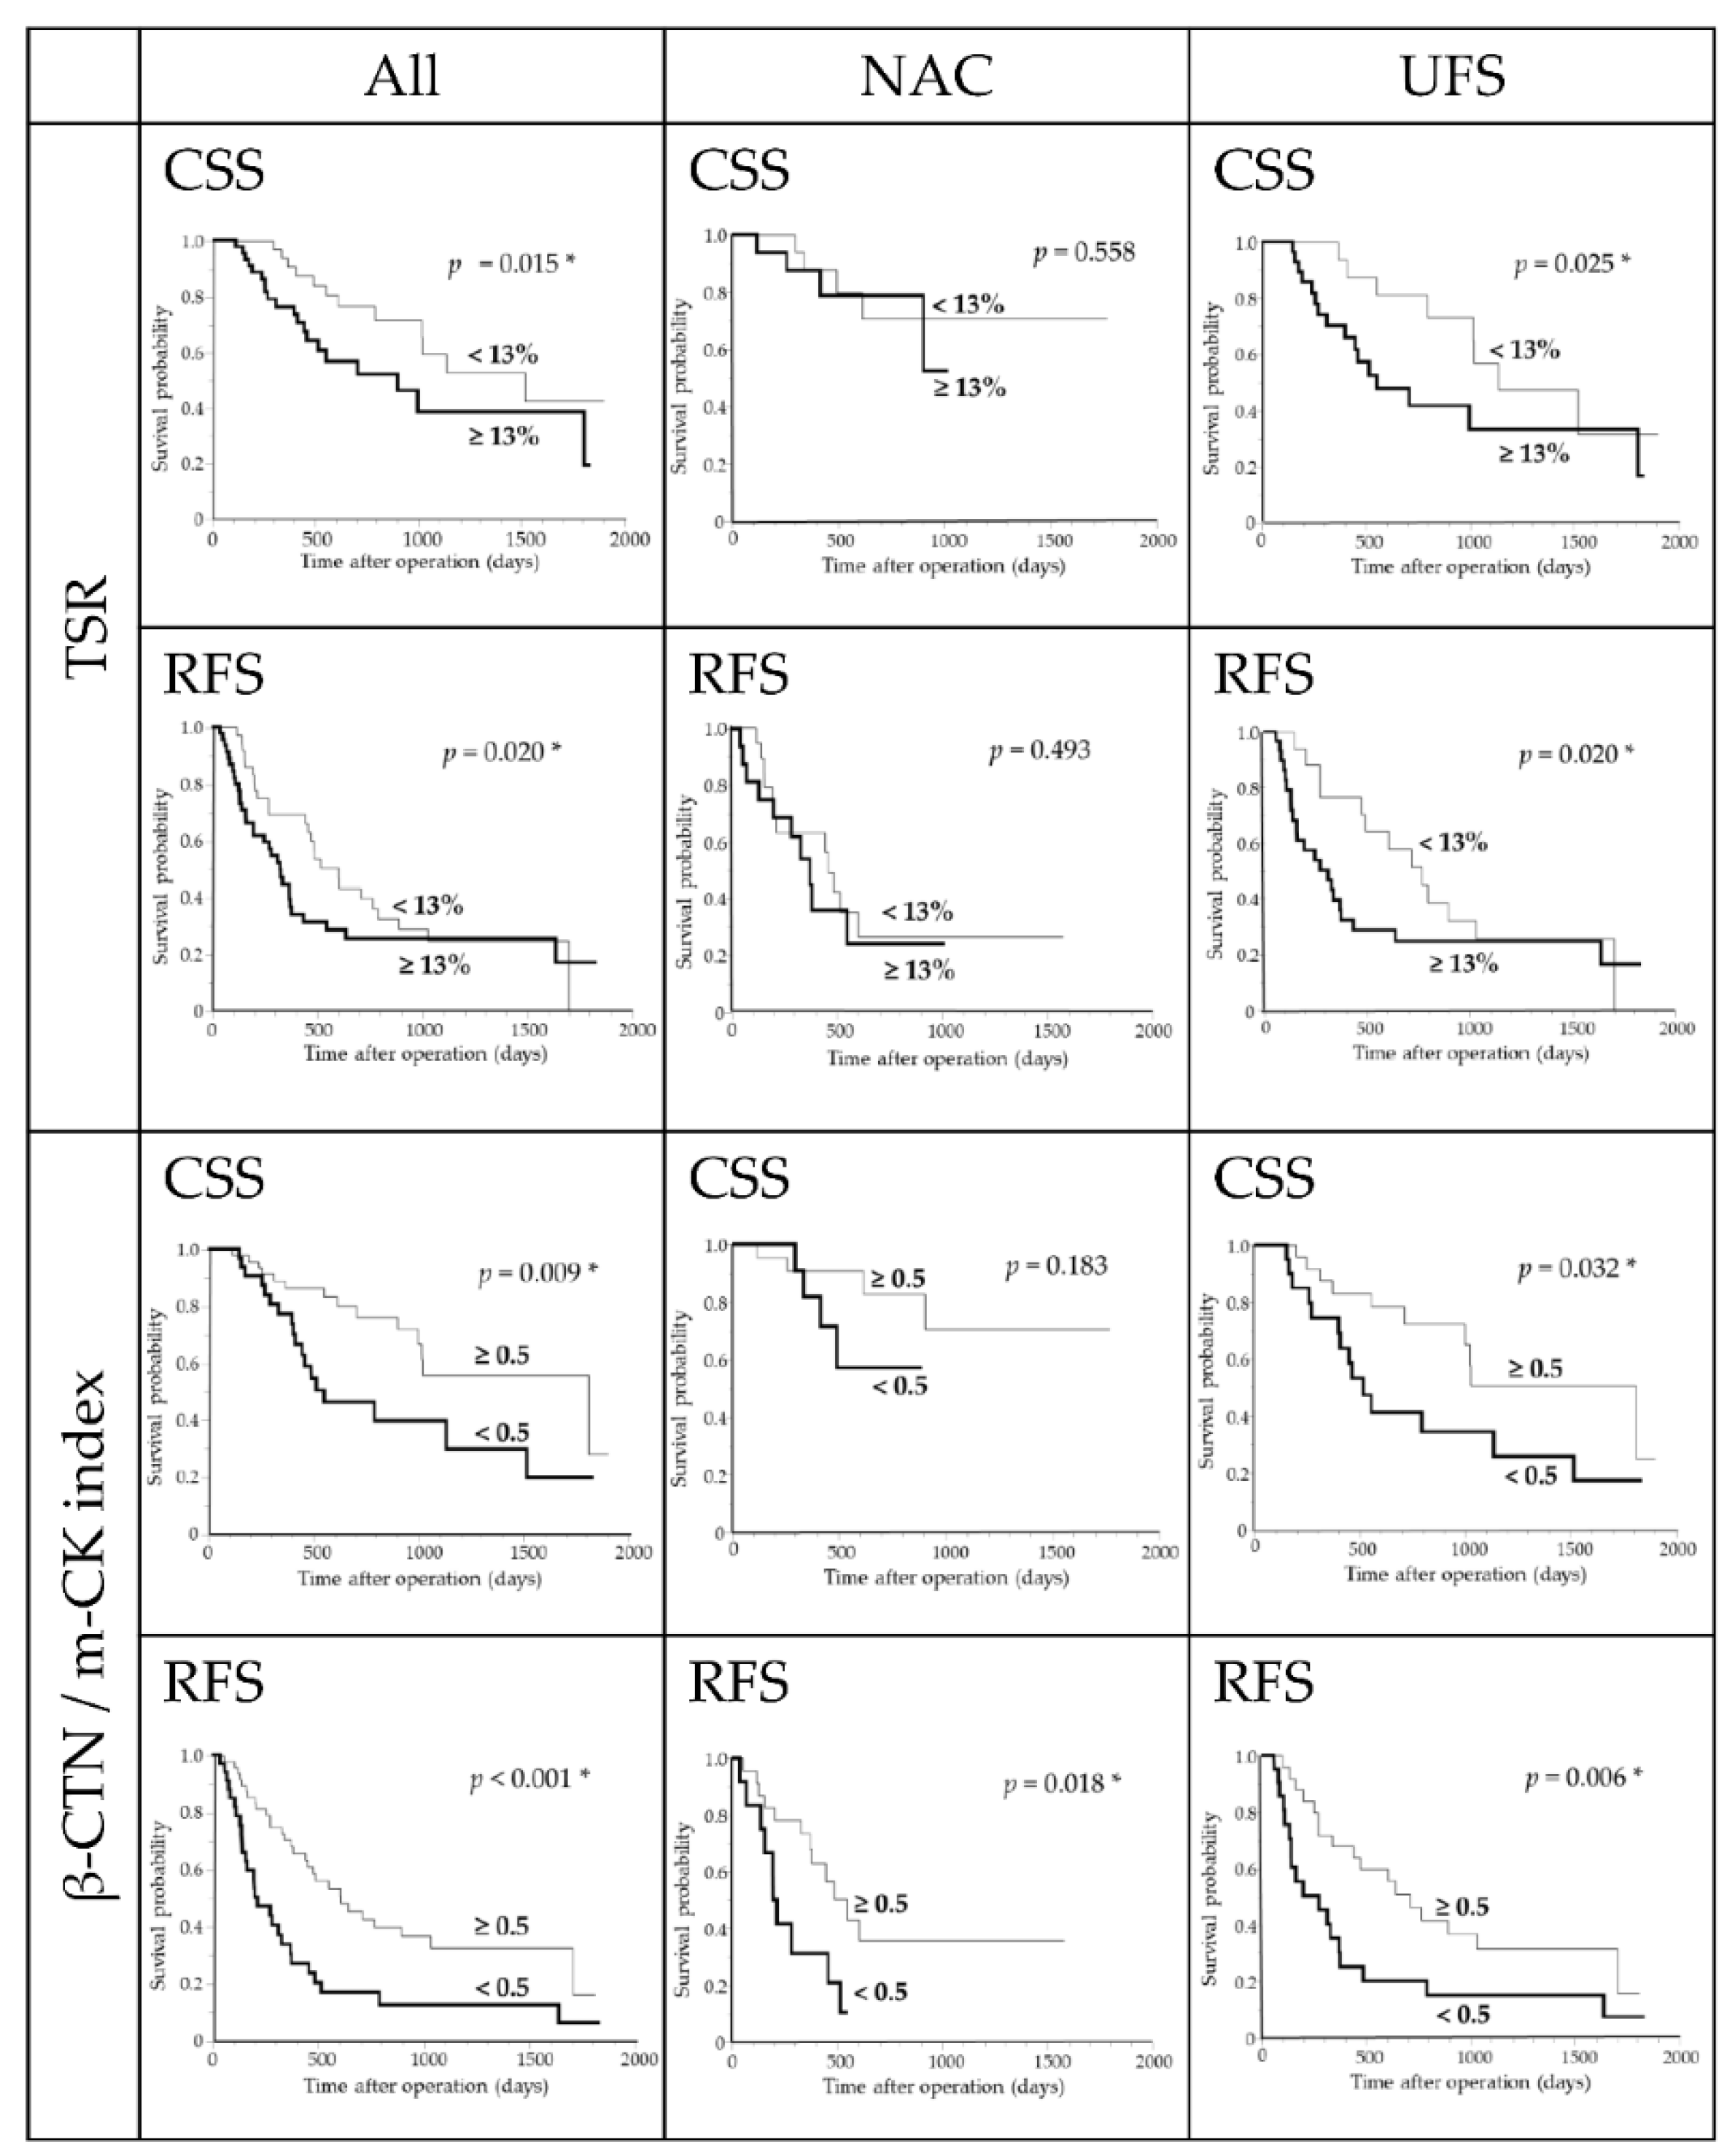

Table 1.
Clinicopathological characteristics in patients with PDAC undergoing NAC versus UFS.
| Variable | NAC | UFS | p-Value |
| Number of cases | 35 | 49 | |
| Age (years) | |||
| Mean / Median (range) | 69.5 / 71 (39-85) | 74.8 / 75 (50-91) | 0.040 * |
| <75 | 22 | 24 | 0.268 |
| ≥75 | 13 | 25 | |
| Sex | 0.664 | ||
| Male | 19 | 24 | |
| Female | 16 | 25 | |
| Tumor location | 1.000 | ||
| Head | 21 | 29 | |
| Body / Tail | 14 | 20 | |
| Adjuvant therapy | 0.264 | ||
| Yes | 23 | 25 | |
| No | 12 | 24 | |
| pT category | 0.060 | ||
| 1 | 13 | 10 | |
| 2 | 13 | 31 | |
| 3 | 9 | 8 | |
| pN category | 0.564 | ||
| N0 | 18 | 21 | |
| N1 | 11 | 15 | |
| N2 | 6 | 13 | |
| Tumor differentiation | 0.787 | ||
| Well | 14 | 23 | |
| Moderate | 18 | 23 | |
| Poor | 3 | 3 | |
| Lymphovascular invasion | 0.468 | ||
| Absent | 8 | 15 | |
| Present | 27 | 34 | |
| Perineural invasion | 0.199 | ||
| Absent | 11 | 9 | |
| Present | 24 | 40 | |
| Peripancreatic fat invasion | 0.409 | ||
| Absent | 9 | 8 | |
| Present | 26 | 41 | |
| Resection margin | 0.067 | ||
| Negative | 33 | 39 | |
| Positive | 2 | 10 | |
* p<0.05 was considered statistically significant. Abbreviations: PDAC, pancreatic ductal adenocarcinoma; NAC, neoadjuvant chemotherapy; UFS, upfront surgery.
Table 2.
Multivariate analysis of clinicopathological features associated with survival outcomes in PDAC.
Table 2.
Multivariate analysis of clinicopathological features associated with survival outcomes in PDAC.
| Variable | CSS | RFS | ||||
| HR | 95% CI | p-Value | HR | 95% CI | p-Value | |
| Adjuvant therapy (Yes vs No) | 5.395 | 2.233 - 13.031 | <0.001 * | 2.210 | 1.230 - 3.972 | 0.008 * |
| pT category (1 + 2 vs 3) | N/A | N/A | N/A | 1.785 | 0.909 - 3.505 | 0.093 |
| pN category (N0 vs N1 + N2) | 1.477 | 0.651 - 3.350 | 0.350 | 1.953 | 1.093 - 3.492 | 0.024 * |
| Tumor differentiation (Well vs Moderate + Poor) | 7.776 | 2.832 - 21.349 | <0.001 * | 2.394 | 1.260 - 4.551 | 0.008 * |
| Lymphovascular invasion (Absent vs Present) | N/A | N/A | N/A | 2.546 | 1.218 - 5.321 | 0.013 * |
| Peripancreatic fat invasion (Absent vs Present) | 6.972 | 1.911 - 25.428 | 0.003 * | N/A | N/A | N/A |
| TSR (<13% vs ≥13%) | 2.414 | 1.071 - 5.439 | 0.034 * | N/A | N/A | N/A |
| β-CTN/m-CK index (≥0.5 vs <0.5) | N/A | N/A | N/A | 2.028 | 1.120 - 3.670 | 0.020 * |
* p<0.05 was considered statistically significant. Abbreviations: PDAC, pancreatic ductal adenocarcinoma; CSS, cancer-specific survival; RFS, recurrence-free survival; HR, hazard ratio; CI, confidence interval; TSR, tumor–stroma ratio; β-CTN, β-catenin; m-CK, multi-cytokeratin; N/A, not applicable.
Table 3.
Multivariate analysis of clinicopathological features associated with survival outcomes in NAC-treated PDAC.
Table 3.
Multivariate analysis of clinicopathological features associated with survival outcomes in NAC-treated PDAC.
| Variable | CSS | RFS | ||||
| HR | 95% CI | p-Value | HR | 95% CI | p-Value | |
| Sex (Female vs Male) | 18.054 | 1.614 - 201.926 | 0.019 * | N/A | N/A | N/A |
| Resection margin (Negative vs Positive) | 63.446 | 2.871 - 1402.272 | 0.009 * | 4.033 | 0.817 - 19.922 | 0.087 |
| β-CTN/m-CK index (≥0.5 vs <0.5) | N/A | N/A | N/A | 2.516 | 1.031 - 6.138 | 0.043 * |
| TB (Low vs High) | 6.008 | 0.847 - 42.627 | 0.073 | N/A | N/A | N/A |
* p<0.05 was considered statistically significant. Abbreviations: NAC, neoadjuvant chemotherapy; PDAC, pancreatic ductal adenocarcinoma; CSS, cancer-specific survival; RFS, relapse-free survival; HR, hazard ratio; CI, confidence interval; β-CTN, β-catenin; m-CK, multi-cytokeratin; TB, tumor budding; N/A, not applicable.
Table 4.
Multivariate analysis of clinicopathological features associated with survival outcomes in UFS-treated PDAC.
Table 4.
Multivariate analysis of clinicopathological features associated with survival outcomes in UFS-treated PDAC.
| Variable | CSS | RFS | ||||
| HR | 95% CI | p-Value | HR | 95% CI | p-Value | |
| Adjuvant therapy (Yes vs No) | 5.539 | 1.882 - 16.306 | 0.002 * | 2.013 | 0.980 - 4.136 | 0.057 |
| Tumor differentiation (Well vs Moderate + Poor) | 7.632 | 2.471 - 23.575 | <0.001 * | 5.006 | 2.178 - 11.508 | <0.001 * |
| Peripancreatic fat invasion (Absent vs Present) | 4.933 | 1.104 - 22.033 | 0.037 * | N/A | N/A | N/A |
| TSR (<13% vs ≥13%) | 2.536 | 0.947 - 6.790 | 0.064 | N/A | N/A | N/A |
| β-CTN/m-CK index (≥0.5 vs <0.5) | N/A | N/A | N/A | 2.230 | 1.106 - 4.500 | 0.025 * |
* p<0.05 was considered statistically significant. Abbreviations: UFS, upfront surgery; PDAC, pancreatic ductal adenocarcinoma; CSS, cancer-specific survival; RFS, relapse-free survival; HR, hazard ratio; CI, confidence interval; TSR, tumor–stroma ratio; β-CTN, β-catenin; m-CK, multi-cytokeratin; N/A, not applicable.
Disclaimer/Publisher’s Note: The statements, opinions and data contained in all publications are solely those of the individual author(s) and contributor(s) and not of MDPI and/or the editor(s). MDPI and/or the editor(s) disclaim responsibility for any injury to people or property resulting from any ideas, methods, instructions or products referred to in the content. |
© 2025 by the authors. Licensee MDPI, Basel, Switzerland. This article is an open access article distributed under the terms and conditions of the Creative Commons Attribution (CC BY) license (http://creativecommons.org/licenses/by/4.0/).
Copyright: This open access article is published under a Creative Commons CC BY 4.0 license, which permit the free download, distribution, and reuse, provided that the author and preprint are cited in any reuse.


