
Submitted:
10 September 2025
Posted:
11 September 2025
You are already at the latest version
Abstract
The urgent push to electrify Europe's transportation sector has intensified efforts to develop battery technologies that are not only high-performing but also environmen-tally sustainable. A critical element in battery system design is the structural housing, which must provide effective impact protection to ensure passenger safety and prevent catastrophic failures. Thermoplastic composite housings present notable advantages over traditional metallic and thermoset alternatives, owing to their superior toughness, recyclability, and ease of processing. This study examines the impact response of a battery housing fabricated from an innovative thermoplastic composite material—glass fiber-reinforced ELIUM MC combined with Martinal ATH. The composite’s mechan-ical properties were first evaluated through standardized tests. To assess impact re-sistance, low-velocity drop-weight impact experiments were performed on both flat composite plates and the full-scale housing. These tests were conducted at varying energy levels to induce barely visible impact damage (BVID) and visible impact dam-age (VID). A numerical model of the housing was developed using LS-DYNA explicit software, incorporating experimentally derived material properties. After successful validation against the experimental results, the model was used to simulate a series of impact scenarios, including ground and pole collisions. The simulations showed that high-energy impacts significantly compromise the structural integrity of the housing, yet do not jeopardize the battery pack itself. In contrast, low-energy impacts resulted in only localized damage, preserving the functional integrity of the system. Beyond en-suring structural integrity, this thermoplastic housing addresses critical challenges in electric mobility, namely recyclability and fire safety. These findings underscore the potential of thermoplastic composites in enhancing the crashworthiness, safety, and durability of battery housings, offering a sustainable path for electric transportation.
Keywords:
thermoplastic
; SMC
; battery
; housing
; impact
; drop tower
; LS Dyna
; safety
1. Introduction
Driven by the need for a more sustainable transportation sector, aiming to reduce greenhouse gas emissions and dependency on fossil fuels, Battery Electric Vehicles (BEVs) have gained major recognition in the last decades. Their core component, the battery, is the subject of intensive research and development. The most common battery type in contemporary electric vehicles is lithium-ion, which is adopted due to their high energy density [1]. While improvements in battery capacity and charging speed are crucial for extending range in transportation to match conventional vehicles, they often lead to an increase in battery, and consequently, vehicle weight. Current BEVs are heavier than their internal combustion engine counterparts, therefore opting for lightweight materials in the design of the vehicle remains crucial [2]. Composite materials and more specifically, composite battery housings offer an excellent solution, providing superior weight-specific mechanical performance, enhanced corrosion resistance and thermal insulation compared to traditional aluminum alloy or steel housings [3].
Thermoset matrices have been the state-of-the-art choice compared to their thermoplastic counterparts, due to their easier fiber impregnation, lower processing temperatures, and lower cost [4]. However, thermoplastic resins present greater fatigue resistance, superior damage tolerance under impact, and shorter processing times. Also, thermosets undergo irreversible chemical formation during curing, which permanently sets their molecular structure, while thermoplastics can be remolded while fully retaining their original composition and properties, offering significant benefits for recyclability [5]. Essentially, there is a need for a thermoplastic resin that exhibits good mechanical properties and room-temperature curing but also be compatible with liquid processing techniques. These requirements led to the development of a new acrylic resin by Arkema company, called Elium. This low-viscosity, in-situ polymerizable thermoplastic resin effectively cures at room temperature and is suited for both Vacuum Assisted Resin Infusion (VARI), Resin Transfer Moulding (RTM), as well as Sheet Moulding Compound (SMC) processes [6,7].
The composite housing design needs to include reliable protection for internal electronics and battery cells. This requires shielding from external loads, e.g. physical impacts, and various environmental influences, such as extreme temperatures, which can cause thermal runaway, the catastrophic overheating of the battery that can lead to fire [8,9]. Consequently, the impact safety of Battery Pack Systems (BPS) is of great importance [10,11]. Impact events, such as those from road debris, can cause nonvisible internal damage to conventional unidirectional (UD) composites, which reduces their mechanical performance. Discontinuous fiber composites, such as SMCs, appear to be a suitable substitute, providing improved resin flow and complex geometry manufacturing of components at a reduced cost [12]. Within the existing literature, numerous impact studies have been conducted on continuous carbon and glass fiber composites. Carbon fibers are recognized for their high strength, whereas glass fibers exhibit greater ductility, which allows glass fibers to enhance energy absorption before failure, consequently improving the overall impact tolerance of the composite [13]. However, a significant gap exists in comprehensive experimental data and numerical simulations needed to thoroughly evaluate the impact resistance of Battery Pack Structures (BPS) [14,15]. Research on BPS safety predominantly concentrates on cells and module’s electrochemical degradation. Regarding their mechanical integrity, limited impact scenarios including frontal, side, and rear impacts have been examined [16]. Chen et al. investigated the dynamic response of lithium-ion battery packs under high-speed impact, developing models to predict internal failure mechanisms under mechanical abuse [17,18]. Xu et al. examined the influence of State of Charge (SOC) on the mechanical response of lithium-ion batteries during impact [19]. More recently, bottom crashworthiness has gained attention, with researchers utilizing composite materials and structures to enhance impact resistance [10]. Xia et al. introduced a new analysis method designed to evaluate potential damage of battery packs from road debris [20]. Also, explicit finite element analysis (FEA), using the LS-DYNA software, has been employed to model the response of cylindrical lithium-ion battery cells to lateral impact [11] and to simulate the ground impact of lithium-ion battery packs in electric vehicles [21,22,23].
Concerning the dynamic response of battery enclosures, numerical simulations to predict the deformation of steel battery housings during frontal low-speed impacts have been employed using LS-DYNA software [16]. Ground impact simulations have been developed for fiber metal laminate (FML) battery enclosures, investigating various impact velocities (35–41 m/s), with experimental tests carried out to validate these models [24]. A crash simulation analysis focusing on a battery pack that integrates cylindrical cells within an ABS enclosure has also been carried out using the Radioss solver, aiming to compare the impact responses of the battery pack system both in the presence and absence of shock absorbers [25]. Also, side pole impact simulations on carbon fiber reinforced battery enclosures, have been carried out, modeled with VPS software and 2D shell elements [3,10]. Another study examined the design optimization of a battery pack enclosure (BPE) constructed from steel, aluminum, and carbon fiber composite to enhance its impact resistance. This research used a multi-objective optimization approach, integrating numerical models and analytical methods, to reduce BPE's mass and maximum deformation. For this, a modified TOPSIS method was applied to determine the most important design parameters [26].
To the authors’ knowledge, a limited number of studies, both numerically and experimentally, focusing on the impact performance of SMCs and discontinuous fiber composites has been investigated and no prior work on the impact response of Elium glass fiber SMC battery housings has been reported. In this work, a novel thermoplastic battery enclosure is subjected to ground and frontal pole impact, with parametrically increasing the impact velocity. In Section 2, the SMC material is characterized in tension, compression, shear and three-point bending, and its mechanical properties are calculated. Also, the experimental procedure of drop tower impact tests is described, for both thermoplastic plates and the battery housing, conducted at impact energies of 7.5 J and 30 J. Section 3 outlines the numerical modeling in detail. This includes the development of two models intended to validate the drop tower test results for both the SMC plate and the housing, as well as the development of the parametric ground and crash impact simulations. Section 4 includes the results of numerical modelling, that validate the impact response of the housing. Using the validated model, the results of the parametric analysis, for ground and pole impact, are discussed. In Section 5, the work of this paper is summarized.
2. Experimental
2.1. Geometry and Material
The battery housing consists of two primary components—the lid and the main enclosure—both fabricated from a novel thermoplastic composite material. The matrix is based on Arkema Elium MC 590, an acrylic resin, modified with Martinal ATH (aluminum hydroxide) to impart fire resistance. The composite is reinforced with 20 wt% chopped glass fibers (JM Multistar 272), providing mechanical strength and stiffness. The housing has maximum external dimensions of 440 mm × 300 mm × 89 mm and features four symmetrical support legs at the bottom, each measuring 12 mm × 12 mm × 2 mm (width × length × height), as illustrated in the CAD drawing of Figure 1. Due to the manufacturing process, the wall thickness of the housing varies between 3.0 and 3.5 mm. The material is produced in the form of a Sheet Molding Compound (SMC)—a specialized type of prepreg suitable for compression molding. The complete manufacturing process, from the formulation of semi-finished SMC sheets to the compression molding of flat plates and the final housing component, was carried out at Fraunhofer ICT in Pfinztal, Germany [2].
2.2. Mechanical Characterization of the SMC Composite
To characterize the short fiber SMC composite, tension, compression, shear and three-point bending tests were conducted in accordance with relevant ASTM standard test methods. For each mechanical test, a minimum of five specimens were prepared and tested under controlled environmental conditions of 23 °C and 50% relative humidity, in compliance with the respective standard procedures. Strain measurements were obtained using bonded strain gauges with a resistance of 350 Ω. All tests were carried out using a 100 kN MTS Universal Testing Machine equipped with hydraulic grips. Consistent with the nature of the composite—comprising randomly oriented short glass fibers—specimens were tested without end tabs, as permitted by the applicable ASTM standards. The testing configurations and the mounted specimens are shown in Figure 2. A summary of the testing procedures and associated parameters is provided in Table 1.
Tensile properties of the composite material were evaluated in accordance with ASTM D3039. Flat strip specimens with a constant rectangular cross-section were used, measuring 250 mm × 25 mm × 2.5 mm, with a gage length of 150 mm. The specimens were mounted in the universal testing machine and subjected to tensile loading at a standard crosshead displacement rate of 1 mm/min. Strain gauges with a resistance of 350 Ω were affixed on both faces of the specimen—one aligned in the longitudinal direction and the other in the transverse direction. These measurements enabled the calculation of the tensile modulus of elasticity and Poisson’s ratio, based on the stress–strain data and using equations specified in ASTM D3039. Additionally, the ultimate tensile strength (UTS) of the material was determined as part of the test output.
Compression testing was conducted in accordance with ASTM D3410. Rectangular flat specimens were prepared with dimensions of 140 mm (length) × 25 mm (width) × 2.5 mm (thickness) and a gage length of 12 mm. The gage length was determined based on the specimen thickness to ensure sufficient space for the placement of strain gauges in the longitudinal direction, while also minimizing the risk of Euler buckling within the test section. Specimens were mounted in the testing machine and compressed at a constant crosshead displacement rate of 1 mm/min. The test yielded measurements of ultimate compressive strength and compressive modulus.
Flexural testing was carried out according to ASTM D790, using a three-point bending configuration. Specimens had a rectangular cross-section with dimensions of 95 mm × 18 mm × 4.5 mm and were tested using a support span-to-depth ratio of (16 ± 1):1, as recommended by the standard. The crosshead speed was set to 2.2 mm/min. This procedure enabled the evaluation of key flexural properties, specifically the flexural strength and flexural modulus.
Shear properties were evaluated in accordance with ASTM D7078, which utilizes v-notched rail shear specimens. In this method, the specimens are clamped between two loading fixtures and subjected to tensile loading, which induces a relatively uniform shear stress distribution in the reduced cross-section of the gage area, ultimately resulting in shear failure. To measure shear strain, two strain gauges are applied at ±45° angles relative to the loading direction. The test was performed at a crosshead speed of 2 mm/min. The test results were used to determine the shear modulus and ultimate shear strength of the composite material.
2.2.1. Experimental Results
Figure 3 presents the force–displacement curves obtained from the mechanical testing procedures, while Table 2 summarizes the corresponding mechanical properties derived from each test. The experimental results demonstrate that the short fiber SMC composite exhibits a transversely isotropic mechanical response, characterized by comparable properties in both the in-plane and through-thickness directions. This behavior is consistent with the random orientation of the chopped glass fibers within the matrix, contributing to a relatively uniform distribution of mechanical performance across different loading directions. The failure modes of the specimens are illustrated in Figure 4.
The tensile behavior of the composite material exhibits a bi-linear force–displacement response, as illustrated in Figure 4(a). The initial linear segment of the curve corresponds to the elastic region, primarily governed by the presence of a high concentration of aluminum hydroxide (Al(OH)₃) within the thermoplastic matrix. The Al(OH)₃ filler acts as a stress concentrator, restricting the mobility and alignment of the polymer chains under tensile loading. This interaction results in a stiffening effect, which enhances the initial stiffness and elastic modulus of the composite. However, this same mechanism contributes to a reduction in ductility, as the restricted polymer chain mobility limits the material's ability to undergo plastic deformation. Consequently, the composite exhibits a more brittle response in the post-elastic region, consistent with the reduced strain-to-failure observed in the experimental data [27]. However, with the increase of the filler content, the continuity of the polymer matrix decreases, resulting more in Al(OH)3 particle-particle interaction rather than particle-resin interaction [28]. The formation of particle clusters, also, increases porosity and has a degrading effect on interface adhesion, which accelerates crack propagation and can lead to poor mechanical attributes [29]. The linear region, following the initial one, shows a drastic drop of the incline of the curve, thus a smaller tangent modulus (3.68 GPa) compared to the elastic modulus (12.26 GPa). This can be attributed to the thermoplastic resin, which gradually becomes less effective as the reinforcements begin to dominate the material's response [30]. The softening in the mechanical response is also developed due to matrix cracking and poor filler-resin interface bonding. The linear behavior is maintained until the material reaches a brittle failure. As illustrated in Figure 4(a), the failure mechanisms due to tension exhibit matrix cracking, fiber breakage and fiber pullout.
Under compressive loading, fiber breakage is not the primary failure mode [6]. Instead, the material tends to undergo degradation due to crack initiation and propagation, as well as debonding between the fibers and matrix. Due to the thermoplastic behavior of the Elium resin, that has a low yield point [7], the initial elastic region, shown in Figure 4(b), is not easily noticeable, because of the early development of microcracks resulting in non-linearity. Following the crack propagation, the ultimate compressive strength of the SMC is achieved, and a sudden drop of the load is observed, leading to the ultimate fracture of the composite. Figure 4(b) displays the specimens after fracture, highlighting matrix cracking and fiber debonding as the main failure mechanisms.
Concerning the shear response of the composite material, as illustrated in Figure 4(c), the initial behavior is linear elastic, enabling the determination of the shear modulus. As strain increases, the material exhibits a non-linear response, attributed to the initiation and growth of micro-cracks within the thermoplastic resin matrix—a characteristic behavior of Elium-based composites. At higher deformation levels, a visible diagonal crack forms at the notch root, as shown in Figure 4(c), leading to a slight reduction in the load response just prior to ultimate failure.
Regarding the three-point bending results, the composite exhibits high flexural strength, indicating effective interfacial bonding between the matrix and the reinforcing fibers [6]. In terms of flexural failure modes, Figure 4(d) shows that crack initiation consistently occurs on the tension side of the specimen, with fracture localized at the mid-span, corresponding to the region of maximum bending stress.
2.3. Drop Tower Impact Tests
Low-velocity impact tests were conducted using an INSTRON 9250HV drop tower machine, as shown in Figure 5. A 45 kN load cell was employed to accurately record the force exerted by the impactor during each test. The system is equipped with an anti-rebound mechanism to prevent multiple impacts on the specimen, ensuring consistency in test results. All tests were performed using a steel impactor with a mass of 6.795 kg, while the impact energy was controlled by adjusting the drop height, following the principle of energy conservation. The impactor was fitted with a 16 mm diameter hemispherical tip, in compliance with ASTM D7136 guidelines, to ensure standardized testing conditions. The impactor was mounted on a crosshead, which lifted it to the predetermined height before releasing it for free-fall along two vertical guide columns.
The data acquisition system records the load vs. time response for each impact event. The impact velocity is measured immediately prior to contact using a photoelectric diode and flag system. This system employs a flag attached to the drop weight, consisting of two prongs spaced 1 cm apart. As the prongs pass through the photo-diode sensor, the obstruction of the light beam generates electrical signals. The system calculates the time interval between the leading edges of the two prongs as they interrupt the beam. Given the known distance between prongs (1 cm) and the measured time, the impact velocity of the drop weight is accurately determined using basic kinematic principles. This method ensures precise velocity measurement at the moment just before impact.
Impact tests were performed at two energy levels, 7.5 J and 30 J, corresponding to impact velocities of 1.486 m/s and 2.972 m/s, respectively. Two SMC plate specimens were tested at each energy level. The plates were cut to dimensions of 165 mm × 100 mm × 2.5 mm and positioned on a 250 mm × 250 mm × 30 mm steel support base featuring a 130 mm × 70 mm central opening. The specimens were secured using four symmetrical clamps to ensure proper fixation during impact. For the battery housing, testing was conducted at an impact energy of 30 J. A custom fixture was designed to maintain the housing in a fixed position throughout the test. A steel plate measuring 540 mm × 400 mm was placed beneath the housing to provide structural support, while a second steel plate of the same dimensions, containing a 450 mm × 280 mm cut-out, was positioned on top. The two plates were clamped together using eight bolts, each with an 18 mm diameter, ensuring a rigid and repeatable setup. Following each test, the damage depth was measured at the center of the specimen, where the most significant deformation or damage consistently occurred.
3. Numerical Modeling
In this study, all geometries were designed and meshed using ANSYS Workbench, while the impact simulations were carried out using the LS-DYNA explicit solver. Explicit time integration is particularly well-suited for problems involving significant nonlinearities, such as complex contact interactions and nonlinear material behavior, which are common in impact scenarios. However, explicit methods require a small-time step to maintain numerical stability and ensure accurate results. The time-step size is governed by the transit time of an acoustic wave through the smallest element in the model, as defined by the shortest characteristic length. This is a function of the material’s elastic properties—specifically, the Young’s modulus, Poisson’s ratio, density, and speed of sound [31]. According to the Courant condition, information should not propagate through more than one element per time step; otherwise, numerical instabilities may arise, leading to spurious oscillations and non-physical results. To enhance stability, the Time Step Scale Factor (TSSFAC), typically set at 0.90, was conservatively reduced to 0.70 in this study. This ensures a safer margin for accurate and stable calculations. For the structural discretization, solid elements were used with ELFORM = 1, a reduced integration formulation featuring a single integration point. While computationally efficient, this formulation is susceptible to hourglass modes, which require stabilization. To address this, stiffness-based hourglass control (Type 4) was employed. This control method is particularly effective in impact simulations involving structural components, especially when used with a reduced hourglass coefficient of 0.05, which minimizes the introduction of artificial stiffness and preserves the physical fidelity of the simulation.
3.1. Drop Tower Impact Models
The development of the drop tower numerical models stems from the need to validate the simulated impact response against experimental data, ensuring that the model reliably captures the physical behavior of the system. Model validation is essential for establishing the credibility and accuracy of the simulation framework. Once validated, the model serves as a powerful tool to significantly reduce testing costs and time, while enabling the prediction of structural performance under conditions that may be difficult, expensive, or unsafe to replicate experimentally. The validated model will be utilized in Section 3.2 and Section 3.3 to support the numerical analysis of parametric ground and crash impact scenarios, respectively, providing predictive insights into the mechanical performance and crashworthiness of the battery housing system.
3.1.1. Model of SMC Plate
The first drop tower model simulates the impact event of a projectile striking the SMC composite plates. The setup replicates the configuration of the experimental drop tower apparatus, including the steel support base with a central orthogonal opening, the four clamps, and the steel impactor, as illustrated in Figure 6. These three components are modeled as rigid bodies using Material Model 20 (MAT_RIGID) in LS-DYNA, with the associated material parameters listed in Table 3. The MAT_RIGID formulation enables the definition of both translational and rotational constraints for each component. Specifically, the base and clamps are fully constrained in all degrees of freedom, while the impactor is restricted only in the x and y directions and all rotational degrees of freedom, allowing free motion solely in the z-translational direction to simulate the vertical drop impact accurately.
A refined mesh was employed to ensure numerical stability and capture local effects with high accuracy. Specifically, 1 mm solid elements were used for the impactor and the clamps, while a 2 mm element size was applied to the composite plate, as shown in Figure 7(a),(b),(d). This mesh resolution was selected to minimize the influence of nonlinearities that could introduce numerical instabilities during the simulation. The specimen, representing the SMC composite plate, was modeled using Material Model 162 (MAT_COMPOSITE_MSC_DMG) in LS-DYNA. This material model enables progressive failure analysis of composite materials, incorporating the Hashin failure criteria and a damage mechanics-based softening behavior following damage initiation [32]. Given the randomly oriented chopped glass fibers in the SMC, the composite exhibits transversely isotropic behavior, with identical in-plane properties and reduced out-of-plane strength—effectively mimicking a unidirectional (UD)-like response. This behavior is implemented in the model using option 1 of the AMODEL keyword, which assumes transverse isotropy. The material properties were derived from experimental mechanical tests presented in Section 2, and the full list of input parameters is provided in Table 4. The SMC plate was meshed using 1 mm solid elements, as illustrated in Figure 7(c).
In impact simulations, automatic contact definitions are preferred due to the continuously changing relative orientations and the large deformations that typically occur during the event. Accordingly, CONTACT_AUTOMATIC_SURFACE_TO_SURFACE was selected in LS-DYNA to define the interactions between the composite specimen and both the steel base plate and the impactor. According to the literature, static friction coefficients for contact between glass fiber-reinforced polymers (GFRPs) and steel typically range from 0.2 to 0.5, while dynamic friction coefficients are generally 30%–40% lower [33]. In this study, the static and dynamic friction coefficients for the contact between the GF composite and steel components (impactor and base) were set to 0.4 and 0.2, respectively, to reflect realistic interaction conditions and ensure numerical stability.
To accurately model the interaction between the composite specimen and the clamps, a tied contact approach was implemented. Specifically, CONTACT_TIED_SURFACE_TO_SURFACE_OFFSET was used, which is well-suited for interactions involving rigid bodies, such as the clamps in this setup. In this configuration, the slave nodes (clamps) are constrained to follow the motion of the master surface (specimen), ensuring consistent boundary conditions and preventing relative motion at the interface.
The projectile was assigned an initial impact velocity using the INITIAL_VELOCITY_GENERATION keyword in the z-direction, corresponding to the experimental impact energy levels. For the low-velocity impact simulations, two energy levels were investigated: 7.5 J and 30 J, which correspond to initial velocities of 1486 mm/s and 2972 mm/s, respectively.
3.1.2. Model of SMC Battery Housing
The second drop tower simulation model replicates the impact event of a projectile striking the SMC composite housing. To constrain the housing’s movement and suppress rebound during the impact event, two steel plates are implemented: one with a rectangular opening matching the dimensions of the housing (positioned on top), and a solid plate (placed underneath). This setup is designed to secure the specimen while allowing localized deformation at the impact site. The projectile is positioned to strike the center of the housing’s upper surface, as shown in Figure 8. All three components—the projectile and the upper and lower plates—are modeled as rigid bodies using LS-DYNA’s MAT_RIGID material model, with corresponding parameters listed in Table 3. The steel plates are fully constrained in all degrees of freedom, while the projectile is restricted to translational motion along the z-axis. In terms of meshing, the steel plates are discretized with 3 mm elements, while the projectile is refined with 0.5 mm elements, as illustrated in Figure 9(a). The housing is modeled using MAT_162, as previously detailed in Section 3.1.1. To mitigate hourglass effects and improve contact stability, a localized mesh refinement is applied to the impact zone. Specifically, a 60 mm × 60 mm central area is meshed with 0.5 mm elements, while the remainder of the housing is meshed with 2 mm elements to optimize computational efficiency, as shown in Figure 9(b).
An automatic surface-to-surface contact algorithm was employed to define the interactions between the projectile, steel plates, and the SMC composite housing. This contact type was selected to ensure accurate handling of impact events, sliding, and separation between rigid and deformable bodies. As previously specified, the static and dynamic friction coefficients for the steel–composite interfaces were set to 0.4 and 0.2, respectively, to reflect realistic interaction conditions observed in experimental testing. The projectile was assigned an initial velocity in the z-direction, calibrated to match an impact energy of 30 J. This corresponds to an initial impact velocity of 2972 mm/s, derived from the kinetic energy equation and consistent with experimental conditions.
3.2. Ground Impact Model
Investigating ground impact scenarios in battery housing simulations is critical for ensuring the safety and structural integrity of electric vehicles (EVs) under real-world operating conditions. Battery housings play a key role in protecting lithium-ion battery packs, which are highly sensitive due to their high energy density and potential for hazardous failure modes. In typical driving environments, vehicles are routinely subjected to impacts from road debris, curbs, or other low-lying obstacles—especially at high speeds. A severe impact to the underside of the vehicle can inflict mechanical damage on the battery housing, which may propagate to the battery cells, resulting in internal short circuits, electrolyte leakage, or thermal runaway. These failure modes can lead to fires, explosions, and the release of toxic gases, posing a direct threat to both occupant safety and public health. Even when catastrophic failure is avoided, sub-critical impacts can still induce internal damage to the battery structure, leading to performance degradation, reduced driving range, and shortened battery lifespan. Consequently, numerical simulations are indispensable for evaluating the crashworthiness of battery housings, allowing engineers to predict mechanical response, optimize designs, and implement effective countermeasures to prevent both catastrophic and progressive damage.
The FE model developed to simulate ground impact, as shown in Figure 10, includes three main components: the composite battery housing, the lid, and a spherical steel impactor with a diameter of 20 mm and mass of 0.3 kg, representing a road debris impact scenario. The enclosure assembly—comprising the housing and lid—is modeled using the short fiber SMC composite material and is assumed to be adhesively bonded. A hexagonal mapped mesh was generated for all components to ensure mesh quality and accuracy. The battery housing and lid were discretized using 2 mm solid elements, while the impactor was meshed with 1 mm elements to capture detailed contact behavior. The projectile is modeled as a rigid body using MAT_RIGID, constrained to move only in the z-direction to replicate vertical impact. The composite components are defined using MAT_162, as described in Section 3.1.1. To simulate fixed support conditions, the four bottom legs of the battery housing are fully constrained in the z-direction using BOUNDARY_SPC_SET.
An automatic surface-to-surface contact was employed to define the interaction between the impactor and the SMC composite housing, enabling accurate simulation of dynamic contact behavior during impact. Given that the lid and main enclosure are adhesively bonded, a cohesive zone modeling (CZM) approach was adopted to represent the bonded interface. Specifically, the CONTACT_AUTOMATIC_SURFACE_TO_SURFACE_TIEBREAK option was used, which activates only for nodes initially in contact. In this study, Tiebreak Option 9 was selected, which is based on the cohesive material model MAT_138 (MAT_COHESIVE_MIXED_MODE). This option implements a bilinear traction–separation law and a quadratic mixed-mode delamination criterion, along with a progressive damage formulation to simulate interfacial failure mechanisms [31,32]. In CZM, traction stresses develop as bonded nodes begin to separate. Once the predefined maximum traction strength is reached, interfacial failure occurs. This approach effectively captures debonding behavior while maintaining computational efficiency. As demonstrated in the research of Dogan et al. [34], the tiebreak contact model—with appropriately chosen parameters—has shown strong correlation with experimental results and offers a computationally efficient alternative to full CZM implementation. Accordingly, this method was chosen for the current study to balance accuracy and simulation performance. The tiebreak failure parameters used here are representative of typical structural adhesive films and are summarized in Table 5.
Four cases of impact are examined, with a parametric increase of velocity between 10 and 25 m/s, as described in Table 6, which corresponds to a wide range of realistic speeds, 36 to 90 km/h, a vehicle can travel with.
3.2.1. Models of Cells and Cell Pack
The primary objective of battery housing design is to ensure the protection of individual cells, which significantly influences the overall stiffness, mass, and energy absorption capacity of the battery pack. During an impact event, the housing serves as the first line of defense, transmitting forces directly to the cell pack. Therefore, accurately modeling the cell pack is essential to realistically predict load distribution, deformation behavior, and energy dissipation throughout the system. This level of fidelity is critical for achieving compliance with safety standards and regulations. Omitting the cell pack from the simulation would likely result in an overestimation of the housing’s protective capabilities, leading to a misleading evaluation of the battery system’s crashworthiness. As such, the inclusion of the cell pack in the numerical model is vital for assessing the structural integrity of the entire assembly and for ensuring the reliable protection of its most critical components under impact conditions.
In this study, a thermoplastic cell pack is placed inside the composite housing, with outer dimensions of 230 mm × 288 mm × 81 mm, as illustrated in Figure 11(a). The pack encapsulates five solid-state pouch cells, each measuring 280 mm in length and 195 mm in width, utilizing aluminum–plastic enclosures and Li/Advanced LFP (Lithium Iron Phosphate) battery chemistry. As the focus of this study lies in evaluating the mechanical response rather than the electrochemical behavior, the pouch cells are simplified for modeling purposes. Each cell is represented by a 0.1 mm thick aluminum foil shell, which simulates the outer casing, and an 8 mm thick polymer gel core, serving as a surrogate for the internal active components—including the anode, cathode, and electrolyte. To limit uncontrolled motion of the cells during impact scenarios, plastic cell frames are introduced between each pouch cell. These frames have an orthogonal geometry of 270 mm × 210 mm, with a 4 mm thickness, and feature a central 236 mm × 175 mm opening to permit controlled deformation of the cells in the middle of the configuration, as shown in Figure 11(b),(c). For the finite element model, a mapped mesh was applied across all components to ensure mesh regularity and accuracy. The cell pack structure is discretized using 3 mm solid elements, while both the pouch cells and intermediate frames are meshed with a finer 2 mm element size, as depicted in Figure 12.
Both the cell pack and the intermediate frames are composed of ABS plastic, a material commonly used for structural and protective components in battery systems. In the finite element model, ABS is represented using the MAT_24 (MAT_ISOTROPIC_ELASTIC_PLASTIC) material model in LS-DYNA, which accounts for isotropic plasticity without built-in failure or erosion capabilities. This model is selected for its computational efficiency and ability to capture basic plastic deformation behavior under impact loading. To enable failure within this framework, the ADD_EROSION option is activated. This enhancement allows for element deletion when a predefined failure criterion is met. In this study, the Von Mises stress criterion is employed, and failure is initiated when the equivalent stress reaches a specified threshold, as detailed in Table 7. For the cell components, an isotropic elastic material, with the specialization of allowing the modeling of fluids (MAT_ELASTIC), is employed. The input parameters for the aluminum foil and the polymer gel are stated in Table 8.
To accurately capture the mechanical interactions within the battery system, automatic surface-to-surface contact is defined between the cell pack and both the upper and lower support frames, as well as between the frames and individual pouch cells. This contact setup allows for realistic relative motion and stress transfer between components during impact loading. The internal cell structure, comprising the aluminum foil shell and the polymer gel core, is modeled using CONTACT_TIED_SURFACE_TO_SURFACE. In this constraint-based formulation, the slave nodes (assigned to the foil shell) remain fully attached to the master surface (the gel core), ensuring kinematic compatibility and preventing artificial separation or delamination during deformation. Additionally, the entire cell pack is assumed to be adhesively bonded to the composite housing via a tiebreak contact formulation. This is implemented using CONTACT_AUTOMATIC_SURFACE_TO_SURFACE_TIEBREAK, allowing for the simulation of interface failure between the cell pack and the housing. The relevant interfacial strength and failure criteria are described in Section 3.2, enabling the model to realistically predict debonding or delamination under severe loading conditions.
3.3. Crash (Pole) Model
Crash simulations, especially those involving pole impacts, represent some of the most demanding and safety-critical load cases for battery enclosures. These scenarios are vital for evaluating the enclosure’s ability to withstand localized, high-energy impacts—conditions commonly encountered in real-world vehicle collisions. Such analyses are crucial for assessing the enclosure’s performance in terms of impact energy absorption, structural integrity preservation, and protection of the internal cell pack, while also considering material efficiency and weight optimization. In this study, a parametric analysis is performed to examine the impact response of the SMC composite battery housing across a range of impact energy levels. The simulations involve a cylindrical pole impactor striking the enclosure at various initial velocities, carefully selected to replicate realistic crash conditions observed in full-scale vehicle tests. These velocities, detailed in Table 9, correspond to practical, high-risk scenarios and offer valuable insights into the crashworthiness and structural resilience of the composite housing design.
The crash simulation model consists of the main enclosure (housing) and lid, which are adhesively bonded, a rigid cylindrical impactor, and a base plate that simulates the vehicle floor, as depicted in Figure 13. The housing is made from SMC composite material, while both the impactor and base plate are modeled with steel properties. The impactor is modeled as a rigid body, measuring 120 mm in length, 50 mm in diameter, and weighing 7 kg. It is constrained to move exclusively in the x-direction, replicating a lateral impact scenario. The base plate, with dimensions of 440 mm × 300 mm, is also defined as a rigid body, with all translational and rotational degrees of freedom fully constrained. All components are meshed with solid elements using a uniform element size of 2 mm, ensuring sufficient resolution for capturing local deformations. Contact between the impactor and the housing/lid assembly is defined using CONTACT_AUTOMATIC_SURFACE_TO_SURFACE, allowing accurate simulation of force transmission during the impact event. To represent the adhesive bonding between the lid and housing, a tiebreak contact formulation is used, enabling simulation of potential debonding or failure under high loads. Additionally, the bottom surface of the housing is bonded to the base plate using adhesive film properties consistent with those defined in Table 5, ensuring realistic interface behavior during impact loading.
4. Numerical Results and Discussion
4.1. Model Validation Against Experimental Results
This section presents a detailed validation of the drop tower finite element models, through direct comparison with the experimental impact test results described in Section 2.3. Validation is a critical step to ensure the accuracy and predictive capability of the simulations, particularly in assessing the impact performance of the battery enclosure under realistic conditions. The comparison focuses on key impact response metrics, including force–time histories, damage patterns, and deformation and failure measurements, to evaluate how well the numerical predictions replicate the actual material and structural behavior under dynamic loading. By examining the level of agreement between simulation outputs and experimental observations, this validation effort aims to establish the models as credible and reliable tools for further parametric studies and design optimization.
4.1.1. Impact on SMC Plate: 7.5 J
The impact behavior of composite materials is typically evaluated using force–time curves, which provide insight into the dynamic response of the material during impact. In the 7.5 J impact case, illustrated in Figure 14, the experimental force–time response exhibits a smooth, symmetric, bell-shaped profile, characteristic of a non-perforating impact where the material undergoes deformation followed by rebound. The curve reaches a peak force of 0.486 kN at 7.55 ms, before returning to zero, marking the end of the impact event. The total impact duration is approximately 15 ms, and is consistent between the experimental and simulated results. The numerical force–time curve closely mirrors the experimental one in both shape and duration. The simulation predicts a peak force of approximately 0.512 kN, occurring slightly later, at around 7.91 ms—a difference well within acceptable tolerance limits for dynamic simulations. Both curves display a gradual rise to peak load, followed by a smooth unloading phase, indicating good correlation in the overall mechanical response. In the initial loading phase of the experimental curve (0–1 ms), the contact force increases with minor amplitude oscillations, likely due to elastic wave propagation and vibrations within the composite during early impact. This is followed by small load drops, which may correspond to localized stiffness reductions caused by the onset of damage, such as matrix cracking. These fluctuations are typical in experimental data and can be attributed to machine vibrations and external noise, which are inherently smoothed out in numerical simulations. The simulation curve is therefore smoother, as it does not capture these high-frequency disturbances. Nonetheless, the close agreement in peak force values—with the simulation differing by less than 5% from the experimental result—demonstrates strong predictive accuracy of the model for this energy level.
At the impact energy of 7.5 J, the SMC composite material absorbs energy primarily through plastic deformation and localized damage mechanisms. The impact results in surface indentation, accompanied by matrix cracking and potentially minor fiber damage, without full penetration of the specimen by the impactor. As shown in Figure 15(a), a comparison is made between the front face damage observed in the drop tower test and that predicted by the numerical simulation. The experimental specimen exhibits a distinct indentation with visible radial cracks resembling the projectile’s shape, attributed to matrix failure. The measured damage dimensions are 10.40 mm × 10.02 mm. The simulation predicts a slightly larger dent, measuring 10.78 mm × 10.05 mm, consistent with the higher peak force observed in the numerical force–time response. Despite minor differences, the agreement between simulation and experiment is very good. Figure 15(b) presents the rear face of the impacted plate. The experimental specimen shows a well-defined indentation with cracks propagating outward from the center of impact. The measured dimensions are 18.67 mm × 21.82 mm. The simulation reproduces the overall shape of the indentation but displays a smoother deformation profile, without capturing the matrix cracking and fiber breakage seen in the test. The predicted damage area is 15.62 mm × 17.36 mm, slightly smaller than the experimental values. This discrepancy is primarily attributed to the material modeling approach: the MAT_162 material model treats the chopped fiber composite as a transversely isotropic, unidirectional (UD)-like laminate, rather than a true discontinuous fiber composite, which can affect the accuracy of predicted damage modes. A side profile comparison in Figure 15(c) reveals that the maximum indentation depth in the experiment is 0.77 mm, whereas the simulation predicts 1.06 mm. Given the complexity of the material and the impact event, this level of agreement is considered acceptable, further supporting the validity of the simulation model.
Overall, the results indicate that the MAT_162 material model effectively captures the stiffness and elastic–plastic behavior of the SMC composite throughout the impact event. The simulation accurately reproduces the general indentation morphology, though it lacks the fine resolution of crack propagation observed in the experimental specimens. Nevertheless, the depth of the damage is comparable between simulation and experiment, suggesting that the model reliably captures the through-thickness deformation. While there are differences in the visual representation of damage, particularly in the depiction of matrix cracks, the close agreement in force–time response supports the model’s validity in predicting energy absorption and macroscopic deformation behavior under low-energy impact conditions. This demonstrates the model’s potential as a reliable tool for assessing the crashworthiness of composite battery enclosures at this energy level.
4.1.2. Impact on SMC Plate: 30 J
In the 30 J impact case, the experimental force–time curve, shown in Figure 16, displays a rapid initial rise, reaching a peak force of approximately 0.626 kN at 2.20 ms. Following this peak, the curve exhibits a complex profile, including a load drop indicative of fracture initiation, followed by a secondary peak of about 0.45 kN at 3.2 ms, and a subsequent sharp decline. This fluctuating behavior suggests a sequence of progressive failure mechanisms, such as matrix cracking and fiber breakage, occurring throughout the impact event. Additionally, part of this irregularity may be attributed to the experimental fixture configuration, particularly the clamps. Under the high-energy impact, the clamps may have failed to maintain full constraint on the specimen, allowing minor relative movements that introduced oscillations into the measured force response. The total impact duration in the experiment is approximately 4.5 ms. The numerical simulation effectively captures the initial force rise and closely matches the primary peak, reaching approximately 0.643 kN at 2.4 ms, resulting in a 2.6% deviation from the experimental value. However, the simulation shows a shorter impact duration of about 4.1 ms and a smoother, more idealized decline in force after the peak. Notably, it does not reproduce the secondary peak, or the oscillatory features observed in the experimental data. This discrepancy is likely due to modeling simplifications and assumptions, such as idealized boundary conditions, rigid clamp definitions, and limitations in capturing dynamic interactions and complex damage progression—all of which contribute to the differences between simulated and observed behavior.
A comparison between the experimental and numerical damage patterns reveals that the impactor fully penetrates the specimen in both cases, with the numerical model predicting a slightly larger perforation, consistent with the higher peak force observed in the simulation. As shown in Figure 17(a), the front face of the specimen exhibits a clean, circular damage area in both the experimental and simulated results, corresponding closely to the geometry of the impactor. The damage dimensions are 13.27 mm × 13.27 mm in the experiment and 13.42 mm × 14.19 mm in the simulation, indicating strong agreement in damage extent on the impacted surface. On the rear face of the specimen (Figure 17(b)), the experimental test shows significant perforation, characterized by extensive matrix cracking, possible fiber breakage, and noticeable fiber pull-out around the hole’s perimeter, resulting in an irregular damage shape with dimensions of approximately 18.29 mm × 17.37 mm. The numerical model, while unable to capture the detailed fiber fraying and pull-out due to limitations in the material formulation, predicts a smooth, circular perforation with dimensions of 18.50 mm × 18.41 mm, in very good agreement with the overall size of the damaged area. Figure 17(c) presents the side profile of the impact zone. The experimental specimen exhibits a penetration depth of 9.19 mm with visible signs of fiber separation. The simulation replicates the overall deformation shape, producing a slightly deeper penetration depth of 9.61 mm. Although the numerical result presents a more idealized failure profile, it successfully captures the macroscopic deformation behavior, even if it does not reflect the complex fiber damage mechanisms observed in the experiment.
The agreement between the experimental and numerical results is very good, particularly in terms of damage size and overall geometry. The simulation accurately predicts the macroscopic dimensions of the damage, including both the perforation diameter and the through-thickness deformation, indicating a high level of accuracy in capturing the global failure response of the SMC composite under impact. This serves as a critical validation point, reinforcing the model’s capability to predict the overall extent of material failure in crash scenarios. However, notable differences in damage morphology are observed. These discrepancies, such as the absence of detailed fiber breakage and matrix cracking in the simulation, are inherent to continuum damage models like MAT_162. Such models are limited in their ability to represent micro-scale failure mechanisms, including fiber pull-out, delamination, and localized crack propagation, which are often visible in experimental observations. Despite these limitations, the model remains highly effective for predicting global damage metrics essential for structural design and crashworthiness assessment.
4.1.3. Impact on SMC Housing: 30 J
The overall profiles of the experimental and numerical force–time curves for the 30 J impact on the SMC housing, shown in Figure 18, demonstrate reasonably good agreement. Both curves exhibit a rapid initial force rise, reaching peak values of 0.737 kN (simulation) and 0.708 kN (experiment) at approximately 4.00 ms and 4.19 ms, respectively. This corresponds to a variation of just 3.9%, indicating a strong correlation in capturing the initial impact response. As with the 30 J plate impact case, the most notable differences arise in the post-peak behavior. The experimental curve shows a sharp drop in force after approximately 5 ms, even dipping into negative values, which typically signals a major structural failure. This behavior is associated with degradation of local stiffness due to severe internal damage, such as matrix cracking, fiber breakage, and possible loss of constraint, ultimately signifying the fracture of the housing. In contrast, the simulation presents a more gradual decline in force, lacking the abrupt drop and negative force rebound observed in the experimental data. This discrepancy can be attributed to limitations in the material model, which may not fully capture the complex and dynamic failure mechanisms observed in the physical test, such as catastrophic fracture, debonding, or fixture compliance.
The resulting damage on the housing surface under 30 J impact energy is comparable to that observed on the SMC plate tested at the same energy level, both in terms of damage dimensions and failure modes, as expected. On the front face of the housing, shown in Figure 19(a), the experimental results reveal a symmetrical, circular opening caused by projectile penetration, with visible material damage measuring 13.27 mm × 13.27 mm. The simulation produces a similarly shaped, slightly cleaner perforation, with dimensions of 13.42 mm × 14.19 mm, demonstrating excellent agreement with the test. A consistent pattern is observed on the back face of the housing in Figure 19(b), where the experimental damage exhibits a more irregular shape, attributed to fiber breakage and pull-out mechanisms. While the simulation cannot capture these finer-scale damage details due to material modeling limitations, it effectively reproduces the overall deformation profile. The side profiles of both the experiment and simulation, shown in Figure 19(c), display significant plastic deformation, with measured indentation depths of 12.38 mm (experiment) and 12.17 mm (simulation). This close correlation in through-thickness deformation further validates the model’s ability to predict global damage characteristics. Overall, the simulation shows very good agreement with experimental results in terms of damage size, shape, and deformation depth, thereby confirming the model’s validity. It reliably captures damage patterns and force responses across different structural configurations—both plates and housing—demonstrating its applicability for predictive analysis in composite impact scenarios.
4.2. Parametric Study on Impact Energy
4.2.1. Ground Impact
Figure 20 and Figure 21 illustrate the progressive deformation and load transfer mechanisms in the parametric analysis of the battery housing's response to ground impact at increasing velocities. Figure 20 focuses on the maximum displacement of the housing and its interaction with the internal components of the cell pack, which closely aligns with the impactor's maximum displacement. At the lowest impact velocity (Figure 20(a)), the housing shows a maximum displacement of 4.74 mm, while the cell pack remains undisturbed, with a displacement of 3.71 mm. This results in a 1.28 mm residual gap between the cell pack and the first pouch cell. Individual cell displacement remains minimal (0.33–0.37 mm), indicating that the housing and cell pack effectively absorb impact energy, preventing direct loading on the cells. As velocity increases (Figure 20(b)), housing deformation rises to 6.86 mm, while the cell pack displaces 5.74 mm, reducing the gap to 0.65 mm. The first cell now exhibits a displacement of 1.10 mm, whereas the remaining four cells remain within 0.46–0.49 mm. While load transmission increases, there is still no direct impact loading on the cells. At 20 m/s (Figure 20(c)), the housing deformation reaches 7.78 mm and the cell pack displaces 6.71 mm, now making contact with the first cell, which shows localized indentation of 2.71 mm. The remaining cells deform between 0.65 and 0.69 mm, indicating the onset of direct load transfer to the lowest cell in the stack. At the highest simulated velocity (Figure 20(d)), the housing's displacement increases to 11.20 mm, while the cell pack reaches 8.20 mm. The first cell is significantly deformed (4.17 mm) and the load propagates to the second cell, now showing 0.82 mm of displacement. The remaining three cells exhibit up to 0.79 mm of displacement, demonstrating load propagation through the cell stack. These results suggest that at impact velocities above 20 m/s, the housing's capacity to isolate the cell pack from high-energy impacts becomes compromised. This threshold is critical for defining design safety limits, as direct cell deformation increases the risk of mechanical failure and thermal runaway, posing significant safety concerns for battery systems in real-world crash scenarios.
Regarding the tiebreak contact behavior, the adhesive bonds between the cell pack and the housing, as well as between the housing and the lid, remain intact across all impact scenarios, indicating robust interfacial strength under dynamic loading. At an impact velocity of 10 m/s, the housing experiences a peak Von Mises stress of 114 MPa, localized around the impact area, while the majority of its surface remains within a lower stress range of 30–40 MPa. The cell pack reaches a maximum stress of 38 MPa, while the cell frames and individual pouch cells experience peak stresses of 18 MPa and 8.5 MPa, respectively. These values confirm that mechanical loading at this velocity is well within safe operational limits, with no threat to the structural integrity of internal components. At 15 m/s, the stress distribution remains similar, with the housing peaking at 120 MPa, and the cell pack increasing marginally to 40 MPa. The stress in the cell frames and cells remains unchanged (18 MPa and 8.5 MPa, respectively), reaffirming that impact energy is still being effectively absorbed without compromising internal structures. At 20 m/s, a noticeable increase in stress levels occurs across all components. The housing reaches 156 MPa, while the cell pack, frames, and cells reach 41 MPa, 28 MPa, and 12.5 MPa, respectively. Although the housing approaches its damage threshold, all other components remain below critical stress limits, suggesting continued structural integrity. Under the highest impact velocity, the housing experiences 160 MPa, with the cell pack at 45 MPa, frames at 37 MPa, and cells at 16 MPa. At this level, localized damage in the housing is likely, but the internal components continue to operate within safe mechanical thresholds, showing no signs of failure. Overall, the stress analysis confirms that even under high-impact loading, the internal battery components remain mechanically protected, validating the efficacy of the housing design up to the maximum tested velocity.
Regarding the permanent deformation of the housing and cell pack, the lowest impact velocity resulted in only minor indentation, insufficient to be captured accurately in post-processing in terms of x and y coordinates. Table 10 summarizes the residual deformation along the z-axis for each parametric scenario. At impact velocities of 10 and 15 m/s, the residual deformation remains below 1 mm, indicating a resilient structural response at moderate energy levels. However, with further increase in velocity, the indentation depth nearly doubles, marking a threshold beyond which significant permanent deformation occurs, particularly noticeable above 20 m/s. In most cases, the cell pack exhibits greater permanent deformation than the housing. This trend is attributed to differences in material stiffness and the application of a coarser mesh in the modeling of the cell pack, which may reduce stiffness numerically and increase localized compliance. Figure 21(a) illustrates the dent profiles for both components at 15 m/s, showing spherical indentations consistent with the impactor geometry. The dent dimensions are comparable for both the housing and cell pack, ranging between 9 and 10 mm. At 20 m/s, Figure 21(b) shows a similarly symmetrical dent on the housing, while the cell pack exhibits a narrower width along the x-axis, indicating a more concentrated deformation. At the highest tested impact velocity, Figure 21(c) depicts more pronounced dents on both the housing and the cell pack. Despite the increased depth, the overall geometric characteristics of the deformations remain consistent with those observed at lower velocities, reflecting the repeatable nature of the response in this configuration.
4.2.2. Crash (Pole Impact)
Regarding the numerical results of the pole impact analysis, Figure 22 presents the progressive evolution of damage in both the battery housing and the cell pack as impact velocity increases. At the lowest impact energy level, illustrated in Figure 22(a), significant plastic deformation is observed on the left side of the housing—the impact site. The housing exhibits a maximum displacement of 54.10 mm in the impact direction. The lid undergoes inward and upward folding, indicating a localized buckling response and confirming permanent structural deformation. Despite this, the remainder of the housing retains its original shape, and the cell pack remains undeformed, maintaining its rectangular geometry. This demonstrates the housing’s effectiveness in isolating and protecting the internal components under low-energy impact. At the intermediate velocity scenario (Figure 22(b)), the housing undergoes more pronounced deformation, localized primarily at the impact zone. The left wall buckles inward with a displacement of 76.61 mm, and the lid experiences additional bending. This reflects the housing’s continued function as an energy-absorbing structure. However, the deformation now approaches the cell pack, which is displaced upwards by 33.60 mm in the z-direction. This vertical displacement raises concerns about the operational integrity of the pack, as the internal chemical components within the pouch cells could potentially mix, increasing the risk of short-circuit. This case indicates the onset of a safety threshold, beyond which the housing can no longer fully isolate the cells from high-energy impact effects. At the highest impact velocity (Figure 22(c)), the housing experiences severe and widespread deformation. The left wall is crushed and bent inwards, reaching a displacement of 79 mm, while the lid undergoes extreme buckling and displacement, signifying a critical loss of structural integrity. The cell pack also deforms substantially, especially on the left side, aligning with the intrusion zone of the housing. This implies that mechanical damage to individual cells has likely occurred, posing a risk of internal short-circuiting and potentially triggering thermal runaway. This scenario highlights the limit of the housing’s energy absorption capacity; although it absorbs substantial energy through plastic deformation, it fails to prevent internal component compromise under extreme loading.
Regarding tiebreak contact behavior, the bond between the left support legs and the base plate fails under loading, permitting the housing to displace in the z-direction. In the crash simulations at 10 and 12.5 m/s, the adhesive bond between the lid and the housing remains largely intact, aside from the immediate impact zone. Importantly, no debonding occurs between the cell pack and the housing in any of the three simulated impact cases. Figure 23 focuses on the most severe scenario: the 15 m/s pole impact. In this case, the housing undergoes substantial buckling and folding, fulfilling its role of energy absorption by sacrificing structural integrity to shield the internal components. However, the cell pack itself also experiences significant deformation, indicative of a high-energy impact, where progressive structural failure contributes to dissipating energy and preventing direct intrusion or catastrophic damage to the protected cells. Notably, the adhesive bond between the lid and the housing fails extensively, with a debonded length of 189.05 mm. While this separation allows the housing to deform more freely, enhancing energy absorption, it also alters the internal load paths and may influence the degree of cell pack protection. The debonding process is progressive, enabling relative movement between the lid and the housing, which contributes to the dissipation of impact energy, but could also reduce the enclosure’s mechanical containment performance under extreme conditions.
5. Conclusions
This study investigates the impact performance of an innovative SMC-based thermoplastic battery housing under both ground and frontal pole impact scenarios. The mechanical behavior of the composite material was experimentally characterized through tensile, compressive, shear, and three-point bending tests. Drop tower impact experiments were conducted on flat SMC plates and the housing itself at 7.5 J and 30 J, providing the foundation for validating the corresponding finite element models.
Numerical simulations, developed using the LS-DYNA material model MAT_162, demonstrated strong correlation with experimental results, accurately predicting peak impact forces, global stiffness, and energy absorption. While the simulations offered smoother representations of localized failure phenomena—such as matrix cracking and fiber fracture—they still reliably captured key metrics including displacement, indentation depth, and overall damage extent.
Parametric analyses of ground impacts revealed a progressive failure mechanism: at low velocities, both the housing and cell pack provided effective isolation and protection for the battery cells. However, as velocity increased, the cell pack experienced greater displacement, leading to localized deformation in the first, and subsequently the second, cell layer—highlighting a critical velocity threshold beyond which internal damage becomes probable.
In frontal pole impact simulations, increasing impact energy resulted in pronounced deformation of the housing and lid. Although the enclosure initially dissipated energy effectively, its protective function diminished at higher energy levels, allowing mechanical intrusion into the cell pack. This observed degradation in performance under high-severity conditions provides valuable insights into the structural limits of the system.
From a safety standpoint, the structural integrity of the housing is correlated to battery safety, since deformation of the pouch cells may cause separator penetration and lead to internal short-circuit that can potentially trigger thermal runaway. The parametric studies indicate that up to 15 m/s ground impact and 10 m/s pole impact, the Elium SMC housing successfully prevents contact between the impactor and the cell pack, ensuring that the cells remain mechanically isolated, maintaining their electrochemical safety. However, beyond these thresholds, the first pouch cells in the stack begin to deform. While the deformation observed in this study is not sufficient to cause immediate rupture, it highlights a critical transition point for defining safe operating conditions for battery housing design.
In summary, the thermoplastic battery housing demonstrates robust impact resistance within defined energy thresholds. The validated numerical models offer a reliable framework for structural evaluation and future design optimization. Enhancing the predictive fidelity of these models, particularly regarding composite failure mechanisms and thermal effects, will support the development of safer and more resilient battery systems for transport applications.
Author Contributions
Aikaterini Fragiadaki: Data curation, Formal analysis, Investigation, Software, Validation, Writing – original draft. Konstantinos Tserpes: Conceptualization, Funding acquisition, Methodology, Project administration, Resources, Supervision, Visualization, Writing – review and editing. All authors have read and agreed to the published version of the manuscript.
Funding
This work was financially supported by the EC-funded HORIZON Project “TEMPEST” -Project 101103681-. [HORIZON-CL5-2022-D2-01-05 — Next generation technologies for High-performance and safe-by-design battery systems for transport and mobile applications (Batteries Partnership)].
Data Availability Statement
We encourage all authors of articles published in MDPI journals to share their research data. In this section, please provide details regarding where data supporting reported results can be found, including links to publicly archived datasets analyzed or generated during the study. Where no new data were created, or where data is unavailable due to privacy or ethical restrictions, a statement is still required. Suggested Data Availability Statements are available in section “MDPI Research Data Policies” at https://www.mdpi.com/ethics.
Acknowledgments
All authors acknowledge support from Fraunhofer ICT, who provided the material samples and the CAD file of the housing to perform the mechanical tests and simulations.
Conflicts of Interest
The authors declare no conflicts of interest.
References
- Um, H.-J.; Hwang, Y.-T.; Bae, I.-J.; Kim, H.-S. Design and Manufacture of Thermoplastic Carbon Fiber/Polyethylene Terephthalate Composites Underbody Shield to Protect the Lithium-Ion Batteries for Electric Mobility from Ground Impact. Composites Part B: Engineering 2022, 238, 109892. [Google Scholar] [CrossRef]
- Höhne, C.-C.; Blaess, P.; Ilinzeer, S.; Griesbaum, P. New Approach for Electric Vehicle Composite Battery Housings: Electromagnetic Shielding and Flame Retardancy of PUR/UP-Based Sheet Moulding Compound. Composites Part A: Applied Science and Manufacturing 2023, 167, 107404. [Google Scholar] [CrossRef]
- Kulkarni, S.S.; Hale, F.; Taufique, M.F.N.; Soulami, A.; Devanathan, R. Investigation of Crashworthiness of Carbon Fiber-Based Electric Vehicle Battery Enclosure Using Finite Element Analysis. Applied Composite Materials 2023, 30, 1689–1715. [Google Scholar] [CrossRef]
- Revolutionizing Aircraft Materials and Processes; Pantelakis, S., Tserpes, K., Eds.; Springer International Publishing: Cham, 2020; ISBN 978-3-030-35345-2.
- Toro, S.A.; González, C.; Fernández-Blázquez, J.P.; Ridruejo, A. Fabrication and Mechanical Properties of a High-Performance PEEK-PEI Hybrid Multilayered Thermoplastic Matrix Composite Reinforced with Carbon Fiber. Composites Part A: Applied Science and Manufacturing 2024, 185, 108308. [Google Scholar] [CrossRef]
- Kazemi, M.E.; Shanmugam, L.; Lu, D.; Wang, X.; Wang, B.; Yang, J. Mechanical Properties and Failure Modes of Hybrid Fiber Reinforced Polymer Composites with a Novel Liquid Thermoplastic Resin, Elium®. Composites Part A: Applied Science and Manufacturing 2019, 125, 105523. [Google Scholar] [CrossRef]
- Kazemi, M.E.; Shanmugam, L.; Chen, S.; Yang, L.; Yang, J. Novel Thermoplastic Fiber Metal Laminates Manufactured with an Innovative Acrylic Resin at Room Temperature. Composites Part A: Applied Science and Manufacturing 2020, 138, 106043. [Google Scholar] [CrossRef]
- Sun, Q.; Liu, H.; Wang, Z.; Meng, Y.; Xu, C.; Wen, Y.; Wu, Q. Investigation on Thermal Runaway Hazards of Cylindrical and Pouch Lithium-Ion Batteries under Low Pressure of Cruise Altitude for Civil Aircraft. Batteries 2024, 10, 298. [Google Scholar] [CrossRef]
- Höschele, P.; Ellersdorfer, C. Implementing Reversible Swelling into the Numerical Model of a Lithium-Ion Pouch Cell for Short Circuit Prediction. Batteries 2023, 9, 417. [Google Scholar] [CrossRef]
- Shaikh, S.A.; Taufique, M.F.N.; Balusu, K.; Kulkarni, S.S.; Hale, F.; Oleson, J.; Devanathan, R.; Soulami, A. Finite Element Analysis and Machine Learning Guided Design of Carbon Fiber Organosheet-Based Battery Enclosures for Crashworthiness. Applied Composite Materials 2024, 31, 1475–1493. [Google Scholar] [CrossRef]
- Avdeev, I.; Gilaki, M. Structural Analysis and Experimental Characterization of Cylindrical Lithium-Ion Battery Cells Subject to Lateral Impact. Journal of Power Sources 2014, 271, 382–391. [Google Scholar] [CrossRef]
- Pheysey, J.; Del Cuvillo, R.; Naya, F.; Pernas-Sanchez, J.; De Cola, F.; Martinez-Hergueta, F. Low-Velocity Impact Response of Hybrid Sheet Moulding Compound Composite Laminates. Composites Part A: Applied Science and Manufacturing 2025, 188, 108527. [Google Scholar] [CrossRef]
- Xu, D.; Pan, Y.; Zhang, X.; Dai, W.; Liu, B.; Shuai, Q. Data-Driven Modelling and Evaluation of a Battery-Pack System’s Mechanical Safety against Bottom Cone Impact. Energy 2024, 290, 130145. [Google Scholar] [CrossRef]
- Dai, Z.; Miao, Q.; Wu, D. Data Simulation of the Impact of Ball Strikes on the Bottom of Electric Vehicle Battery Packs Based on Finite Element Analysis. Thermal Science and Engineering Progress 2024, 53, 102757. [Google Scholar] [CrossRef]
- Fragiadaki, A.; Tserpes, K. Numerical Simulation of Dynamic Response of a Composite Battery Housing for Transport Applications. In Proceedings of the EASN 2024; MDPI, March 10 2025; p. 10.
- Li, R.; Pan, Y.; Zhang, X.; Dai, W.; Liu, B.; Li, J. Mechanical Safety Prediction of a Battery-Pack System under Low Speed Frontal Impact via Machine Learning. Engineering Analysis with Boundary Elements 2024, 160, 65–75. [Google Scholar] [CrossRef]
- Chen, Y.; Santhanagopalan, S.; Babu, V.; Ding, Y. Dynamic Mechanical Behavior of Lithium-Ion Pouch Cells Subjected to High-Velocity Impact. Composite Structures 2019, 218, 50–59. [Google Scholar] [CrossRef]
- Yin, H.; Ma, S.; Li, H.; Wen, G.; Santhanagopalan, S.; Zhang, C. Modeling Strategy for Progressive Failure Prediction in Lithium-Ion Batteries under Mechanical Abuse. eTransportation 2021, 7, 100098. [Google Scholar] [CrossRef]
- Xu, J.; Liu, B.; Wang, X.; Hu, D. Computational Model of 18650 Lithium-Ion Battery with Coupled Strain Rate and SOC Dependencies. Applied Energy 2016, 172, 180–189. [Google Scholar] [CrossRef]
- Wang, W.; Xu, X.; Sun, S.; Wang, Y.; Zhang, T. Design and Uncertainty-Based Multidisciplinary Optimization of a 3D Star-Shaped Negative Poisson’s Ratio Structural Battery Pack. Energy 2024, 313, 133728. [Google Scholar] [CrossRef]
- Xia, Y.; Wierzbicki, T.; Sahraei, E.; Zhang, X. Damage of Cells and Battery Packs Due to Ground Impact. Journal of Power Sources 2014, 267, 78–97. [Google Scholar] [CrossRef]
- Akbari, E.; Voyiadjis, G.Z. Stress and Strain Characterization for Evaluating Mechanical Safety of Lithium-Ion Pouch Batteries under Static and Dynamic Loadings. Batteries 2024, 10, 309. [Google Scholar] [CrossRef]
- Cardoso-Palomares, M.A.; Paredes-Rojas, J.C.; Flores-Campos, J.A.; Oropeza-Osornio, A.; Torres-SanMiguel, C.R. Impact Testing of Aging Li-Ion Batteries from Light Electric Vehicles (LEVs). Batteries 2025, 11, 263. [Google Scholar] [CrossRef]
- Santosa, S.P.; Nirmala, T. Numerical and Experimental Validation of Fiber Metal Laminate Structure for Lithium-Ion Battery Protection Subjected to High-Velocity Impact Loading. Composite Structures 2024, 332, 117924. [Google Scholar] [CrossRef]
- Scurtu, L.; Szabo, I.; Mariasiu, F.; Moldovanu, D.; Mihali, L.; Jurco, A. Numerical Analysis of the Influence of Mechanical Stress on the Battery Pack’s Housing of an Electric Vehicle. IOP Conference Series: Materials Science and Engineering 2019, 568, 012054. [Google Scholar] [CrossRef]
- Wang, S.; Guo, S.; Li, R.; Hu, Z.; Leng, Q. On Crashworthiness Design of Hybrid Metal–Composite Battery-Pack Enclosure Structure. Mechanics of Advanced Materials and Structures 2025, 32, 2548–2559. [Google Scholar] [CrossRef]
- Weber, F.; Dötschel, V.; Steinmann, P.; Pfaller, S.; Ries, M. Evaluating the Impact of Filler Size and Filler Content on the Stiffness, Strength, and Toughness of Polymer Nanocomposites Using Coarse-Grained Molecular Dynamics. Engineering Fracture Mechanics 2024.
- Guo, A.; Tao, X.; Kong, H.; Zhou, X.; Wang, H.; Li, J.; Li, F.; Hu, Y. Effects of Aluminum Hydroxide on Mechanical, Water Resistance, and Thermal Properties of Starch-Based Fiber-Reinforced Composites with Foam Structures. Journal of Materials Research and Technology 2023, 23, 1570–1583. [Google Scholar] [CrossRef]
- Atiqah, A.; Ansari, M.N.M.; Kamal, M.S.S.; Jalar, A.; Afeefah, N.N.; Ismail, N. Effect of Alumina Trihydrate as Additive on the Mechanical Properties of Kenaf/Polyester Composite for Plastic Encapsulated Electronic Packaging Application. Journal of Materials Research and Technology 2020, 9, 12899–12906. [Google Scholar] [CrossRef]
- Pheysey, J.; De Cola, F.; Martinez-Hergueta, F. Short Fibre/Unidirectional Hybrid Thermoplastic Composites: Experimental Characterisation and Digital Analysis. Composites Part A: Applied Science and Manufacturing 2024, 181, 108121. [Google Scholar] [CrossRef]
- LSTC, “Volume I Keyword,” 1992.
- LSTC, “LS-DYNA ® KEYWORD USER’S MANUAL VOLUME II Material Models 1992.
- Birleanu, C.; Pustan, M.; Cioaza, M.; Bere, P.; Contiu, G.; Dudescu, M.C.; Filip, D. Tribo-Mechanical Investigation of Glass Fiber Reinforced Polymer Composites under Dry Conditions. Polymers 2023, 15, 2733. [Google Scholar] [CrossRef] [PubMed]
- Dogan, F.; Hadavinia, H.; Donchev, T.; Bhonge, P. Delamination of Impacted Composite Structures by Cohesive Zone Interface Elements and Tiebreak Contact. Open Engineering 2012, 2, 612–626. [Google Scholar] [CrossRef]
Figure 1.
Geometry and dimensions (in mm) of the housing (a) x-y plane, (b) y-z plane.
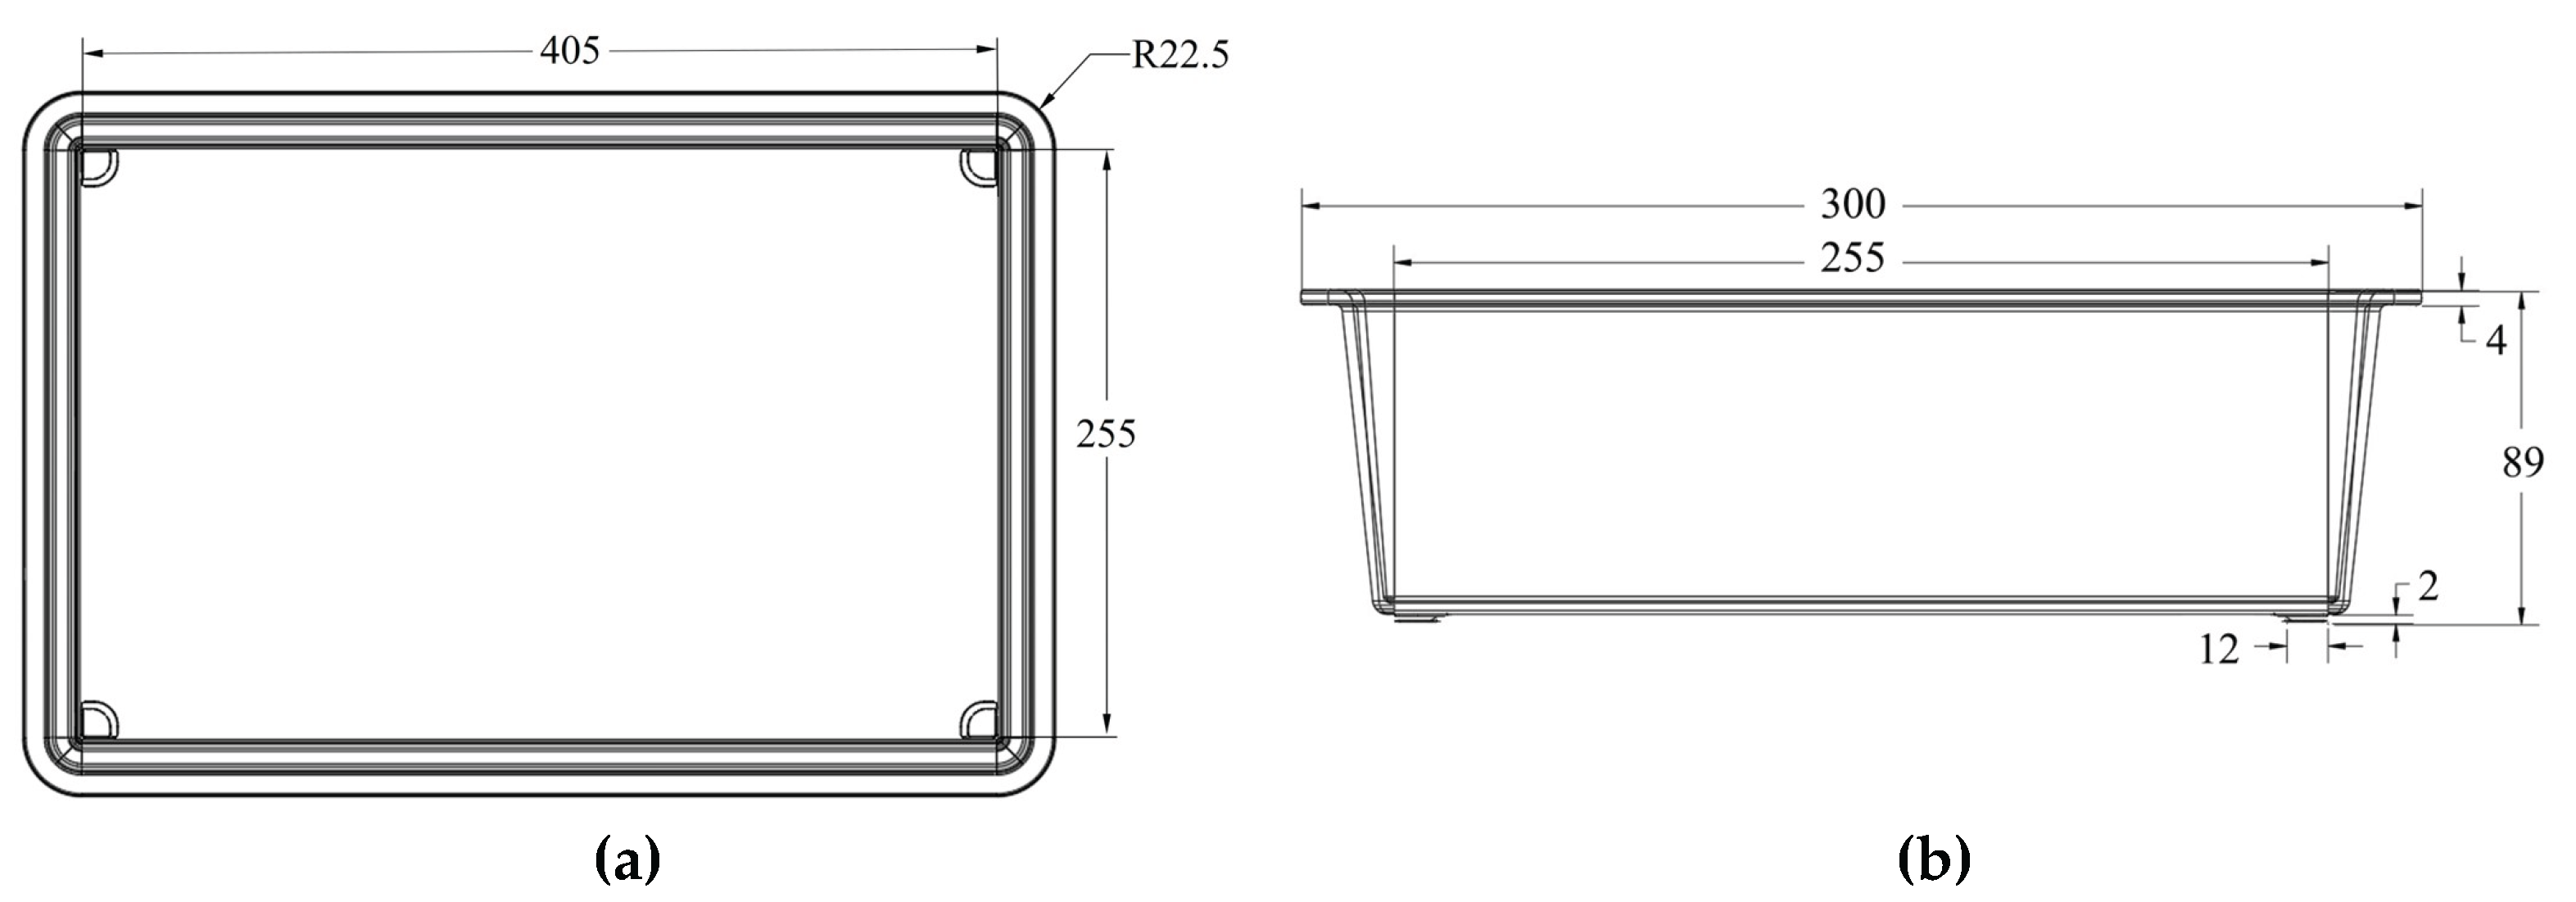
Figure 2.
Testing configuration and mounted specimens of (a) tension test, (b) compression test, (c) shear test, and (d) three-point bending test.
Figure 2.
Testing configuration and mounted specimens of (a) tension test, (b) compression test, (c) shear test, and (d) three-point bending test.
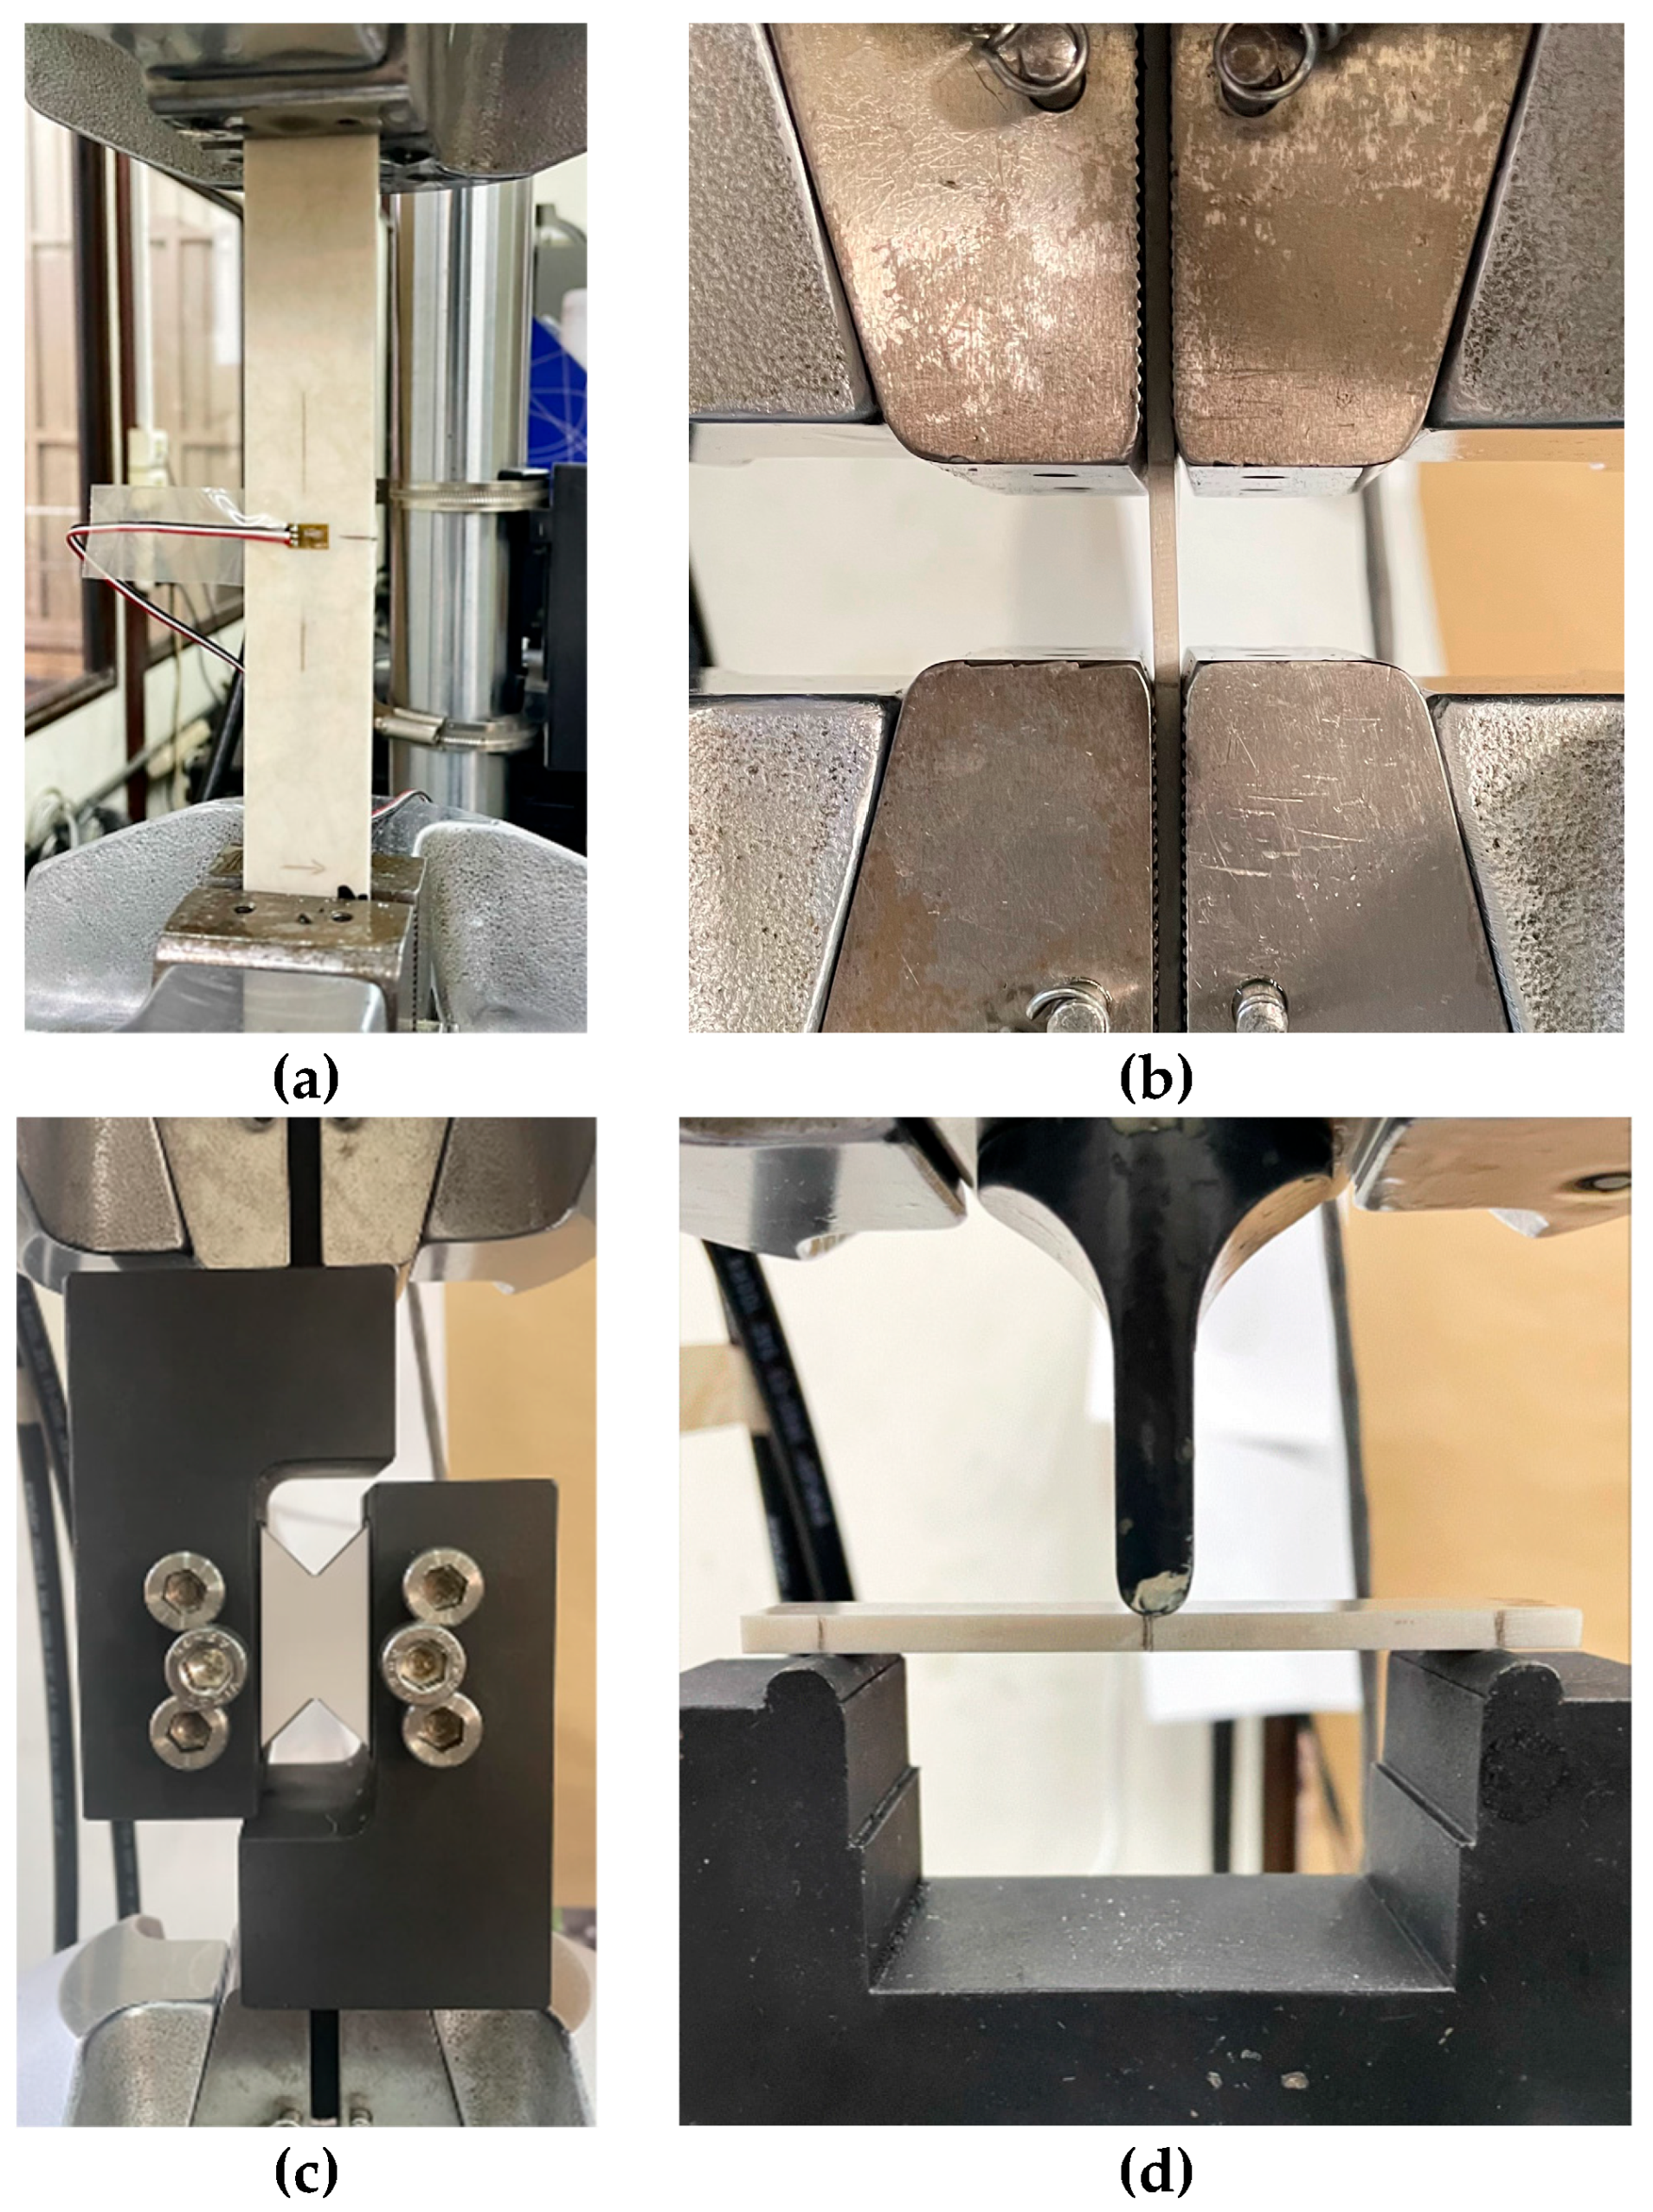
Figure 3.
Force - displacement curves of the SMC specimens subjected to (a) tension, (b) compression, (c) shear, d) three-point bending.
Figure 3.
Force - displacement curves of the SMC specimens subjected to (a) tension, (b) compression, (c) shear, d) three-point bending.
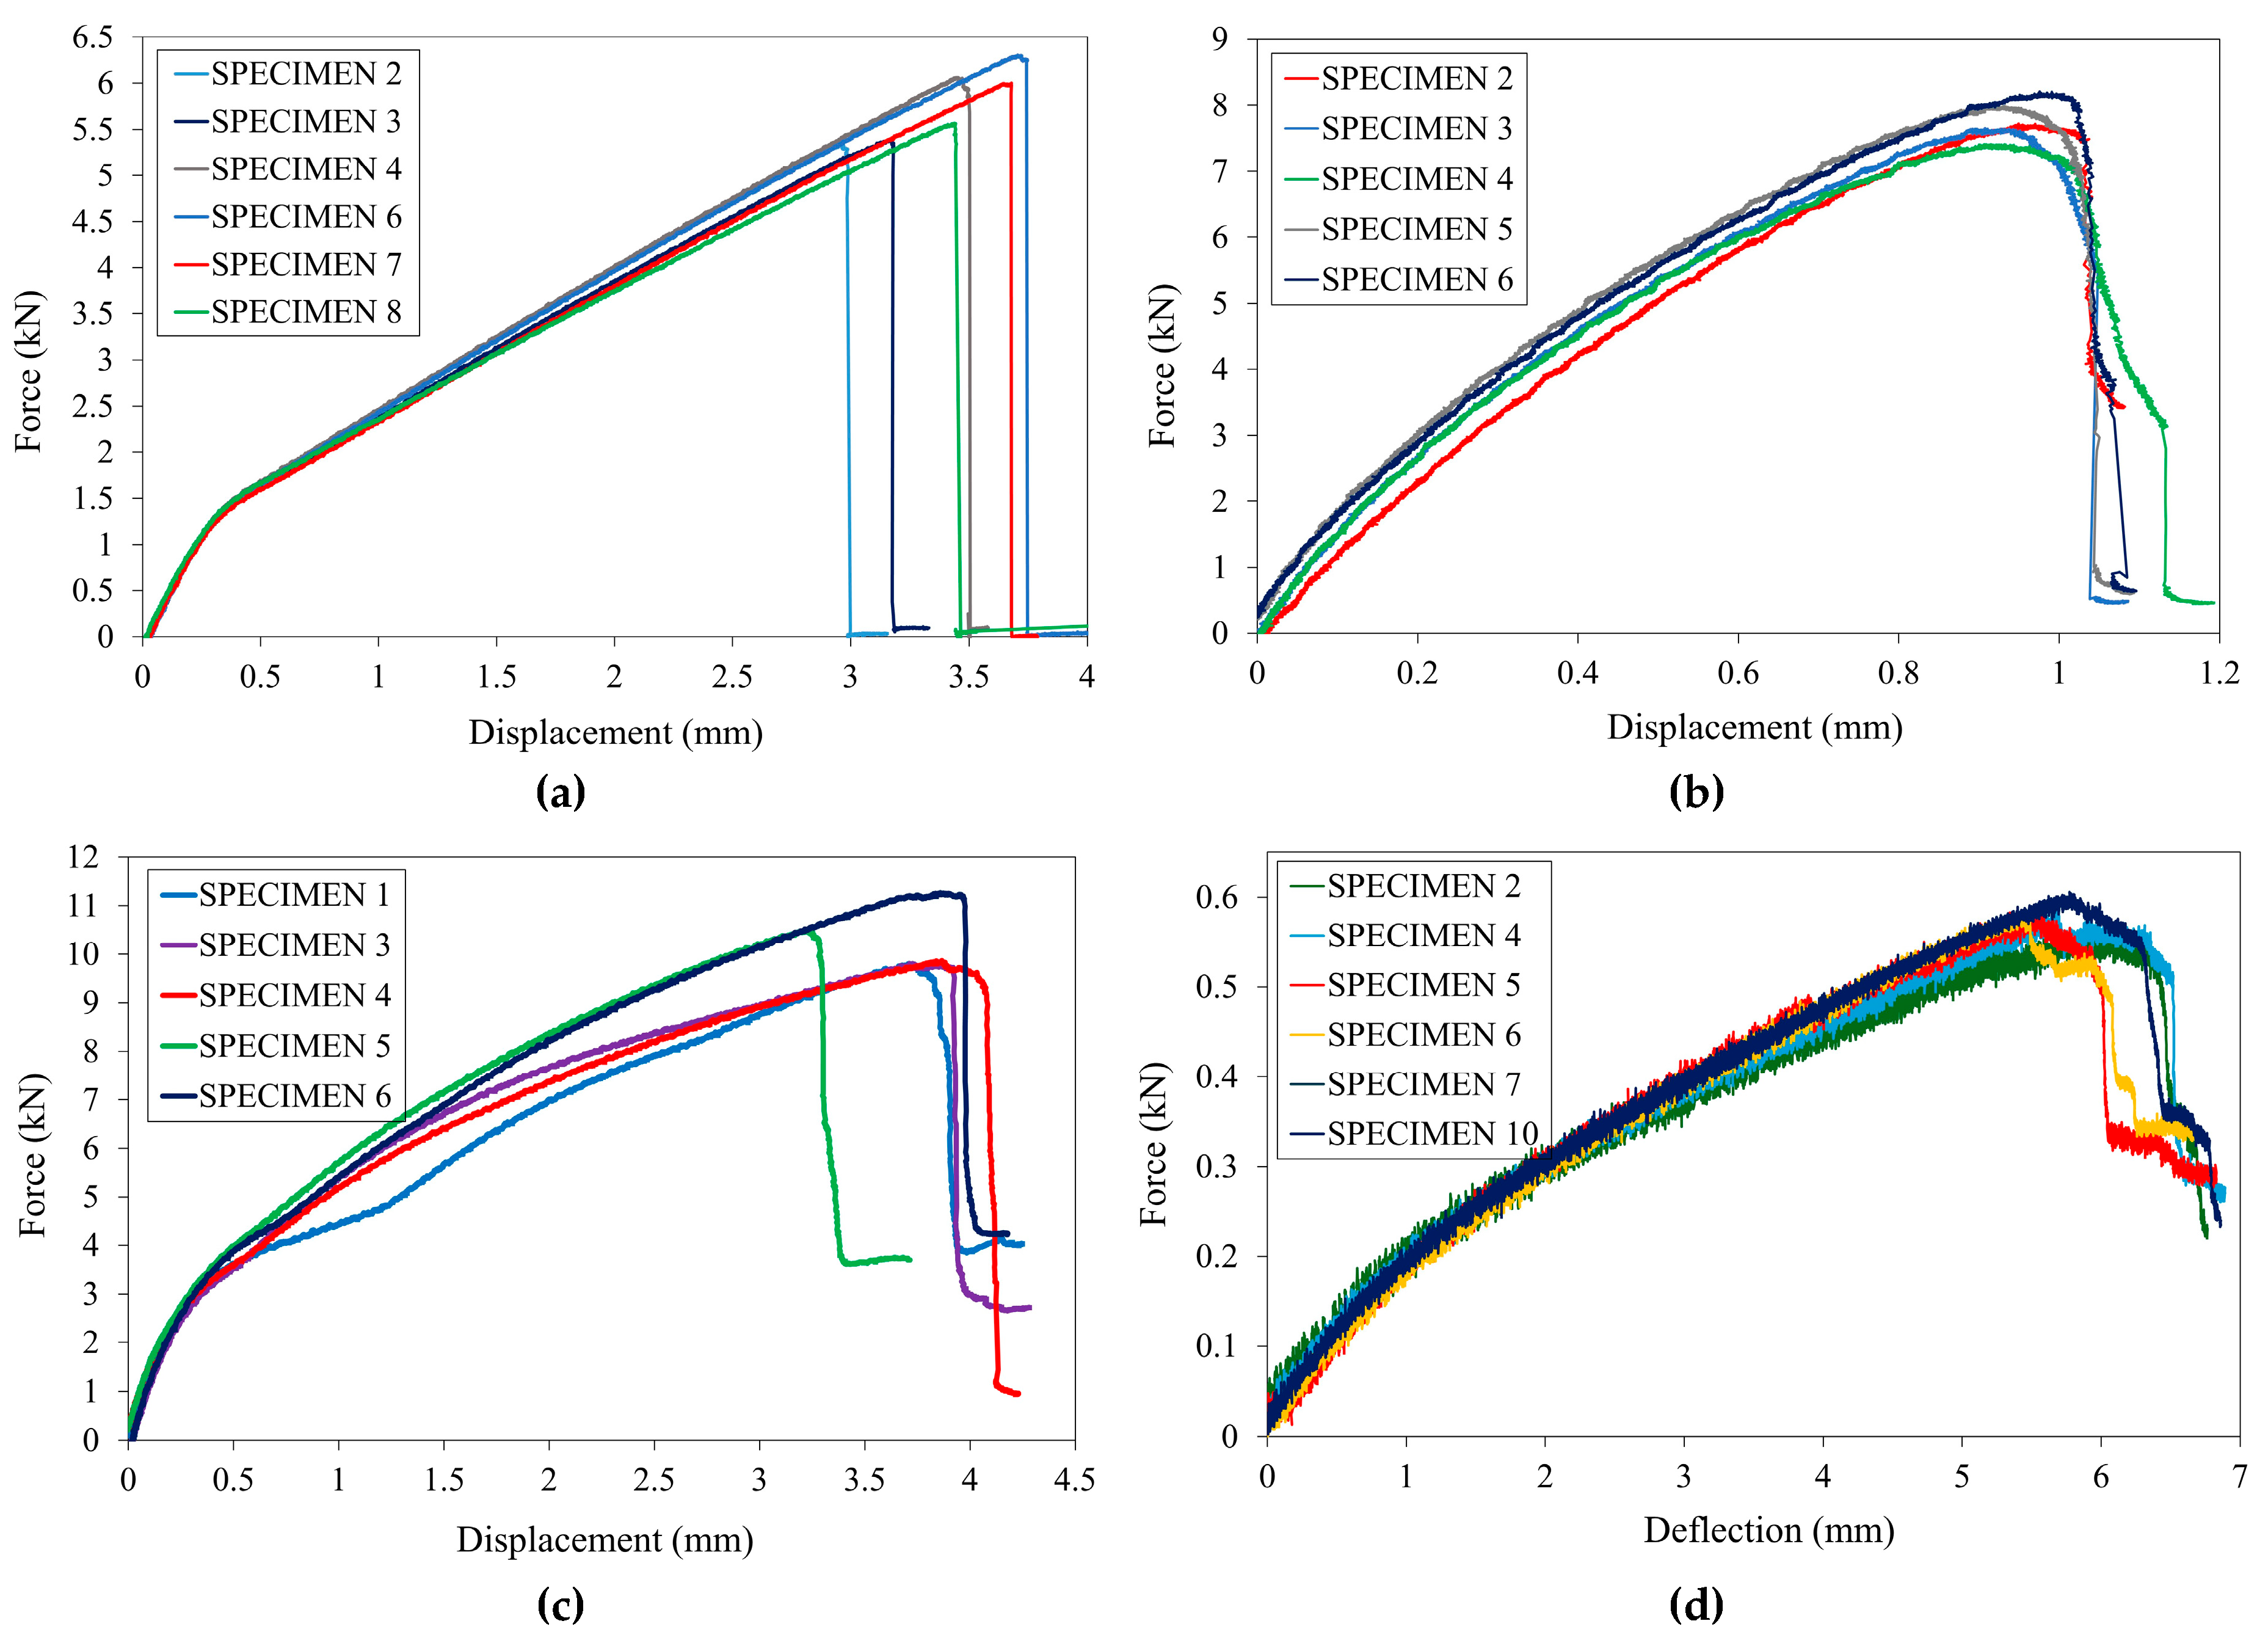
Figure 4.
Failure modes of the SMC specimens subjected to (a) tension, (b) compression, (c) shear, d) three-point bending.
Figure 4.
Failure modes of the SMC specimens subjected to (a) tension, (b) compression, (c) shear, d) three-point bending.
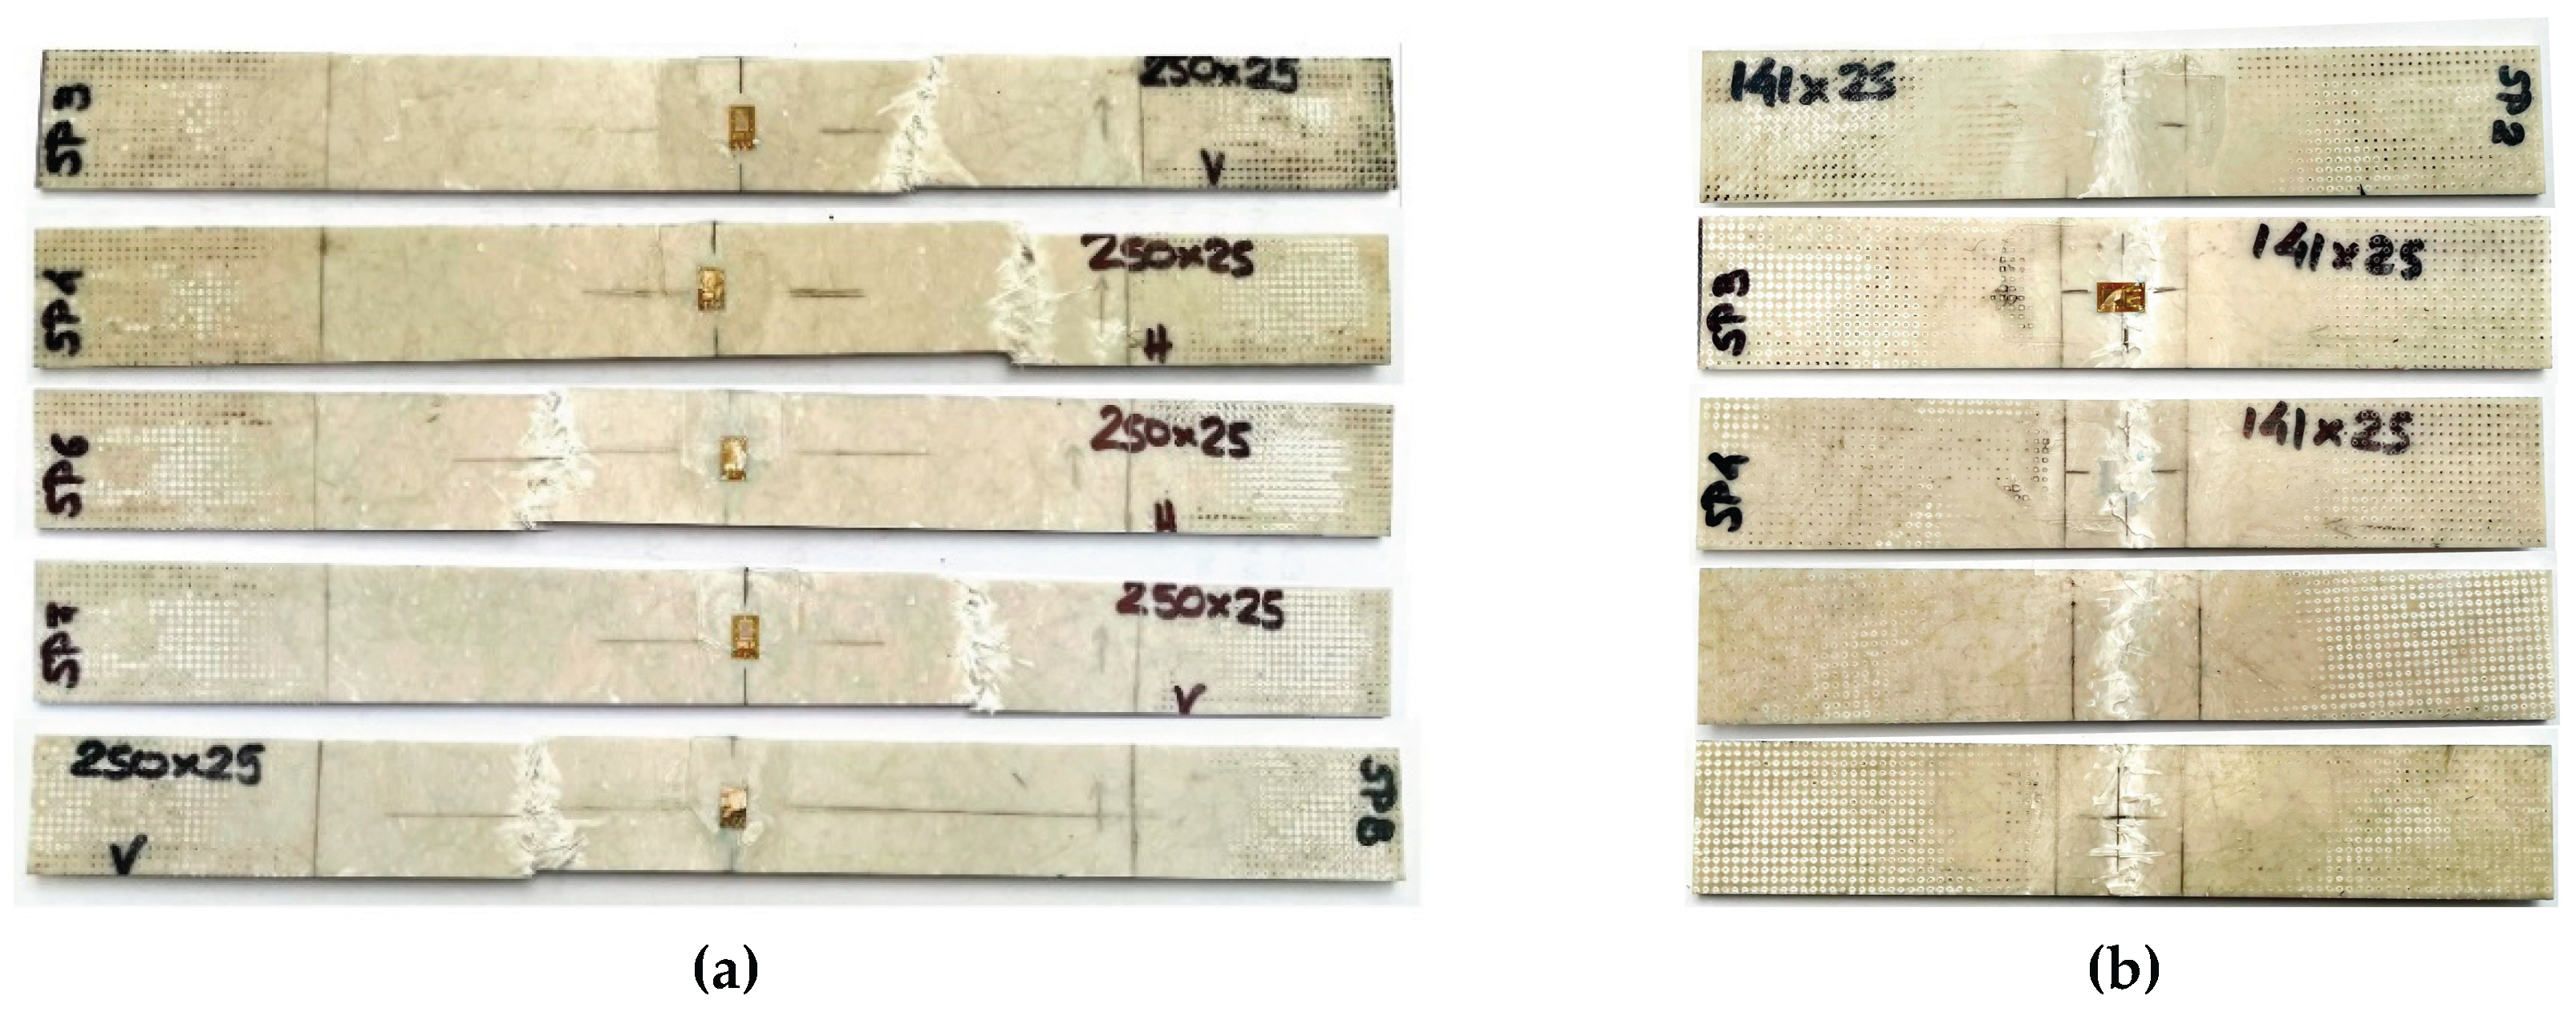
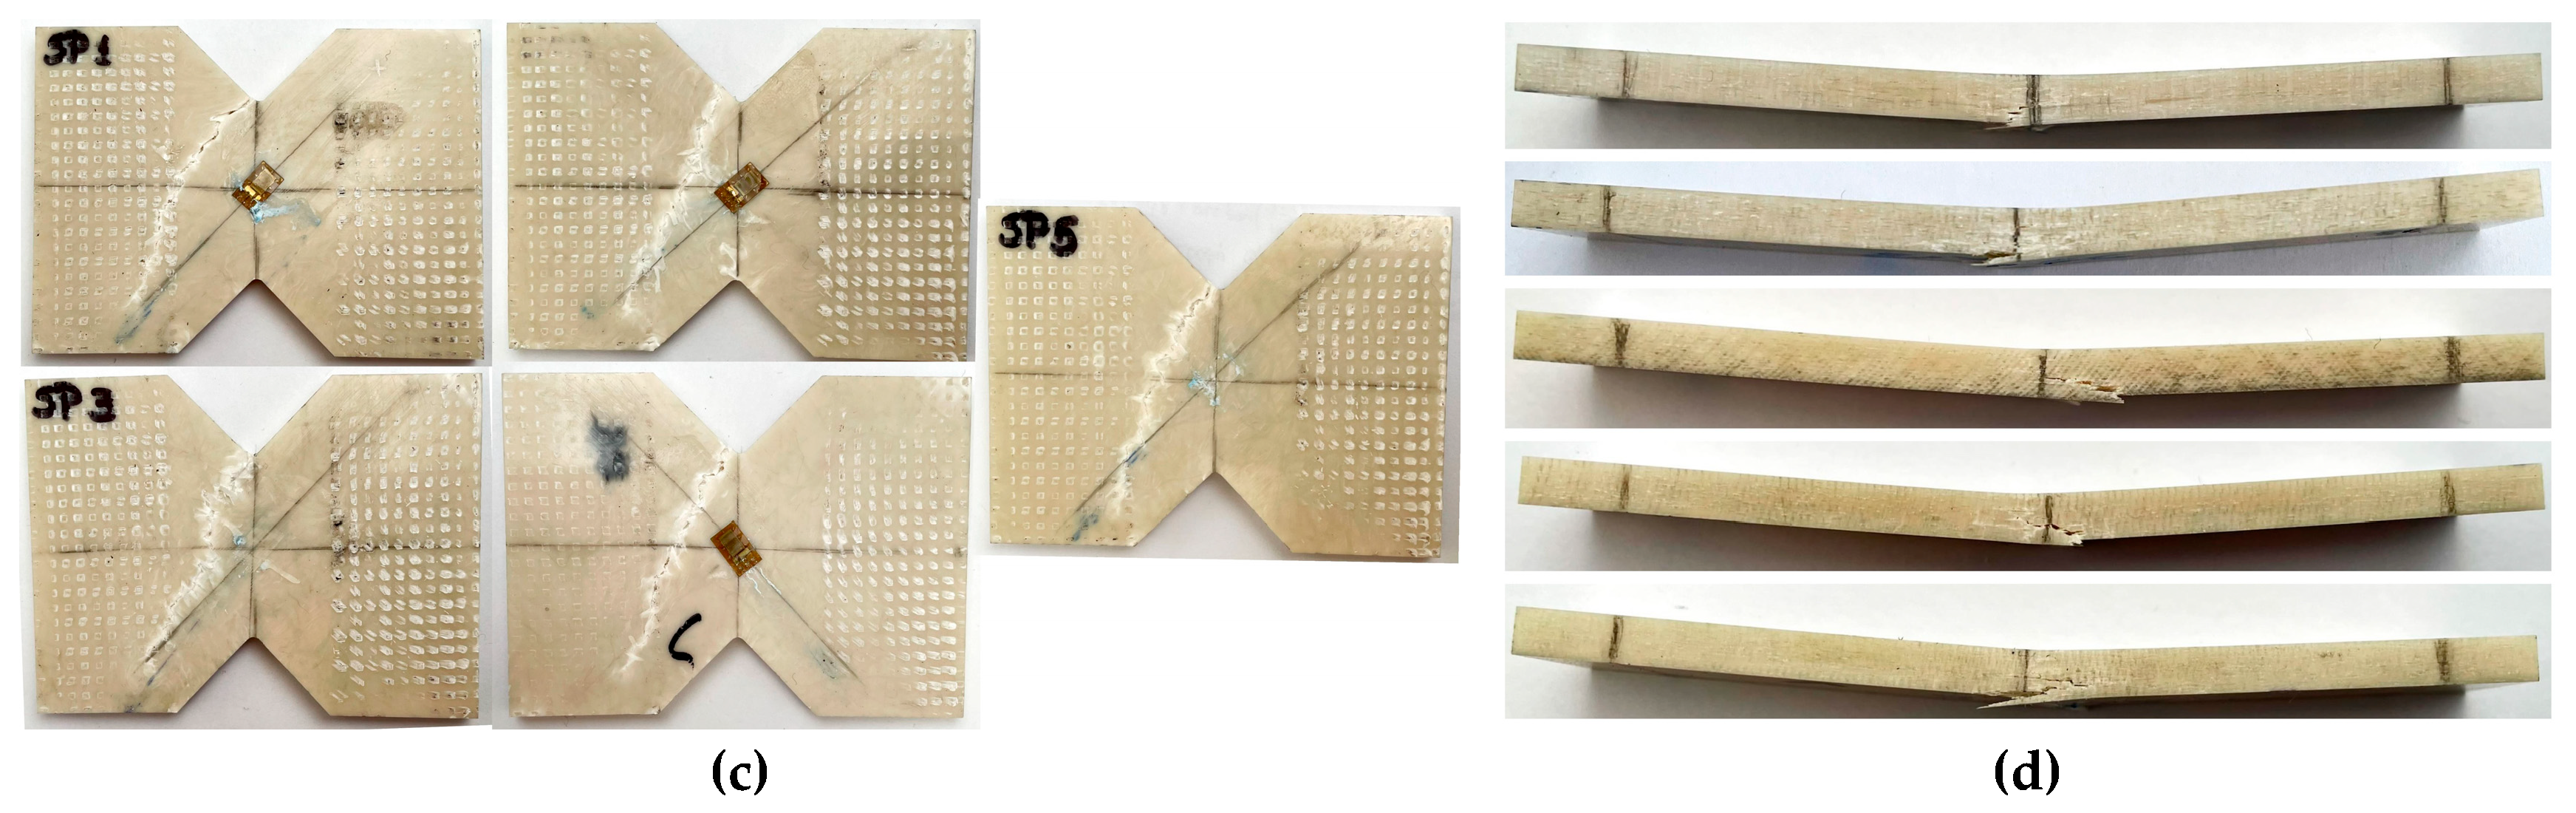
Figure 5.
Instron drop tower testing setup.
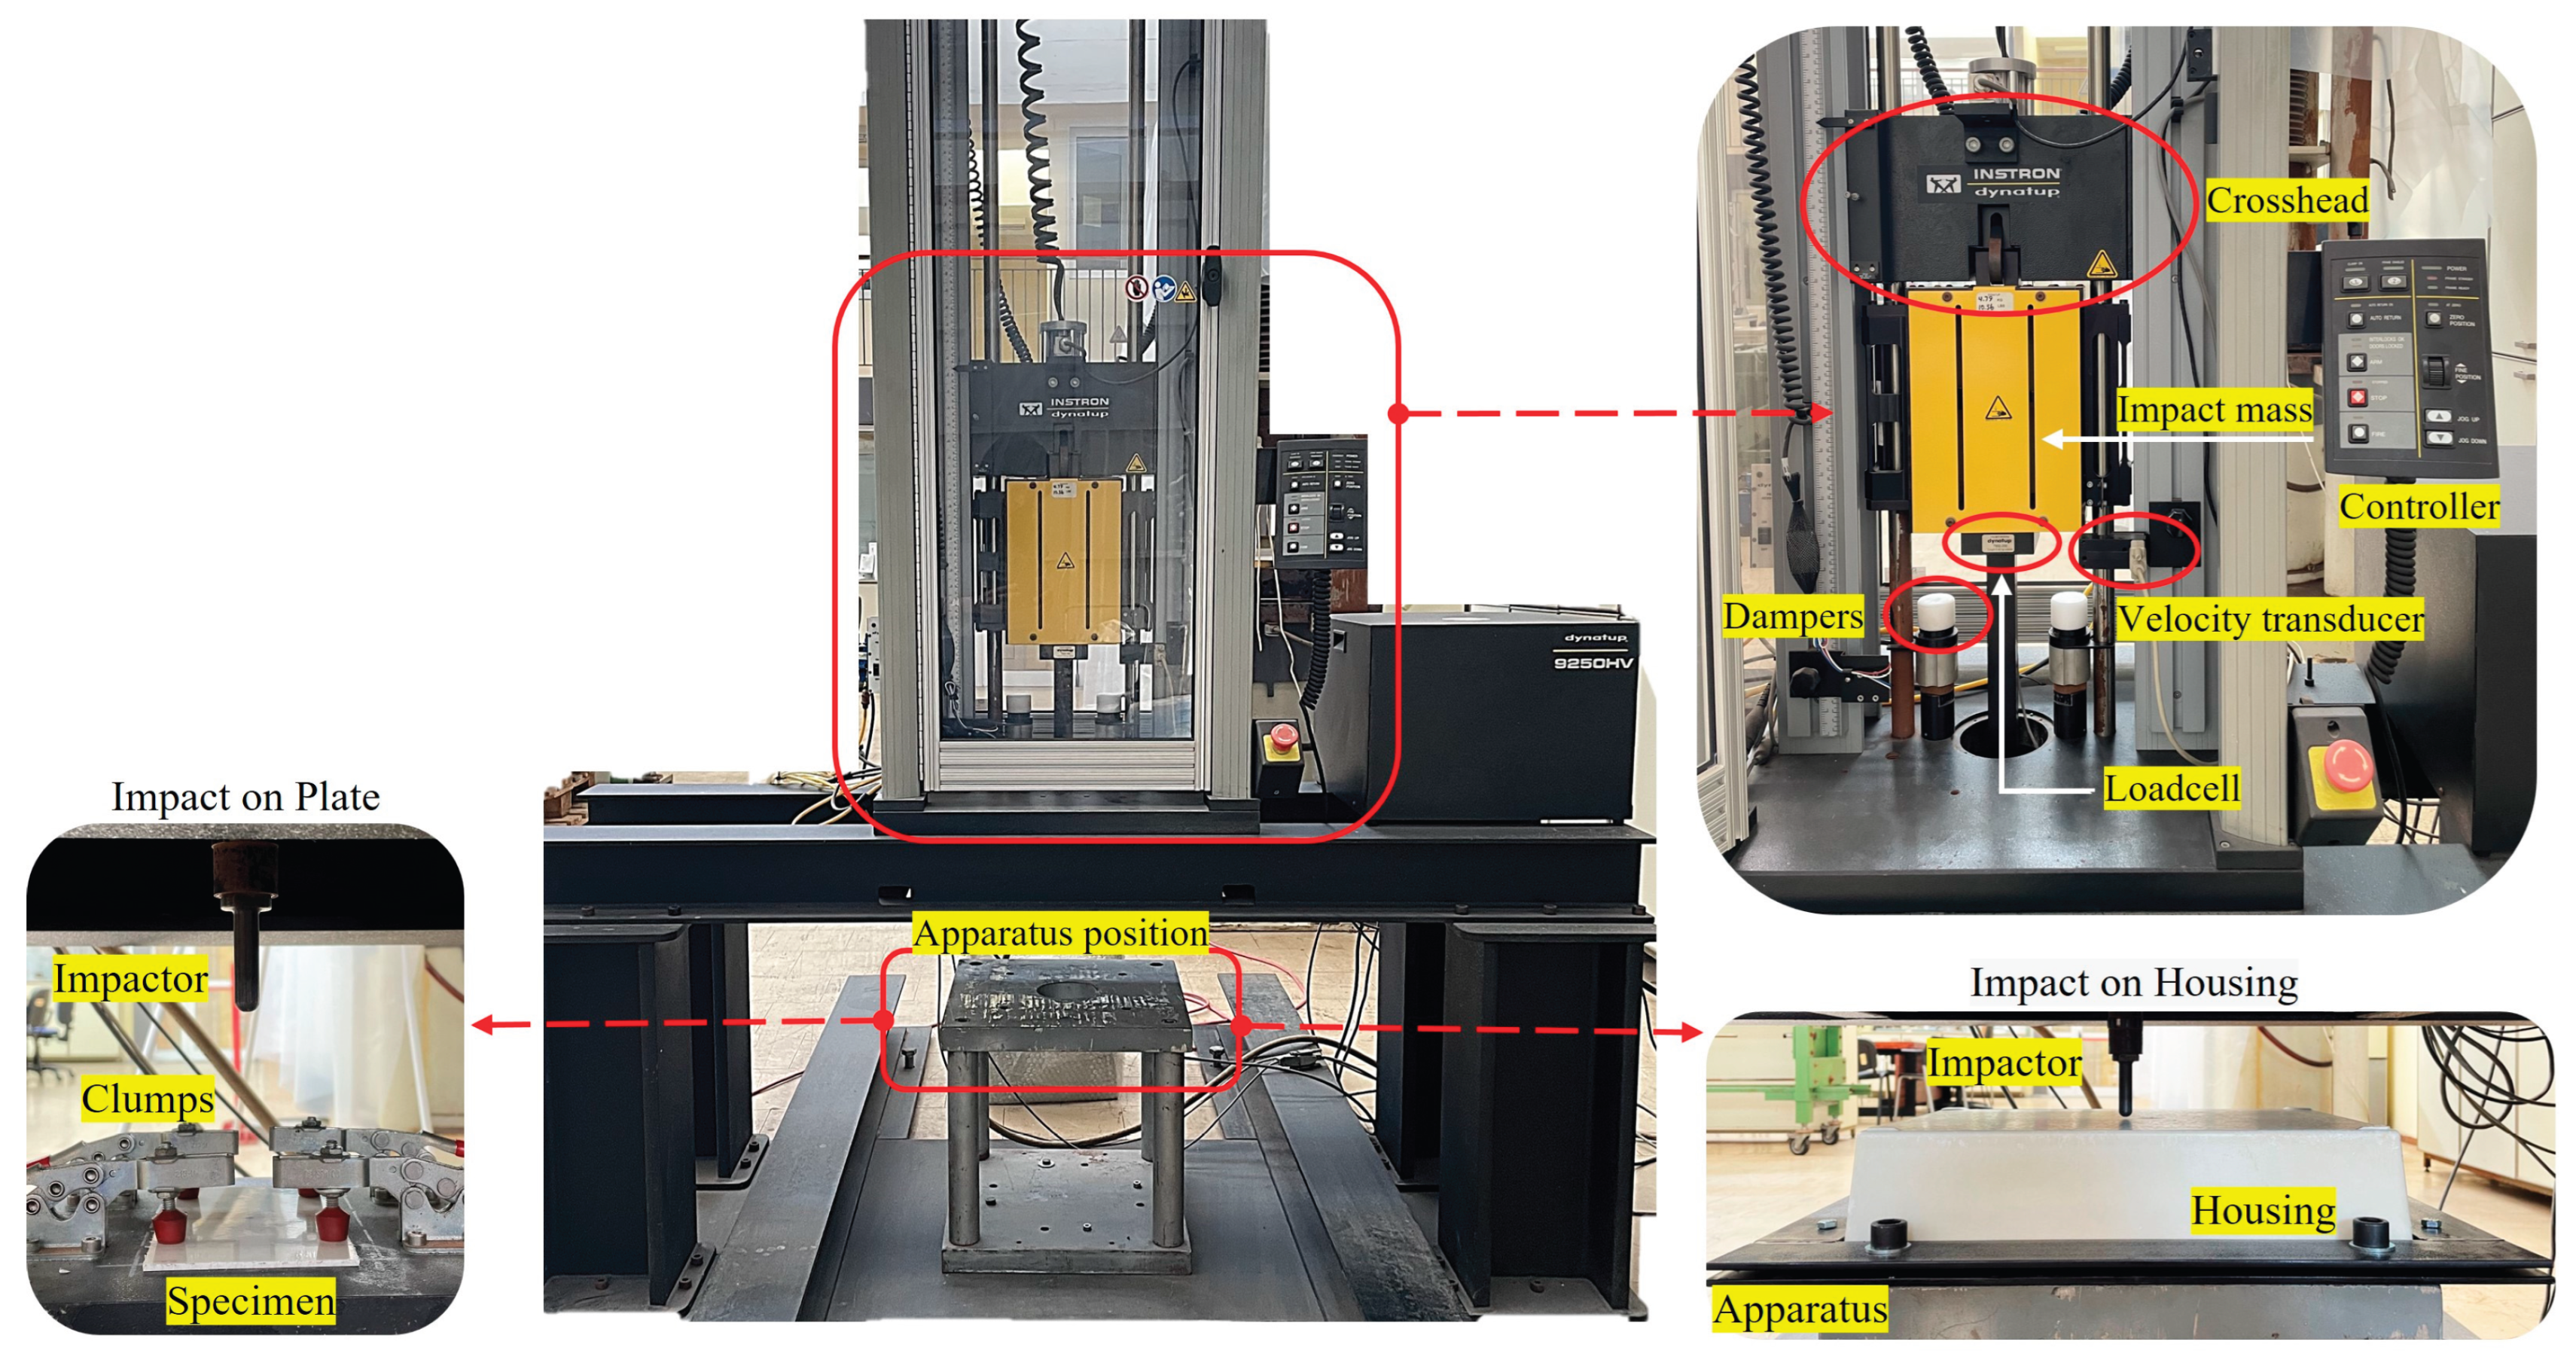
Figure 6.
Configuration of the drop tower model for the plate.
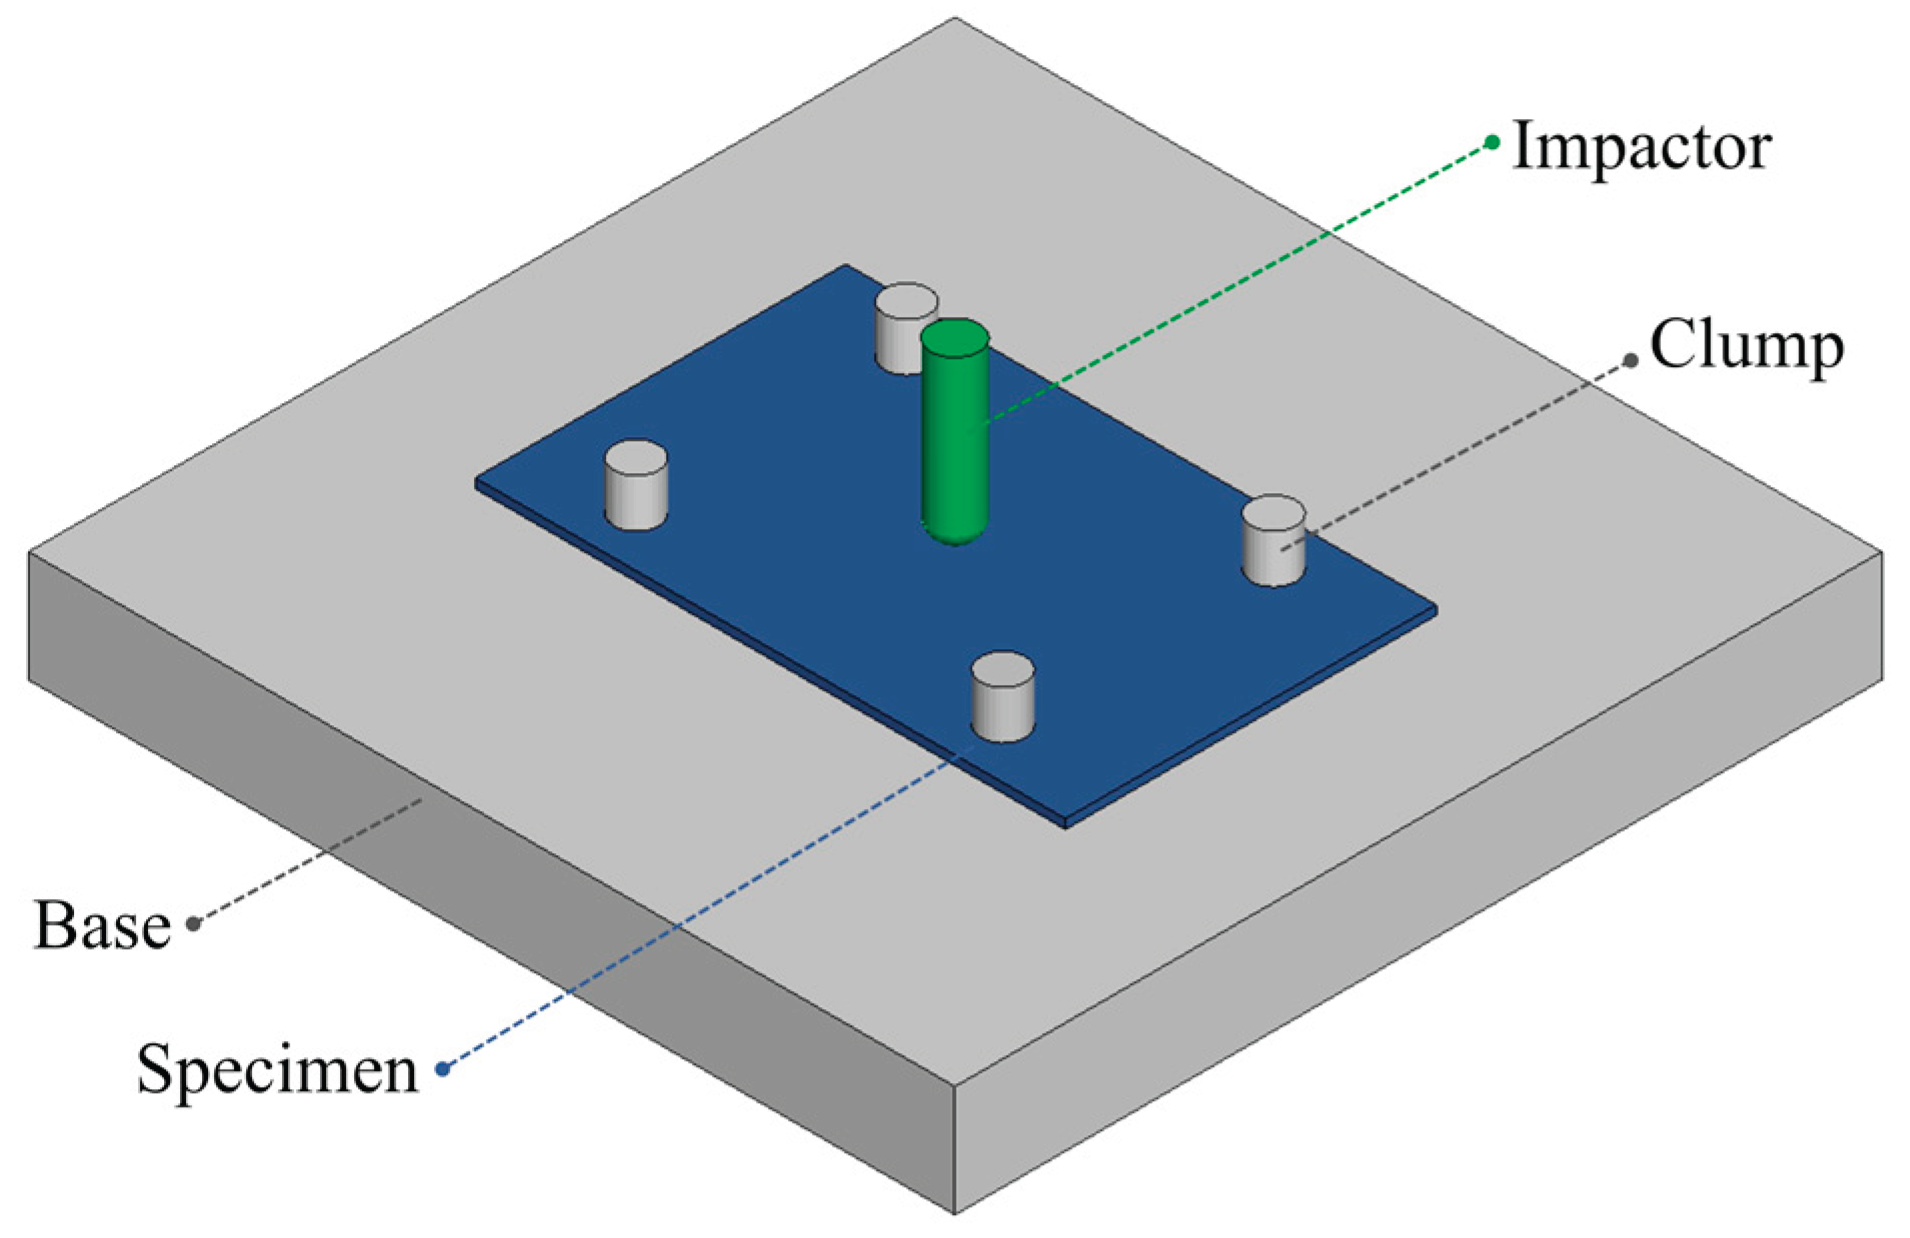
Figure 7.
FE mesh of the drop tower model components for the plate: (a) clump, (b) impactor, (c) plate, and (d) base.
Figure 7.
FE mesh of the drop tower model components for the plate: (a) clump, (b) impactor, (c) plate, and (d) base.
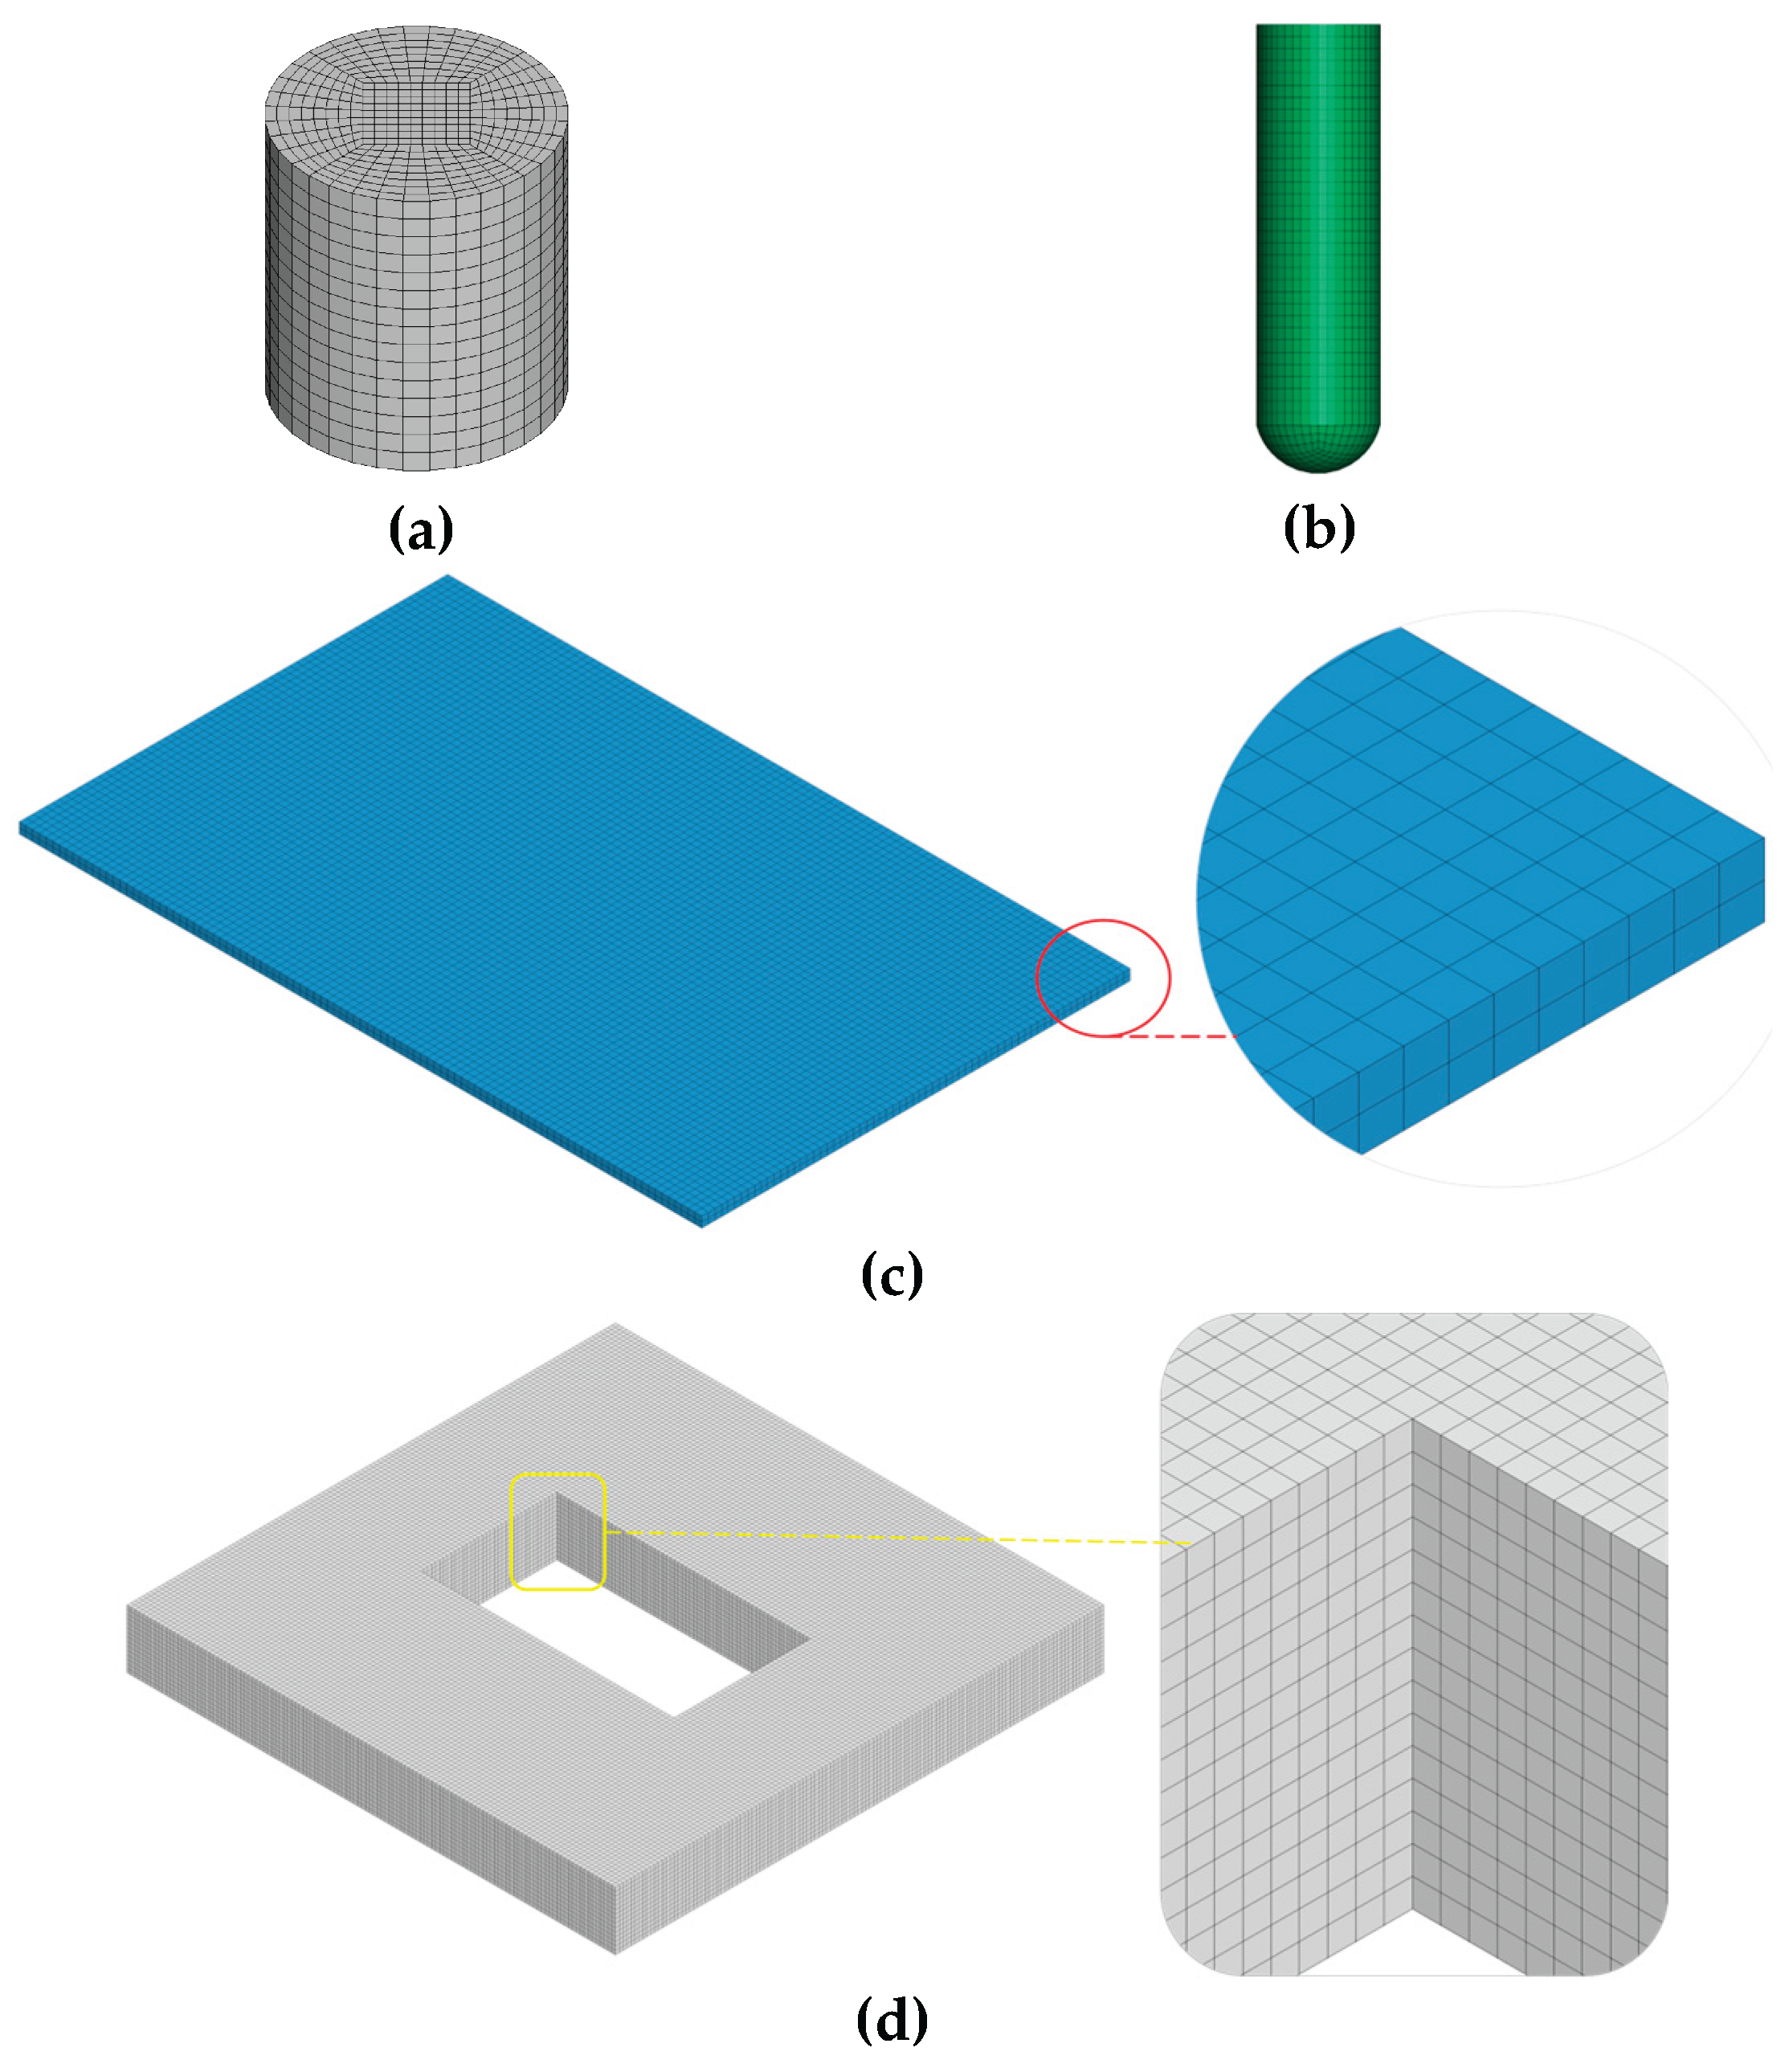
Figure 8.
Configuration of the drop tower model for the housing: (a) isometric view and (b) side view.
Figure 8.
Configuration of the drop tower model for the housing: (a) isometric view and (b) side view.
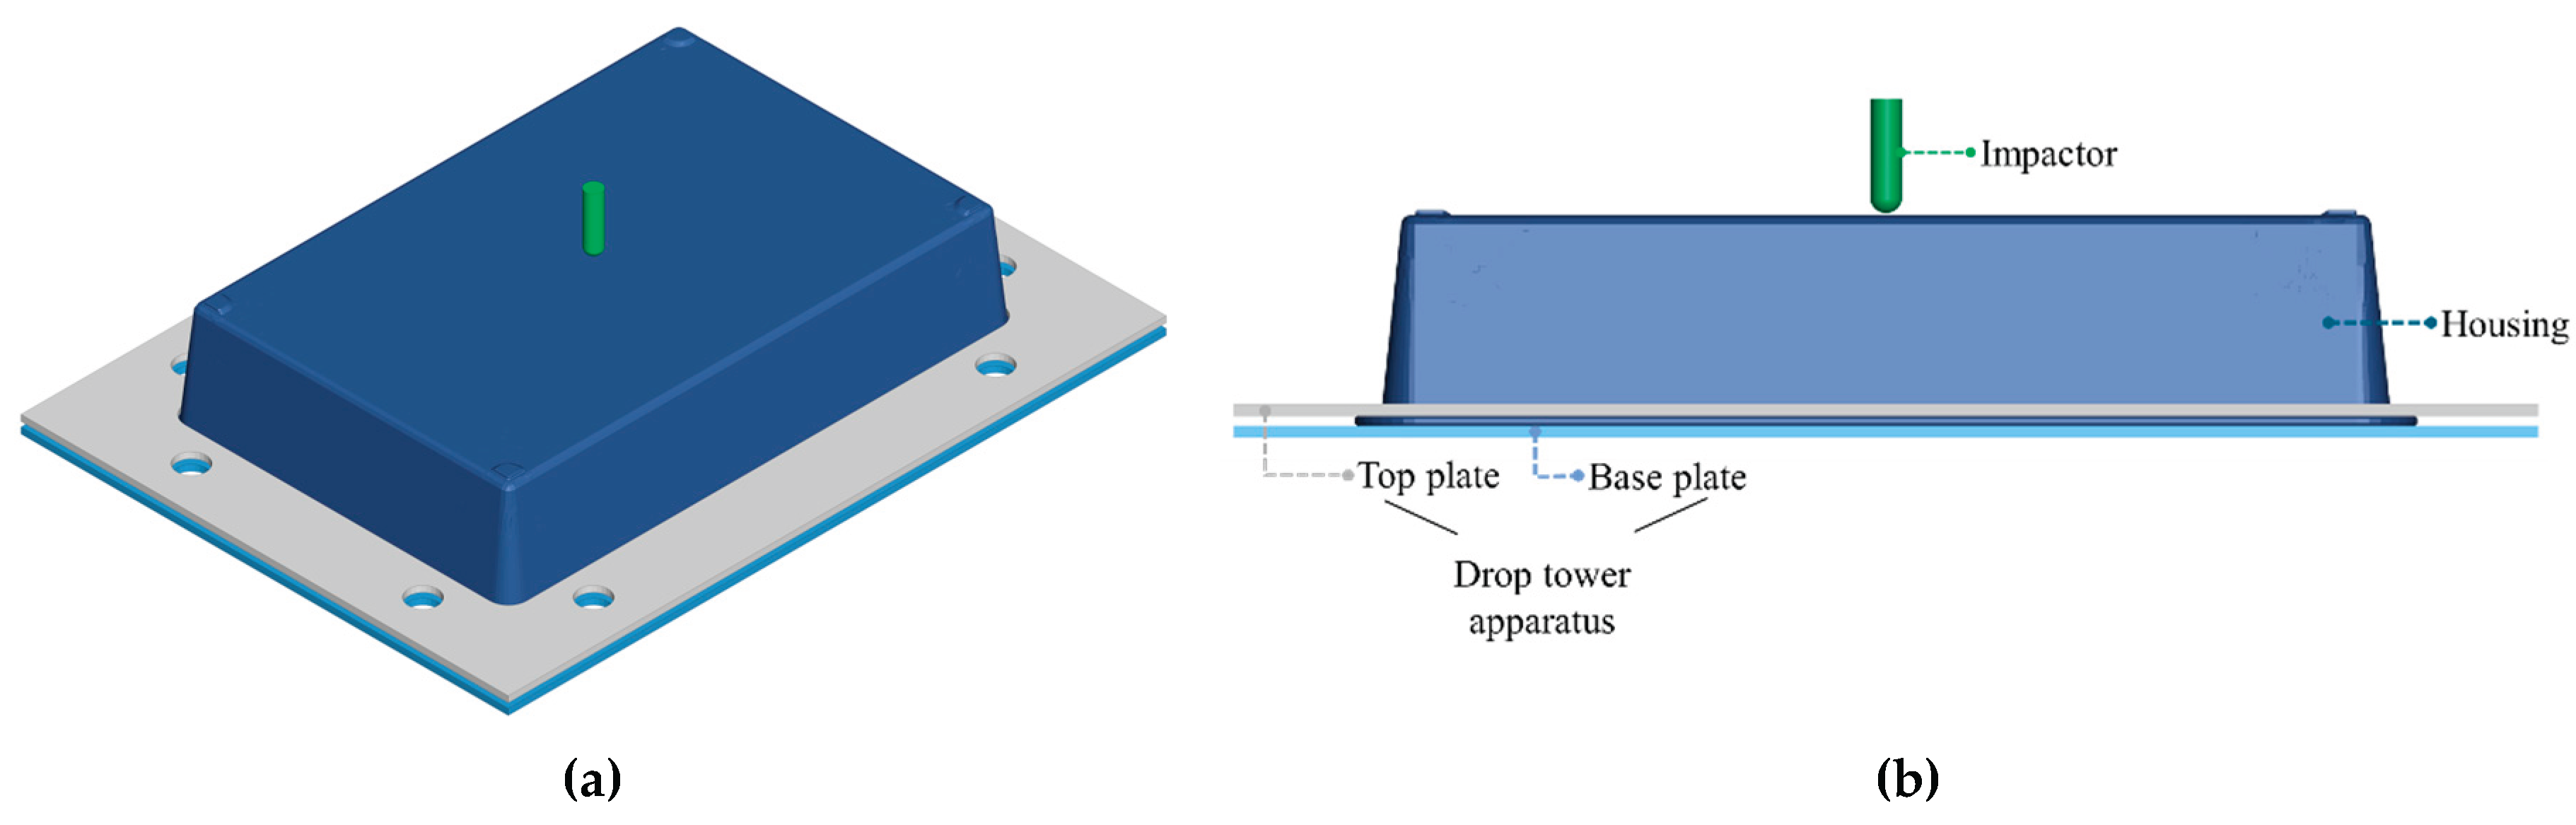
Figure 9.
FE mesh of (a) the apparatus of the drop tower model for the housing, and b) the housing.
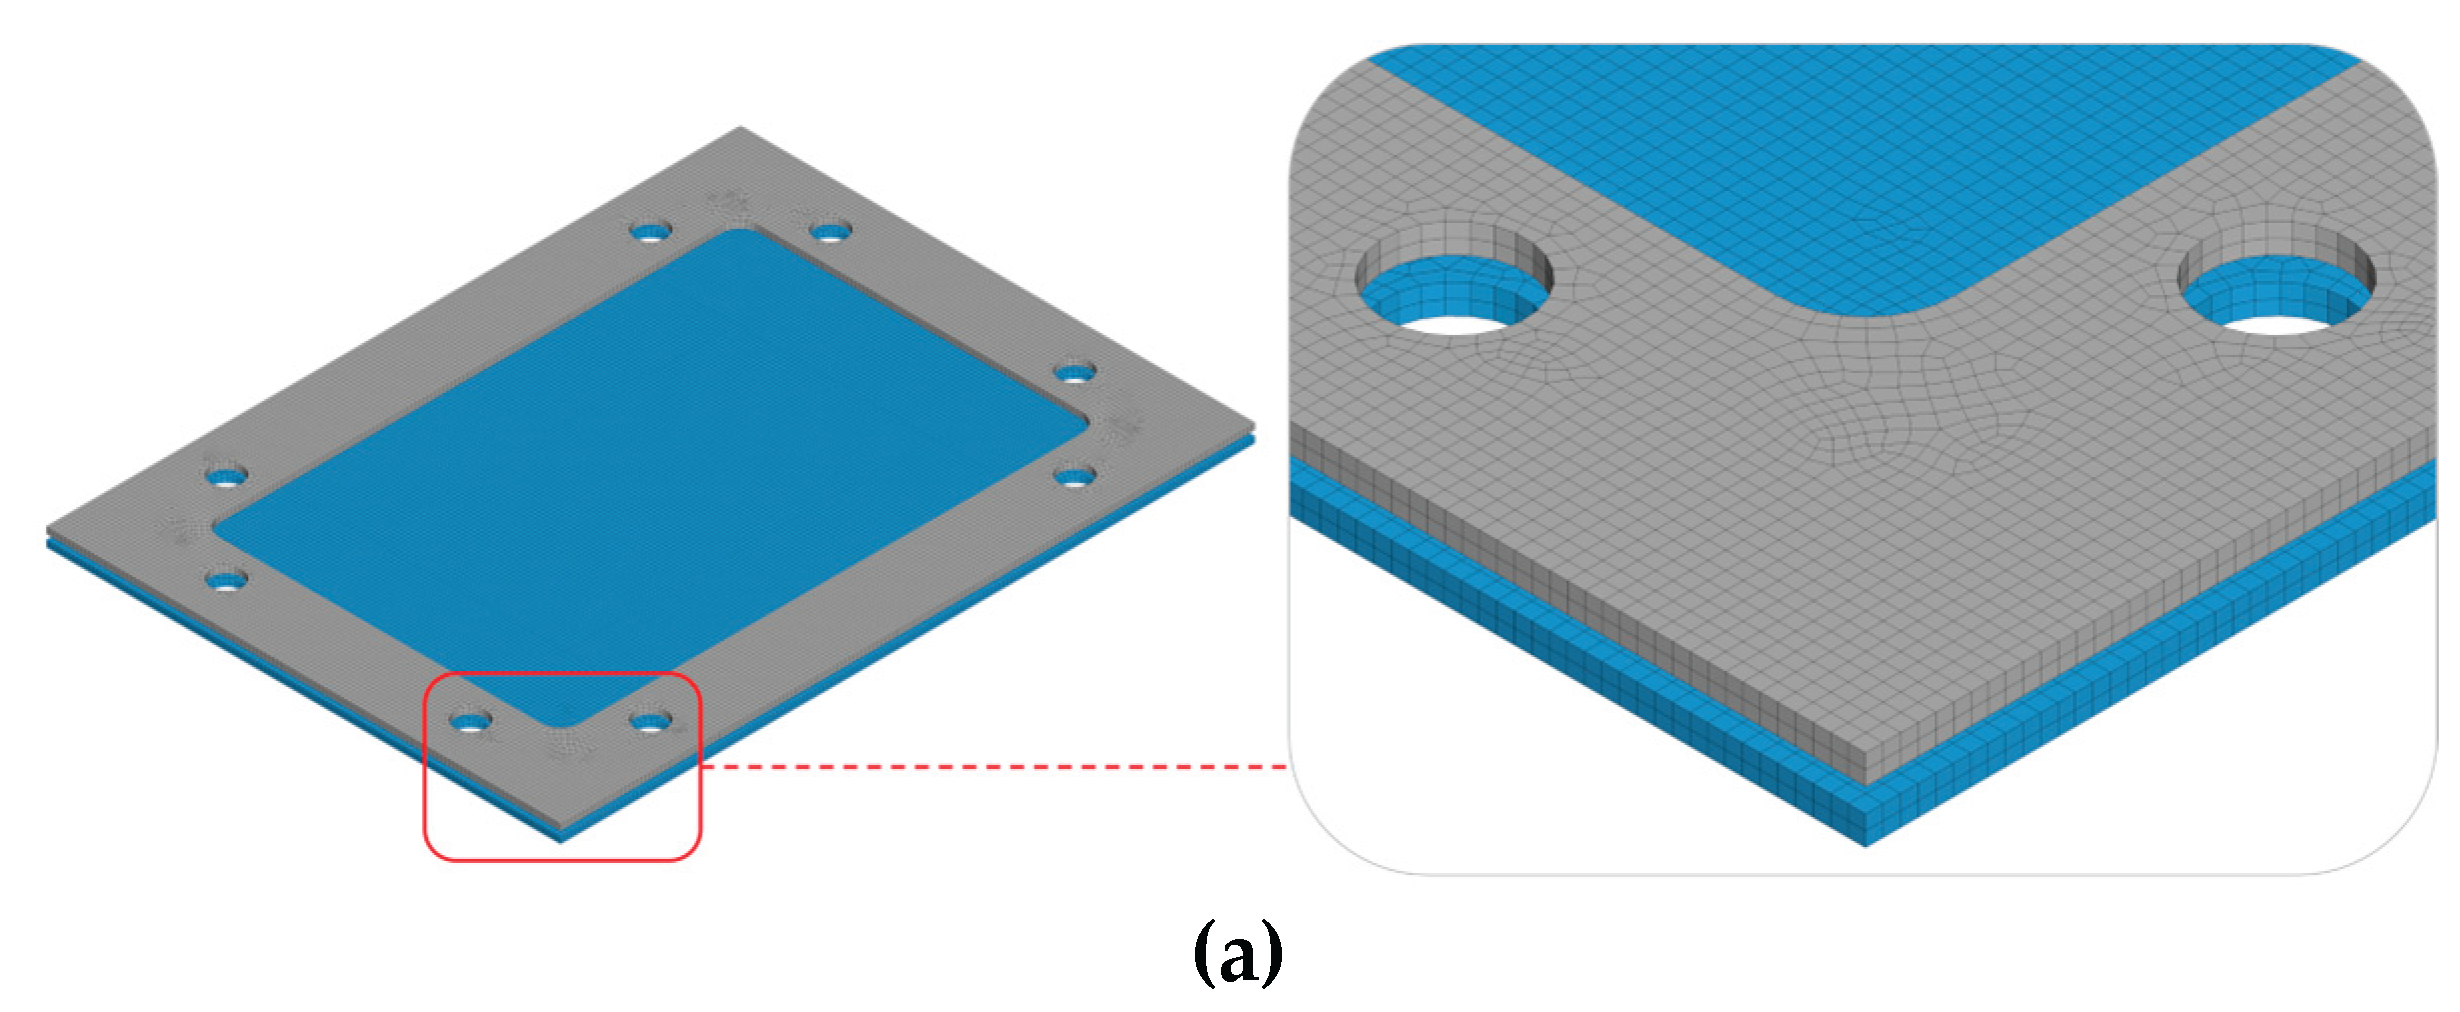
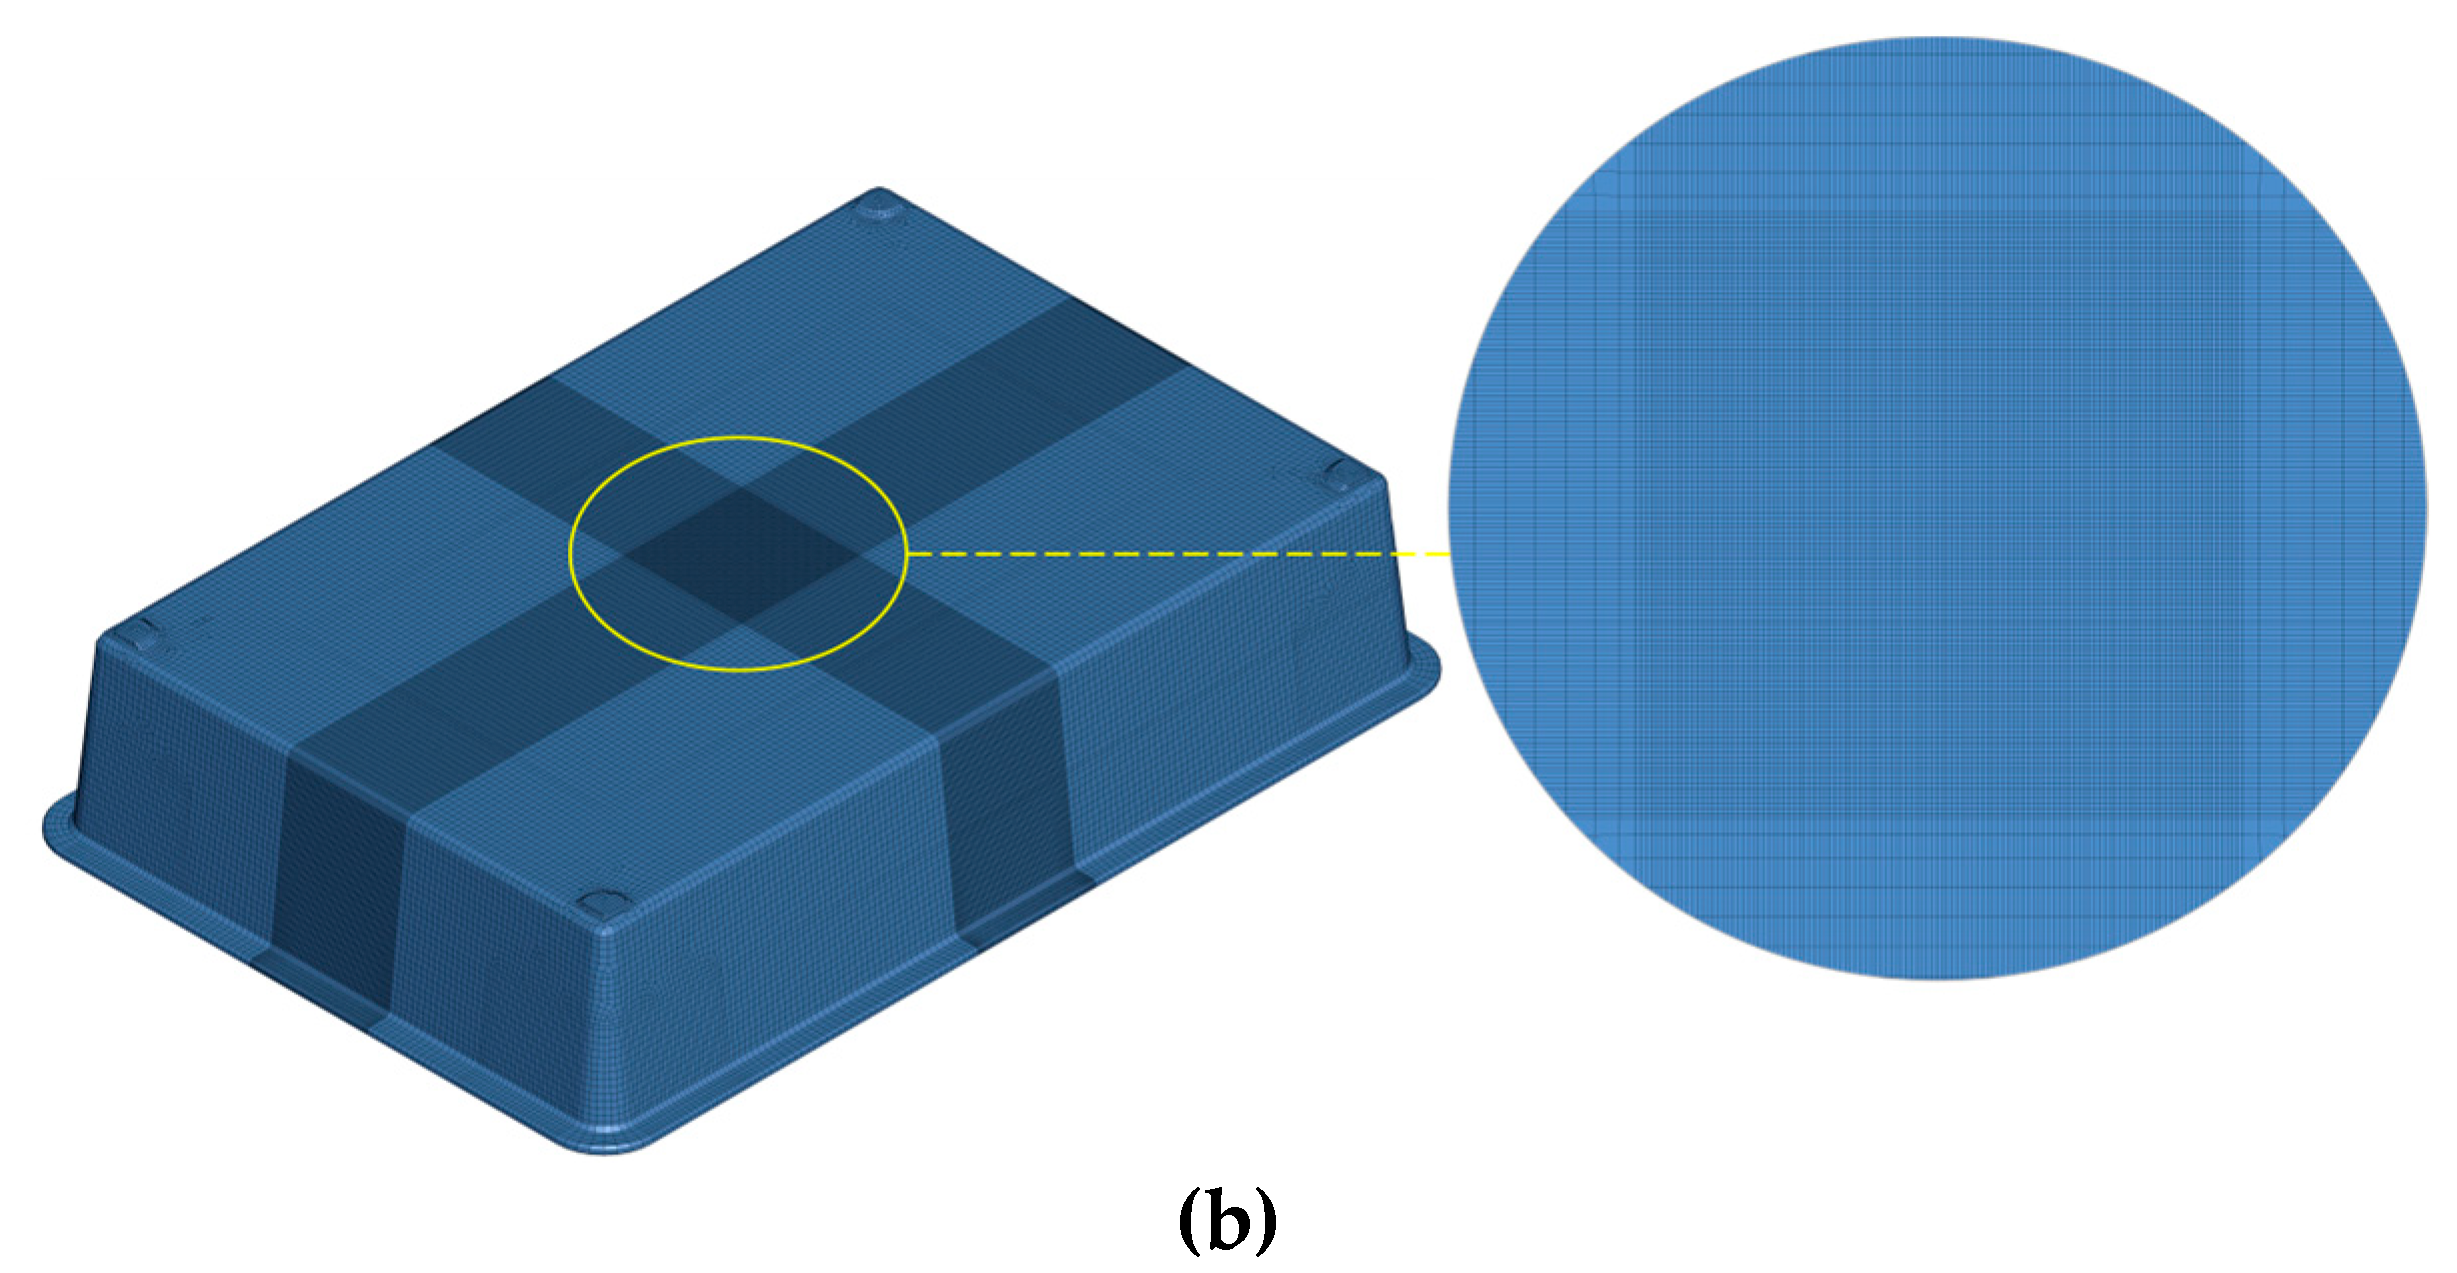
Figure 10.
FE mesh of the housing and the impactor of the ground impact model.
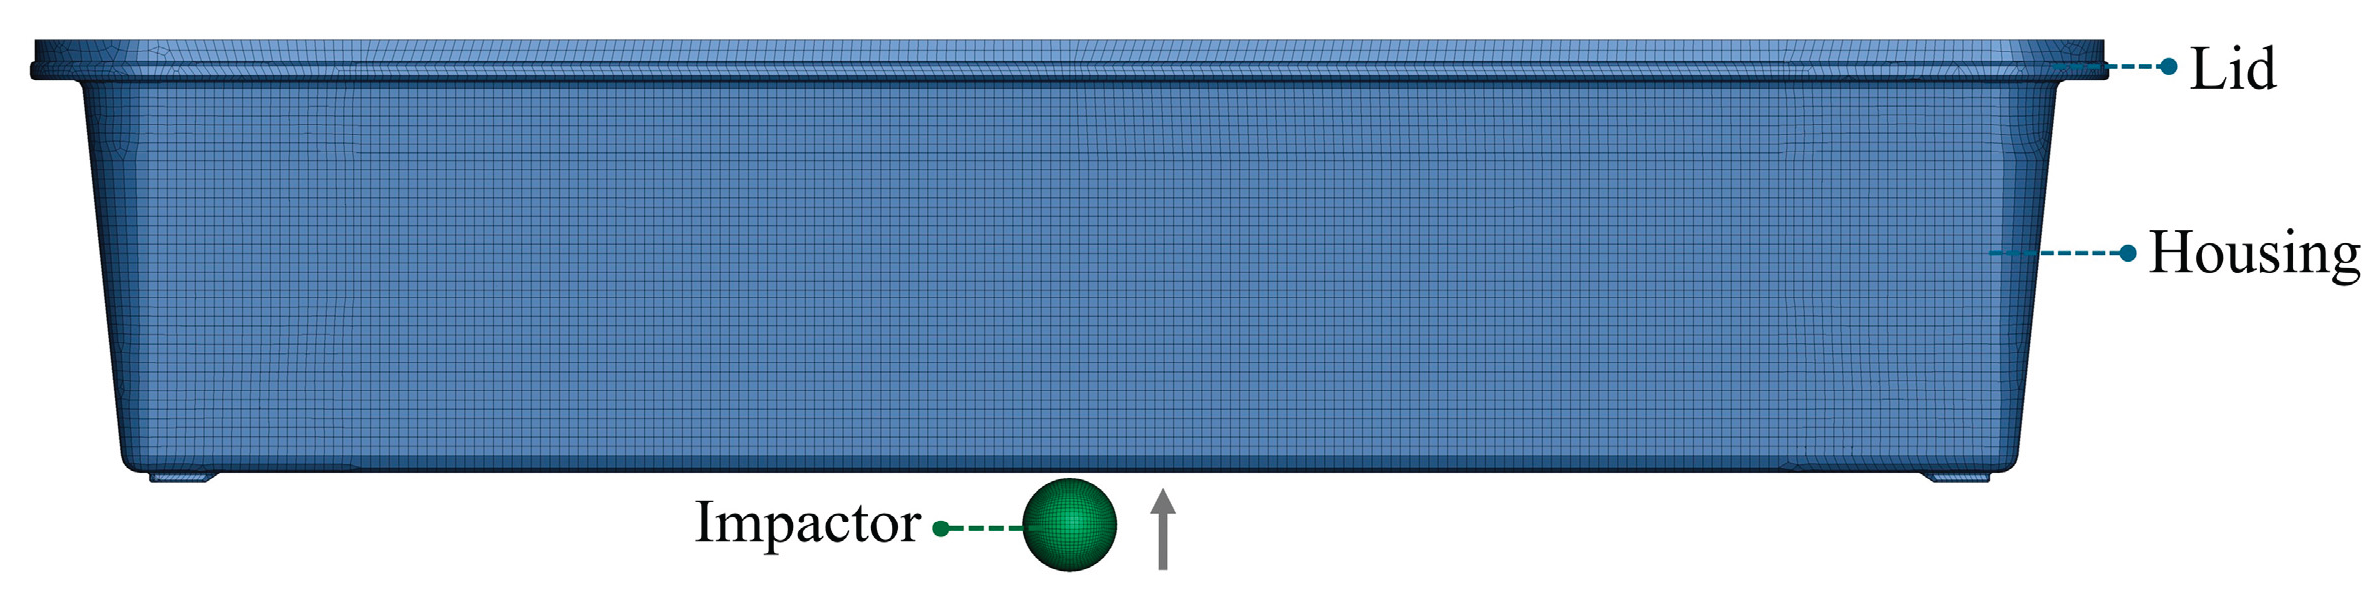
Figure 11.
Geometry of (a) the cell pack, (b) the cell frames, and (c) the cells.
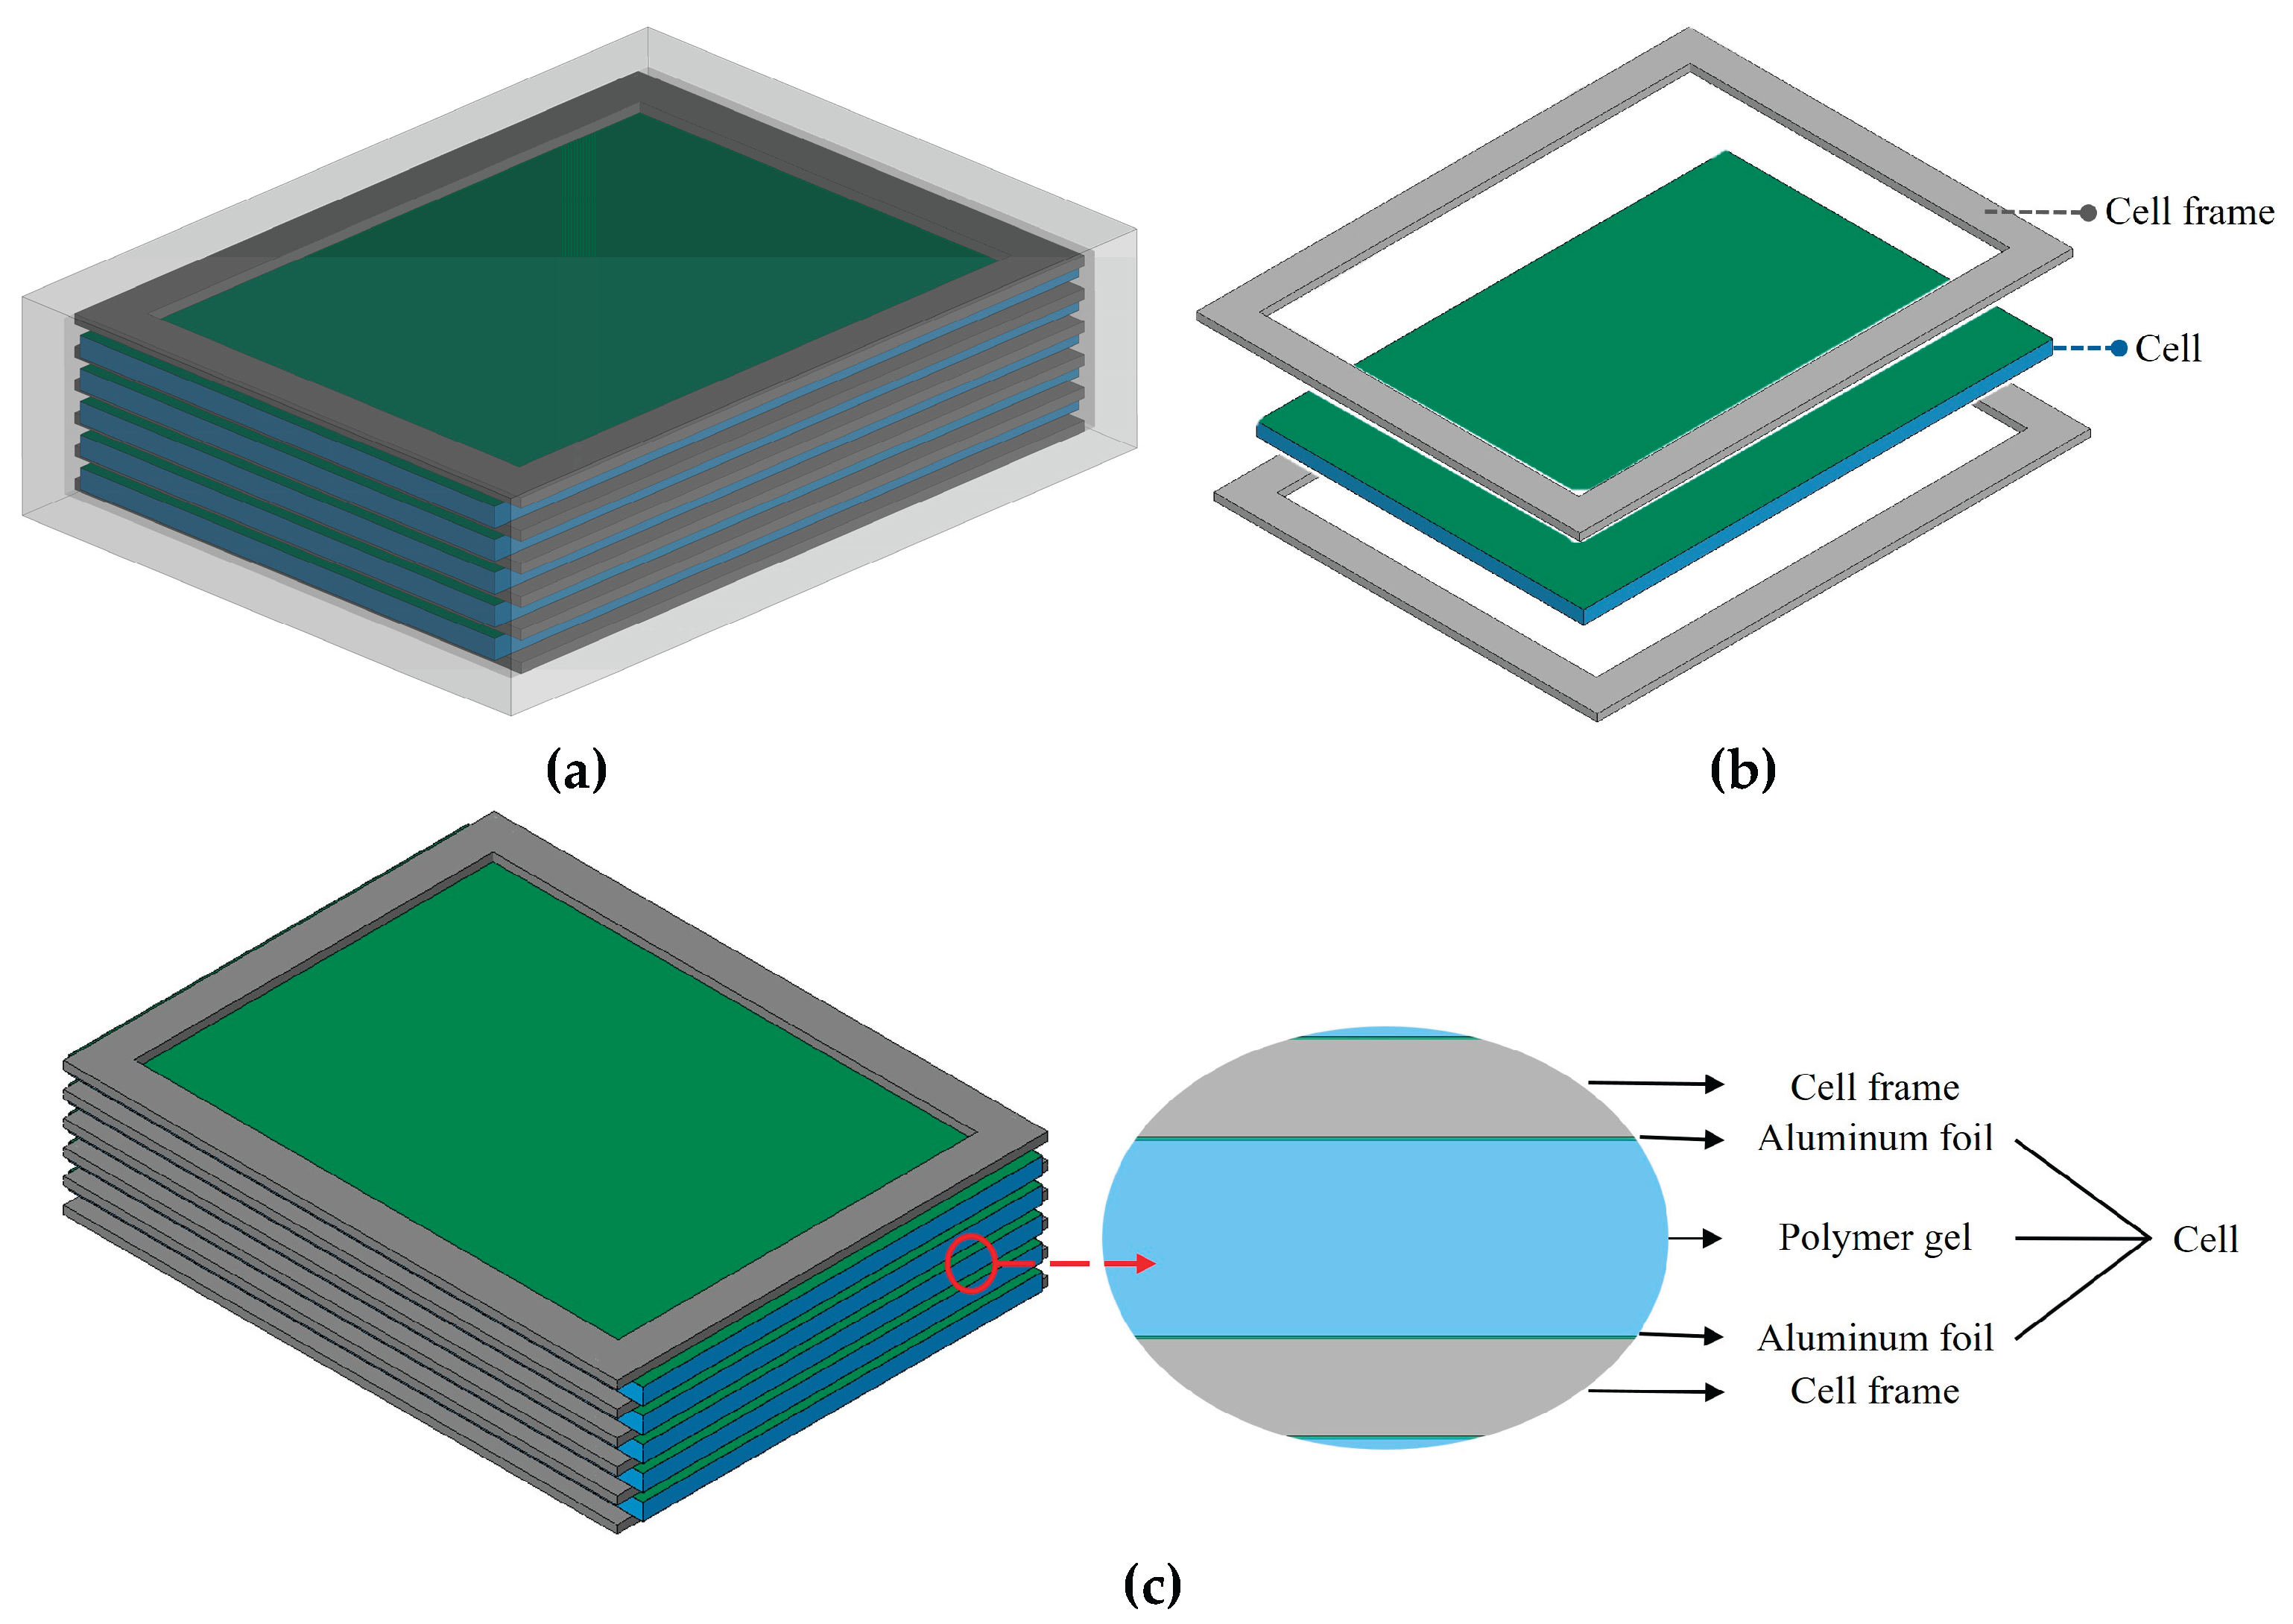
Figure 12.
FE mesh of (a) the cell frame, (b) the cell pack, and (c) the cell.
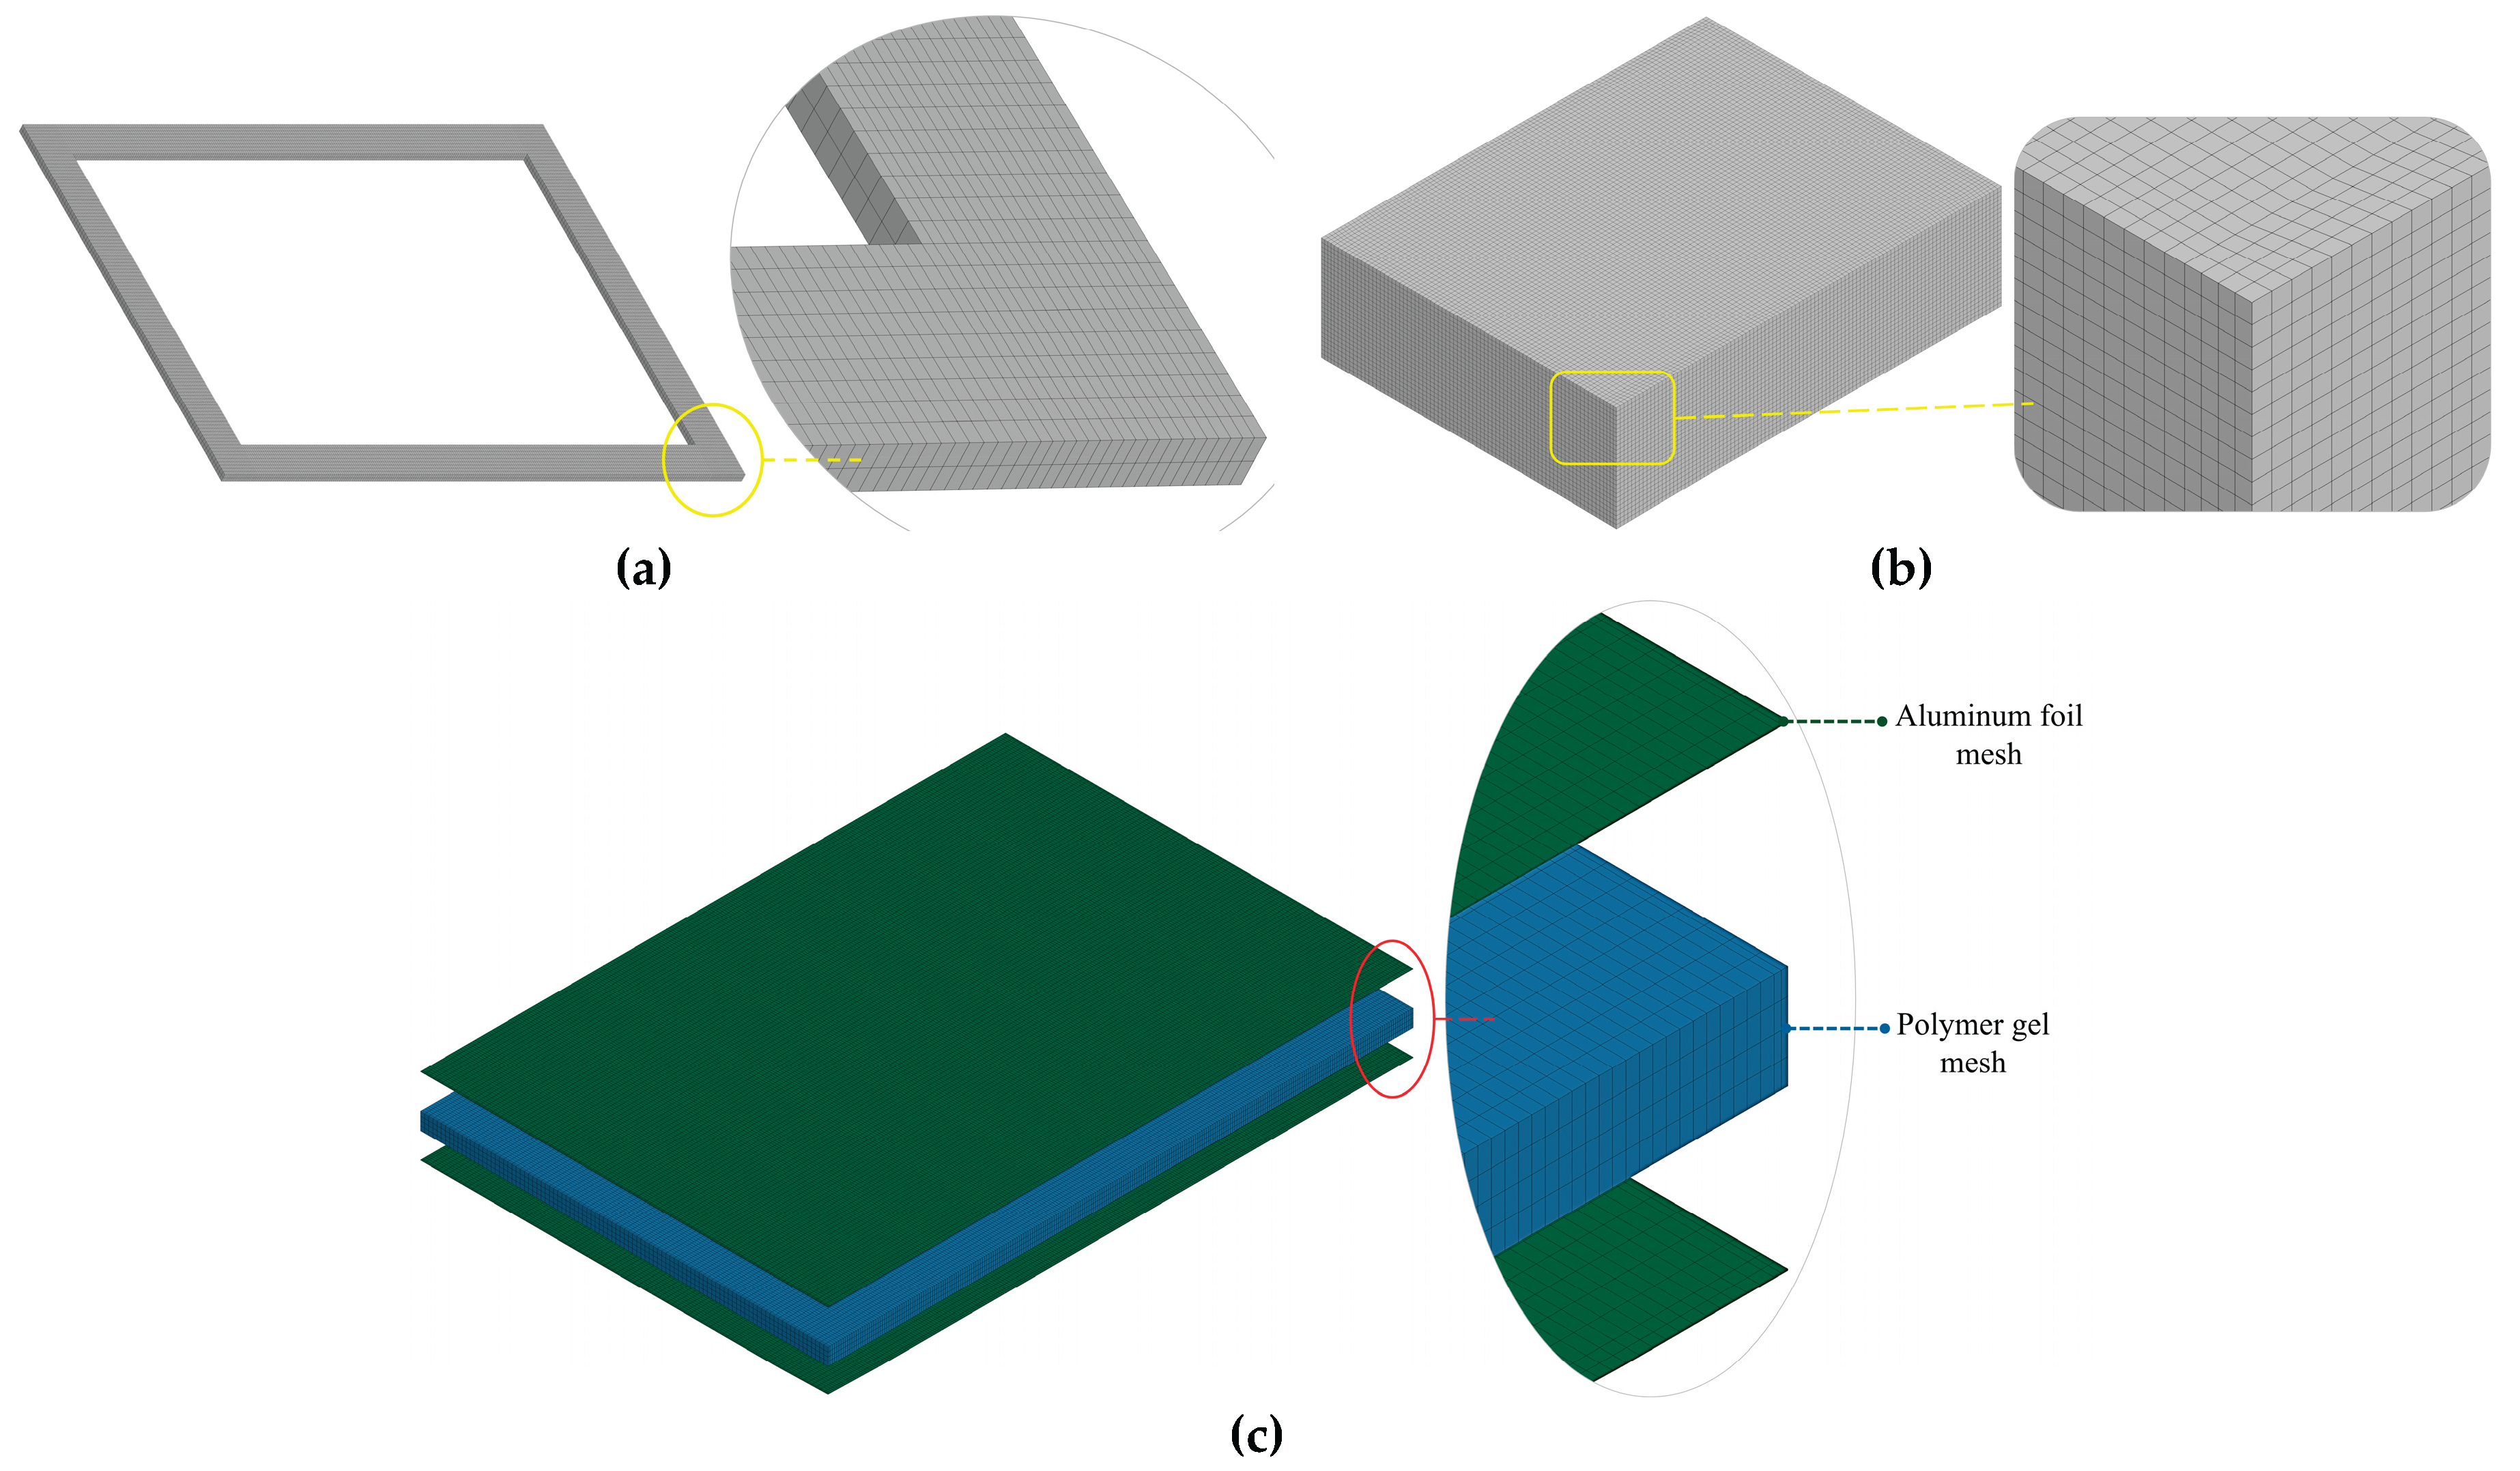
Figure 13.
FE mesh of the housing and the impactor of the pole impact/ crash model.
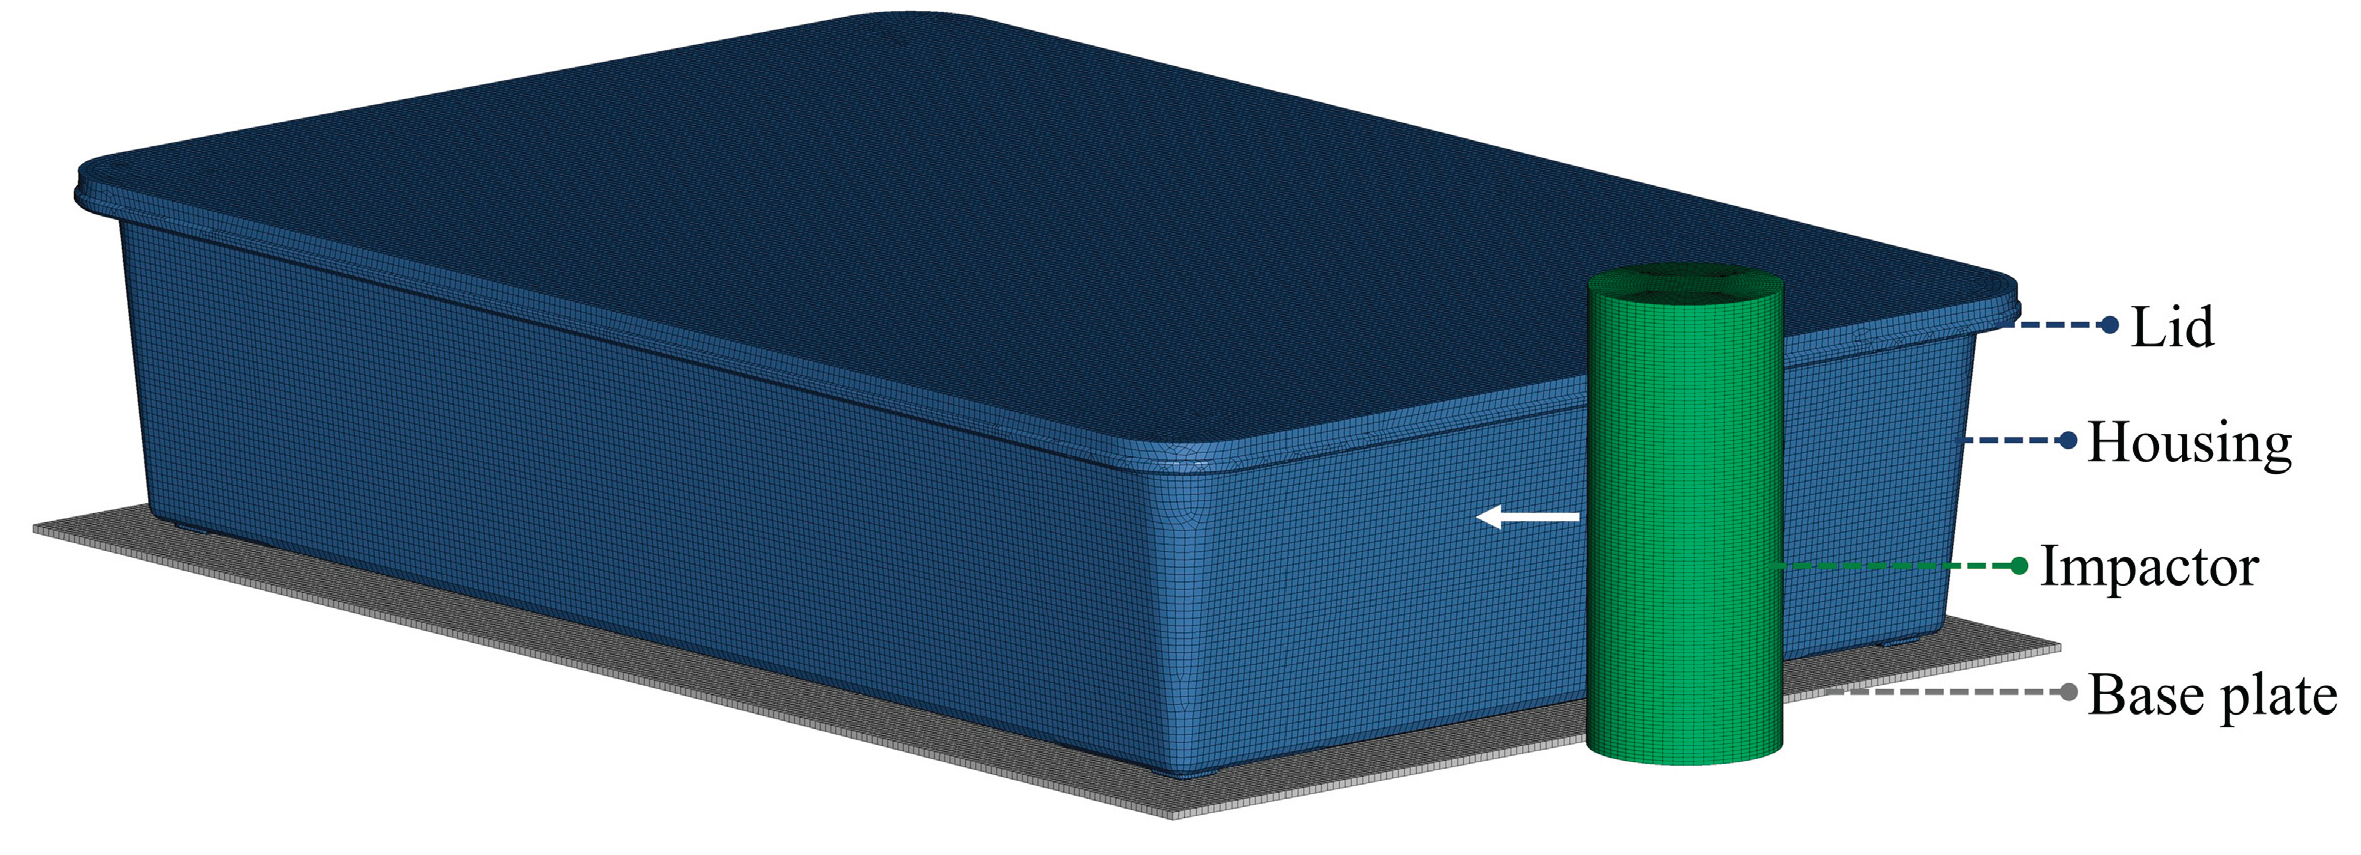
Figure 14.
Experimental and numerical force-time curves for the 7.5J impact of the drop tower impact on the plate.
Figure 14.
Experimental and numerical force-time curves for the 7.5J impact of the drop tower impact on the plate.
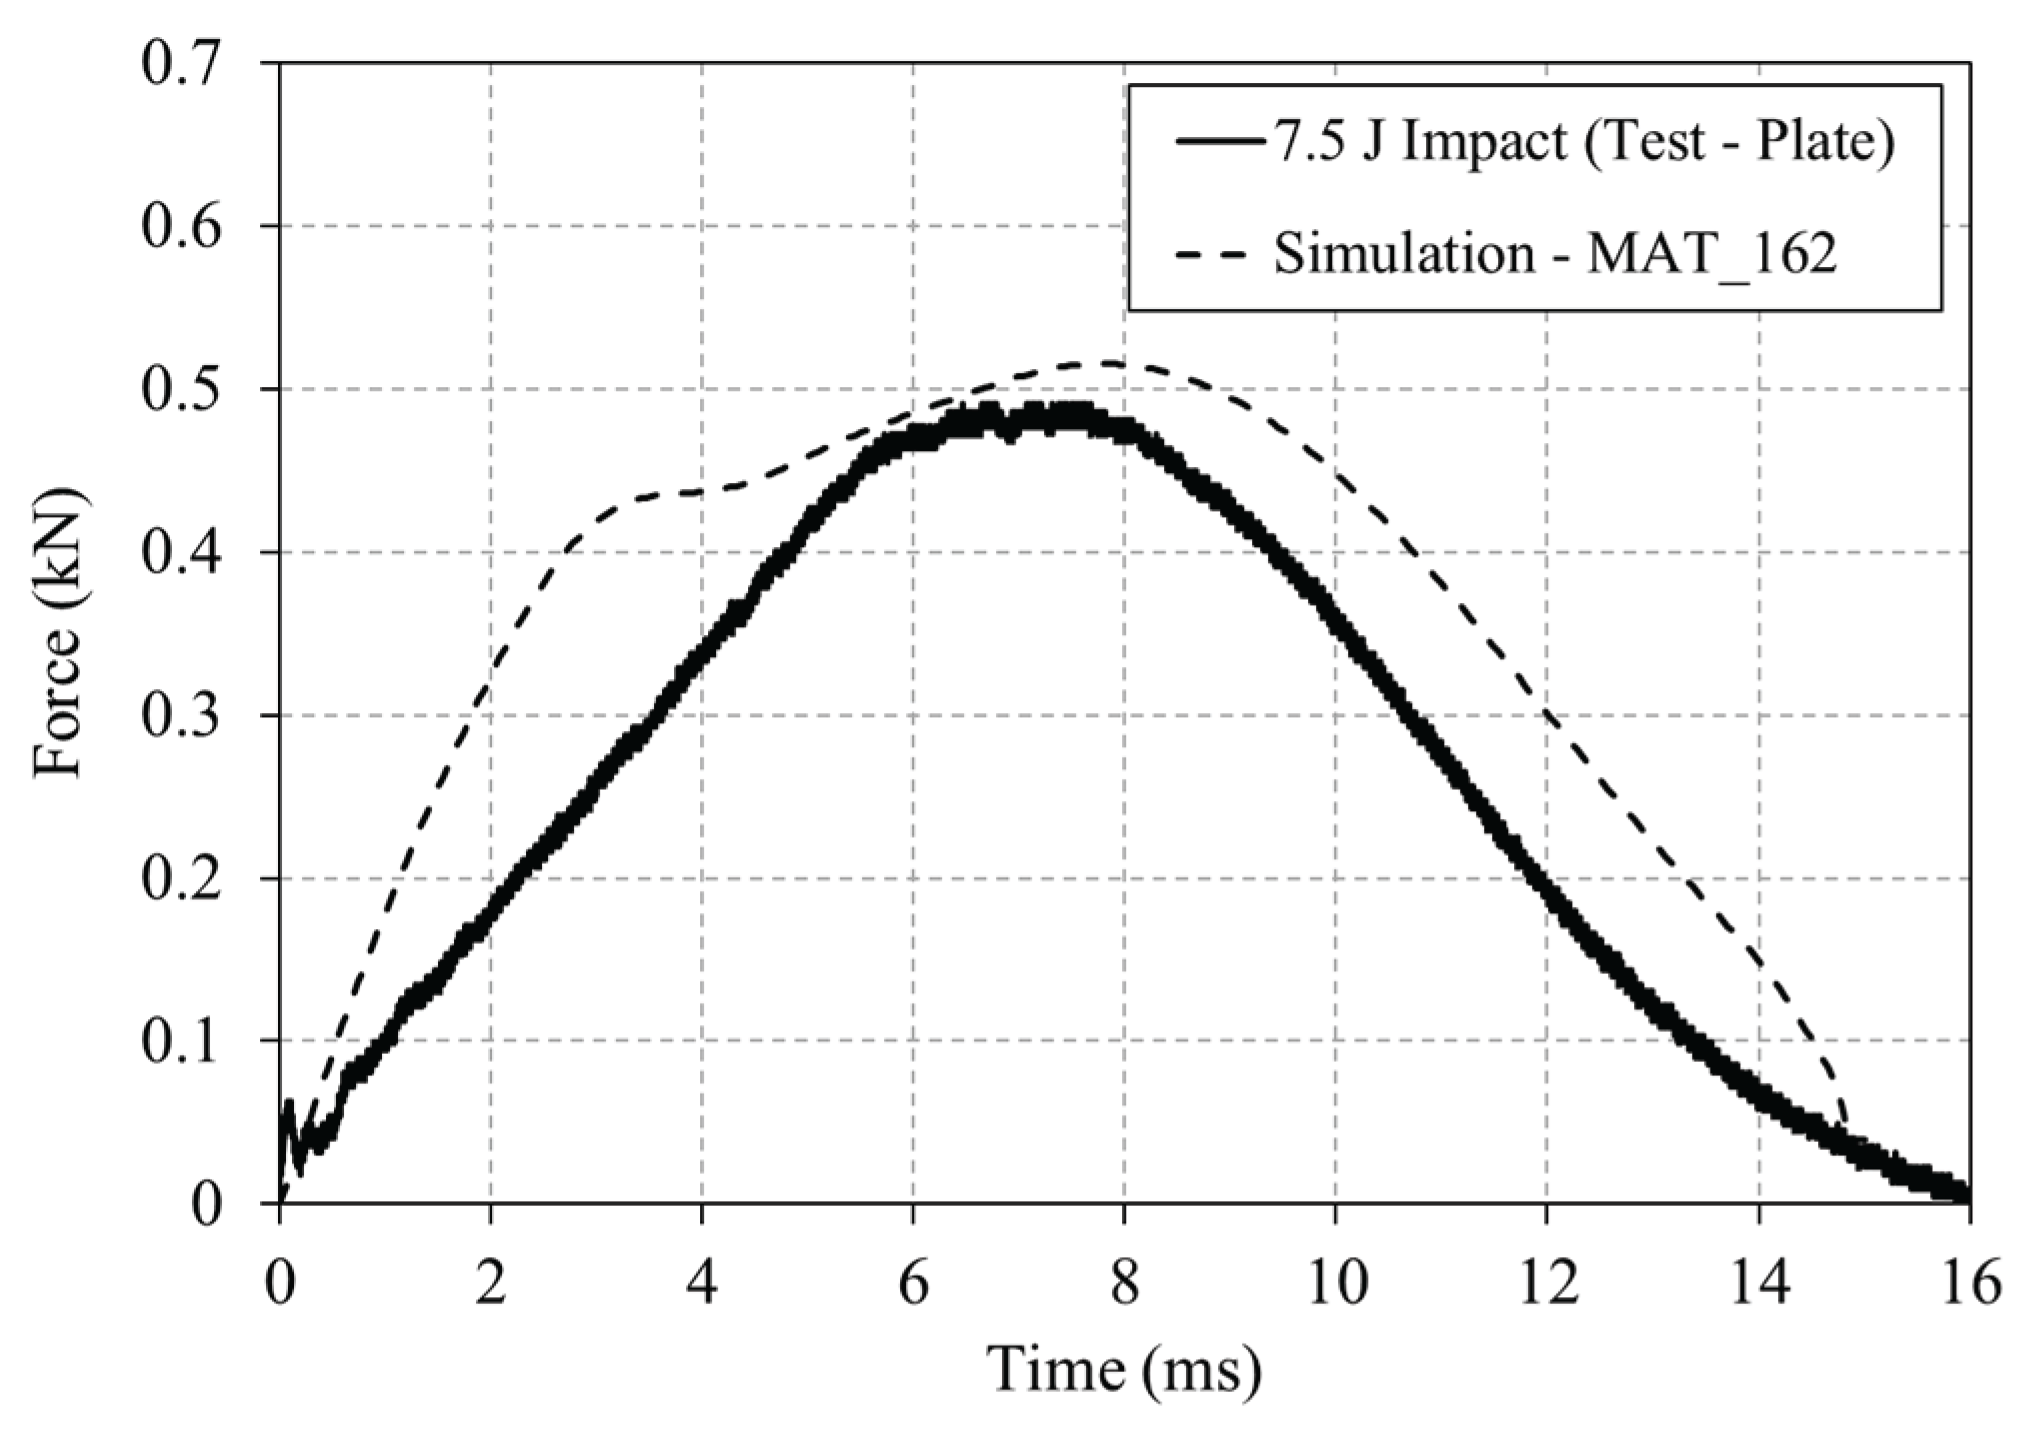
Figure 15.
Experimental versus numerical results of the SMC plate subjected to 7.5 J impact. a) Front face, b) back face, c) side profile comparison.
Figure 15.
Experimental versus numerical results of the SMC plate subjected to 7.5 J impact. a) Front face, b) back face, c) side profile comparison.
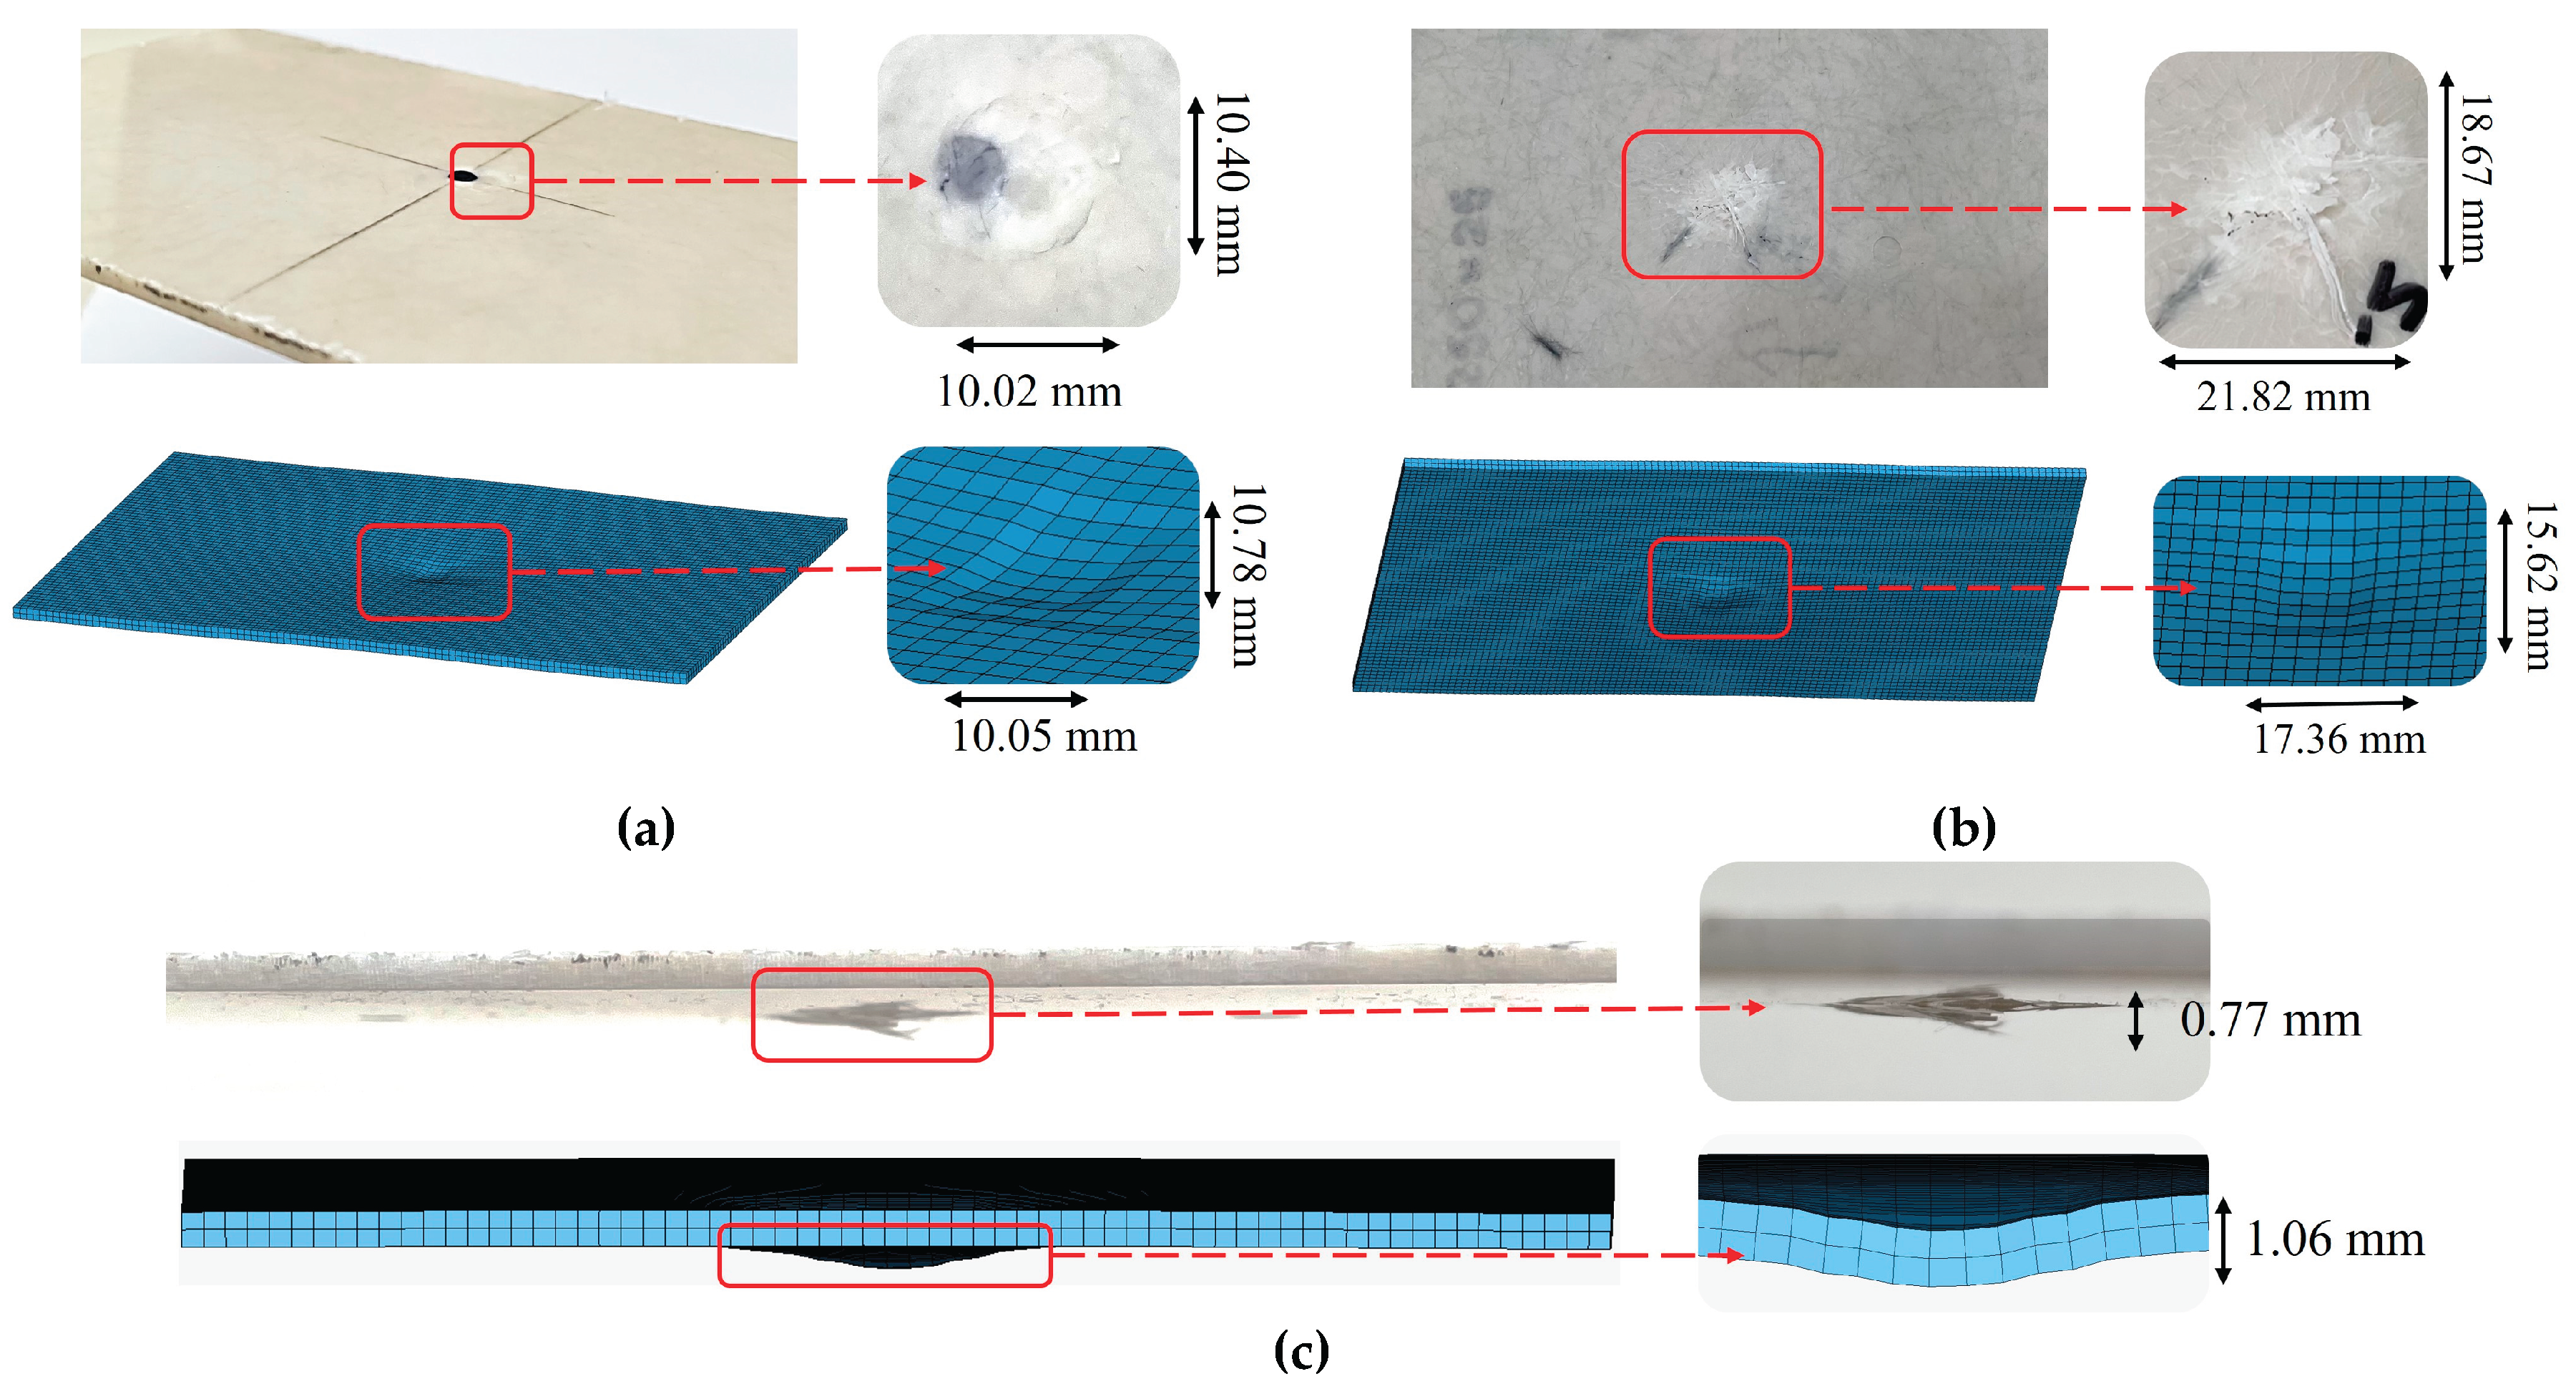
Figure 16.
Experimental and numerical force-time curves for the 30 J impact of the drop tower impact on the plate.
Figure 16.
Experimental and numerical force-time curves for the 30 J impact of the drop tower impact on the plate.
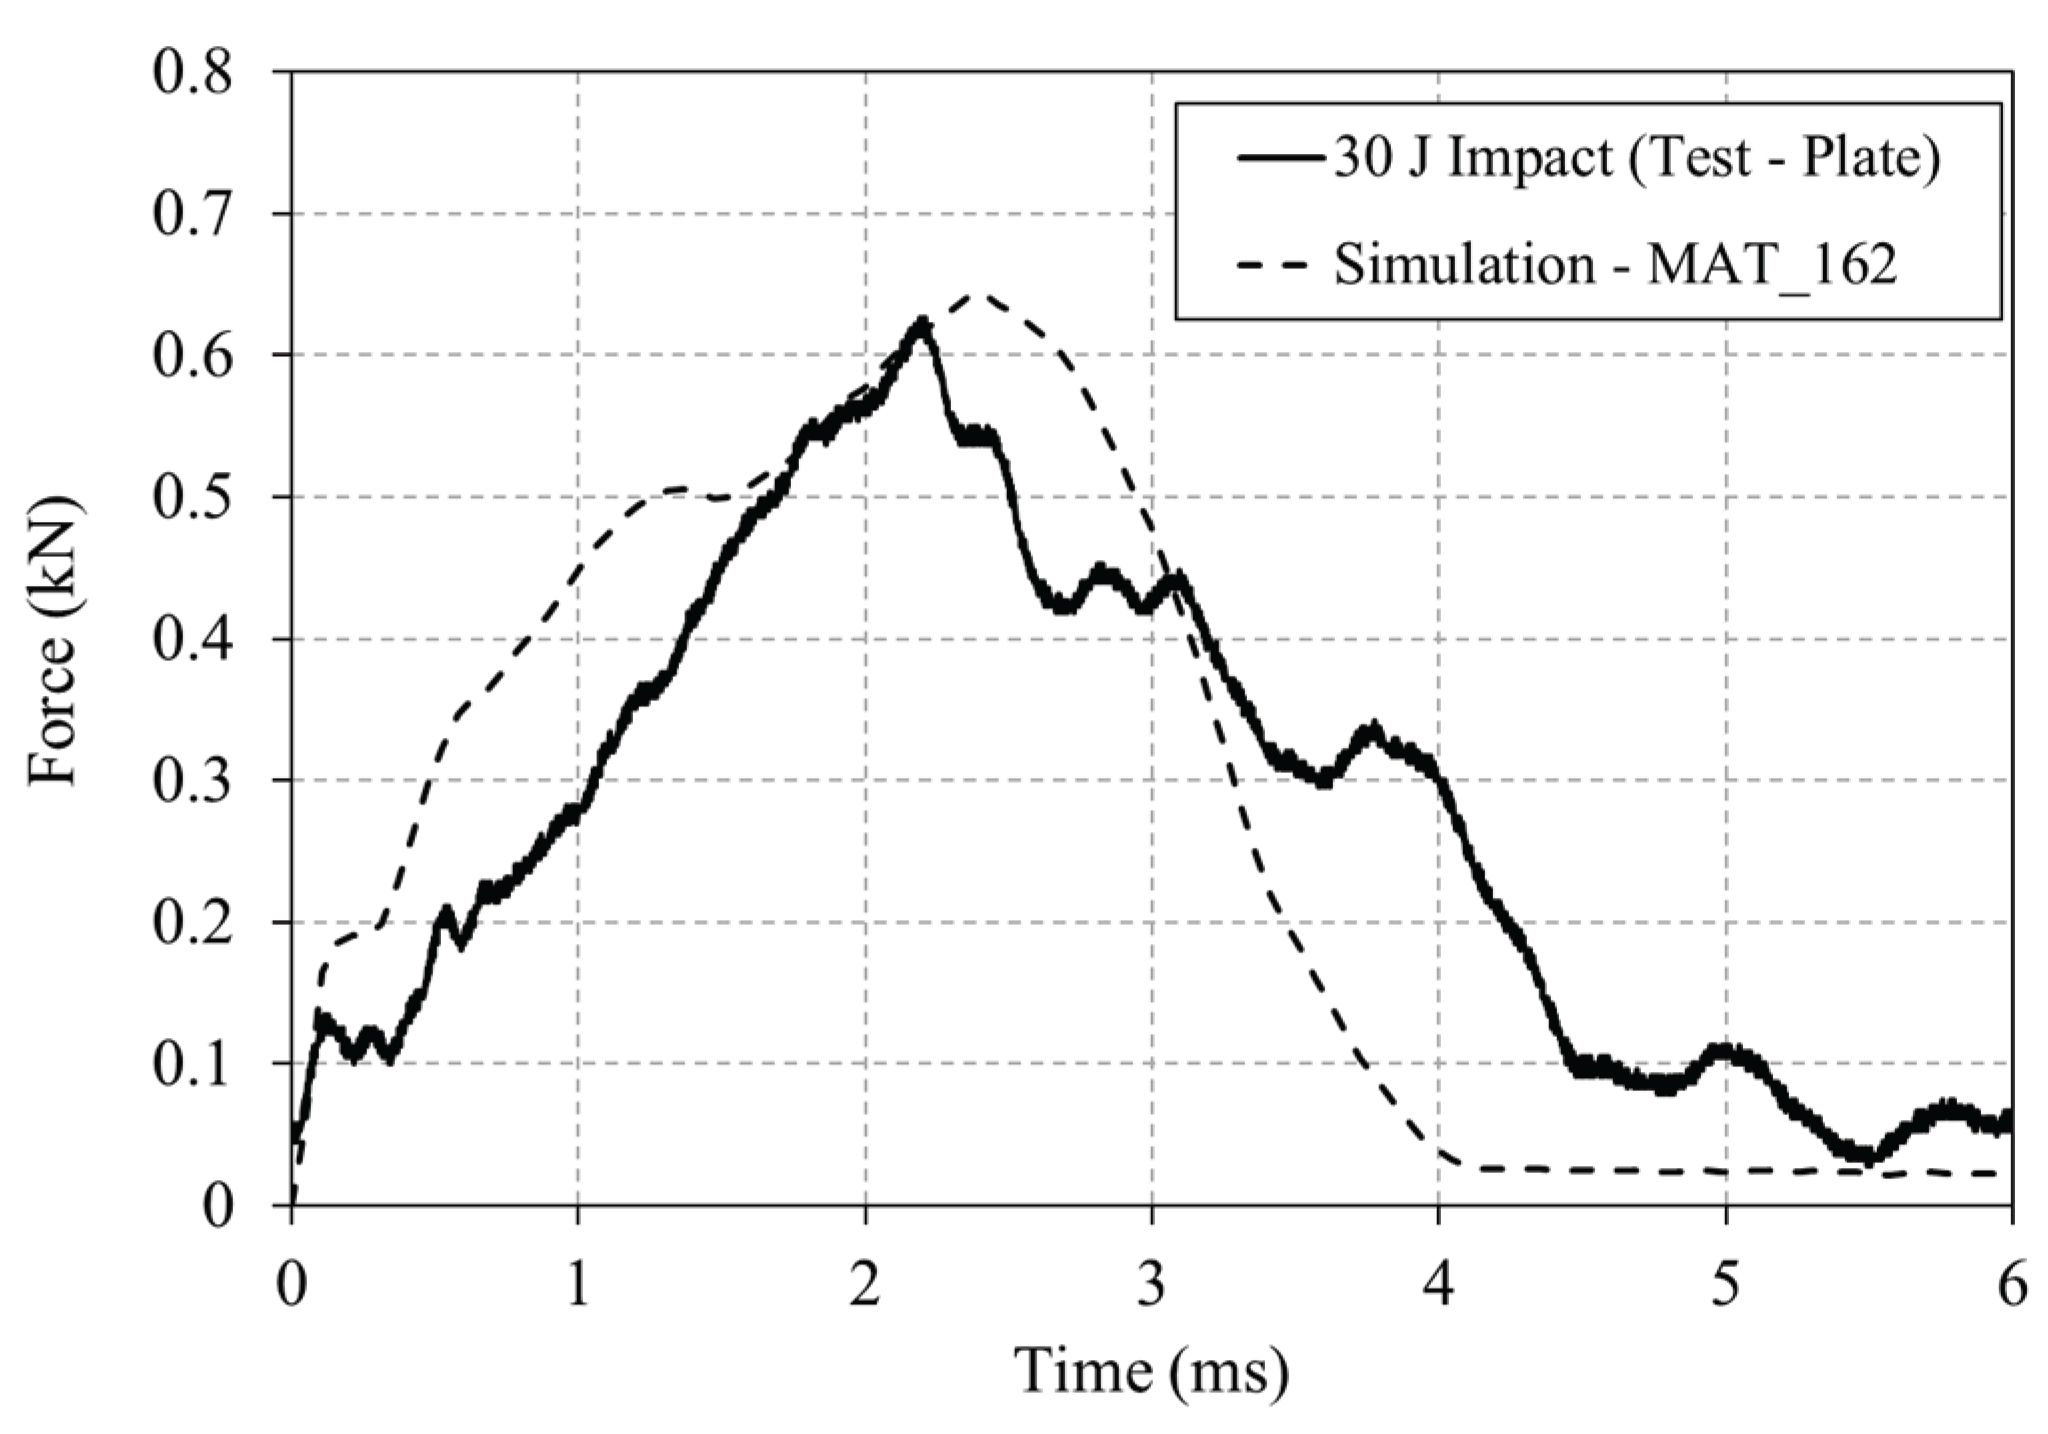
Figure 17.
Experimental versus numerical results of the SMC plate subjected to 30 J impact. a) Front face, b) back face, c) side profile comparison.
Figure 17.
Experimental versus numerical results of the SMC plate subjected to 30 J impact. a) Front face, b) back face, c) side profile comparison.
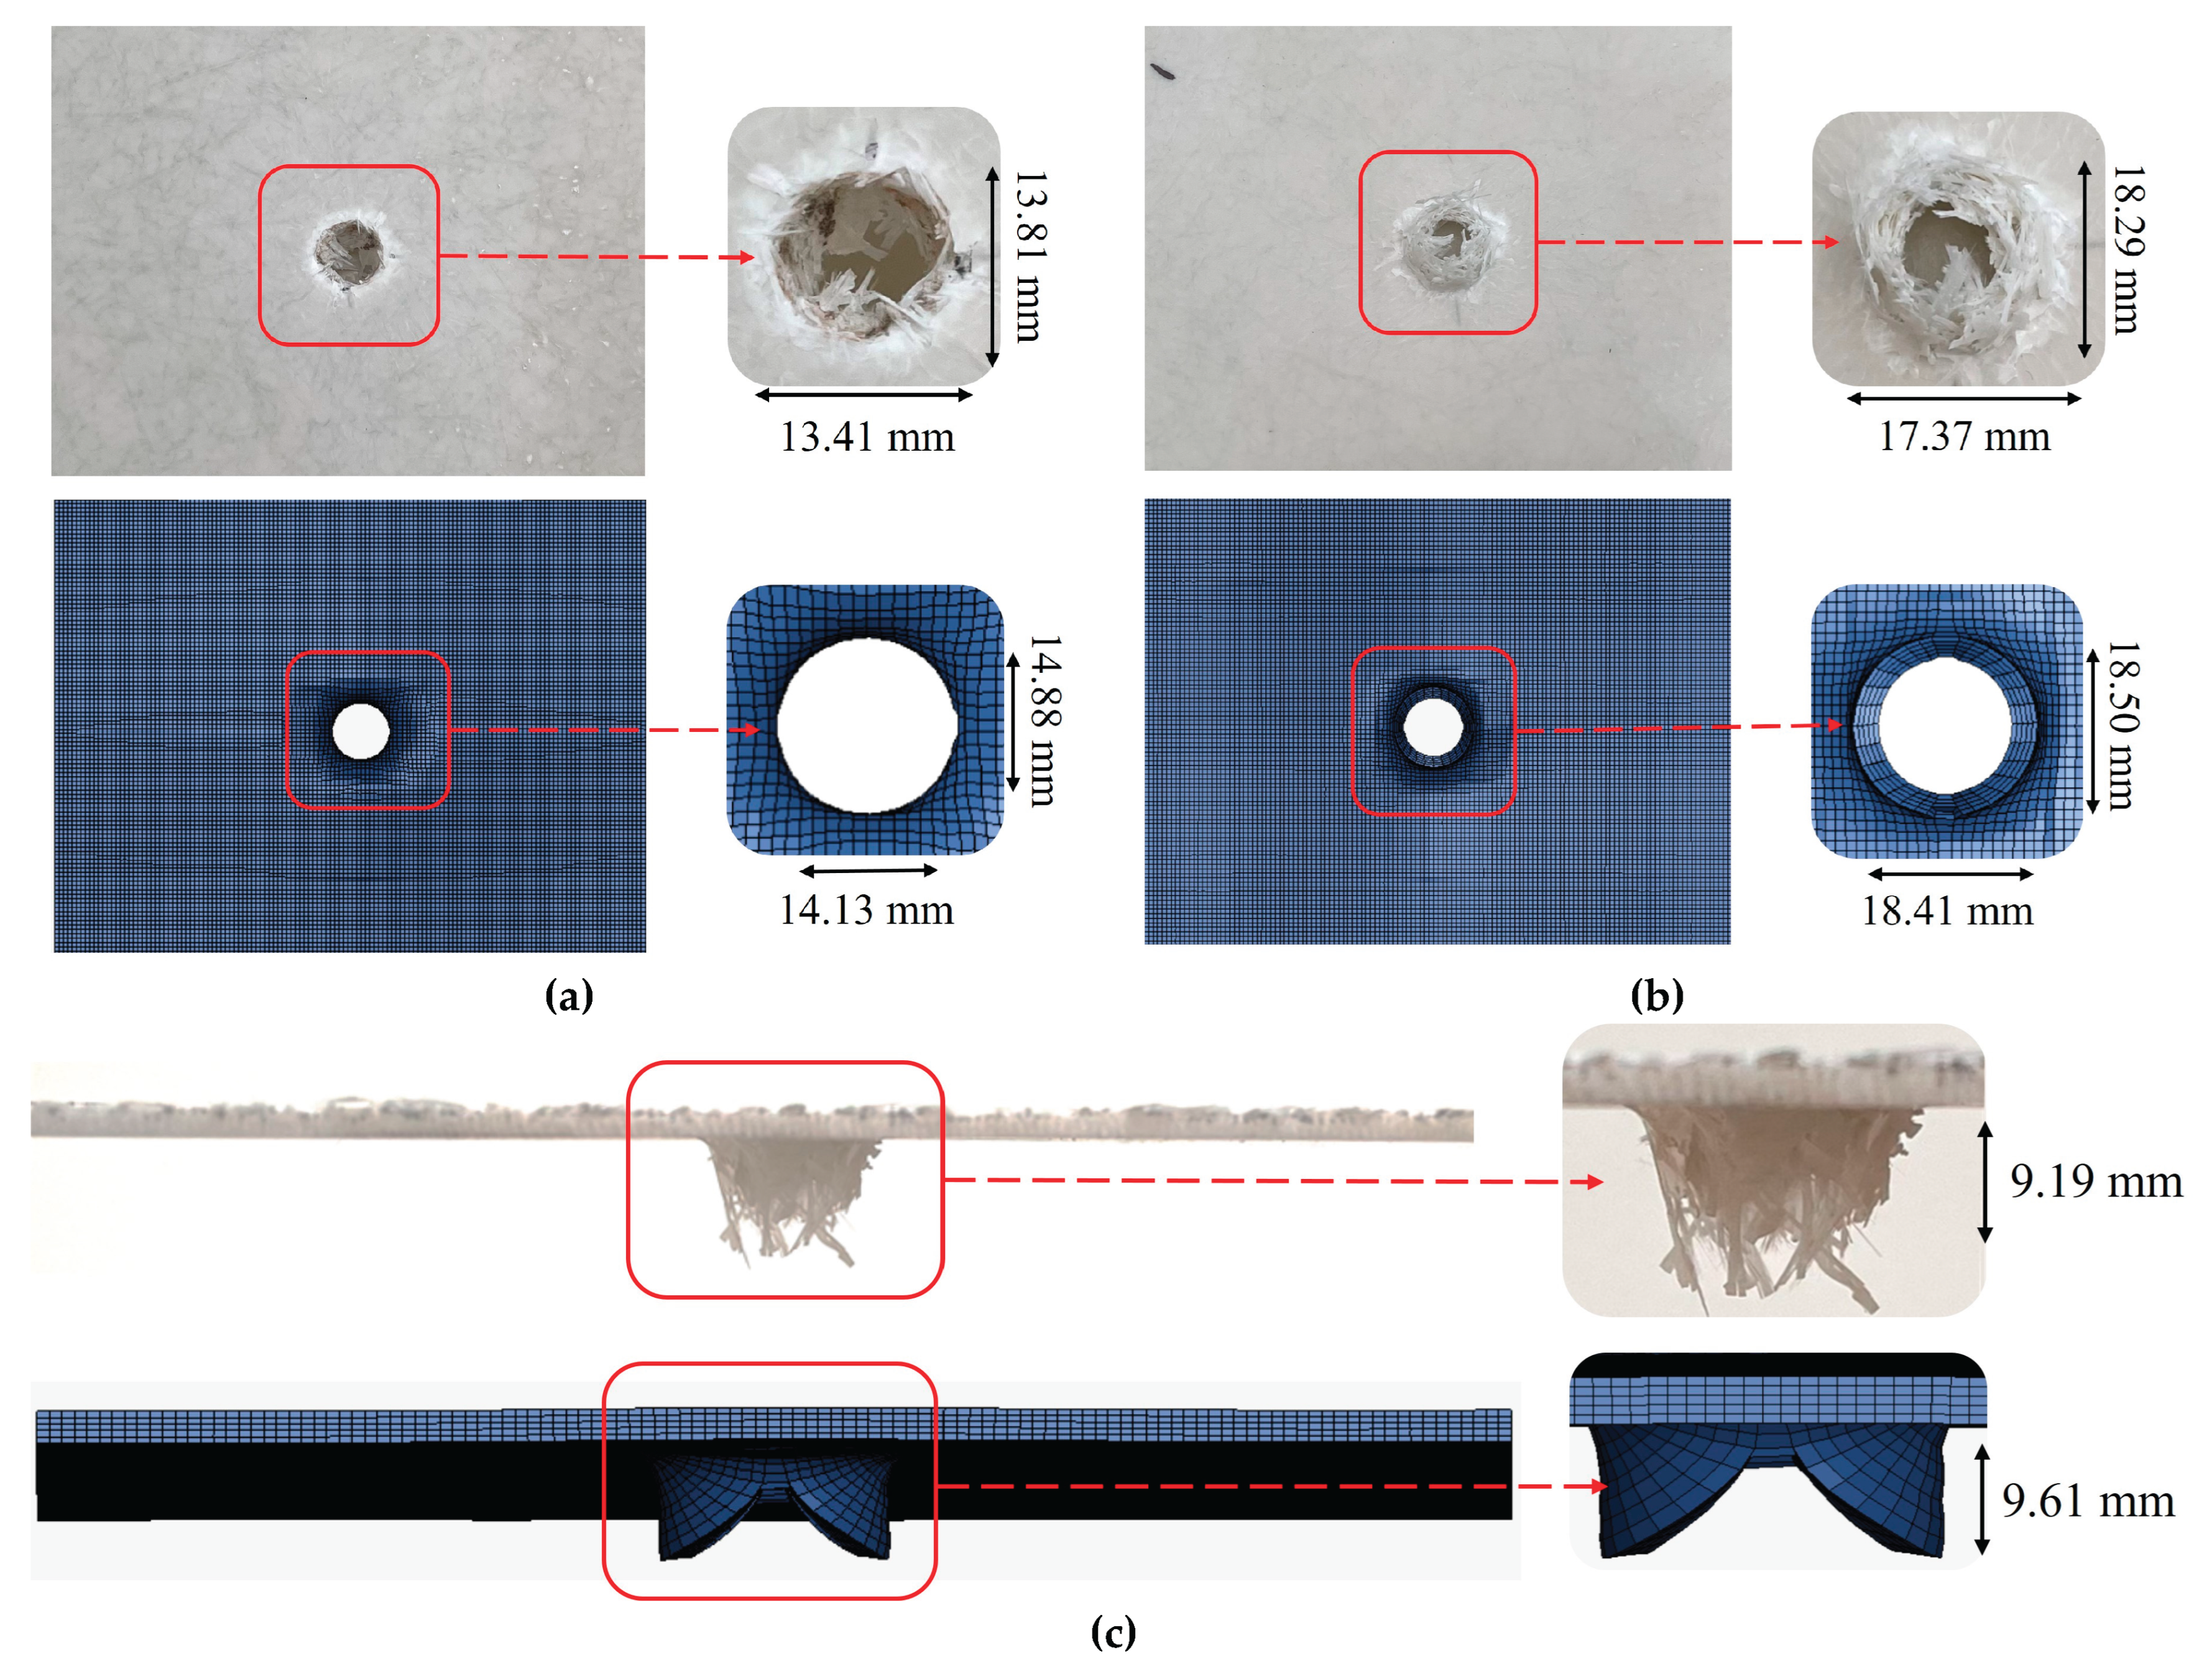
Figure 18.
Experimental and numerical force-time curves for the 7.5J impact of the drop tower impact on the housing.
Figure 18.
Experimental and numerical force-time curves for the 7.5J impact of the drop tower impact on the housing.
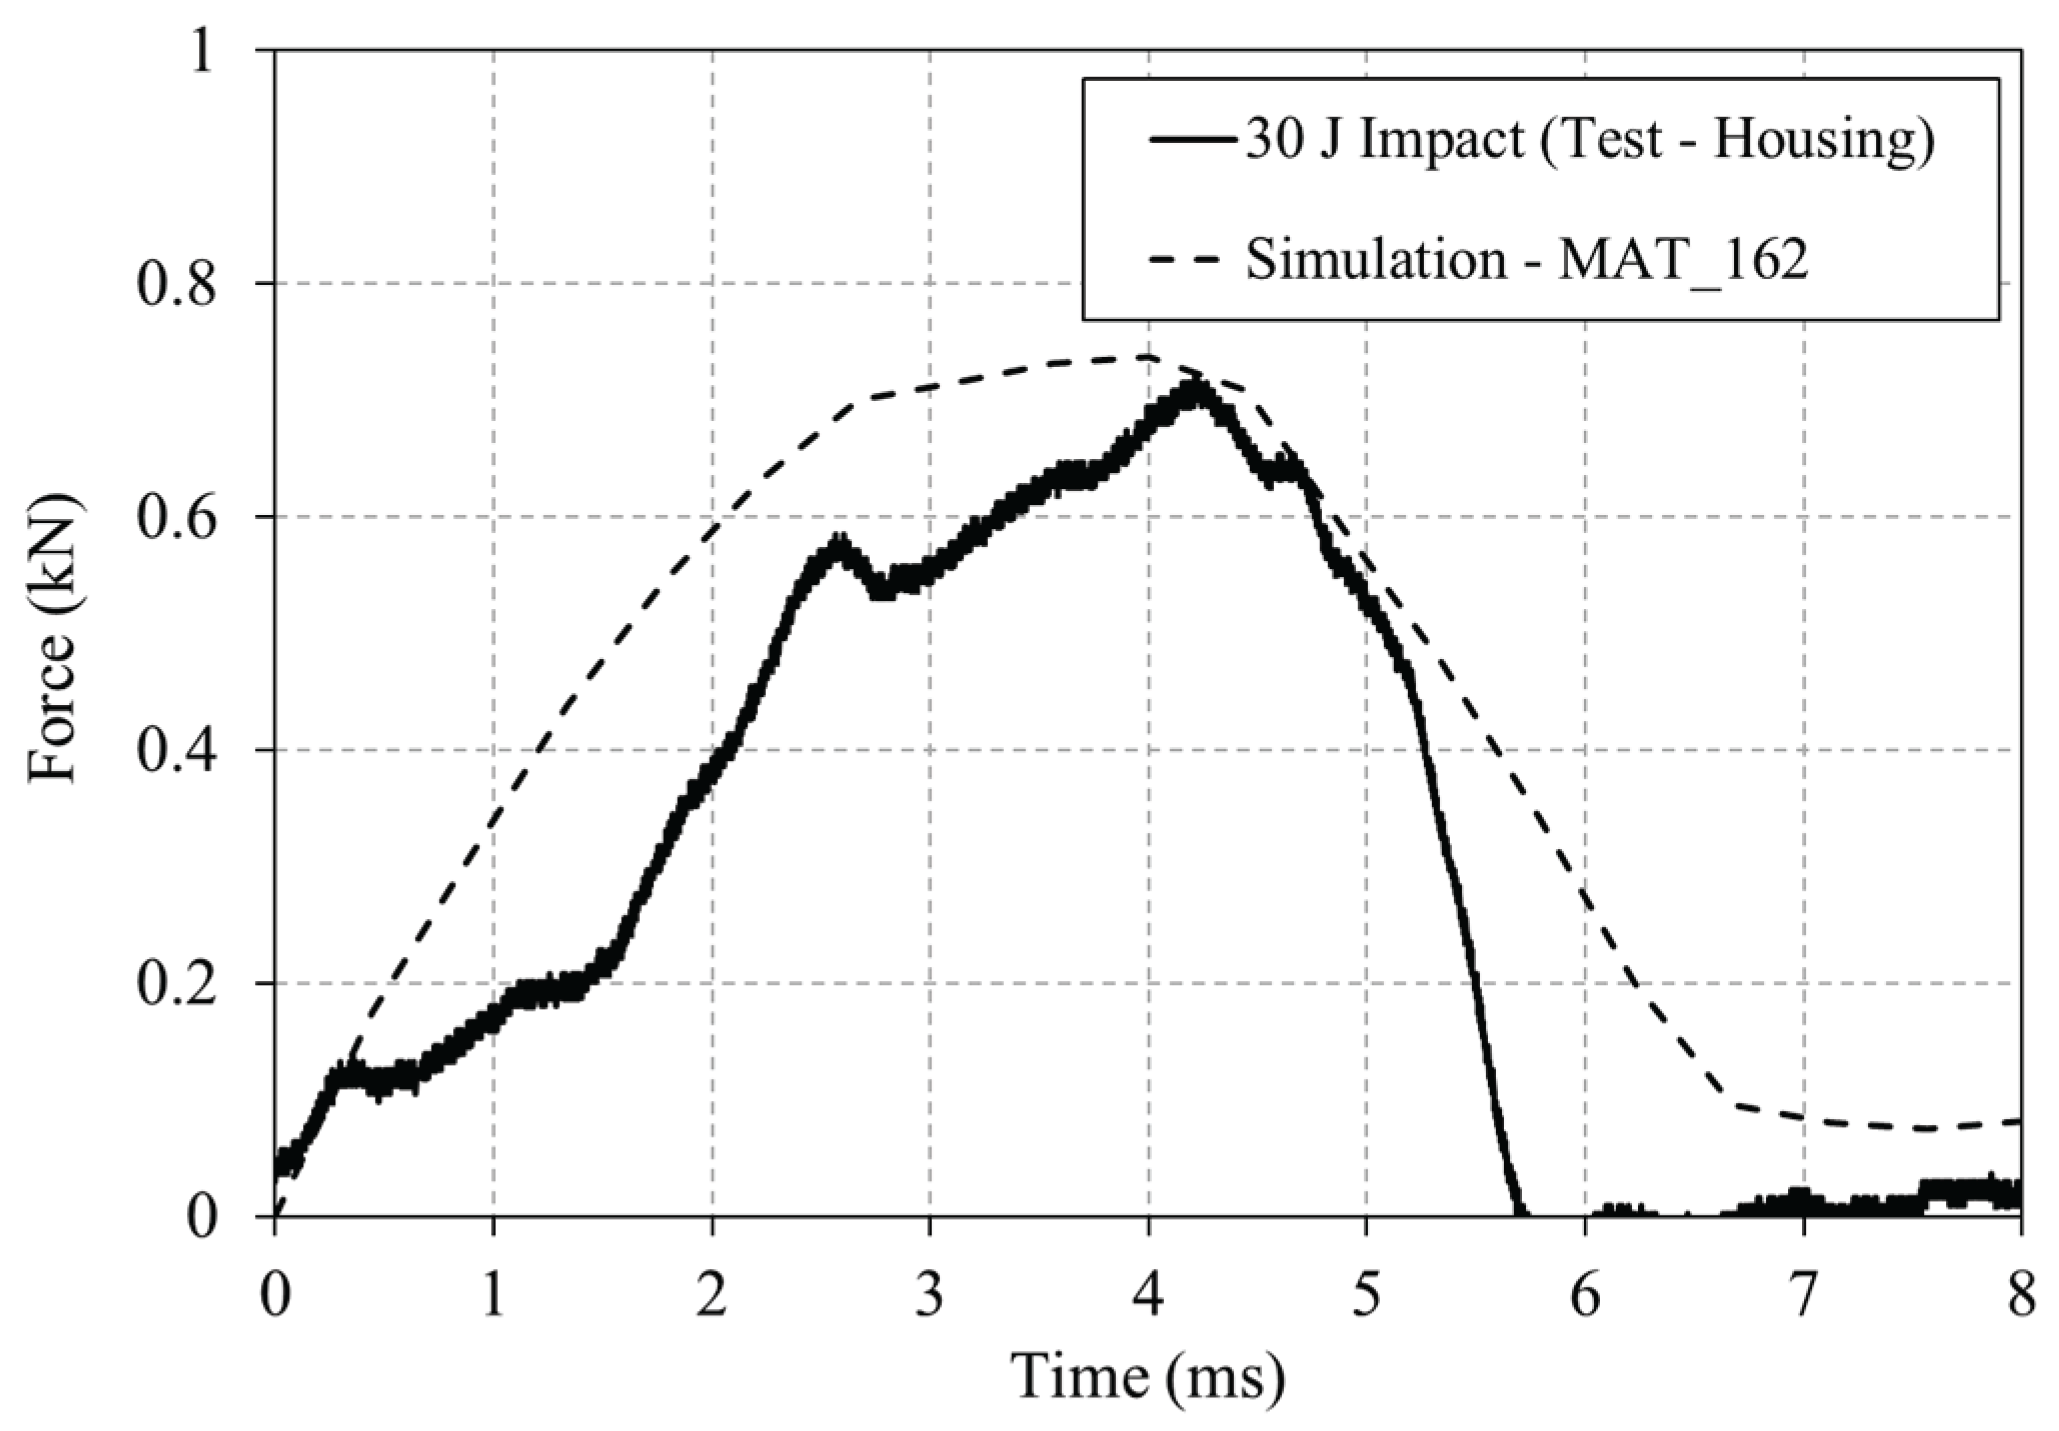
Figure 19.
Experimental versus numerical results of SMC housing subjected to 30 J impact. a) Front face, b) back face, c) side profile comparison.
Figure 19.
Experimental versus numerical results of SMC housing subjected to 30 J impact. a) Front face, b) back face, c) side profile comparison.
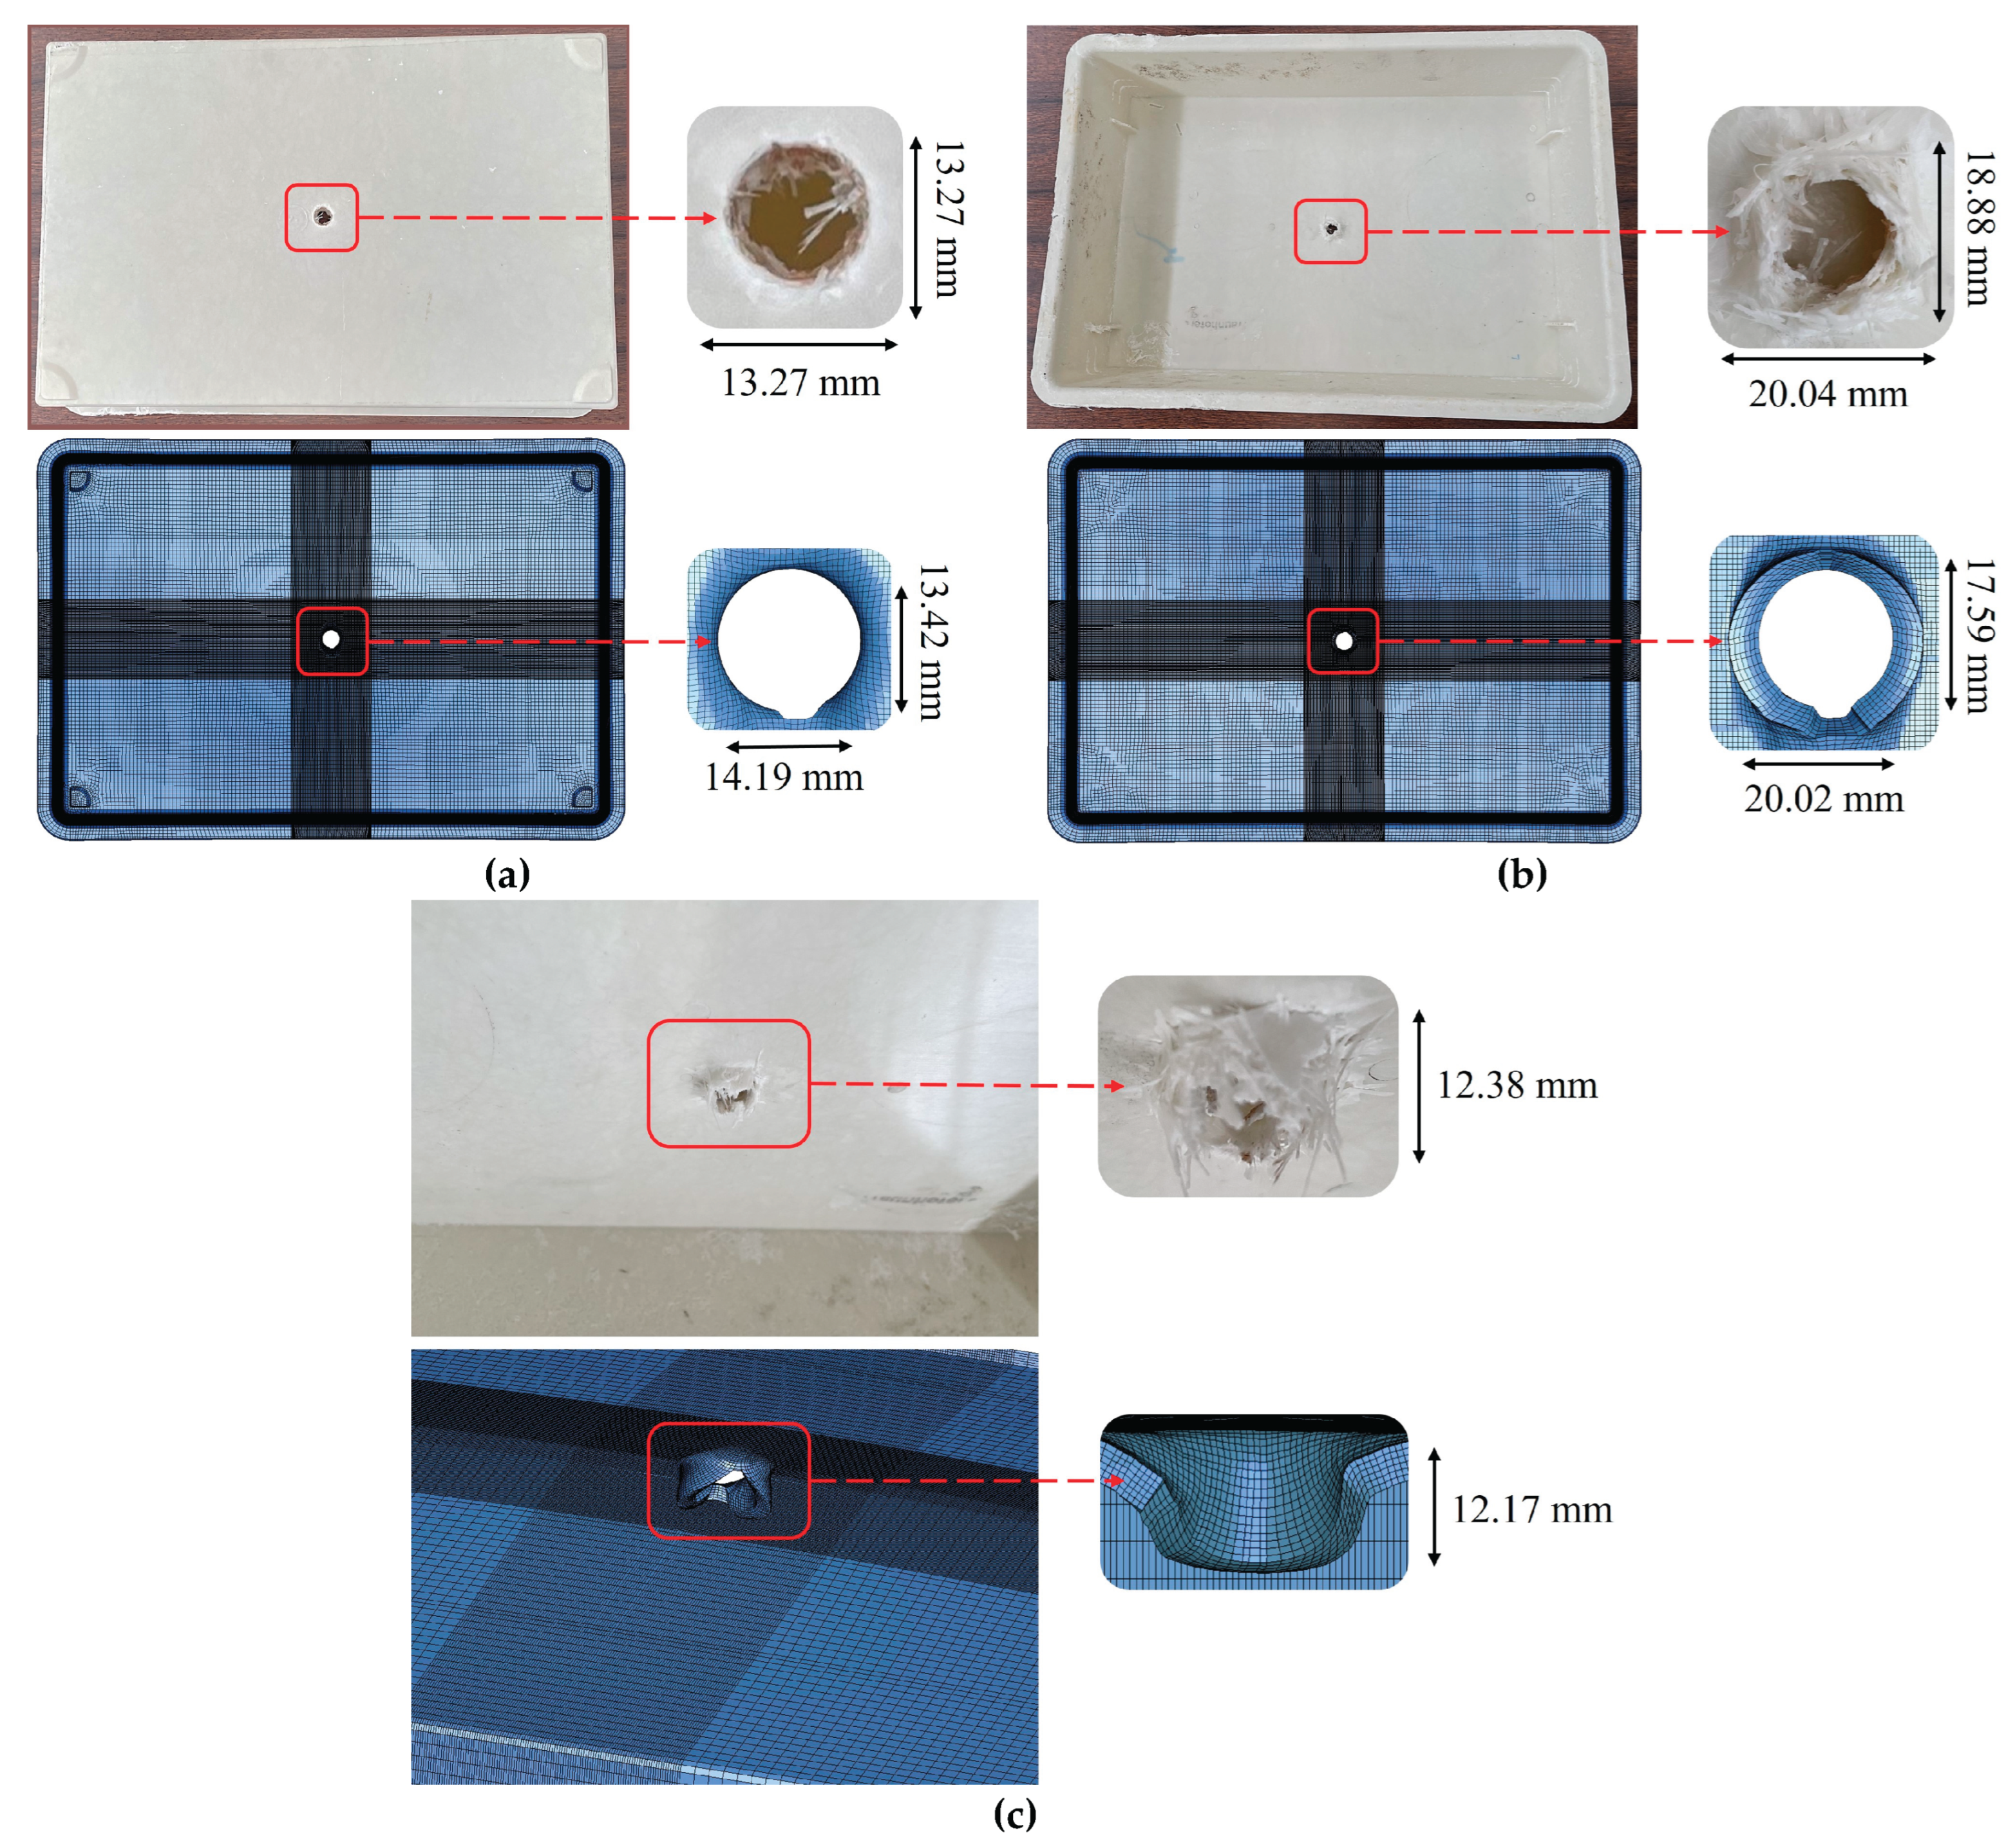
Figure 20.
Interaction of the housing and the cells/cell pack at the maximum displacement of the impactor for the impact cases of (a) 10 m/s, (b) 15 m/s, (c) 20 m/s, and (d) 25 m/s.
Figure 20.
Interaction of the housing and the cells/cell pack at the maximum displacement of the impactor for the impact cases of (a) 10 m/s, (b) 15 m/s, (c) 20 m/s, and (d) 25 m/s.
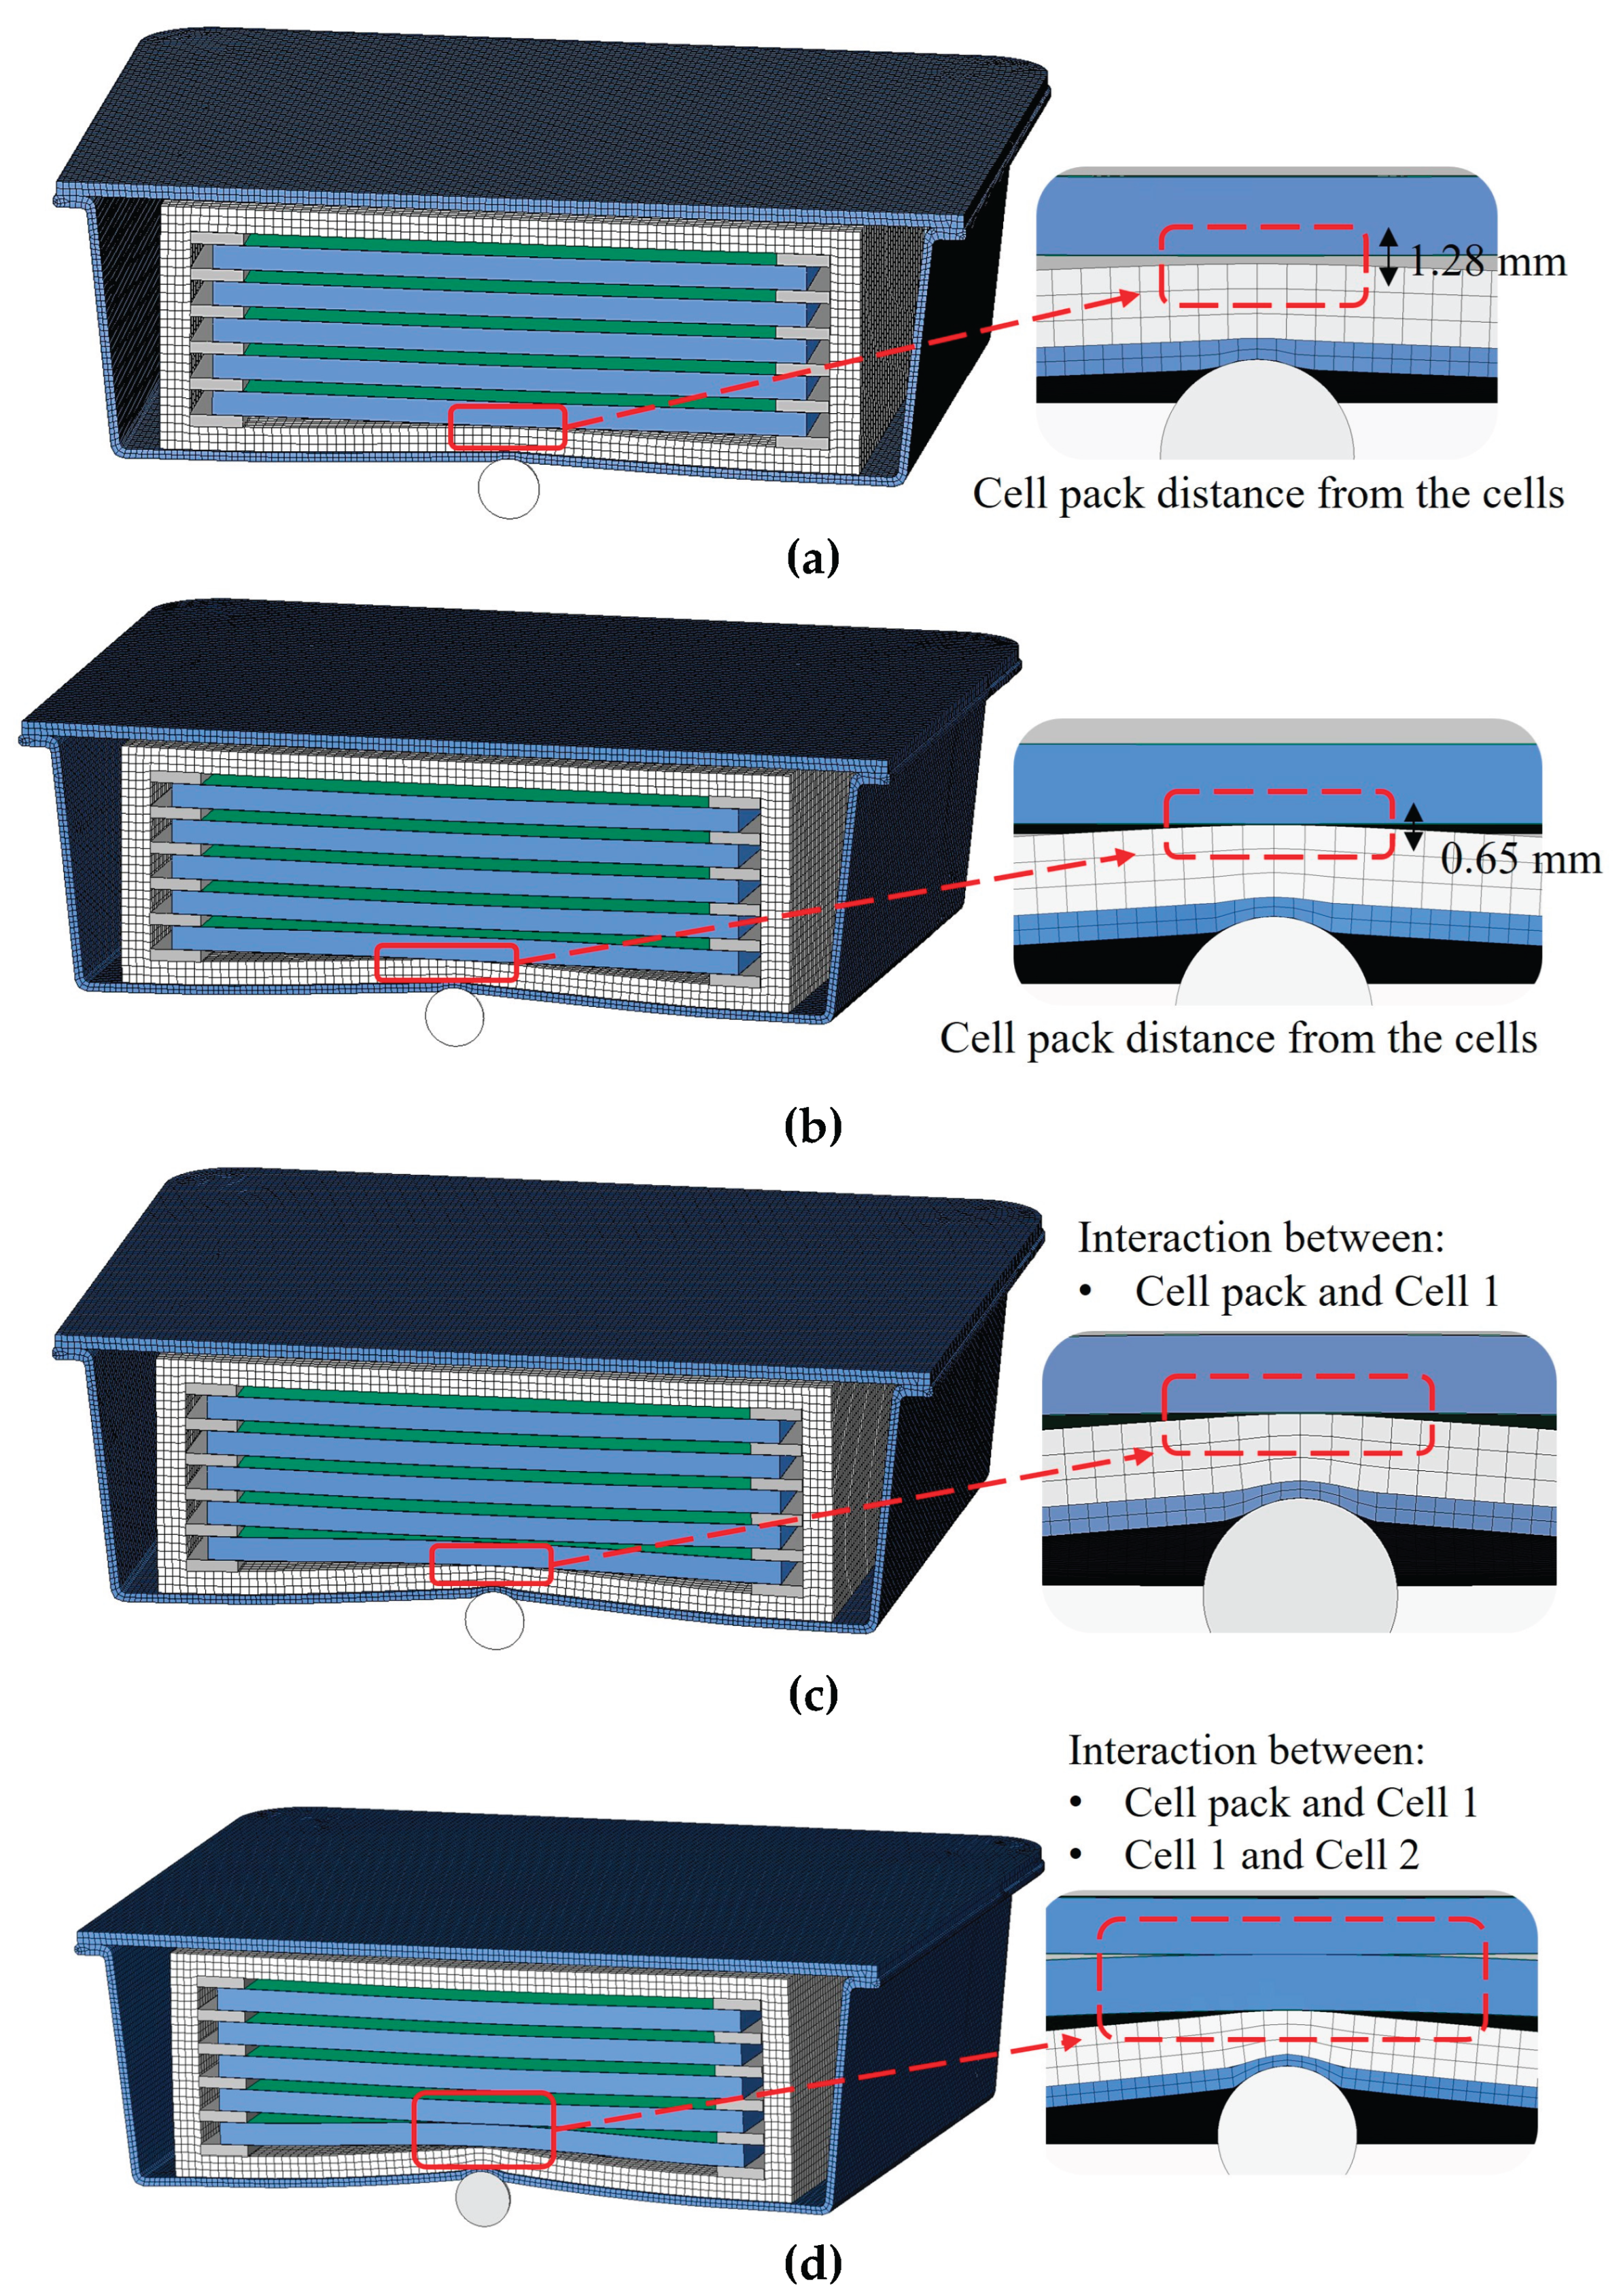
Figure 21.
Permanent deformation in the x and y directions for the housing and the cell pack after being subjected to ground impact of (a) 15 m/s, (b) 20 m/s, (c) 25 m/s.
Figure 21.
Permanent deformation in the x and y directions for the housing and the cell pack after being subjected to ground impact of (a) 15 m/s, (b) 20 m/s, (c) 25 m/s.
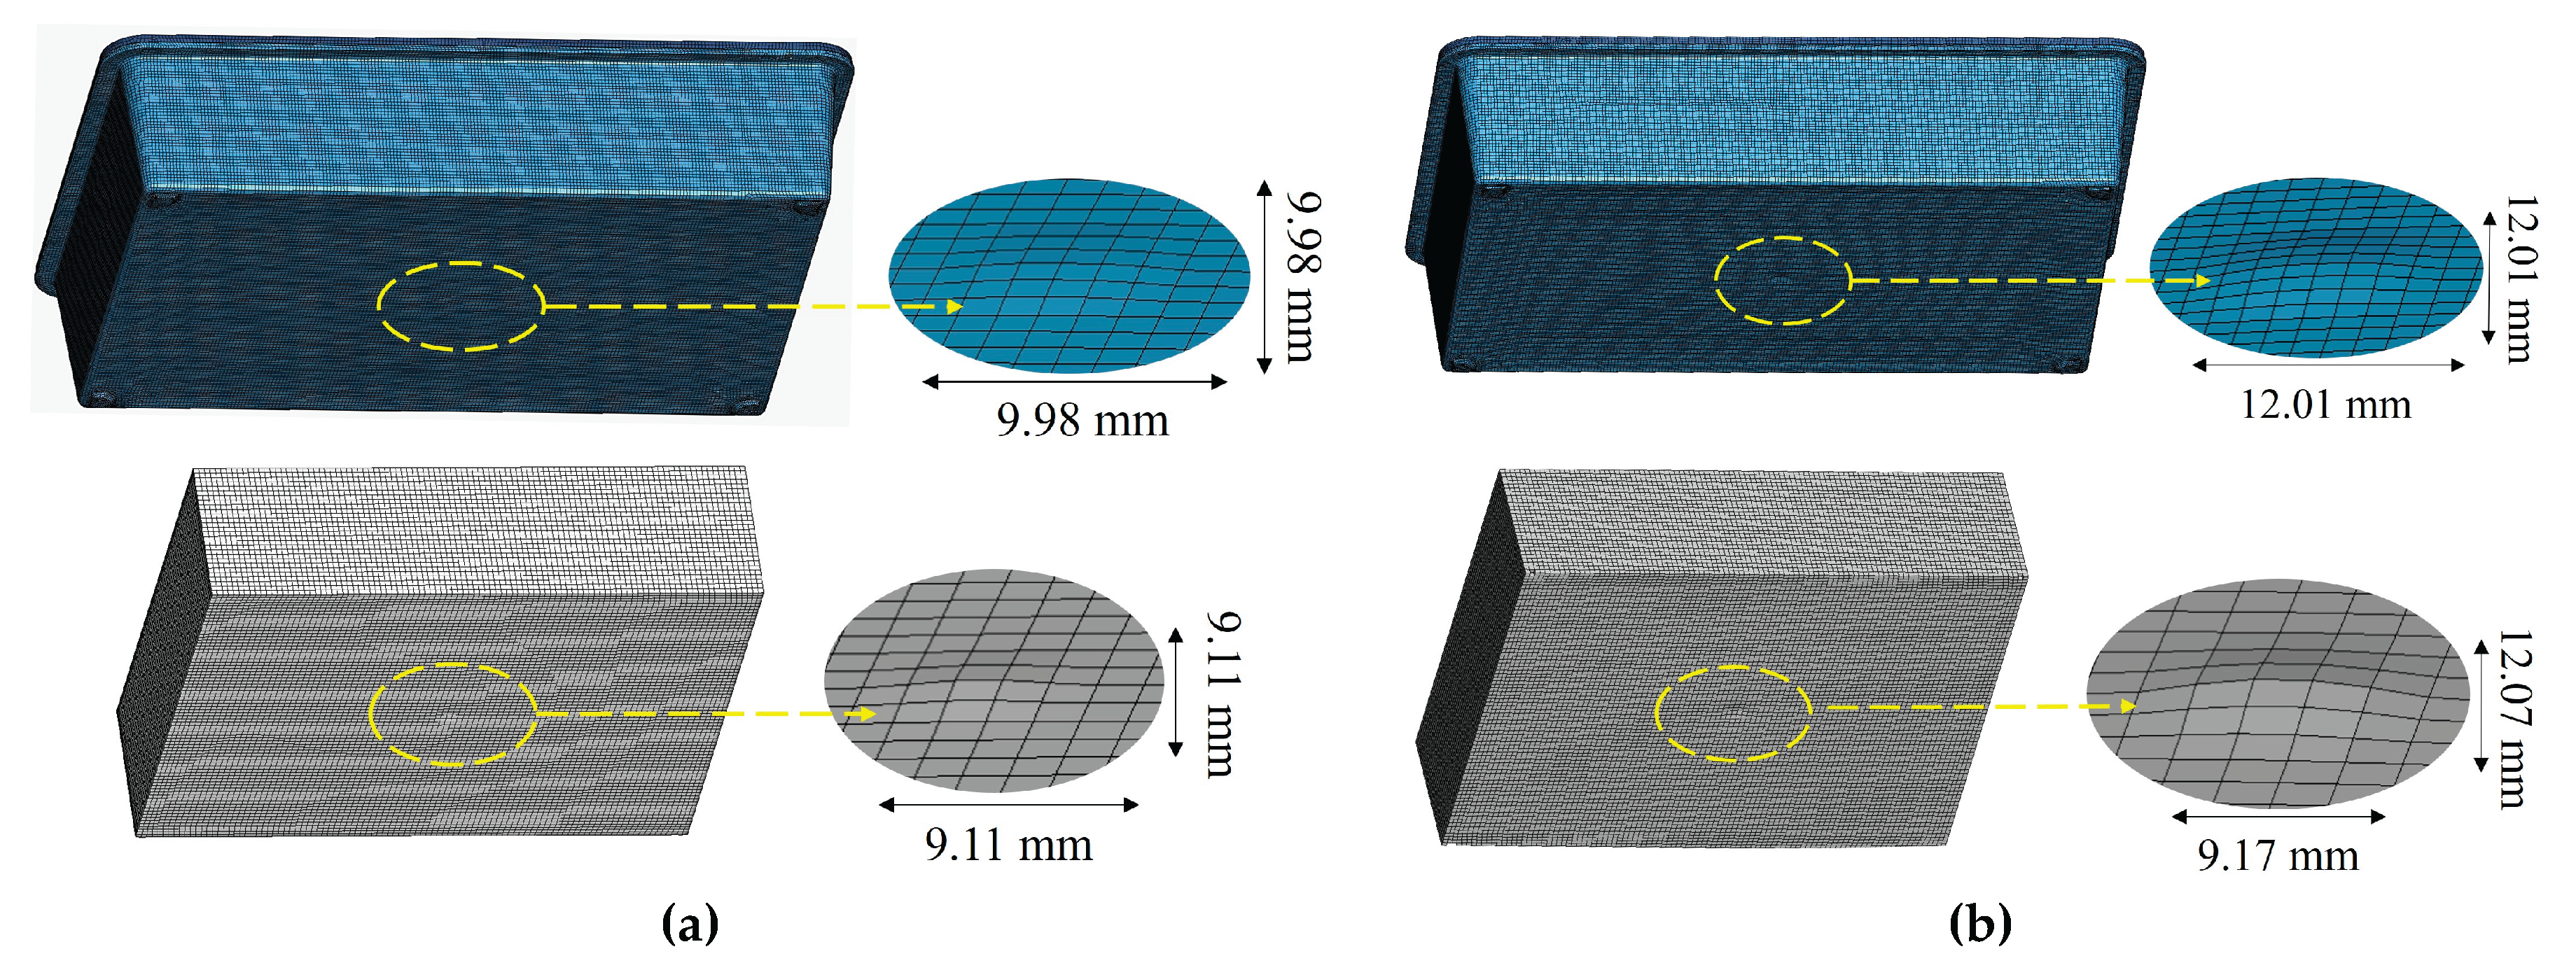
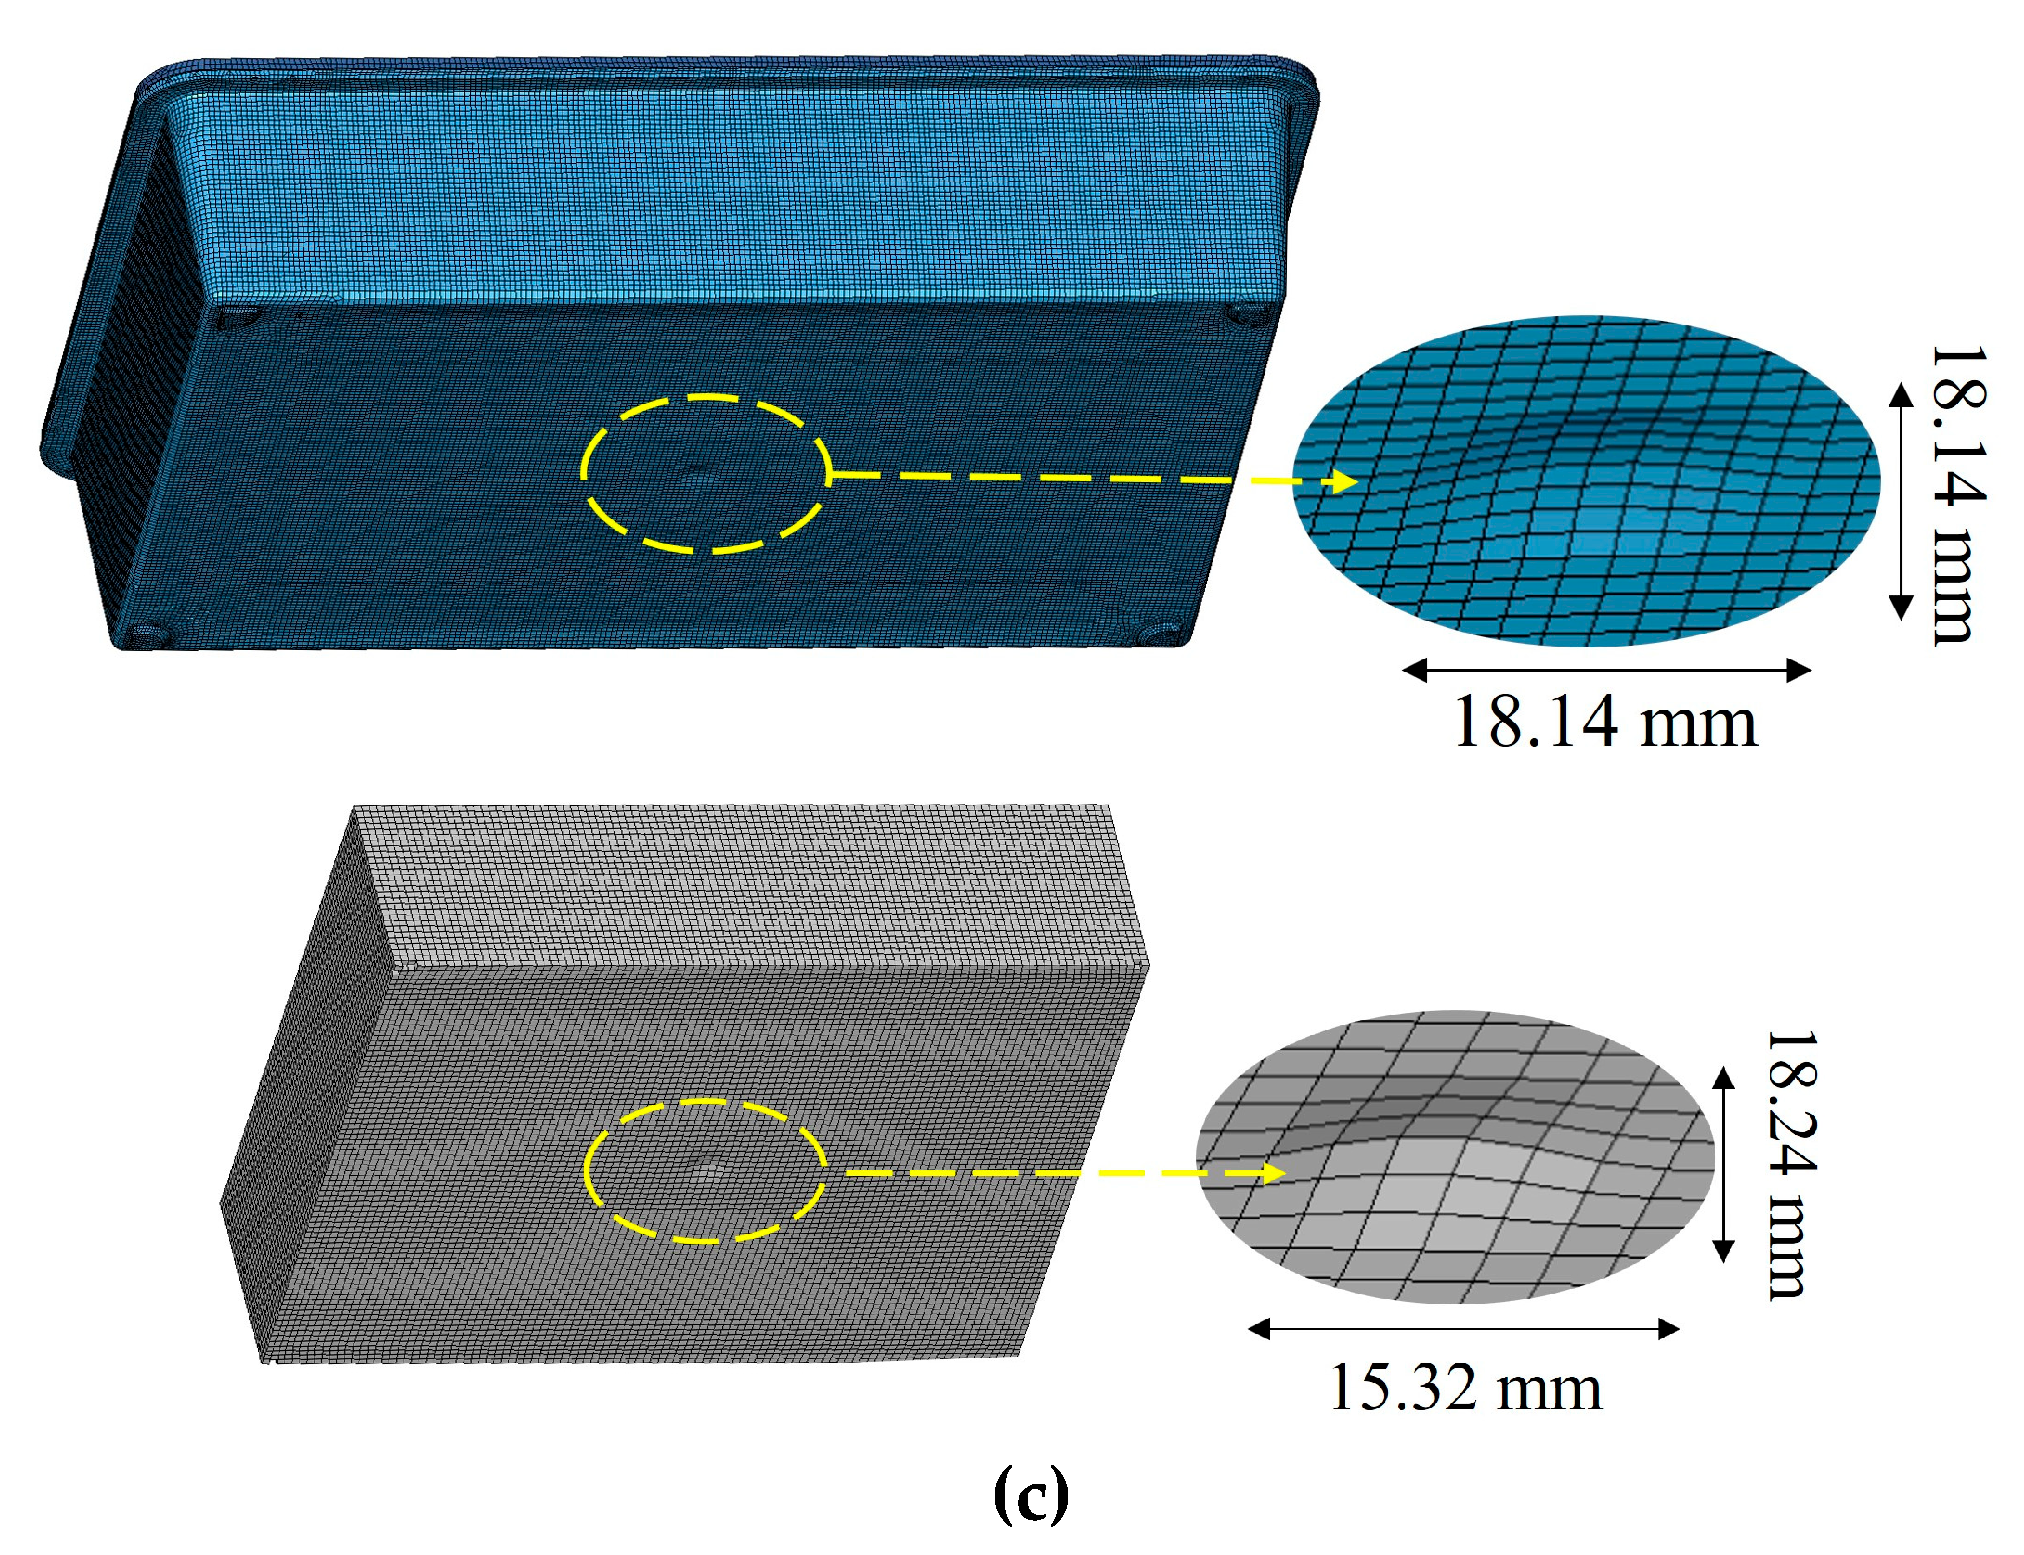
Figure 22.
Maximum displacement of the housing and cell pack after the event of (a) 10 m/s, (b) 12.5 m/s and (c) 15 m/s pole impact.
Figure 22.
Maximum displacement of the housing and cell pack after the event of (a) 10 m/s, (b) 12.5 m/s and (c) 15 m/s pole impact.
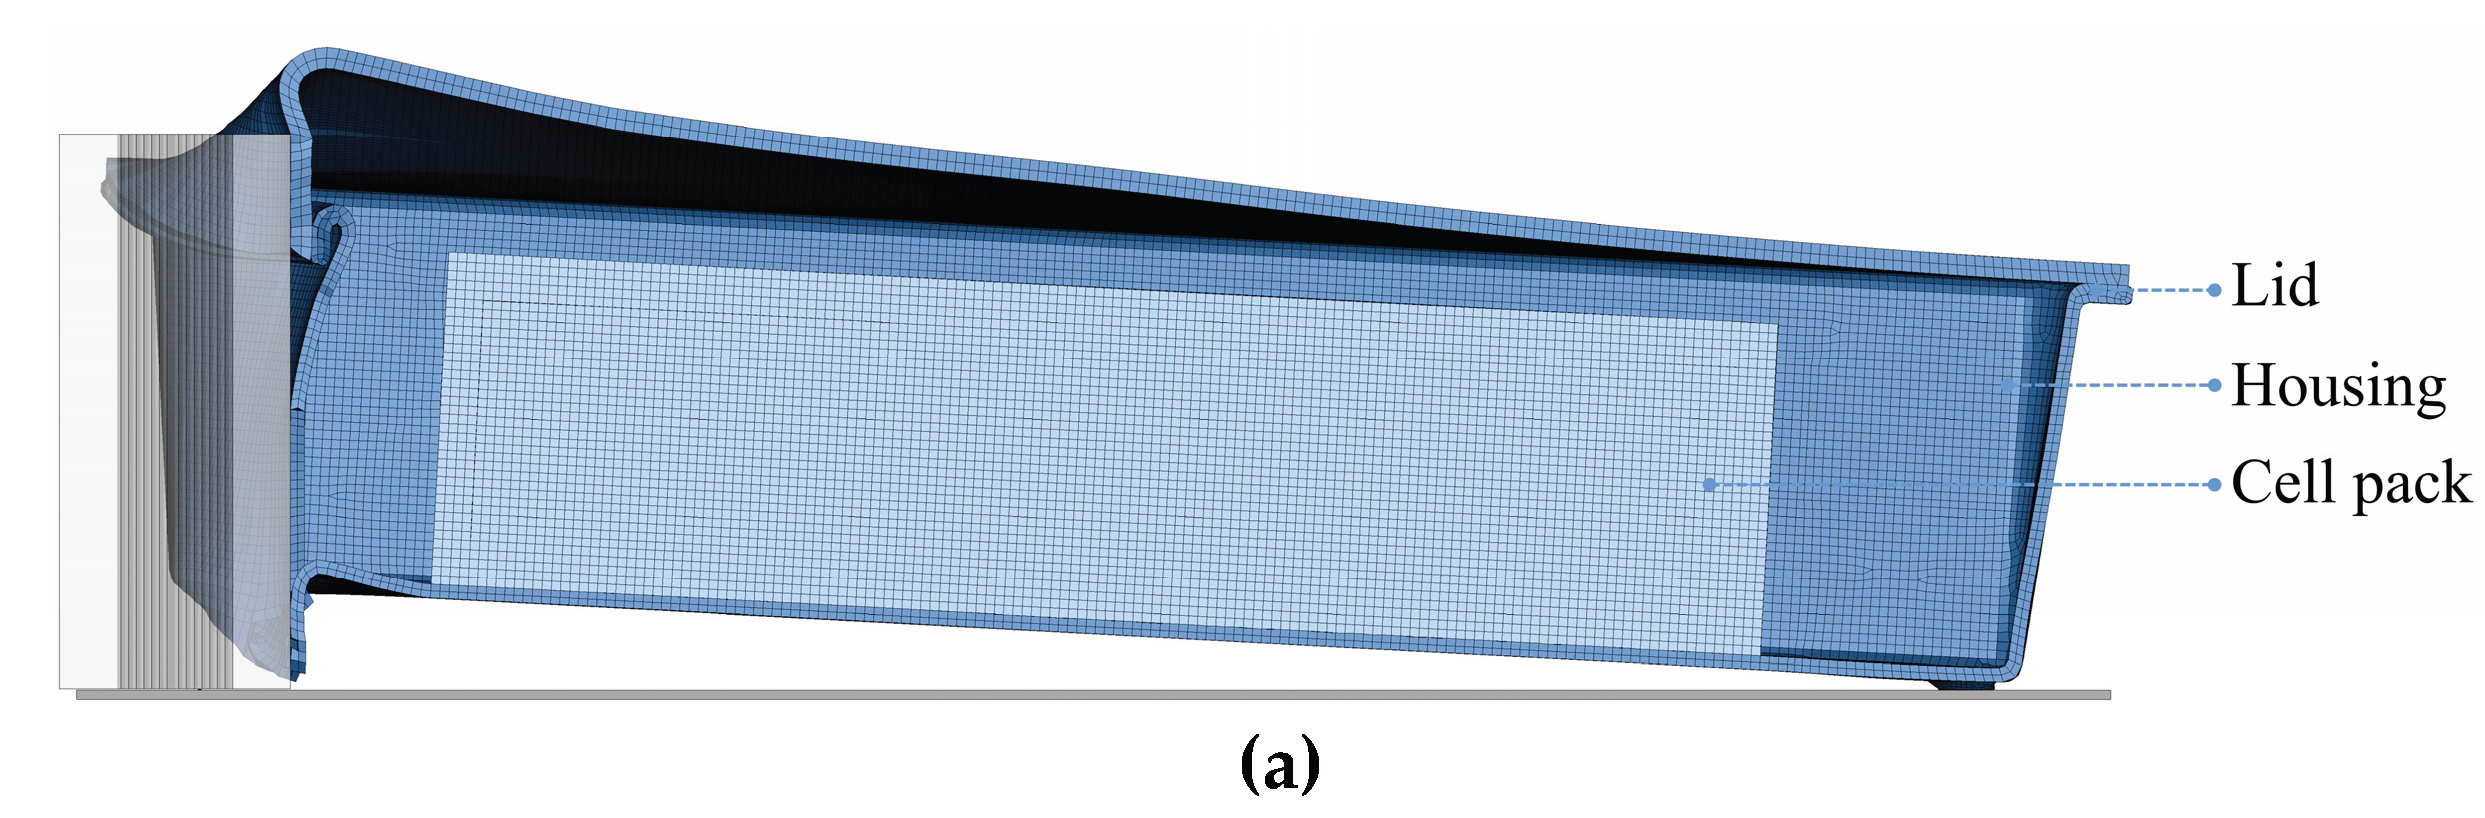
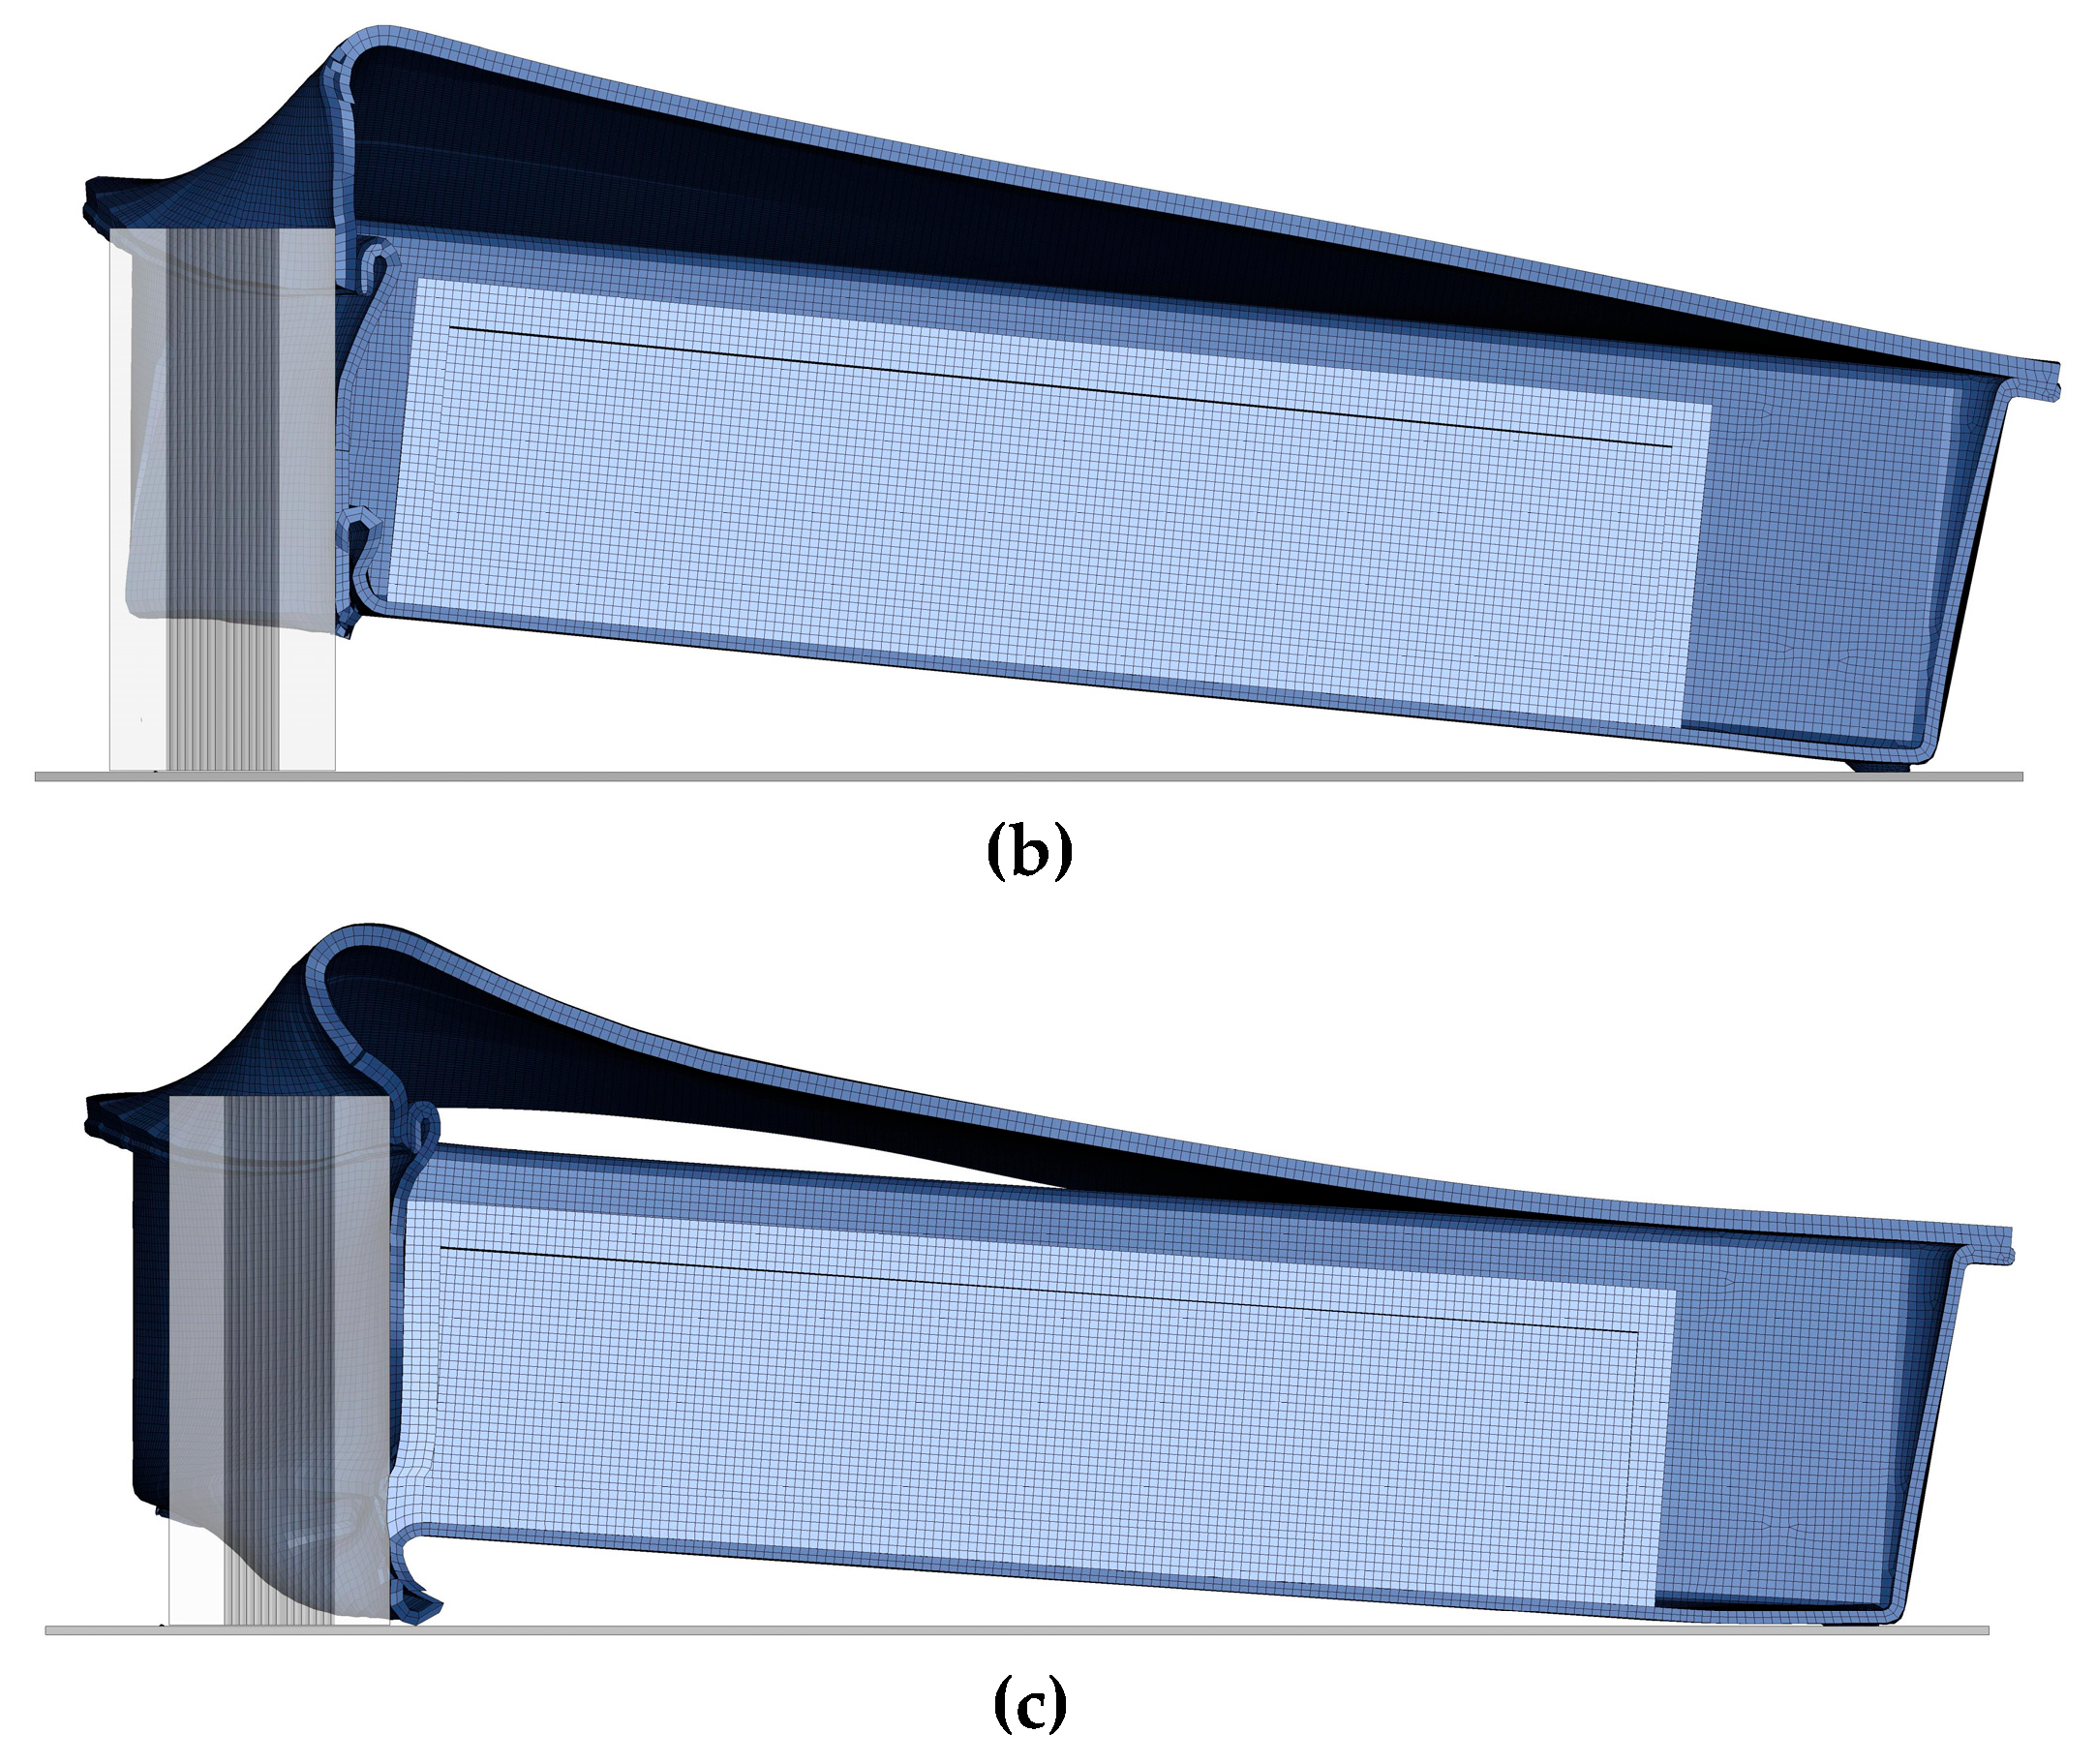
Figure 23.
Interaction of the housing and the cell pack / lid at the maximum displacement of the impactor after the event of the 15 m/s pole impact: (a) left view (intersection), (b) right view.
Figure 23.
Interaction of the housing and the cell pack / lid at the maximum displacement of the impactor after the event of the 15 m/s pole impact: (a) left view (intersection), (b) right view.
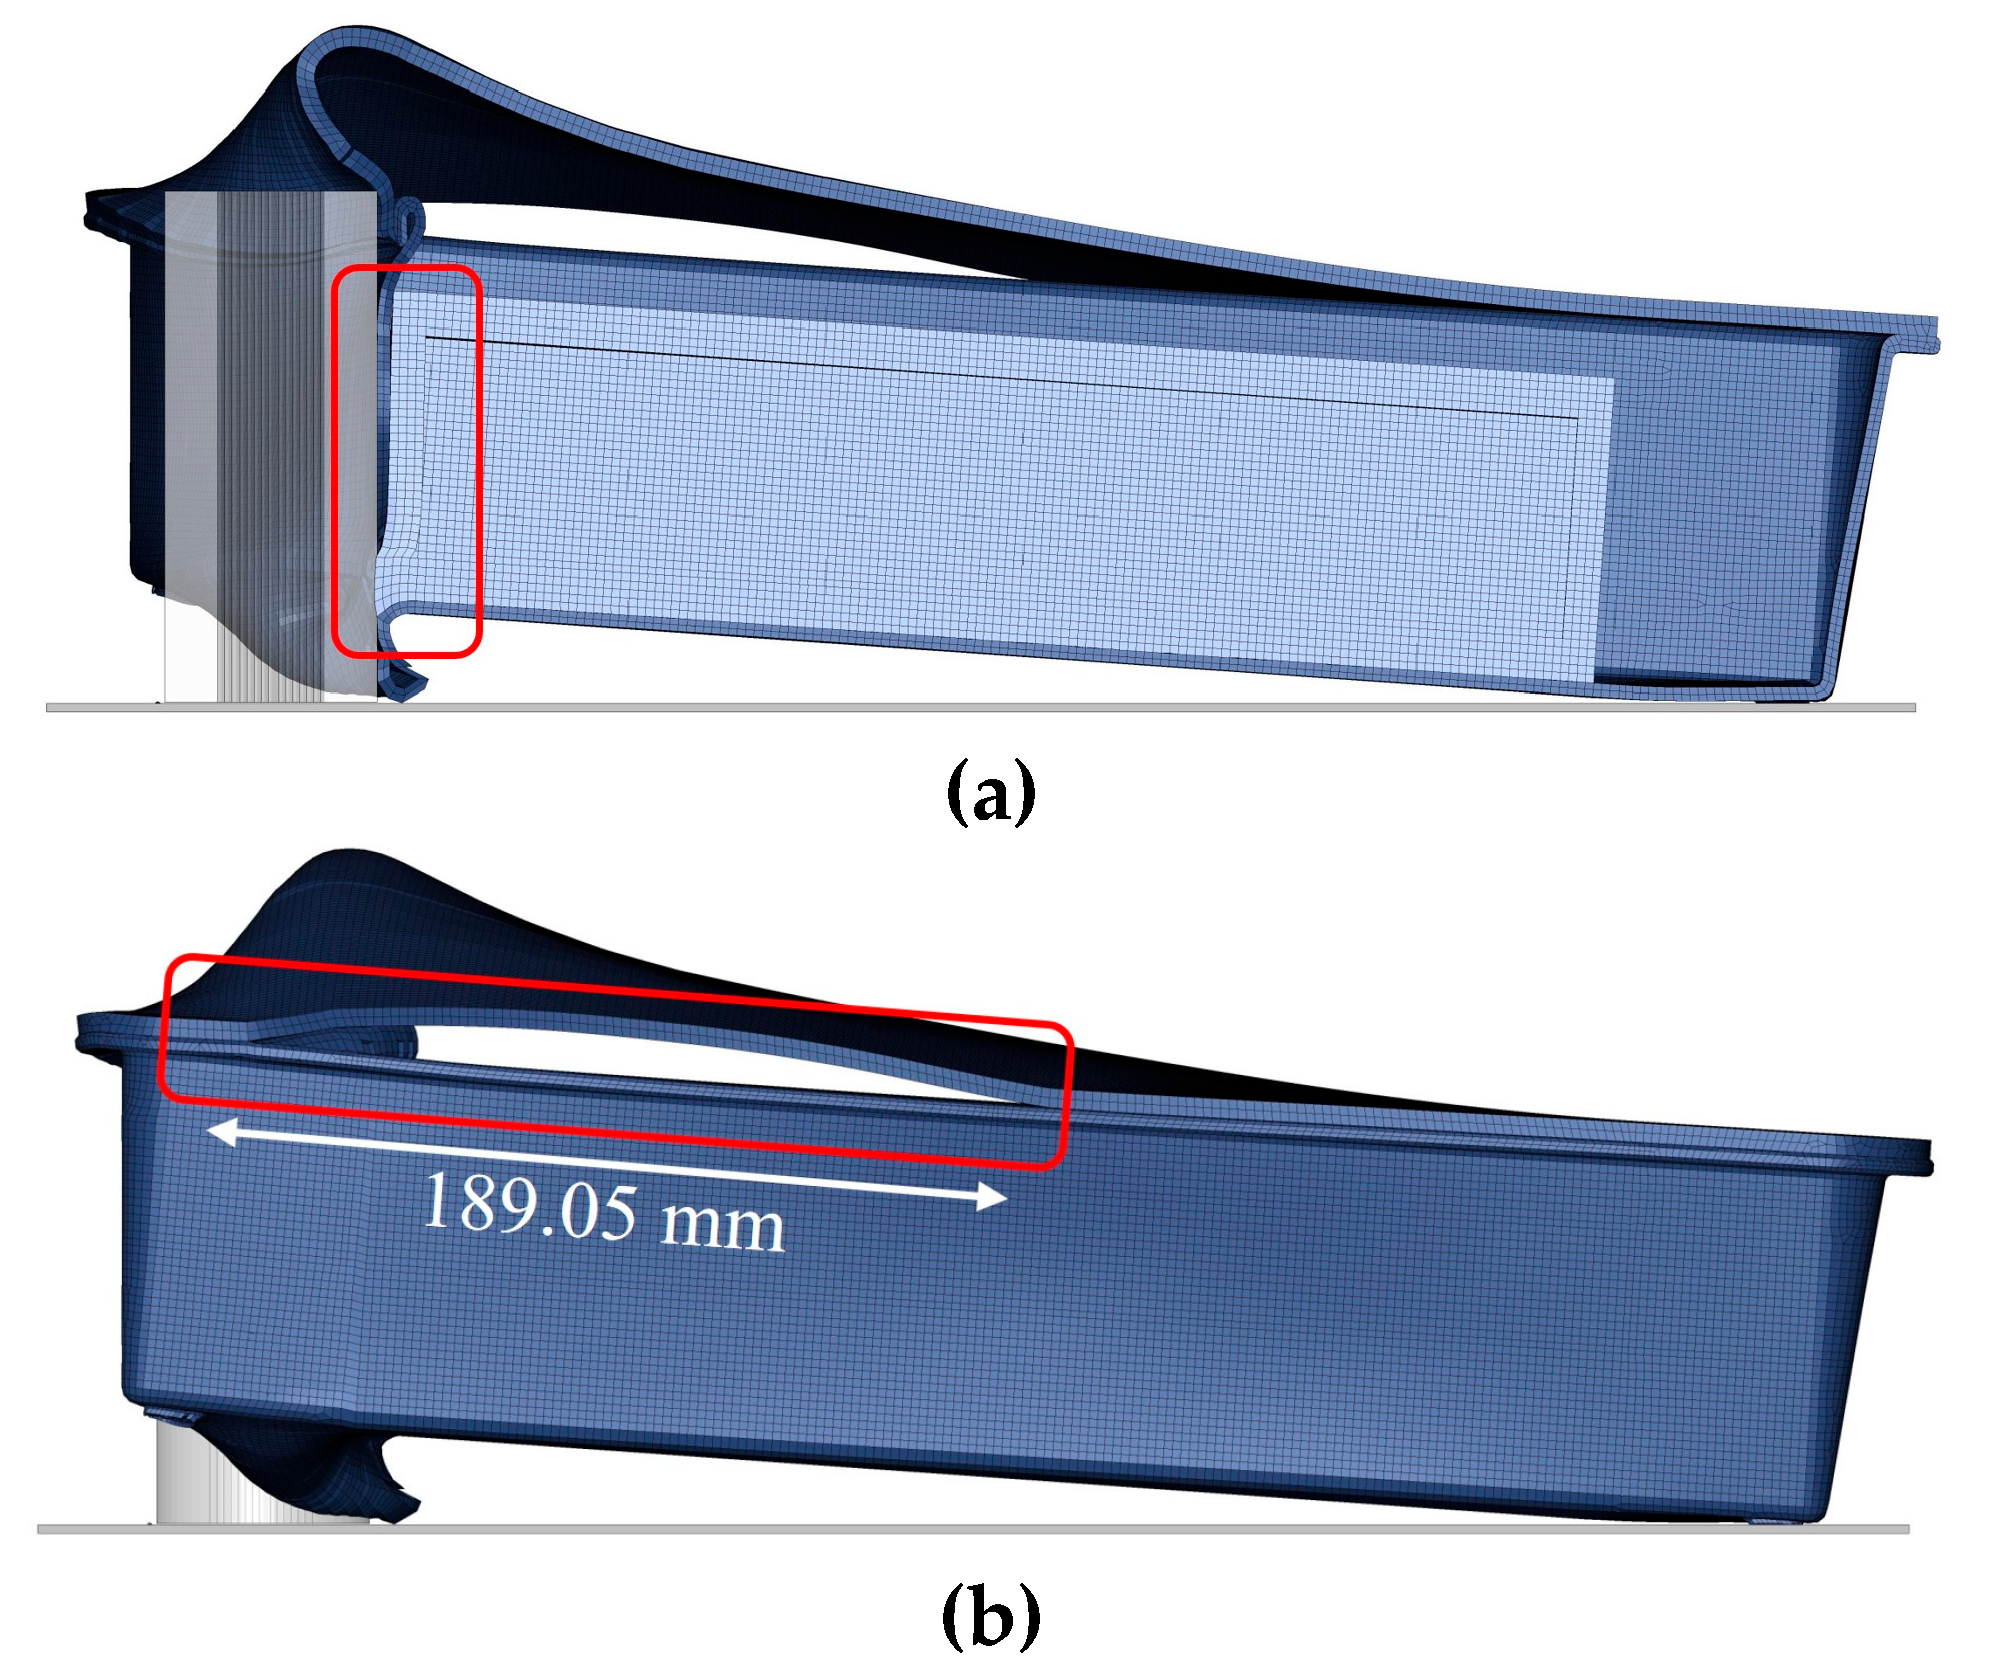

Table 1.
Mechanical testing parameters.
| Test | Standard | Specimen dimensions | Speed of testing |
|---|---|---|---|
| Tension | ASTM D3039 | 250 × 25 × 2.5 mm3 | 1 mm/min |
| Compression | ASTM D3410 | 140 × 25 × 2.5 mm3 | 1 mm/min |
| Three-point bending | ASTM D790 | 95 × 18 × 4.5 mm3 | 2.2 mm/min |
| Shear | ASTM D7078 | 76 × 56 × 4.5 mm3 | 2 mm/min |
Table 2.
Mechanical properties of the SMC composite derived from standardized testing.
| Property | Value |
|---|---|
| Modulus of Elasticity | 12.26 GPa |
| Tensile strength | 94.99 MPa |
| Poisson’s ratio | 0.15 (-) |
| Compressive modulus | 13.61 GPa |
| Compressive strength | 133.83 MPa |
| Flexural modulus | 12.91 GPa |
| Flexural strength | 190.31 MPa |
| Shear modulus | 5.8 GPa |
| Shear strength | 76.92 MPa |
Table 3.
Steel input parameters for MAT_20.
| Parameter | Value |
|---|---|
| Density, RO | 7580 kg/m3 |
| Young’s modulus, E | 200 GPa |
| Poisson’s ratio, PR | 0.33 (-) |
Table 4.
SMC input parameters for MAT_162.
| Parameter | Value |
|---|---|
| Density, RO | 1878 kg/m3 |
| Young’s modulus - longitudinal direction, Ea | 12.2 GPa |
| Young’s modulus - transverse direction, Eb | 12.2 GPa |
| Young’s modulus - through thickness direction, Ec | 5 GPa |
| Poisson’s ratio, vba | 0.15 (-) |
| Poisson’s ratio, vca, vcb | 0.18 (-) |
| Shear modulus, Gab | 5.8 GPa |
| Shear modulus, Gbc, Gca | 3.5 GPa |
| Longitudinal tensile strength, SaT | 95 MPa |
| Transverse tensile strength, SbT | 95 MPa |
| Through thickness tensile strength, ScT | 75 MPa |
| Longitudinal compressive strength, SaC | 133 MPa |
| Transverse compressive strength, SbC | 133 MPa |
| Matrix mode shear strength, Sab, Sbc, Sca | 76 MPa |
Table 5.
Delamination damage model input data for Tiebreak contact.
| Parameter | Value |
|---|---|
| Normal failure stress (peak traction), NFLS | 40 MPa |
| Shear failure stress (peak traction), SFLS | 60 MPa |
| Exponent of the mixed mode criterion (Power law), PARAM | 2 |
| Normal energy release rate, ERATEN | 1.7 MPa·mm |
| Shear energy release rate, ERATES | 0.789 MPa·mm |
| Tangential stiffness to normal stiffness, CT2CN | 1 |
| Normal stiffness, CN | 106 MPa/mm |
Table 6.
Ground impact parameters.
| Impactor’s initial velocity | Total energy | |
|---|---|---|
| i. | 10 m/s | 15 J |
| ii. | 15 m/s | 33.75 J |
| iii. | 20 m/s | 60 J |
| iv. | 25 m/s | 93.75 J |
Table 7.
Material input data for ABS properties.
| Parameter | Value |
|---|---|
| MAT_12 | |
| Density, RO | 1040 kg/m3 |
| Shear modulus, G | 0.85 GPa |
| Yield stress, SIGY | 41.5 MPa |
| Bulk modulus, BULK | 3.94 GPa |
| MAT_ADD_EROSION | |
| Equivalent stress at failure, SIGVM | 55 MPa |
Table 8.
Material parameters of the cell components implemented in MAT_01.
| Parameter | Value | |
|---|---|---|
| Aluminum foil | Polymer gel | |
| Density, RO | 2700 kg/m3 | 900 kg/m3 |
| Young’s modulus, E | 69 GPa | 1.5 GPa |
| Poisson’s ratio, PR | 0.33 (-) | 0.45 (-) |
Table 9.
Pole impact model parameters.
| Impactor’s initial velocity | Total energy | |
|---|---|---|
| i. | 10 m/s | 350 J |
| ii. | 12.5 m/s | 547 J |
| iii. | 15 m/s | 787 J |
Table 10.
Permanent deformation of the housing and the cell pack in the z direction after ground impact of 10, 15, 20, 25 m/s.
Table 10.
Permanent deformation of the housing and the cell pack in the z direction after ground impact of 10, 15, 20, 25 m/s.
| Impact velocity | Permanent deformation | ||
|---|---|---|---|
| Housing | Cell pack | ||
| i. | 10 m/s | 0.07 mm | 0.01 mm |
| ii. | 15 m/s | 0.57 mm | 0.72 mm |
| iii. | 20 m/s | 1.01 mm | 1.25 mm |
| iv. | 25 m/s | 1.07 mm | 1.32 mm |
Disclaimer/Publisher’s Note: The statements, opinions and data contained in all publications are solely those of the individual author(s) and contributor(s) and not of MDPI and/or the editor(s). MDPI and/or the editor(s) disclaim responsibility for any injury to people or property resulting from any ideas, methods, instructions or products referred to in the content. |
© 2025 by the authors. Licensee MDPI, Basel, Switzerland. This article is an open access article distributed under the terms and conditions of the Creative Commons Attribution (CC BY) license (http://creativecommons.org/licenses/by/4.0/).
Copyright: This open access article is published under a Creative Commons CC BY 4.0 license, which permit the free download, distribution, and reuse, provided that the author and preprint are cited in any reuse.


