Submitted:
10 September 2025
Posted:
11 September 2025
You are already at the latest version
Abstract
Previous research has found an association between attractiveness and personality traits, but the neural mechanisms are largely unknown. We used a Stroop-like paradigm combined with EEG recordings to investigate how personality traits affect the perception of facial and vocal attractiveness. Twenty-three female participants classified the attractiveness of male faces and male voices paired with positive or negative personality trait words. The behavioral results indicate that personality trait words that are semantically congruent with attractiveness levels facilitate the perception of attractiveness, whereas incongruent trait information produces the opposite effect. Event-related potentials revealed that the influence of personality trait words on facial attractiveness was primarily related to motivated attention as indicated by the late positive component. In the voice task, personality trait words impacted vocal attractiveness processing first during semantic integration (N400 component) and then modulated motivated attention. These results suggest that alleged personality traits modify attractiveness processing in faces and voices in relatively late and partially modality-specific stages.
Keywords:
facial attractiveness
; vocal attractiveness
; personality trait words
; ERP
Introduction
Attractiveness refers to the degree to which a person’s sexual appeal or beauty captures the perceiver’s attention and elicits positive emotional experiences and a desire to approach (Hill et al., 2017; Rhodes, 2006). Individuals who are physically attractive or have an appealing voice are commonly believed to possess more socially desirable, positive personality traits, reflecting the stereotype of “what is beautiful is good” (Dion et al., 1972; Zuckerman et al., 1990). In turn, personality traits can also influence evaluations of facial and vocal attractiveness; that is, individuals with positive personality traits are often perceived as more attractive, aligning with the stereotype of “what is good is beautiful” (Langlois et al., 2000; Wu et al., 2022). This stereotype represents the reverse mechanism of the halo effect, evolving from the notion that “what is beautiful is good”, which is supported by meta-analytic evidence (Eagly et al., 1991). People may infer others’ personality traits through external features such as facial, vocal, and body attractiveness. Similarly, alleged personality traits, such as morality (which is often considered a dimension of personality traits in social perception contexts (McAdams & Mayukha, 2024)), can influence the perceived attractiveness of external features. However, the perceptual or cognitive processes through which personality trait information influences perceived attractiveness are not well understood. By examining how personality traits modulate perceptions of attractiveness across facial and vocal modalities, this work seeks to expand our understanding of the cognitive and neural mechanisms underlying these stereotypes. The present study investigated this question combining a Stroop-like paradigm with the event-related potential (ERP) technique.
The Perception of Facial Attractiveness and Its Relationship with Personality Traits
ERP studies have shown that facial attractiveness affects brain responses such as the P1, N170, P2, and LPC components (Halit et al., 2000; Marzi & Viggiano, 2010; Pizzagalli et al., 2002; Schacht et al., 2008), with highly attractive faces eliciting larger N170 compared to less attractive faces (Marzi & Viggiano, 2010), indicating more pronounced in structural encoding of faces and motivated attention. Additionally, the interaction with attractive individuals or its anticipation triggers positive emotional responses and a desire for a closer relationship (Pataki & Clark, 2004).
Facial attractiveness influences various social and psychological outcomes, including mate selection, kin relationships and career prospects (Busetta et al., 2013) and the inference of certain personality traits (). For example, there is the “what is beautiful is good” stereotype where attractive individuals are attributed more positive behaviors, characteristics, and personality traits and are treated more favorably (Langlois et al., 2000). For example, teachers’ evaluations of students across multiple dimensions, such as their academic potential and intelligence, and students’ evaluations of teachers in areas, such as organizational skills and classroom management, are influenced by attractiveness levels (Liu et al., 2013). Preferences for attractiveness also exist in the labor market, social interactions, and even in politics (Kamenica, 2012; Johnston, 2010; Berggren et al., 2010; Rosar et al., 2008).
Personality traits are amongst the most important factors influencing mate selection, cooperation, and decision-making. Li et al. (2024) and Zhang et al. (2014) have shown that positive personality traits can increase the acceptance of unfair proposals and improve the rating of facial attractiveness. Research by Little et al. (2006) and Niimi and Goto (2023) explored how individuals’ expectation of their partner’s personality traits affected their preference for faces; they found that expected personality traits could significantly affect the attractiveness evaluation of faces. He et al. (2022) reported that faces related to prosocial moral vignettes were considered more attractive, and further supported the bidirectional relationship between moral character and aesthetic judgment.
The Perception of Vocal Attractiveness and Its Relationship with Personality Traits
ERP studies on vocal attractiveness have found that, as compared to low-attractive voices, high-attractive voices elicited larger N1 amplitudes (Zhang et al., 2020; Shang and Liu, 2022; Yuan et al., 2024) and LPC amplitudes (Zhang et al., 2020; Shang and Liu, 2022) in both conscious vocal attractiveness judgments and passive listening. These studies suggest that vocal attractiveness processing involves early rapid and mandatory processes, as well as late, strategy-based aesthetic decisions.
Voice also plays a role in shaping impressions related to social evaluations (Mileva et al., 2018). When visual cues are absent, such as hearing voices on the radio or telephone, listeners make judgments about the speaker based on vocal information (Borkenau & Liebler, 1992). Listeners exhibit high consistency in social evaluations and personality judgments of others even when faced with different speech content or in different language contexts (Mahrholz et al., 2018; McAleer et al., 2014). This phenomenon occurs partly because vocal acoustic information is correlated with actual personality traits (McAleer et al., 2014), and we can make judgments based on non-visual cues alone (for a review, see Groyecka et al., 2017). Indeed, vocal acoustic characteristics influence personality trait attribution, such as trustworthiness (Belin et al., 2017). During first impression formation vocal attractiveness was positively correlated with judgments of the speaker’s confidence, openness, and conscientiousness (Zuckerman et al., 1991). For example, when experts are asked to provide professional advice, they lower their average pitch and vocal tract resonance, presumably in order to obtain favorable evaluations in social environments (Groyecka et al., 2017).
Research on the influence of ascribed personality traits on vocal attractiveness is relatively scarce. One study examining the bidirectional relationship between vocal attractiveness and morality in the impression formation process (Wu et al., 2022). The results revealed a tendency to rate the voices of individuals associated with positive moral impressions as more attractive, in addition to associating highly attractive voices with better moral qualities. While these findings illustrate a harmonious bidirectional influence when perceptual and semantic cues align, a key question remains: How are evaluations formed when vocal attractiveness and ascribed personality traits provide conflicting signals, such as an appealing voice paired with negative moral descriptors?
One useful framework for understanding this apparent contradiction is provided by cognitive conflict and conflict-monitoring theories (Botvinick et al., 2001; Stürmer et al., 2009). This framework posits that conflicts in information processing—such as mismatches between perceptual attractiveness signals and semantic trait valence—trigger an evaluative monitoring system (potentially involving the anterior cingulate cortex) to detect the demand for control, leading to compensatory adjustments in attention and integration. According to this account, conflict can arise when concurrently active representations imply different evaluations — in our study, when externally derived perceptual signals (e.g., voice or face attractiveness) and internally represented semantic trait information favor different responses. When both types of cues are presented simultaneously — for example, a perceptually attractive face paired with a negative personality descriptor — these inputs create a representational mismatch that triggers conflict detection and resolution processes (Botvinick et al., 2001; Festinger, 1957). Such representational mismatch constitutes a form of cognitive conflict, which is detected by the anterior cingulate cortex (ACC) and subsequently resolved through the recruitment of prefrontal control systems. This framework predicts that external cues, given their perceptual salience, often dominate initial impressions, while internal cues exert stronger influence when perceptual information is ambiguous or uncertain. Neurocognitively, this conflict–resolution process is indexed by distinct ERP signatures: semantic mismatch arising from internal trait information is reflected in N400 modulations (Kutas & Federmeier, 2011), whereas later evaluative re-processing and control-related adjustments are reflected in late positive potentials (LPCs) associated with motivated attention (e.g.,Hajcak et al., 2009). In this way, conflict-monitoring theory provides a mechanistic account of how external perceptual signals and internal personality information are weighted and integrated in attractiveness evaluations.
The Present Study
Previous research has found that facial/vocal attractiveness and personality traits mutually influence each other. However, the neural mechanisms underlying the influence of (putative) personality traits on attractiveness perception are still unclear since pertinent studies are still missing. In this study, we used electroencephalography (EEG) and a Stroop-like paradigm to investigate the neurocognitive processes involved in the influence of personality traits on perceiving facial and vocal attractiveness. The classic Stroop paradigm is a widely used task to measure cognitive conflict arising from interference between relevant and irrelevant stimulus dimensions(Kornblum et al., 1990). Stroop-like paradigms are variations of this classic paradigm, adapted to probe cognitive conflict in other domains, such as semantic, emotional, or cross-modal incongruencies (e.g., spatial Stroop tasks where stimulus location conflicts with content). In the present study, we employed a Stroop-like paradigm where facial or vocal stimuli of high or low attractiveness are presented simultaneously with positive or negative personality trait words, analogous to the classic Stroop task’s simultaneous presentation of conflicting dimensions. Trait words presented concurrently with face/voice stimuli are expected to automatically activate semantic associations or valuations (e.g.,“honest”with positive), which can be congruent or incongruent with the perceptual attractiveness cue, thereby producing interference analogous to Stroop interference.
Our experiment included two tasks: In the face task, we presented participants with face stimuli of high or low attractiveness along with written denotations of positive or negative personality traits, requiring to judge facial attractiveness. The voice task was similar to the face task except that voice stimuli of high or low attractiveness was presented and vocal attractiveness was to be judged. Both tasks included congruent conditions (high facial/vocal attractiveness-positive personality traits, low facial/vocal attractiveness-negative personality traits) and incongruent conditions (high facial/vocal attractiveness-negative personality traits, low facial/vocal attractiveness-positive personality traits).
In terms of behavioral outcomes, based on previous research on stereotypes, we hypothesized that personality trait words semantically congruent with the attractiveness levels would facilitate attractiveness judgments, whereas incongruent trait information would counteract these evaluations. Furthermore, as a strong signal, the face may be relatively less affected by this effect. As for the ERP results, according to previous studies (e.g., Marzi & Viggiano, 2010) we predicted that, compared to low-attractive faces, high-attractive faces would elicit larger N170 and LPC amplitudes, but low-attractive faces would elicit larger P1 amplitudes compared to high-attractive faces (Halit et al., 2000). Similarly, compared to low-attractive voices, high-attractive voices should elicit larger N1, P2, and LPC amplitudes (Zhang et al. 2020; Shang & Liu, 2022; Yuan et al., 2024). More importantly, we expected incongruent conditions to elicit greater cognitive conflicts compared to congruent conditions, enhancing N400 amplitudes (e.g., Zahedi et al., 2019). The N400 typically begins 200-300 ms after the presentation of visual or auditory stimuli and peaks around 400 ms (Lau et al., 2008), and is thought to be triggered among others by semantic conflict (Zahedi et al., 2019), conflict control (Pan et al., 2020) and cognitive resource allocation (Paulmann & Kotz, 2008). Many studies have found that incongruent (vs. congruent) stimuli elicit larger N400 amplitudes, and this effect has been observed across different types of stimuli, such as speech, words, faces, and pictures (Ishii et al., 2010; Lau et al., 2008). Based on the conflict-monitoring account and prior ERP findings, we predicted that incongruent pairings would induce greater semantic/representational conflict — manifesting as enhanced N400 amplitudes — followed by increased LPC amplitudes reflecting control-related re-evaluation. If a positive personality trait is presented, it is usually associated with high attractiveness (according to stereotypes) and would facilitate the corresponding response. However, when the face/voice is unattractive, the response primed by a positive personality trait is incongruent with the required response. Moreover, because external perceptual cues (especially faces) are may be highly salient and dominate initial processing, semantic conflict may be resolved later for faces (producing stronger LPC effects), whereas vocal attractiveness—being comparatively more susceptible to semantic/contextual information—may more readily elicit early semantic conflict indexed by a larger N400 (Liu et al., 2023).
Previous research has found that gender affects attractiveness preferences (O’Connor et al., 2013; Feinberg et al., 2011). Specifically, men are more inclined to be attracted to attractive female faces or voices, while women prefer attractive male faces or voices and, furthermore, women who prefer male faces tend to also prefer male voices (O’Connor et al., 2012). Therefore, in order to reduce the complexity of the experimental design, we decided to recruit only female participants and to use only male faces and male voice stimuli.
2. Methods
2.1. Participants
Based on previous research (Thiruchselvam et al., 2016), the sample size was estimated by using G*power3.1 software (Faul et al., 2007). We specified an F-test for an ANOVA: “Repeated measures, within factors” (type of power analysis: a priori), set the effect size to f = 0.25 (medium), α = 0.05, power (1 − β) = 0.80, number of groups = 1 (within-subjects design), and number of measurements = 4 (four within-subject conditions). The correlation between repeated measurements and spherical vacation devices was set by default (correlation among repeated measures = 0.50 and nonsphericity correction ε = 1). Under these settings, G*Power indicated that a sample of approximately 23 participants (N ≈ 23) was required. A total of 30 female college students from Liaoning Normal University were recruited. All participants reported being heterosexual, with no history of mental illness, and having normal or corrected-to-normal hearing and vision. Three participants were excluded from the behavioral data analysis due to an error rate exceeding 50%. Due to equipment failure, EEG data from two additional participants were not recorded, and EEG data from two participants were excluded due to low quality (low number of valid trials after preprocessing and excessive artifacts). Consequently, the final sample for data analysis included 23 female participants with an average age of 22.12 ± 1.92 years. The experiment was approved by the Research Ethics Committee of Liaoning Normal University. All participants read and signed an informed consent form before the experiment and received compensation thereafter.
2.2. Stimuli
The stimuli included voice recordings, face images, and personality trait words. All voice recordings were selected from our own database and were of the emotionally neutral Chinese words “历史(history)”, “事物(things)”, and “心脏(heart)”. The recordings had been made in a quiet environment using a high-quality microphone (Bluebird SL, Blue Microphones) and Adobe Audition CS6 software, with a sampling rate of 44,100Hz at a bit rate of 32kbps, and stored in .wav format. Praat software was used for editing, retaining only the voiced segments, standardizing loudness at 70dB, and removing any recordings with noticeable background noise, mispronunciations, or unnatural speech, retaining voiced segments without equalizing F0 or duration to preserve attractiveness cues. For the experiment, 150 voice recordings from 50 male speakers were selected.
Photographs of faces were taken from previous research (Yang et al., 2015) and partially newly taken, resulting in 80 images of adult male faces. All portraits were taken from frontal view, with eyes looking straight ahead and displaying a neutral expression. Brightness and contrast were standardized using the SHINE toolbox in MATLAB(Willenbockel et al., 2010), which applies histogram equalization to match luminance distributions across images. This process minimized low-level perceptual confounds (e.g., variations in lighting or contrast) while preserving the natural structural features of the faces. The images were first cropped to 260×300 pixels and converted to grayscale with a black background using Adobe Photoshop CS6, ensuring uniformity in external features (e.g., no hair, ears, or clothing visible).
Since the formal experiment involved only female participants evaluating male stimuli, we selected high- and low- attractive stimuli based on the ratings by female participants. A total of 23 females (aged 19-26 years, M = 21.75, SD = 2.12) who did not participate in the formal experiment rated the attractiveness of all faces and voices. The stimuli were presented using E-prime software and rated on 7-point scales (1 = very attractive, 7 = very unattractive) based on subjective impressions. The final stimuli for the ERP experiment included 30 high-attractive (M = 5.46, SD = 0.28) and 30 low-attractive male voices (M = 3.29, SD = 0.42), as well as 30 high-attractive (M = 4.61, SD = 0.39) and 30 low-attractive male faces (M = 2.15, SD = 0.22). Statistical testing confirmed the differences between the high- and low-attractive stimuli for both voices (t = 23.38, p < 0.001) and faces (t = 29.77, p < 0.001).
Personality trait words (adjectives, e.g., “honest”, “evil”) were partially selected from standardized personality trait databases (Kong et al., 2012) and partially from online sources, resulting in a total of 235 two-character Chinese words. Personality trait words were rated by a mixed-gender sample, as these descriptors are not gender-specific and our aim was to obtain normative semantic valence ratings. Forty participants (21 females, 19 males, aged 19-26 years, M = 21.89, SD = 2.12) were recruited to rate each word on valence, familiarity, and gender typicality. In the valence rating task, 1 indicated a very negative word, 4 indicated neutral, and 7 indicated very positive. In the familiarity rating task, 1 indicated very unfamiliar, 4 indicated moderate familiarity, and 7 indicated very familiar. In the gender typicality rating task, 1 indicated that the word described only females, 4 indicated that the word could describe both males and females, and 7 indicated that the word described only males. The mean and standard deviation were calculated for the valence, familiarity, and gender typicality dimensions. Finally, 90 negative words (valence: M = 2.55, SD = 0.34, familiarity: M = 5.11, SD = 0.22, gender typicality: M = 3.93, SD = 0.29) and 90 positive words (valence: M = 5.72, SD = 0.25, familiarity: M = 5.70, SD = 0.22, gender typicality: M = 4.00, SD = 0.32) were selected as the final experimental materials. Statistical testing confirmed the differences between the negative and positive words for valence (t = -72.13, p < 0.001), familiarity (t = -18.05, p < 0.001), and gender typicality (t = -1.48, p = 0.14).
2.3. Procedure
The experiment was conducted in a room with soft lighting, quiet and comfortable surroundings, and electromagnetic shielding. Participants sat in front of a computer monitor at 75 cm. The monitor was 17inches with a resolution of 1920×1080 pixels, and stimuli subtended a visual angle of approximately 5°. Auditory stimuli were presented through headphones at a subjectively comfortable volume. Each participant completed two Stroop-like tasks: one for facial attractiveness and one for vocal attractiveness judgements, and they were asked to classify the face or voice as attractive or unattractive according to their own criteria (they were not informed about the preselection of stimuli) while ignoring the personality words. In the task, faces/voices and personality trait words were presented simultaneously to induce automatic semantic activation and thereby probe semantic interference in attractiveness judgments. Participants were to quickly and spontaneously (without much deliberation) classify each face/voice according to attractiveness.
As shown in Figure 1, each trial began with a fixation point (accompanied by a “beep” sound in the voice task) that lasted 400-500ms. This was followed by the simultaneous presentation of a face (or voice) and a personality trait word for 500-800ms, with the personality words positioned above the nose of the face (at the same location as in the voice task). Only after a 600ms blank screen, participants were required to classify the attractiveness of each face/voice by pressing the “F” or “J” key on the keyboard, with key assignments counterbalanced between participants. A final 1000-ms blank screen was presented before the next trial began.
All face and voice stimuli were presented across four blocks, with two blocks each for faces and voices; the order of face and voice tasks was counterbalanced across participants. In both tasks, stimuli were pseudo-randomly assigned to two blocks, each containing 90 trials. The paired stimuli yielded four conditions with 45 trials each (high-attractive voices/positive traits, high-attractive voices/negative traits, low-attractive voices/positive traits, low-attractive voices/ negative traits). A practice phase with 16 additional trials was included to ensure that participants understood the experimental procedure. The entire experiment took approximately one hour, including preparation, practice, and the main experiment.
2.4. Data Collection and Analysis
The EEG signals were recorded using a 64-channel Ag/AgCl electrode cap (Brain Products, Germany) based on the extended 10-20 international system. Continuous EEG signals were recorded by using FCz as common online reference, a 100 Hz low-pass filter and a sampling rate of 500 Hz. The impedance of all scalp electrodes was maintained below 5 kΩ. During offline analysis, the data were re-referenced to the averaged mastoid channels using EEGLAB v2023.1 (MathWorks, Natick, USA). Data were preprocessed with a bandpass filter of 0.01 Hz (24 dB/octave) to 30 Hz (24 dB/octave). Obvious artifacts such as EMG and head movements were manually removed. Further artifact correction was performed using independent component analysis (ICA) (Delorme & Makeig, 2004), and trials with amplitudes exceeding ±100 μV were excluded. Components were visually inspected and rejected if they clearly reflected ocular artifacts (e.g., blinks or eye movements, characterized by frontal topography and slow waveforms), muscular artifacts (e.g., high-frequency noise with peripheral topography), or other non-neural sources (e.g., line noise or electrode pops). The EEG data were segmented from 200 ms before to 800 ms after the onset of the face or voice stimuli, with a baseline correction based on the 200 ms pre-stimulus period. Only trials with participant responses consistent with independent pre-ratings (labeled as “correct” for analytical purposes, as a proxy for agreement with baseline attractiveness categories) were retained for ERP averaging. We retained approximately 74.1% of trials in total.
In the ERPs of both face and voice tasks, the N400 component was measured in the 300-500 ms time window at a frontal-central ROI (FCz, FC1, FC2, FC3, FC4, Cz, C1, C2, C3, C4) (Caldara et al., 2004); Zahedi et al., 2019). The LPC typically shows a parietal scalp distribution (for attractive relative to non-attractive faces) (Schacht et al., 2008; Werheid et al. 2007) and voices (Liu et al. 2023) but with some possible variance. In the present results, we found that the differences for attractive and non-attractive stimuli in the late ERPs differed in topographies and time windows in face and voice tasks. Therefore, in both the face and voice tasks, the LPC component was analyzed in two consecutive time windows: 500–650 ms and 650–800 ms. For the face task, mean amplitudes were extracted from a centro-parietal ROI (CP1, CP2, CPz, P1, P2, Pz); whereas for the voice task, a fronto-central ROI (FCz, FC1, FC2, FC3, FC4, Cz, C1, C2, C3, C4) was used.
Additionally, in the face task ERPs we measured the P1 in the 90-140ms time window at an occipito-temporal ROI (O1, Oz, O2) (Halit et al., 2000) and the N170 component during the 160-220 ms time window at an occipito-temporal ROI (O2, O1, Oz, POz, PO8, PO7, PO4, PO3) (Doi & Shinohara, 2015). In the voice task ERPs, the N1 component was measured in the 90-140 ms time window at the fronto-central region of interest (ROI: F1, Fz, F2, FC1, FCz, FC2, C1, Cz, C2) (e.g., Yuan et al., 2024; Marzi & Viggiano, 2010); the P2 component was measured during the 160 to 230ms time window at a fronto-central ROI (F2, F1, Fz, FC2, FC1, FCz, Cz, C1, C2) (Zhang & Deng, 2012).
ERP amplitudes were statistically analyzed using repeated measures ANOVAs with factors Attractiveness (high attractiveness, low attractiveness) and Congruency (congruent, incongruent). Our analytic strategy followed a theory-driven ROI approach: each ERP component/time window was pre-specified based on prior literature, and Bonferroni correction was applied in SPSS for post-hoc pairwise comparisons following significant ANOVA effects. This was done for each component to control Type I error in targeted comparisons.
3. Results
According to Liu et al., (2023), for both the face and voice task, performance was evaluated in terms of percent agreement with the rating-based attractiveness categories, distinguishing between attractive and non-attractive stimuli and whether they were congruent or incongruent with the personality trait words. The primary behavioral measure was "percent agreement" with the pre-rated attractiveness categories, chosen over traditional accuracy because participants judged attractiveness subjectively (based on personal taste, without awareness of pre-ratings), allowing us to assess alignment with stimulus norms rather than objective correctness. Percent agreement was calculated as the proportion of trials where participants' classifications matched the pre-rated category (high = attractive, low = unattractive), computed per condition. Please note that participants were to categorize the stimuli as attractive or non-attractive only according to their personal taste and not according to some external standard. To simplify the results and exclude irrelevant factors, only trials consistent with the attractiveness ratings of the stimuli were included in the subsequent ERP statistical analysis. Additionally, to ensure that personality traits and attractiveness processing were not influenced by keypresses, participants were required to make classifications 600 ms after stimulus presentation. Reaction times were not analyzed, and only accuracy was considered. The order of the face and voice tasks was counterbalanced across participants (approximately half of participants completed the face task first and half completed the voice task first). Task order was controlled at the design stage but was not included as an explicit factor in the reported ANOVAs. In the following, we will report the results of the two tasks separately, mainly because ERPs to faces and voices differ in their basic morphology – due to the modality difference – and are therefore hard to compare.
3.1. Performance Results
3.1.1. Face Task
A repeated measures ANOVA was conducted to analyze the effects of Attractiveness and Congruency. The main effect of Attractiveness was significant, F(1,22) = 42.96, p < 0.001, ηp2 = 0.661, with higher agreements for low attractive faces (M = 0.954, SD = 0.018) than for high attractive faces, (M = 0.802, SD = 0.024). The main effect of Congruency was also significant, F(1,22) = 9.25, p = 0.006, ηp2 = 0.296, with agreement under the congruent condition (M =0.907, SD = 0.019) being higher than under the incongruent condition (M = 0.85, SD = 0.021).
In addition, the interaction between Attractiveness and Congruency was significant, F(1,22) = 7.87, p = 0.01, ηp2 = 0.264. Further simple effects analyses revealed that for low-attractive faces, the main effect of Congruency exhibited a strong trend toward significance, F(1,22) = 4.27, p = 0.051, ηp2 = 0.163, with better agreement in the congruent condition (M = 0.968, SD = 0.016) than in the incongruent condition (M = 0.94, SD = 0.021). For high-attractive faces, this effect was even more pronounced and significant, F(1,22) = 10.09, p = 0.004, ηp2 = 0.315, with better agreement in the congruent condition (M = 0.845, SD = 0.027) than in the incongruent condition (M = 0.759, SD = 0.029), see Figure 2A.
3.1.2. Voice Task
In the voice task the main effect of Attractiveness was significant, F(1,22) = 5.14, p = 0.034, ηp2 = 0.189, with better agreements for high attractive voices (M = 0.86, SD = 0.023) than for low attractive voices, (M = 0.783, SD = 0.02). The main effect of Congruency was also significant, F(1,22) = 14.02, p = 0.001, ηp2 = 0.389, with better agreement in the congruent condition (M = 0.857, SD = 0.012) than in the incongruent condition (M = 0.786, SD = 0.019).
More importantly, also the interaction between Attractiveness and Congruency was significant, F(1,22) = 45.11, p<0.001, ηp2 = 0.672. Simple effects analyses revealed that for the low-attractive voices, the main effect of Congruency was significant, F(1,22) = 67.11, p<0.001, ηp2 = 0.753, with better agreement in the congruent condition (M = 0.858, SD = 0.018) than in the incongruent condition (M = 0.708, SD = 0.025). In contrast, for high-attractive voices, we did not find an effect of Congruency (p = .708; see Figure 2B).
3.2. ERP Results
3.2.1. Facial Attractiveness Classification Task
P1. The statistical results for the P1-component in the face task revealed a significant main effect of Attractiveness F(1,22) = 4.89, p = 0.038, ηp2 = 0.182. Further analysis showed that low-attractive faces induced greater P1 amplitude than high-attractive faces, (M = 2.625, SD = 0.529μV) vs. (M = 2.208, SD = 0.55μV). In addition, the main effect of Congruency (p = 0.578) and the interaction between Attractiveness and Congruency (p = 0.789) were not significant, see Figure 3.
N170. ANOVA revealed a significant main effect of Attractiveness, F(1,22) = 7.18, p = 0.014, ηp2 = 0.246, with high-attractive faces eliciting a more negative (larger) N170 component compared to low-attractive faces, (M = -0.786, SD = 0.862 μV) vs. (M = -0.164, SD = 0.846 μV). The main effect of Congruency (p = 0.338) and the interaction between Attractiveness and Congruency was not significant (p = 0.108), see Figure 4.
N400. The statistical results for this component showed no significant main effects (Attractiveness, p = 0.264; Congruency, p = 0.975) or interaction, p = 0.915.
LPC (500-650 ms time window). The statistical results for this time window showed no significant main effects (Attractiveness, p = 0.271; Congruency, p = 0.695) or interaction, p = 0.95.
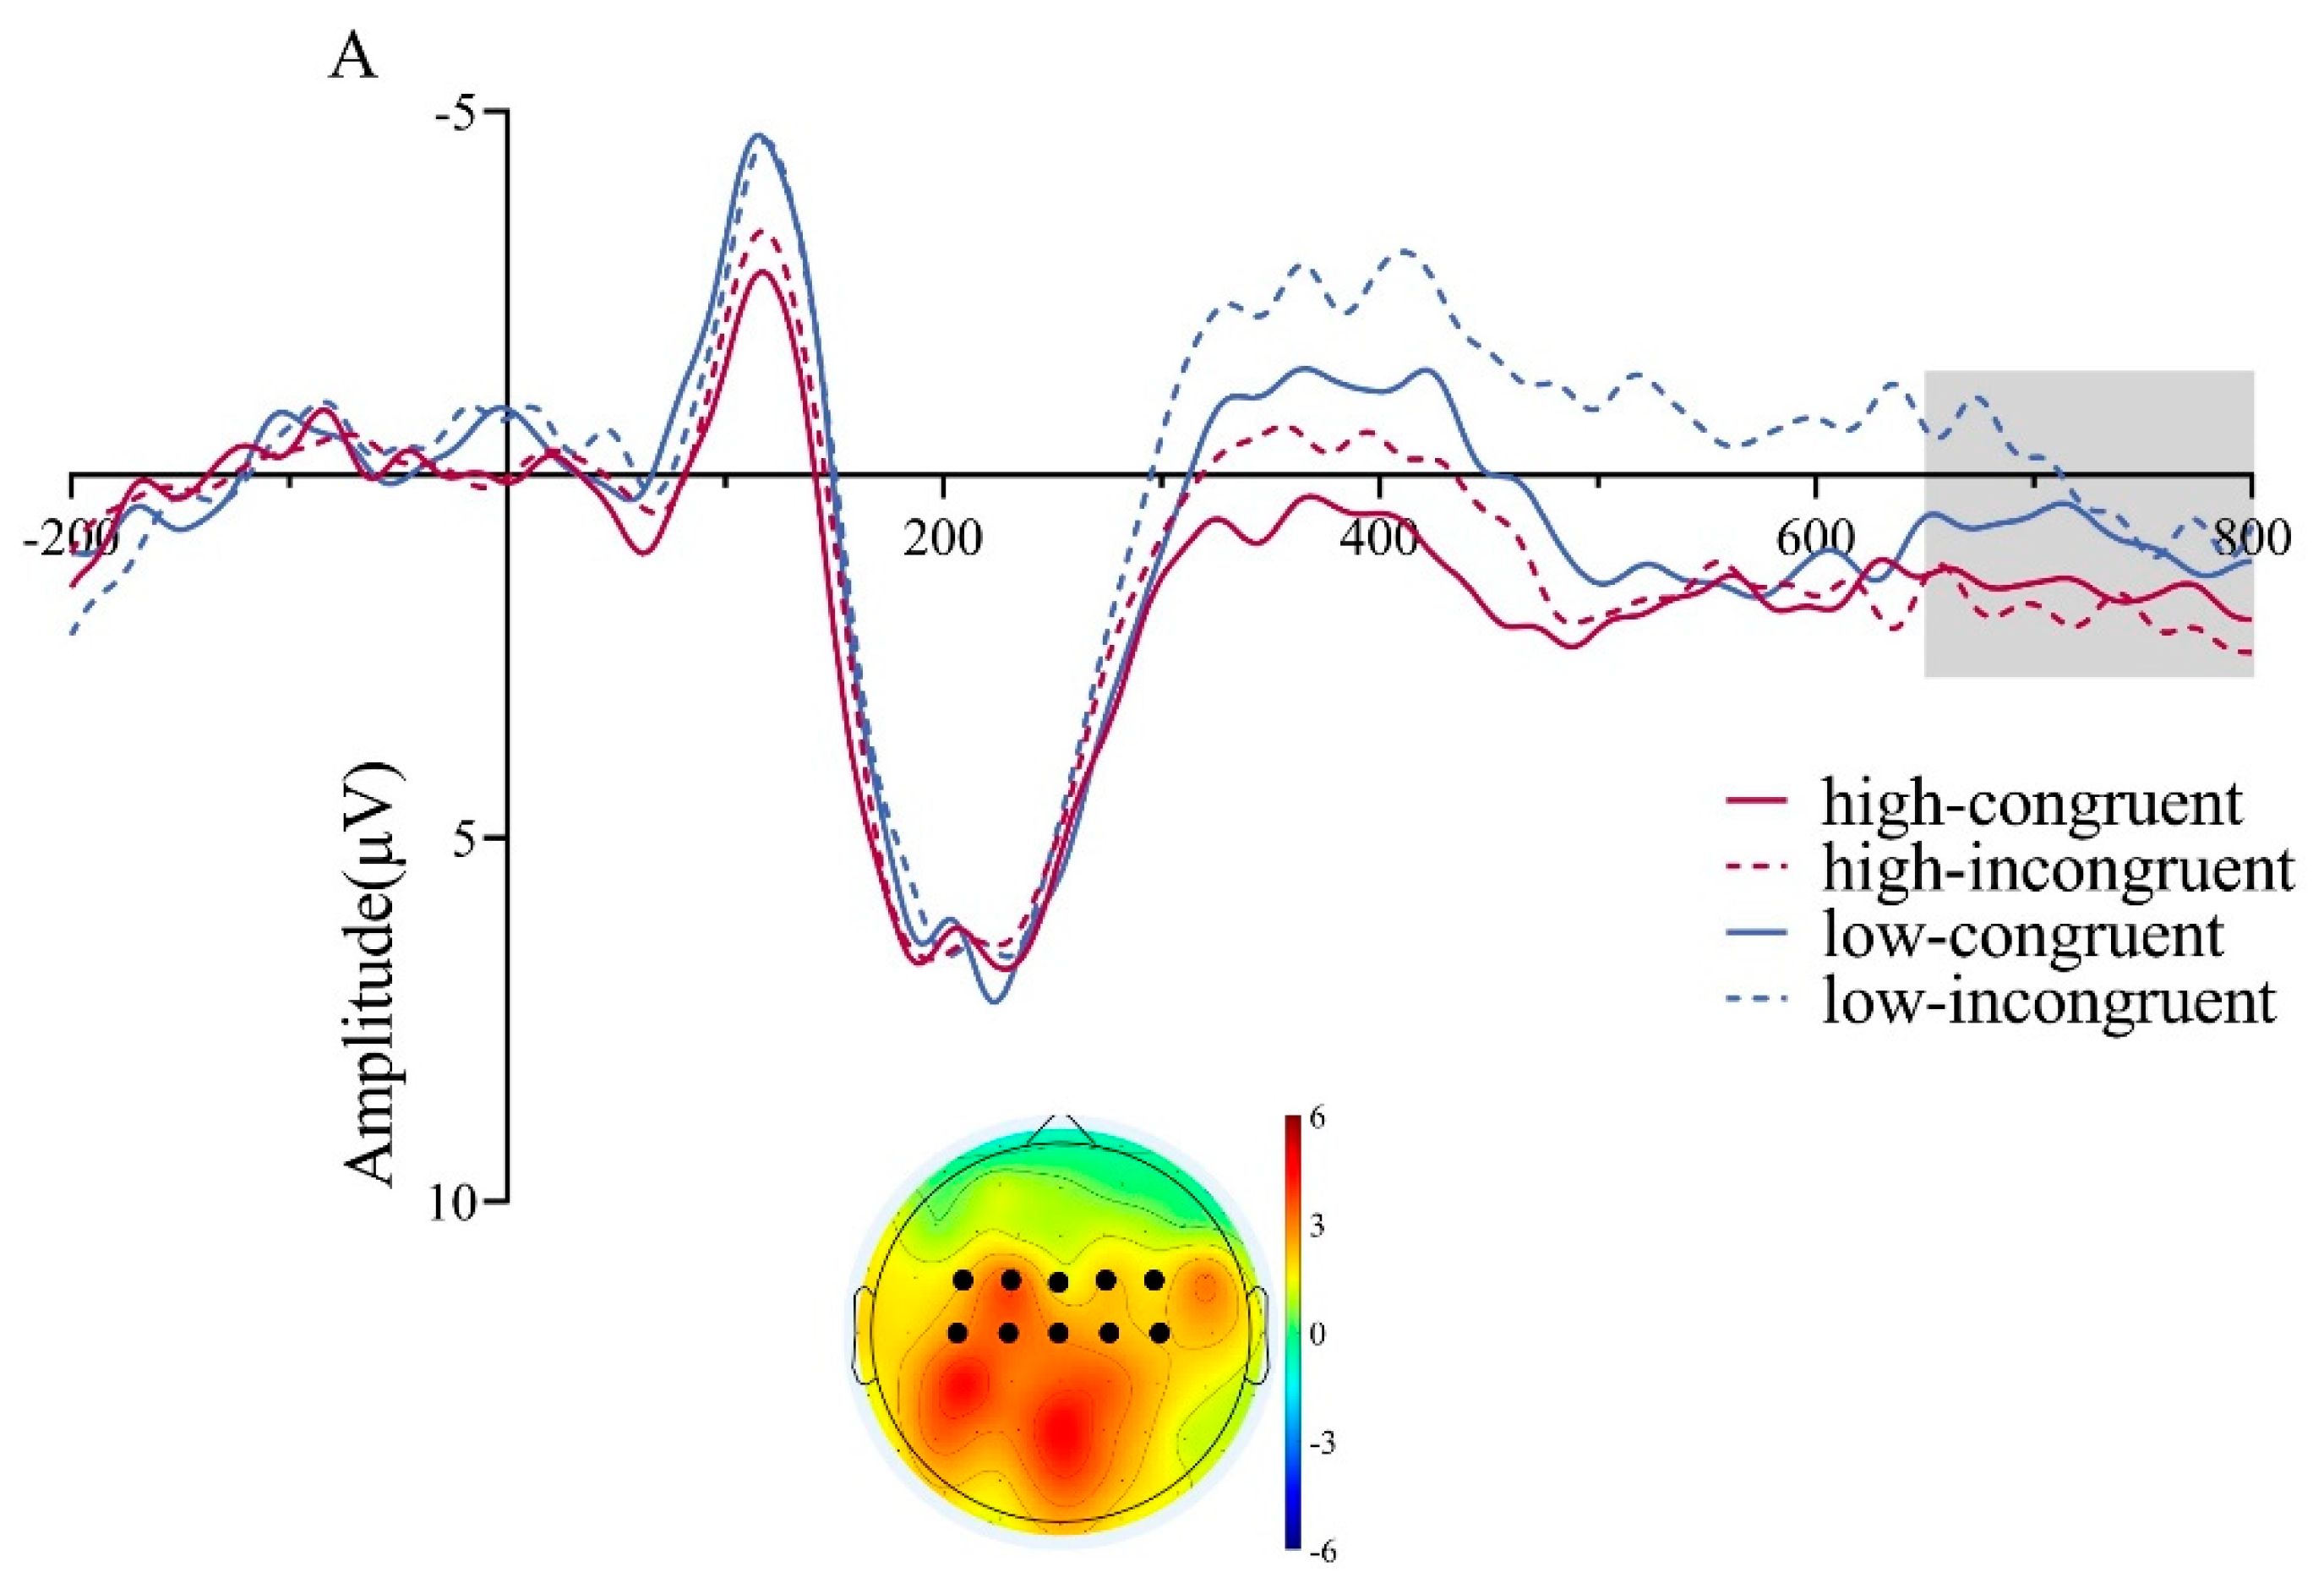
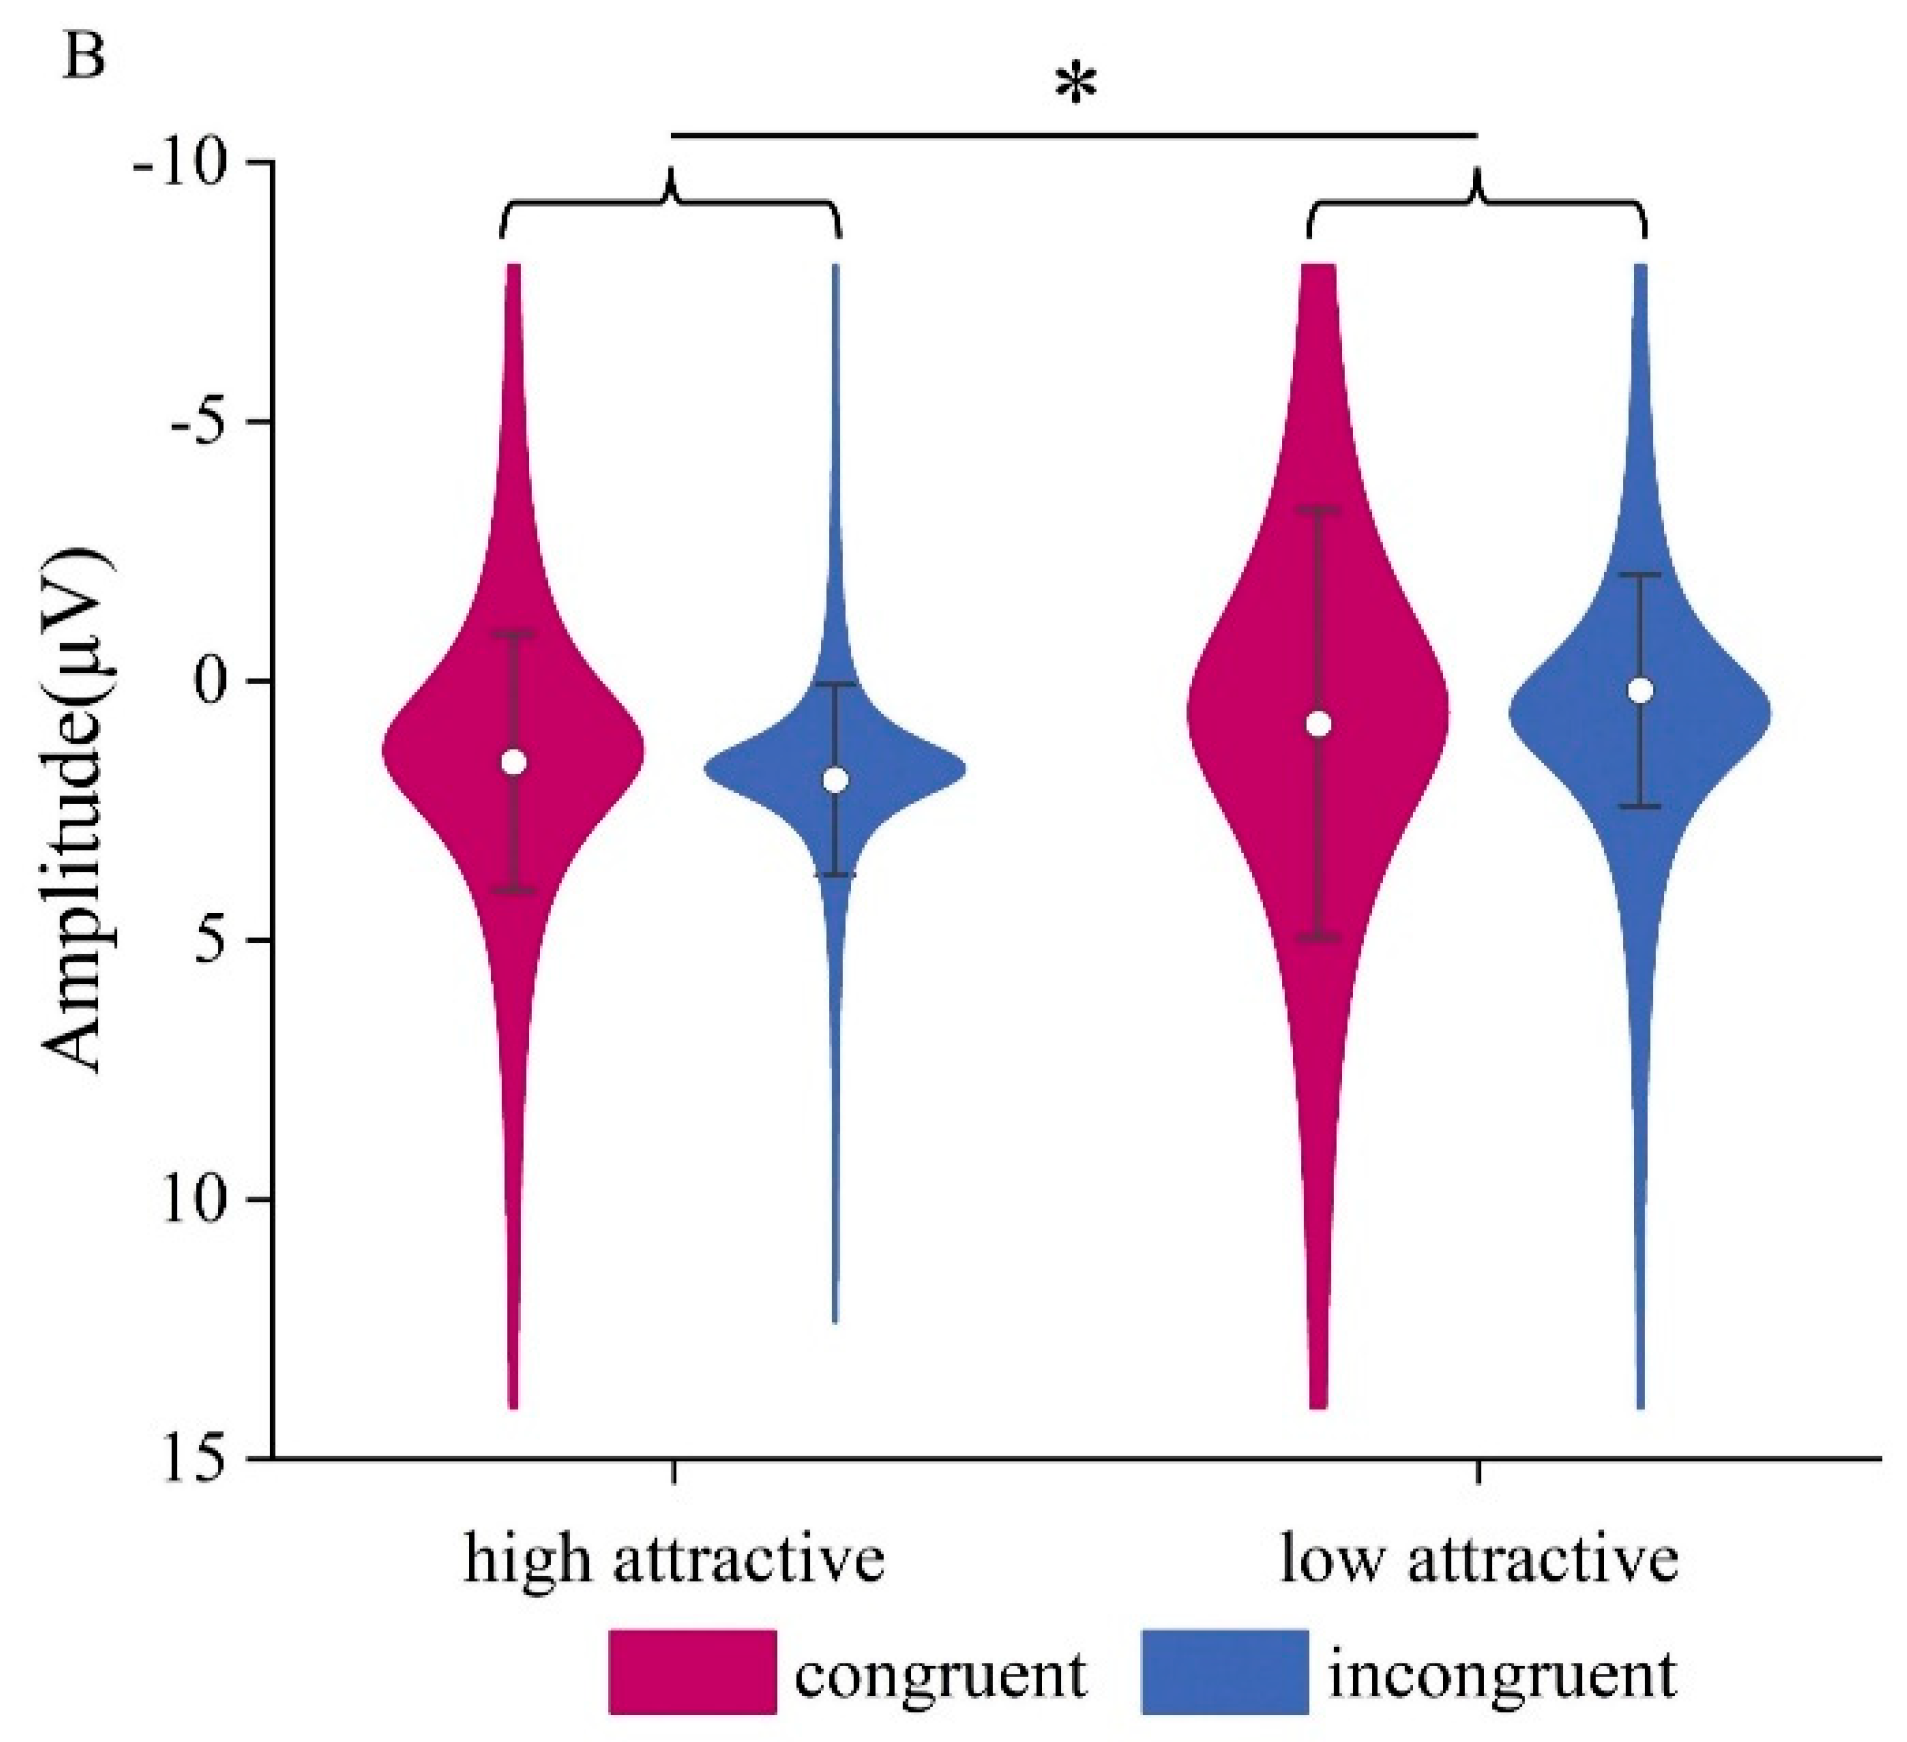
LPC (650-800 ms time window). There was a trend for a main effect of Attractiveness, F(1,22) = 3.58, p = 0.072, ηp2 = 0.14; high-attractive faces elicited larger amplitudes than low-attractive faces (M = 6.471, SD = 0.744μV) vs. (M = 5.48, SD = 0.558μV)). The main effect of Congruency was significant, F(1,22) = 9.97, p = 0.005, ηp2 = 0.312, incongruent face/word stimuli induced greater LPC amplitude than congruent stimuli, (M = 6.426, SD = 0.598μV) vs. (M = 5.524, SD = 0.641μV). The interaction was not significant (p = 0.835), see Figure 5.
3.2.2. Vocal Attractiveness Classification Task
N1. The ANOVA revealed a significant main effect of Attractiveness, F(1,22) = 16.17, p < 0.001, ηp2 = 0.424, with low-attractive voices eliciting larger N1 amplitudes (M = -3.615, SD = 0.344 μV) than high-attractive voices (M = -2.248, SD = 0.391 μV). But the main effect of Congruency (p = 0.652) and the interaction between Attractiveness and Congruency (p = 0.188) were not significant. See Figure 6.
P2. The statistical results showed no significant main effects (Attractiveness, p = 0.268; Congruency, p = 0.699) or interaction, p = 0.905.
N400. ANOVA indicated a significant main effect of Attractiveness, F(1,22) = 38.64, p < 0.001, ηp2 = 0.637; low-attractive voices induced more negative N400 amplitudes (M = -1.277, SD = 0.687 μV) compared to high-attractive voices (M = 0.675, SD = 0.541 μV). The main effect of Congruency was also significant, F(1,22) = 6.77, p = 0.016, ηp2 = 0.235, with more negative N400 amplitudes in the incongruent condition (M = -0.92, SD = 0.688 μV) than in the congruent condition (M = 0.317, SD = 0.596 μV). There was no interaction (p = 0.343), see Figure 7.
LPC (500-650 ms time window). The ANOVA showed a significant main effect of Attractiveness, F(1,22) = 14.77, p < 0.001, ηp2= 0.402; high-attractive voices induce larger LPC amplitudes compared to low-attractive voices, (M = 1.651, SD = 0.486 μV) vs. (M = 0.253, SD = 0.652 μV). The main effect of Congruency was also significant, F(1,22) = 5.82, p = 0.025, ηp2 = 0.209, congruent trait/voice combinations induced more positive LPC amplitudes compared to incongruent combinations, (M = 1.505, SD = 0.623 μV) vs. (M = 0.398 ± 0.558 μV).
Importantly, there was a significant interaction between Attractiveness and Congruency, F(1,22) = 6.43, p = 0.019, ηp2 = 0.226. Simple effects analysis indicated that for low-attractive voices, congruent trait words induced larger LPC amplitudes than incongruent words, F(1,22) = 9.96, p = 0.005, ηp2 = 0.312, (M = 1.345, SD = 0.82 μV) vs. (M = -0.839, SD = 0.645 μV); in contrast, for high-attractive voices, there was no significant effect of congruency (p = 0.956), see Figure 8.
LPC (650-800 ms time window). For this time window ANOVA showed a significant main effect of Attractiveness, F(1,22) = 6.77, p = 0.016, ηp2 = 0.235, with a more positive LPC for high attractive than low attractive voices, (M = 1.735, SD = 0.348 μV) vs. (M = 0.507, SD = 0.593 μV). The main effect of Congruency (p = 0.751) and the interaction (p = 0.267) were not significant. See Figure 9.
4. Discussion
Using ERP technology in a Stroop-like paradigm we examined the effects of positive or negative associated personality traits on the classification of facial and vocal attractiveness. The behavioral and ERP results show that personality traits modulate perception of attractive levels and show differences in face and voice tasks. At the behavioral level, we found that the influence of personality trait words on perceived attractiveness differed between facial and vocal stimuli. Analysis of the EEG data further revealed the temporal dynamics underlying this effect. In fact, the influence of personality traits on attractive judgments is not expressed in isolation but emerges through their interaction with perceptual cues. It is this interplay — where trait information can either reinforce or conflict with facial/voice attractiveness — that reveals the dynamic contribution of personality to impression formation. In the following, we will discuss these findings in greater detail.
4.1. Performance Evidence
Significant main effects of congruency revealed that agreement of participants’ attractiveness ratings with the corresponding stimulus categories was higher when personality traits were congruent rather than incongruent with the stimulus category. This result suggests that personality trait information influences participants’ attractiveness judgements for both faces and voices, consistent with the “what is good is beautiful” stereotype, where positive traits enhance perceived attractiveness and negative traits diminish (Dion et al., 1972).
In the face task, percentage of agreement for low-attractive faces was significantly higher than for high-attractive faces, whereas in the voice task, percentage of agreement for high-attractive voices was significantly higher than for low-attractive voices. First, people’s opinions on unattractive faces may tend to be more consistent. Besides, these seemingly opposite results across the two tasks are not truly contradictory. One possible explanation is that, relative to the other level, the high-attractive face stimuli and the low-attractive voice stimuli were closer to the intermediate level, which is shown in the pre-experimental rating results. This may have restricted the influence of personality trait information on attractiveness judgments for low attractive faces and for high attractive voices, as reflected in our results. This pattern aligns with stereotype theory, as moderately attractive stimuli may be more susceptible to trait-based modulation due to their ambiguity, amplifying the influence of congruent or incongruent personality cues (Langlois et al., 2000).
The interaction effect revealed that the congruency effect was stronger in the high-attractive face condition and the low-attractive voice condition. A stronger consistency effect for highly attractive faces suggests that when the expected positive traits do not match the personality trait words presented, it more significantly disrupts the processing of attractive faces. This may be due to stronger stereotypes or expectations associated with attractive individuals (Dion et al., 1972). When negative trait words appeared, classification accuracy for highly attractive faces significantly declined, indicating that this mismatch induced cognitive conflict. In contrast, in the voice task, the distinct acoustic features of attractive voices may have aided participants in their classification. For low-attractive voices, the percentage of agreement decreased under inconsistent conditions, suggesting that consistent trait words provided more critical information for judging attractiveness. Meanwhile, high-attractive voices remained relatively stable across conditions. These findings indicate that low-attractive voices may be characterized by more ambiguous perceptual cues and therefore rely more heavily on semantic context to guide judgments. The same explanation may hold for the “high attractive” faces, which in reality were similarly intermediate as the low-attractive voices. This differential susceptibility to trait influences underscores the stereotype-driven expectation that positive traits enhance attractiveness, particularly when perceptual cues are less definitive, as seen in our low-attractive voice and moderately attractive face conditions.
Overall, our findings aligned with our expectations: personality trait words that were semantically congruent with attractiveness facilitated attractiveness judgments. In contrast, incongruent trait information led to altered evaluations. The impact of this effect also varied across different levels of attractiveness—being more pronounced when attractiveness was closer to a moderate level, and attenuated as it approached the extremes. These behavioral results underscore the complexity of attractiveness judgments, suggesting that they are shaped not only by perceptual cues but also by contextual semantic information.
4.2. Effect of Personality Traits on the Perception of Facial Attractiveness
In our study, we found that low-attractive faces elicited larger P1 amplitudes than high attractive faces. This result is consistent with results of Halit et al. (2000), which showed that facial morphology is processed at a very early stage, and that unattractive and atypical faces elicit larger P1 amplitudes than attractive and typical faces. The amplitude of P1 is generally thought to reflect the initial perception and processing of visual stimuli, especially in the allocation of attention and early analysis of external visual features. The low-attractive faces in our study may have been less typical than the high-attractive faces, which may have caused participants to attend to these faces earlier. This early effect may reflect low-level perceptual differences, such as atypical facial features or asymmetry in low-attractive faces, which draw attention due to their deviation from prototypical face templates (Rhodes, 2006).
Then, we found that high-attractive faces induced larger N170 amplitudes compared to low-attractive faces. The N170 component has been found to be independent of facial expression in some studies, sensitive to face processing, and attractive faces may cause greater amplitudes associated with structural encoding and recognition memory (Marzi & Viggiano, 2010; Liu et al., 2023; Pizzagalli et al., 2002). The current result is consistent with these previous research.
Nevertheless, our study is inconsistent with Hahn et al. (2016) and Halit et al. (2000), who found that N170 amplitudes of lower aesthetic versions of faces were larger than those of higher aesthetic versions of faces when presented with adult and infant faces as stimuli. A possible explanation for the inconsistency between our study and Hahn et al. (2006), and Halit et al. (2000), is that in these two studies, investigators processed the same individual's faces into high-and low-attractive versions, while we selected different faces from different individuals when selecting materials, so differences in material selection could lead to different results.
In the face task, no effect was observed on the N400 component, which is noteworthy. Given that the N400 is typically linked to semantic processing, this may suggest that there was no effect of personality trait words on first-pass semantic integration or memory retrieval. Besides, the visual salience of faces dominates early processing, delaying the integration of personality traits until later stages, potentially due to the holistic nature of face perception (Rhodes, 2006).
The LPC segment was divided into two phases. In the early LPC phase, no main effects or interaction were observed. However, in the later phase, the LPC revealed a trend of larger amplitudes for highly attractive faces as well as a significant effect of consistency, with inconsistent conditions eliciting greater amplitudes. The long latency of the effect may be because the influence of personality traits on faces is mainly produced in later processing stages compared with voice. The marginal effect of attractiveness on the LPC is consistent with previous studies (Li et al., 2024; Shang & Liu, 2022). However, the main effect of congruency in the LPC where its amplitude was significantly greater in the incongruent condition than in the congruent condition is not consistent with the results of previous studies. High-attractive stimuli provide profound intrinsic rewards (Wiese et al., 2014; Andreoni & Petrie, 2008), leading to larger LPC amplitudes in both face and voice tasks. However, it can be seen from our results that personality traits exert less influence on facial attractiveness perception than voice tasks. So one possible explanation for our interaction is that when participants encounter an inconsistent stimulus that does not align with their identified stereotype, the processing of this information occurs in stages. In the early stages of cognitive processing, although face and personality information were presented together, the face stimulus dominated the processing, overshadowing the accompanying personality information. However, as processing advances to later stages, the personality information becomes more prominent. This shift indicates that participants needed more attention resources to process this inconsistency at a higher level of cognitive processing, which also reflected the difference in the influence of personality traits when processing faces and voices. This late-stage effect supports the stereotype that positive traits enhance attractiveness judgments (Dion et al., 1972), but the delayed integration may reflect low-level perceptual factors, such as the holistic processing of faces, which prioritizes visual features over semantic traits until later cognitive stages.
4.3. Effect of Personality Traits on the Perception of Vocal Attractiveness
In the vocal attractiveness judgment task, the N1 component served as an early indicator of auditory attention toward target stimuli (Shehabi et al., 2025). N1 amplitude was larger to low- than to high attractive voices, suggesting that in the initial stages of cognitive processing, individuals paid greater attention to less attractive voices. Alternatively, it could also reflect the greater difficulty to categorize low-attractive voices, which were closer to the neutral point than high-attractive voices.
Personality traits influence attractiveness, which is manifested in the N400 component. The N400 is generally considered to reflect the processing of mismatched semantic information or retrieval of semantic information (Ishii et al., 2010; Kutas & Federmeier, 2011; Zahedi et al., 2019), focusing on the consistency of stimulus conditions rather than the type of stimulus (Caldara et al., 2004). Other meaningful stimuli, such as faces (Barrett et al., 1988), can also elicit this component. Most studies found that incongruent conditions elicited larger N400 amplitudes compared to congruent conditions (Bobes et al., 2000). Our results are consistent with those studies, which may be due to participants having specific impression for attractive or unattractive voices, with the simultaneous personality trait information being inconsistent with their impression, causing greater N400 amplitudes.
In addition to integration processing, the N400 is related to conflict control (Pan et al., 2020), and cognitive resource allocation (Paulmann & Kotz, 2008); the increased cognitive resources needed to resolve conflicting information may lead to larger N400 amplitudes. In our study, participants’ task was to assess vocal attractiveness, which may involve suppressing conflicting stimuli unrelated to personality trait information (Liu et al., 2015; Paulmann & Pell, 2010). Thus, the larger N400 amplitude observed under inconsistent conditions may indicate that personality trait information interfered with the attractiveness evaluation process. Further, the N400 effect only happens for voices and not for faces. One possible reason is that the greater difficulty of vocal attractiveness judgements caused a deeper and more elaborate processing than for the easier facial attractiveness task, which then led to the interaction at the conceptual /semantic stage.
For the LPC of the 500-650ms time window, we found that it was modulated by attractiveness; high-attractive voices induced larger LPC amplitudes compared to low-attractive voices. Previous research has shown that attractive voice or face stimuli elicit larger LPC amplitudes compared to unattractive stimuli (Li et al., 2024; Liu et al., 2023; Shang & Liu, 2022; Thiruchselvam et al., 2016), and high- and low-attractive stimuli induced larger LPC amplitudes compared to moderately attractive stimuli (Revers et al., 2023). High-attractive voices have greater intrinsic reward value (Wiese et al., 2014; Andreoni & Petrie, 2008), thus capturing more of the participant’ attention resources, resulting in larger LPC amplitudes for high-attractive voices. We further observed a main effect of congruency, with larger LPC amplitudes to congruent than incongruent condition, consistent with previous research (Shang & Liu, 2022; Liu et al., 2023). LPC amplitude increases with the importance of the stimulus and with motivated attention (Werheid et al., 2007). In the present study, unrelated personality traits can enhance the level of vocal attractiveness under consistent conditions. This may reflect that under consistent conditions, participants need to invest more attention and cognitive resources in the aesthetic evaluation. The interaction indicates that for low-attractive voices, consistency influenced the LPC, whereas it had no such effect for high-attractive voices. This pattern suggests that the consistency of trait words affected evaluative processing for low-attractive voices. This finding is consistent with the performance effects where only low-attractive voices are modulated by congruency. And it is also consistent with the observation of larger N1 amplitudes elicited by low-attractive voices, indicating that greater early attention was allocated to less attractive stimuli. For these perceptually ambiguous signals, the integration process appears to rely more heavily on contextual information. In the later 650–800 ms window, only the main effect of attractiveness persisted, with high-attractive voices eliciting larger amplitudes, possibly reflecting sustained positive appraisal or reward processing(Liu et al., 2023). These effects support stereotype theory, as congruent positive traits reinforce the reward value of attractive voices, enhancing motivated attention, while low-level sequential processing of auditory cues may amplify the role of semantic context in early evaluation stages.
4.4. Integration of Results on Face and Voice Attractiveness
Overall, we found that personality traits exert both overlapping and distinct influences on the perception of facial and vocal attractiveness, our findings highlight the complex interaction between personality traits and attractiveness perceptions, which appear to be temporally and modality specific. Behaviorally, our results indicate that in both the face and voice domain, the congruency between personality traits and attractiveness categories significantly affects attractiveness judgments, supporting the “what is good is beautiful” stereotype where positive traits amplify perceived attractiveness across modalities (Dion et al., 1972; Langlois et al., 2000). In terms of ERP findings, we observed modality-specific differences in the cognitive processing of these influences. In facial and vocal tasks, early ERP components, such as N1 and P1, likely reflect initial sensory processing and attention allocation to the stimulus(Luck, 2014). These early effects may be driven by low-level perceptual differences, with faces processed holistically and voices sequentially, influencing the timing of trait integration (Groyecka et al., 2017; Rhodes, 2006). However, the processing of personality trait information diverged temporally between the two modalities. In the face task, the impact of personality traits became apparent during the late-stage LPC, reflecting higher-level cognitive integration and evaluative processing. Conversely, in the voice task, this influence was evident as early as in the N400 component, indicating that semantic incongruency between personality traits and vocal attractiveness was detected and processed at an earlier stage of semantic integration. These differences highlight the complex interplay between perceptual cues and semantic information in shaping attractiveness judgments across different sensory modalities and underscore the need for further research to explore these interactions in more diverse populations and contexts. Future studies could further disentangle whether low-level perceptual factors, such as face configuration versus vocal prosody, or higher-level stereotype expectations drive these modality-specific effects.
4.5. Limitations
The present study has several limitations. Firstly, the sample size was relatively small. Although the large effect sizes observed lend support to the findings, a larger and more diverse sample would enhance the stability of the experimental results and improve ecological validity. Besides, the 600-ms blank screen before responses may introduce minor motor preparation effects, though our preprocessing and trial retention of 74.1% suggest minimal impact on key ERP components. Future studies could use longer delays or response-locked analyses to further isolate cognitive signals. Furthermore, subsequent studies should more thoroughly investigate the degree to which personality traits influence attractiveness. For example, including a neutral-attractiveness level in the stimulus set would allow a clearer comparison of how personality trait descriptors independently influence attractiveness ratings and how they interact with baseline perceptual attractiveness, thereby improving the separation between attractiveness baselines and trait-driven effects. Besides, although counterbalancing was done to rule out order effects such as fatigue or practice, there may be carry-over effects between tasks, which provide a caveat for the present results and could be ruled out in research with between group designs. In our study, a potential problem may lie in the asymmetric differences between attractive and unattractive stimuli. This makes it unclear whether the asymmetric congruency effects relate to the valence of the stimuli or to the asymmetric difficulty of classification. Further research should use more symmetrical stimuli to examine the influence of personality traits on attractiveness.
5. Conclusions
This study employed ERP technology and a Stroop-like paradigm to explore the impact of personality traits on the perception of faces and voices at different attractiveness levels. Results indicate at least partially modality-specific effects of personality traits on attractiveness: in the face task, this influence appeared primarily in a late LPC stage, while in the voice task, it was observed in the N400 and early LPC stages. Moreover, negative personality traits enhanced judgment accuracy in low-attractive conditions, especially in the voice task. Together, these findings suggest that the modulation of attractiveness by personality traits in social cognition is both temporally sequenced during cognitive processing stages and partially modality-dependent.
Author Contributions
Lingyun Xiang: Conceptualization, Data curation, Formal analysis, Software, Writing - original draft. Werner Sommer: Conceptualization, Supervision, Validation, Writing - review & editing. Siqi Yue: Data curation, Formal analysis, Methodology, Writing - Review & Editing. Jingyu Liao: Investigation, Methodology. Meng Liu: Formal analysis, Investigation, Methodology, Supervision. Weijun Li: Funding acquisition, Supervision, Writing - original draft, Writing - review & editing, Project Administration.
Acknowledgments
This research was support by Ministry of Education in China Project of Humanities and Social Sciences [21YJA190003].
Conflicts of Interest statement
All authors declare to have no conflict of interest related.
References
- Andreoni, J.; Petrie, R. Beauty, gender and stereotypes: Evidence from laboratory experiments. Journal of Economic Psychology 2008, 29, 73–93. [Google Scholar] [CrossRef]
- Barrett, S.; Rugg, M.; Perrett, D. Event-Related Potentials and the Matching of Familiar and Unfamiliar Faces. Neuropsychologia 1988, 26, 105–117. [Google Scholar] [CrossRef]
- Belin, P.; Boehme, B.; McAleer, P. The sound of trustworthiness: Acoustic-based modulation of perceived voice personality. PLoS ONE 2017, 12, e0185651. [Google Scholar] [CrossRef]
- Berggren, N.; Jordahl, H.; Poutvaara, P. The looks of a winner: Beauty and electoral success. Journal of Public Economics 2010, 94, 8–15. [Google Scholar] [CrossRef]
- Bobes, M.A.; Martín, M.; Olivares, E.; Valdés-Sosa, M. Different scalp topography of brain potentials related to expression and identity matching of faces. Cognitive Brain Research 2000, 9, 249–260. [Google Scholar] [CrossRef]
- Borkenau, P.; Liebler, A. Trait inferences: Sources of validity at zero acquaintance. Journal of Personality and Social Psychology 1992, 62, 645–657. [Google Scholar] [CrossRef]
- Botvinick, M.M.; Braver, T.S.; Barch, D.M.; Carter, C.S.; Cohen, J.D. Conflict monitoring and cognitive control. Psychological Review 2001, 108, 624–652. [Google Scholar] [CrossRef] [PubMed]
- Busetta, G.; Fiorillo, F.; Visalli, E. Searching for a Job is a Beauty Contest. SSRN Electronic Journal 2013. [Google Scholar] [CrossRef]
- Caldara, R.; Jermann, F.; Arango, G.L.; Van der Linden, M. Is the N400 category-specific? A face and language processing study. NeuroReport 2004, 15, 2589–2593. [Google Scholar] [CrossRef]
- Delorme, A.; Makeig, S. EEGLAB: An open source toolbox for analysis of single-trial EEG dynamics including independent component analysis. Journal of Neuroscience Methods 2004, 134, 9–21. [Google Scholar] [CrossRef]
- Dion, K.; Berscheid, E.; Walster, E. What is beautiful is good. Journal of Personality and Social Psychology 1972, 24, 285–290. [Google Scholar] [CrossRef] [PubMed]
- Doi, H.; Shinohara, K. Unconscious Presentation of Fearful Face Modulates Electrophysiological Responses to Emotional Prosody. Cerebral Cortex 2015, 25, 817–832. [Google Scholar] [CrossRef] [PubMed]
- Eagly, A.H.; Ashmore, R.D.; Makhijani, M.G.; Longo, L.C. What is beautiful is good, but…: A meta-analytic review of research on the physical attractiveness stereotype. Psychological Bulletin 1991, 110, 109–128. [Google Scholar] [CrossRef]
- Faul, F.; Erdfelder, E.; Lang, A.-G.; Buchner, A. G*Power 3: A flexible statistical power analysis program for the social, behavioral, and biomedical sciences. BEHAVIOR RESEARCH METHODS 2007, 39, 175–191. 36th Annual Meeting of the Society-for-Computers-in-Psychology (SCiP). [CrossRef]
- Feinberg, D.R.; Jones, B.C.; DeBruine, L.M.; O’Connor, J.J.M.; Tigue, C.C.; Borak, D.J. Integrating fundamental and formant frequencies in women’s preferences for men’s voices. Behavioral Ecology 2011, 22, 1320–1325. [Google Scholar] [CrossRef]
- Festinger, L. (1957). A theory of cognitive dissonance. Stanford University Press.
- Groyecka, A.; Pisanski, K.; Sorokowska, A.; Havlicek, J.; Karwowski, M.; Puts, D.; Roberts, S.C.; Sorokowski, P. Attractiveness Is Multimodal: Beauty Is Also in the Nose and Ear of the Beholder. Frontiers in Psychology 2017, 8, 778. [Google Scholar] [CrossRef]
- Hahn, A.C.; Symons, L.A.; Kredel, T.; Hanson, K.; Hodgson, L.; Schiavone, L.; Jantzen, K.J. Early and late event-related potentials are modulated by infant and adult faces of high and low attractiveness. Social Neuroscience 2016, 11, 207–220. [Google Scholar] [CrossRef]
- Hajcak, G.; Dunning, J.P.; Foti, D. Motivated and controlled attention to emotion: Time-course of the late positive potential. Clinical Neurophysiology: Official Journal of the International Federation of Clinical Neurophysiology 2009, 120, 505–510. [Google Scholar] [CrossRef]
- Halit, H.; De Haan, M.; Johnson, M.H. Modulation of event-related potentials by prototypical and atypical faces. NeuroReport 2000, 11, 1871–1875. [Google Scholar] [CrossRef]
- He, D.; Workman, C.; He, X.; Chatterjee, A. What Is Good Is Beautiful (and What Isn’t, Isn’t): How Moral Character Affects Perceived Facial Attractiveness. Psychology of Aesthetics, Creativity, and the Arts. 2022. [CrossRef]
- Hill, A.K.; Cárdenas, R.A.; Wheatley, J.R.; Welling, L.L.M.; Burriss, R.P.; Claes, P.; Apicella, C.L.; McDaniel, M.A.; Little, A.C.; Shriver, M.D.; Puts, D.A. Are there vocal cues to human developmental stability? Relationships between facial fluctuating asymmetry and voice attractiveness. Evolution and Human Behavior 2017, 38, 249–258. [Google Scholar] [CrossRef]
- Ishii, K.; Kobayashi, Y.; Kitayama, S. Interdependence modulates the brain response to word–voice incongruity. Social Cognitive and Affective Neuroscience 2010, 5, 307–317. [Google Scholar] [CrossRef]
- Johnston, D.W. Physical appearance and wages: Do blondes have more fun? Economics Letters 2010, 108, 10–12. [Google Scholar] [CrossRef]
- Kamenica, E. Beauty Pays: Why Attractive People Are More Successful. Journal of Economic Literature 2012, 50, 521–523. [Google Scholar] [CrossRef]
- Kong, F.; Zhang, Y.; Chen, H. ERP differences between processing of physical characteristics and personality attributes. Behavioral and Brain Functions 2012, 8, 49. [Google Scholar] [CrossRef] [PubMed]
- Kornblum, S.; Hasbroucq, T.; Osman, A. Dimensional overlap: Cognitive basis for stimulus-response compatibility--a model and taxonomy. Psychological Review 1990, 97, 253–270. [Google Scholar] [CrossRef] [PubMed]
- Kutas, M.; Federmeier, K.D. Thirty Years and Counting: Finding Meaning in the N400 Component of the Event-Related Brain Potential (ERP). Annual Review of Psychology 2011, 62, 621–647. [Google Scholar] [CrossRef] [PubMed]
- Langlois, J.H.; Kalakanis, L.; Rubenstein, A.J.; Larson, A.; Hallam, M.; Smoot, M. Maxims or myths of beauty? A meta-analytic and theoretical review. Psychological Bulletin 2000, 126, 390–423. [Google Scholar] [CrossRef]
- Li, T.; Liang, Z.; Yuan, Y.; Sommer, W.; Li, W. The impact of facial attractiveness and alleged personality traits on fairness decisions in the ultimatum game: Evidence from ERPs. Biological Psychology 2024, 190, 108809. [Google Scholar] [CrossRef]
- Little, A.C.; Burt, D.M.; Perrett, D.I. Assortative mating for perceived facial personality traits. Personality and Individual Differences 2006, 40, 973–984. [Google Scholar] [CrossRef]
- Liu, J.; Hu, J.; Furutan, O. The Influence of Student Perceived Professors’ “Hotness” on Expertise, Motivation, Learning Outcomes, and Course Satisfaction. Journal of Education for Business 2013, 88, 94–100. [Google Scholar] [CrossRef]
- Liu, M.; Sommer, W.; Yue, S.; Li, W. Dominance of face over voice in human attractiveness judgments: ERP evidence. Psychophysiology 2023, e14358. [Google Scholar] [CrossRef]
- Liu, P.; Rigoulot, S.; Pell, M.D. Culture modulates the brain response to human expressions of emotion: Electrophysiological evidence. Neuropsychologia 2015, 67, 1–13. [Google Scholar] [CrossRef]
- Luck, S.J. (2014). An introduction to the event-related potential technique (2nd ed). MIT Press.
- Mahrholz, G.; Belin, P.; McAleer, P. Judgements of a speaker’s personality are correlated across differing content and stimulus type. PLoS ONE 2018, 13, e0204991. [Google Scholar] [CrossRef]
- Marzi, T.; Viggiano, M.P. When memory meets beauty: Insights from event-related potentials. Biological Psychology 2010, 84, 192–205. [Google Scholar] [CrossRef] [PubMed]
- McAdams, D.P.; Mayukha, A. Hiding in plain view: An historical perspective on the study of morality in personality psychology. Journal of Personality 2024, 92, 666–682. [Google Scholar] [CrossRef] [PubMed]
- McAleer, P.; Todorov, A.; Belin, P. How Do You Say ‘Hello’? Personality Impressions from Brief Novel Voices. PLoS ONE 2014, 9, e90779. [Google Scholar] [CrossRef] [PubMed]
- Mileva, M.; Tompkinson, J.; Watt, D.; Burton, A.M. Audiovisual integration in social evaluation. Journal of Experimental Psychology: Human Perception and Performance 2018, 44, 128–138. [Google Scholar] [CrossRef] [PubMed]
- Niimi, R.; Goto, M. Good conduct makes your face attractive: The effect of personality perception on facial attractiveness judgments. PLoS ONE 2023, 18, e0281758. [Google Scholar] [CrossRef]
- O’Connor, J.J.M.; Feinberg, D.R.; Fraccaro, P.J.; Borak, D.J.; Tigue, C.C.; Re, D.E.; Jones, B.C.; Little, A.C.; Tiddeman, B. Female Preferences for Male Vocal and Facial Masculinity in Videos. Ethology 2012, 118, 321–330. [Google Scholar] [CrossRef]
- O’Connor, J.J.M.; Fraccaro, P.J.; Pisanski, K.; Tigue, C.C.; Feinberg, D.R. Men’s Preferences for Women’s Femininity in Dynamic Cross-Modal Stimuli. PLoS ONE 2013, 8, e69531. [Google Scholar] [CrossRef]
- Pan, F.; Ou, Y.; Sun, H.; Qian, Y. Integration of conflict resolution and positive emotions: Electrophysiological evidence. NEUROPSYCHOLOGIA 2020, 149, 107661. [Google Scholar] [CrossRef]
- Pataki, S.P.; Clark, M.S. Self-Presentations of Happiness: Sincere, Polite, or Cautious? Personality and Social Psychology Bulletin 2004, 30, 905–914. [Google Scholar] [CrossRef]
- Paulmann, S.; Kotz, S.A. An ERP investigation on the temporal dynamics of emotional prosody and emotional semantics in pseudo- and lexical-sentence context. Brain and Language 2008, 105, 59–69. [Google Scholar] [CrossRef]
- Paulmann, S.; Pell, M.D. Contextual influences of emotional speech prosody on face processing: How much is enough? Cognitive, Affective, & Behavioral Neuroscience 2010, 10, 230–242. [Google Scholar] [CrossRef]
- Pizzagalli, D.A.; Lehmann, D.; Hendrick, A.M.; Regard, M.; Pascual-Marqui, R.D.; Davidson, R.J. Affective Judgments of Faces Modulate Early Activity (∼160 ms) within the Fusiform Gyri. NeuroImage 2002, 16, 663–677. [Google Scholar] [CrossRef]
- Revers, H.; Van Deun, K.; Vroomen, J.; Bastiaansen, M. Neural responses to facial attractiveness: Event-related potentials differentiate between salience and valence effects. Biological Psychology 2023, 179, 108549. [Google Scholar] [CrossRef]
- Rhodes, G. The evolutionary psychology of facial beauty. Annual Review of Psychology 2006, 57, 199–226. [Google Scholar] [CrossRef] [PubMed]
- Rosar, U.; Klein, M.; Beckers, T. The frog pond beauty contest: Physical attractiveness and electoral success of the constituency candidates at the North Rhine-Westphalia state election of 2005. European Journal of Political Research 2008, 47, 64–79. [Google Scholar] [CrossRef]
- Schacht, A.; Werheid, K.; Sommer, W. The appraisal of facial beauty is rapid but not mandatory. Cognitive, Affective, & Behavioral Neuroscience 2008, 8, 132–142. [Google Scholar] [CrossRef] [PubMed]
- Shang, J.; Liu, Z. Vocal Attractiveness Matters: Social Preferences in Cooperative Behavior. Frontiers in Psychology 2022, 13, 877530. [Google Scholar] [CrossRef]
- Shehabi, S.; Comstock, D.C.; Mankel, K.; Bormann, B.M.; Das, S.; Brodie, H.; Sagiv, D.; Miller, L.M. Individual Differences in Cognition and Perception Predict Neural Processing of Speech in Noise for Audiometrically Normal Listeners. eNeuro. 2025. [Google Scholar] [CrossRef]
- Stürmer, B.; Sommer, W.; Frensch, P. Conflicts as signals: Bridging the gap between conflict detection and cognitive control. Psychological Research Psychologische Forschung 2009, 73, 741–743. [Google Scholar] [CrossRef] [PubMed]
- Sui, J.; Liu, C.H. Can beauty be ignored? Effects of facial attractiveness on covert attention. Psychonomic Bulletin & Review 2009, 16, 276–281. [Google Scholar] [CrossRef] [PubMed]
- Thiruchselvam, R.; Harper, J.; Homer, A.L. Beauty is in the belief of the beholder: Cognitive influences on the neural response to facial attractiveness. Social Cognitive and Affective Neuroscience 2016, 11, 1999–2008. [Google Scholar] [CrossRef] [PubMed]
- Werheid, K.; Schacht, A.; Sommer, W. Facial attractiveness modulates early and late event-related brain potentials. Biological Psychology 2007, 76, 100–108. [Google Scholar] [CrossRef]
- Wiese, H.; Altmann, C.S.; Schweinberger, S.R. Effects of attractiveness on face memory separated from distinctiveness: Evidence from event-related brain potentials. Neuropsychologia 2014, 56, 26–36. [Google Scholar] [CrossRef]
- Willenbockel, V.; Sadr, J.; Fiset, D.; Horne, G.O.; Gosselin, F.; Tanaka, J.W. Controlling low-level image properties: The SHINE toolbox. BEHAVIOR RESEARCH METHODS 2010, 42, 671–684. [Google Scholar] [CrossRef]
- Wu, C.; Liang, X.; Duan, Y.; Gong, L.; Zhang, W.; He, M.; Ouyang, Y.; He, X. The Voice of Morality: The Two-Way Relationship Between the Beauty of Voice and Moral Goodness. Journal of Voice 2022, S0892199722001357. [Google Scholar] [CrossRef]
- Yang, T.; Chen, H.; Hu, Y.; Zheng, Y.; Wang, W. Preferences for sexual dimorphism on attractiveness levels: An eye-tracking study. Personality and Individual Differences 2015, 77, 179–185. [Google Scholar] [CrossRef]
- Yuan, Y.; Shang, J.; Gao, C.; Sommer, W.; Li, W. A premium for positive social interest and attractive voices in the acceptability of unfair offers? An ERP study. European Journal of Neuroscience 2024, ejn.16422. [CrossRef]
- Zahedi, A.; Abdel Rahman, R.; Stürmer, B.; Sommer, W. Common and specific loci of Stroop effects in vocal and manual tasks, revealed by event-related brain potentials and posthypnotic suggestions. Journal of Experimental Psychology: General 2019, 148, 1575–1594. [Google Scholar] [CrossRef]
- Zhang, H.; Liu, M.; Li, W.; Sommer, W. Human voice attractiveness processing: Electrophysiological evidence. Biological Psychology 2020, 150, 107827. [Google Scholar] [CrossRef]
- Zhang, Y.; Kong, F.; Zhong, Y.; Kou, H. Personality manipulations: Do they modulate facial attractiveness ratings? Personality and Individual Differences 2014, 70, 80–84. [Google Scholar] [CrossRef]
- Zhang, Z.; Deng, Z. Gender, facial attractiveness, and early and late event-related potential components. Journal of Integrative Neuroscience 2012, 11, 477–487. [Google Scholar] [CrossRef]
- Zuckerman, M.; Hodgins, H.; Miyake, K. The vocal attractiveness stereotype: Replication and elaboration. Journal of Nonverbal Behavior 1990, 14, 97–112. [Google Scholar] [CrossRef]
- Zuckerman, M.; Miyake, K.; Hodgins, H.S. Cross-channel effects of vocal and physical attractiveness and their implications for interpersonal perception. Journal of Personality and Social Psychology 1991, 60, 545–554. [Google Scholar] [CrossRef]
Figure 1.
Trial scheme of the face and voice task (top vs. bottom).
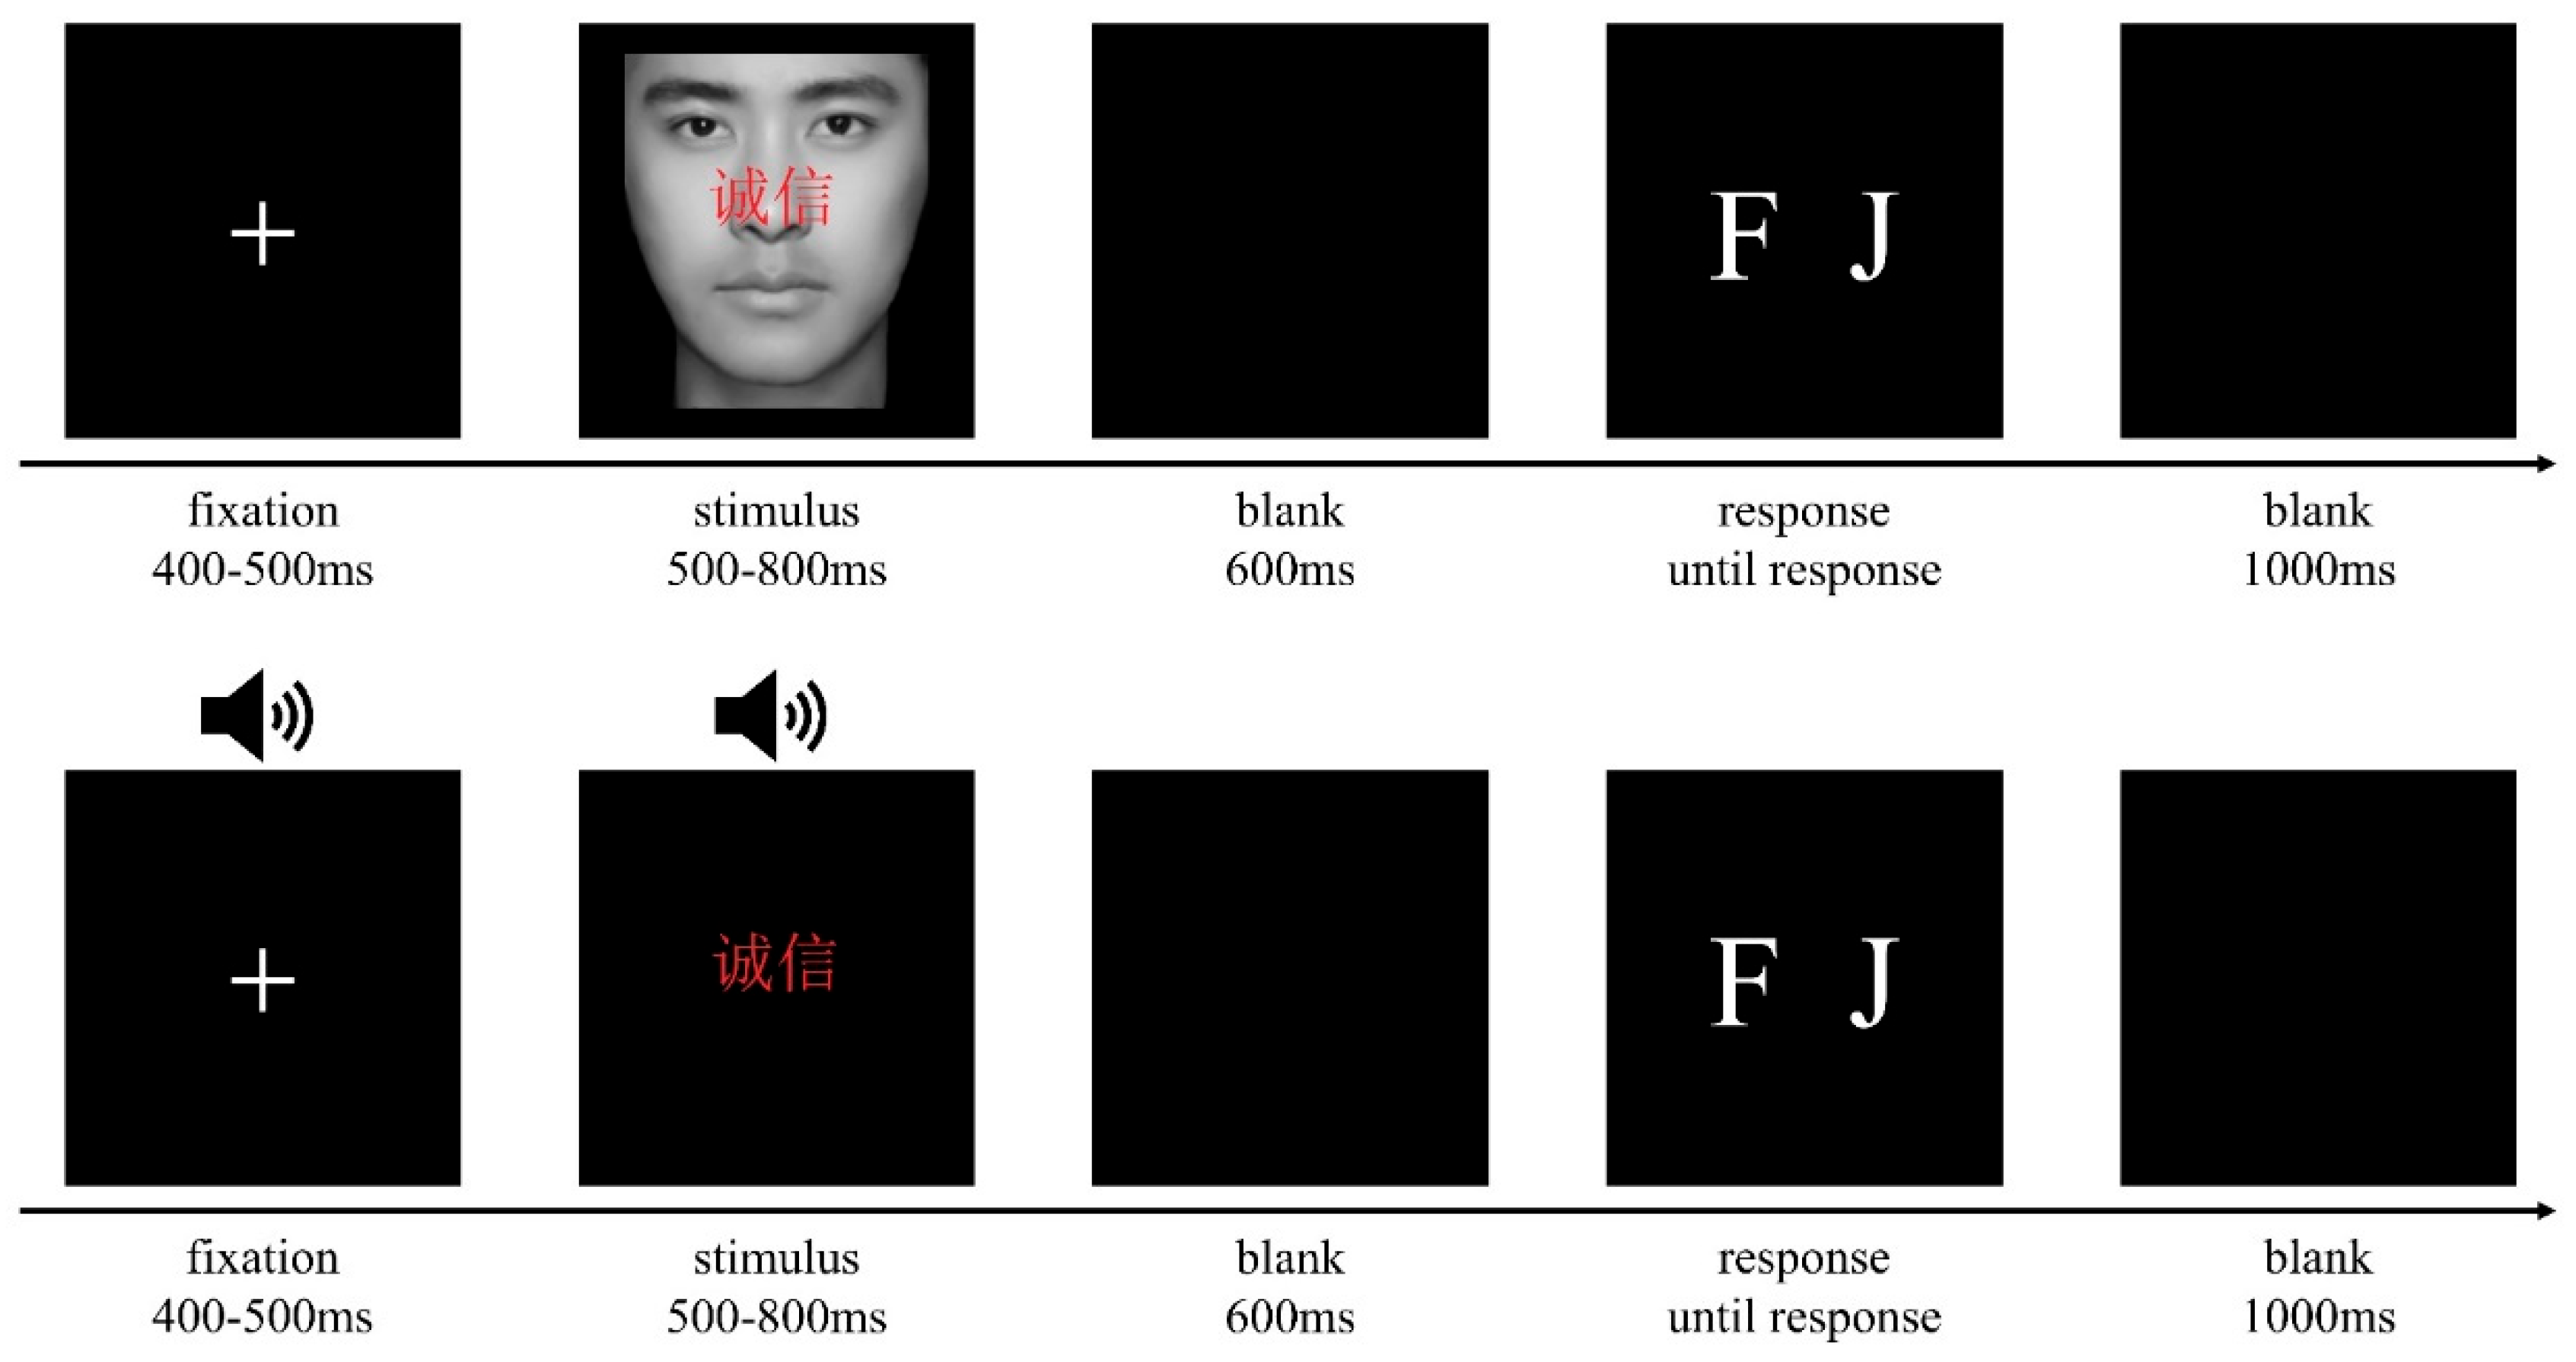
Figure 2.
Percent agreement of attractiveness judgments with stimulus categories. (A) Attractiveness judgment in the face task. (B) Attractiveness judgment in the voice task. Only interaction effects are marked. **p<0.01, ***p<0.001, n.s.p>0.01.
Figure 2.
Percent agreement of attractiveness judgments with stimulus categories. (A) Attractiveness judgment in the face task. (B) Attractiveness judgment in the voice task. Only interaction effects are marked. **p<0.01, ***p<0.001, n.s.p>0.01.
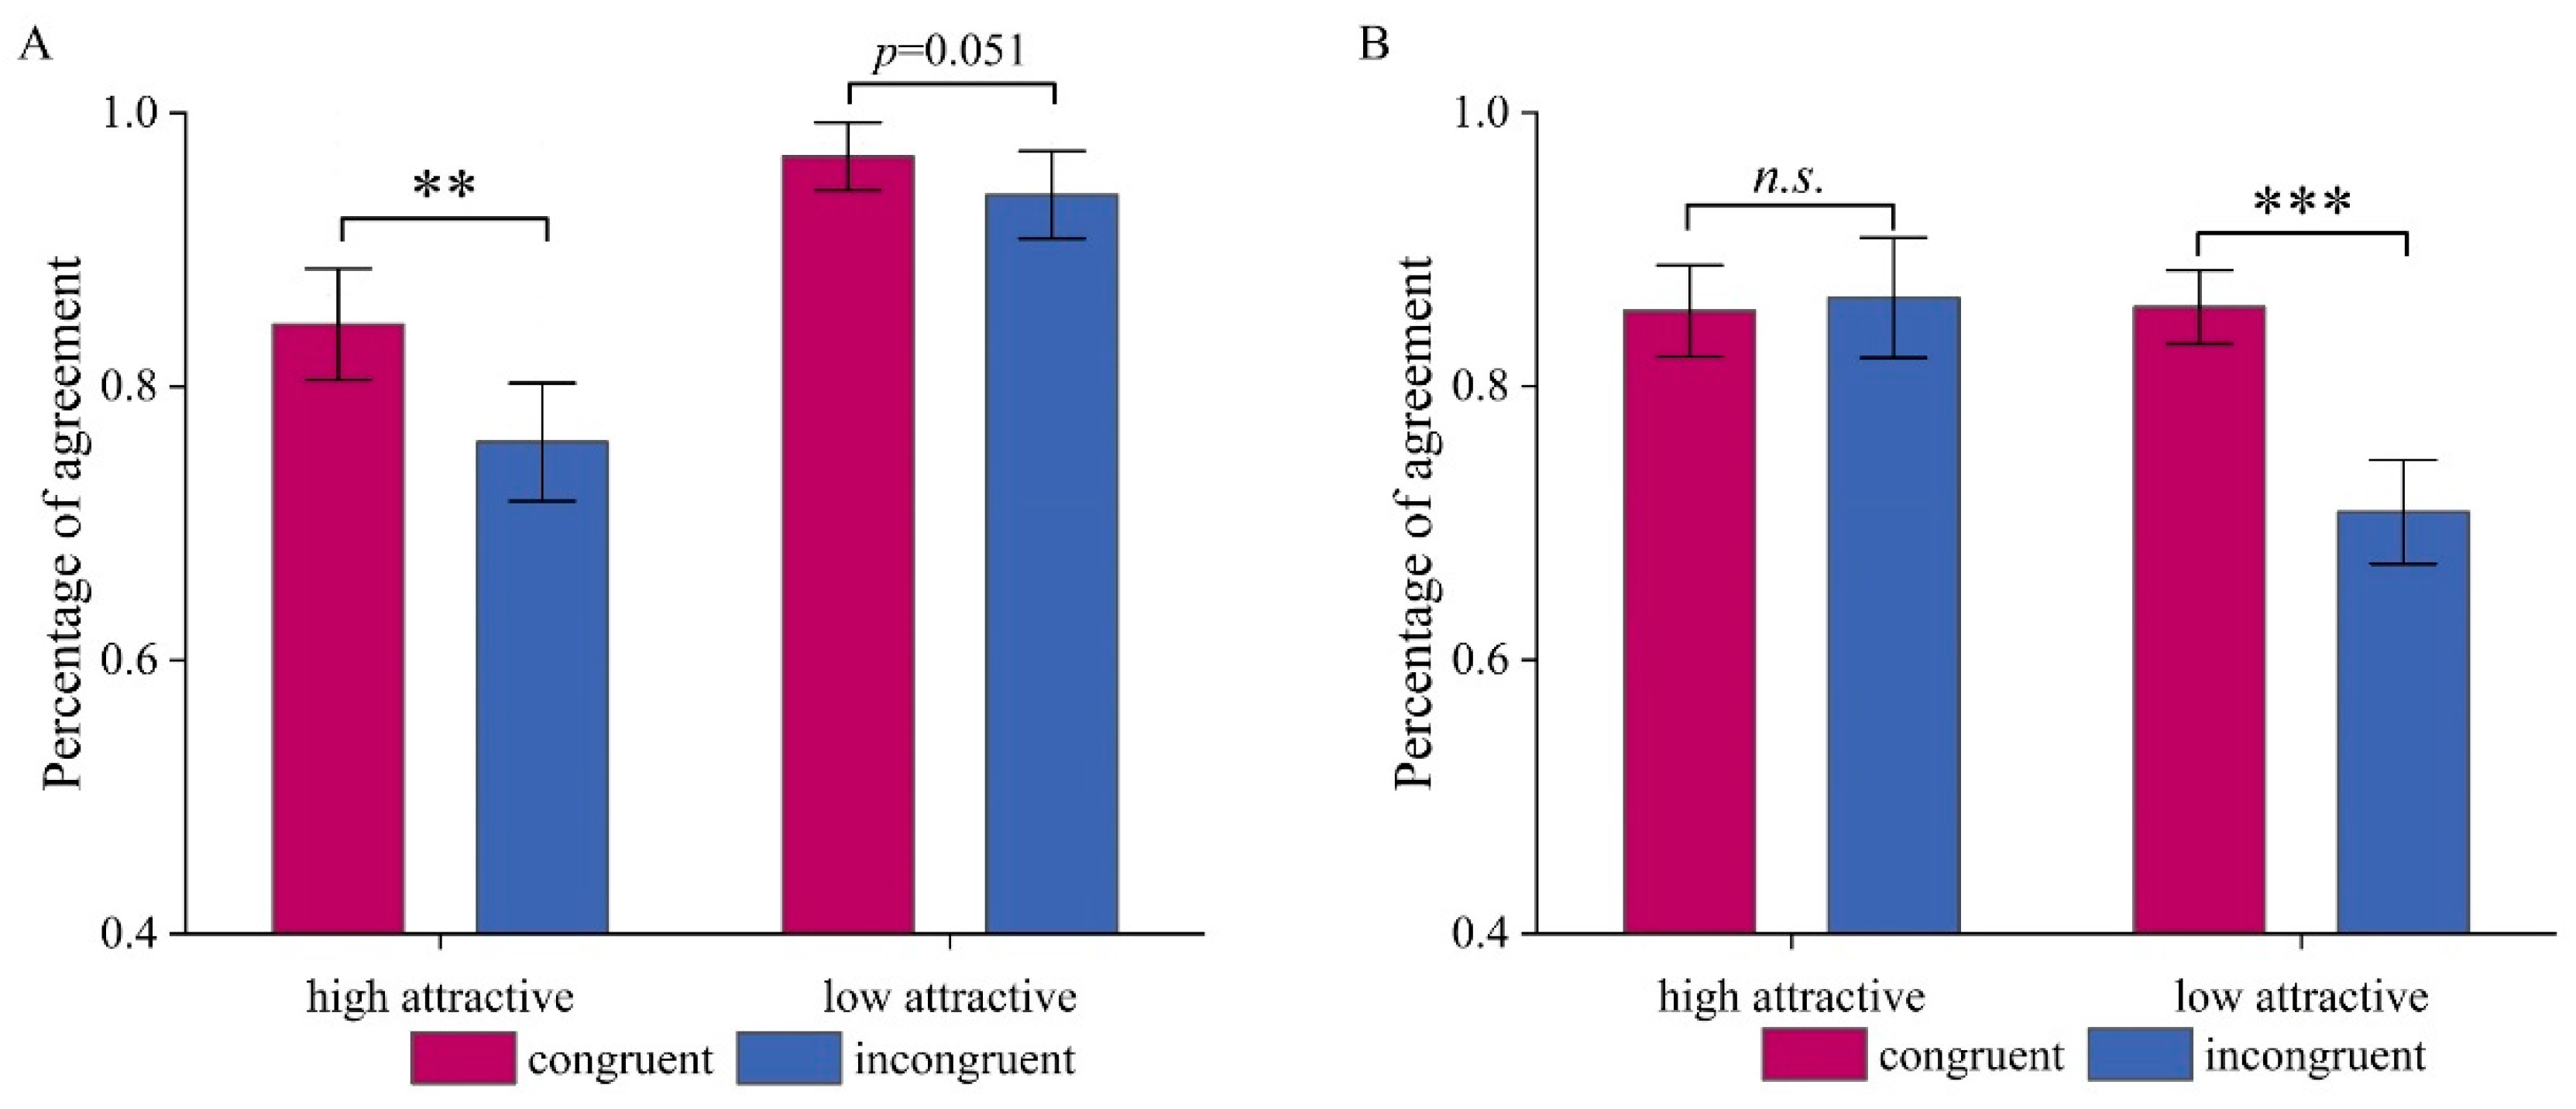
Figure 3.
P1 component in the Facial Attractiveness Classification task. (A) The ERP waveforms in the region of interest (ROI; see bold points in the topography) for the P1 component, along with topographical maps showing the low-attractive condition minus the high-attractive condition within the 90-140 ms time window. (B) The ERP amplitudes of the P1 component in each condition. *p<0.05.
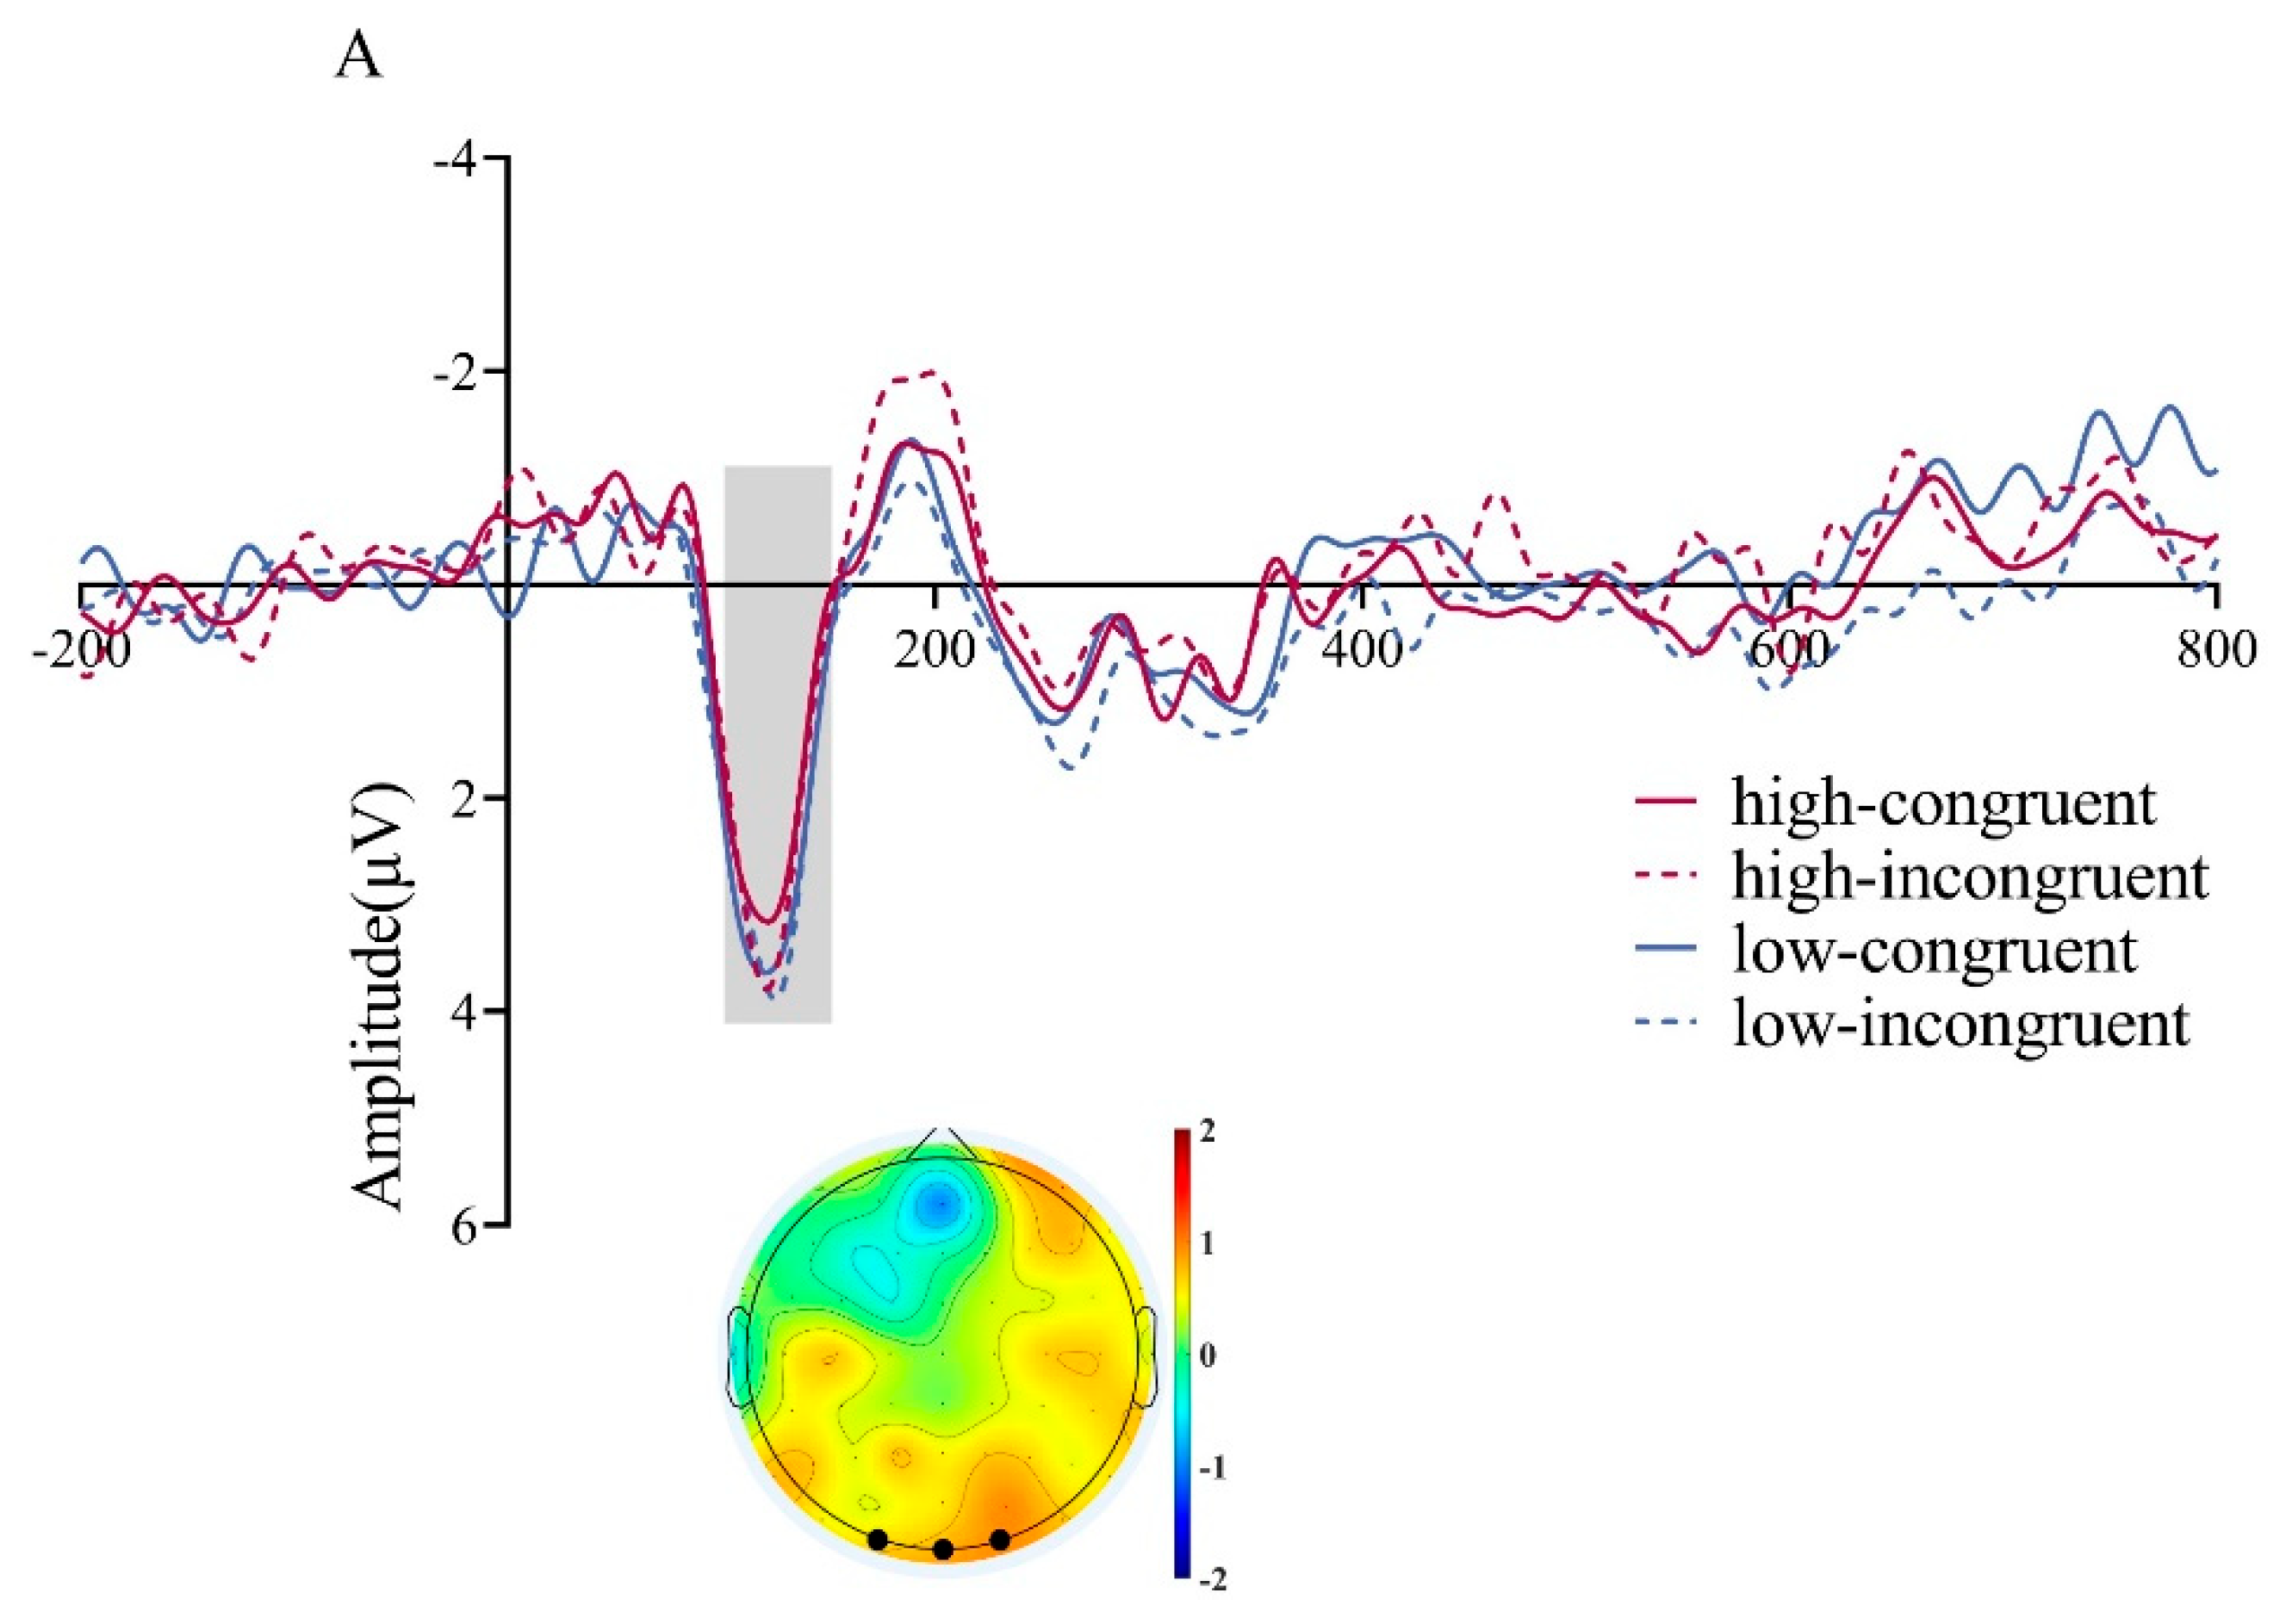
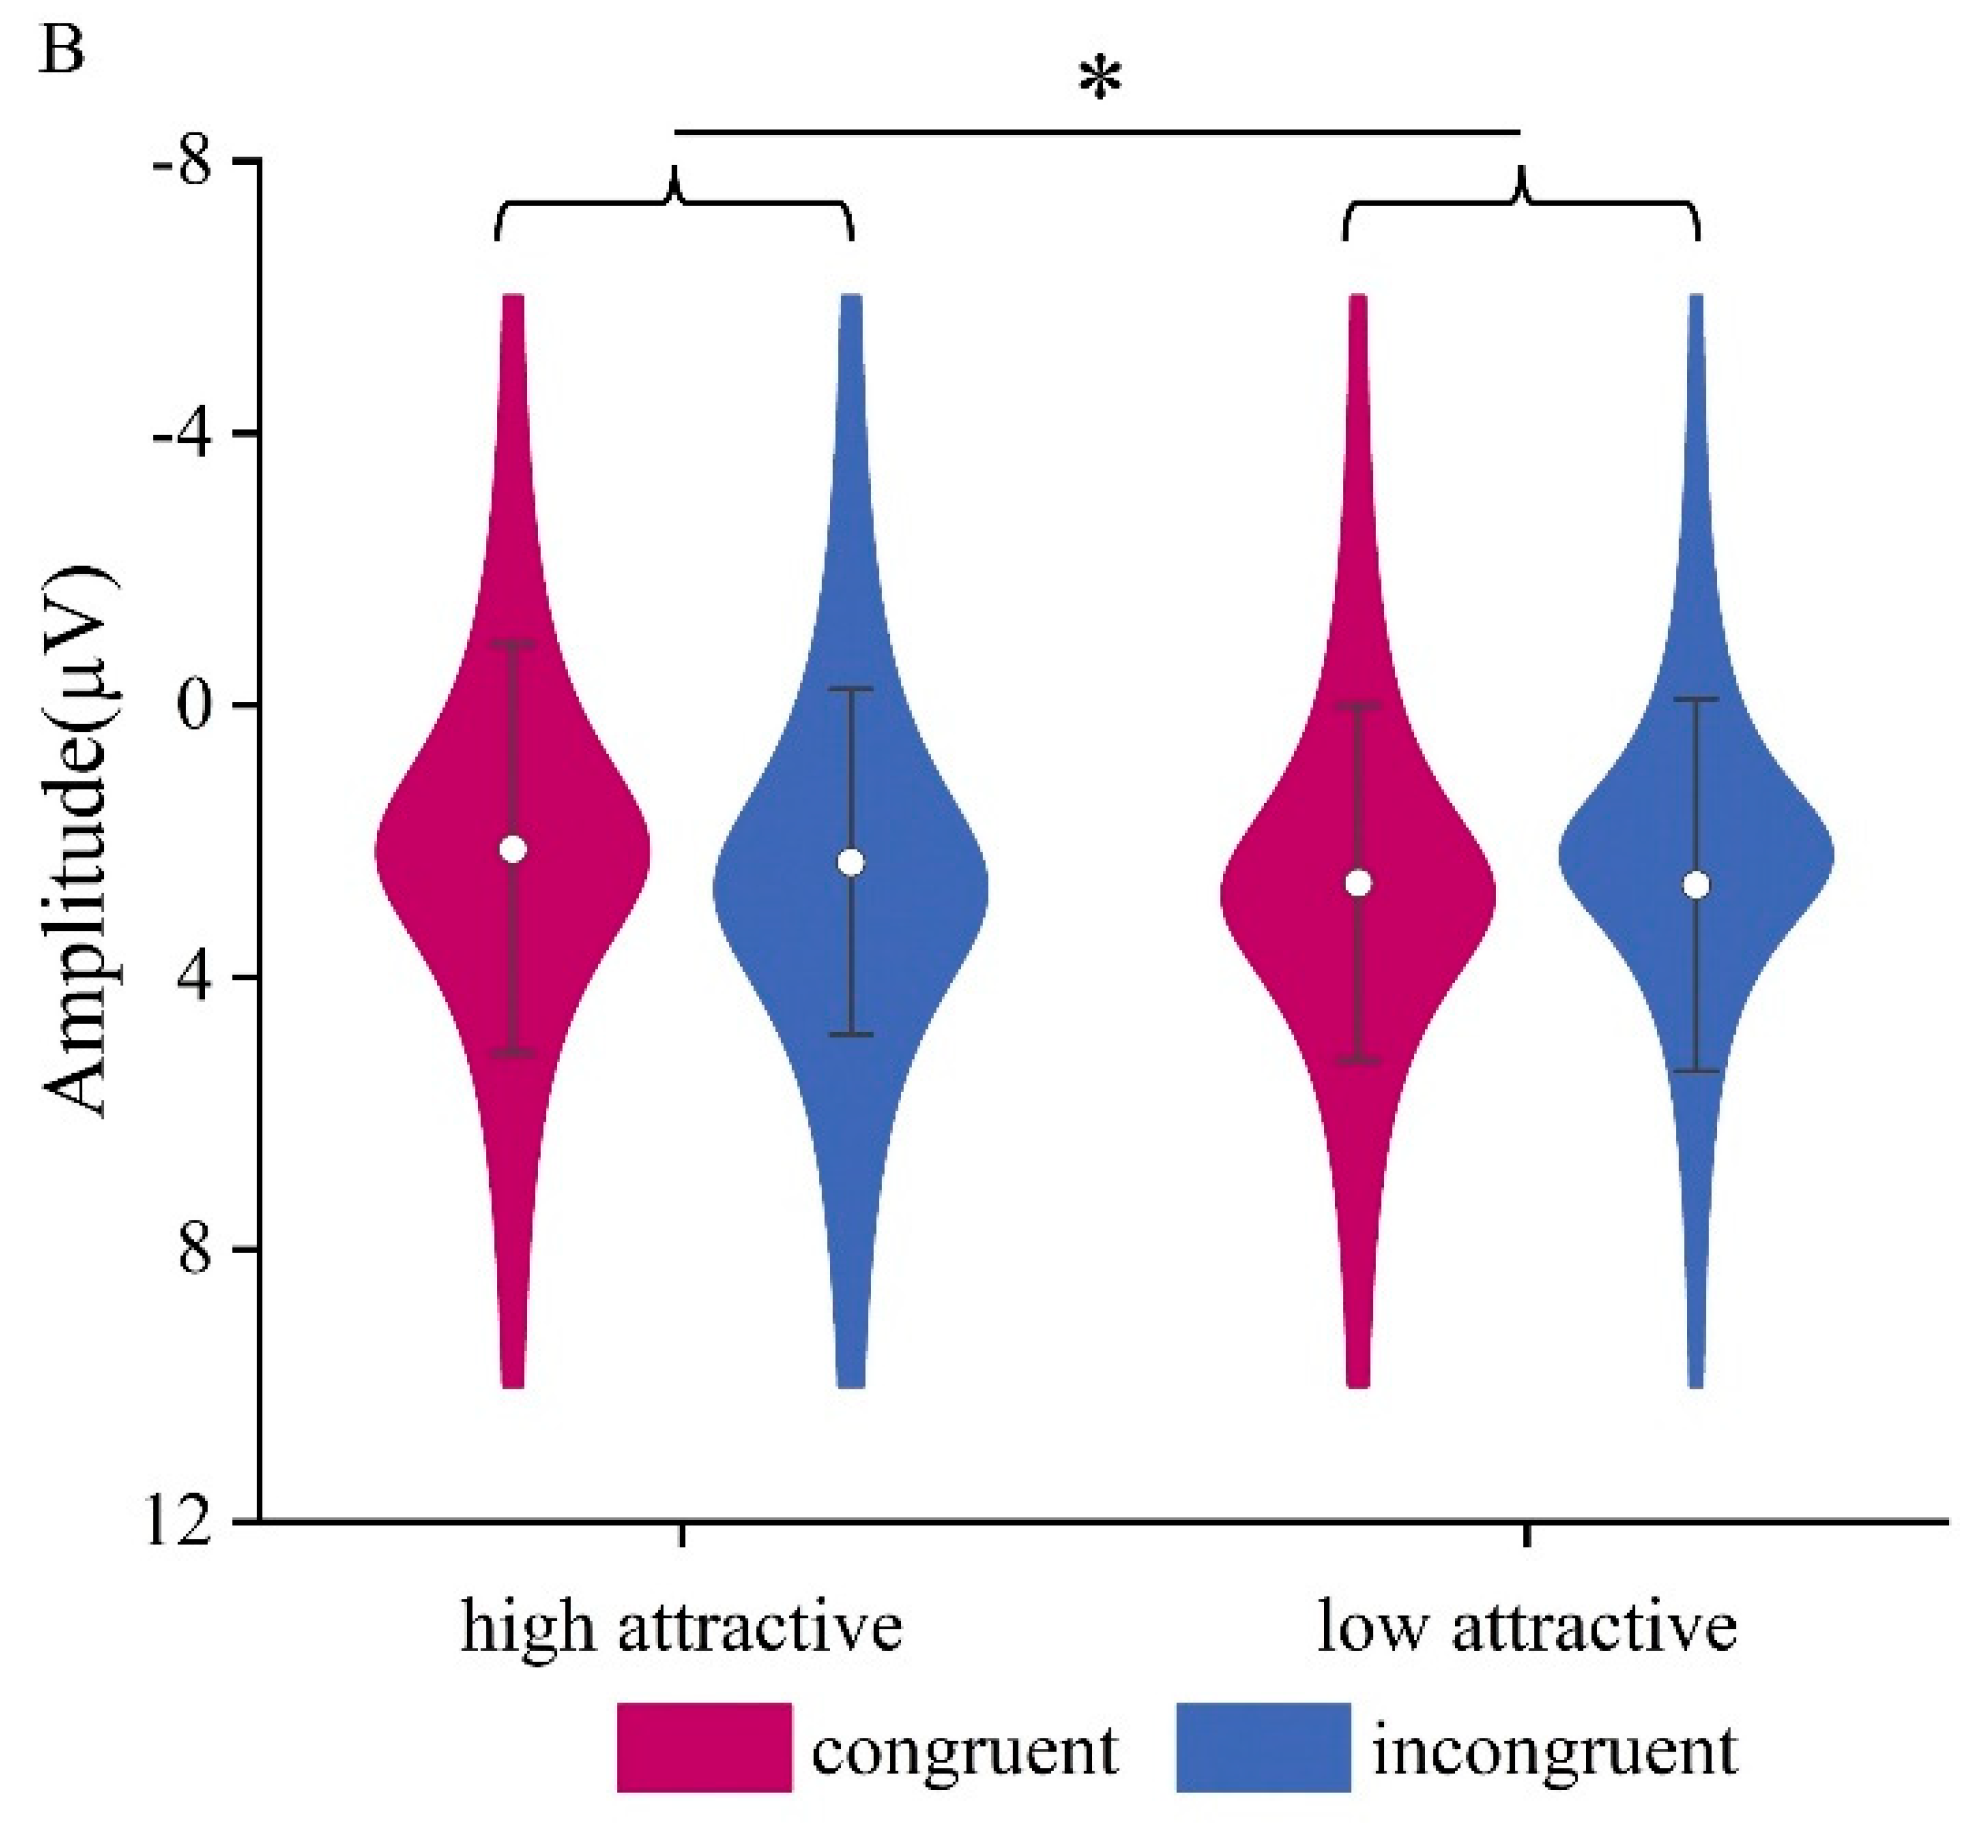
Figure 4.
N170 component in the Facial Attractiveness Judgment task. (A) The ERP waveforms in the region of interest (ROI) for the N170 component, along with topographical maps showing the high attractive condition minus the low attractive condition within the 160-220 ms time window. (B) ERP amplitudes of the N170 component for each condition. *p<0.05.
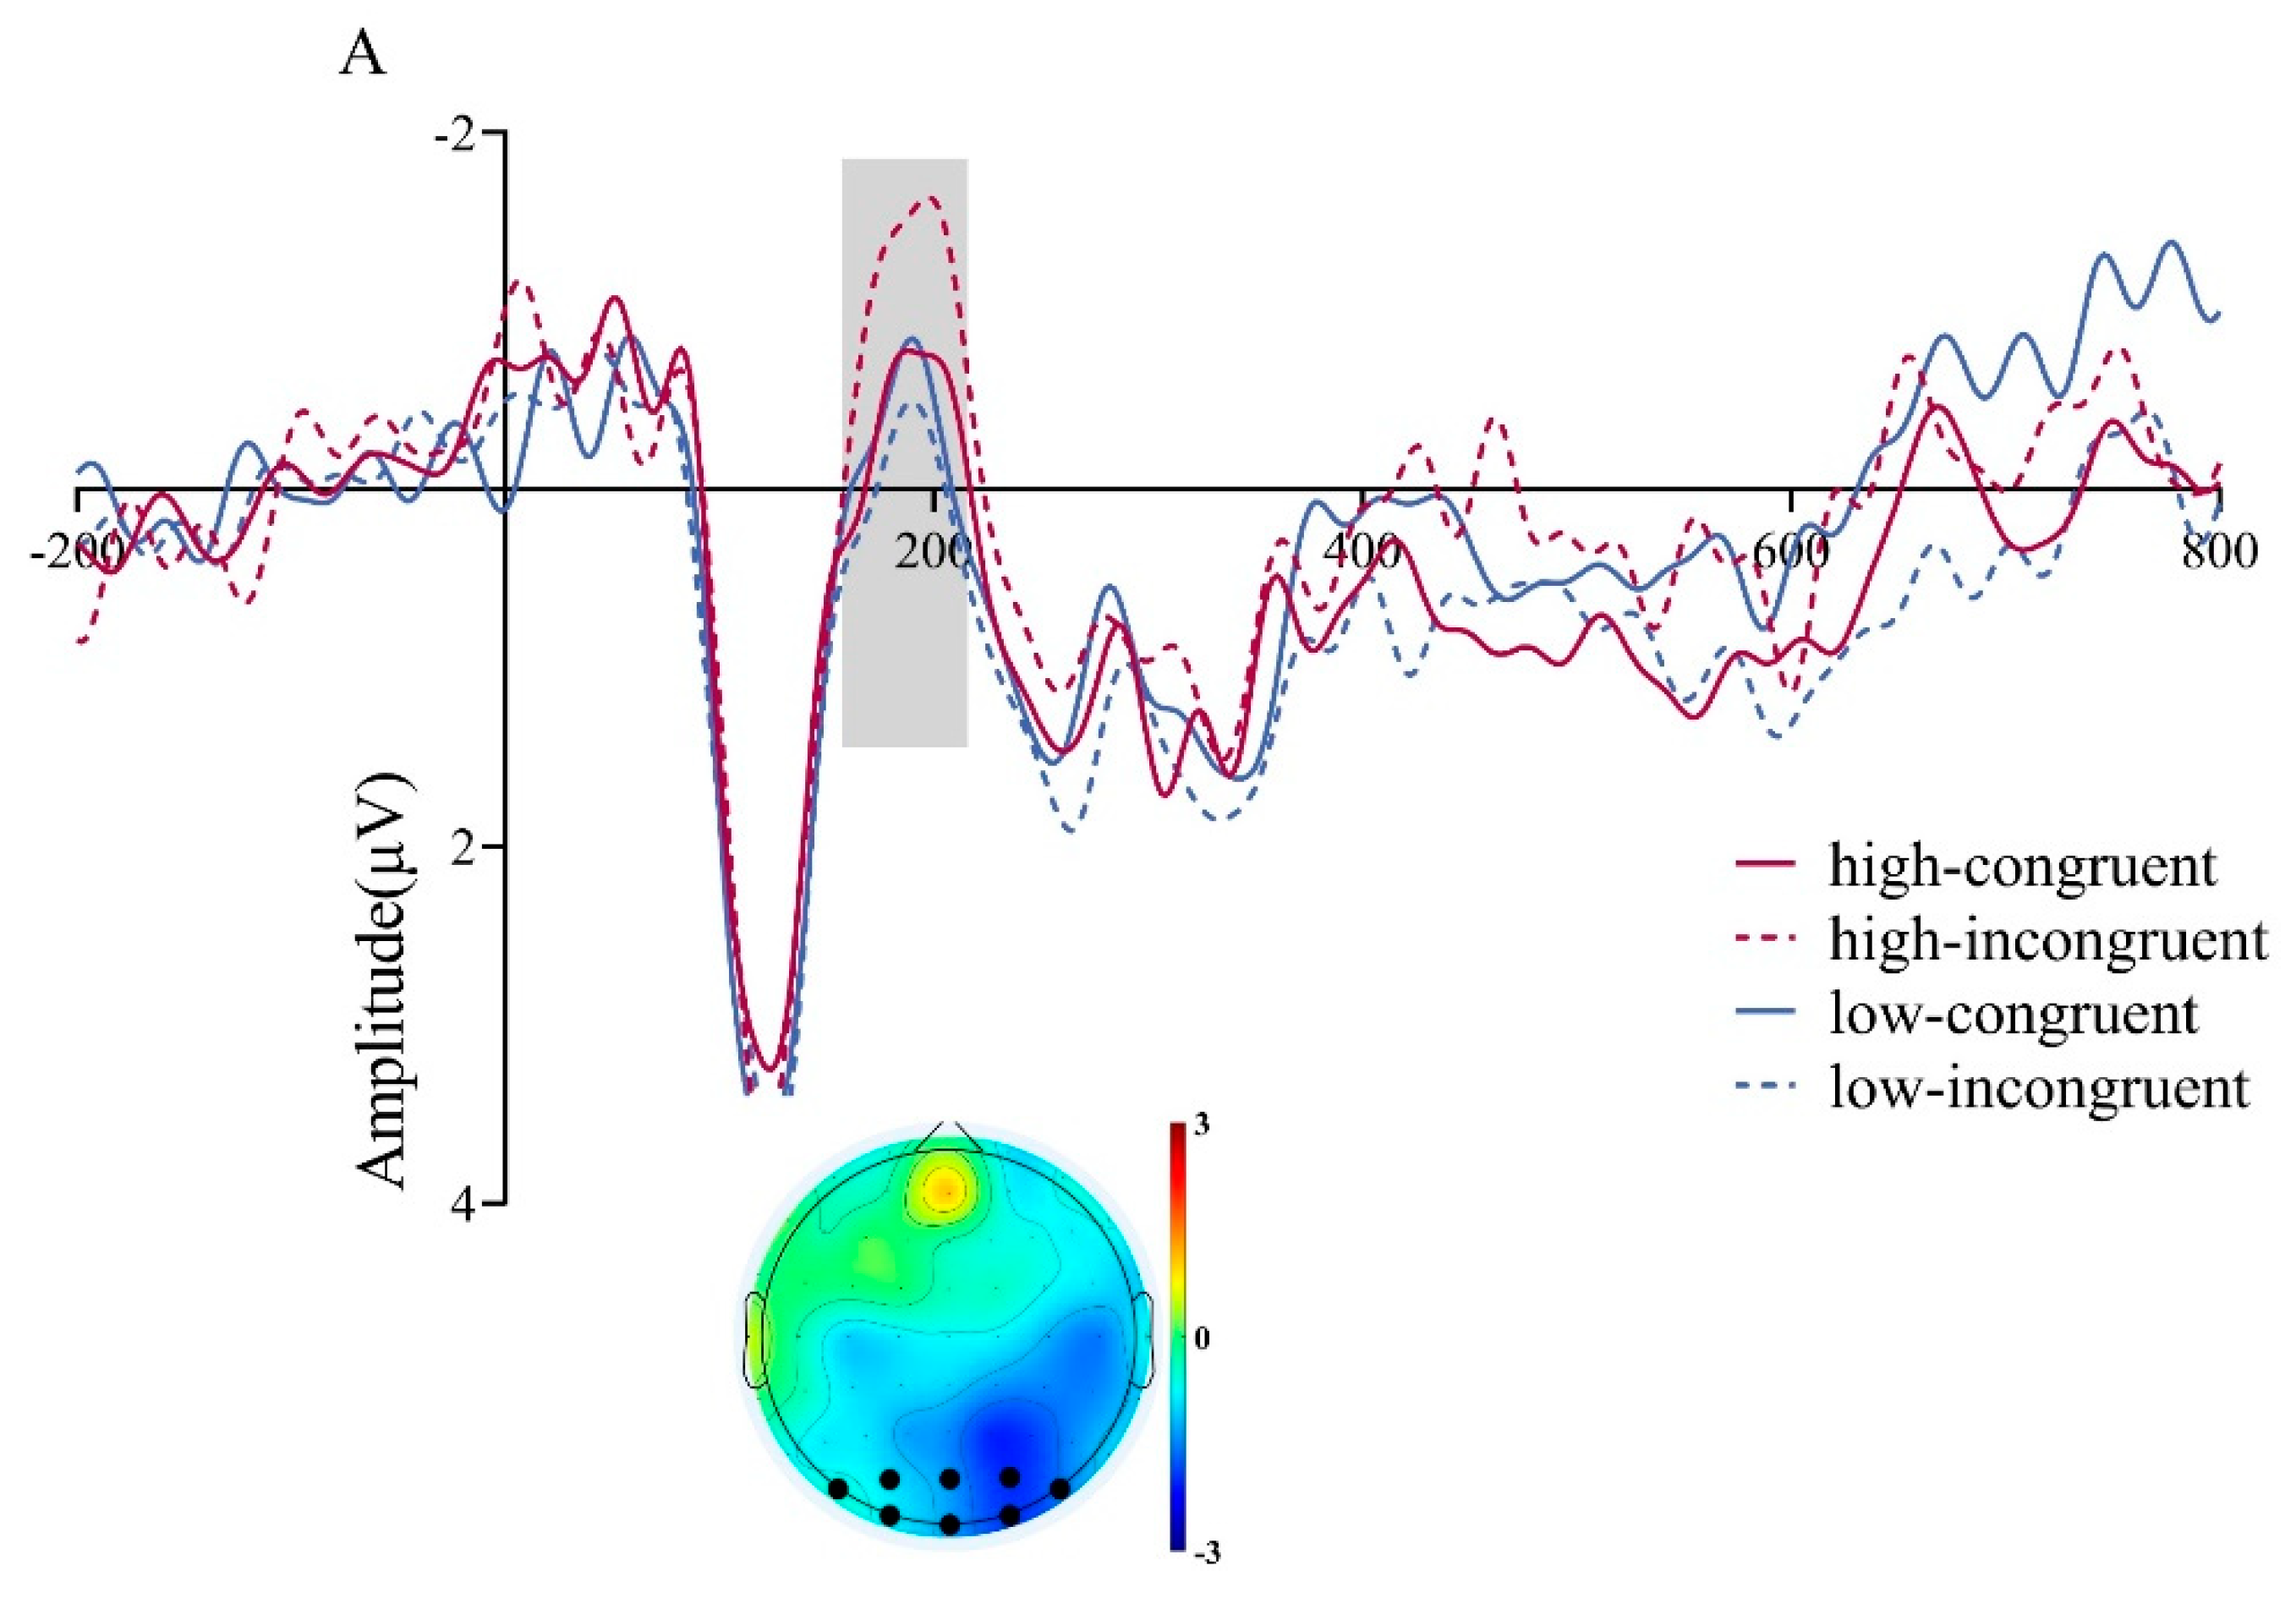
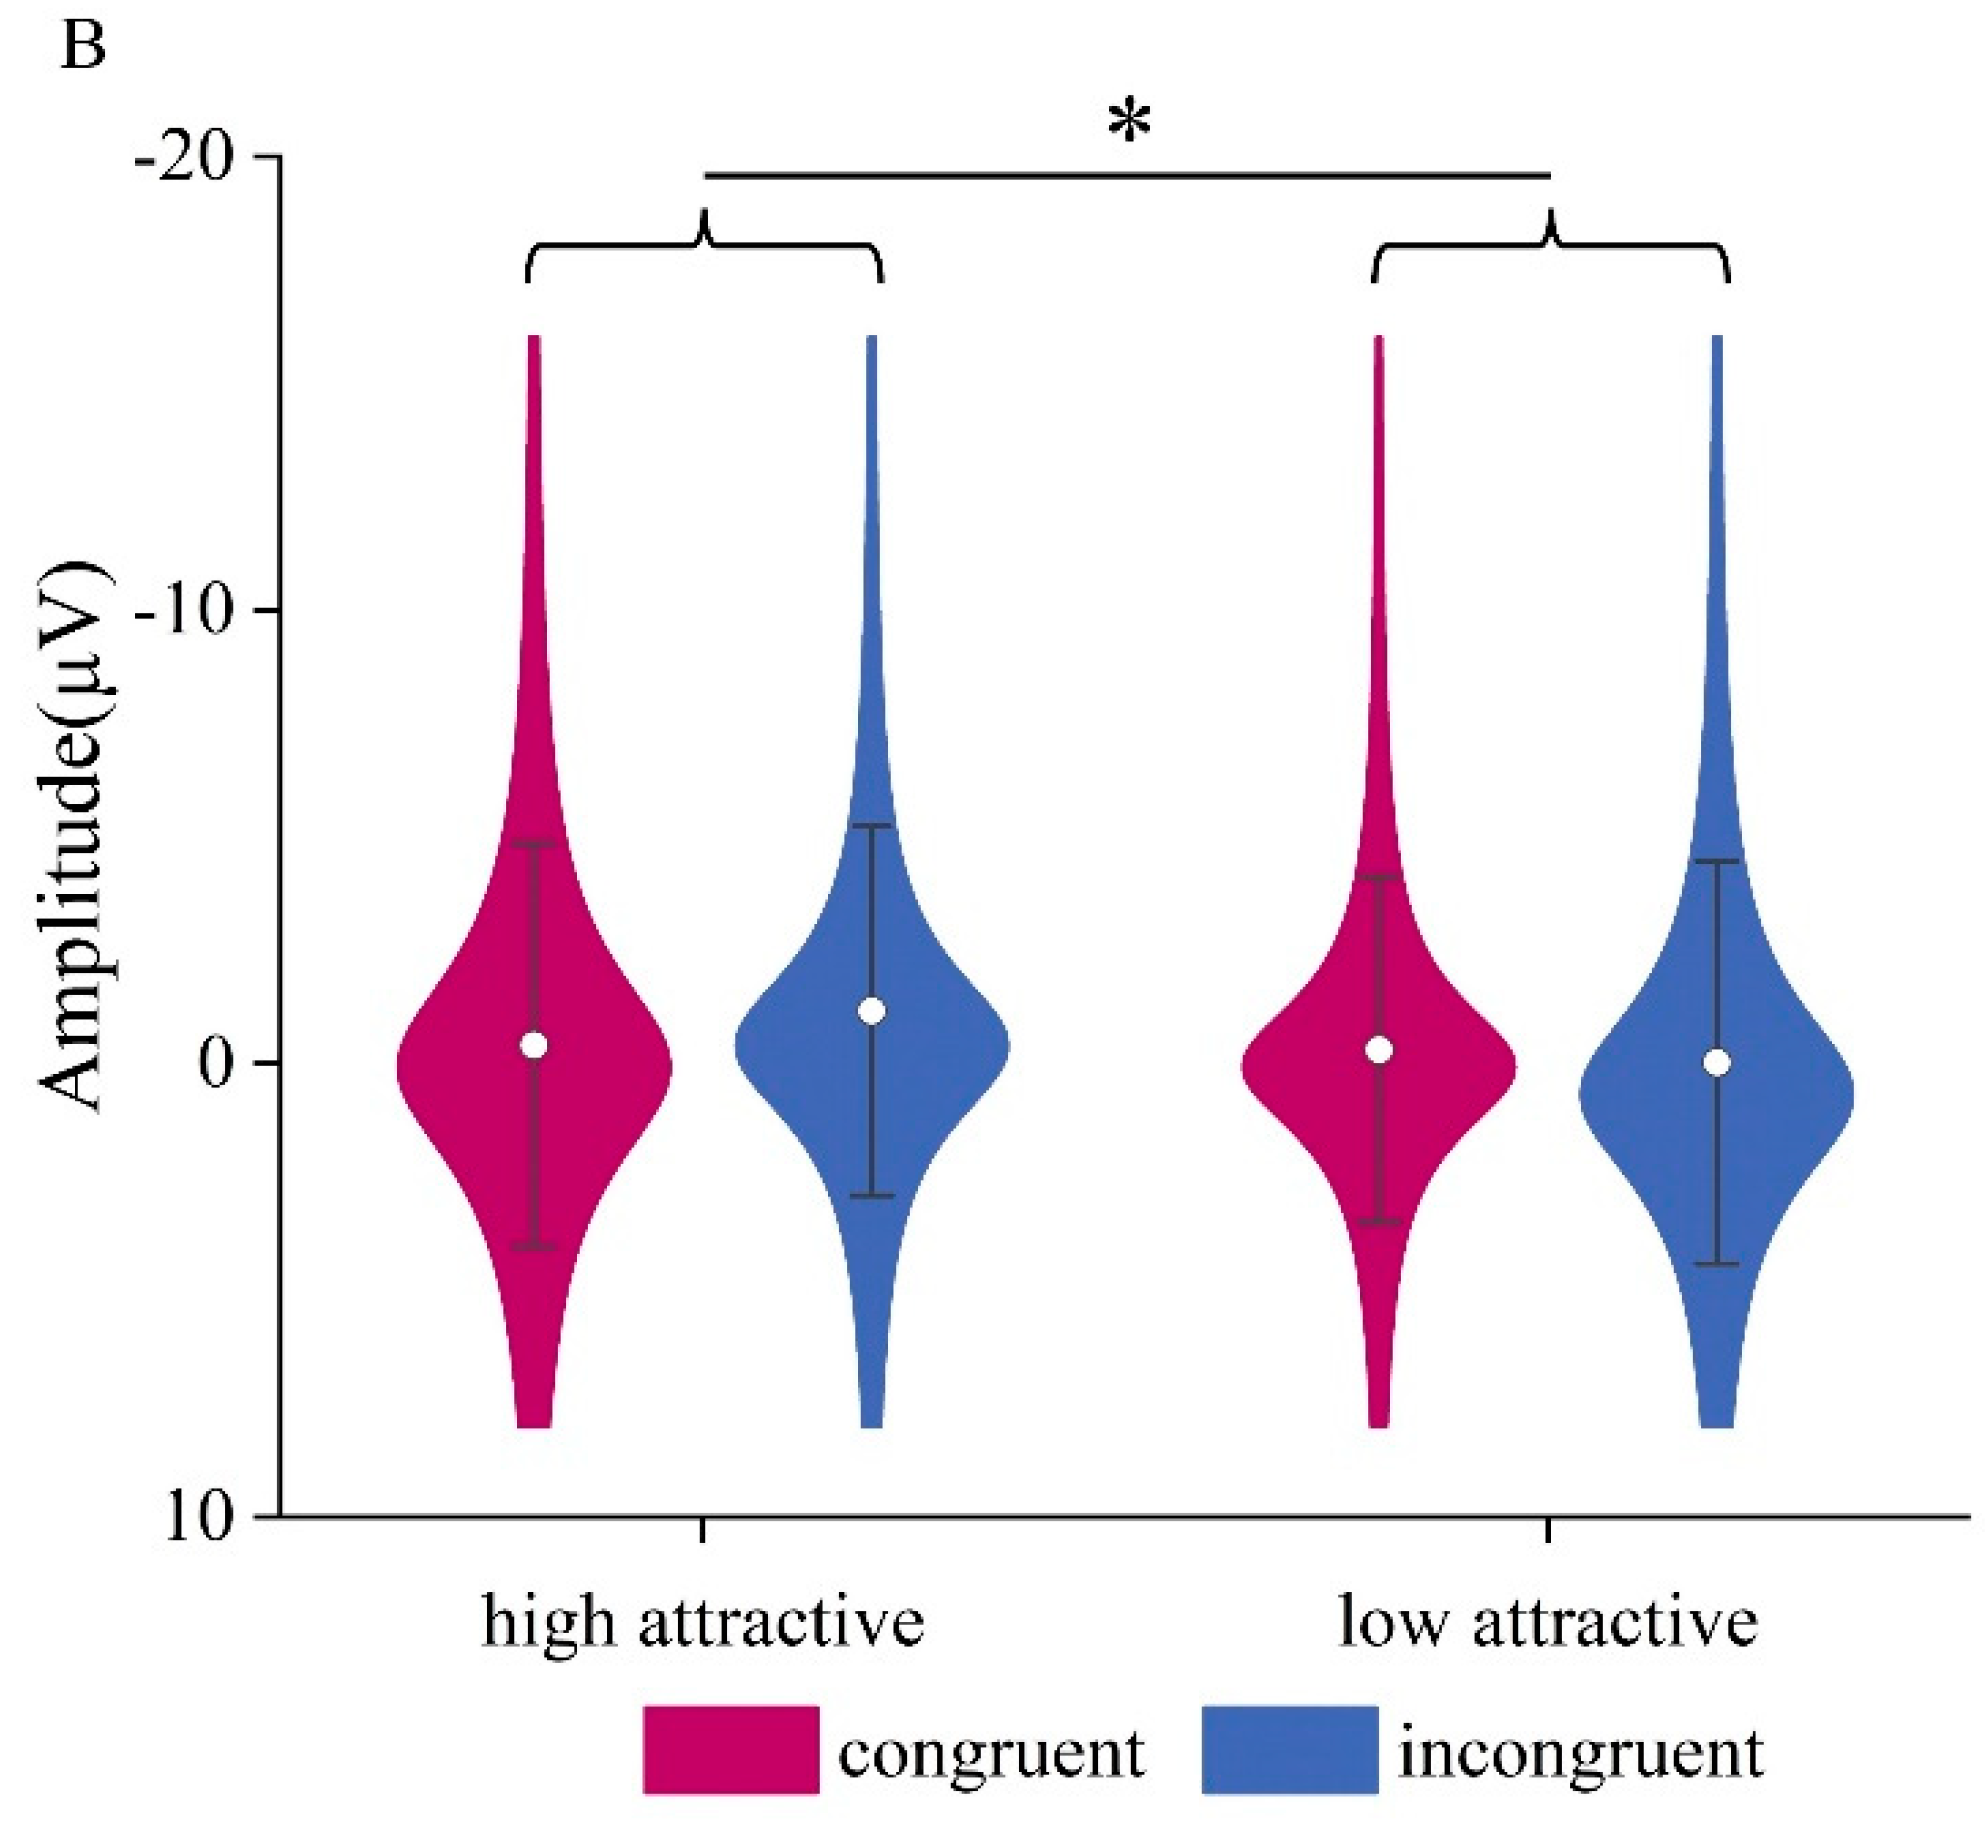
Figure 5.
LPC Component in Facial Attractiveness Judgment. (A) The ERP waveforms in the region of interest (ROI) for the LPC component, along with topographical maps showing the high attractive condition minus the low attractive condition (left) and the incongruent condition minus the congruent condition (right) within the 650-800 ms time window. (B) ERP amplitudes of the LPC component for each condition combination. **p < 0.01.
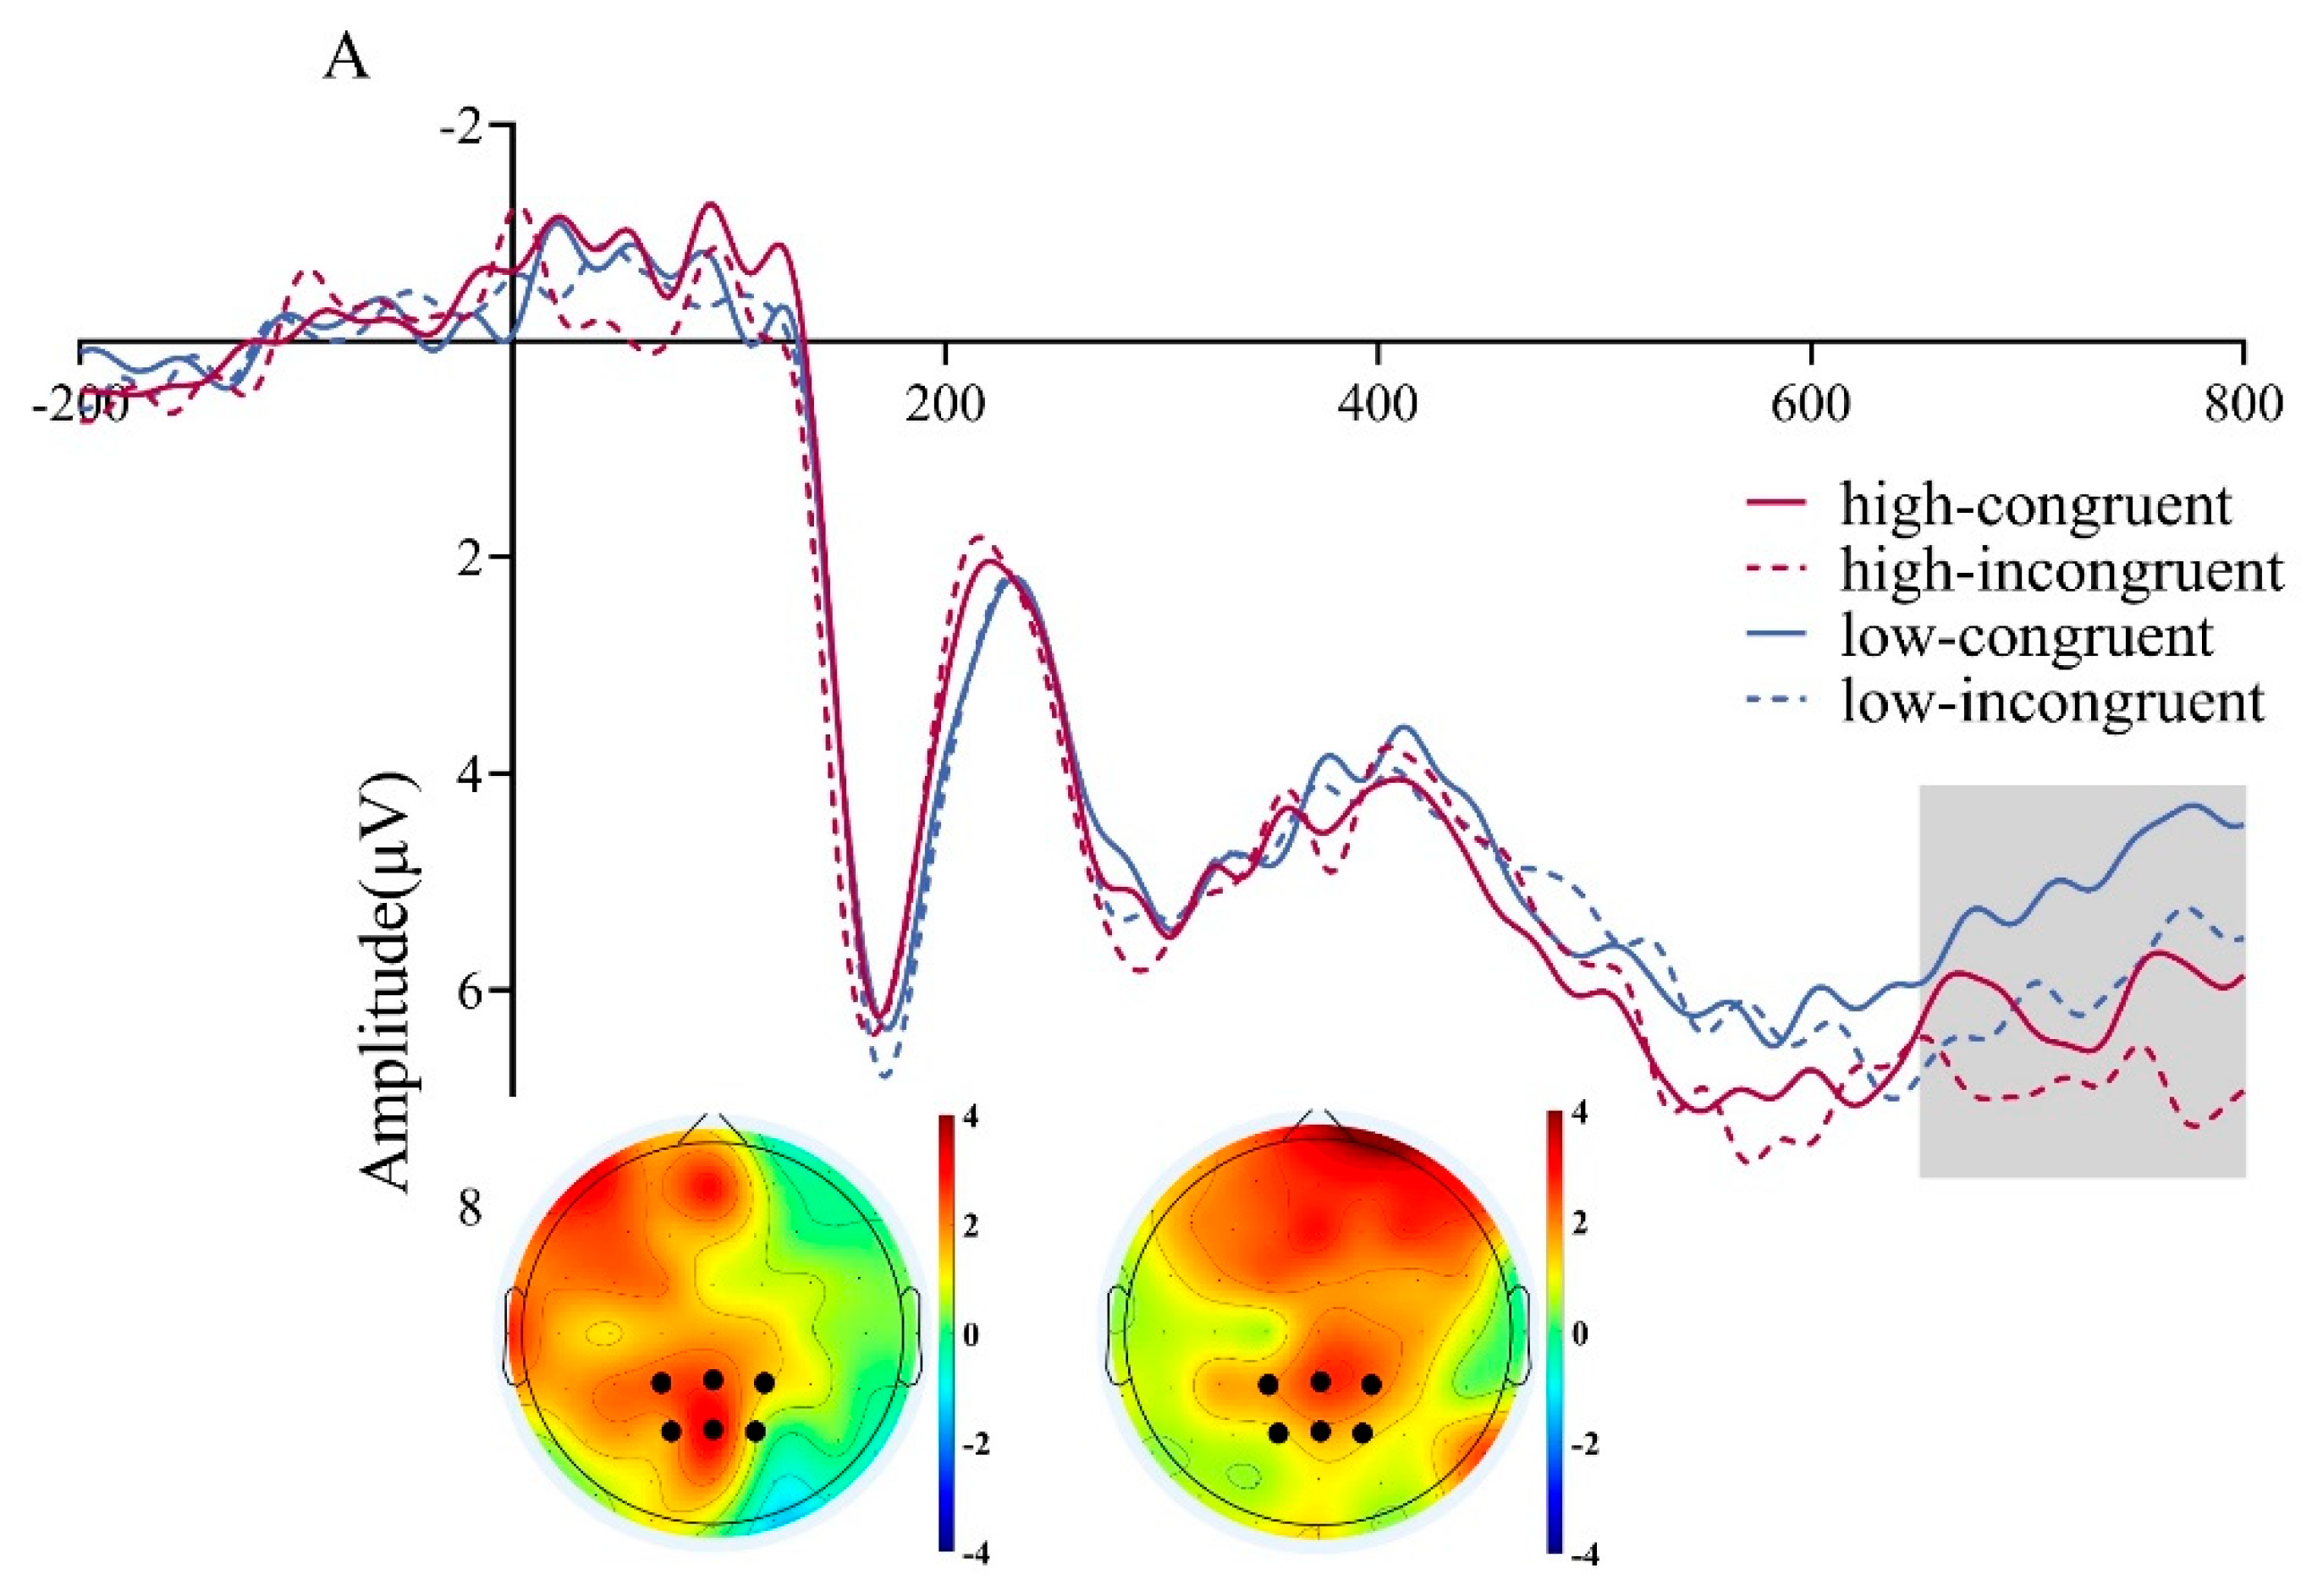
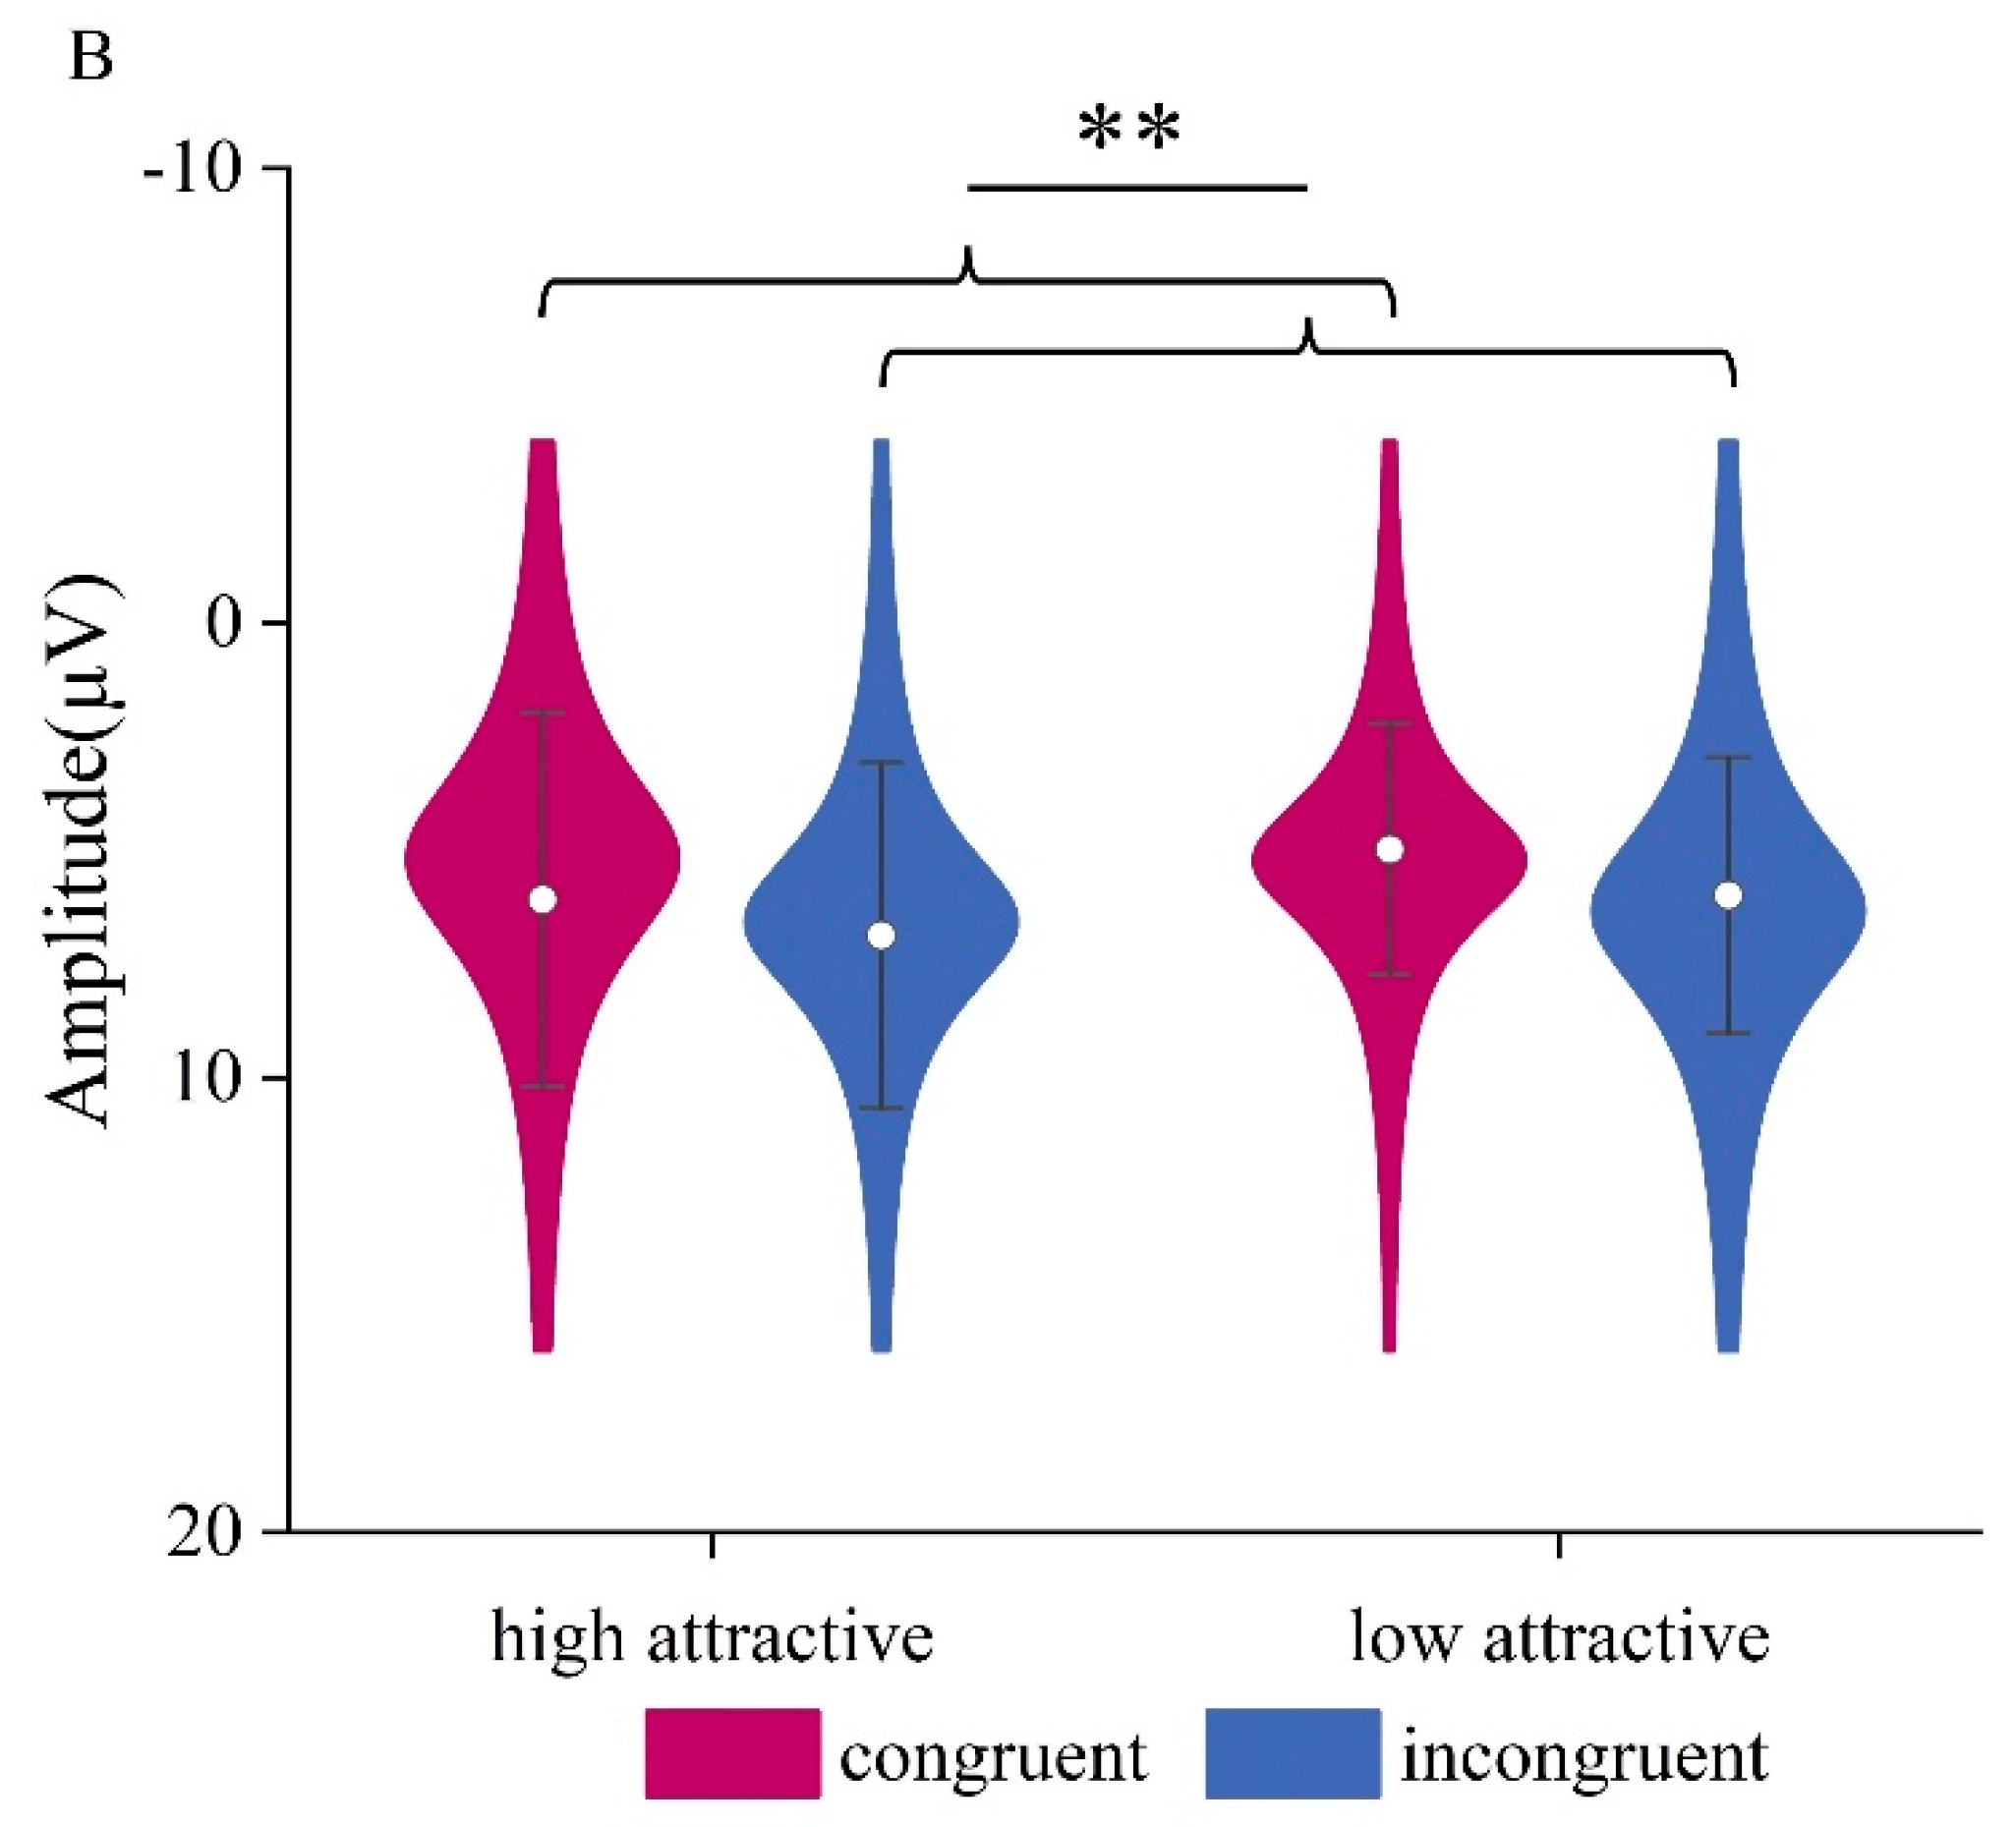
Figure 6.
N1 component in the Vocal Attractiveness Judgment task. (A) Grand mean ERP waveforms of the N1 (ROI) during classification of vocal attractiveness, and the difference topography of the low attractive minus the high attractive conditions in the 90-140ms time window. (B) ERP amplitudes of the N1 component for four condition combinations. ***p < 0.001.
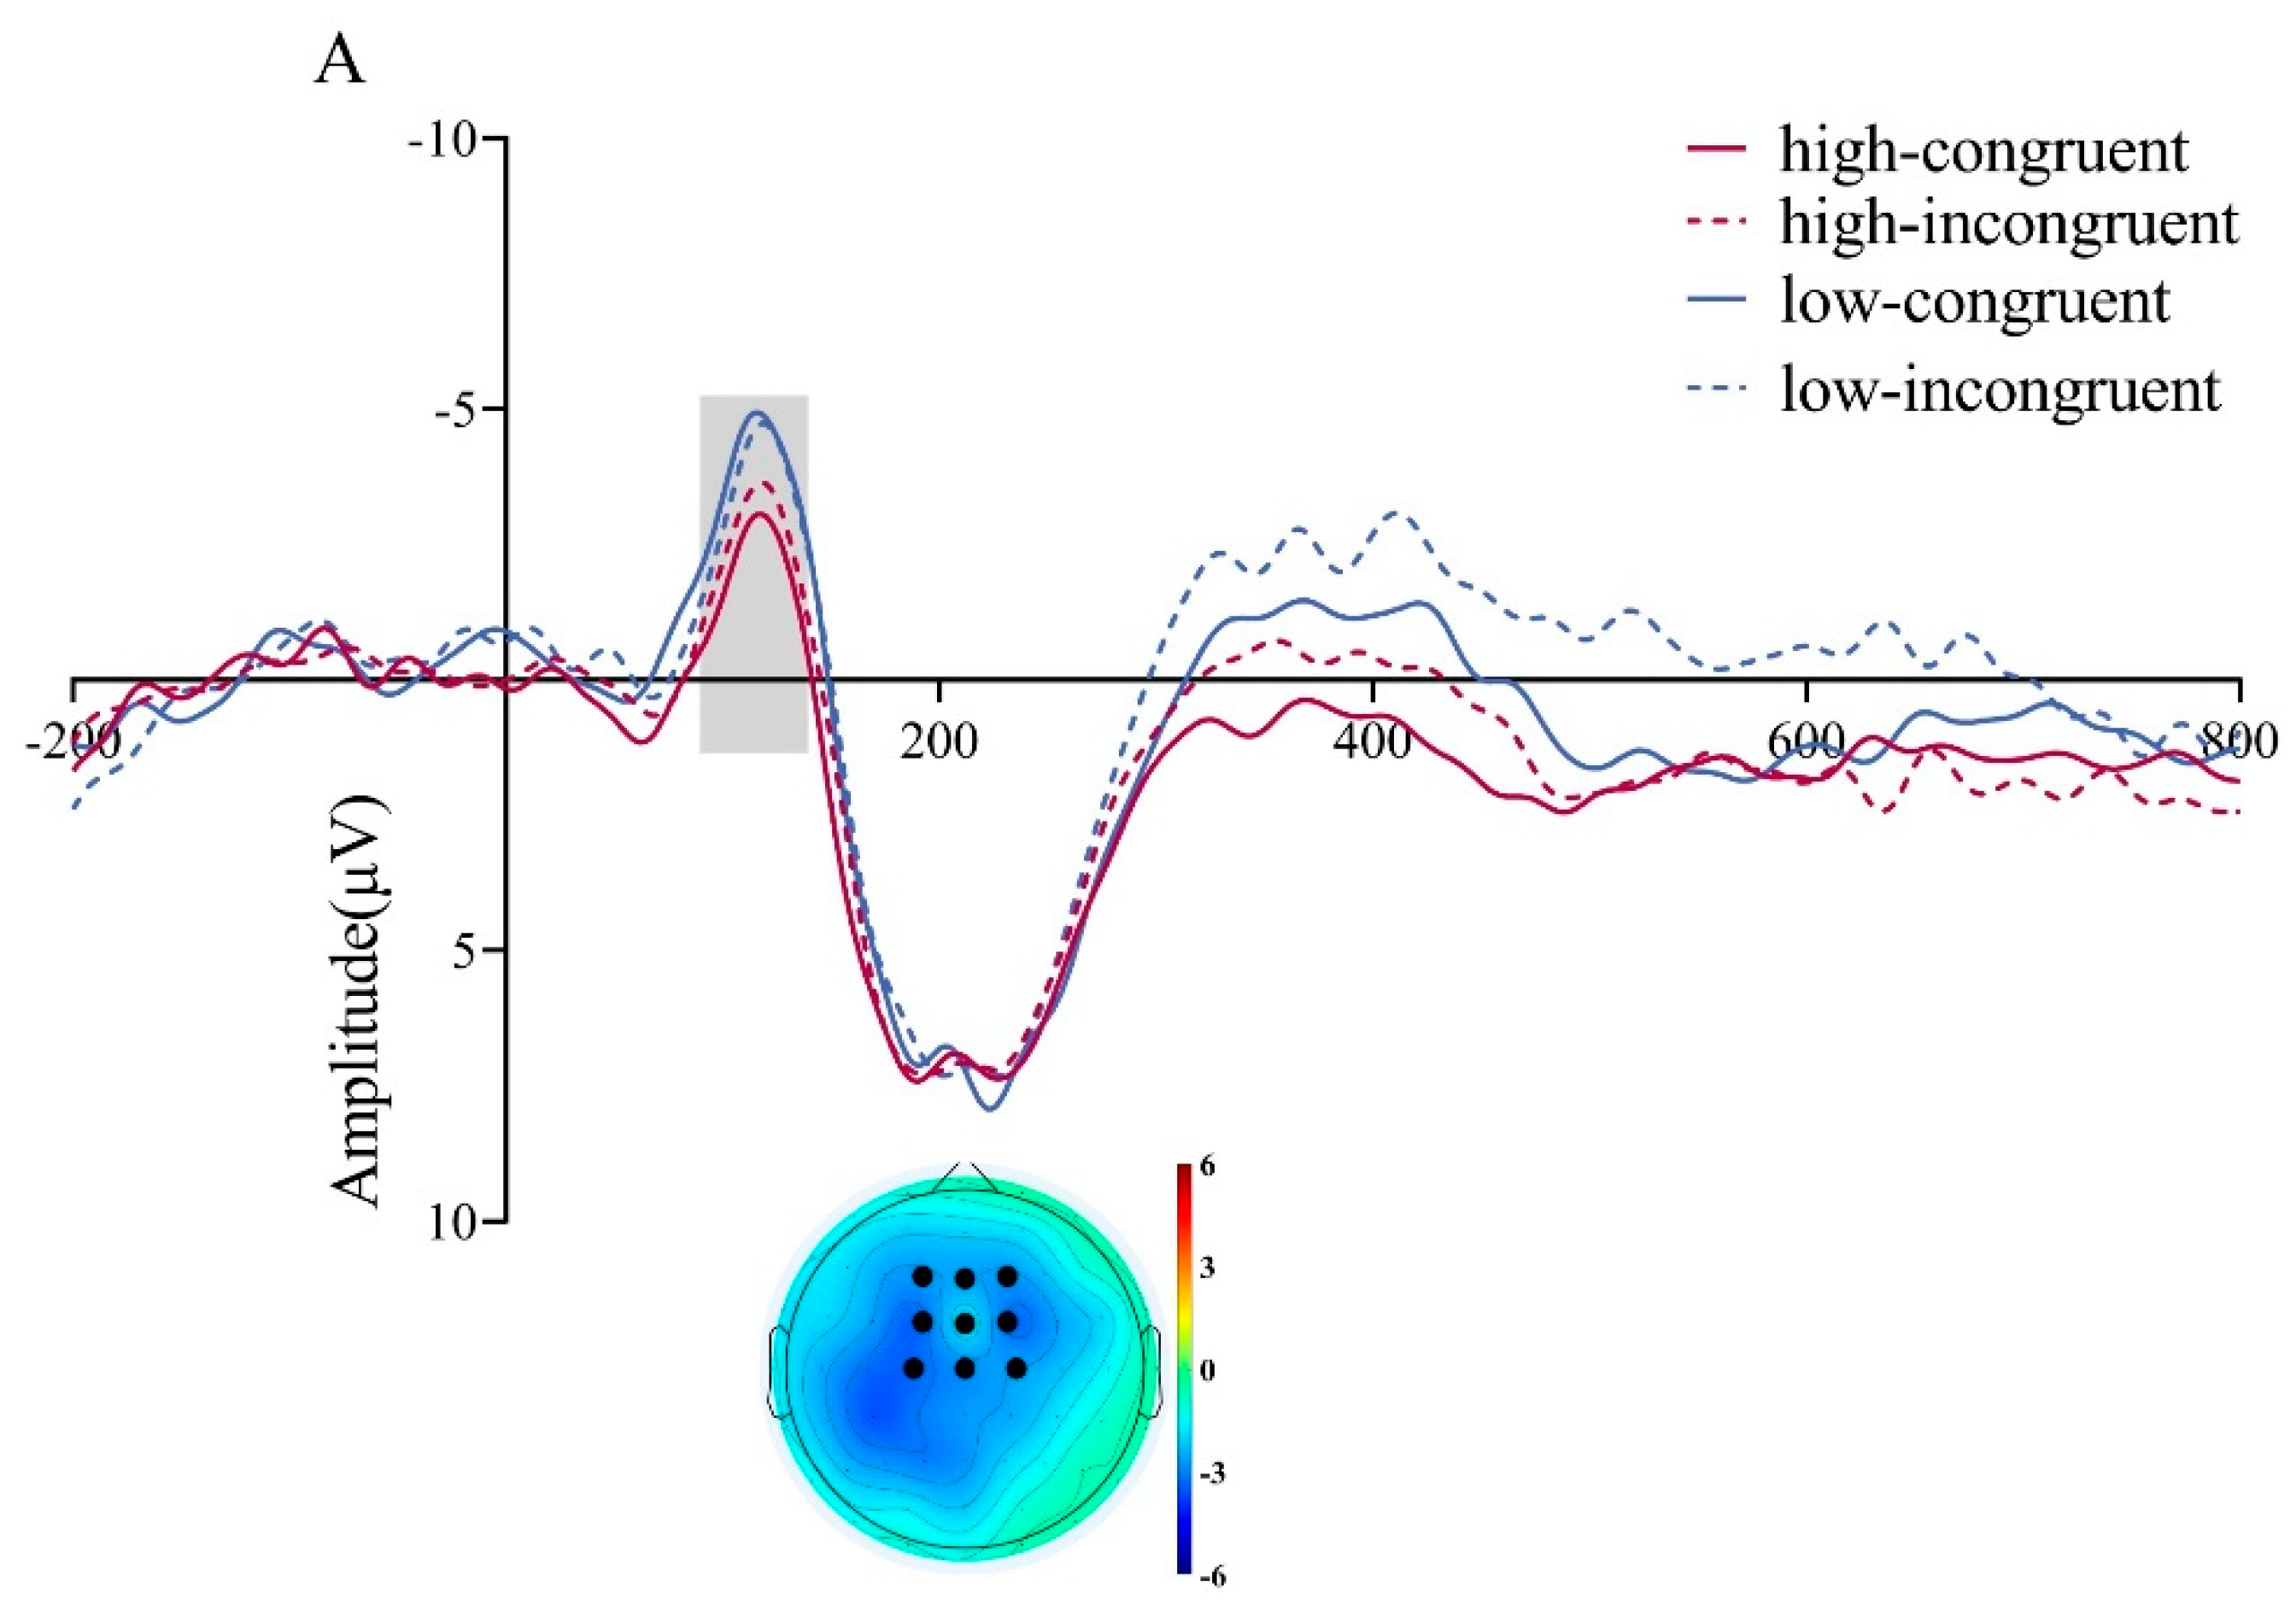
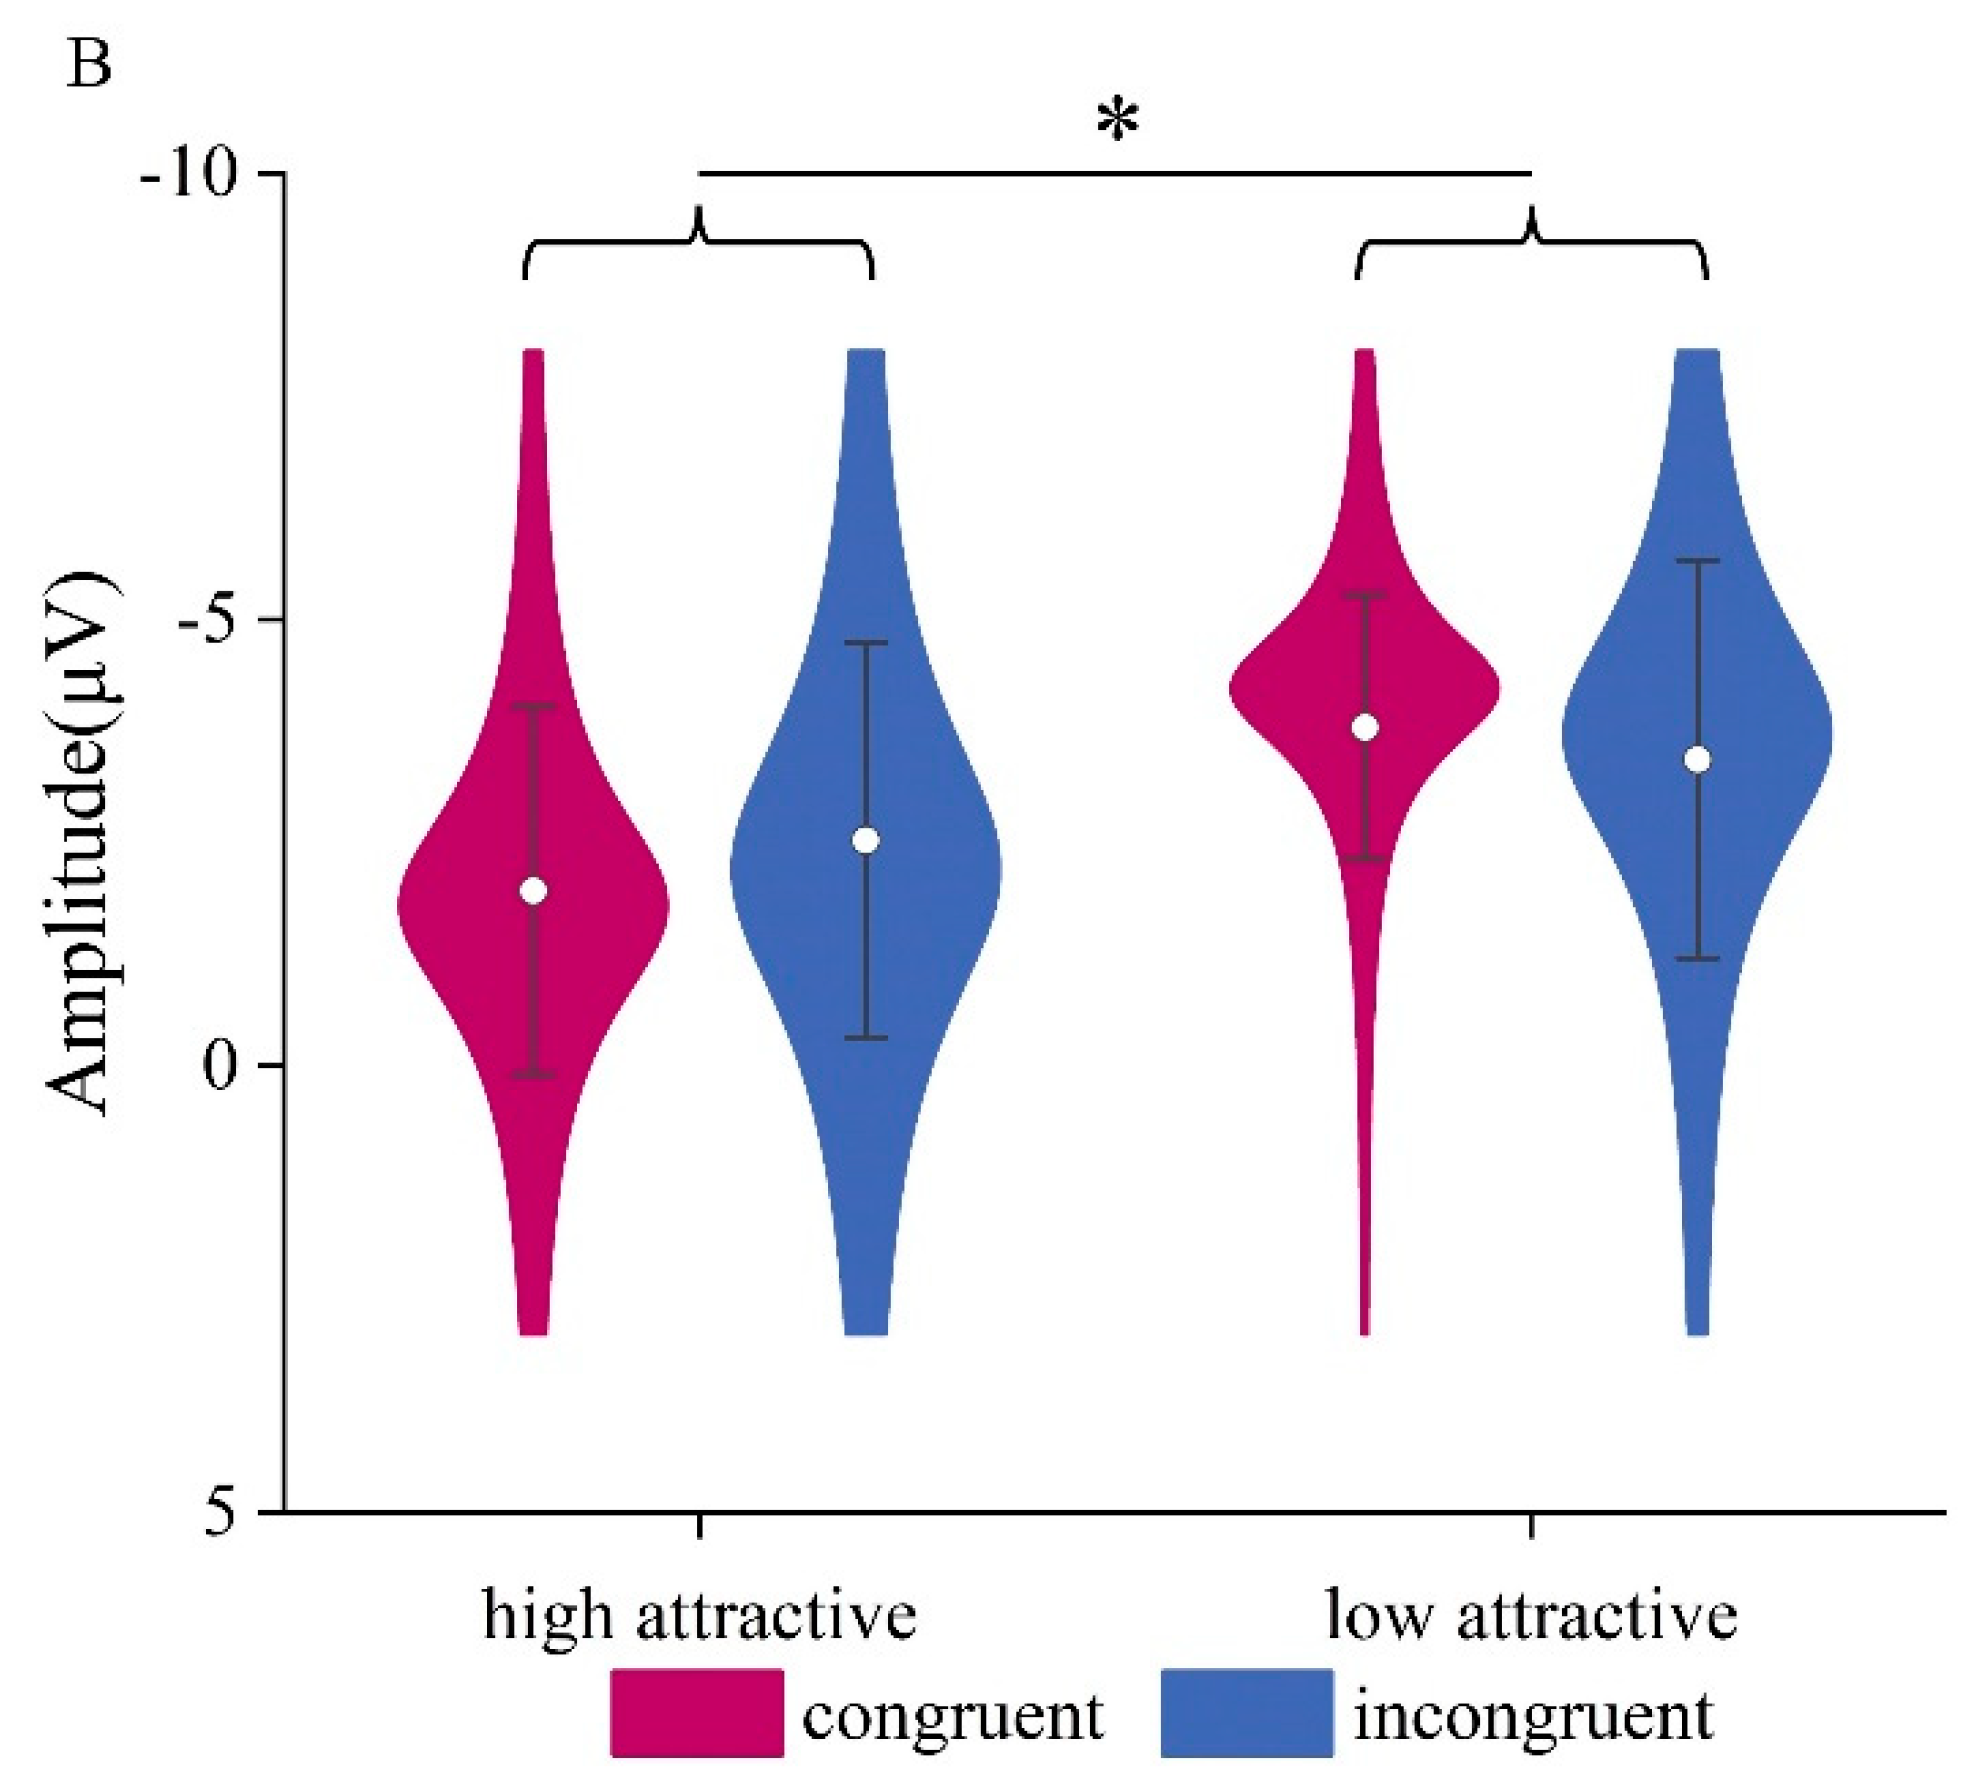
Figure 7.
N400 component in the Vocal Attractiveness Judgment task. (A) Grand mean ERP waveforms for the N400 ROI during vocal attractiveness classification, and the difference topography of the low attractive minus high attractive voice condition (left) and the incongruent minus congruent condition (right) in the 300-500ms time window. (B) ERP amplitude of the N400 component under different conditions. *p<0.05, ***p<0.001.
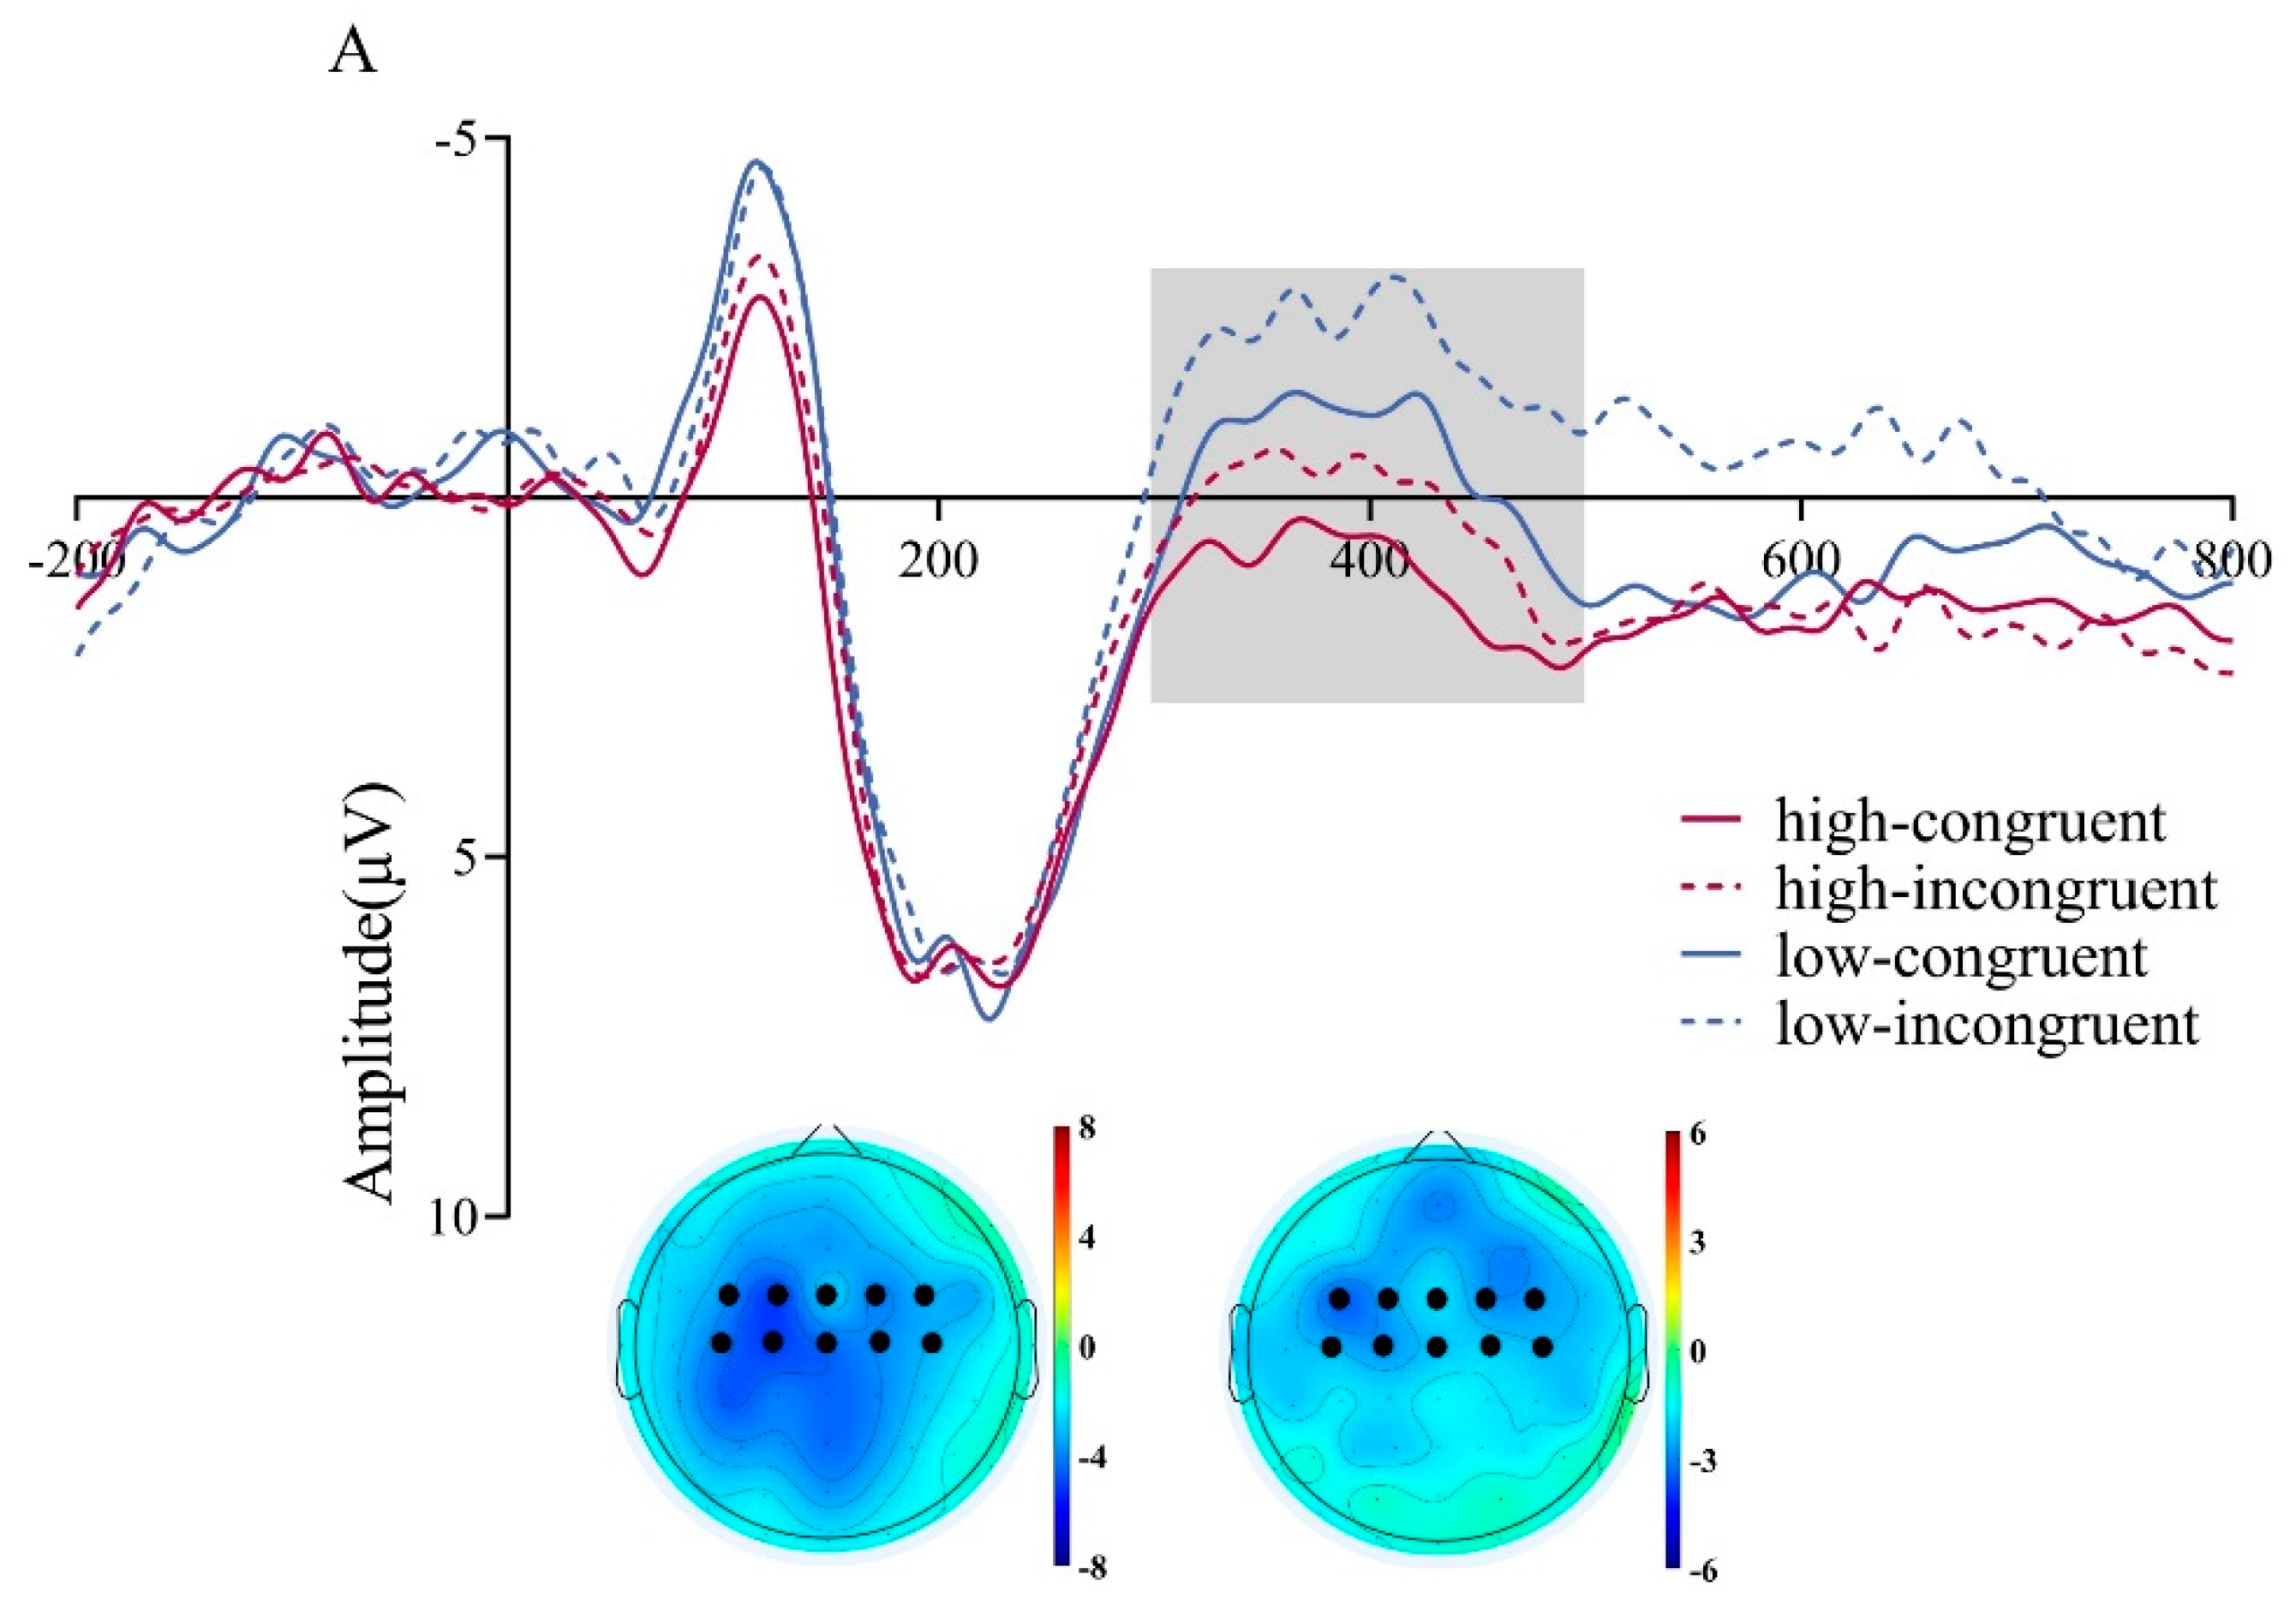
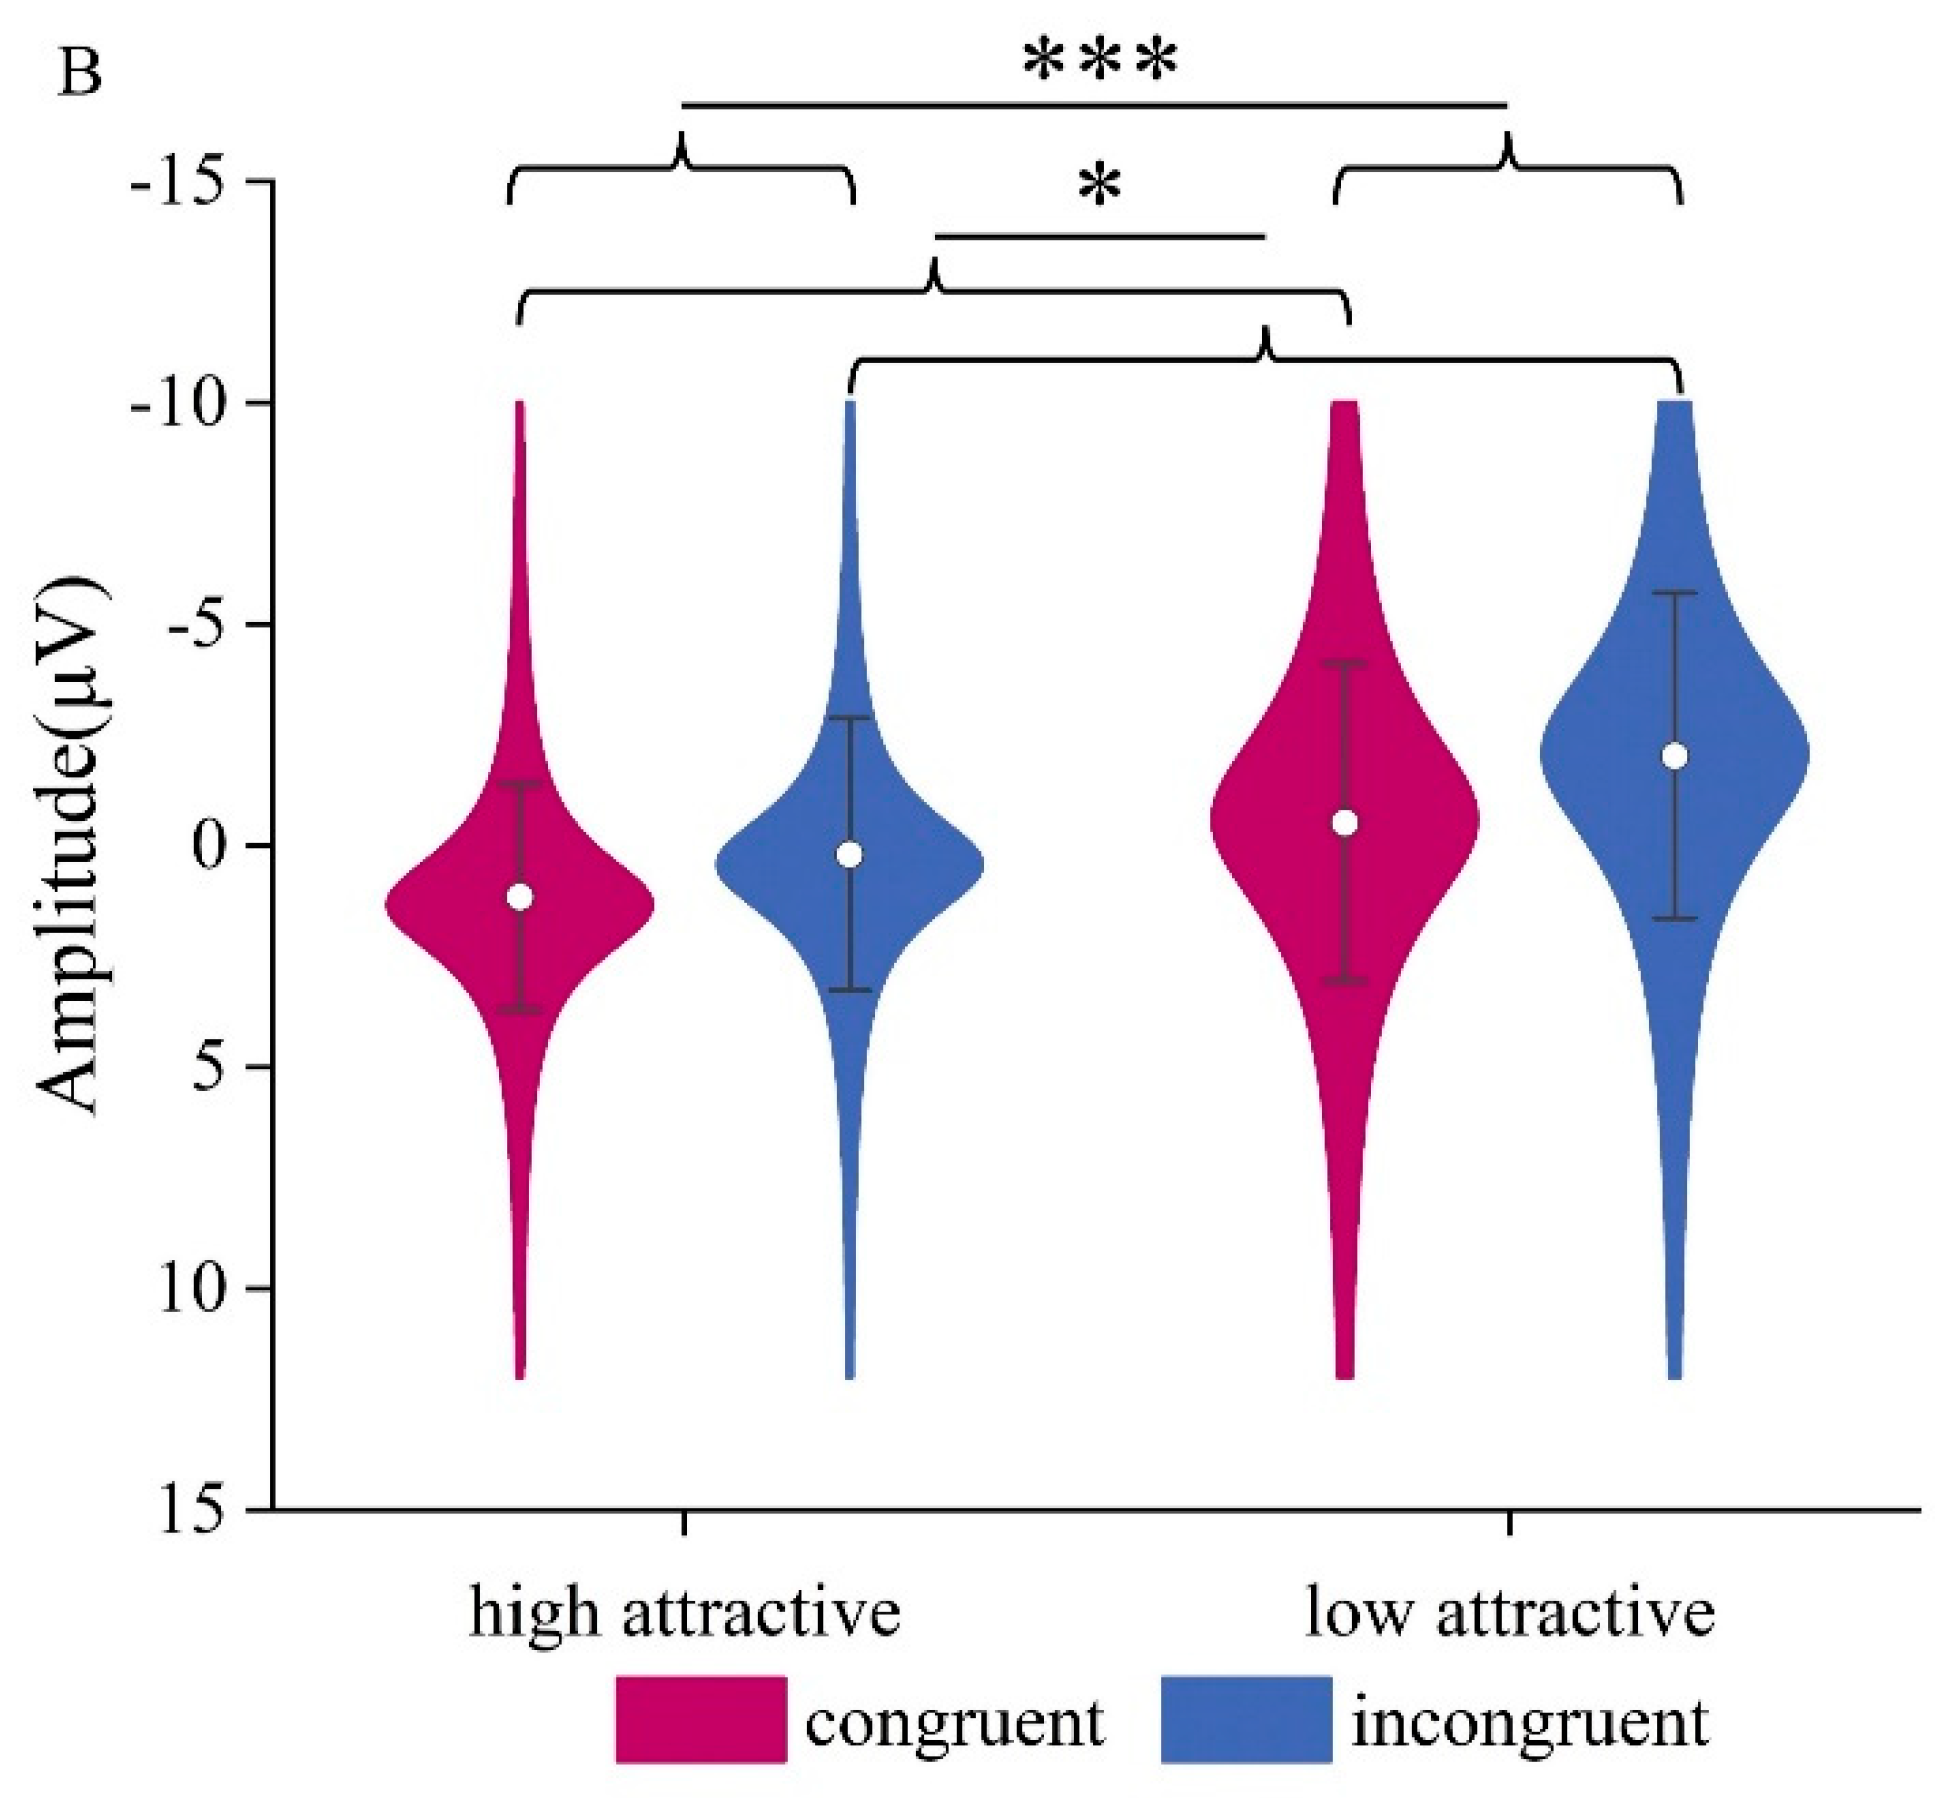
Figure 8.
LPC component in the Vocal Attractiveness Judgment task. (A) Grand mean ERP waveforms for the LPC ROI during vocal attractiveness classification, and the difference topography of the high attractive voice condition minus the low attractive voice condition (left), the congruent condition minus the incongruent condition (middle), and the low attractive-congruent condition minus the low attractive-incongruent condition (right) in the 500-650ms time window. (B) ERP amplitude of the LPC component under different conditions. *p<0.05,**p<0.01, ***p<0.001.
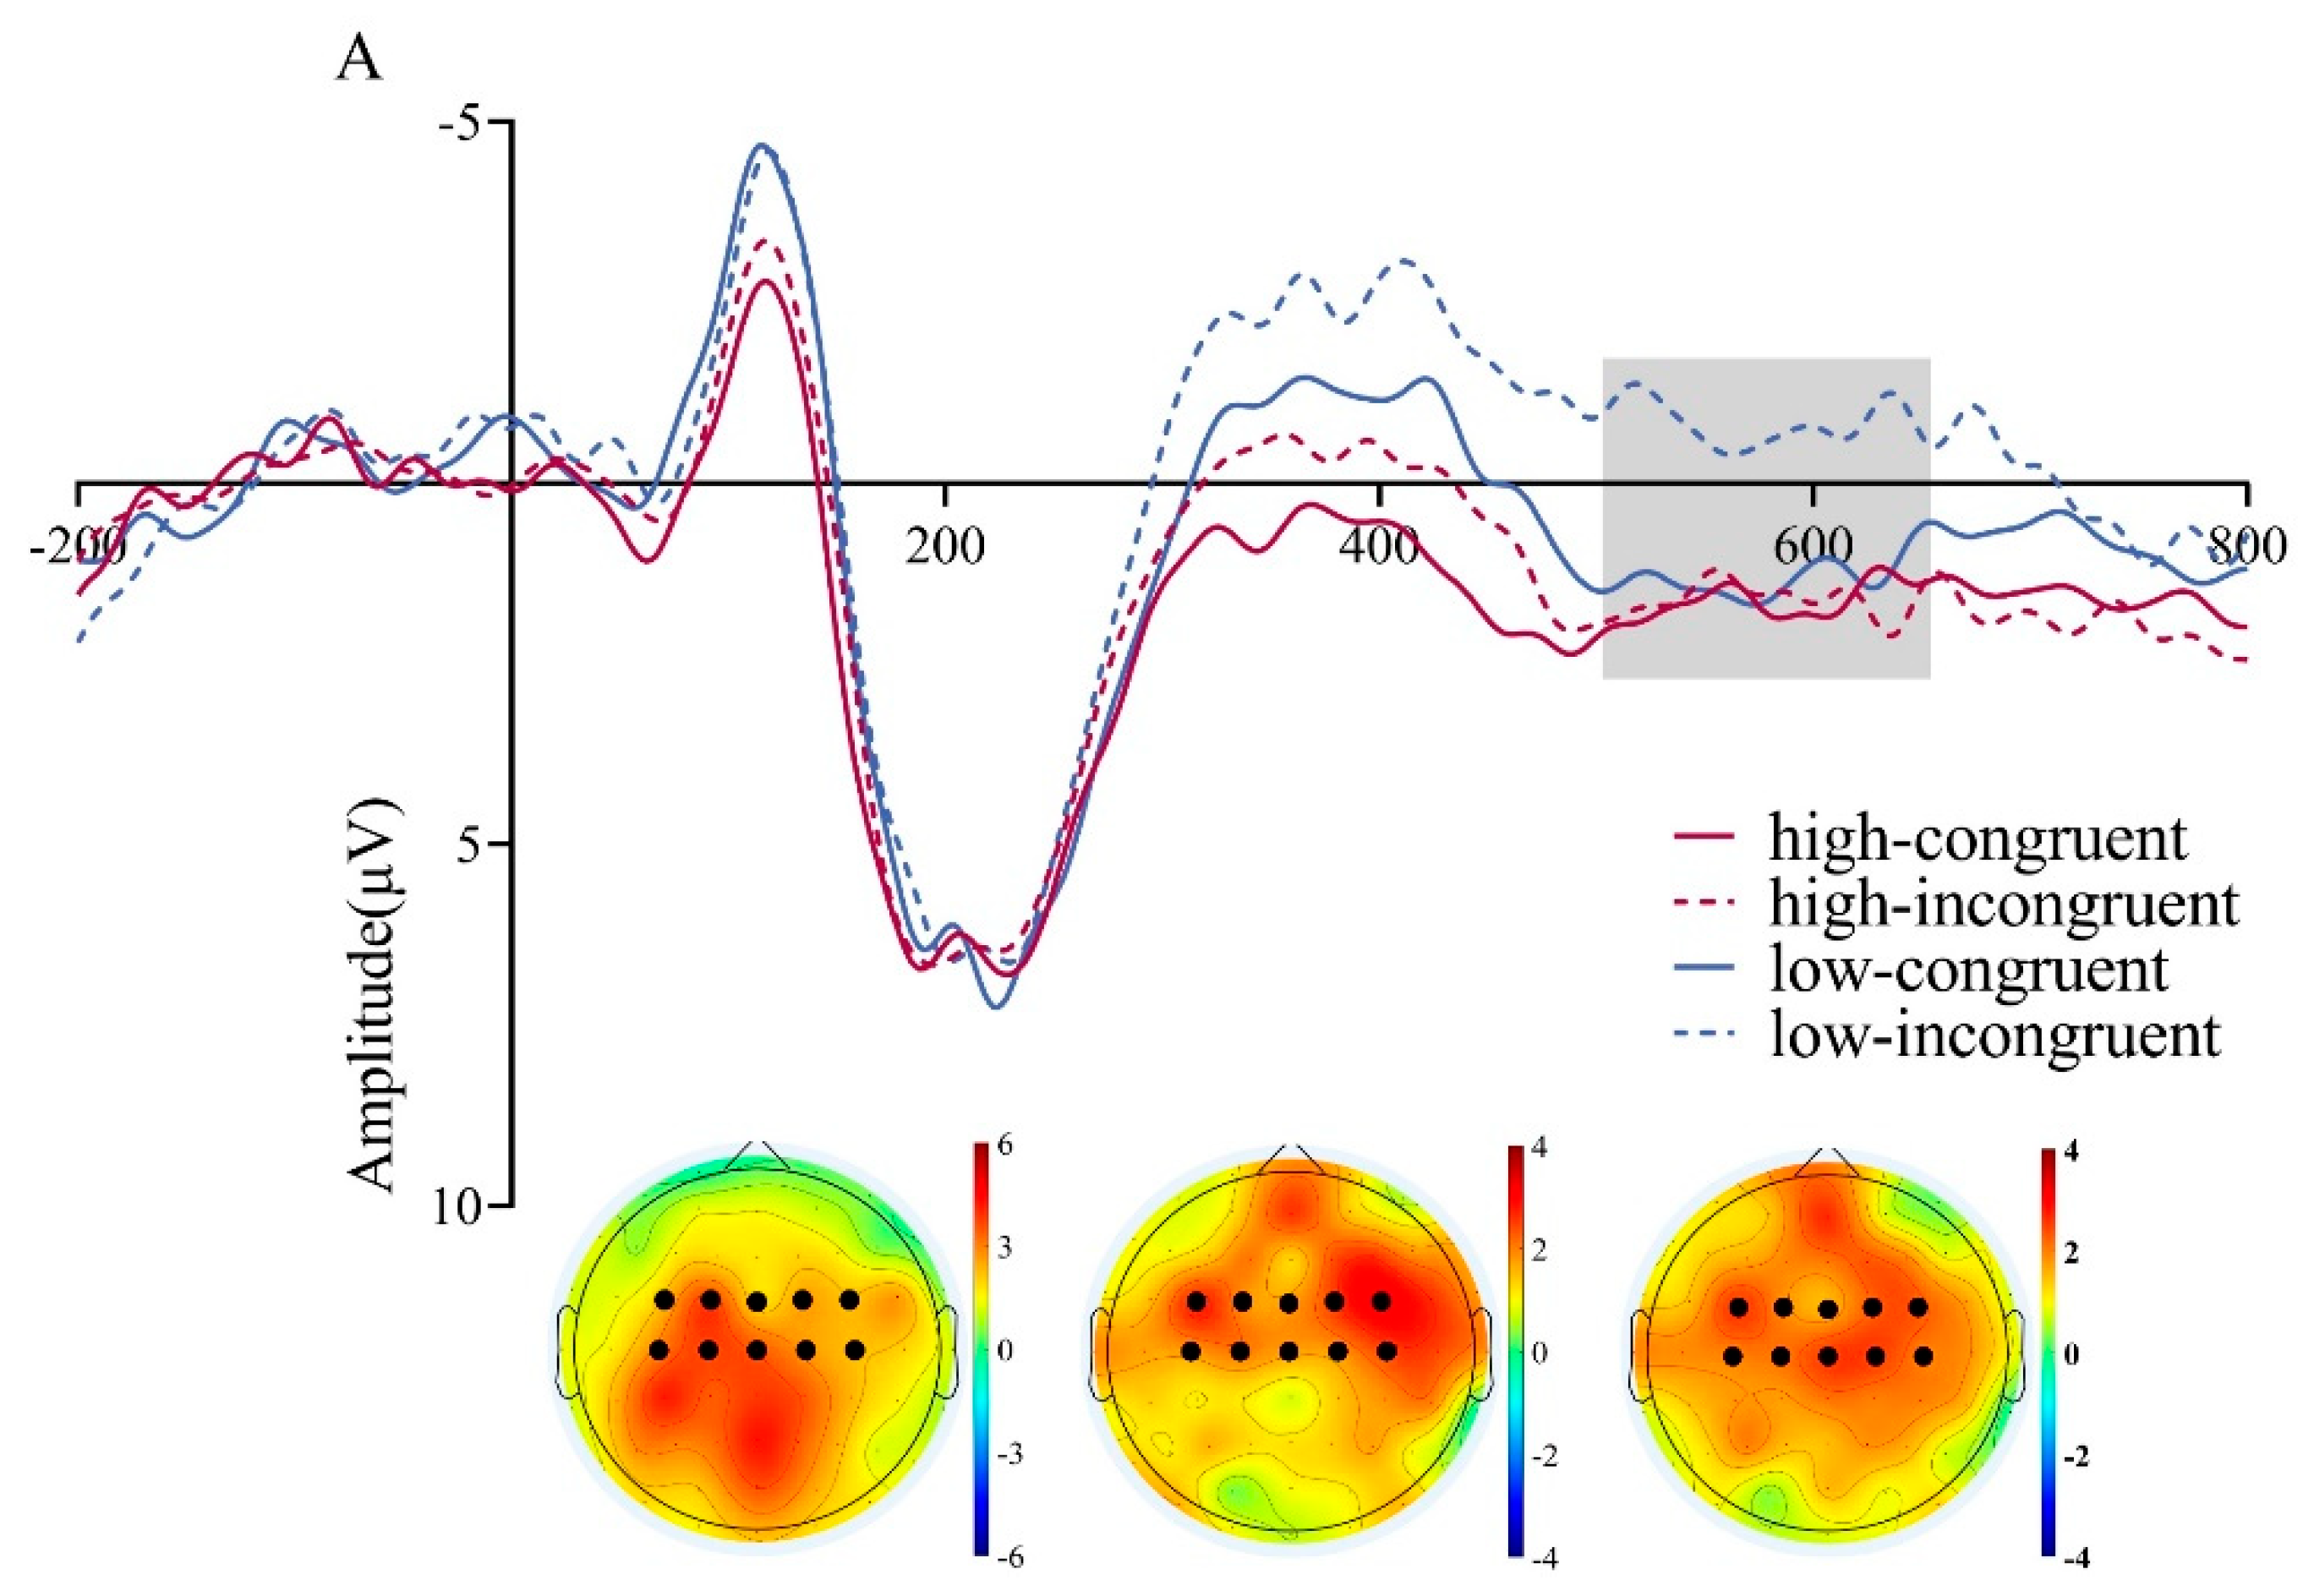
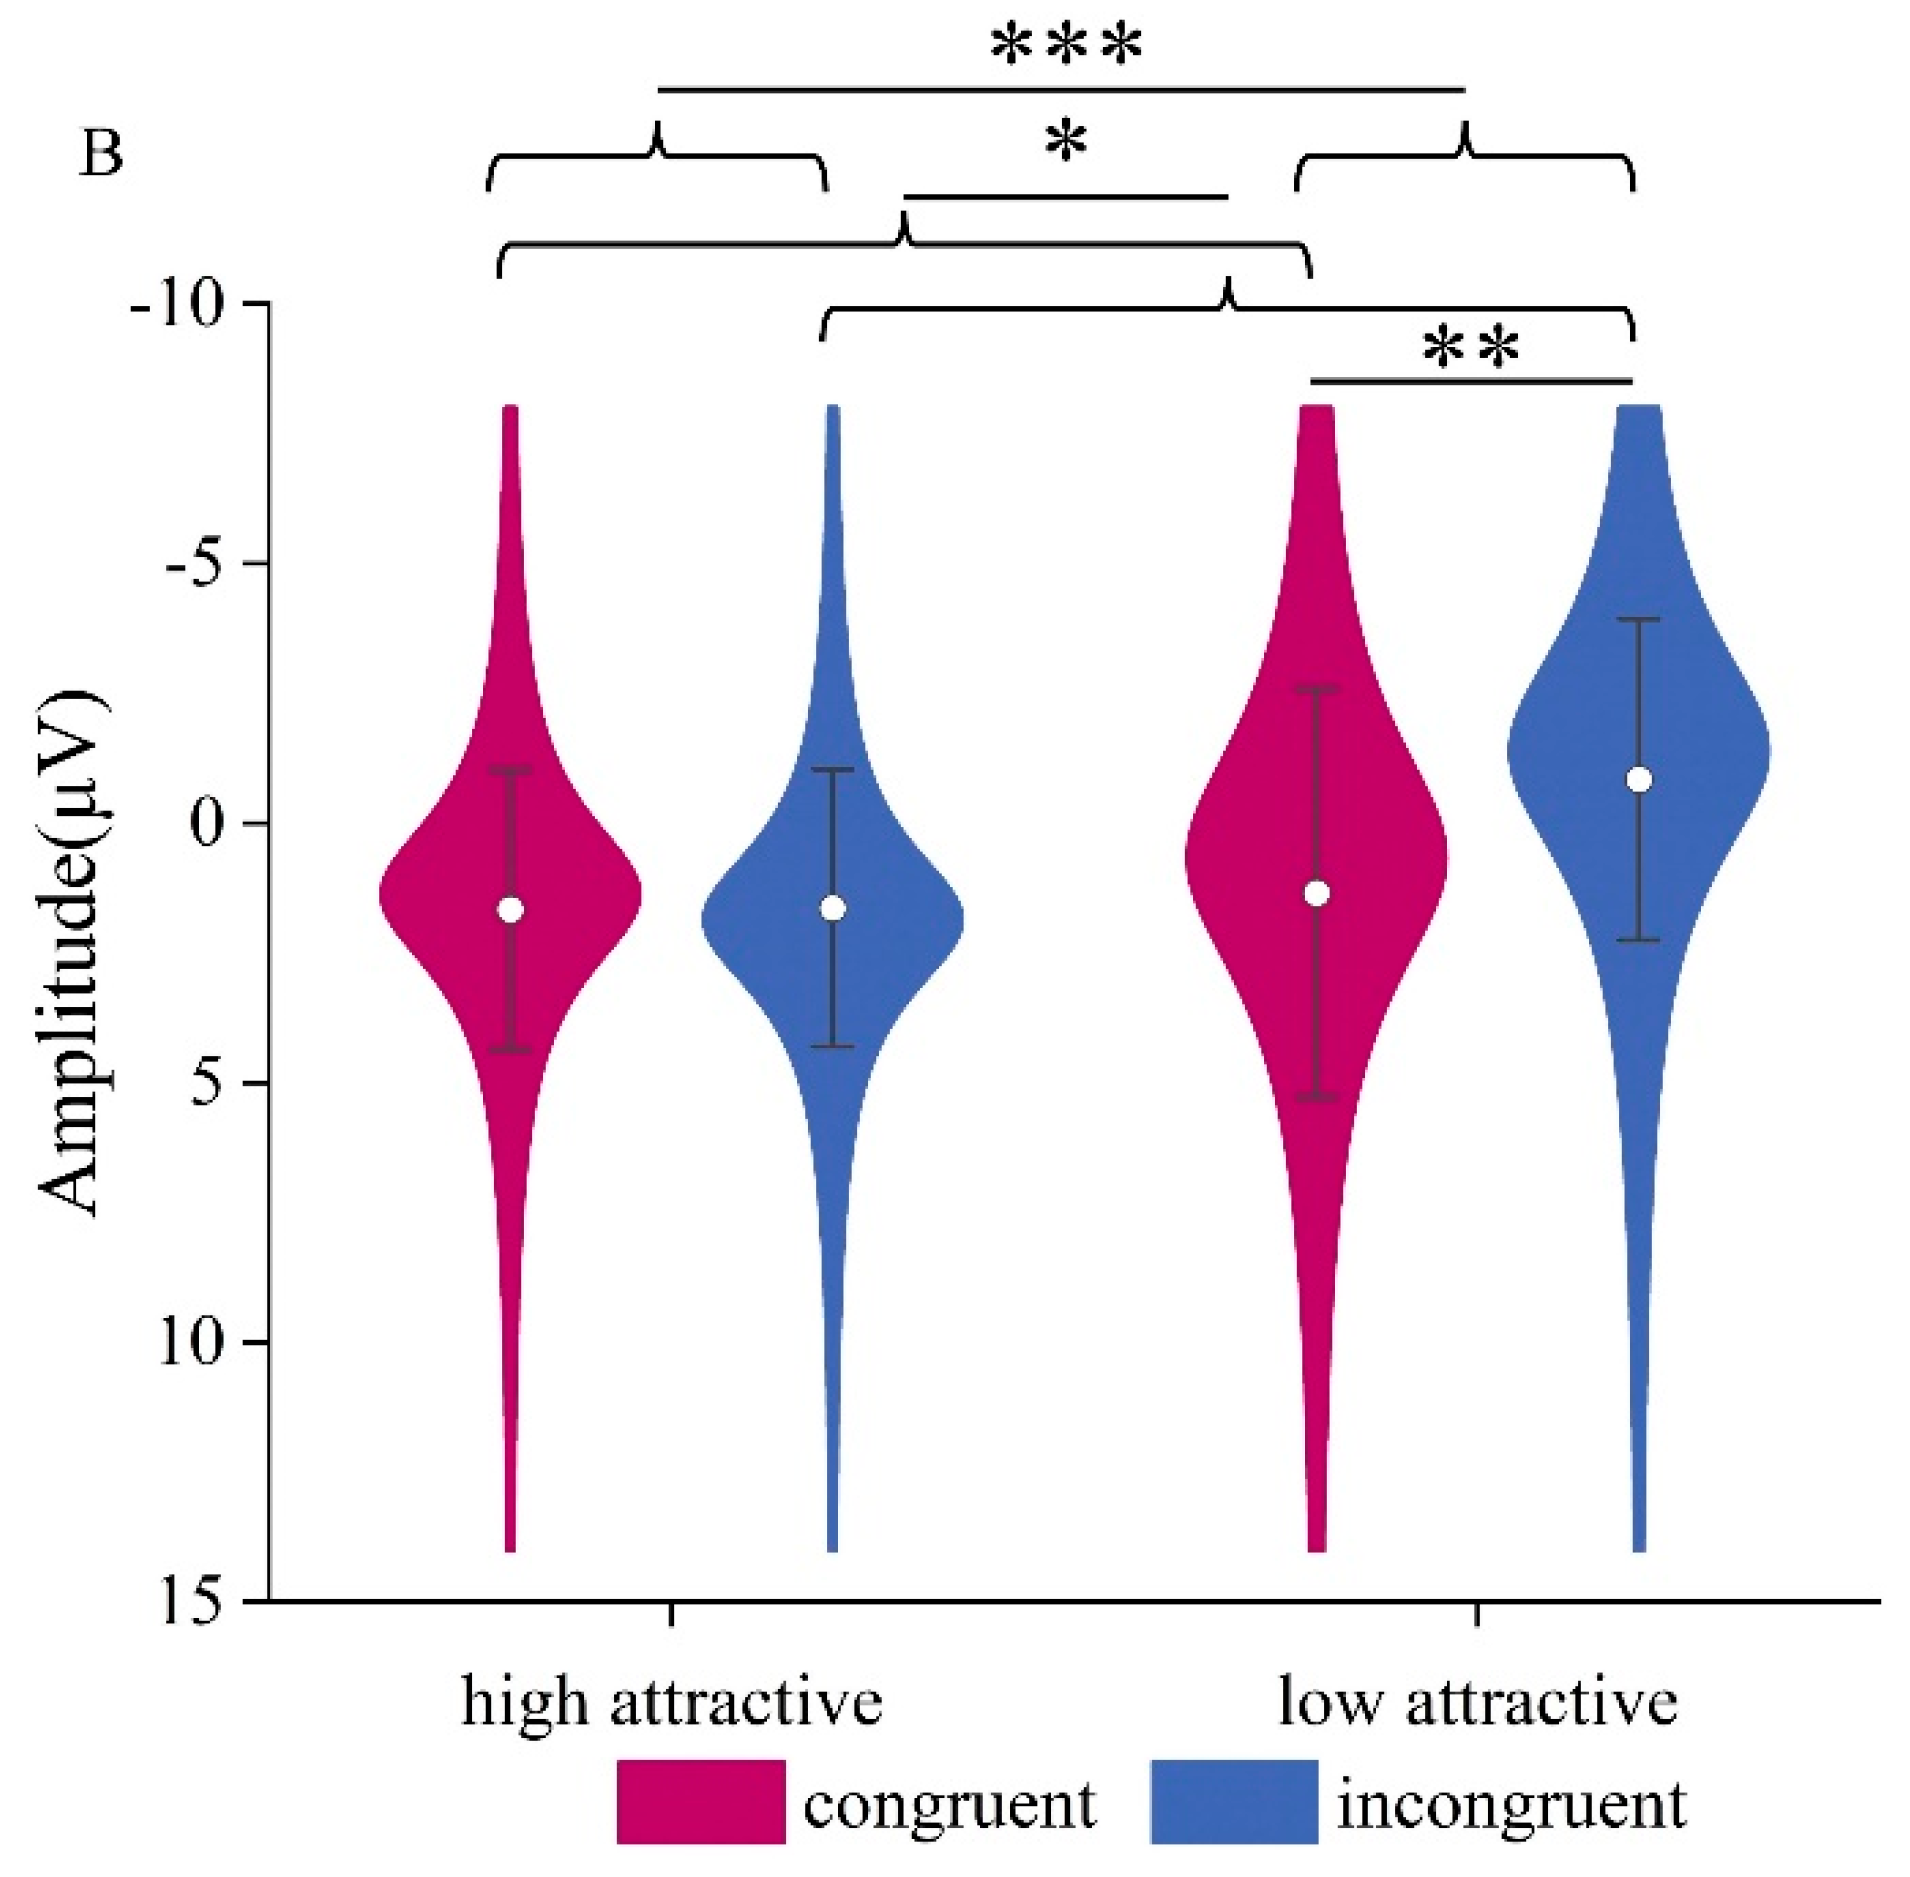
Figure 9.
(A) Grand mean ERP waveforms for the LPC ROI during vocal attractiveness classification, and the difference topography of the high attractive minus the low attractive voice condition in the 650-800 ms time window. (B) ERP amplitude of the LPC component under different conditions. *p<0.05.
Figure 9.
(A) Grand mean ERP waveforms for the LPC ROI during vocal attractiveness classification, and the difference topography of the high attractive minus the low attractive voice condition in the 650-800 ms time window. (B) ERP amplitude of the LPC component under different conditions. *p<0.05.
Disclaimer/Publisher’s Note: The statements, opinions and data contained in all publications are solely those of the individual author(s) and contributor(s) and not of MDPI and/or the editor(s). MDPI and/or the editor(s) disclaim responsibility for any injury to people or property resulting from any ideas, methods, instructions or products referred to in the content. |
© 2025 by the authors. Licensee MDPI, Basel, Switzerland. This article is an open access article distributed under the terms and conditions of the Creative Commons Attribution (CC BY) license (http://creativecommons.org/licenses/by/4.0/).
Copyright: This open access article is published under a Creative Commons CC BY 4.0 license, which permit the free download, distribution, and reuse, provided that the author and preprint are cited in any reuse.


