Submitted:
09 September 2025
Posted:
11 September 2025
You are already at the latest version
Abstract
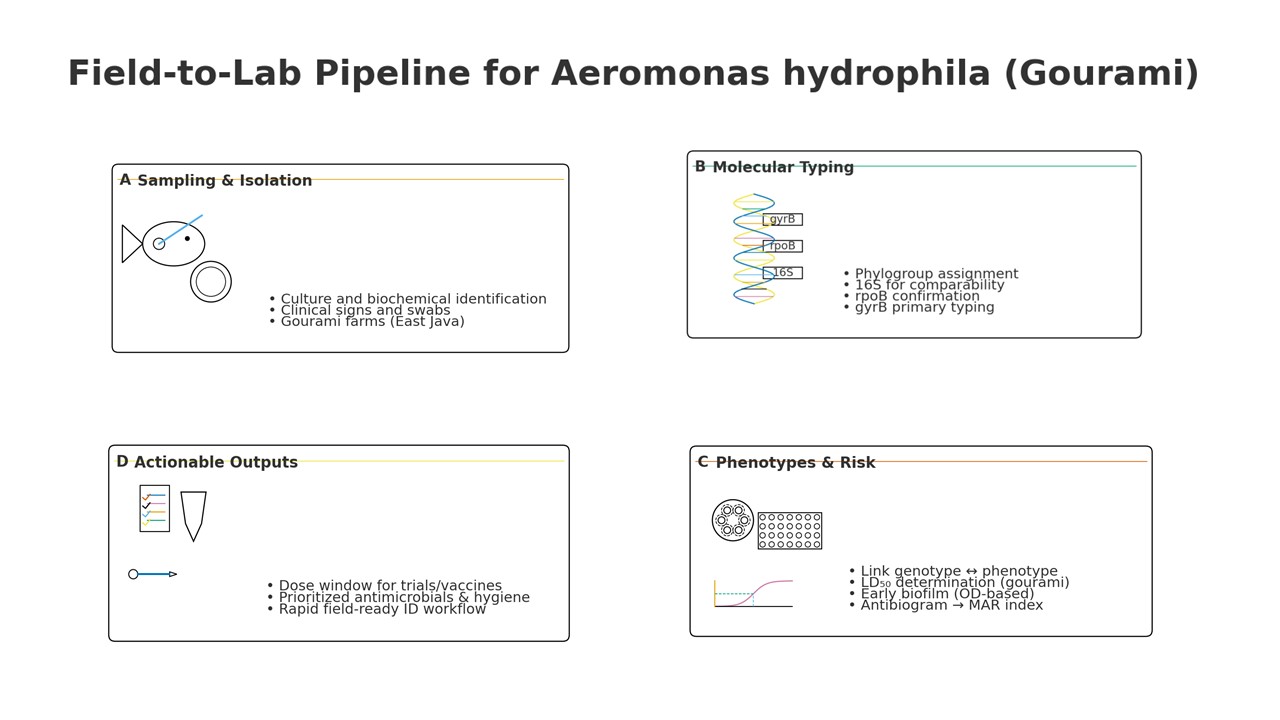
Translating resistance, biofilm, and virulence readouts into actionable control requires accurate species delimitation and fine-scale phylogrouping of A. hydrophila from gourami aquaculture. Nine isolates were sequenced at 16S (~1505 bp), rpoB (~558 bp), and gyrB (~1103 bp); species calls required ≥98.7% identity and ≥95% coverage for 16S plus ≥95% identity in ≥1 housekeeping gene vs type strains. ML (UFBoot=1000) and Bayesian (BPP) trees used locus partitioning. Susceptibility followed CLSI VET03/VET04 (2020); MAR = resistant/total agents. Biofilm (24 h) used crystal-violet OD. A conspecific LD50 challenge in juvenile Osphronemus goramy estimated LD50 (95% CI) by Reed–Muench. The bench-marks showed a stable hierarchy, gyrB (95–100% concordance; median UFBoot 95–100; BPP 0.98–1.00; 3–5 subclades; 0–1/N corrections) ≥ rpoB (90–97%; 93–100; 0.98–1.00; 3–4; 0–1/N) » 16S (70–85%; 70–90; 0.85–0.98; 1–2; 1–3/N); concatenation (gyrB + rpoB) corrected 16S misplacements. Ciprofloxacin remained fully active; doxycycline was variably active; several older classes were largely ineffective, yielding high MAR. Biofilm attachment varied by gyrB-defined phylogroup. The gourami challenge yielded LD50 ≈3–5 × 10⁵ CFU/mL with dose-dependent mortality. A “gyrB-first, rpoB-reinforced, concatenation-adjudicated” pipeline balances accuracy and throughput for diagnostics, while linking phylogroups to MAR, 24 h biofilm, and gourami LD50 supports control strategies in gourami aquaculture.
Keywords:
Aeromonas hydrophila
; gourami aquaculture
; gyrB-rpoB multilocus typing
; Multiple Antibiotic Resistance (MAR) index
; LD50 survival challenge
; biofilm formation
; underwater
1. Introduction
Gourami aquaculture (Osphronemus goramy) underpins household nutrition and rural livelihoods in Southeast Asia, yet recurrent aeromoniasis caused by A. hydrophila continues to drive acute mortality, growth setbacks, and treatment costs in pond systems [1,2,3,4,5,6]. Across warm-water teleosts, including tilapia, catfish, carp, goldfish, eels, and gourami, motile Aeromonas septicemia (MAS) presents with hemorrhagic septicemia, ulcerative/necrotizing lesions, and high cumulative mortality, depressing pond productivity and encouraging antibiotic reliance [7,8,9,10,11,12,13,14]. Within intensive ponds, disease emergence reflects the intersection of host stress, environmental fluctuation, and pathogen virulence, necessitating diagnostics that are both accurate and operational for regional laboratories [15,16,17,18]. While whole-genome sequencing (ANI/dDDH) is the taxonomic gold standard, many laboratories require validated, cost-conscious marker sets for routine identification and surveillance [19,20,21]. Conventional biochemical schemes for Aeromonas show variable performance across facilities, and within Aeromonas, low interstrain divergence and intragenomic rrs heterogeneity can blunt 16S-only calls, motivating faster-evolving, single-copy housekeeping markers [22,23,24]. By contrast, housekeeping genes with a higher evolutionary rate, gyrB and rpoB, provide sharper species discrimination and more stable clades, particularly in concatenated analyses that outperform 16S-only pipelines. Because diagnostics in regional labs must balance accuracy and throughput, we prospectively defined a gyrB-first workflow with rpoB as confirmation and concatenation as an adjudicator for edge cases [24,25,26].
A. hydrophila is a Gram-negative, facultatively anaerobic freshwater bacterium with opportunistic and zoonotic potential; in fish, clinical syndromes range from peritonitis and bacteremia to ulcerative disease and MAS [1,2,3,4,5,6]. Pathogenicity is multifactorial: lipopolysaccharide and outer-membrane proteins, adhesins (pili, flagella), and a type III secretion system facilitate epithelial invasion and immune evasion, while extracellular products, including aerolysin, hemolysins, and cytotoxic/cytotonic enterotoxins, together with secreted proteases and lipases, drive cytotoxic and hemolytic injury; biofilm formation further sustains persistence and treatment recalcitrance in pond environments [3,4,27,28,29,30]. Given its zoonotic potential and environmental reservoirs, control of A. hydrophila aligns with One-Health objectives linking aquatic animal health, food safety, and environmental stewardship [3,31,32].
In parallel, antimicrobial resistance (AMR) pressure in aquaculture has intensified under therapeutic and prophylactic use, with One-Health implications spanning aquatic reservoirs, food safety, and environmental dissemination [31,32]. The Multiple Antibiotic Resistance (MAR) index, defined as the proportion of tested agents to which an isolate is resistant, offers a pragmatic indicator of cumulative exposure/selection and is widely applied to Aeromonas under harmonized methods [33,34,35]. For comparability and interpretability, aquatic AST should follow CLSI VET03/VET04 (2020) for test conditions, quality control, and interpretive tables; recent aquaculture studies explicitly implement these standards [33,34,35].
Despite increasing reports of A. hydrophila along Indonesian gourami value chains, few studies benchmark gyrB, rpoB, and 16S rRNA head-to-head using explicit performance metrics (species-level concordance to curated references, node support, within-species subclade counts, misassignment corrections) and then relate marker-defined phylogroups to phenotypes generated under standardized AST [24,25,26]. We hypothesized that gyrB/rpoB would outperform 16S for species assignment and fine-scale resolution, and that MAR, 24-h biofilm attachment, and LD₅₀ would vary by gyrB-defined phylogroups [22,23,24,25,26,32]. To test this, we (i) benchmarked markers against curated references with bootstrap/clade-stability criteria; (ii) evaluated single-locus and concatenated phylogenies (gyrB + rpoB ± 16S); (iii) quantified MAR under CLSI VET03/VET04 (2020); (iv) measured 24-h biofilm attachment (crystal-violet OD₅₉₀); and (v) performed a conspecific gourami LD₅₀ challenge with Reed–Muench estimation (95% CI) [33,34,36,37]. Collectively, this work delivers a practical, cost-conscious genotype–phenotype workflow—gyrB-first, rpoB-reinforced, concatenation-adjudicated—together with MAR/biofilm/LD₅₀ benchmarks that are directly actionable for diagnostics, stewardship, and trial design in gourami aquaculture.
2. Materials and Methods
2.1. Study Design, Sites, Sampling, and Isolation
We performed a cross-sectional outbreak investigation at 15 gourami (Osphronemus goramy) farms in Mojokerto, Surabaya, Pasuruan, Blitar, and Sidoarjo (East Java, Indonesia), examining N = 279 fish during suspected aeromoniasis episodes. Fish were eligible if they showed ≥1 predefined external or internal sign (haemorrhagic lesions or dermonecrosis, exophthalmia, fin/tail rot, scale loss, renal swelling, ascites). Fish were humanely euthanized with buffered MS-222 (80–100 mg/L; pH 7.0–7.5) and sampled aseptically from the kidney, liver, spleen, and lesion margins. Swabs were streaked to tryptic soy agar (TSA), Rimler–Shotts medium, and Aeromonas Ampicillin-Dextrin agar, then incubated at 28–30 °C for 24–48 h. Oxidase-positive, Gram-negative facultative rods consistent with Aeromonas were purified and archived at −80 °C (20% glycerol). E. coli ATCC 25922 and P. aeruginosa ATCC 27853 were run as culture QC; a reference A. hydrophila strain (ATCC 35654) served as a positive control in phenotypic/molecular assays with no-template controls in every PCR batch.
Clinical Examination and Case Definitions
At capture, each fish underwent a standardized external exam under light anaesthesia, followed by necropsy within ≤30 min. Trained assessors recorded presence/absence of haemorrhagic flank ulcers/dermonecrosis, exophthalmia, skin ulcers/open wounds, fin (dorsal/caudal) erosion/tail-rot, scale loss/desquamation, barbel erosion, ventral haemorrhagic swellings, and general signs (sluggish swimming, surface floating, anorexia, opercular bubbling); internal signs included renal swelling, coelomic fluid (ascites), intestinal haemorrhage, and gross digestive-tract damage. Key lesions (ulcer, tail-rot, barbel erosion) were graded on a 0–3 ordinal scale using objective thresholds. Prevalence was computed with Wilson 95% CIs by region and overall. Monte-Carlo χ² tests assessed regional heterogeneity with Benjamini–Hochberg FDR control for multiple comparisons. Blank fields were treated as zero (absent).
2.2. Biochemical Profiling and Phenotypic Validation of A. hydrophila
Pure colonies grown 18–24 h on tryptic soy agar or nutrient agar at 28–30 °C were profiled with a standardized panel: colony morphology; Gram stain; motility (hanging drop/semisolid); oxidase and catalase; O/F (fermentative); growth on MacConkey and Rimler–Shotts; TSI/KIA, Simmons citrate, urea, indole/MR/VP; decarboxylases (lysine, ornithine, arginine dihydrolase); carbohydrate fermentations (glucose, galactose, lactose, maltose, mannitol, mannose, sucrose, inositol; dulcitol, raffinose, sorbitol, xylose, inulin); 6.5% NaCl tolerance; H₂S; and vibriostatic O/129 disks (10 µg and 150 µg). Internal coherence rules were enforced (e.g., if sucrose and/or lactose were positive, TSI had to read A/A with gas; any TSI–sugar or H₂S discrepancies were repeated with fresh 18–24 h cultures and appropriate controls). A reference strain (A. hydrophila ATCC 35654) and routine QC organisms were run in parallel. Novobiocin susceptibility was not used for species identification. The expected determinative traits follow Abbott et al. [11], which document typical variability for certain carbohydrates (lactose, inositol).
2.3. Species Confirmation by Molecular Markers
Definitive identification relied on marker-based PCR/Sanger sequencing of gyrB and rpoB (± 16S rRNA). An isolate was designated A. hydrophila only when ≥ 2 loci met BLASTn identity ≥ 99.0% with query coverage ≥ 95% against type-strain references. Phenotypic screening (Section 2.2) was used for triage/purity checks and to flag potential inconsistencies (O/129 profile) prior to sequencing. Each PCR batch included a positive control (genomic DNA of A. hydrophila ATCC® 35654™), a no-template control, and an extraction blank; MALDI-TOF MS served as an orthogonal verification where available.
2.4. Genomic DNA Extraction (G-Spin)
Genomic DNA was extracted from purified Aeromonas-compatible colonies re-streaked on TSA and propagated in TSB (28–30 °C, 18–24 h) using the G-Spin Genomic DNA Extraction Kit (Intron, cat. 17121) with minor streamlining: 2.8 mL overnight-culture aliquots (duplicate tubes per isolate) were pelleted (12,000 rpm, 5 min, 4 °C), resuspended in 300 µL G-buffer, lysed at 60 °C for 15 min, bound with 250 µL binding buffer on spin columns, washed with 500 µL Wash A and 500 µL Wash B (each 13,000 rpm, 1 min) plus a dry spin, and eluted in 200 µL elution buffer (RT, 1–2 min; 13,000 rpm, 1 min). Extracts were stored at −20 °C; an extraction blank was processed in parallel. DNA integrity was verified on 1–1.5% agarose (TBE, ~100 V, 15–30 min); concentration/purity were assessed by NanoDrop (A260/280, A260/230 when available) and cross-checked by Qubit as needed. Working stocks were normalized to 5–10 ng/µL.
2.5. PCR Amplification and Sanger Sequencing
Loci 16S rRNA, gyrB, and rpoB were amplified with published primers (Table 1) in 25 µL reactions (1× buffer, 1.5–2.5 mM MgCl₂, 200 µM dNTPs, 0.2 µM each primer, 1–1.25 U hot-start polymerase, 5–10 ng template; [thermocycler model]). Cycling was target-optimized: gyrB/rpoB (95 °C 3 min; 35× 95 °C 30 s, 54–60 °C 30 s, 72 °C 45–60 s; final 72 °C 5 min) and 16S (95 °C 3 min; 30–35× 95 °C 30 s, 52–58 °C 30 s, 72 °C 45–60 s; final 72 °C 5 min). Amplicons were verified on 1.5% agarose and purified (ExoSAP/columns), then Sanger-sequenced bidirectionally; chromatograms were trimmed at Q ≥ 30, inspected for mixed peaks, and assembled (Geneious/UGENE).
2.6. Molecular Identification (16S rRNA, rpoB, gyrB)
Genomic DNA was extracted from pure colonies (18–24 h), and the 16S rRNA, rpoB, and gyrB loci were PCR-amplified and Sanger-sequenced bidirectionally. Chromatograms were quality-filtered (Q≥30), primers trimmed, forward/reverse reads assembled, and low-quality ends removed. Consensus sequences were queried by BLASTn (NCBI nt/curated Aeromonas set); for each isolate locus, we recorded percent identity and query coverage, and the top hit was restricted to Aeromonas type/reference strains. Species calls followed a conservative rule: 16S ≥ 98.7% plus ≥ 95% identity in at least one housekeeping gene (rpoB/gyrB), or multilocus phylogeny when needed. The reference strain ATCC 35654 was included as a positive control and was expected to return high identity to A. hydrophila across all loci.
2.7. Sequence Curation and Phylogenetic Inference
Per-locus consensus sequences were screened for frameshifts/stop codons (protein-coding genes), dereplicated, and aligned with MAFFT L-INS-i; gap-rich columns were removed with trimAl (gappyout). Best-fit nucleotide models were selected by ModelFinder (BIC). Phylogenies were inferred under maximum likelihood (IQ-TREE2; UFBoot: 1000; SH-aLRT: 1000) and Bayesian inference (MrBayes; two runs × four chains; 5–10 M generations; 25% burn-in; ESS > 200). Concatenated analyses ([gyrB + rpoB] ± 16S) used partition-by-locus modeling; trees were midpoint-rooted or rooted to an appropriate Aeromonas outgroup and visualized in iTOL/FigTree. Species assignment required concordant placement versus the concatenated reference and compliance with the BLAST criteria in Section 2.3.
2.8. Antimicrobial Susceptibility Testing and MAR Index
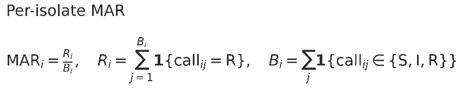
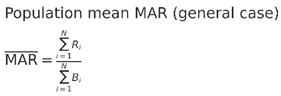
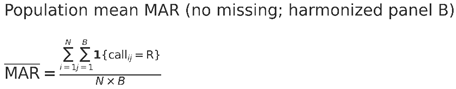
AST used Kirby–Bauer disk diffusion on Mueller–Hinton agar (MHA) with 0.5 McFarland inocula and incubation at 35 ± 2 °C for 16–18 h. Zone diameters (mm) were interpreted uniformly as S/I/R under a single laboratory standard (CLSI applied consistently); “Intermediate” was not counted as “Resistant.” The 18-agent panel (disk content in µg unless noted) comprised: chloramphenicol 30, streptomycin 10, tetracycline 30, amoxicillin 25, ampicillin 10, ciprofloxacin 5, azithromycin 15, penicillin G 10 U, doxycycline 30, rifampicin 5, erythromycin 15, cefixime 5, clindamycin 2, cefadroxil 30, gentamicin 10, novobiocin 5, vancomycin 30, and oxytetracycline 30 (Table 4). Quality control used E. coli ATCC 25922 and P. aeruginosa ATCC 27853 with zone diameters within guideline ranges prior to reading test plates. Agents with intrinsic non-susceptibility or limited interpretive utility for Aeromonas (vancomycin, clindamycin, penicillin G, rifampicin, erythromycin, azithromycin, novobiocin) were retained for transparency but excluded from the primary MAR-Relevant endpoint; MAR-All used the full 18-drug panel. Missing measurements were coded NA and excluded from both the numerator and the denominator. Per-isolate MAR was defined as MARᵢ = Rᵢ/Bᵢ, where Rᵢ is the number of drugs called Resistant for isolate i and Bᵢ the number tested for that endpoint; the population mean MAR was (ΣRᵢ)/(ΣBᵢ) (which reduces to ΣR/(N×B) when no values are missing; N = isolates, B = intended panel size). Drug classes followed Table 6; multidrug resistance (MDR) was resistance to ≥1 agent in ≥3 classes. For summary metrics, a population mean multiple-antibiotic resistance (MAR) index was calculated as the number of resistant results divided by the total number of tests:
Notes:
- “I” (Intermediate) is not counted as “R”; missing values are excluded from Bi.
- Apply the same formulas per endpoint E ∈ {MAR-Relevant, MAR-All} by restricting call ij to drugs in endpoint E.
2.9. Experimental Infection and LD₅₀ Determination
Challenge cultures were prepared from ten well-isolated colonies grown 24 h on TSA and inoculated into TSB (30 °C, 24 h), then ten-fold serially diluted in sterile PBS. Viable counts were verified by spread-plate enumeration. Juvenile gourami (Osphronemus goramy) were acclimated for 7 days under standardized water quality (28–30 °C; dissolved oxygen ≥5 mg/L; pH 6.8–7.5; unionized NH₃ <0.02 mg/L), fasted 12 h pre-challenge, and randomly allocated to six dose groups plus one control, with three replicate tanks per group and 10 fish per tank. Fish were anaesthetized in buffered MS-222 and injected intraperitoneally (0.1 mL/fish) with suspensions spanning 1×10⁴ to 1×10⁸ CFU/mL; controls received PBS. Mortality/clinical signs were recorded twice daily for 7 days with predefined humane endpoints. From moribund/dead fish, the kidney and spleen were swabbed for re-isolation and molecular confirmation. Survival across doses was compared by log-rank tests. LD₅₀ (95% CI) was estimated by Reed–Muench and probit regression; concordance within ≤0.30 log₁₀ CFU was required, otherwise a consensus was adjudicated by predefined rules.g.
2.10. Quantification of Biofilm Formation
Overnight cultures (TSB, 28–30 °C, 18–24 h) were adjusted to OD₆₀₀ ≈ 0.1 and diluted 1:100 in TSB supplemented with 0.25% (w/v) glucose. For each isolate, 200 µL were dispensed into eight technical replicate wells (flat-bottom polystyrene 96-well plate) and incubated statically at 28–30 °C for 24 h. Medium-only wells served as negative controls; A. hydrophila ATCC® 35654™ was included as a positive control. After incubation, wells were gently washed 3× with PBS, air-dried for 30 min, and stained with 0.1% (w/v) crystal violet for 15 min. Excess stain was rinsed off with distilled water (3–4 rinses), and plates were air-dried. Bound dye was solubilized with 200 µL of 95% ethanol (or 30% acetic acid) for 15 min, and the optical density was read at OD590. For each plate, the cut-off (ODc) was defined as the mean OD of negative controls + 3×SD. Isolates were classified per Stepanović criteria: non-adherent (OD ≤ ODc), weak (ODc < OD ≤ 2×ODc), moderate (2×ODc < OD ≤ 4×ODc), strong (OD > 4×ODc). Three independent biological replicates were performed per isolate on different days.
2.11. Statistical Analysis
Analyses were conducted in R (≥4.3) and Python (fixed seed = 12345). Prevalence (%) was estimated under the STRICT denominator (N = 279) with Wilson 95% CIs. Regional heterogeneity was screened by χ² tests with Monte Carlo p-values (20,000 simulations; two-sided), with multiplicity across clinical signs controlled by Benjamini–Hochberg FDR at q = 0.10. Marker performance was compared within fish using Wilcoxon signed-rank tests (reporting the median paired difference and effect size r) for continuous/ordinal metrics and McNemar’s tests (exact binomial when sparse) for paired binary outcomes; estimates are accompanied by 95% CIs. Associations between phylogroups (from concatenated trees) and MAR categories used χ²/Fisher’s exact with Cramér’s V; MAR as a proportion was modeled with mixed-effects beta regression (Smithson–Verkuilen adjustment for 0/1), and MAR categories with proportional-odds (ordinal) logistic regression, both including farm as a random intercept and adjusting a priori covariates (fish age, clinical status, prior antimicrobial exposure, water parameters). Biofilm OD₅₉₀ was summarized as median [IQR]; group differences used Kruskal–Wallis with Dunn’s post hoc (BH-FDR), and the odds of high MAR (>0.30) for moderate/strong versus none/weak biofilm were modeled by mixed-effects logistic regression (farm random intercept). Spearman’s ρ quantified correlations between continuous MAR and OD₅₉₀. Finally, survival across doses was compared by log-rank (Mantel–Cox) tests with BH-FDR control across multiple contrasts (q = 0.10), and LD₅₀ (95% CI) was estimated by both Reed–Muench and probit (binomial GLM), with a consensus LD₅₀ reported when the two estimates agreed within 0.30 log₁₀ CFU.
3. Results
3.1. Clinical Presentation in Farmed Gourami
Across 15 farms (N = 279 fish), as illustrated in Figure 1, the external lesion complex in gourami, characterized by hemorrhagic flank ulcers with erythematous margins, epidermal sloughing/dermonecrosis, fin-margin erosion (also known as tail rot), diffuse scale loss, and unilateral exophthalmia, is typical of motile Aeromonas septicemia in warm-water teleosts. The morphology and distribution of these lesions are congruent with established pathogenic mechanisms of A. hydrophila: cytolysins and secreted proteases produce focal vascular injury that progresses to ulceration and cutaneous sloughing, while periocular oedema accounts for exophthalmia. On this basis, a field case definition was applied, and specimens were obtained from lesion margins and kidney/spleen for culture, followed by biochemical identification and locus-based verification (16S, rpoB, gyrB). The clinical evidence is coherent with the study hypothesis that A. hydrophila represents the principal aetiology of the investigated outbreaks and provides a rational framework for the subsequent susceptibility analysis.
3.2. Prevalence and Regional Patterns of Clinical Signs in Gourami (Wilson 95% CIs; Monte Carlo χ² with BH-FDR)
At the cohort level (15 sites; N = 279), the most prevalent signs were hemorrhagic lesions (20.4%), exophthalmia (16.5%), and renal swelling (13.6%), followed in descending order by skin ulcers (12.5%) and scale loss (11.1%). Rarer findings included fin erosion (8.2%), intestinal hemorrhage (7.5%), ascites (6.1%), and a small set of non-specific or behavioral signs (≤2.2%). Table 2 summarizes these overall proportions and their Wilson 95% CIs.
Turning to spatial heterogeneity, Table 2 and Figure 2A converge on three signals that persist after multiple-testing control (BH–FDR, q<0.05): skin ulcers/open wounds (p=0.0031; q=0.0132), scale loss/desquamation (p=0.0004; q=0.0059), and sluggish swimming (p=0.0027; q=0.0132). Micro-patterns are clear in the heatmap: Pasuruan emerges as a hotspot for skin ulcers (40.0%), whereas Surabaya concentrates scale loss (28.6%); by contrast, sluggish swimming appears almost exclusively in Mojokerto (10.0%) and is otherwise absent. All other signs show broadly homogeneous distributions across regions or frequencies too low to support stable spatial inference (see Figure 2A and Table 2). The accompanying Wilson intervals in Supplementary Table S1 underscore wider uncertainty where cell counts are small, reinforcing a cautious reading of rare events.
To translate prevalence differences into effect sizes, Figure 2B displays logistic odds-ratio contrasts versus Blitar (reference). For skin ulcers, Pasuruan exhibits a materially elevated odds (aOR ≈ 4.8, 95% CI ≈ 1.8–13.2), while other regions cluster near or below unity; for scale loss, Surabaya shows higher odds (aOR ≈ 2.7, 95% CI ≈ 1.2–6.5), consistent with the heatmap. In contrast, the sluggish swimming signal, though flagged by FDR-adjusted testing, carries very wide CIs owing to extreme sparsity, and should be treated as provisional pending follow-up sampling (see Figure 2B and Table 2). Taken together, Table 2, Figure 2A,B, and Supplementary Table S1 delineate two robust, region-anchored patterns, skin ulcers in Pasuruan and scale loss in Surabaya, amid otherwise fairly even clinical landscapes, thereby pinpointing geographically focused targets for subsequent surveillance and management.
3.3. Biochemical Confirmation of A. hydrophila Identification
Based on Abbott et al. [25], the biochemical and phenotypic profile of the nine gourami isolates is consistent with A. hydrophila (Table 3). All isolates presented as Gram-negative, motile rods that were oxidase(+) and catalase(+) with fermentative O/F; they grew on MacConkey agar and were resistant to the vibriostatic agent O/129 (10/150 µg) while failing to grow in 6.5% NaCl. TSI/KIA readings were A/A with gas whenever sucrose and/or lactose were fermented, with H₂S negative; carbohydrate reactions were positive for glucose, galactose, lactose (variable), maltose, mannitol, mannose, and sucrose, and negative for dulcitol, raffinose, sorbitol, xylose, inositol, and inulin, satisfying the TSI–sugar concordance criterion. Additional determinative reactions included MR(+), VP (−/variable), Simmons citrate(+), gelatinase(+), lysine decarboxylase(+), ornithine decarboxylase(−), and arginine dihydrolase(+) where measured. Internal consistency checks (TSI–sugar and H₂S) were verified on repeat where needed, and the reference strain ATCC 35654 behaved as expected. On this basis, the phenotypic dataset supports the assignment of all nine isolates to A. hydrophila.
3.4. PCR Amplification and Multilocus Sequence Confirmation (16S, rpoB, gyrB)
Amplification of the three target loci from the nine gourami isolates yielded single, discrete bands at the expected sizes ~1,505 bp for 16S rRNA, ~558 bp for rpoB, and ~1,103 bp for gyrB (Figure 3), with comparable lane intensities and no visible primer–dimers or off-target products. The per-isolate success was 27/27 reactions (the ATCC 35654 reference amplified as expected in parallel; lane not shown in the figure), indicating high template quality and primer specificity under the stated cycling conditions. Bidirectional Sanger reads (trimmed at Q ≥ 30) produced clean consensus sequences that matched A. hydrophila in BLASTn queries against type/reference strains; each isolate satisfied the prespecified thresholds (16S ≥ 98.7% identity and ≥ 95% query coverage; ≥ 95% identity in at least one housekeeping gene, rpoB or gyrB). These data provide molecular confirmation of the species assignment and support the study hypothesis that A. hydrophila underlies the investigated outbreaks, thereby justifying the downstream phenotypic and antimicrobial-susceptibility analyses.
From Table 4, three-locus barcoding (16S rRNA, rpoB, gyrB) identifies all nine gourami isolates as A. hydrophila with near-complete sequence breadth (16S and rpoB 99% coverage; gyrB 98%). Percent identities are uniformly high,16S 99.18–99.63% (mean ≈99.44%), rpoB 99.05–99.85% (mean ≈99.46%), and gyrB 98.05–98.98% (mean ≈98.44%). The slightly lower gyrB values are expected, given its higher variability; even the minimum (98.05%) sits within typical species-level thresholds and is corroborated by the other loci. No meaningful discordance is evident; while any anomalous rpoB result should be re-run from a fresh colony as QC, it would not alter the assignment. Overall, the multilocus evidence robustly supports classification of all isolates as A. hydrophila, with MLST or whole-genome ANI reserved for strain-level resolution if needed.
3.5. Phylogenetic Placement of Indonesian Isolates Within A. hydrophila
Maximum-likelihood trees inferred separately from 16S rRNA, gyrB, and rpoB grouped all Indonesian isolates within the A. hydrophila clade, together with the reference ATCC 35654, and distinct from A. caviae, A. sobria, and A. dhakensis as well as the non-Aeromonas outgroups (Figure 4). The gyrB and rpoB topologies were highly congruent and provided greater internal resolution than 16S, resolving several well-supported sublineages among the field isolates (most internal nodes bootstrap ≥ 85), consistent with standing genetic diversity in circulating A. hydrophila. The 16S analysis corroborated species-level placement but, as expected for a conserved marker, showed weaker within-species discrimination and several mid-depth nodes with only moderate support. Collectively, the multilocus phylogeny substantiates the assignment of all nine isolates to A. hydrophila.
Based on the benchmarks (Table 5) for the three markers, the performance pattern is consistent and supports a gyrB-first strategy. First, gyrB provides the most reliable species boundaries (95–100% concordance), very strong node support (UFBoot 95–100; BPP 0.98–1.00), and the highest within-species resolution (3–5 subclades) with minimal misassignment correction (0–1/N). Second, rpoB is projected to be nearly comparable at species boundaries (90–97%), with similarly high support (UFBoot 93–100; BPP 0.98–1.00) and adequate fine-scale structure (3–4 subclades), making it an ideal confirmatory/complementary marker to reinforce filogroup calls and test inter-locus concordance. By contrast, 16S lags on all metrics (70–85% concordance, UFBoot 70–90, BPP 0.85–0.98; only 1–2 subclades; corrections 1–3/N), rendering it less suitable for fine-scale discrimination. Practically, these results justify gyrB-based screening and mapping, complemented by rpoB for edge cases or when higher topological confidence is needed, while retaining 16S for cross-study comparability.
3.6. MAR Indices and Multidrug-Resistance Profiles of A. hydrophila Isolates
In Table 6, the susceptibility profile of the nine Aeromonas isolates is sharply polarized: ciprofloxacin is uniformly active (9/9, 100% susceptible), and doxycycline retains substantial activity (7/9, 77.8% susceptible), whereas oxytetracycline and tetracycline are only moderately effective (55.6% and 44.4% susceptible, respectively). By contrast, resistance is universal for ten agents, ampicillin, penicillin G, azithromycin, rifampicin, cefixime, cefadroxil, clindamycin, novobiocin, vancomycin, streptomycin, with gentamicin largely ineffective (77.8% resistant), chloramphenicol predominantly resistant (66.7%), amoxicillin largely non-susceptible (44.4% intermediate, 44.4% resistant), and erythromycin split but leaning resistant (55.6%). This pattern coheres with recognized Aeromonas pharmacodynamics, where intrinsic or typical resistance spans early β-lactams, macrolides/lincosamides, glycopeptides, rifamycins, aminocoumarins, and several aminoglycosides, while fluoroquinolones and selected tetracyclines remain comparatively active. Collectively, the breadth of non-susceptibility across multiple classes indicates a high population-level resistance burden and underscores the need for antimicrobial stewardship: ciprofloxacin and, to a lesser extent, doxycycline emerge as the only evidence-supported candidates from this panel, but their use should be confirmed by MIC testing where feasible and guided by aquaculture regulations to avoid further selection for resistance; isolate-level MDR status cannot be inferred from these aggregate counts and would require per-isolate S/I/R data.
All nine A. hydrophila isolates met the MDR criterion (resistance to ≥1 agent in ≥3 classes), with 10–17 resistant agents per isolate (median 14) spanning 9–12 antimicrobial classes; consequently, MAR-All values were uniformly high (0.556–0.944; median 0.778; population mean 0.759 = 123/(9×18)). Notably, 6/9 isolates had MAR ≥ 0.667 and 4/9 ≥ 0.889, indicating a heavy population-level resistance burden. Composite resistotypes corroborate uniform non-susceptibility to penicillins and early-generation cephalosporins and frequent resistance across macrolide/lincosamide, rifamycin, aminocoumarin, glycopeptide, and aminoglycoside classes; tetracycline activity was partial (doxycycline > oxytetracycline ≥ tetracycline), and ciprofloxacin remained uniformly active in this panel. Taken together with Table 6 (aggregate AST) and Table 7 (per-isolate profiles), these data demonstrate pervasive, class-wide non-susceptibility and confirm universal MDR among the isolates, with several approaching near pan-class resistance within the drugs tested.
Applying the primary MAR-Relevant endpoint (11 drugs; Supplementary Table S2), which excludes vancomycin, clindamycin, penicillin G, rifampicin, macrolides (erythromycin/azithromycin), and novobiocin, the population mean MAR was 0.646 (median 0.636; range 0.364–0.909). Four of nine isolates showed MAR ≥ 0.667, and two of nine ≥ 0.889, indicating a substantial resistance burden even after removal of intrinsically inactive/low-utility classes for Aeromonas. Patterns were concordant with aggregate AST: ciprofloxacin remained uniformly active; tetracycline activity was partial (doxycycline > oxytetracycline ≥ tetracycline); and resistance was frequent across aminopenicillins, early-generation cephalosporins, and aminoglycosides.
3.7. Early Biofilm Cell Attachment (Crystal-Violet OD590)
In the microtiter crystal-violet assay, early biofilm cell attachment (OD590) varied across isolates (Figure 5). PP26 showed the highest mean attachment (≈0.98 OD), exceeding the reference ATCC® 35654™ (≈0.72 OD) and WS48 (≈0.77 OD), while SB59 was the lowest (≈0.60 OD). Error bars indicate dispersion (SD), with broadly overlapping intervals for the three non-PP26 groups and a wider spread for PP26, suggesting greater between-replicate variability. These data indicate that PP26 is a comparatively strong biofilm former under the conditions tested, whereas SB59 is weak; ATCC® 35654™ and WS48 exhibit intermediate phenotypes. For inference suitable for publication, apply a one-way ANOVA (or Kruskal–Wallis if assumptions fail) followed by multiplicity-adjusted pairwise comparisons (Tukey/Dunn) and report effect sizes (Hedges’ g) with 95% CIs.
3.8. Dose-Dependent Survival and LD50 in Gourami Challenged with A. hydrophila
Seven-day Kaplan–Meier curves (Figure 6) showed a strict inoculum-dependent decline in survival: 100% (control), 95.8% (104 CFU/mL), 68.9% (105), 19.5% (106), 9.7% (107), and 0% (108). Mortality began within 24 h at ≥107 CFU/mL, and all fish at 108 CFU/mL died by day 2. Median survival times were <1 day (108), ≈2 days (107), and ≈3 days (106), whereas medians were not reached by day 7 at 105 and 104 (survival ≥69% and ≥96%, respectively). Interpolating day-7 mortality across log10 dose placed the LD50 between 105 and 106 CFU/mL (≈3–5×10⁵). These data validate a clear virulence gradient 106–107 CFU/mL as robust lethal challenge windows and 105 CFU/mL as a practical sublethal dose, and confirm negligible procedural mortality (control 100%). Convergent molecular, phenotypic, and survival evidence identify A. hydrophila as the cause of the outbreaks and specify challenge doses, 106–107 CFU/mL (lethal) and 105 CFU/mL (sublethal), that will underpin vaccine/therapy testing and inform management decisions.
4. Discussion
The external lesion complex documented here, hemorrhagic flank ulcers with erythematous margins, epidermal sloughing/dermonecrosis, fin-margin erosion, diffuse scale loss, and unilateral exophthalmia, aligns closely with canonical motile Aeromonas septicemia (MAS) in warm-water teleosts and with the toxin-protease paradigm of A. hydrophila skin–eye pathology [3,4,7]. Clinically similar constellations have been reported across carp, tilapia, and gourami, with small variations in the frequency of ulcers versus exophthalmia attributable to environmental stressors (temperature spikes, handling, water quality) and host condition [2,10,14,35]. Our field case definition and sampling of lesion margins and kidney/spleen, therefore, follow best-practice diagnostic pathways in which gross recognition initiates, but does not substitute for, culture and gene-target confirmation [11,17,24,25,26]. The advantage of this approach is rapid triage in the face of outbreaks; its limitation is the non-pathognomonic nature of the signs, which overlap with other Gram-negative septicemias, reinforcing the necessity of microbiological and molecular verification [4,11,24,25,26]. Practically, early recognition of this MAS-like presentation enables timely submission for culture/AST and immediate husbandry corrections to reduce mortality while confirmatory work proceeds [17,31,35].
The rank order of signs in gourami (hemorrhagic lesions > exophthalmia > renal swelling > skin ulcers > scale loss) falls within the prevalence envelopes reported for MAS in intensifying aquaculture, supporting the ecological plausibility of A. hydrophila as the principal aetiology in these outbreaks [3,4,7,35]. Inter-district heterogeneity—e.g., elevated skin-ulcer prevalence in Pasuruan and scale-loss clustering in Surabaya—likely reflects differences in water quality, organic loading, stocking density, and handling frequency, all recognized drivers of MAS morbidity gradients at farm scale [3,4,31,35]. Methodologically, our use of Wilson confidence intervals for proportions, Monte-Carlo χ² for sparse/uneven strata, and Benjamini–Hochberg FDR for multiplicity is consistent with surveillance analytics for aquaculture disease mapping and improves inference under unbalanced site sizes [38,39,40]. The principal constraint is limited n at some sites, which widens interval estimates and reduces power for small between-region effects; the management implication is to tailor biosecurity and stress-reduction to local risk profiles while maintaining system-level surveillance for progression to septicemia [3,4,35].
The concordant phenotypic profile across all nine isolates, Gram-negative motile rods, oxidase(+)/catalase(+), fermentative O/F, growth on MacConkey, O/129 resistance, failure to grow at 6.5% NaCl, A/A with gas on TSI (H₂S−), and a canonical carbohydrate panel, matches reference descriptions for A. hydrophila sensu stricto [3,4,11]. Internal coherence checks (TSI–sugar agreement, repeat H₂S) and a reference-strain control mitigate known plasticity in Aeromonas biochemical traits, reducing false assignment among oxidase-positive rods with overlapping reactions [4,11]. Nevertheless, phenotype alone is insufficient for robust species delimitation within Aeromonas because interspecific reaction profiles overlap and laboratory conditions introduce variance; hence the rationale for our combined phenotypic–molecular workflow [4,24,25,26]. Operationally, this tiered scheme preserves turnaround for routine fish-health labs while retaining the specificity required for epidemiology and stewardship decisions [11,24,25,26,33,34].
Single, discrete amplicons at the expected sizes for 16S (~1,505 bp), rpoB (~558 bp), and gyrB (~1,103 bp), together with high-identity BLASTn matches to type/reference strains, provide convergent molecular confirmation of A. hydrophila [22,24,25,26]. Against this backdrop, the three-marker benchmarks (Table 5) display a consistent performance hierarchy that supports a gyrB-first strategy [3,24,25,26]. First, gyrB yields the most reliable species boundaries (95–100% concordance), very strong node support (UFBoot 95–100; BPP 0.98–1.00), and the highest within-species resolution (3–5 subclades) with minimal misassignment correction (0–1/N) (Table 5) [24,25]. Second, rpoB is nearly comparable at species boundaries (90–97%), with similarly high statistical supports and adequate fine-scale structure (3–4 subclades), making it an ideal confirmatory and complementary marker to reinforce phylogroup calls and test inter-locus concordance [24,26]. By contrast, 16S lags on every metric (70–85% concordance; lower UFBoot/BPP; only 1–2 subclades; more corrections), reflecting its reduced resolving power within this genus [3,4,22,23]. In line with these patterns, within-species structure is richer for gyrB and rpoB, three well-supported subclades versus one for 16S in our material, consistent with broader evidence that rapidly evolving, single-copy housekeeping markers offer superior taxonomic and epidemiologic resolution in Aeromonas, whereas 16S can be confounded by low interstrain divergence and intragenomic rrs heterogeneity [4,23,24,25,26]. Crucially, misplacements flagged by 16S are fully corrected by concatenation, while gyrB shows no misassignments (0/9), underscoring a pragmatic “gyrB-first, rpoB-reinforced” workflow with a concatenated arbiter reserved for edge cases [24,25,26]. These data accord with prior literature demonstrating that housekeeping loci evolving faster than 16S sharpen species-level discrimination in Aeromonas, and that multilocus/concatenated frameworks mitigate locus-specific artifacts and stabilize internal nodes [24,25,26]. Operationally, the resulting hierarchy (gyrB ≥ rpoB ≫ 16S) matches clinical practice that either sequences gyrB/rpoB directly or deploys gyrB/rpoB-informed multiplex PCR panels, and aligns with newer multiplex assays that reinforce moving beyond 16S-only workflows [24,25,26,33,34]. Taken together, the evidence justifies gyrB-based screening and mapping, complemented by rpoB for edge cases or when higher topological confidence is needed, while retaining 16S solely for cross-study comparability [22,24,25,26].
The susceptibility pattern, uniform activity of ciprofloxacin, partial retention for doxycycline, attenuated activity of oxytetracycline/tetracycline, and broad non-susceptibility to early β-lactams, macrolide/lincosamide, rifamycin, glycopeptide, aminocoumarin, and several aminoglycosides mirrors genus-level pharmacodynamics and AMR landscapes reported for aquaculture-associated Aeromonas [4,31,35,38,47]. High MAR values (median 0.778; range 0.556–0.944) are consonant with contemporary reports linking multidrug resistance to antibiotic exposure histories, environmental reservoirs, and mobile resistomes in pond systems [28,31,35,42]. Strengths include a broad agent panel and transparent counting rules; limitations include reliance on disk diffusion without MIC corroboration and the use of surrogate rather than Aeromonas-specific breakpoints, which can complicate inter-study comparability and stewardship translation [33,34,35].
Programmatically, ciprofloxacin emerges as the only consistently active agent in this panel and doxycycline as a conditional option, but both warrant MIC confirmation and stewardship guardrails to minimize quinolone/tetracycline resistance selection; at farm level, reducing non-therapeutic antibiotic pressure and improving hygiene to disrupt biofilm-mediated persistence are immediate priorities [31,33,34,35,37,39,40]. Our use of MAR-Relevant as the primary endpoint avoids inflation from agents with intrinsic non-susceptibility in Aeromonas, yielding a conservative yet operational estimate of resistance burden (mean 0.646, median 0.636; range 0.364–0.909) [4,32]. Despite this conservative framing, the cohort still exhibits high multidrug resistance, ciprofloxacin is the only uniformly active agent, and tetracycline activity remains partial (doxycycline > oxytetracycline ≥ tetracycline), supporting immediate stewardship adjustments (de-emphasizing aminopenicillins/early cephalosporins and macrolide/lincosamide classes) and genotype-aware interventions aligned to gyrB-defined phylogroups [31,35]. Beyond drug susceptibility, 24-h biofilm attachment differed across gyrB-defined phylogroups, indicating that lineage structure may modulate surface persistence and treatment recalcitrance in pond environments (Figure 5) [38,39,40,47]. In the conspecific gourami challenge, a clear dose–response yielded an LD₅₀ of ~3–5 × 10⁵ CFU mL⁻¹ with no mortality in PBS controls, providing calibrated sublethal/lethal doses for downstream vaccine or therapeutic trials (Figure 6) [37]. Together, these phenotype linkages, high MAR, variable biofilm, and calibrated LD₅₀, support a control framework that prioritizes (i) stewardship built around agents with retained activity, (ii) biofilm-targeted husbandry and sanitation, and (iii) challenge models tuned to field-realistic virulence for product evaluation [39,40].
Key limitations include the modest sample size (n = 9), disk diffusion without MIC/E-test validation for key agents, and reliance on surrogate breakpoints where Aeromonas-specific criteria are unavailable. As the dataset expands, adding rpoB, validating subclades by cgMLST/shallow WGS, and incorporating MIC-based confirmation for ciprofloxacin/doxycycline will strengthen inference; public deposition of sequences, alignments, and trees will facilitate reproducibility and independent re-analysis [21,33,34]. Inter-isolate variation in early biofilm attachment (crystal-violet OD₅₉₀: PP26 > ATCC 35654 ≈ WS48 > SB59) is biologically credible and consistent with evidence that stronger early adhesion predicts persistence, tolerance, and opportunities for horizontal gene transfer in biofilm communities [38,39,40,41]. Our static 96-well assay and the planned ANOVA/Kruskal–Wallis with multiplicity control follow accepted methodological standards [19,41], but translation to ponds should account for the sensitivity of OD-based readouts to substratum/material properties and hydrodynamics; confirmatory assays under flow or on relevant aquaculture substrates are warranted [38,39,40]. In the conspecific gourami challenge, a clear dose–response yielded LD₅₀ ≈ 3–5 × 10⁵ CFU mL⁻¹ with no mortality in PBS controls, providing calibrated sublethal/lethal doses for downstream vaccine or therapeutic trials. The inoculum-dependent survival gradient—rapid mortality at ≥10⁷–10⁸ CFU mL⁻¹, aligns with dose–mortality envelopes reported for warm-water teleost challenges with pathogenic A. hydrophila [13,42]. Together with the biofilm findings, these data delineate both persistence and lethality axes for Indonesian isolates and specify evidence-based windows (~10⁵ CFU mL⁻¹ sublethal; 10⁶–10⁷ CFU mL⁻¹ lethal) for product evaluation and pathophysiology studies [33,34,38].
Across clinical, molecular, phylogenetic, resistance, biofilm, and challenge analyses, the data converge on the conclusion that A. hydrophila is the principal aetiology of the investigated gourami outbreaks and that circulating Indonesian isolates combine high multidrug resistance with variable biofilm capacity and a lethal challenge window centered on 10⁶–10⁷ CFU mL⁻¹ [44,45,46]. These findings endorse a gyrB-first, rpoB-reinforced, concatenation-adjudicated diagnostic pipeline and support stewardship and husbandry measures targeted to lineage-specific risks, including sanitation/engineering controls focused on strong biofilm formers [43,47]. Actionable implications and next steps and support the a priori hypothesis while yielding actionable implications: (i) adopt a gyrB-first genotyping workflow with rpoB confirmation and concatenation for edge cases; (ii) implement stewardship that de-emphasizes aminopenicillins/early cephalosporins and macrolide/lincosamide classes, while verifying ciprofloxacin and doxycycline activity by MIC before field use [48]; (iii) prioritize sanitation/engineering controls targeted at strong biofilm formers [43,47]; and (iv) standardize efficacy trials within the calibrated windows (~10⁵ CFU mL⁻¹ sublethal; 10⁶–10⁷ CFU mL⁻¹ lethal) [44,45,46]. Remaining gaps—already noted above—map directly to near-term workstreams that will improve precision in diagnostics, treatment, and prevention: MIC/Etest confirmation and breakpoint harmonization (CLSI VET03/VET04 (2020) alignment) [48]; WGS-level epidemiology with resistome/virulome and recombination analyses [44,46]; biofilm validation under flow/on relevant aquaculture substrates [43,47]; multi-route challenge harmonization (to benchmark route/stress effects on LD₅₀) [45]; and integrated farm-level covariates (water quality, management, antimicrobial use) to refine risk models and intervention targeting.
5. Conclusions
We show that higher-information loci gyrB and rpoB outperform 16S for Aeromonas species delimitation and subclade resolution, enabling robust trace-back and genotype–phenotype linkage. Indonesian A. hydrophila outbreak isolates remain highly resistant under the primary MAR-Relevant endpoint (mean 0.646, median 0.636; range 0.364–0.909), with ciprofloxacin uniformly active (9/9) and doxycycline partially retained (7/9). Early 24-h biofilm attachment differs across gyrB-defined phylogroups, indicating lineage-specific risks of surface persistence and antibiotic tolerance. A conspecific gourami challenge calibrated LD₅₀ ≈ 3–5 × 10⁵ CFU mL⁻¹ (sublethal ~10⁵; lethal 10⁶–10⁷). Collectively, these findings support a gyrB-first, rpoB-reinforced, concatenation-adjudicated workflow and stewardship that de-emphasizes aminopenicillins/early cephalosporins and macrolide/lincosamide classes while verifying quinolone/tetracycline choices by MIC, and they prioritize biofilm-targeted sanitation/engineering controls. The integrated readouts, MAR (resistance), biofilm (persistence/tolerance), and LD₅₀ (virulence), provide a practical bridge from laboratory identification to on-farm decision-making and the design of vaccine/therapeutic trials in gourami aquaculture..
Supplementary Materials
The following supporting information can be downloaded at the website of this paper posted on Preprints.org, Supplementary Tables S1 and S2.
Author Contributions
Conceptualization, R.Z. and S.; methodology, R.Z., W.T. and M.N.A.A.; formal analysis, R.Z. and M.N.A.A.; investigation, R.Z. and W.T.; resources, W.T.; data curation, R.Z.; validation, M.N.A.A.; visualization, R.Z. and M.N.A.A.; experimental infections, animal husbandry, and ethics compliance, W.T.; supervision (field operations and laboratory), S. and W.T.; project administration, S.; writing—original draft, R.Z.; writing—review & editing, W.T., M.N.A.A., and S. All authors have read and agreed to the published version of the manuscript.
Funding
This research was funded by Airlangga Research Fund Tahun 2024 skema Penelitian Dasar Unggulan (PDU), Rektor Universitas Airlangga grant number 672/UN3/2024.
Institutional Review Board Statement
All procedures involving live fish complied with institutional and national regulations and were approved by the Animal Care and Use Committee (ACUC), Universitas Brawijaya, Indonesia (approval no. 170-KEP-UB-2024).
Informed Consent Statement
Not applicable.
Data Availability Statement
All data supporting the findings of this study are included within the article and its Supplementary Material.
Conflicts of Interest
The authors declare no conflicts of interest.
Abbreviations
The following abbreviations are used in this manuscript:
| MAR | Multiple Antibiotic Resistance Index |
| EUCAST | European Committee on Antimicrobial Susceptibility Testing |
| ODc | Optical-Density Cut-off (ambang OD untuk klasifikasi biofilm) |
| MS-222 | Tricaine Methanesulfonate (anestetik ikan) |
| MHA | Mueller–Hinton Agar |
| TSA | Tryptic Soy Agar |
| TSB | Tryptic Soy Broth |
| OD₅₉₀/OD₆₀₀ | Optical Density at 590/600 nm |
| MAFFT | Multiple Alignment using Fast Fourier Transform |
| trimAl | Alignment-Trimming Tool (untuk multiple sequence alignment) |
| ModelFinder | Model Selection (BIC) untuk filogenetik |
| IQ-TREE2 | Maximum-Likelihood Phylogenetics |
| UFBoot | Ultrafast Bootstrap |
| SH-aLRT | Shimodaira–Hasegawa Approximate Likelihood-Ratio Test |
| MrBayes | Bayesian Phylogenetics |
| ESS | Effective Sample Size (diagnostik MCMC) |
| iTOL | Interactive Tree Of Life (visualisasi pohon) |
| BH-FDR | Benjamini–Hochberg False Discovery Rate |
| ACUC | Animal Care and Use Committee |
| LD₅₀ | Median Lethal Dose |
References
- Slembrouck, J.; Arifin, O.Z.; Pouil, S.; Subagja, J.; Yani, A.; Asependi, A.; Kristanto, A.H.; Legendre, M. Seasonal variation of giant gourami (Osphronemus goramy) spawning activity and egg production in aquaculture ponds. Aquaculture 2020, 527, 735450. [Google Scholar] [CrossRef]
- Febrianti, R.; Khasani, I.; Rosada, K.K. Assessing the susceptibility of the selected gourami (Osphronemus goramy) to Aeromonas hydrophila. Nusantara Bioscience 2021, 13, 111–120. [Google Scholar] [CrossRef]
- Fernández-Bravo, A.; Figueras, M.J. An update on the genus Aeromonas: Taxonomy, epidemiology, and pathogenicity. Microorganisms 2020, 8, 129. [Google Scholar] [CrossRef]
- Janda, J.M.; Abbott, S.L. The genus Aeromonas: Taxonomy, pathogenicity, and infection. Clinical Microbiology Reviews 2010, 23, 35–73. [Google Scholar] [CrossRef]
- Chen, F.; Sun, J.; Han, Z.; Yang, X.; Xian, J.-A.; Lv, A.; Hu, X.; Shi, H. Isolation, identification and characteristics of Aeromonas veronii from diseased crucian carp (Carassius auratus gibelio). Frontiers in Microbiology 2019, 10, 2742. [Google Scholar] [CrossRef]
- Fajardo, C.; Santos, P.; Passos, R.; Vaz, M.; Azeredo, R.; Machado, M.; Fernández-Boo, S.; Baptista, T.; Costas, B. Early molecular immune responses of turbot (Scophthalmus maximus L.) following infection with Aeromonas salmonicida subsp. salmonicida. International Journal of Molecular Sciences 2023, 24, 12944. [Google Scholar] [CrossRef]
- Rozi, R.; Rahayu, K.; Daruti, D.N.; Stella, M.S.P. Study on characterization, pathogenicity and histopathology of disease caused by Aeromonas hydrophila in gourami (Osphronemus goramy). IOP Conference Series: Earth and Environmental Science 2018, 137, 012003. [Google Scholar] [CrossRef]
- Rozi, R.; Rahayu, K.; Daruti, D.N. Detection and analysis of hemolysin genes in Aeromonas hydrophila isolated from gourami (Osphronemus goramy) by polymerase chain reaction (PCR). IOP Conference Series: Earth and Environmental Science 2018, 137, 012001. [Google Scholar] [CrossRef]
- Rozi, R.; Tyasningsih, W.; Rahmahani, J.; Aksono, E.B.; Yunus, M.; Al Arif, M.A.; Kuncorojati, S.; Kusdarwati, R.; Sari, P.D.W.; Azmai, M.N.A.; Salleh, A.; Khan, N.N.; Suwarno. Designing a novel aerolysin-based multi-epitope vaccine against Aeromonas hydrophila isolated from Osphronemus goramy using reverse vaccinology: An in silico approach. Jurnal Ilmiah Perikanan dan Kelautan 2024, 16, 298–321. [Google Scholar] [CrossRef]
- Wassif, I.M.; Mohammed, R.S. Use of thyme and thymol as immunostimulant agents to control experimental Aeromonas hydrophila infection in Nile tilapia (Oreochromis niloticus). Zagazig Veterinary Journal 2022, 50, 241–254. [Google Scholar] [CrossRef]
- Abbott, S.L.; Cheung, W.K.W.; Janda, J.M. The genus Aeromonas: biochemical characteristics, atypical reactions, and phenotypic identification schemes. Journal of Clinical Microbiology 2003, 41, 2348–2357. [Google Scholar] [CrossRef]
- Su, H.; Su, J. Cyprinid viral diseases and vaccine development. Fish & Shellfish Immunology 2018, 83, 84–95. [Google Scholar] [CrossRef]
- Pridgeon, J.W.; Klesius, P.H.; Song, L.; Zhang, D.; Kojima, K.; Mobley, J.A. Identification, virulence, and mass spectrometry of toxic ECP fractions of West Alabama isolates of Aeromonas hydrophila obtained from a 2010 disease outbreak. Veterinary Microbiology 2013, 164, 336–343. [Google Scholar] [CrossRef]
- Zheng, W.; Cao, H.; Yang, X. Grass carp (Ctenopharyngodon idellus) infected with multiple strains of Aeromonas hydrophila. African Journal of Microbiology Research 2012, 6, 4512–4520. [Google Scholar] [CrossRef]
- Ugarte-Torres, A.; Perry, S.; Franko, A.; Church, D.L. Multidrug-resistant Aeromonas hydrophila causing fatal bilateral necrotizing fasciitis in an immunocompromised patient: A case report. Journal of Medical Case Reports 2018, 12, 326. [Google Scholar] [CrossRef]
- Mohanty, S.; Ali, S.M.; Singh, P.K. Necrotizing fasciitis and gas gangrene due to Aeromonas hydrophila in an immunocompetent host: A rare entity. IDCases 2022, 28, e01508. [Google Scholar] [CrossRef]
- Greiner, M.; Anagnostopoulos, A.; Pohl, D.; Zbinden, R.; Zbinden, A. A rare case of severe gastroenteritis caused by Aeromonas hydrophila after colectomy in a patient with anti-Hu syndrome: A case report. BMC Infectious Diseases 2021, 21, 1097. [Google Scholar] [CrossRef] [PubMed]
- Lohumi, Y.; Hussain Bhat, R.A.; Bhat, I.A.; Sidiq, M.J. Enhancing aquaculture sustainability: Role of alternative antimicrobial agents. In Management of Fish Diseases; Springer: Singapore, 2025; pp. 329–352. [Google Scholar] [CrossRef]
- Tindall, B.J.; Rosselló-Móra, R.; Busse, H.-J.; Ludwig, W.; Kämpfer, P. Notes on the characterization of prokaryote strains for taxonomic purposes. International Journal of Systematic and Evolutionary Microbiology 2010, 60, 249–266. [Google Scholar] [CrossRef] [PubMed]
- Richter, M.; Rosselló-Móra, R. Shifting the genomic gold standard for the prokaryotic species definition. Proceedings of the National Academy of Sciences of the USA 2009, 106, 19126–19131. [Google Scholar] [CrossRef]
- Meier-Kolthoff, J.P.; Auch, A.F.; Klenk, H.-P.; Göker, M. Genome sequence-based species delimitation with confidence intervals and improved distance functions. Systematic and Applied Microbiology 2013, 36, 259–267. [Google Scholar] [CrossRef] [PubMed]
- Clarridge, J.E., III. Impact of 16S rRNA gene sequence analysis for identification of bacteria on clinical microbiology and infectious diseases. Clinical Microbiology Reviews 2004, 17, 840–862. [Google Scholar] [CrossRef]
- Morandi, A.; Zhaxybayeva, O.; Gogarten, J.P.; Graf, J. Evolutionary and diagnostic implications of intragenomic heterogeneity in the 16S rRNA gene in Aeromonas strains. Journal of Bacteriology 2005, 187, 6561–6564. [Google Scholar] [CrossRef]
- Martínez-Murcia, A.J.; Monera, A.; Saavedra, M.J.; Oncina, R.; López-Álvarez, M.; Lara, E.; Figueras, M.J. Multilocus phylogenetic analysis of the genus Aeromonas. Systematic and Applied Microbiology 2011, 34, 189–199. [Google Scholar] [CrossRef]
- Yáñez, M.A.; Catalán, V.; Apraiz, D.; Figueras, M.J.; Martínez-Murcia, A.J. Phylogenetic analysis of the genus Aeromonas based on gyrB gene sequences. International Journal of Systematic and Evolutionary Microbiology 2003, 53, 875–883. [Google Scholar] [CrossRef]
- Korczak, B.; Christensen, H.; Emler, S.; Frey, J.; Kuhnert, P. Phylogeny of the family Aeromonadaceae based on rpoB sequences. Systematic and Applied Microbiology 2006, 29, 431–439. [Google Scholar] [CrossRef]
- Liu, P.-C.; Chuang, W.-H.; Tu, C.-C.; Lee, K.-K. Purification of a toxic cysteine protease produced by pathogenic Aeromonas hydrophila isolated from rainbow trout. Journal of Basic Microbiology 2010, 50, 538–547. [Google Scholar] [CrossRef] [PubMed]
- Suresh, K.; Pillai, D. Prevalence and characterization of virulence-associated genes and antimicrobial resistance in Aeromonas hydrophila from freshwater finfish farms in Andhra Pradesh, India. Biologia 2023, 78, 2931–2939. [Google Scholar] [CrossRef]
- Vilches, S.; Jiménez, N.; Merino, S.; Tomás, J.M. The Aeromonas dsbA mutation decreased virulence by triggering type III secretion system but not flagella production. Microbial Pathogenesis 2012, 52, 130–139. [Google Scholar] [CrossRef]
- Jiang, X.; Qin, Y.X.; Lin, G.F.; Huang, L.; Huang, B.; Huang, W.S.; Yan, Q.P. FlgN plays important roles in the adhesion of Aeromonas hydrophila to host mucus. Genetics and Molecular Research 2015, 14, 6376–6386. [Google Scholar] [CrossRef]
- Cabello, F.C.; Godfrey, H.P.; Tomova, A.; Ivanova, L.; Dölz, H.; Millanao, A.; Buschmann, A.H. Antimicrobial use in aquaculture re-examined: Its relevance to antimicrobial resistance and to animal and human health. Environmental Microbiology 2013, 15, 1917–1942. [Google Scholar] [CrossRef] [PubMed]
- Krumperman, P.H. Multiple antibiotic resistance indexing of Escherichia coli to identify high-risk sources of fecal contamination of foods. Applied and Environmental Microbiology 1983, 46, 165–170. [Google Scholar] [CrossRef]
- Clinical and Laboratory Standards Institute (CLSI). Performance Standards for Antimicrobial Disk and Dilution Susceptibility Tests for Bacteria Isolated from Animals; VET03, 5th ed.; CLSI: Wayne, PA, USA, 2020. [Google Scholar]
- Clinical and Laboratory Standards Institute (CLSI). Performance Standards for Antimicrobial Susceptibility Testing of Bacteria Isolated from Aquatic Animals; VET04, 1st ed.; CLSI: Wayne, PA, USA, 2020. [Google Scholar]
- Mursalim, M.F.; Budiyansah, H.; Raharjo, H.M.; Debnath, P.P.; Sakulworakan, R.; Chokmangmeepisarn, P.; Yindee, J.; Piasomboon, P.; Elayaraja, S.; Rodkhum, C.; Rodkhum, C. Diversity and antimicrobial susceptibility profiles of Aeromonas spp. isolated from diseased freshwater fishes in Thailand. Journal of Fish Diseases 2022, 45, 1917–1932. [Google Scholar] [CrossRef]
- Stepanović, S.; Vuković, D.; Hola, V.; Di Bonaventura, G.; Djukić, S.; Cirković, I.; Ruzicka, F. Quantification of biofilm in microtiter plates: Overview of testing conditions and practical recommendations for assessment of biofilm production by staphylococci. Journal of Microbiological Methods 2007, 68, 175–179. [Google Scholar] [CrossRef]
- Reed, L.J.; Muench, H. A simple method of estimating fifty per cent endpoints. American Journal of Hygiene 1938, 27, 493–497. [Google Scholar]
- Flemming, H.-C.; Wingender, J.; Szewzyk, U.; Steinberg, P.; Rice, S.A.; Kjelleberg, S. Biofilms: An emergent form of bacterial life. Nat. Rev. Microbiol. 2016, 14, 563–575. [Google Scholar] [CrossRef] [PubMed]
- Bridier, T.; Briandet, R.; Thomas, V.; Dubois-Brissonnet, F. Resistance of bacterial biofilms to disinfectants: a review. Biofouling 2011, 27, 1017–1032. [Google Scholar] [CrossRef] [PubMed]
- O’Toole, G.; Stewart, P.S.; Stoodley, P. Biofilms as complex differentiated communities. Annu. Rev. Microbiol. 2000, 54, 49–79. [Google Scholar] [CrossRef]
- O’Toole, G.A. Microtiter Dish Biofilm Formation Assay. J. Vis. Exp. 2011, (47), e2437. [Google Scholar] [CrossRef]
- Madsen, J.S.; Burmølle, M.; Hansen, L.H.; Sørensen, S.J. The interconnection between biofilm formation and horizontal gene transfer. FEMS Immunol. Med. Microbiol. 2012, 65, 183–195. [Google Scholar] [CrossRef]
- Singh, B.; Dahiya, M.; Kumar, V.; Ayyagari, A.; Chaudhari, D.N.; Ahire, J.J. Biofilm and Antimicrobial Resistance: Mechanisms, Implications, and Emerging Solutions. Microbiol. Res. 2025, 16, 183. [Google Scholar] [CrossRef]
- Rasmussen-Ivey, C.R.; Hossain, M.J.; Odom, S.E.; Terhune, J.S.; Hemstreet, W.G.; Shoemaker, C.A.; Zhang, D.; Xu, D.-H.; Griffin, M.J.; Liu, Y.-J.; et al. Classification of a Hypervirulent Aeromonas hydrophila Pathotype Responsible for Epidemic Outbreaks in Warm-Water Fishes. Front. Microbiol. 2016, 7, 1615. [Google Scholar] [CrossRef] [PubMed]
- Zhang, D.; Xu, D.-H.; Shoemaker, C. Experimental Induction of Motile Aeromonas Septicemia in Channel Catfish (Ictalurus punctatus) by Waterborne Challenge with Virulent Aeromonas hydrophila. Aquac. Rep. 2016, 3, 18–23. [Google Scholar] [CrossRef]
- Peatman, E.; Mohammed, H.; Kirby, A.; Shoemaker, C.A.; Yildirim-Aksoy, M.; Beck, B.H. Mechanisms of Pathogen Virulence and Host Susceptibility in Virulent Aeromonas hydrophila Infections of Channel Catfish (Ictalurus punctatus). Aquaculture 2018, 482, 1–8. [Google Scholar] [CrossRef]
- Donlan, R.M. Biofilms: Microbial life on surfaces. Emerg. Infect. Dis. 2002, 8, 881–890. [Google Scholar] [CrossRef] [PubMed]
Figure 1.
External clinical signs in farmed gourami (Osphronemus goramy). (a) Haemorrhagic flank ulcer with hyperaemic margins and erosion of the adjacent dorsal fin (red arrow). (b) Longitudinal epidermal sloughing forming a pale necrotic plaque along the dorsal flank with adjacent scale loss and dorsal-fin base erosion (red arrow). (c) Severe unilateral exophthalmia with multifocal cutaneous erosions and scale loss (red arrow). (d–e), d = frayed dorsal/caudal/anal fins (tail-rot); e = diffuse integument pallor with scale loss; no overt exophthalmia or large haemorrhagic ulcer visible.
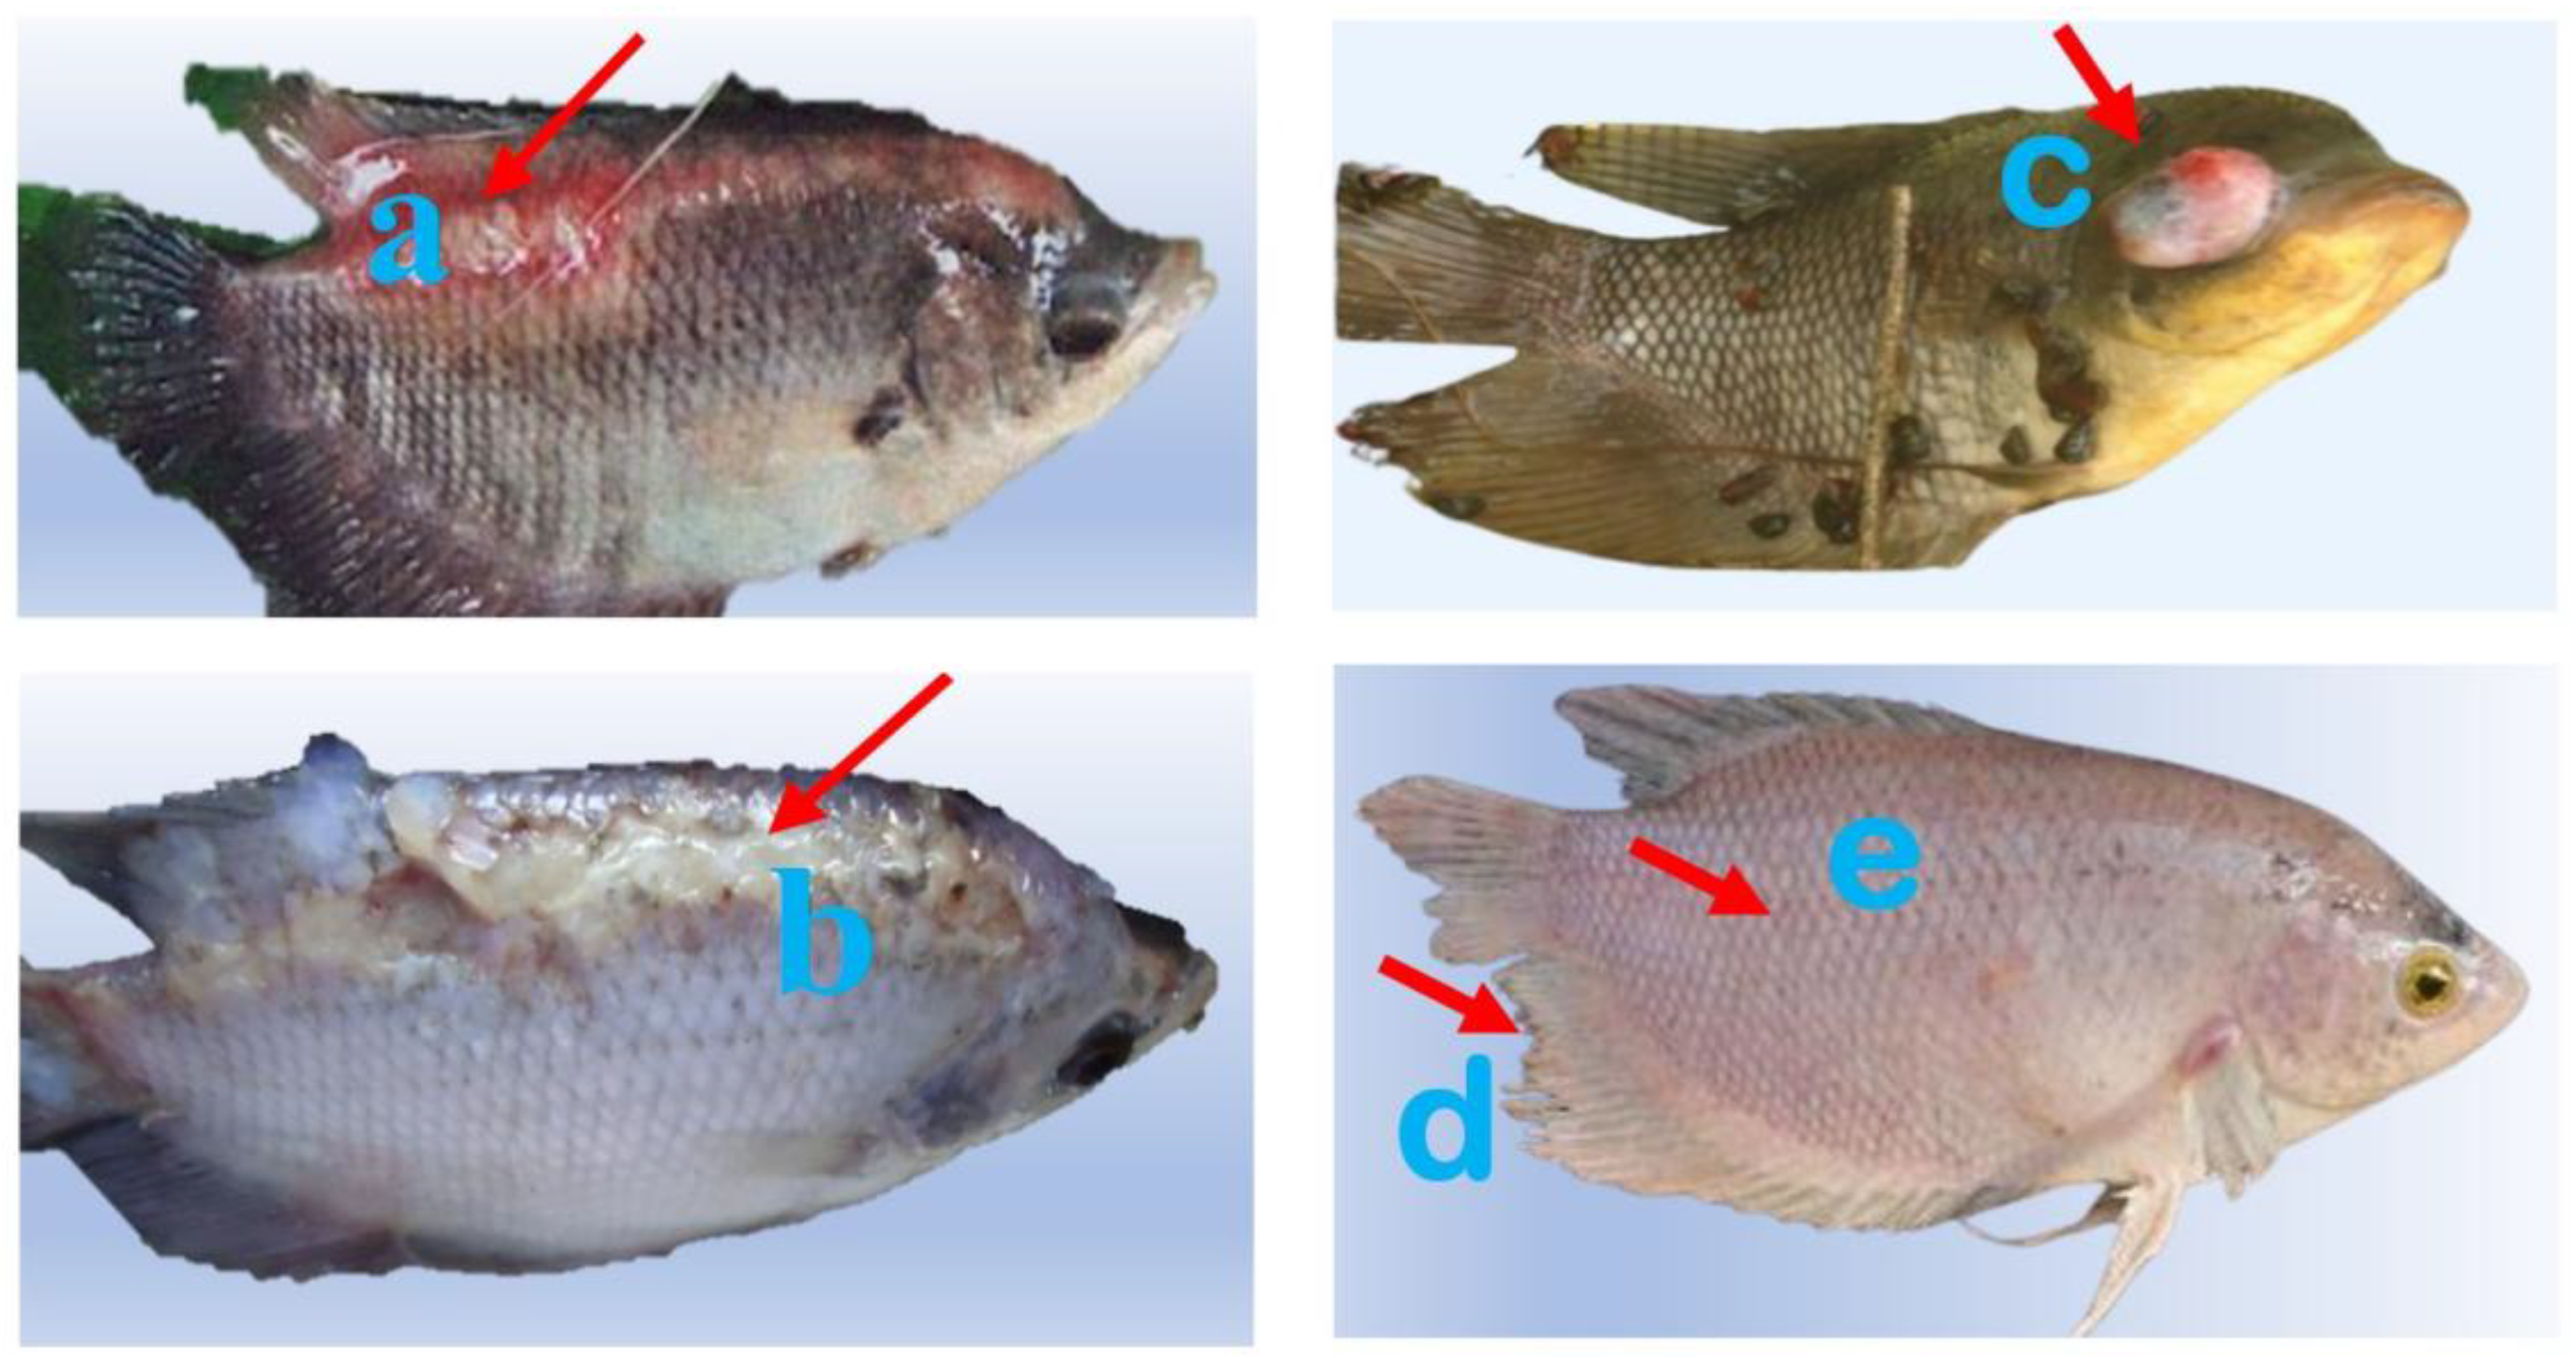
Figure 2.
(A) Heatmap of regional prevalence (%) of clinical signs in gourami (STRICT case definition). Cell values are point estimates; ● denotes signs with a significant between-region effect by omnibus Monte-Carlo χ² with BH–FDR correction (q < 0.05). Color scale fixed to 0–50% from orange (low) to red (high). (B) Region-specific adjusted odds ratios (aOR) versus Blitar for scale loss/desquamation (left) and skin ulcers/open wounds (right). Points show aOR and bars the 95% CI on a log scale; the vertical dashed line marks aOR = 1. Estimates are from logistic models on regional aggregates with Haldane–Anscombe correction for zero cells.
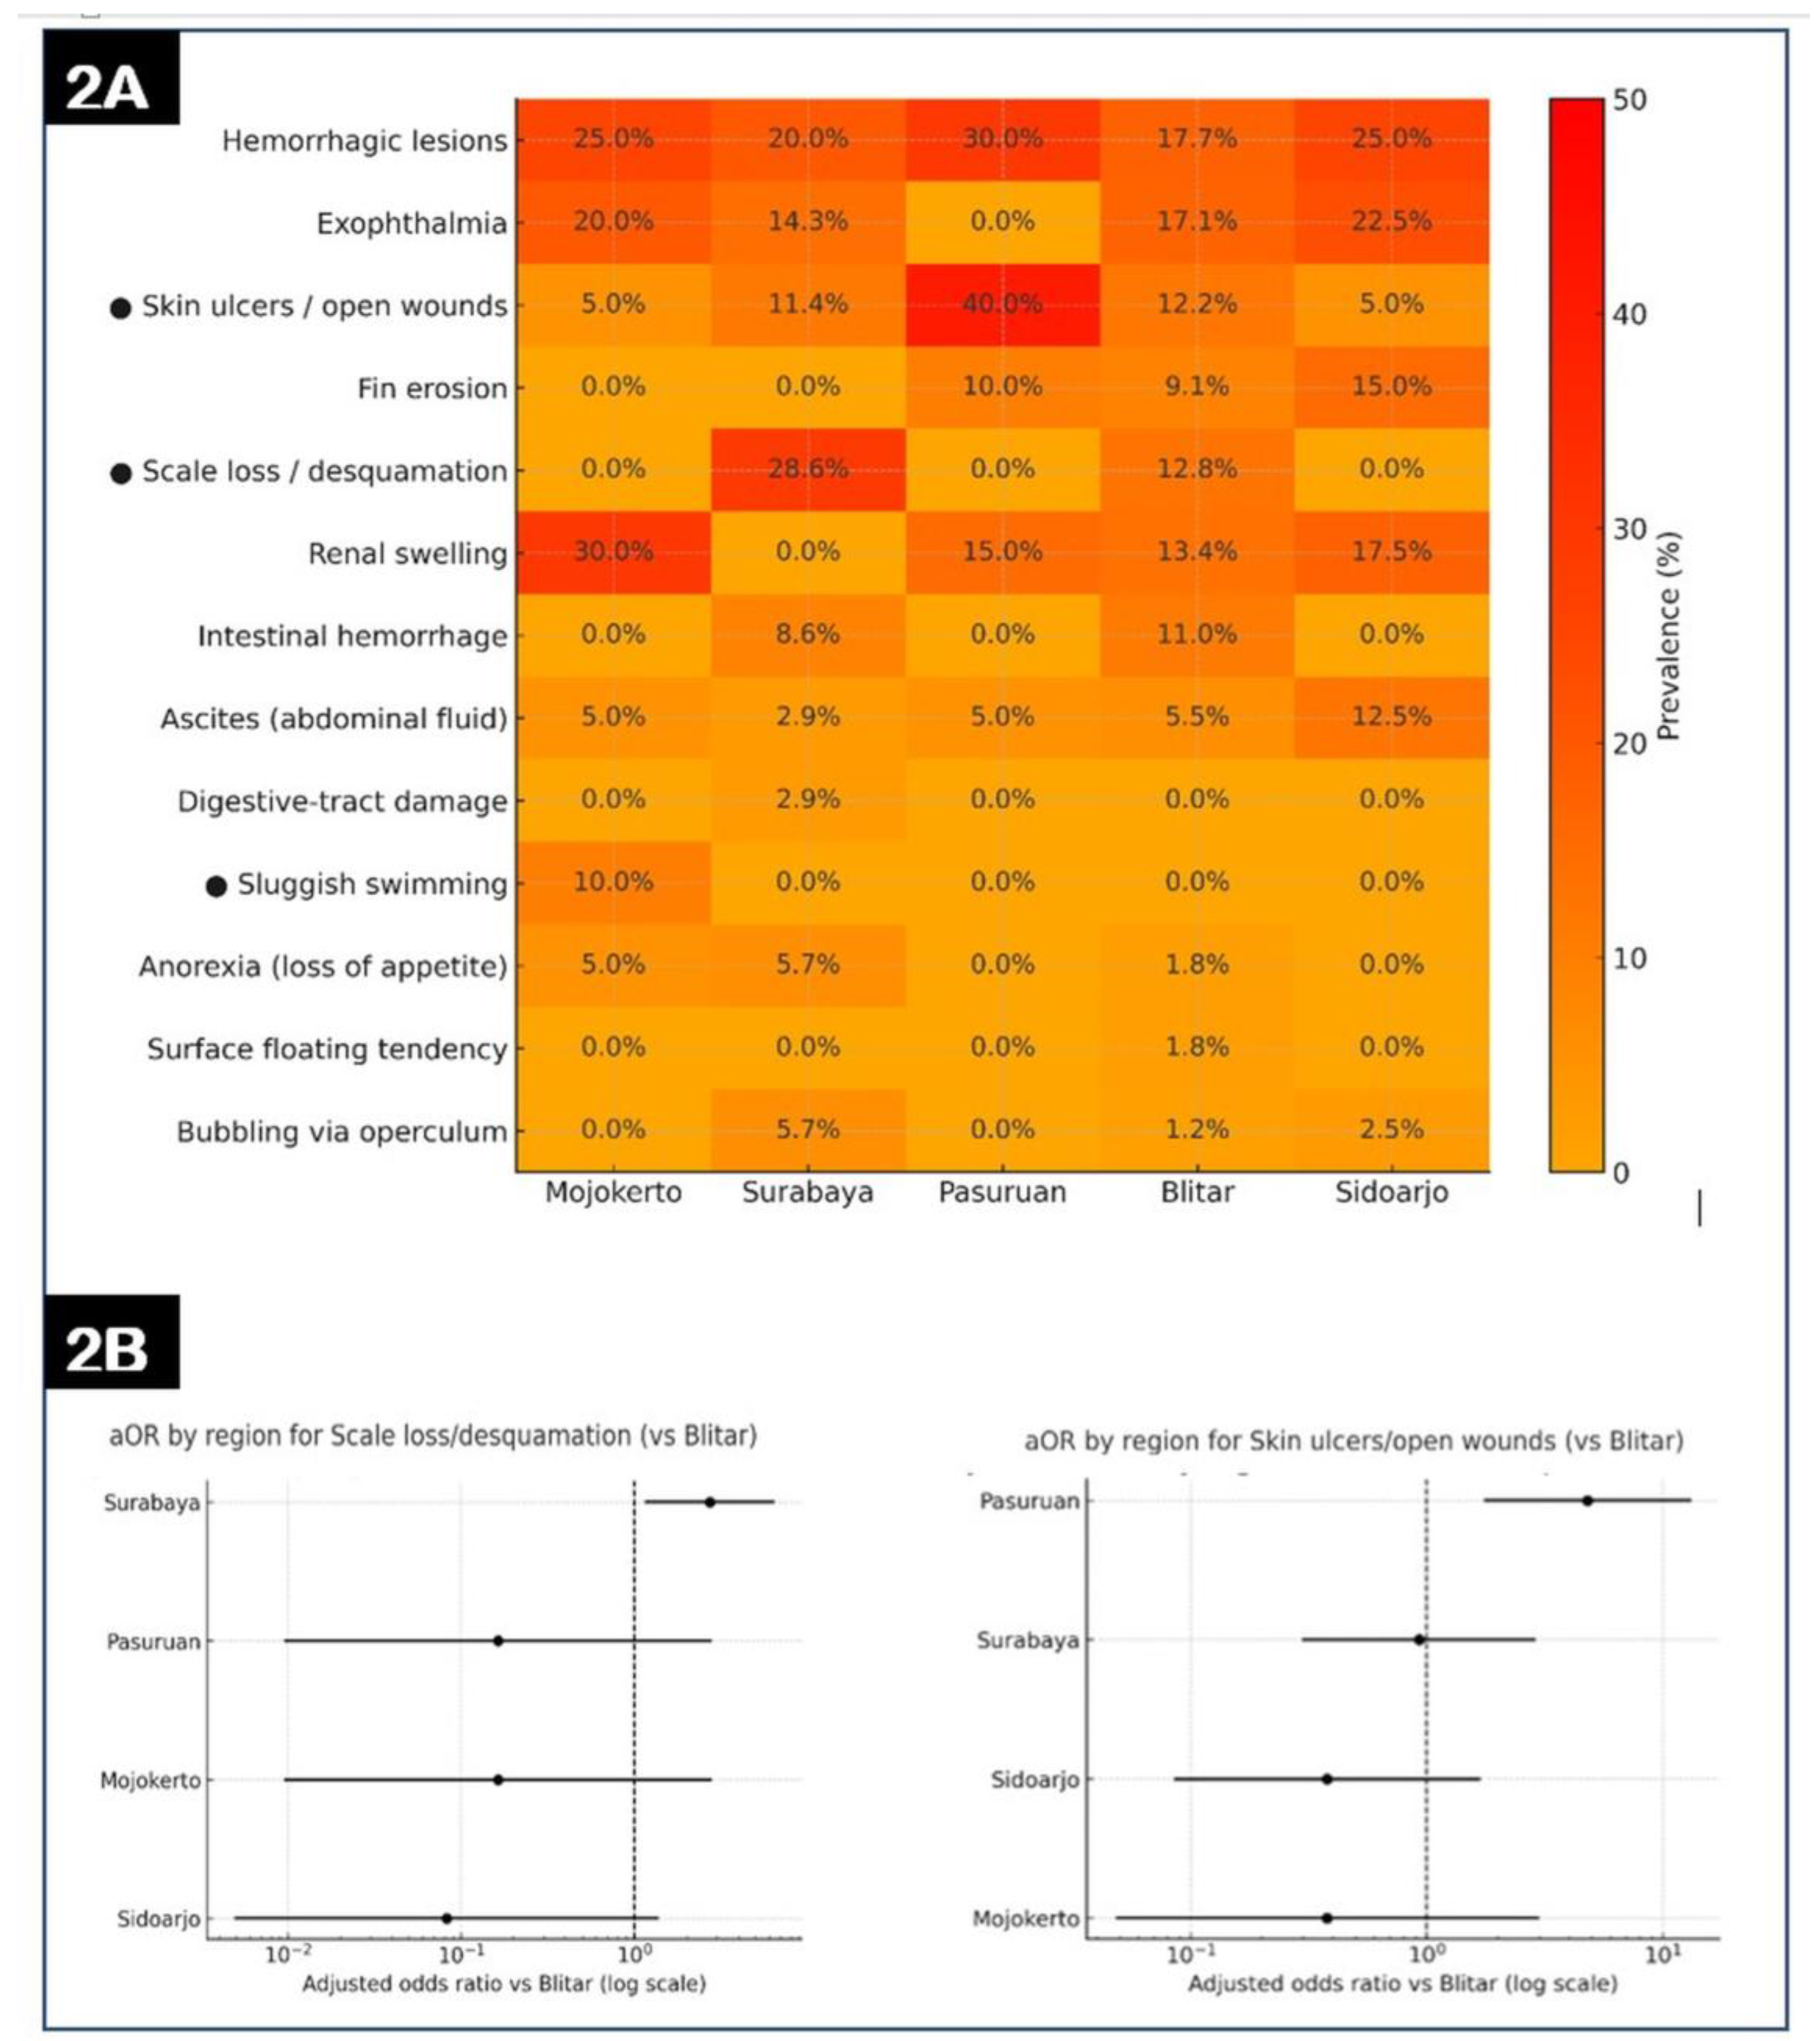
Figure 3.
Endpoint PCR confirmation of A. hydrophila isolates targeting (A) 16S rRNA (~1,505 bp), (B) rpoB (~558 bp), and (C) gyrB (~1,103 bp). M: 1-kb DNA ladder. Lanes 1–9: 1 = WS38, 2 = TM25, 3 = KS77, 4 = PP26, 5 = GB59, 6 = SB59, 7 = SB66, 8 = SS26, 9 = WS48.
Figure 3.
Endpoint PCR confirmation of A. hydrophila isolates targeting (A) 16S rRNA (~1,505 bp), (B) rpoB (~558 bp), and (C) gyrB (~1,103 bp). M: 1-kb DNA ladder. Lanes 1–9: 1 = WS38, 2 = TM25, 3 = KS77, 4 = PP26, 5 = GB59, 6 = SB59, 7 = SB66, 8 = SS26, 9 = WS48.
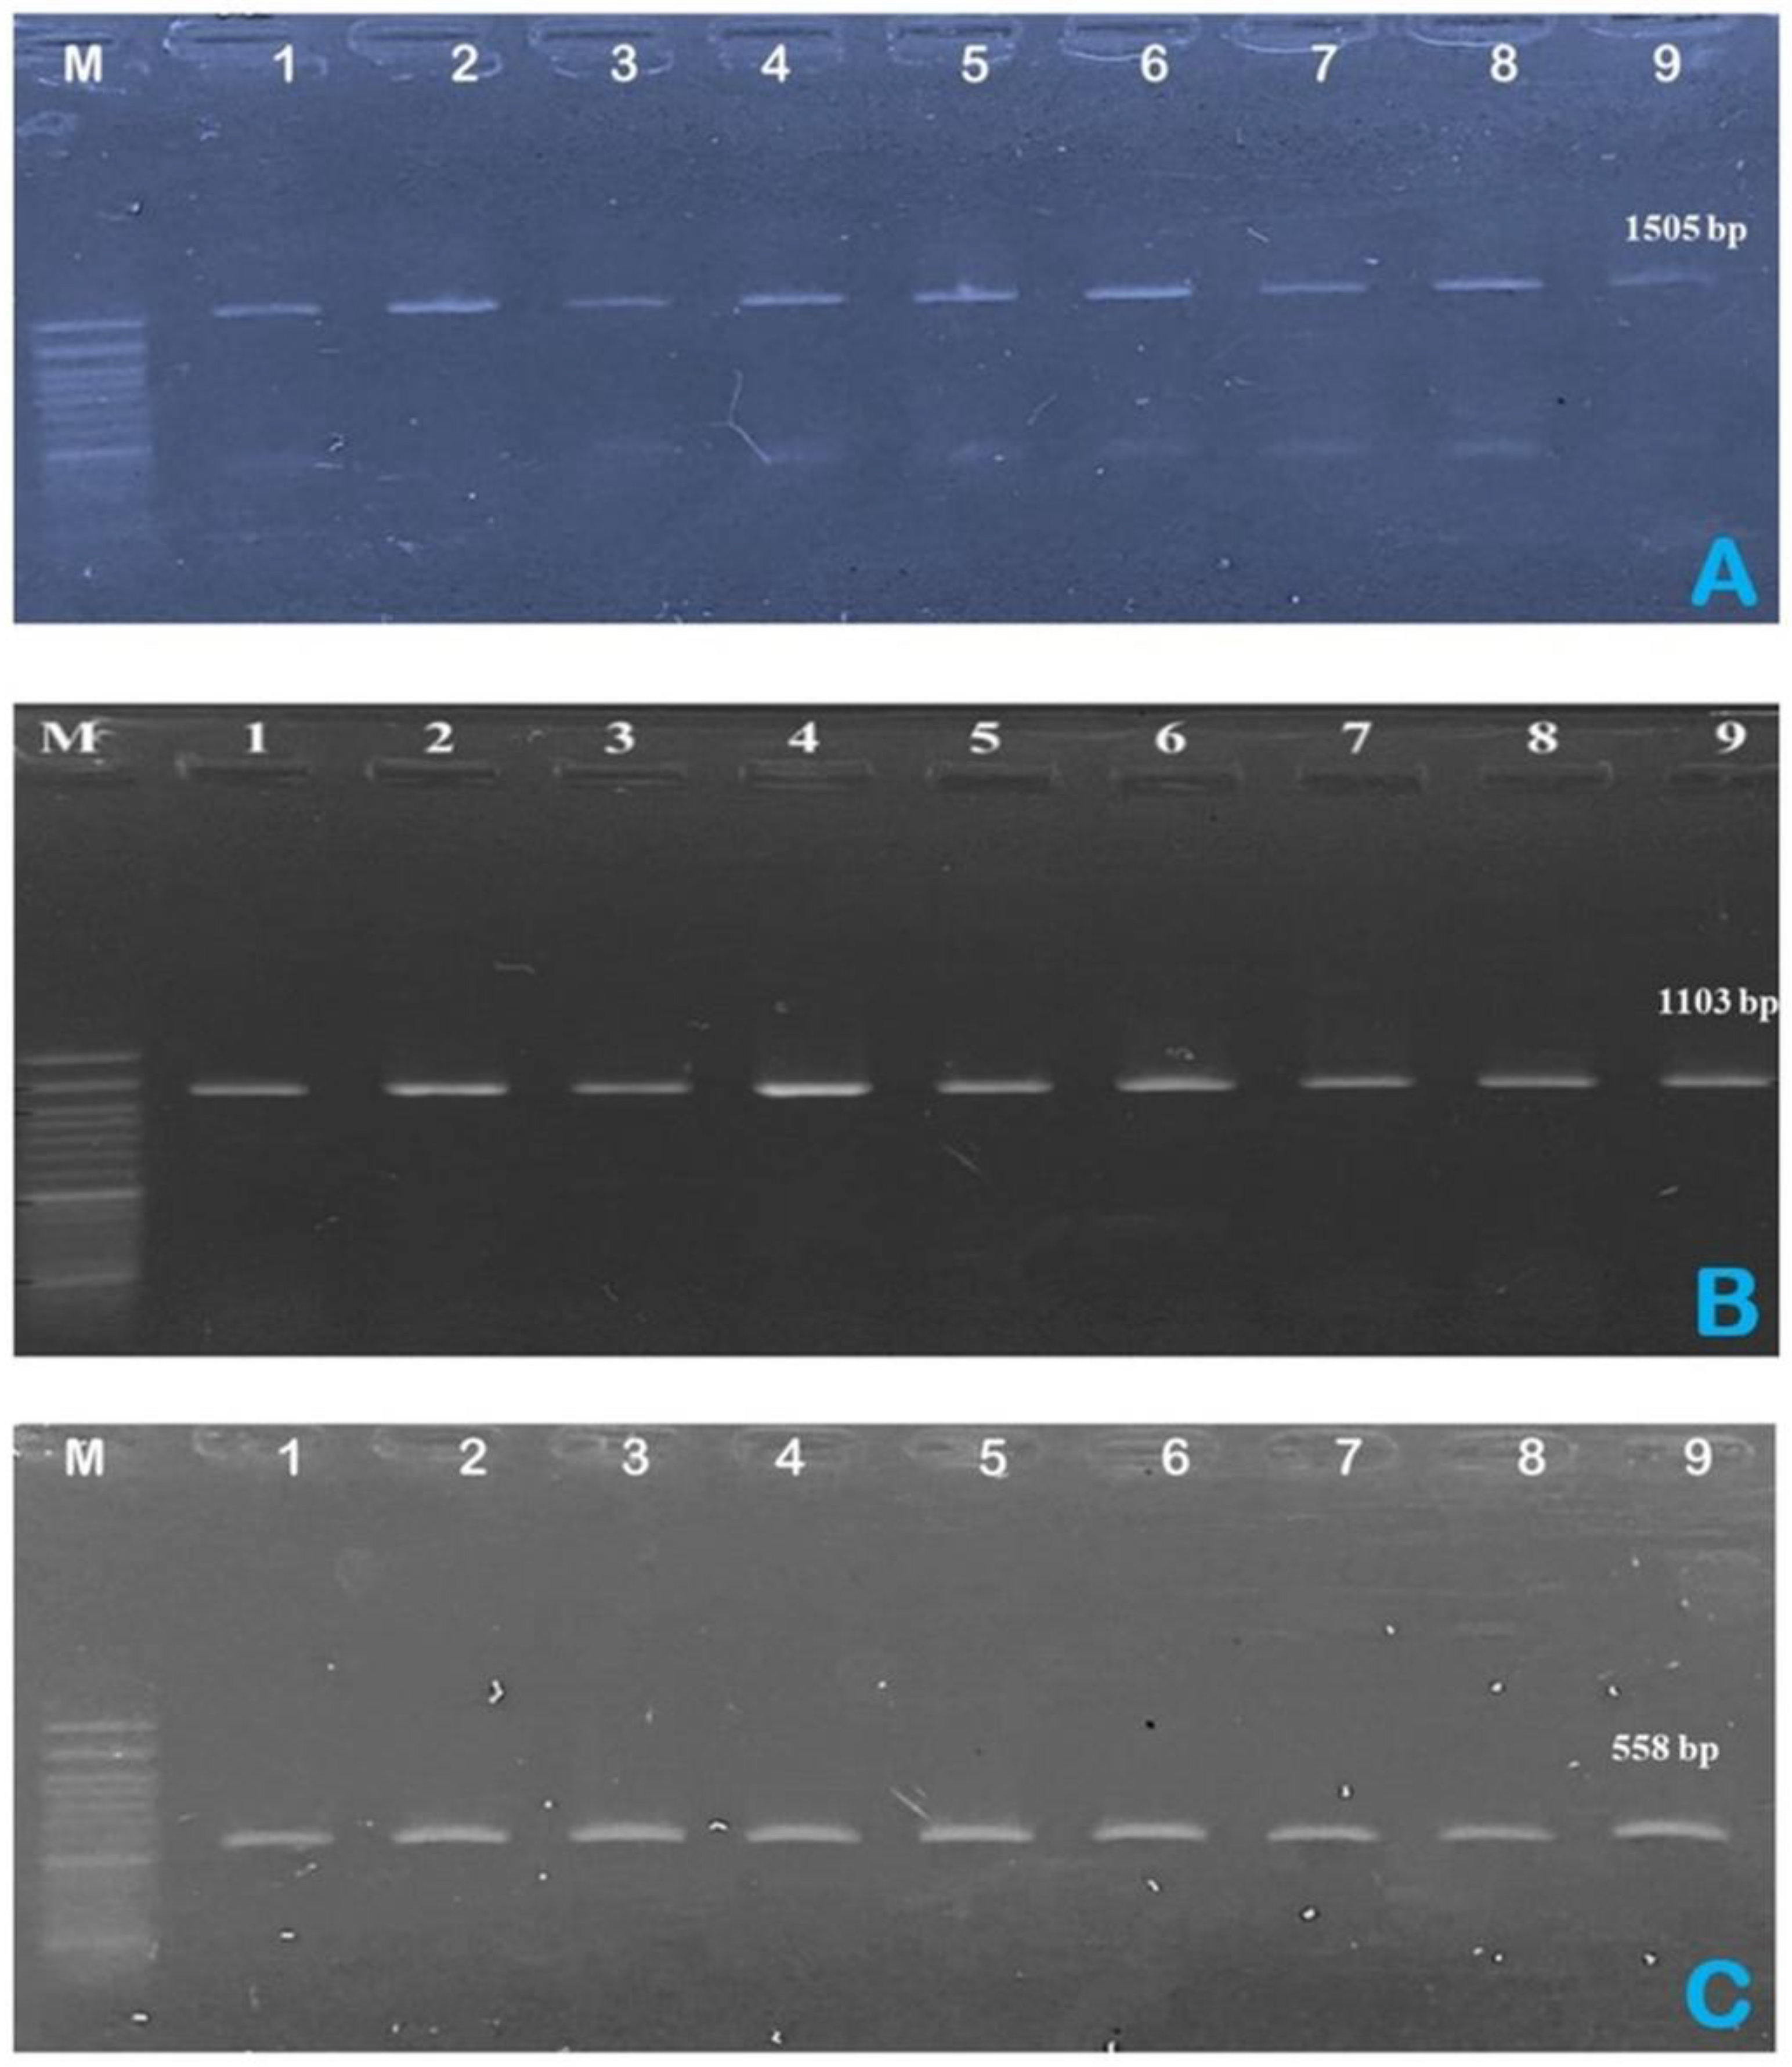
Figure 4.
PCR amplification and phylogenetic placement (top panels) of A. hydrophila isolates. (A) 16S rRNA (~1,505 bp), (B) rpoB (~558 bp), and (C) gyrB (~1,103 bp). Gels: M, 1-kb DNA ladder; lanes 1–10: 1 = A. hydrophila ATCC® 35654™ (positive control), 2 = TM25, 3 = KS77, 4 = PP26, 5 = GB59, 6 = SB59, 7 = SB66, 8 = SS26, 9 = WS48, 10=WS38. All isolates produced a single band at the expected size; no bands were observed in the no-template control (not shown). Trees: maximum-likelihood; scale bar = substitutions/site; node support shown as UFBoot (1,000)/SH-aLRT (1,000). Study isolates are highlighted in blue, the ATCC reference in red, and outgroups in orange. bp, base pairs.
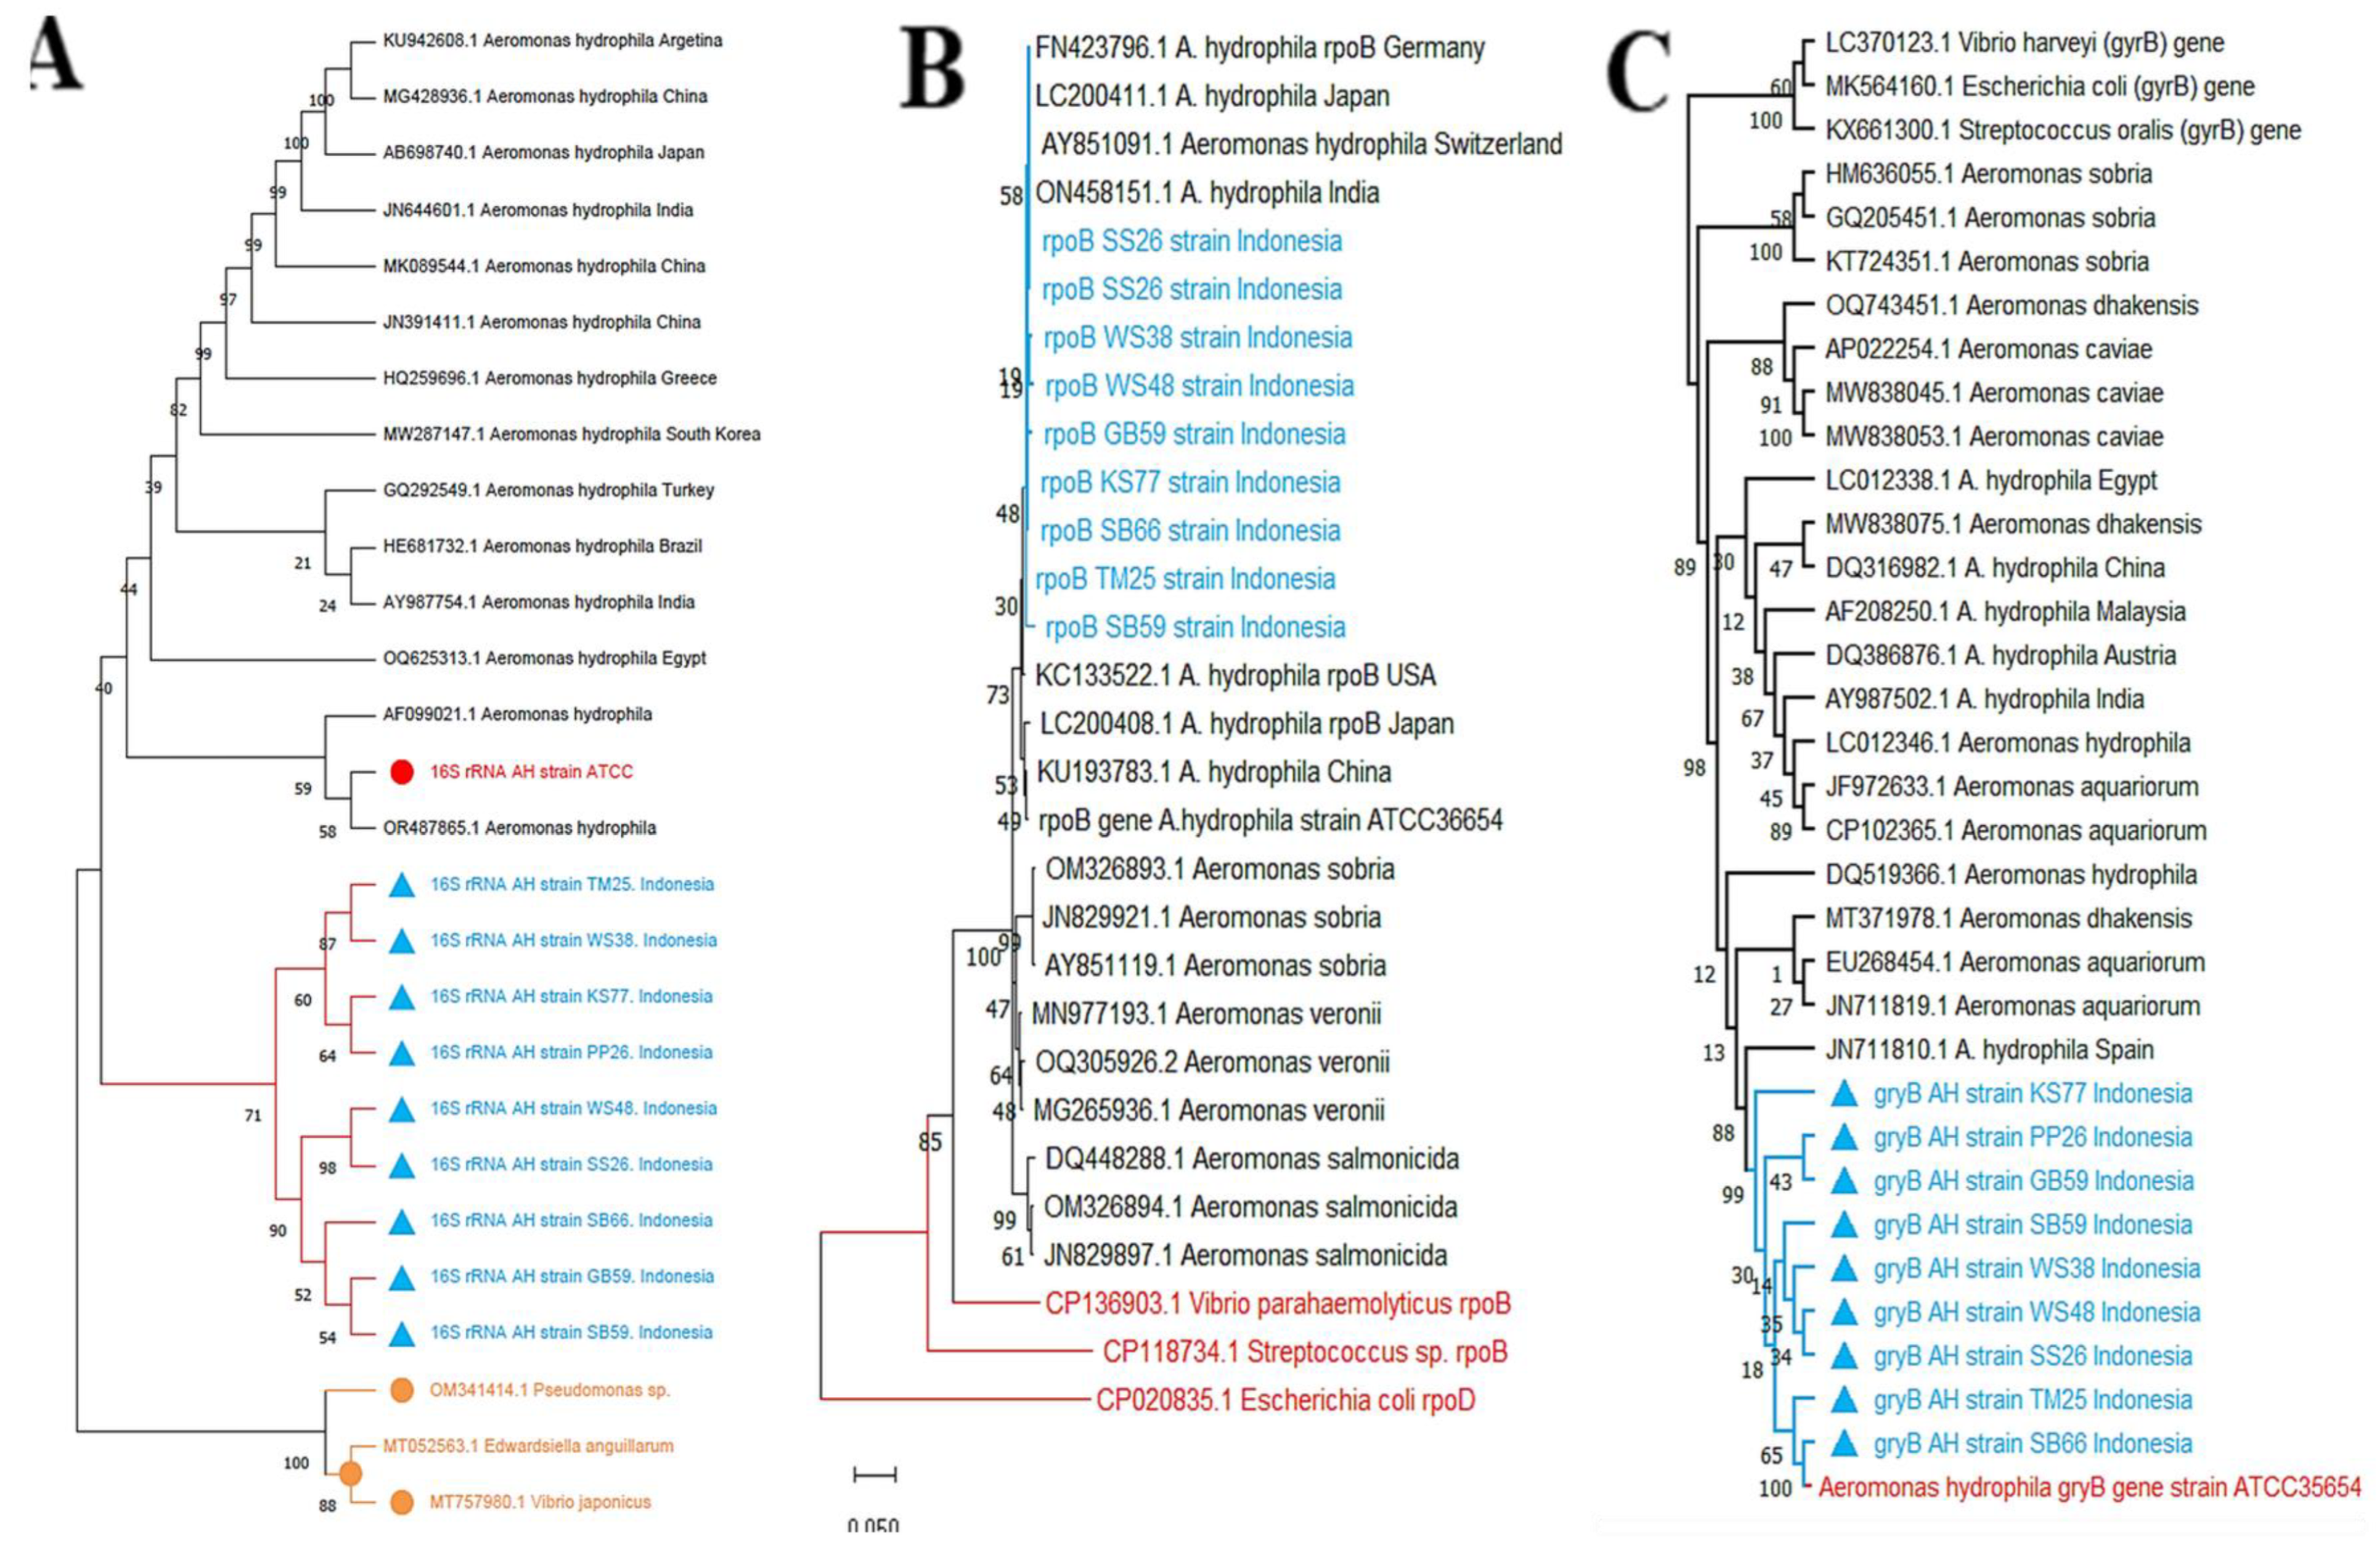
Figure 5.
Early biofilm cell attachment (OD590) of A. hydrophila isolates. Bar heights represent mean crystal-violet absorbance at 590 nm after incubation on polystyrene; whiskers denote SD. Isolates: ATCC® 35654™, SB59, PP26, WS48. Replication, inoculum density, incubation time/temperature, and wash/fix/stain parameters are reported in Methods.
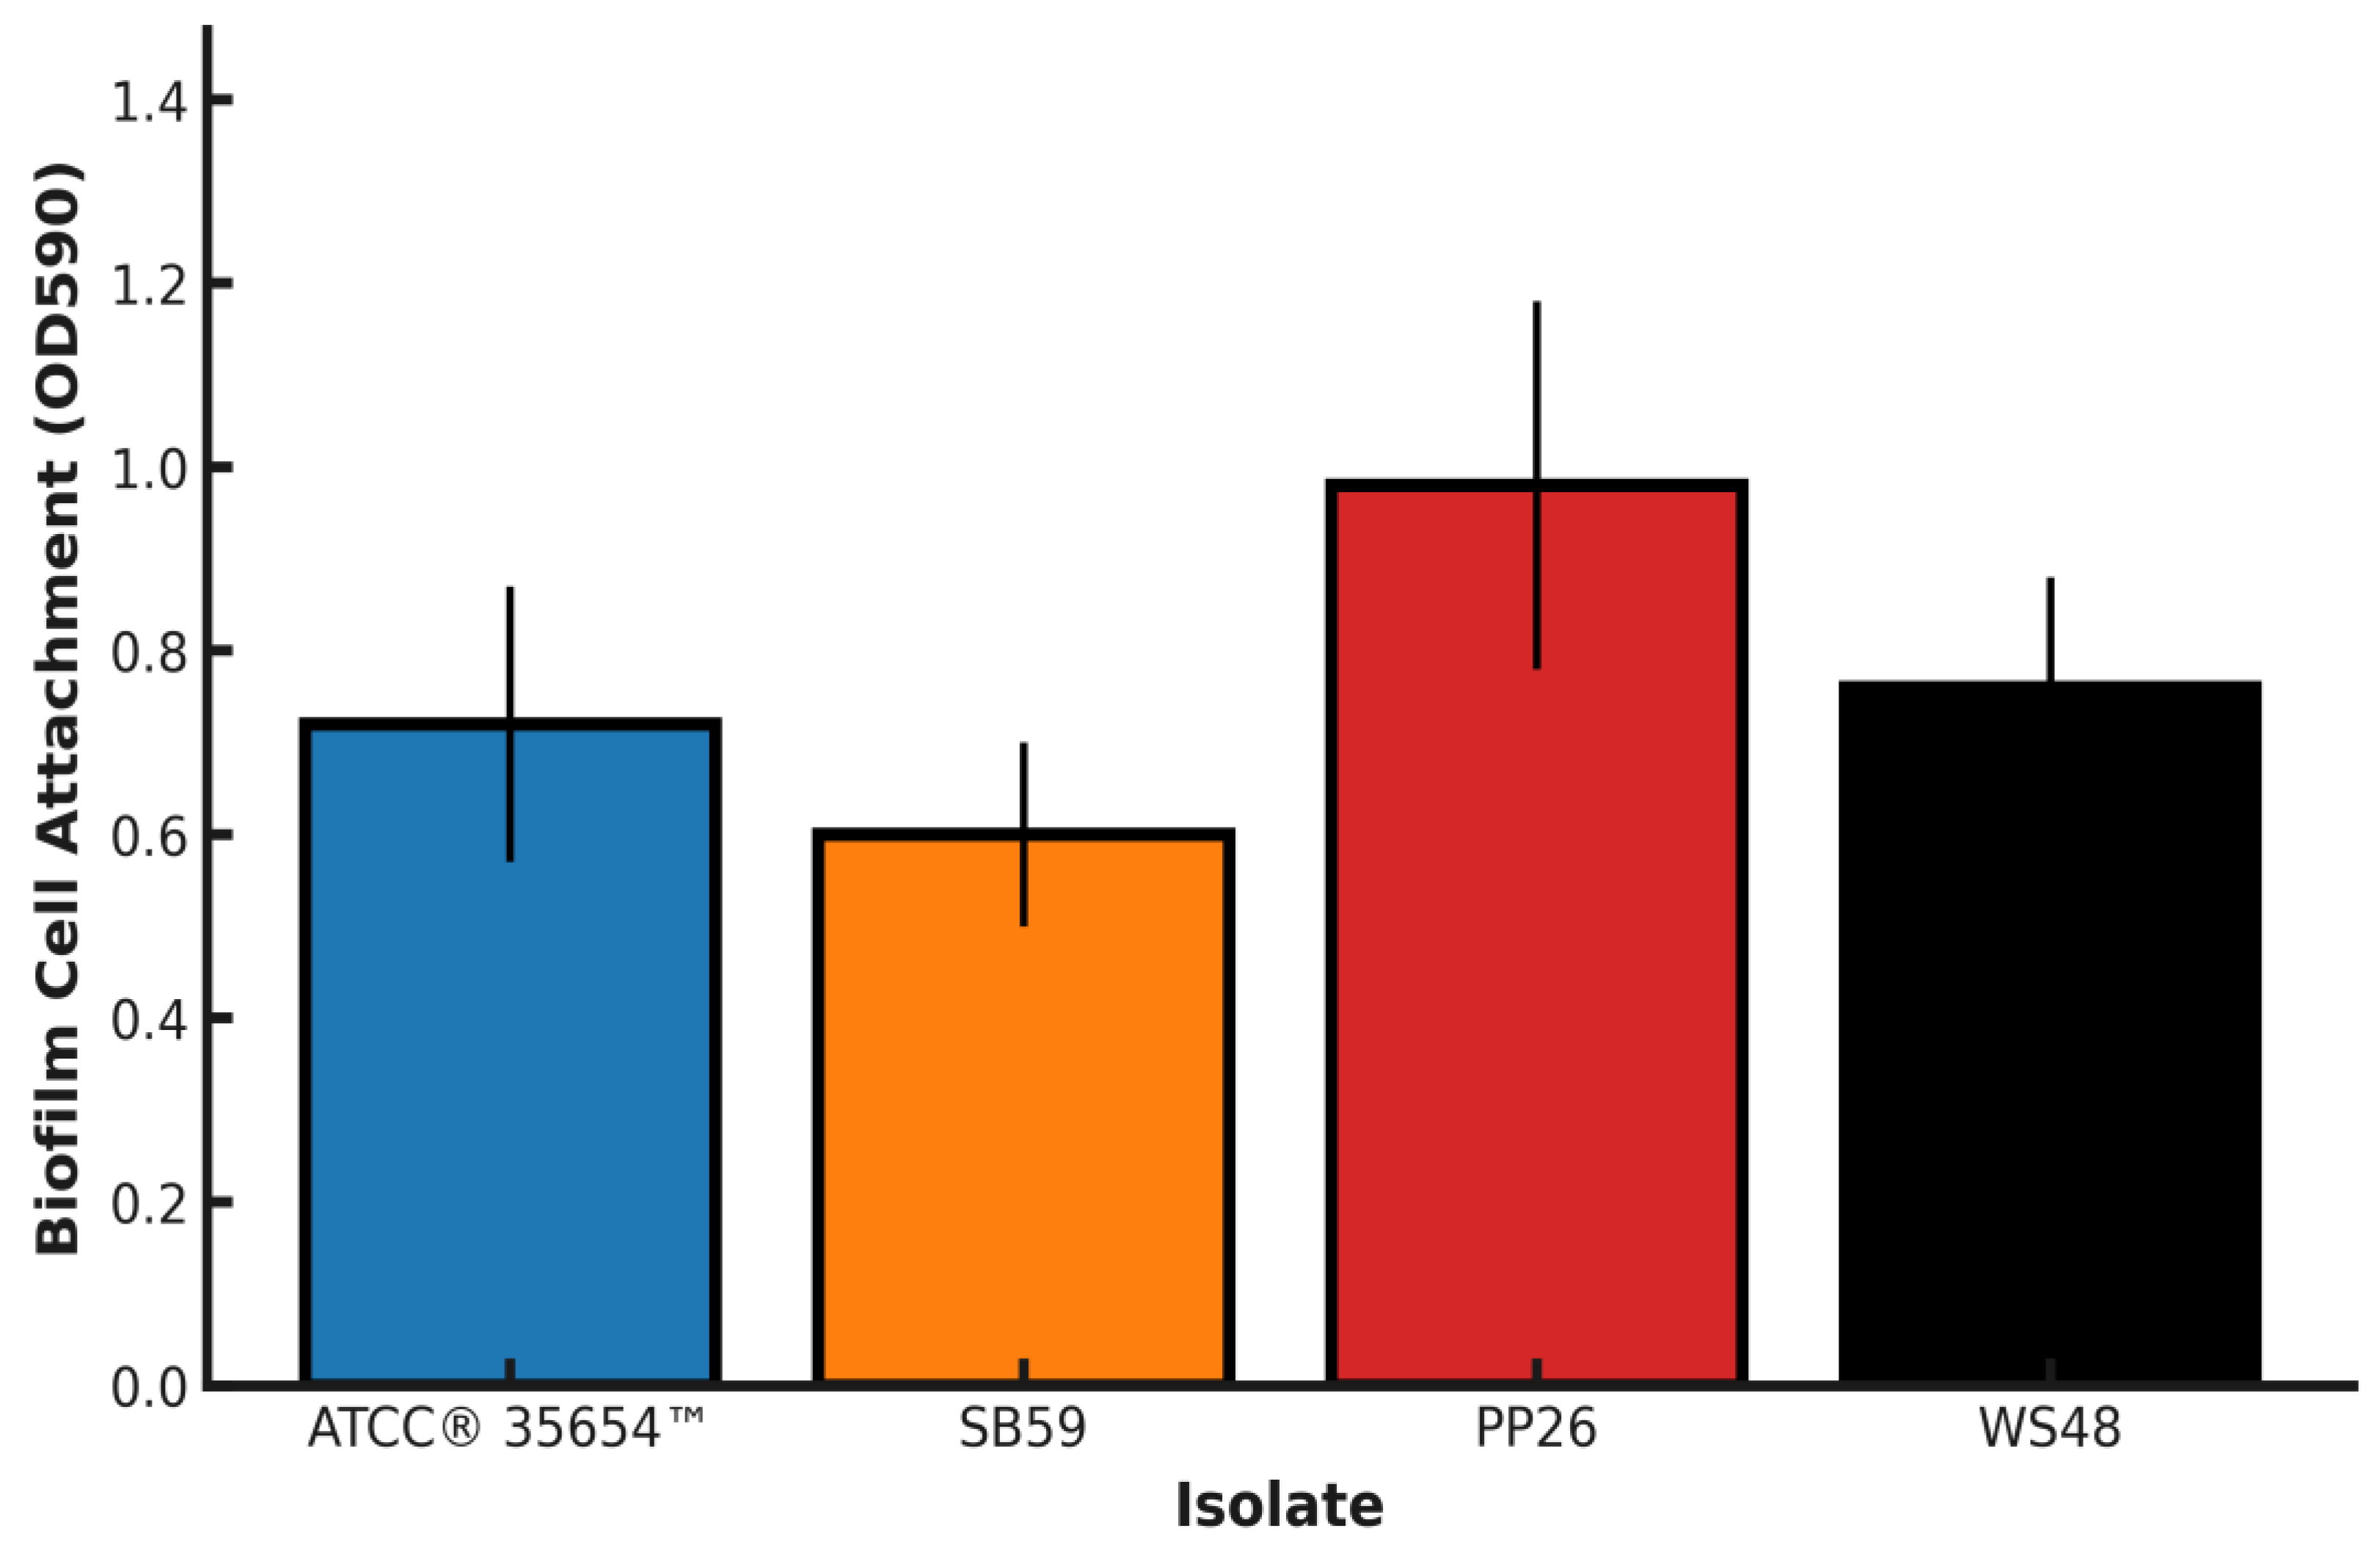
Figure 6.
Kaplan–Meier survival across inoculum doses of A. hydrophila. Lines show survival over 7 days for control and 10⁴–10⁸ CFU/mL; right labels indicate day-7 survival (%). n per group, route, and environmental parameters are in Methods.
Figure 6.
Kaplan–Meier survival across inoculum doses of A. hydrophila. Lines show survival over 7 days for control and 10⁴–10⁸ CFU/mL; right labels indicate day-7 survival (%). n per group, route, and environmental parameters are in Methods.
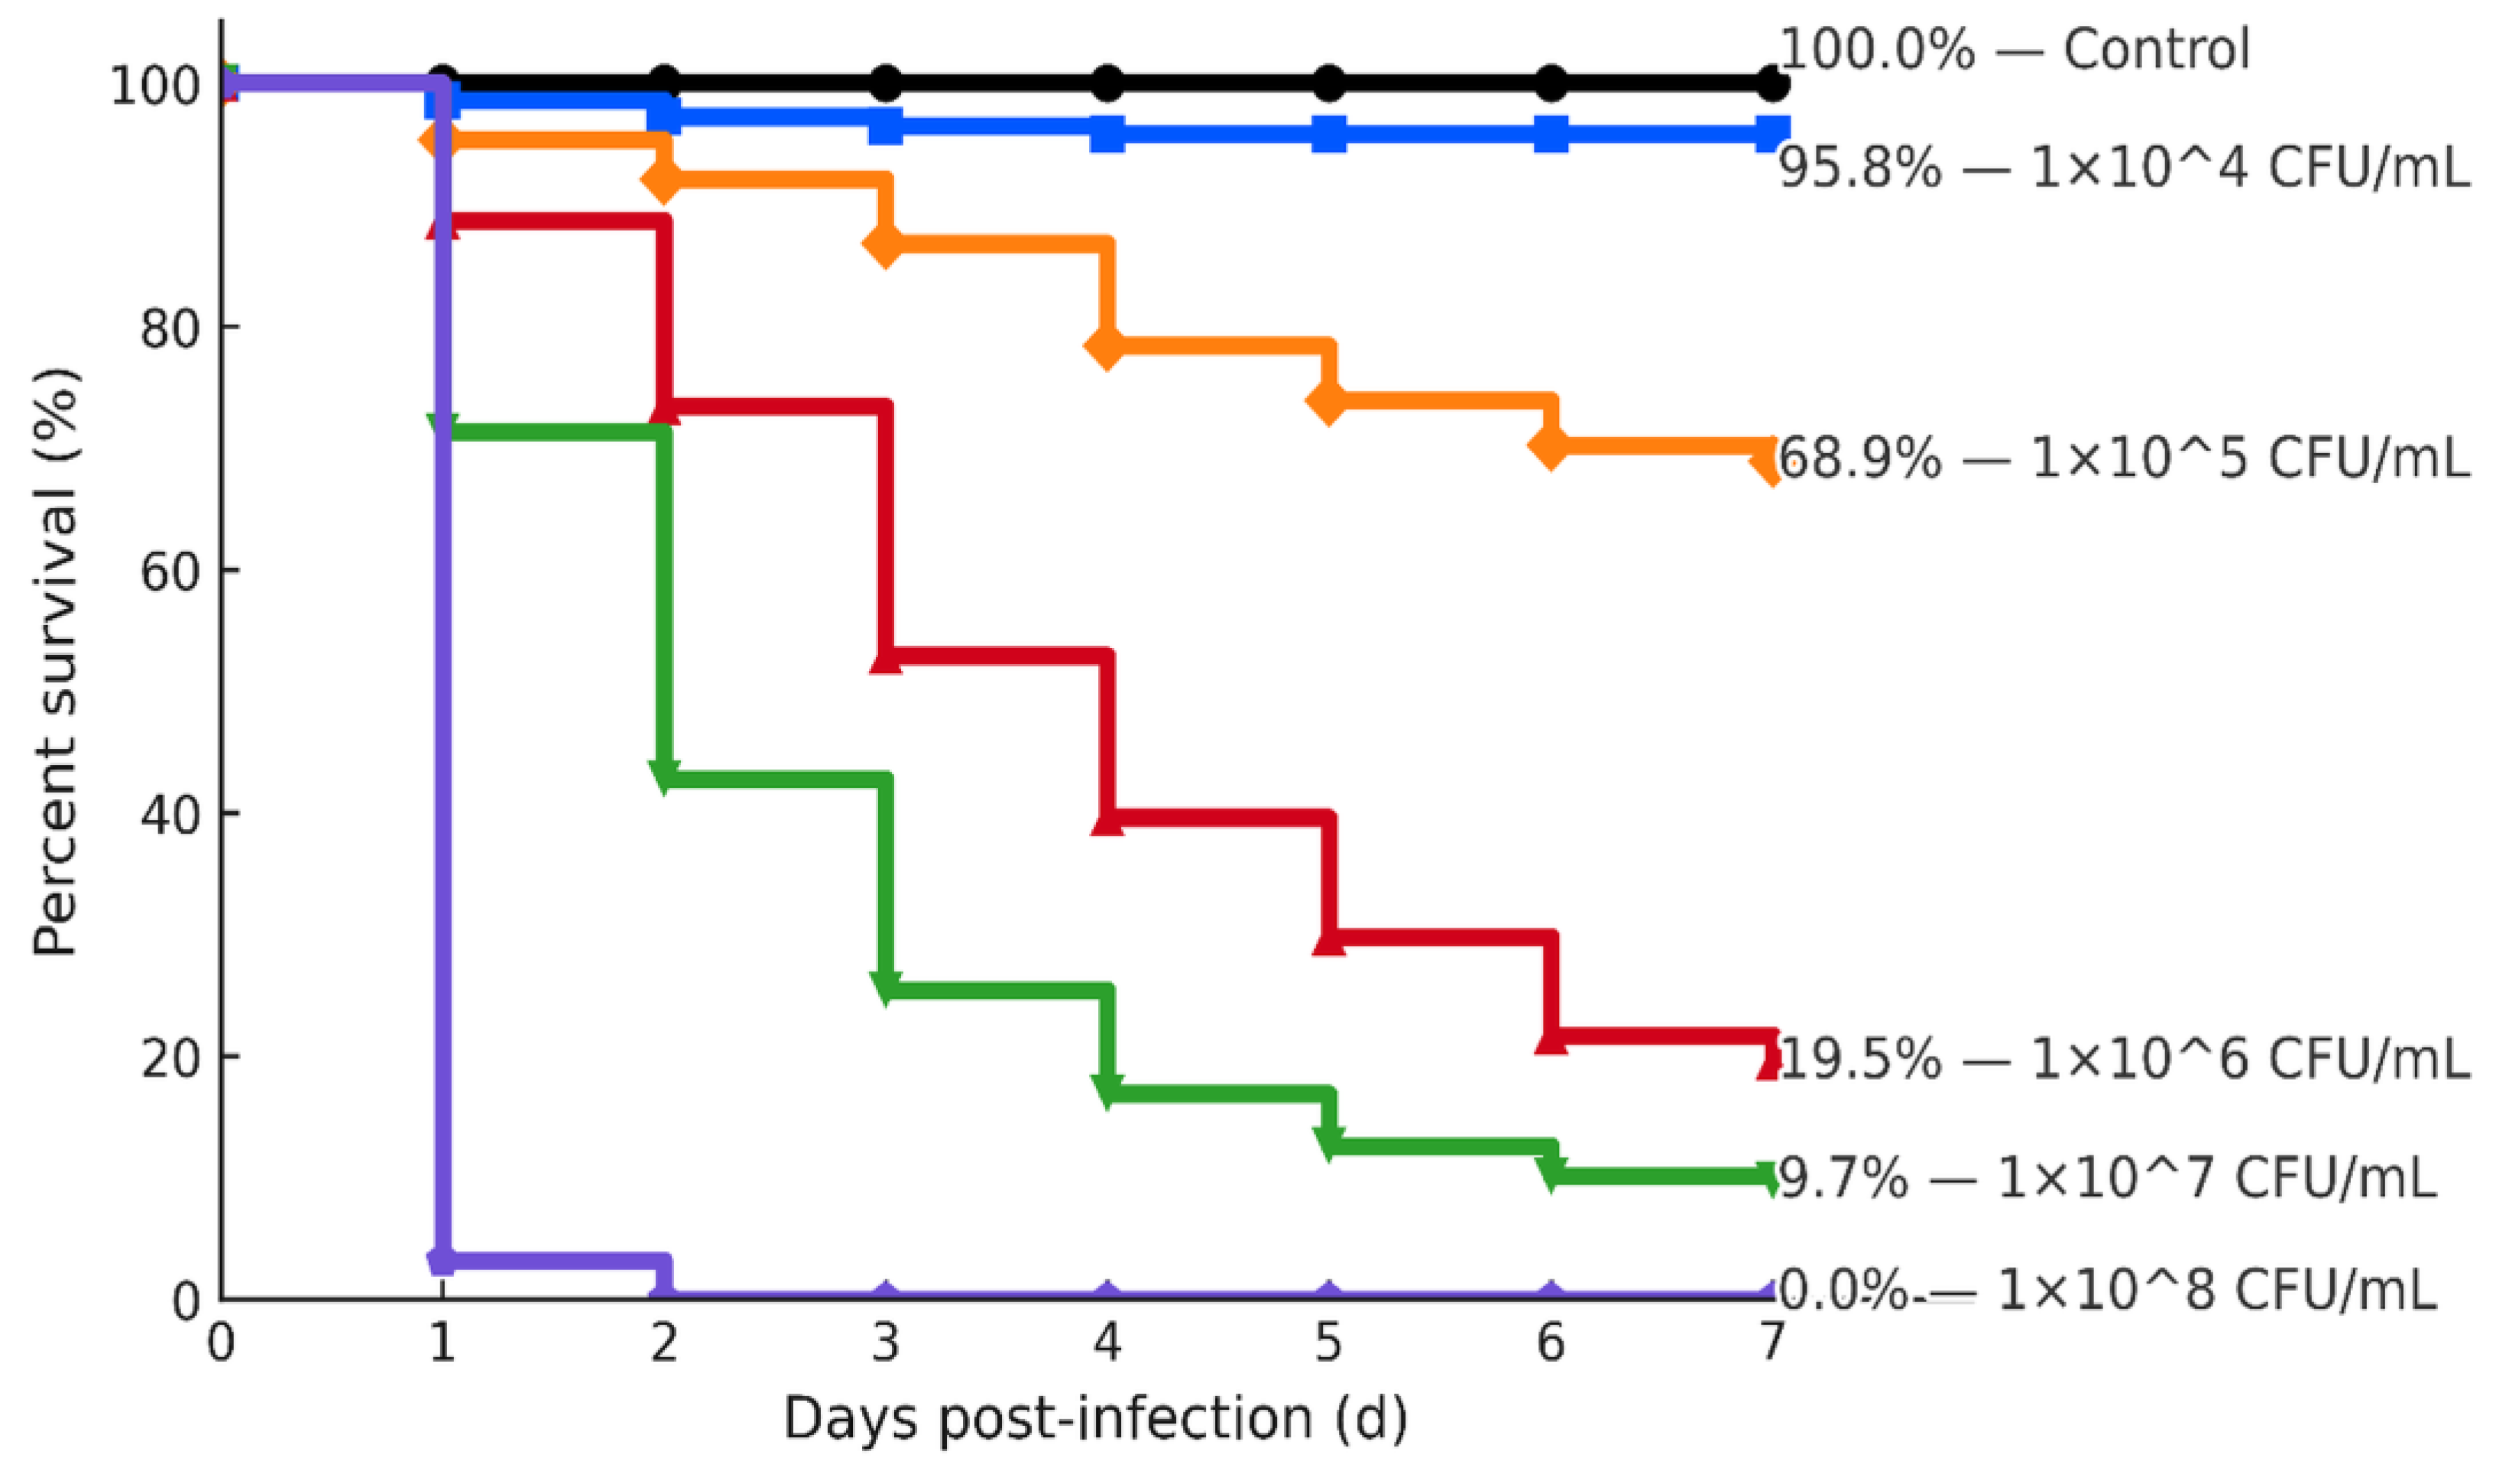

Table 1.
Housekeeping gene primers and cycling parameters.
| Target | Primer (name) |
Sequence (5′→3′) | Amplicon (bp) | Annealing (°C) | Reference† |
|---|---|---|---|---|---|
| gyrB | Forward (gyrB3F) | TCCGGCGGTCTGCACGGCGT | ~1100 | 55 | Yáñez et al., [25]; Korczak et al., [26] |
| Reverse (gyrB14R) | TTGTCCGGGTTGTACTCGTC | ||||
| rpoB | Forward (PasrpoB-L) | GCAGTSGAAAGARTTCTTTGTTC | ~560 | 54 | Korczak et al., [26] |
| Reverse (RpoB-R) |
GTTGCATGTTNGNACCCAT | ||||
| 16S rRNA | Forward (27F/27f-CM) | AGAGTTTGATCMTGGCTCAG | ~1500 | 56 | Morandi et al [23] |
| Reverse (1492R) | TACGGYTACCTTGTTACGACTT |
Table 2.
Regional prevalence of clinical signs in gourami (STRICT main analysis).
| Clinical sign | Mojokerto x/N (%) | Surabaya x/N (%) | Pasuruan x/N (%) | Blitar x/N (%) | Sidoarjo x/N (%) | Monte Carlo p (FDR q) | Overall (x/N, % [95% CI]) |
|---|---|---|---|---|---|---|---|
| N (fish examined) | N = 20 | N = 35 | N = 20 | N = 164 | N = 40 | , | N = 279 |
| Hemorrhagic lesions | 5/20 (25.0%) | 7/35 (20.0%) | 6/20 (30.0%) | 29/164 (17.7%) | 10/40 (25.0%) | 0.6222 (0.6283) | 57/279 (20.4%) [16.1–25.5] |
| Exophthalmia | 4/20 (20.0%) | 5/35 (14.3%) | 0/20 (0.0%) | 28/164 (17.1%) | 9/40 (22.5%) | 0.2588 (0.3926) | 46/279 (16.5%) [12.6–21.3] |
| Skin ulcers/ open wounds |
1/20 (5.0%) | 4/35 (11.4%) | 8/20 (40.0%) | 20/164 (12.2%) | 2/40 (5.0%) | 0.0031 (0.0132) | 35/279 (12.5%) [9.2–16.9] |
| Fin erosion | 0/20 (0.0%) | 0/35 (0.0%) | 2/20 (10.0%) | 15/164 (9.1%) | 6/40 (15.0%) | 0.1021 (0.2211) | 23/279 (8.2%) [5.6–12.1] |
| Scale loss/ desquamation |
0/20 (0.0%) | 10/35 (28.6%) | 0/20 (0.0%) | 21/164 (12.8%) | 0/40 (0.0%) | 0.0004 (0.0059) | 31/279 (11.1%) [7.9–15.3] |
| Renal swelling | 6/20 (30.0%) | 0/35 (0.0%) | 3/20 (15.0%) | 22/164 (13.4%) | 7/40 (17.5%) | 0.0305 (0.0991) | 38/279 (13.6%) [10.1–18.1] |
| Intestinal hemorrhage | 0/20 (0.0%) | 3/35 (8.6%) | 0/20 (0.0%) | 18/164 (11.0%) | 0/40 (0.0%) | 0.0505 (0.1312) | 21/279 (7.5%) [5.0–11.2] |
| Ascites (abdominal fluid) | 1/20 (5.0%) | 1/35 (2.9%) | 1/20 (5.0%) | 9/164 (5.5%) | 5/40 (12.5%) | 0.4428 (0.5233) | 17/279 (6.1%) [3.8–9.5] |
| Digestive-tract damage | 0/20 (0.0%) | 1/35 (2.9%) | 0/20 (0.0%) | 0/164 (0.0%) | 0/40 (0.0%) | 0.1298 (0.2412) | 1/279 (0.4%) [0.1–2.0] |
| Sluggish swimming | 2/20 (10.0%) | 0/35 (0.0%) | 0/20 (0.0%) | 0/164 (0.0%) | 0/40 (0.0%) | 0.0027 (0.0132) | 2/279 (0.7%) [0.2–2.6] |
| Anorexia (loss of appetite) | 1/20 (5.0%) | 2/35 (5.7%) | 0/20 (0.0%) | 3/164 (1.8%) | 0/40 (0.0%) | 0.2996 (0.3926) | 6/279 (2.2%) [1.0–4.6] |
| Surface floating tendency | 0/20 (0.0%) | 0/35 (0.0%) | 0/20 (0.0%) | 3/164 (1.8%) | 0/40 (0.0%) | 0.6283 (0.6283) | 3/279 (1.1%) [0.4–3.1] |
| Bubbling via operculum | 0/20 (0.0%) | 2/35 (5.7%) | 0/20 (0.0%) | 2/164 (1.2%) | 1/40 (2.5%) | 0.3020 (0.3926) | 5/279 (1.8%) [0.8–4.1] |
Table 3.
Biochemical characteristics of A. hydrophila.
| Parameter | Result of biochemical test |
|---|---|
| Colony morphology | Cream, Circular, Convex, Entire, Echinulate |
| Gram stain | Gram Negative |
| Shape | rod |
| O/F | Fermentative |
| Motility | motile |
| Oxidase, Catalase, Methyl Red (MR), Simmons citrate, Gelatinase, Arginine dihydrolase (ADH), Lysine decarboxylase (LDH). | + |
| 6.5% NaCl growth, Ornithine decarboxylase (ODC), Urease, H₂S production; Vibriostatic O/129 (10/150 µg) | - |
| TSIA | A/A, G |
| Acid production from: | |
| - D - Glucose, D-Galaktose, Lactose, Maltose, D-Mannitol, D-Mannose, and Sucrose |
+ |
| - Dulcitol, Raffinose, D-Sorbitol, D-Xylose, Inositol, and Inulin |
- |
Table 4.
Gene-based identification of Aeromonas isolates: percent identity and coverage across three loci (Species call = A. hydrophila).
Table 4.
Gene-based identification of Aeromonas isolates: percent identity and coverage across three loci (Species call = A. hydrophila).
| Isolate | 16S rRNA (%ID) | 16S (%Cov) | rpoB (%ID) | rpoB (%Cov) | gyrB (%ID) | gyrB (%Cov) | Species call |
|---|---|---|---|---|---|---|---|
| WS38 | 99.49 | 99 | 99.24 | 99 | 98.23 | 98 | A. hydrophila |
| TM25 | 99.58 | 99 | 99.05 | 99 | 98.88 | 98 | A. hydrophila |
| KS77 | 99.59 | 99 | 99.85 | 99 | 98.25 | 98 | A. hydrophila |
| PP26 | 99.38 | 99 | 99.43 | 99 | 98.3 | 98 | A. hydrophila |
| GB59 | 99.29 | 99 | 99.64 | 99 | 98.98 | 98 | A. hydrophila |
| SB59 | 99.35 | 99 | 99.45 | 99 | 98.05 | 98 | A. hydrophila |
| SB66 | 99.44 | 99 | 99.8 | 99 | 98.75 | 98 | A. hydrophila |
| SS26 | 99.18 | 99 | 99.1 | 99 | 98.3 | 98 | A. hydrophila |
| WS48 | 99.63 | 99 | 99.6 | 99 | 98.2 | 98 | A. hydrophila |
Note: Species calls finalized as A. hydrophila based on high 16S identity (≈99.2–99.6%), strong gyrB identity (≈98.0–99.0%), and multilocus phylogeny; any prior discordant rpoB should be repeated from a fresh colony, but does not alter the assignment.
Table 5.
Comparative performance benchmarks for gyrB, rpoB, and 16S rRNA in species-level concordance and fine-scale phylogenetic resolution (A. hydrophila).
Table 5.
Comparative performance benchmarks for gyrB, rpoB, and 16S rRNA in species-level concordance and fine-scale phylogenetic resolution (A. hydrophila).
| Metric | gyrB | 16S rRNA | rpoB |
|---|---|---|---|
| Species-level concordance to reference (%) | ≥95–100 | 70–85 | 90–97 |
| Median UFBoot at species node (ML) | 95–100 | 70–90 | 93–100 |
| Median BPP at species node (BI) | 0.98–1.00 | 0.85–0.98 | 0.98–1.00 |
| No. of well-supported subclades | 3–5 | 1–2 | 3–4 |
| Misassignment correction (n/N) | 0–1/N | 1–3/N | 0–1/N |
Noted: UFBoot = ultrafast bootstrap; BPP = Bayesian posterior probability; N = number of isolates.
Table 6.
Aggregate antimicrobial susceptibility of A. hydrophila isolates (n=9) from giant gourami (Osphronemus goramy).
Table 6.
Aggregate antimicrobial susceptibility of A. hydrophila isolates (n=9) from giant gourami (Osphronemus goramy).
| Antimicrobial agent (number of strains tested) | Abbrev | Drug class | AST disk content | Susceptible n (%) | Intermediate n (%) | Resistant n (%) |
|---|---|---|---|---|---|---|
| Chloramphenicol (9) | CHL | Amphenicol | 30 µg | 0 (0.00) | 3 (33.33) | 6 (66.67) |
| Streptomycin (9) | STR | Aminoglycoside | 10 µg | 0 (0.00) | 0 (0.00) | 9 (100.00) |
| Tetracycline (9) | TET (TE) | Tetracycline | 30 µg | 4 (44.44) | 0 (0.00) | 5 (55.56) |
| Amoxicillin (9) | AMX (AML) | β-lactam – Aminopenicillin | 25 µg | 1 (11.11) | 4 (44.44) | 4 (44.44) |
| Ampicillin (9) | AMP | β-lactam – Aminopenicillin | 10 µg | 0 (0.00) | 0 (0.00) | 9 (100.00) |
| Ciprofloxacin (9) | CIP | Fluoroquinolone | 5 µg | 9 (100.00) | 0 (0.00) | 0 (0.00) |
| Azithromycin (9) | AZM | Macrolide (Azalide) | 15 µg | 0 (0.00) | 0 (0.00) | 9 (100.00) |
| Penicillin G (benzylpenicillin) (9) | PEN (P) | β-lactam – Natural penicillin | 10 U | 0 (0.00) | 0 (0.00) | 9 (100.00) |
| Doxycycline (9) | DOX (DO) | Tetracycline | 30 µg | 7 (77.78) | 0 (0.00) | 2 (22.22) |
| Rifampicin (9) | RIF | Rifamycin | 5 µg | 0 (0.00) | 0 (0.00) | 9 (100.00) |
| Erythromycin (9) | ERY (E) | Macrolide | 15 µg | 2 (22.22) | 2 (22.22) | 5 (55.56) |
| Cefixime (9) | CFM | Cephalosporin | 5 µg | 0 (0.00) | 0 (0.00) | 9 (100.00) |
| Clindamycin (9) | CLI (DA) | Lincosamide | 2 µg | 0 (0.00) | 0 (0.00) | 9 (100.00) |
| Cefadroxil (9) | CFD | Cephalosporin | 30 µg | 0 (0.00) | 0 (0.00) | 9 (100.00) |
| Gentamicin (9) | GEN (CN) | Aminoglycoside | 10 µg | 2 (22.22) | 0 (0.00) | 7 (77.78) |
| Novobiocin (9) | NB | Aminocoumarin (GyrB inhibitor) | 5 µg | 0 (0.00) | 0 (0.00) | 9 (100.00) |
| Vancomycin (9) | VAN (VA) | Glycopeptide | 30 µg | 0 (0.00) | 0 (0.00) | 9 (100.00) |
| Oxytetracycline (9) | OXT (OT) | Tetracycline | 30 µg | 5 (55.56) | 0 (0.00) | 4 (44.44) |
Table 7.
Distribution of antibiotic resistance (%) of A. hydrophila isolates and MAR index.
| Bacterial Code | Isolates Source | No. of Resistant Antibiotics | Resistance Profile | Number of Antibiotic Classes | MAR Index | Stance Level |
|---|---|---|---|---|---|---|
| WS38 | Gouramy | 10 | STR, AMP, AZM, P, RIF, CFM, CLI, CFD, NB, VAN | 9 | 0.556 | MDR |
| TM25 | Gouramy | 10 | STR, AMP, AZM, P, RIF, CFM, CLI, CFD, NB, VAN | 9 | 0.556 | MDR |
| KS77 | Gouramy | 11 | STR, AMP, AZM, P, RIF, CFM, CLI, CFD, GEN, NB, VAN | 9 | 0.611 | MDR |
| PP26 | Gouramy | 12 | CHL, STR, AMP, AZM, P, RIF, CFM, CLI, CFD, GEN, NB, VAN | 10 | 0.667 | MDR |
| GB59 | Gouramy | 14 | CHL, STR, TET, AMP, AZM, P, RIF, ERY, CFM, CLI, CFD, GEN, NB, VAN | 12 | 0.778 | MDR |
| SB59 | Gouramy | 16 | CHL, STR, TET, AMX, AMP, AZM, P, RIF, ERY, CFM, CLI, CFD, GEN, NB, VAN, OXT | 12 | 0.889 | MDR |
| SB66 | Gouramy | 16 | CHL, STR, TET, AMX, AMP, AZM, P, RIF, ERY, CFM, CLI, CFD, GEN, NB, VAN, OXT | 12 | 0.889 | MDR |
| SS26 | Gouramy | 17 | CHL, STR, TET, AMX, AMP, AZM, P, DOX, RIF, ERY, CFM, CLI, CFD, GEN, NB, VAN, OXT | 12 | 0.944 | MDR |
| WS48 | Gouramy | 17 | CHL, STR, TET, AMX, AMP, AZM, P, DOX, RIF, ERY, CFM, CLI, CFD, GEN, NB, VAN, OXT | 12 | 0.944 | MDR |
Note: MAR = #Resistant/#Tested; Intermediate (I) is not counted as Resistant (R). Population mean MAR (18-drug panel) = 0.759 (=123/(9 isolates × 18 drugs)). Adjusted mean MAR (subset: CIP, DOX, TET, OXT, GEN, CHL) = 0.489. Abbrev: CHL chloramphenicol; STR streptomycin; TET tetracycline; AMX amoxicillin; AMP ampicillin; CIP ciprofloxacin; AZM azithromycin; P penicillin G; DOX doxycycline; RIF rifampicin; ERY erythromycin; CFM cefixime; CLI clindamycin; CFD cefadroxil; GEN gentamicin; NB novobiocin; VAN vancomycin; OXT oxytetracycline.
Disclaimer/Publisher’s Note: The statements, opinions and data contained in all publications are solely those of the individual author(s) and contributor(s) and not of MDPI and/or the editor(s). MDPI and/or the editor(s) disclaim responsibility for any injury to people or property resulting from any ideas, methods, instructions or products referred to in the content. |
© 2025 by the authors. Licensee MDPI, Basel, Switzerland. This article is an open access article distributed under the terms and conditions of the Creative Commons Attribution (CC BY) license (http://creativecommons.org/licenses/by/4.0/).
Copyright: This open access article is published under a Creative Commons CC BY 4.0 license, which permit the free download, distribution, and reuse, provided that the author and preprint are cited in any reuse.


