
Submitted:
10 September 2025
Posted:
11 September 2025
You are already at the latest version
Abstract
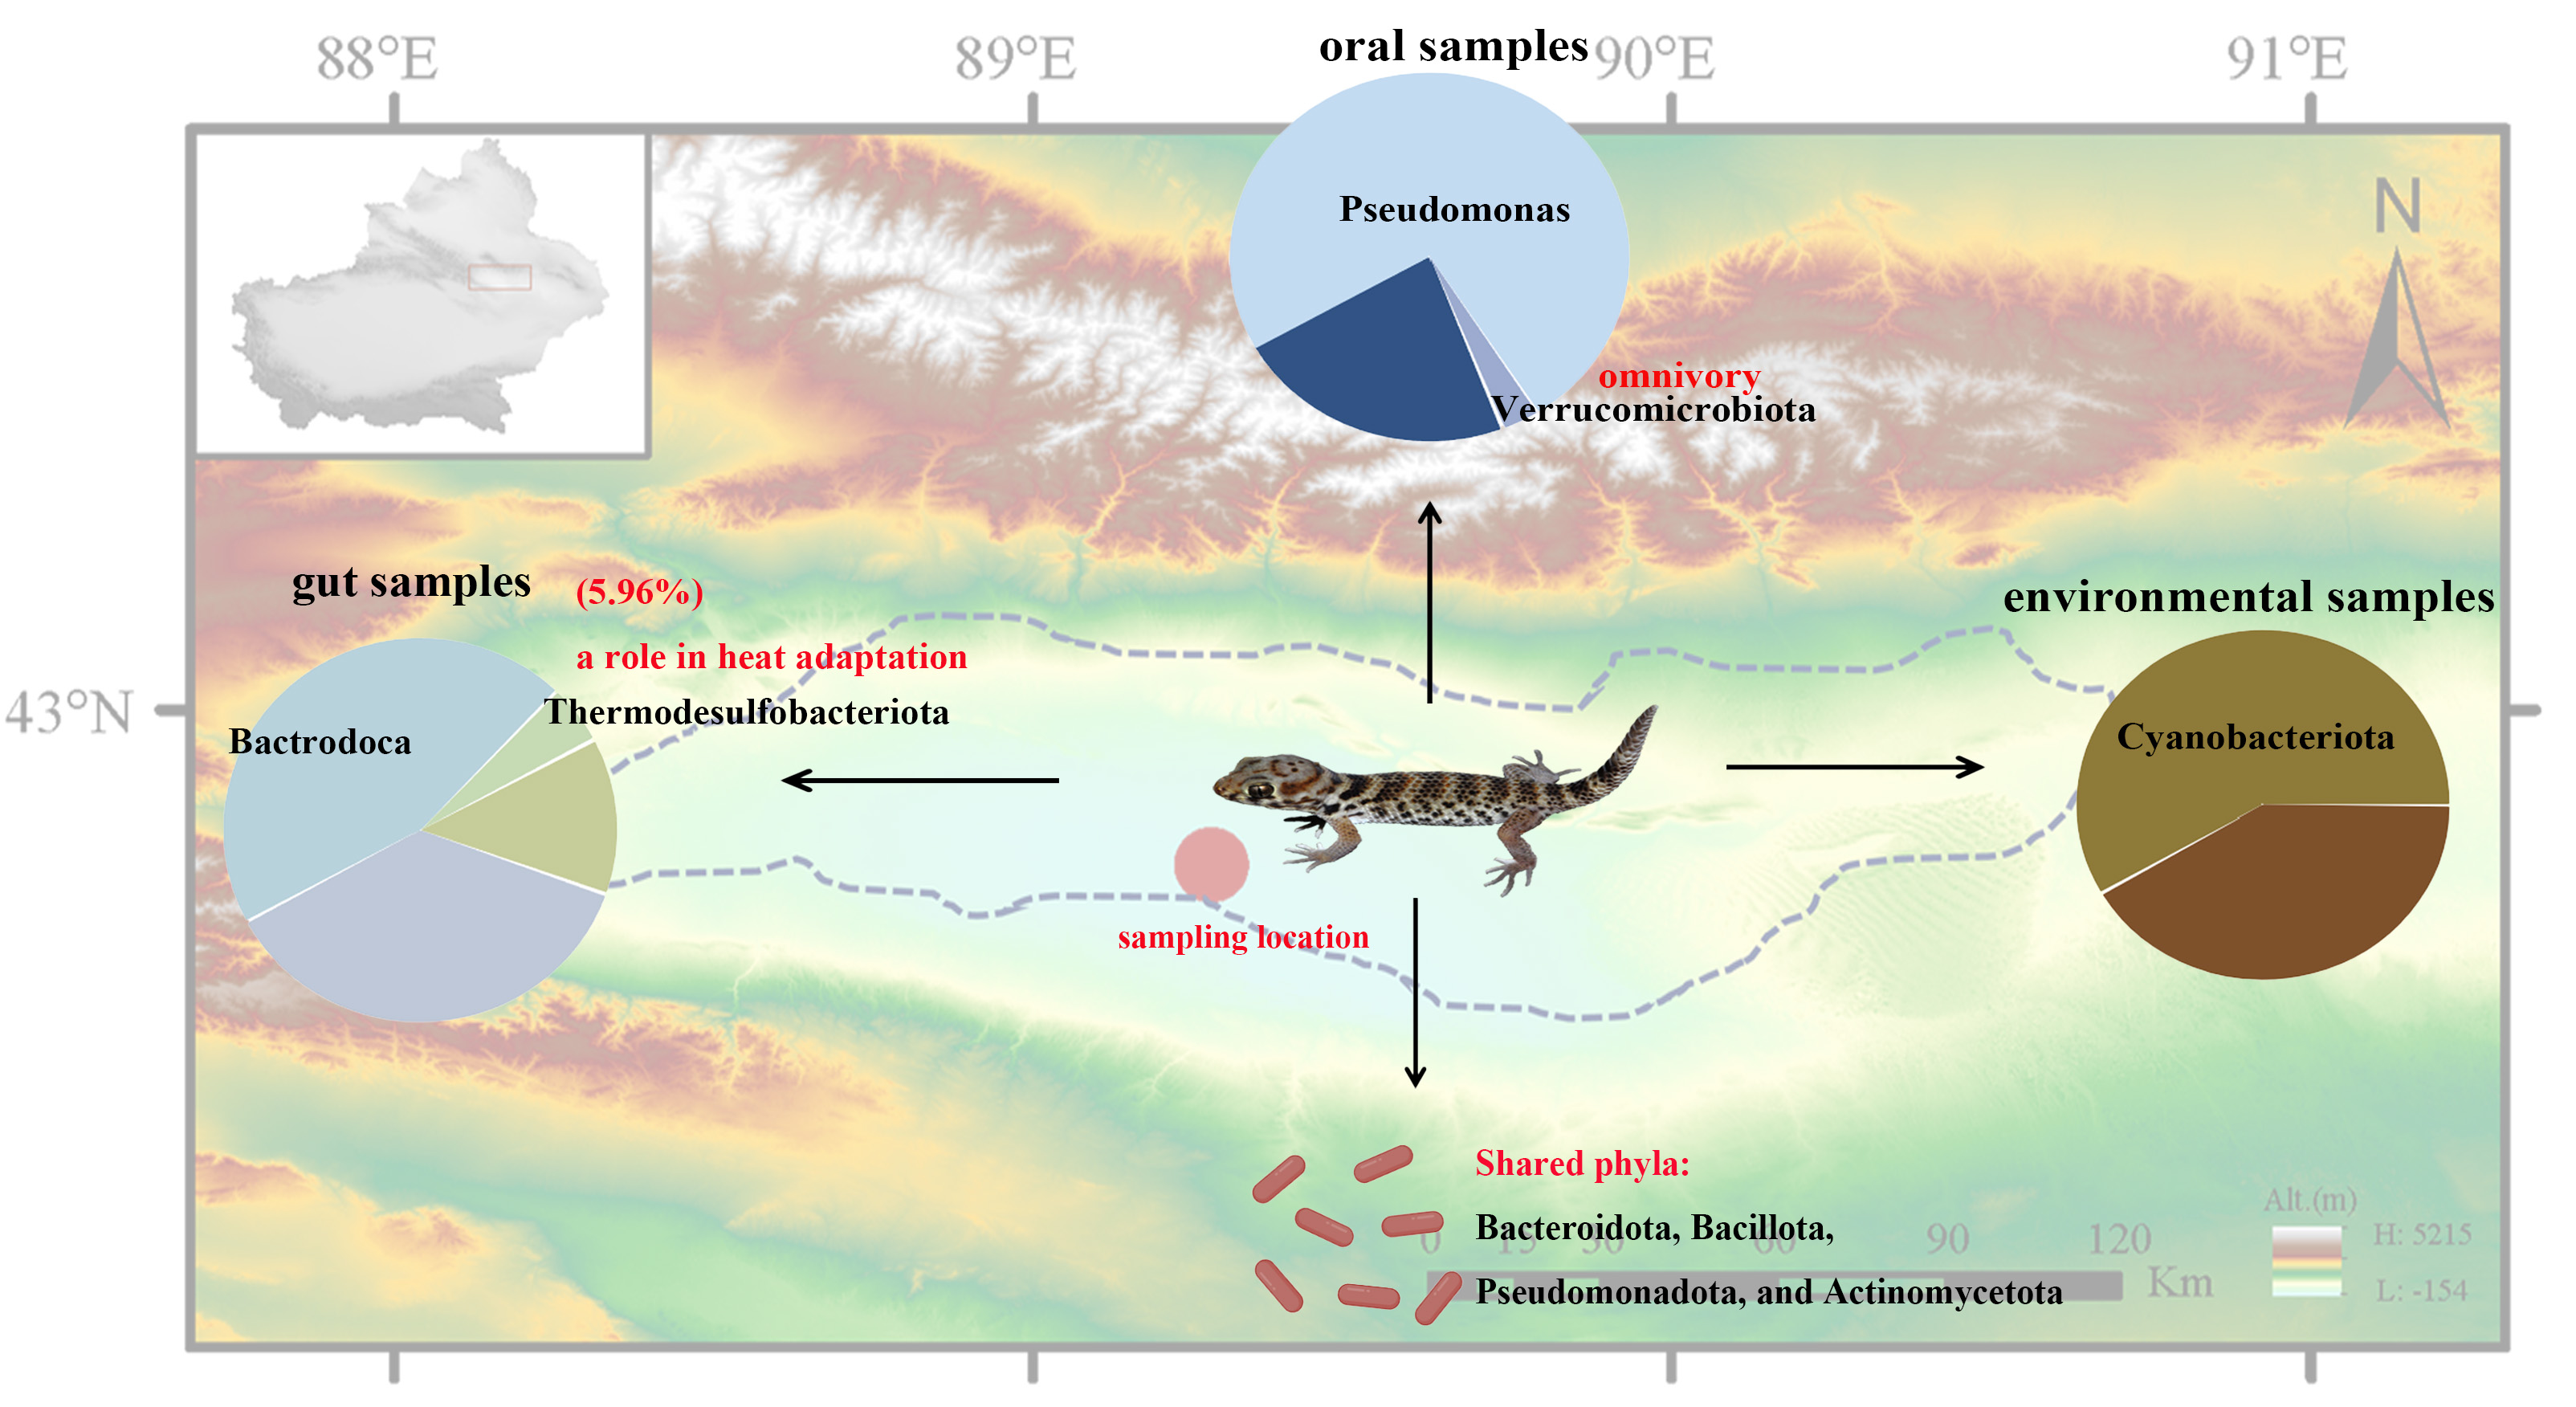
The microbial communities of desert-dwelling reptiles, such as lizards, are crucial for host health and adaptation but remain understudied. This study used 16S rRNA sequencing to analyze the guts, oral cavities, and environments of the Turpan Wonder Gecko (Teratoscincus roborowskii) from the desert area in the Turpan Depression of China. The results showed distinct microbial profiles across these niches. The gut microbiota exhibited the highest diversity, dominated by Bacteroidota and thermophilic Thermodesulfobacteriota, suggesting heat adaptation. The oral cavity was enriched with Pseudomonadota and Verrucomicrobiota, possibly linked to its omnivorous diet. Environmental samples were mainly Cyanobacterota. Functional predictions indicated gut microbes specialized in carbohydrate metabolism, while oral microbes might aid xenobiotic degradation. This study provides the first comprehensive microbial profile of T. roborowskii, offering insights into its adaptation to extreme desert ecosystems.
Keywords:
Microbial communities
; 16S rRNA
; Desert adaptation
; Teratoscincus roborowskii
; Functional profiling
1. Introduction
Microbial communities play fundamental roles in host physiology [1]1 and ecosystem functioning [2,3,4,5], yet our understanding of reptilian microbiota, particularly in extreme environments, remains limited [6,7]. While mammalian, avian, and fish microbiomes have been extensively characterized, lizards – representing over 7,800 species worldwide [8] – have received comparatively little attention. This knowledge gap is particularly pronounced for species inhabiting extreme environments, where host-microbe interactions may be crucial for survival.
The gut microbiota is recognized as a key contributor to host nutrition [9], immune function [10], and environmental adaptation [7,11,12]. In reptiles, microbial communities are known to vary with factors such as diet [13], temperature [14], and habitat [6,15,16], suggesting they may play important roles in ecological adaptation. However, comprehensive studies integrating multiple body sites and their environments remain scarce.
Teratoscincus roborowskii (Turpan Wonder Gecko) presents an ideal model to investigate microbiome adaptations to extreme conditions. Endemic to the hyperarid Turpan Depression in Northwest China, this species thrives in one of the hottest and driest environments on Earth [17]. In this region, the average elevation is only −95 ~ −76 meters, the average annual precipitation is mere 16.4 mm, and the annual evaporation rate is astounding 3000 mm. The extreme high temperature can reach 49.6°C, and the max-imum surface temperature in summer can soar to 80°C. While previous studies have examined its ecology (e,g., [17,18]), biogeography (e.g., [19]) and genetics (e.g., [20]), with a recent study on the impact of seasonal dietary influences on the gut microbiota [21], its microbial communities ‒ potentially critical for desert adaptation ‒ remain nearly uncharacterized.
This study addresses this gap by profiling bacterial communities in the gut, oral cavity, and environment of T. roborowskii using 16S rRNA sequencing. We specifically aimed to: (i) compare microbial diversity and composition across niches, (ii) identify habitat-specific microbial signatures, and (iii) predict functional differences between communities. Our findings advance understanding of microbiome-mediated adaptations in extreme environments and establish a foundation for future studies of desert-adapted species.
2. Materials and Methods
2.1. Sample Collection
On 10 June 2023, nine T. roborowskii geckos were captured (42.7769°N, 89.2831°E, 144 m below sea level) in the Turpan Depression, Xinjiang, China, during their peak activity hours (23:00‒01:00) and fresh fecal pellets were collected during the fasting period (Figure 1). They were located using flashlight-induced eyeshine detection. After recording the gecoks’ sex, location, and developmental stage, fecal samples (FB) were collected by placing each gecko in a sterile container and monitoring it every two hours. Fresh feces were then promptly transferred into labelled sterile EP tubes using sterile forceps and immediately frozen in liquid nitrogen to preserve sample integrity. Oral samples (KQ) were collected using sterile throat swabs and stored in the same way. Four environmental samples (HJ) from the geckos’ habitat were collected using the same sterile protocol. All samples were immediately frozen in liquid nitrogen. All geckos were confirmed to be in good physiological condition post-experiment and were released at the capture site in strict adherence to animal welfare regulations.
2.2. DNA Extraction
Genomic DNA was extracted from the total microbial community of each sample using the E.Z.N.a™ Mag \ Bind Soil DNA Kit (Omega, M5635-02, USA) according to the manufacturer’s instructions. The concentration of the extracted DNA was measured using a Qubit 3.0 fluorometer (Thermo Fisher Scientific, USA) to ensure that a sufficient amount of high-quality genomic DNA was obtained.
2.3. 16S rRNA Amplification and Sequencing
The V4–V5 hypervariable region of the bacterial 16S rRNA gene was targeted for amplification using universal primers 515F (GTGCCAGCMGCCGCGGTAA) and 907R (CCCCGYCAATTCMTTTRAGT) [22] in a 30-µL reaction volume containing 10–20 ng DNA template, 1 µL of each primer (10 µM), 15 µL 2× Hieff® Robust PCR Master Mix (Yeasen, China), and nuclease-free water. Amplification was performed in an Applied Biosystems 9700 thermal cycler using a two-step program: (1) initial denaturation at 94°C for 3 min; 5 cycles of 94°C for 30 s, 45°C for 20 s, 65°C for 30 s; then 20 cycles of 94°C for 20 s, 55°C for 20 s, 72°C for 30 s; final extension at 72°C for 5 min; followed by (2) 95°C for 3 min; 5 cycles of 94°C for 20 s, 55°C for 20 s, 72°C for 30 s; final extension at 72°C for 5 min. PCR products were verified via 2% agarose gel electrophoresis, purified using Hieff NGS™ DNA Selection Beads (Yeasen, China) to remove primer dimers, quantified by Qubit® dsDNA assay (Thermo Fisher) and bioanalyzer (Agilent 2100), pooled equimolarly, and sequenced on an Illumina MiSeq platform (Illumina, USA) by Sangon BioTech (Shanghai) after library construction with Illumina adaptors/indices..
2.4. Microbial Community Analysis Pipeline
Following Illumina MiSeq paired-end sequencing, reads were assembled using PEAR (v0.9.8; [23]) based on their overlap. The resulting FASTQ files were processed into FASTA/QUAL format [24] for downstream processing. Quality-controlled sequences were clustered into Operational Taxonomic Units (OTUs) at ≥97% similarity threshold using USEARCH (v11.0.667; [25]), with chimera removal (UCHIME algorithm) and exclusion of singleton OTUs to minimize artifacts. Bacterial OTUs were classified by BLAST against the Ribosomal Database Project (RDP; release 11.5; [26]) with a confidence threshold of 80%, while fungal OTUs were classified using the UNITE v8.3 ITS reference database [27]. The most abundant sequence within each OTU cluster was designated as the representative sequence for annotation.
2.5. Statistical Analysis
Alpha diversity indices (Chao1, Simpson, Shannon) and rarefaction curves were calculated based on OTU richness using Mothur (v3.8.31; [28]). To analyze the diversity and distribution of operational taxonomic units (OTUs) in our samples, we generated rank abundance curves using the statistical software R (v4.2.2; [29]). The rank abundance curves were calculated using the rankabundance function from the vegan package (v2.6-2; [30]), which sorts the OTUs by their abundance and assigns ranks. The resulting data were then visualized using the ggplot2 package (v3.3.6; [31]), a powerful tool for creating high-quality plots in R.
Within-sample (alpha) diversity comparisons between groups employed t-tests (two groups) or ANOVA (multiple groups). Beta diversity (between-sample differences) was analyzed via Principal Coordinate Analysis (PCoA), Non-metric Multidimensional Scaling (NMDS), and constrained Principal Component Analysis (PCA), visualized using the R vegan package (v2.5-6; [30]). Differential feature abundance between groups was identified using STAMP (v2.1.3; [32]) and LEfSe (v1.1.0; [33]). Microbial associations were assessed using SparCC (v1.1.0; [34]) to compute correlation coefficients and P-values, with results visualized as correlation heatmaps using the R corrplot package (v0.84; [35]). Co-occurrence networks were constructed using the R ggraph package (v2.2.1; [36]).
2.6. Function Prediction
Functional potential of bacterial and archaeal communities was predicted using PICRUSt (v1.1.4; [37]). This analysis inferred metabolic capabilities by comparing the obtained 16S rRNA gene sequencing data against a reference genome database of known functions. PICRUSt generated predictions for KEGG pathways (Kyoto Encyclopedia of Genes and Genomes) and COG pathways (Clusters of Orthologous Groups) to characterize the communities’ potential roles in metabolic processes.
3. Results
3.1. Evaluation of Microbial 16S rRNA Gene Sequencing
Rank Abundance Curves (Figure 2A) were analyzed to assess diversity, where the horizontal span reflects species richness (longer axis = higher richness) and the curve slope indicates evenness (flatter curve = greater evenness). The wide, gradually flattening curves observed demonstrate uniform sample composition and high species richness. Complementarily, rarefaction curves (Figure 2B) confirmed sequencing depth sufficiency, as the number of observed OTUs plateaued with increasing sequencing effort, indicating comprehensive sampling and data reliability for downstream analyses.
3.2. Microbial Diversity Analysis
Illumina MiSeq sequencing of 22 samples generated 2,068,798 raw reads (43,994–117,111 reads/sample; 350–472 bp length), yielding 2,004,305 high-quality sequences (31,155–165,806 reads/sample; avg. 372.04–375.71 bp) after QC. OTU clustering and annotation (26 phyla, 526 species) revealed 125 shared OTUs between oral and environmental groups, with 356, 238, and 93 unique OTUs in fecal, oral, and environmental groups, respectively (Figure 3G). Alpha diversity showed significantly higher richness (Ace, Chao1) and diversity (Shannon, Simpson) in the fecal group vs. oral/environmental groups (P < 0.001–0.05; Figure 3A-E), with coverage >99.9% (Figure 3F). Beta diversity (PCoA/NMDS; Figure 3H-I) confirmed distinct clustering of fecal, oral, and environmental communities, reflecting significant compositional differences (P<0.001). These results demonstrate the fecal microbiome’s uniquely high diversity and structural divergence.
3.3. Microbial Composition Across Habitats
Figure 4A shows the top 10 phyla with the highest content in fecal samples, oral samples and environmental samples. Fecal samples were dominated by Bacteroidota (44.07%) and Bacillota (32.02%), with notable contributions from Pseudomonadota (11.90%) and Thermodesulfobacteriota (5.96%). Oral samples exhibited extreme dominance of Pseudomonadota (73.03%), trailed distantly by Bacteroidota (10.11%) and Bacillota (7.09%), while environmental samples were overwhelmingly characterized by Cyanobacteriota (62.18%), supplemented by Actinomycetota (10.15%), unclassified bacteria (9.47%), and Pseudomonadota (7.78%). Minor phyla demonstrated niche preferences—Verrucomicrobiota was ubiquitous (fecal: 2.57%, oral: 2.77%, environmental: 0.13%), whereas Planctomycetota and Acidobacteriota showed higher oral prevalence (1.07% and 2.75%, respectively) versus near-absence elsewhere (<0.02%).
The top 10 class with the highest content in fecal samples, oral samples and environmental samples are shown in Figure 4B. Fecal samples were dominated by Bacteroidia (44.07%) and Clostridia (20.53%), with substantial contributions from Gammaproteobacteria (11.60%) and Bacilli (10.86%); oral samples showed overwhelming dominance of Alphaproteobacteria (50.14%) followed by Gammaproteobacteria (22.88%) and Bacteroidia (10.11%); while environmental samples were characterized by Cyanobacteriia (62.18%), supplemented by Actinobacteria (9.99%) and unclassified bacteria (9.47%). Cross-niche patterns emerged: Gammaproteobacteria appeared in all habitats (fecal: 11.60%, oral: 22.88%, environmental: 4.94%), Bacilli maintained moderate presence (fecal: 10.86%, environmental: 6.11%, oral: 3.16%), and Verrucomicrobiia showed fecal/oral prevalence (2.56–2.77% vs. environmental: 0.13%). Minor classes exhibited niche-specific distributions (e.g., Desulfovibrionia exclusive to feces: 5.96%; Acidobacteriae primarily oral: 2.31%).
The result in Figure 4C shows the top 10 order with the highest content in fecal samples, oral samples and environmental samples. Fecal samples were dominated by Bacteroidales (43.86%), with substantial contributions from Enterobacterales (11.32%), Oscillospirales (8.01%), and Lachnospirales (6.35%), alongside notable sulfate-reducing Desulfovibrionales (5.96%). Oral samples exhibited overwhelming dominance of Hyphomicrobiales (48.72%), followed by Enterobacterales (16.58%) and Bacteroidales (9.78%), while environmental samples were characterized by phototrophic Cyanobacteriales (62.15%), with significant unclassified bacteria (9.47%) and Micrococcales (9.38%). Cross-habitat patterns included the widespread presence of Enterobacterales (fecal: 11.32%, oral: 16.58%, environmental: 0.31%) and Bacteroidales (fecal: 43.86%, oral: 9.78%, environmental: 0.42%), whereas Hyphomicrobiales showed dual prominence in oral and environmental niches (48.72% vs. 1.94%), and Desulfovibrionales was exclusively abundant in feces (5.96%).
Figure 4D shows the top 10 families with the highest relative abundance in fecal samples, oral samples and environmental samples. Fecal samples were dominated by Bacteroidaceae (22.00%) and Tannerellaceae (9.00%), with significant contributions from Lachnospiraceae (6.33%) and sulfate-reducing Desulfovibrionaceae (5.96%), while oral samples showed exceptional dominance of Beijerinckiaceae (48.32%) alongside Enterobacteriaceae (14.00%). Environmental samples were overwhelmingly composed of unclassified Cyanobacteriales (62.15%) and unclassified bacteria (9.47%), with Microbacteriaceae (8.68%) as the only other major family. Cross-habitat comparisons revealed: (1) Enterobacteriaceae’s dual prominence in feces (5.60%) and oral samples (14.00%), (2) Moraxellaceae’s consistent presence across oral (2.96%) and environmental samples (2.71%), and (3) the exclusive fecal occurrence of SCFA-producing families (Lachnospiraceae, Ruminococcaceae). Notably, 62.15% of environmental sequences remained unclassified at the family level, highlighting uncultured microbial diversity in this niche.
Figure 4E shows the top 10 genera with the highest relative abundance in fecal samples, oral samples and environmental samples. Fecal samples were dominated by Bacteroides (22.0%) and sulfate-reducing Desulfovibrio (5.09%), with notable contributions from Parabacteriides (4.62%) and Morganella (4.49%), while oral samples showed remarkable dominance of Methylobacterium (48.31%) alongside Enterobacteriaceae-affiliated genera (unclassified_Enterobacteriaceae:10.46%, Escherichia/Shigella: 3.54%). Environmental samples were overwehelmingly composed of unclassified_Cyanobacterales (62.15%) and unclassified_Bacteria (9.47%), with Agromyces (8.63%) as the only major genus. Cross-habitat comparisons revealed: (1) Bacteroides’ prominence in feces (22.0%) versus oral samples (4.03%), (2) Acinetobacter’s dual presence in oral (2.55%) and environmental samples (2.61%), and (3) the exclusive environmental occurrence of Chryseobacterium (2.53%) and Brucella (1.19%). Strikingly, >70% of environmental sequences remained unclassified at genus level, underscoring the uncultured microbial diversity in this habitat.
The top 10 species with the highest content in fecal samples, oral samples and environmental samples are shown in Figure 4F. Fecal samples were dominated by unclassified_Bacteroides (20.97%) alongside unclassified_Desulfovibrio (5.09%) and pathogenic Morganella morganii (4.49%), demonstrating substantial taxonomic resolution gaps even for common gut microbes. Oral samples showed exceptional dominance of Methylobacterium jeotgali (48.30%) with notable enteric pathogens (unclassified_Escherichia-Shigella: 3.54%, Providencia rettgeri: 2.30%), while environmental samples remained predominantly unclassified (unclassified_Cyanobacteriales: 62.15%, unclassified_Bacteria: 9.47%). Cross-habitat patterns included: (1) Acinetobacter schindleri’s presence in both oral (1.96%) and environmental (0.14%) niches, (2) the exclusive fecal occurrence of unclassified_Parabacteroides (3.61%), and (3) the environmental specificity of Chryseobacterium taeanense (2.37%). Strikingly, 71.62% of environmental sequences and 20.97-5.31% of fecal sequences lacked species-level classification, highlighting substantial microbial dark matter across all habitats.
Twelve phyla were common to all groups, with Pseudomonadota showing dramatic niche variation (gut: 11.9%, oral: 73.0%, environmental: 7.8%), while Bacteroidota dominated gut samples (44.1%) and Actinomycetota peaked in environmental samples (10.1%). Among 60 shared families, Enterobacteriaceae exhibited oral preference (14.0% vs. gut: 5.6%), whereas Rikenellaceae (gut: 7.4%) and Lachnospiraceae (gut: 6.3%) remained primarily gut-associated. Only two of 90 shared genera maintained >0.1% abundance across all habitats: Escherichia/Shigella (oral:3.5%>gut:0.6%) and unclassified Enterobacteriaceae (oral:10.5% >gut:5.0%), highlighting both the enteric origin of shared taxa and the strong habitat filtering of microbial communities.
3.4. LEfSe Analysis
Linear discriminant effect size (LEfSe) analysis (LDA score >5) identified distinct biomarkers that validated and expanded upon the relative abundance trends: the gut microbiota was uniquely characterized by Bacteroidales (consistent with its 44.07% fecal dominance), while the oral microbiome showed specific enrichment of Pseudomonadota (matching its 73.03% oral prevalence), and environmental samples were distinctly marked by Cyanobacteriales (aligning with their 62.18% environmental abundance). These results not only confirmed the habitat-specific patterns observed in taxonomic composition analyses but also highlighted potential functional adaptations ‒ with Bacteroidales likely supporting gut metabolic functions, Pseudomonadota reflecting aerobic oral conditions, and Cyanobacteriales representing environmental photosynthetic niches. The robust concordance between LEfSe biomarkers and relative abundance data (Figure 4A-F/Figure 5B) reinforces the ecological specialization of microbial communities across these distinct habitats.
3.5. Functional Specialization Across Gut, Oral, and Environmental Microbiota
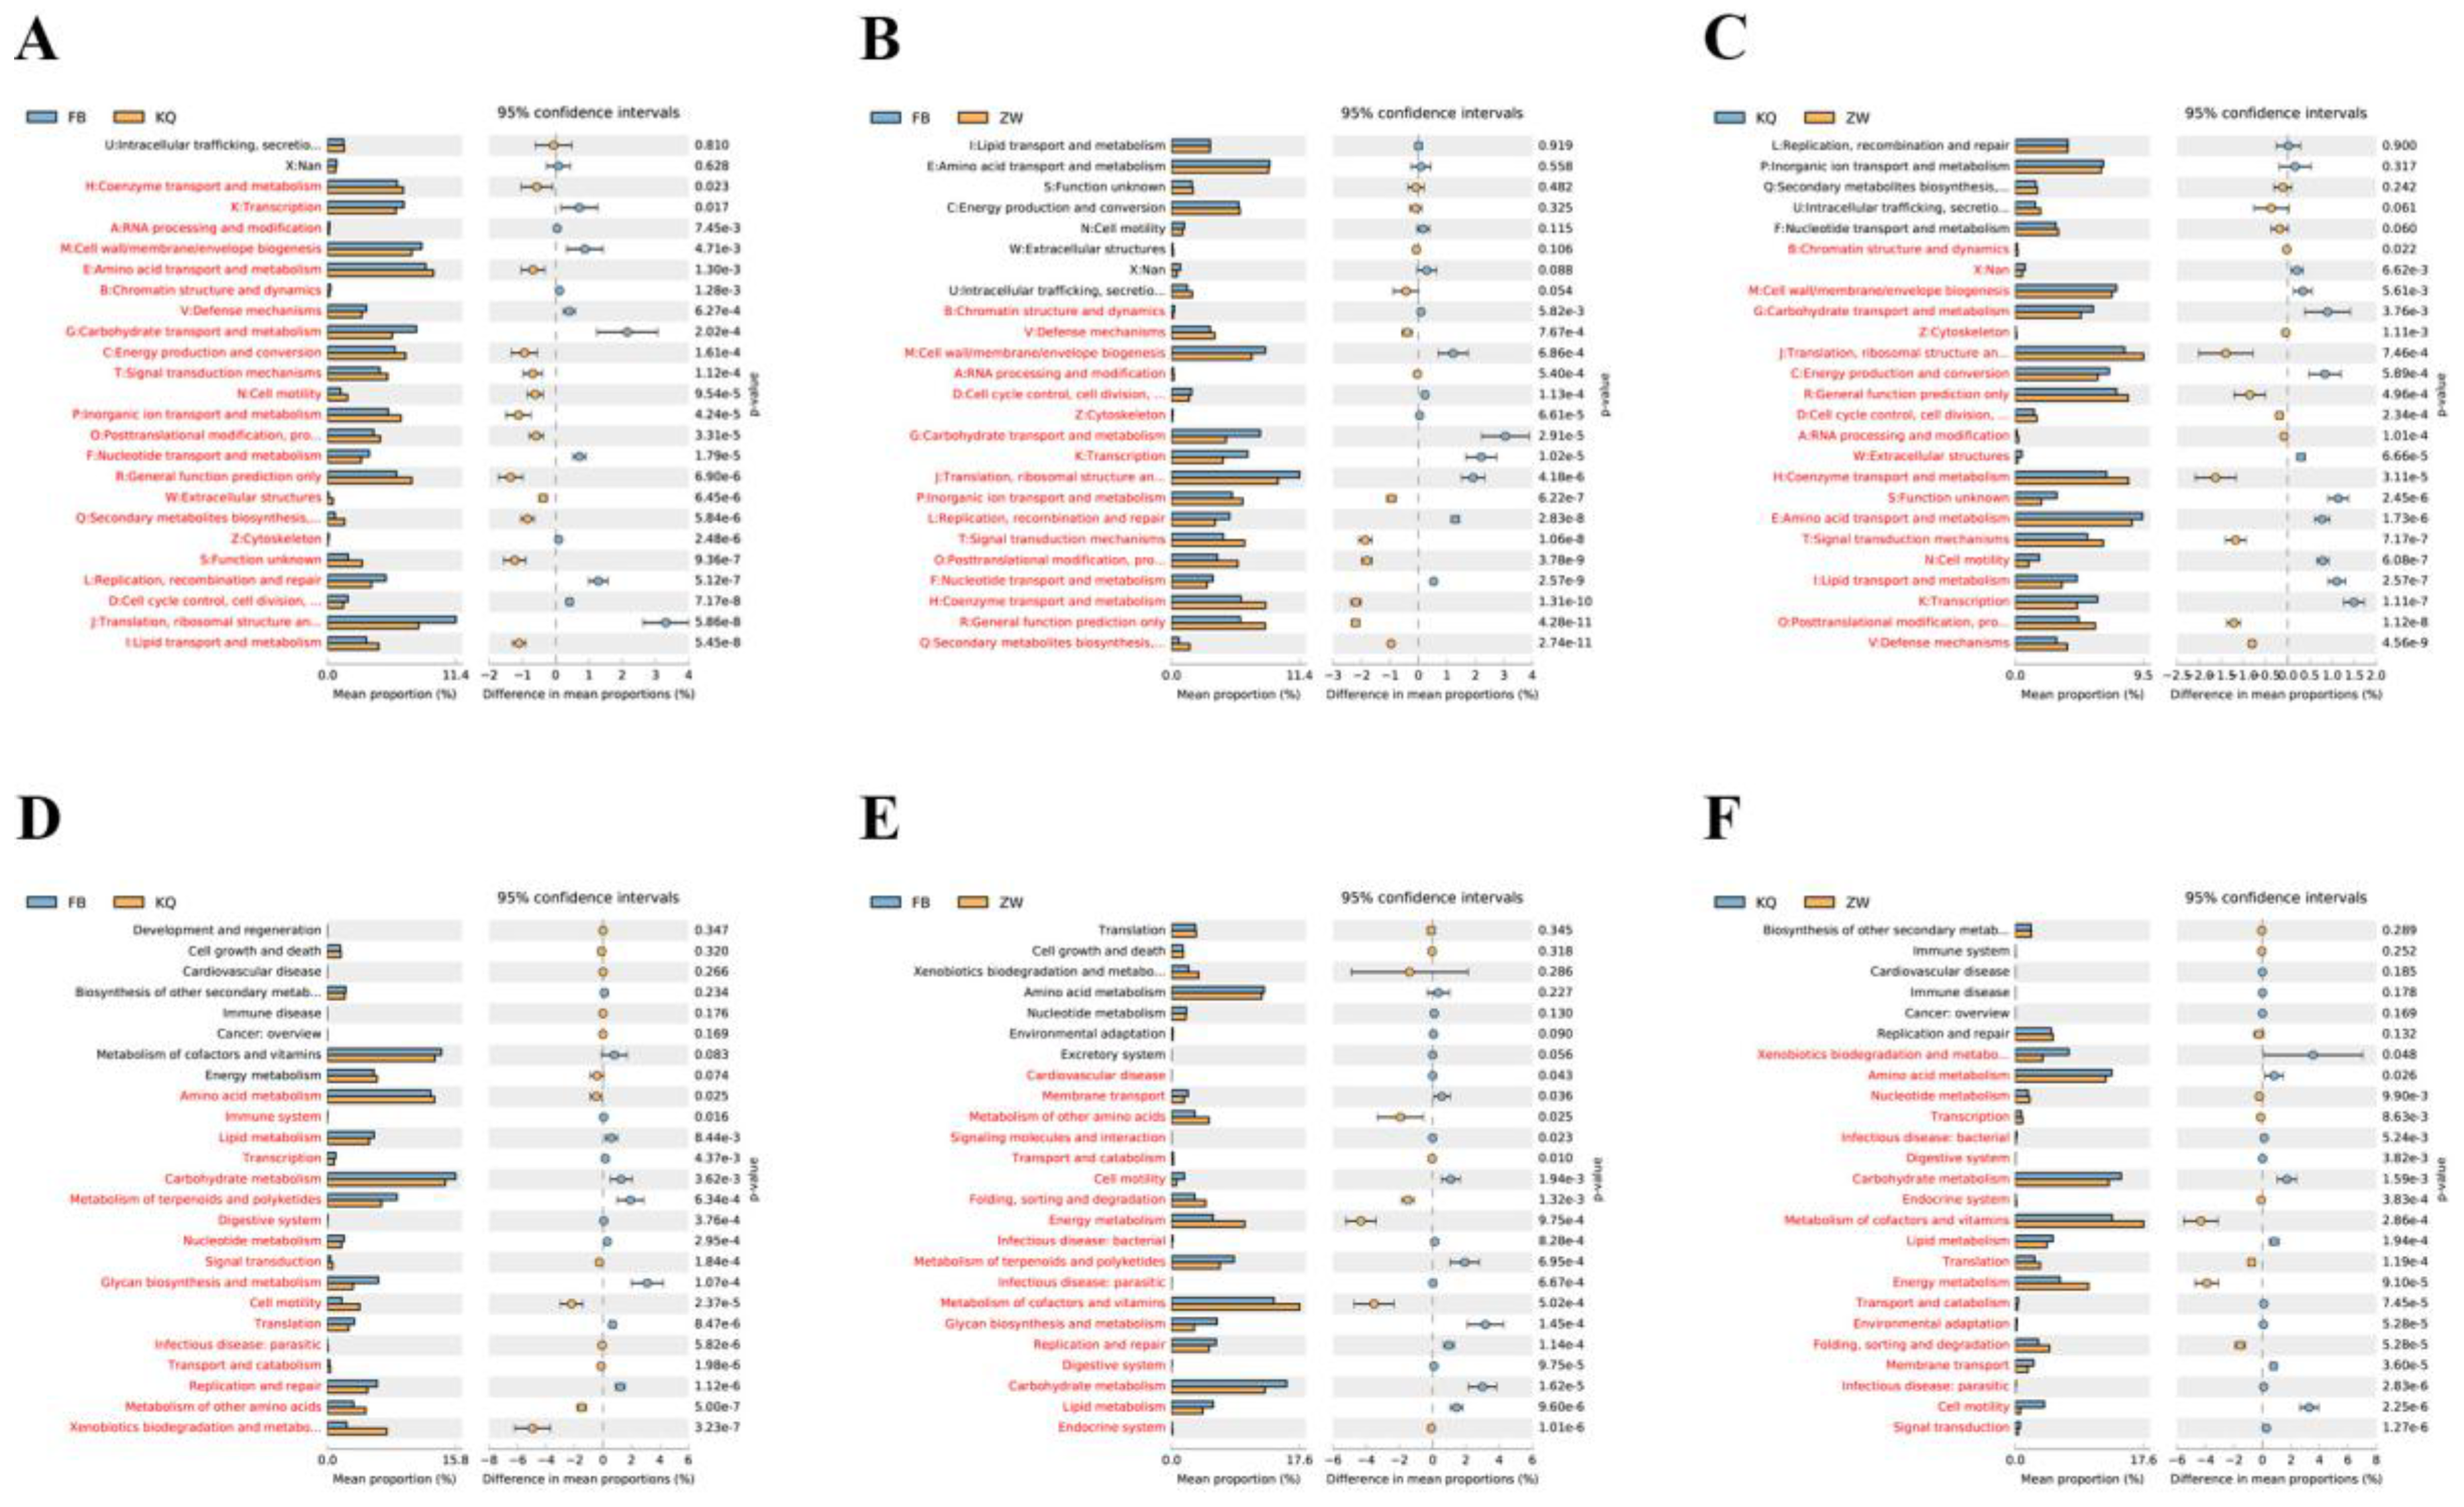
Functional profiling using PICRUSt2 revealed distinct metabolic patterns across gut (FB), oral (KQ), and environmental (ZW) microbiota (Figure 6A-H and Figure 7A-F). COG analysis showed that all three communities were dominated by metabolic functions (42.1‒44.5%), but exhibited key differences: the gut microbiota had higher information processing capacity (23.9% vs. 18.4% in others), while the oral flora contained a higher proportion of poorly characterized functions (10.6% vs. 0.3% in the environmental community. Differential COG analysis (Figure 7A-C) identified oral-specific enhancements in amino acid/coenzyme transport and energy conversion, gut-specific advantages in carbohydrate/nucleotide metabolism and cell division, and environmental specialization in defense mechanisms and protein turnover.
KEGG pathway analysis further highlighted habitat-specific adaptations (Figure 7D-F). Oral microbiota showed significant enrichment in xenobiotic biodegradation and cell motility compared to gut flora. Gut communities demonstrated stronger membrane transport, glycan biosynthesis, and carbohydrate/lipid metabolism than environmental samples. Environmental microbiota exhibited enhanced nucleotide metabolism, energy production, and cofactor/vitamin synthesis compared to oral communities. These functional differences align with and help explain the observed taxonomic variations, revealing how each habitat selects for distinct metabolic capabilities.
Notably, environmental samples exhibited particularly high genetic information processing capacity (14.3% vs. 11.6% in the oral cavity), likely reflecting their need to adapt to variable conditions. The gut’s emphasis on carbohydrate metabolism and glycan biosynthesis underscores its role in host nutrition, while the capacity of oral flora for xenobiotic degradation suggests adaptation to dietary and environmental chemicals. Notably, environmental samples showed particularly high genetic information processing capacity (14.3% vs. 11.6% in oral), likely reflecting their need to adapt to variable conditions. The gut’s emphasis on carbohydrate metabolism and glycan biosynthesis underscores its role in host nutrition, while oral flora’s xenobiotic degradation capacity suggests adaptation to dietary and environmental chemicals. These results collectively demonstrate how microbial communities functionally specialize to thrive in their specific habitats. Together, these results demonstrate how microbial communities functionally specialize to thrive in their specific habitats.
4. Discussion
The host-associated microbial community plays a pivotal role in host physiology, influencing development, disease susceptibility, and adaptation to extreme natural environments. Gut and oral microbial communities are shaped by diverse factors, such as environment [11], temperature [14], diet [6,13,38], and season [21]. Shifts in these communities can facilitate host adaptation. The strictly nocturnal, egg-laying lizard T. roborowskii, which is endemic to the hyperarid Turpan Depression below-sea-level, provides an ideal model for studying the contribution of the microbiome to survival in extreme environments.
Analysis of 16S rRNA sequences revealed that the gut microbiome of T. roborowskii was dominated by the following phyla: Bacteroidota (44.07%), Bacillota (Firmicutes) (32.02%), Pseudomonadota (Proteobacteria) (11.90%), Thermodesulfobacteriota (5.96%), Actinobacteria (Actinomycetota) (3.03%), Verrucomicrobiota (2.57%), and Cyanobacteriota (0.14%) (Figure 4A). This core composition (Bacteroidota, Bacillota, Pseudomonadota, and Actinomycetota) is consistent with previous studies on other lizard species (e.g., Japalura sensu lato, iguanas, and Diploderma spp.) [7,39,40], suggesting that these functions are conserved. Bacteroidota and Bacillota are essential for carbohydrate fermentation and polysaccharide degradation, forming a fundamental part of the gastrointestinal microbiome in non-mammalian vertebrates [41,42]. The Pseudomonadota (formerly the Proteobacteria) are prevalent in carnivorous lizards and contribute to polysaccharide and protein metabolism, as well as the degradation of aromatic compound [15,16,38,43,44,45,46].
While the top three gut phyla (Bacteroidota, Bacillota, and Pseudomonadota) remained consistent across seasons, the relative abundance of these phyla and the composition of the top 10 phyla varied significantly. This variation is consistent with the known influences of geography, season, and diet [21,47] and underscores the modulation of gut microbiome diversity and abundance by the environment. Notably, the Thermodesulfobacteriota phylum (specifically the Desulfobacterota class) was prominent (5.96%) in T. roborowskii. This thermophilic, sulfate-reducing phylum is also found in lizards adapted to high temperatures, such as Diploderma spp. [7] and Japalura, and is linked to arsenic methylation. It thrives at elevated temperatures [48,49]. Its presence in T. roborowskii suggests a potential role in facilitating host adaptation to the desert’s thermal extremes.
Analysis of the oral microbiome revealed a distinct composition, dominated by the phylum Pseudomonadota (see Figure 4A). This composition differed significantly in terms of diversity and abundance from both the gut and environmental microbiomes (see Figure 3). Environmental factors exerted a stronger influence on the structure of the oral community than the gut community. The dominant phyla shared across gut, oral, and environmental samples (>1% abundance) were Bacteroidota, Bacillota, Pseudomonadota, and Actinomycetota (see Figure 4). Notably, Verrucomicrobiota dominated the oral cavity, which was absent in reported lizard oral microbiomes such as Japalura sensu lato. This phylum possesses potent capabilities for degrading complex polysaccharides and organic matter [23,50,51,52], and it may influence host physiology by prodcuing SCFAs [53,54,55]. The presence of this phylum in T. roborowskii (an omnivore) but its absence in the insectivorous Japalura suggests a dietary link.
Functional predictions (KEGG pathway analysis, Figure 7D) supported the distinct roles of these microbial niches. Oral flora showed enrichment in pathways critical for initial food processing, such as xenobiotic biodegradation and metabolism and amino acid metabolism, as well as cell motility. This is consistent with the oral cavity’s role in ingestion. In contrast, gut flora, dominated by the phyla Bacteroidota and Bacillota, showed enrichment in pathways involved in nutrient assimilation (carbohydrate metabolism, lipid metabolism, and nucleotide metabolism), as well as in pathways involved in the processing of complex compounds (glycan biosynthesis and metabolism, and metabolism of terpenoids and polyketides). Gut flora showed enrichment in pathways involved in core cellular functions (translation, replication and repair).
Overall, our results reveal a core microbiome comprising the phyla Bacteroidota, Bacillota, Pseudomonadota, and Actinomycetota, with niche-specific divergences. The high diversity of the gut microbiome aligns with its role in nutrient processing, while the presence of the Pseudomonadota phylum in the oral microbiome may reflect aerobic adaptation. The presence of the Thermodesulfobacteriota phylum in the gut suggests thermophilic adaptations, while the presence of the Verrucomicrobiota phylum in the oral cavity may facilitate polysaccharide digestion in an omnivorous diet. Functional profiles mirrored taxonomic trends, with gut microbiota optimized for metabolism and oral microbiota for detoxification. These findings emphasize the importance of the microbiome in desert adaptation and establish T. roborowskii as a model for extremophile-host symbiosis.
5. Conclusions
This study provides the first comprehensive microbiome analysis of T. roborowskii, revealing niche-specific communities shaped by extreme desert conditions. The gut’s Thermodesulfobacteriota and oral Verrucomicrobiota represent candidate taxa for future mechanistic studies on thermal and dietary adaptations.
Authorship Contributions
Writing – original draft, Xing Luo; Methodology, Xing Luo and Dali Chen; Investigation, Xing Luo, Jinlei He, Xianguang Guo and Dali Chen; Formal analysis, Xing Luo, Jie Luo, Hang Xiong, Yuying Xiao, Yanqin Zhao; Data curation, Xing Luo; Writing – review & editing, Jinlei He, Xianguang Guo, Dali Chen; Supervision, Jinlei He, Xianguang Guo, Dali Chen; Conceptualization, Jinlei He, Xianguang Guo, Dali Chen; Visualization, Jie Luo, Hang Xiong, Yuying Xiao, Yanqin Zhao; Funding acquisition, Xianguang Guo, Dali Chen; Supervision, Dali Chen; Project administration, Dali Chen. All authors have read and agreed to the published version of the manuscript.
Funding
This work was supported by Sichuan Science and Technology Program (Grant No. 2025ZNSFSC0249) and the National Natural Science Foundation of China (Grant Nos. 31872959 and 32470466).
Institutional Review Board Statement
Our experimental procedures complied with the current laws of China for the care and use of experimental animals and were approved by the Animal Research Ethics Committee of Sichuan University (approval number: KS2023517). All applicable international, national and institutional guidelines for animal care and use were observed.
Informed Consent Statement
Not applicable.
Data Availability Statement
The raw sequence data reported in this paper have been deposited in the Genome Sequence Archive (Genomics, Proteomics & Bioinformatics 2021) in National Genomics Data Center (Nucleic Acids Res 2025), China National Center for Bioinformation / Beijing Institute of Genomics, Chinese Academy of Sciences (GSA: CRA026392) that are publicly accessible at https://ngdc.cncb.ac.cn/gsa.
Acknowledgments
We would like to thank Yajing Xu for generating the sampling map used in this study.
Conflicts of Interest
The authors declare that they have no known competing financial interests or personal relationships that could have appeared to influence the work reported in this paper.
References
- Shang, Y.; Zhong, H.; Liu, G.; Wang, X.; Wu, X.; Wei, Q.; Shi, L.; Zhang, H. Characteristics of flora in different segments of the digestive tract of Lycodon rufozonatus. Animals. 2023, 13, 731. [Google Scholar] [CrossRef]
- Acharyya, S.; Majumder, S.; Nandi, S.; Ghosh, A.; Saha, S.; Bhattacharya, M. Uncovering mercury accumulation and the potential for bacterial bioremediation in response to contamination in the Singalila National Park. Sci Rep. 2025, 15, 3664. [Google Scholar] [CrossRef]
- Duffy, J.E.; Godwin, C.M.; Cardinale, B.J. Biodiversity effects in the wild are common and as strong as key drivers of productivity. Nature. 2017, 549, 261–264. [Google Scholar] [CrossRef]
- Huang, Z.K.; Dao, C.J.; Ma, P.X.; Li, B.; Yan, K. Characteristics of nitrogen cycle-related bacterial community and its response to soil in the main lead-zinc mine reclamation area of Lanping. Huan Jing Ke Xue. 2025, 46, 399–408. [Google Scholar] [CrossRef]
- Naeem, S.; Duffy, J.E.; Zavaleta, E. The functions of biological diversity in an age of extinction. Science. 2012, 336, 1401–1406. [Google Scholar] [CrossRef]
- Tang, S.; Li, Y.; Huang, C.; Yan, S.; Li, Y.; Chen, Z.; Wu, Z. Comparison of gut flora diversity between captive and wild Tokay gecko (Gekko gecko). Front Microbiol. 2022, 13, 897923. [Google Scholar] [CrossRef]
- Zhu, W.; Qi, Y.; Wang, X.; Shi, X.; Chang, L.; Liu, J.; Zhu, L.; Jiang, J. Multi-omics approaches revealed the associations of host metabolism and gut microbiome with phylogeny and environmental adaptation in mountain dragons. Front Microbiol. 2022, 13, 913700. [Google Scholar] [CrossRef]
- Uetz, P.; Freed, P.; Aguilar, R.; Reyes, F.; Kudera, J.; Hošek, J. The Reptile Database. https://www.reptile-database.org. (accessed on 13 July 2025).
- Fung, T.C.; Olson, C.A.; Hsiao, E.Y. Interactions between the flora, immune and nervous systems in health and disease. Nat Neurosci. 2017, 20, 145–155. [Google Scholar] [CrossRef] [PubMed]
- Belkaid, Y.; Hand, T.W. Role of the flora in immunity and inflammation. Cell. 2014, 157, 121–141. [Google Scholar] [CrossRef] [PubMed]
- Kim, P.S.; Shin, N.R.; Lee, J.B.; Kim, M.S.; Whon, T.W.; Hyun, D.W.; Yun, J.H.; Jung, M.J.; Kim, J.Y.; Bae, J.W. Host habitat is the major determinant of the gut microbiome of fish. Microbiome. 2021, 9, 166. [Google Scholar] [CrossRef] [PubMed]
- Xiao, F.; Zhu, W.; Yu, Y.; He, Z.; Wu, B.; Wang, C.; Shu, L.; Li, X.; Yin, H.; Wang, J.; Juneau, P.; Zheng, X.; Wu, Y.; Li, J.; Chen, X.; Hou, D.; Huang, Z.; He, J.; Xu, G.; Xie, L.; Huang, J.; Yan, Q. Host development overwhelms environmental dispersal in governing the ecological succession of zebrafish gut flora. NPJ Biofilms Microbiomes. 2021, 7, 5. [Google Scholar] [CrossRef] [PubMed]
- Jiang, H.Y.; Ma, J.E.; Li, J.; Zhang, X.J.; Li, L.M.; He, N.; Liu, H.Y.; Luo, S.Y.; Wu, Z.J.; Han, R.C.; Chen, J.P. Diets alter the gut microbiome of crocodile lizards. Front Microbiol. 2017, 8, 2073. [Google Scholar] [CrossRef] [PubMed]
- Zhu, X.M.; Chen, J.Q.; Du, Y.; Lin, C.X.; Qu, Y.F.; Lin, L.H.; Ji, X. Microbial communities are thermally more sensitive in warm-climate lizards compared with their cold-climate counterparts. Front Microbiol. 2024, 15, 1374209. [Google Scholar] [CrossRef] [PubMed]
- Zhang, W.; Li, N.; Tang, X.; Liu, N.; Zhao, W. Changes in intestinal flora across an altitudinal gradient in the lizard Phrynocephalus vlangalii. Ecol Evol. 2018, 8, 4695–4703. [Google Scholar] [CrossRef]
- Zhang, L.; Yang, F.; Li, N.; Dayananda, B. Environment-dependent variation in gut flora of an oviparous lizard (Calotes versicolor). Animals. 2021, 11, 2461. [Google Scholar] [CrossRef]
- Zhao, E.M.; Zhao, K.T.; Zhou, K.Y. Fauna Sinica, Reptilia, Vol. 2, Squamata, Lacertilia. Science Press, Beijing, China, 1999. (in Chinese).
- Li WR,Song YC,Shi L.Home range of Teratoscincus roborowskii (Gekkonidae): Influence of sex, season, and body size. Acta Ecologica Sinica 2013, 33, 395–401, (In Chinese with English Abstract). [CrossRef]
- Macey, J.R.; Wang, Y.; Ananjeva, N.B.; Larson, A.; Papenfuss, T.J. Vicariant patterns of fragmentation among gekkonid lizards of the genus Teratoscincus produced by the Indian collision: A molecular phylogenetic perspective and an area cladogram for Central Asia. Mol Phylogene Evol. 1999, 12, 320–332. [Google Scholar] [CrossRef]
- Zheng, D.; Ma, R.; Guo, X.; Li, J. Comparative mitogenomics of wonder geckos (Sphaerodactylidae: Teratoscincus Strauch, 1863): Uncovering evolutionary insights into protein-coding genes. Genes. 2025, 16, 531. [Google Scholar] [CrossRef]
- Gao, W.Z.; Yang, Y.; Shi, L. Seasonal dietary shifts alter the gut flora of a frugivorous lizard T. roborowskii (Squamata, Sphaerodactylidae). Ecol Evol. 2023, 13, e10363. [Google Scholar] [CrossRef]
- Jiang, G.H.; Li, H.Y.; Xie, L.J.; Fan, J.Y.; Li, S.Y.; Yu, W.Q.; Xu, Y.T.; He, M.L.; Jiang, Y.; Bai, X.; Zhou, J.; Wang, X. Intestinal flora was associated with occurrence risk of chronic non-communicable diseases. World J Gastroenterol. 2025, 31, 103507. [Google Scholar] [CrossRef]
- Zhang, J.; Kobert, K.; Flouri, T.; Stamatakis, A. PEAR: a fast and accurate Illumina Paired-End reAd mergeR. Bioinformatics. 2014, 30, 614–620. [Google Scholar] [CrossRef]
- Schmieder, R.; Edwards, R. Quality control and preprocessing of metagenomic datasets. Bioinformatics. 2011, 27, 863–864. [Google Scholar] [CrossRef]
- Edgar, R.C. UPARSE: highly accurate OTU sequences from microbial amplicon reads. Nat Methods. 2013, 10, 996–8. [Google Scholar] [CrossRef] [PubMed]
- Wang, Q.; Garrity, G.M.; Tiedje, J.M.; Cole, J.R. Naive Bayesian classifier for rapid assignment of rRNA sequences into the new bacterial taxonomy. Appl Environ Microbiol. 2007, 73, 5261–5267. [Google Scholar] [CrossRef] [PubMed]
- Kõljalg U, Nilsson RH, Abarenkov K, Tedersoo L, Taylor A FS, Bahram M. .. & Larsson K-H. Towards a unified paradigm for sequence-based identification of Fungi. Mol Ecol. 2013, 22, 5271–5277. [Google Scholar] [CrossRef]
- Schloss, P.D.; Westcott, S.L.; Ryabin, T.; Hall, J.R.; Hartmann, M.; Hollister, E.B.; Lesniewski, R.A.; Oakley, B.B.; Parks, D.H.; Robinson, C.J.; Sahl, J.W.; Stres, B.; Thallinger, G.G.; Van Horn, D.J.; Weber, C.F. Introducing mothur: open-source, platform-independent, community-supported software for describing and comparing microbial communities. Appl Environ Microbiol. 2009, 75, 7537–41. [Google Scholar] [CrossRef]
- R Core Team. R: A language and environment for statistical computing. R Foundation for Statistical Computing, Vienna, Austria, 2022. https://www.R-project.org/.
- Oksanen, J.; Simpson, G.L.; Blanchet, G.F.; Kindt, R.; Legendre, P.; Minchin, P.R.; O’Hara, R.B.; Solymos, P.; Stevens, M.H.H.; Szoecs, E.; Wagner, H.; Barbour, M.; Bedward, M.; Bolker, B.; Borcard, D.; Carvalho, G.; Chirico, M.; De Caceres, M.; Durand, S.; Antoniazi Evangelista, H.B.; FitzJohn, R.; Friendly, M.; Furneaux, B.; Hannigan, G.; Hill, M.O.; Lahti, L.; McGlinn, D.; Quellette, M.-H.; Cunha, E.R.; Smith, T.; Stier, A.; Ter Braak, C.J.F.; Weedon, J. vegan: Community Ecology Package. R package version 2.6-2, 2023. https://CRAN.R-project.org/package=vegan.
- Wickham, H. ggplot2: Elegant graphics for data analysis. Springer-Verlag New York, 2016. https://ggplot2.tidyverse.org/.
- Parks, D.H.; Tyson, G.W.; Hugenholtz, P.; Beiko, R.G. STAMP: statistical analysis of taxonomic and functional profiles. Bioinformatics. 2014, 30, 3123–4. [Google Scholar] [CrossRef]
- Segata, N.; Izard, J.; Waldron, L.; Gevers, D.; Miropolsky, L.; Garrett, W.S.; Huttenhower, C. Metagenomic biomarker discovery and explanation. Genome Biol. 2011, 12, R60. [Google Scholar] [CrossRef]
- Friedman, J.; Alm, E.J. Inferring correlation networks from genomic survey data. PLoS Comput Biol. 2012, 8, e1002687. [Google Scholar] [CrossRef] [PubMed]
- Calleros, L.; Barcellos, M.; Grecco, S.; Garzón, J.P.; Lozano, J.; Urioste, V.; Gastal, G. Longitudinal study of the bovine cervico-vaginal bacterial microbiota throughout pregnancy using 16S ribosomal RNA gene sequences. Infect Genet Evol. 2024, 124, 105657. [Google Scholar] [CrossRef]
- Pedersen, T.L. ggraph: An Implementation of grammar of graphics for graphs and networks. R package version 2.2.1.9000, 2024. https://github.com/thomasp85/ggraph.
- Langille, M.G.; Zaneveld, J.; Caporaso, J.G.; McDonald, D.; Knights, D.; Reyes, J.A.; Clemente, J.C.; Burkepile, D.E.; Vega Thurber, R.L.; Knight, R.; Beiko, R.G.; Huttenhower, C. Predictive functional profiling of microbial communities using 16S rRNA marker gene sequences. Nat Biotechnol. 2013, 31, 814–21. [Google Scholar] [CrossRef]
- Zhou, J.; Zhao, Y.T.; Dai, Y.Y.; Jiang, Y.J.; Lin, L.H.; Li, H.; Li, P.; Qu, Y.F.; Ji, X. Captivity affects diversity, abundance, and functional pathways of gut flora in the northern grass lizard Takydromus septentrionalis. Microbiologyopen. 2020, 9, e1095. [Google Scholar] [CrossRef] [PubMed]
- Hong, P.Y.; Wheeler, E.; Cann, I.K.; Mackie, R.I. Phylogenetic analysis of the fecal microbial community in herbivorous land and marine iguanas of the Galápagos Islands using 16S rRNA-based pyrosequencing. ISME J. 2011, 5, 1461–70. [Google Scholar] [CrossRef]
- Tian, Z.; Pu, H.; Cai, D.; Luo, G.; Zhao, L.; Li, K.; Zou, J.; Zhao, X.; Yu, M.; Wu, Y.; Yang, T.; Guo, P.; Hu, X. Characterization of the bacterial flora in different gut and oral compartments of splendid japalure (Japalura sensu lato). BMC Vet Res. 2022, 18, 205. [Google Scholar] [CrossRef]
- Colston, T.J.; Jackson, C.R. Microbiome evolution along divergent branches of the vertebrate tree of life: what is known and unknown. Mol Ecol. 2016, 25, 3776–3800. [Google Scholar] [CrossRef]
- Sichert, A.; Corzett, C.H.; Schechter, M.S.; Unfried, F.; Markert, S.; Becher, D.; Fernandez-Guerra, A.; Liebeke, M.; Schweder, T.; Polz, M.F.; Hehemann, J.H. Verrucomicrobia use hundreds of enzymes to digest the algal polysaccharide fucoidan. Nat Microbiol. 2020, 5, 1026–1039. [Google Scholar] [CrossRef]
- Kohl, K.D.; Amaya, J.; Passement, C.A.; Dearing, M.D.; McCue, M.D. Unique and shared responses of the gut flora to prolonged fasting: a comparative study across five classes of vertebrate hosts. FEMS Microbiol Ecol. 2014, 90, 883–94. [Google Scholar] [CrossRef]
- Abdul Rahman, N.; Parks, D.H.; Vanwonterghem, I.; Morrison, M.; Tyson, G.W.; Hugenholtz, P. A phylogenomic analysis of the bacterial phylum Fibrobacteres. Front Microbiol. 2016, 6, 1469. [Google Scholar] [CrossRef]
- Reid, N.M.; Addison, S.L.; Macdonald, L.J.; Lloyd-Jones, G. Biodiversity of active and inactive bacteria in the gut flora of wood-feeding huhu beetle larvae (Prionoplus reticularis). Appl Environ Microbiol. 2011, 77, 7000–7006. [Google Scholar] [CrossRef] [PubMed]
- Vacca, M.; Celano, G.; Calabrese, F.M.; Portincasa, P.; Gobbetti, M.; De Angelis, M. The controversial role of human gut Lachnospiraceae. Microorganisms. 2020, 8, 573. [Google Scholar] [CrossRef] [PubMed]
- Kohl, K.D.; Brun, A.; Magallanes, M.; Brinkerhoff, J.; Laspiur, A.; Acosta, J.C.; Caviedes-Vidal, E.; Bordenstein, S.R. Gut microbial ecology of lizards: insights into diversity in the wild, effects of captivity, variation across gut regions and transmission. Mol Ecol. 2017, 26, 1175–1189. [Google Scholar] [CrossRef] [PubMed]
- Wang, L.; Pei, H.; Xing, T.; Chen, D.; Chen, Y.; Hao, Z.; Tian, Y.; Ding, J. Gut bacteria and host metabolism: The keys to sea cucumber (Apostichopus japonicus) quality traits. Food Chem. 2025, 482, 144178. [Google Scholar] [CrossRef]
- Yu, T.; Luo, Y.; Tan, X.; Zhao, D.; Bi, X.; Li, C.; Zheng, Y.; Xiang, H.; Hu, S. Global marine cold seep metagenomes reveal diversity of taxonomy, metabolic function, and natural products. Genom Proteom Bionf. 2024, 22, qzad006. [Google Scholar] [CrossRef] [PubMed]
- Gong, H.; Shi, Y.; Zhou, X.; Wu, C.; Cao, P.; Xu, C.; Hou, D.; Wang, Y.; Zhou, L. Flora in the throat and risk factors for Laryngeal Carcinoma. Appl Environ Microbiol. 2014, 80, 7356–7363. [Google Scholar] [CrossRef] [PubMed]
- Naumoff, D.G.; Dedysh, S.N. Bacteria from poorly studied phyla as a potential source of new enzymes: β-galactosidases from planctomycetes and verrucomicrobia. Microbiology 2018, 87, 796–805. [Google Scholar] [CrossRef]
- Tan, X.-Y.; Liu, X.-J.; Lu, D.-C.; Ye, Y.-Q.; Liu, X.-Y.; Yu, F.; Yang, H.; Li, F.; Du, Z.-J.; Ye, M.-Q. Insights into the physiological and metabolic features of Thalassobacterium, a novel genus of Verrucomicrobiota with the potential to drive the carbon cycle. mBio. 2025, 16, e0030525. [Google Scholar] [CrossRef]
- Morrison, D.J.; Preston, T. Formation of short chain fatty acids by the gut microbiota and their impact on human metabolism. Gut Microbes. 2016, 7, 189–200. [Google Scholar] [CrossRef]
- Olson, C.A.; Vuong, H.E.; Yano, J.M.; Liang, Q.Y.; Nusbaum, D.J.; Hsiao, E.Y. The Gut Microbiota Mediates the Anti-Seizure Effects of the Ketogenic Diet. Cell. 2018, 173, 1728–1741.e13. [Google Scholar] [CrossRef]
- Ouwerkerk, J.P.; van der Ark, K.C.H.; Davids, M.; Claassens, N.J.; Finestra, T.R.; de Vos, W.M.; Belzer, C. Adaptation of Akkermansia muciniphila to the oxic-anoxic interface of the mucus layer. Appl Environ Microbiol. 2016, 82, 6983–6993. [Google Scholar] [CrossRef]
Figure 1.
Geographic sampling location of T. roborowskii in this study. Blue dashed lines indicate the species’ range in the Turpan Depression of Xinjiang. Photograph by Xianguang Guo.
Figure 1.
Geographic sampling location of T. roborowskii in this study. Blue dashed lines indicate the species’ range in the Turpan Depression of Xinjiang. Photograph by Xianguang Guo.
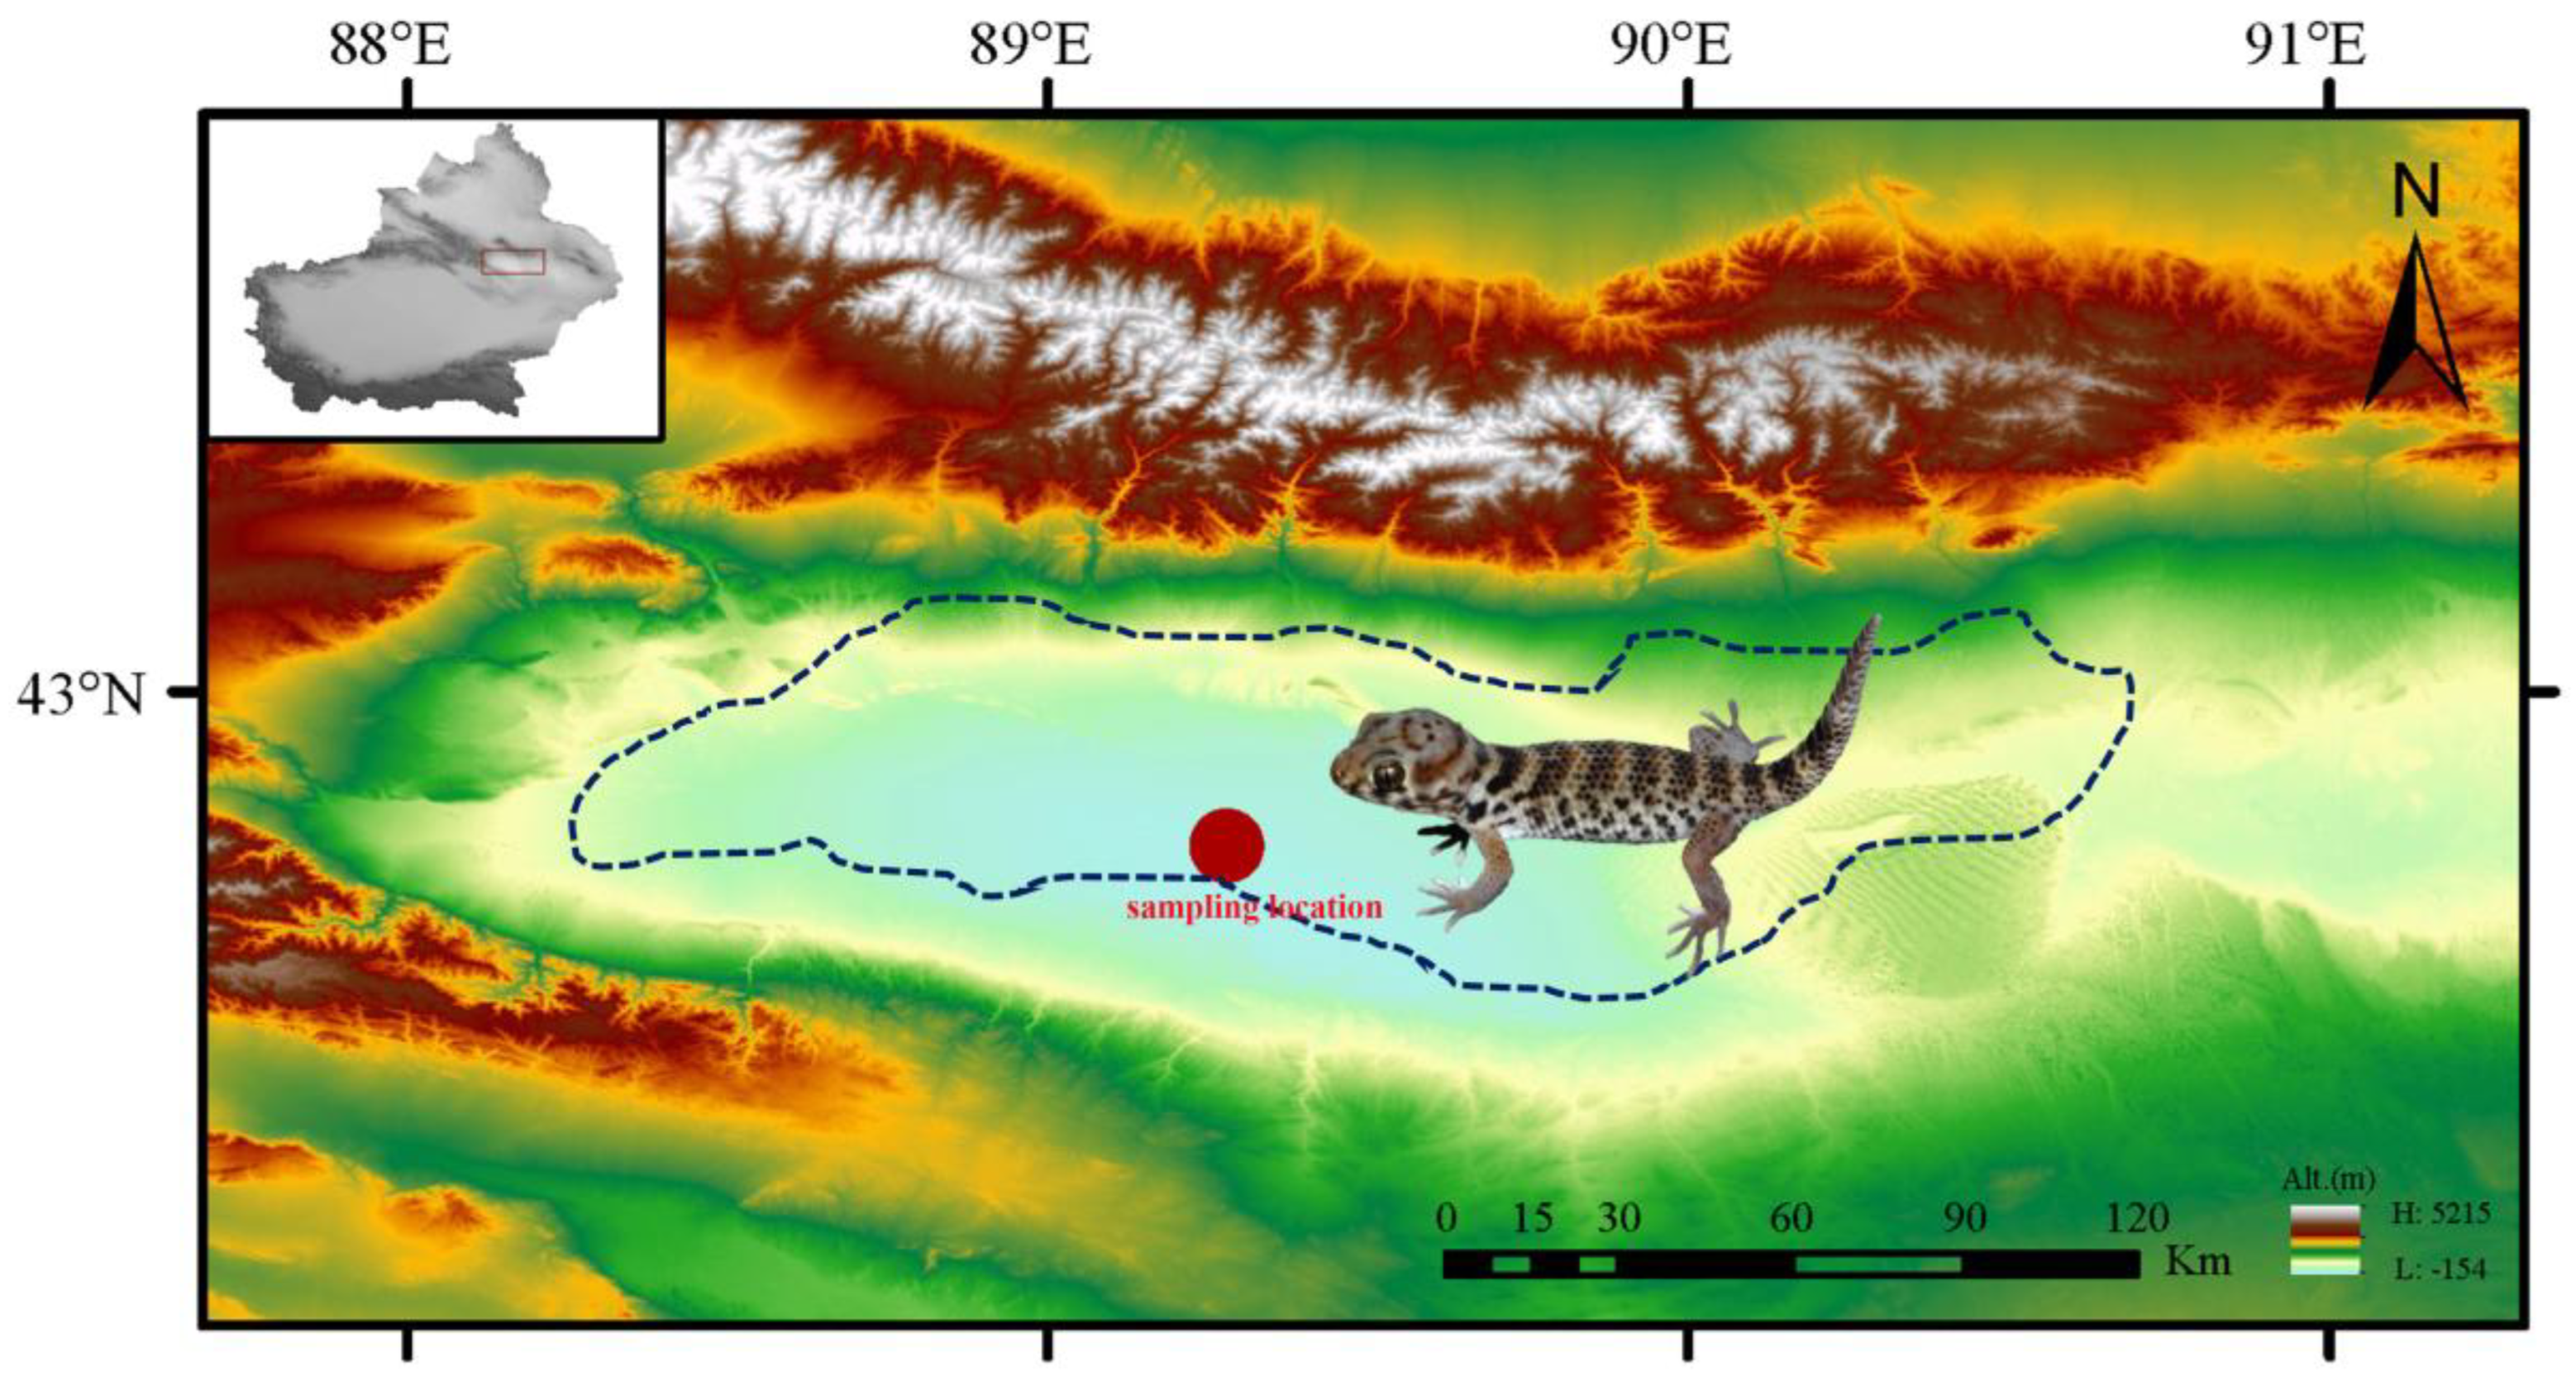
Figure 2.
Microbial community diversity assessment. (A) Rank-abundance curves showing species richness and evenness across sample groups (9 fecal [FB], 9 oral [KQ], and 4 environmental [ZW for vegetation and TR for soil] samples). (B) Rarefaction curves demonstrating sequencing depth adequacy, with all curves approaching saturation, indicating sufficient sampling effort for community characterization. Both analyses were performed using 16S rRNA gene sequencing data.
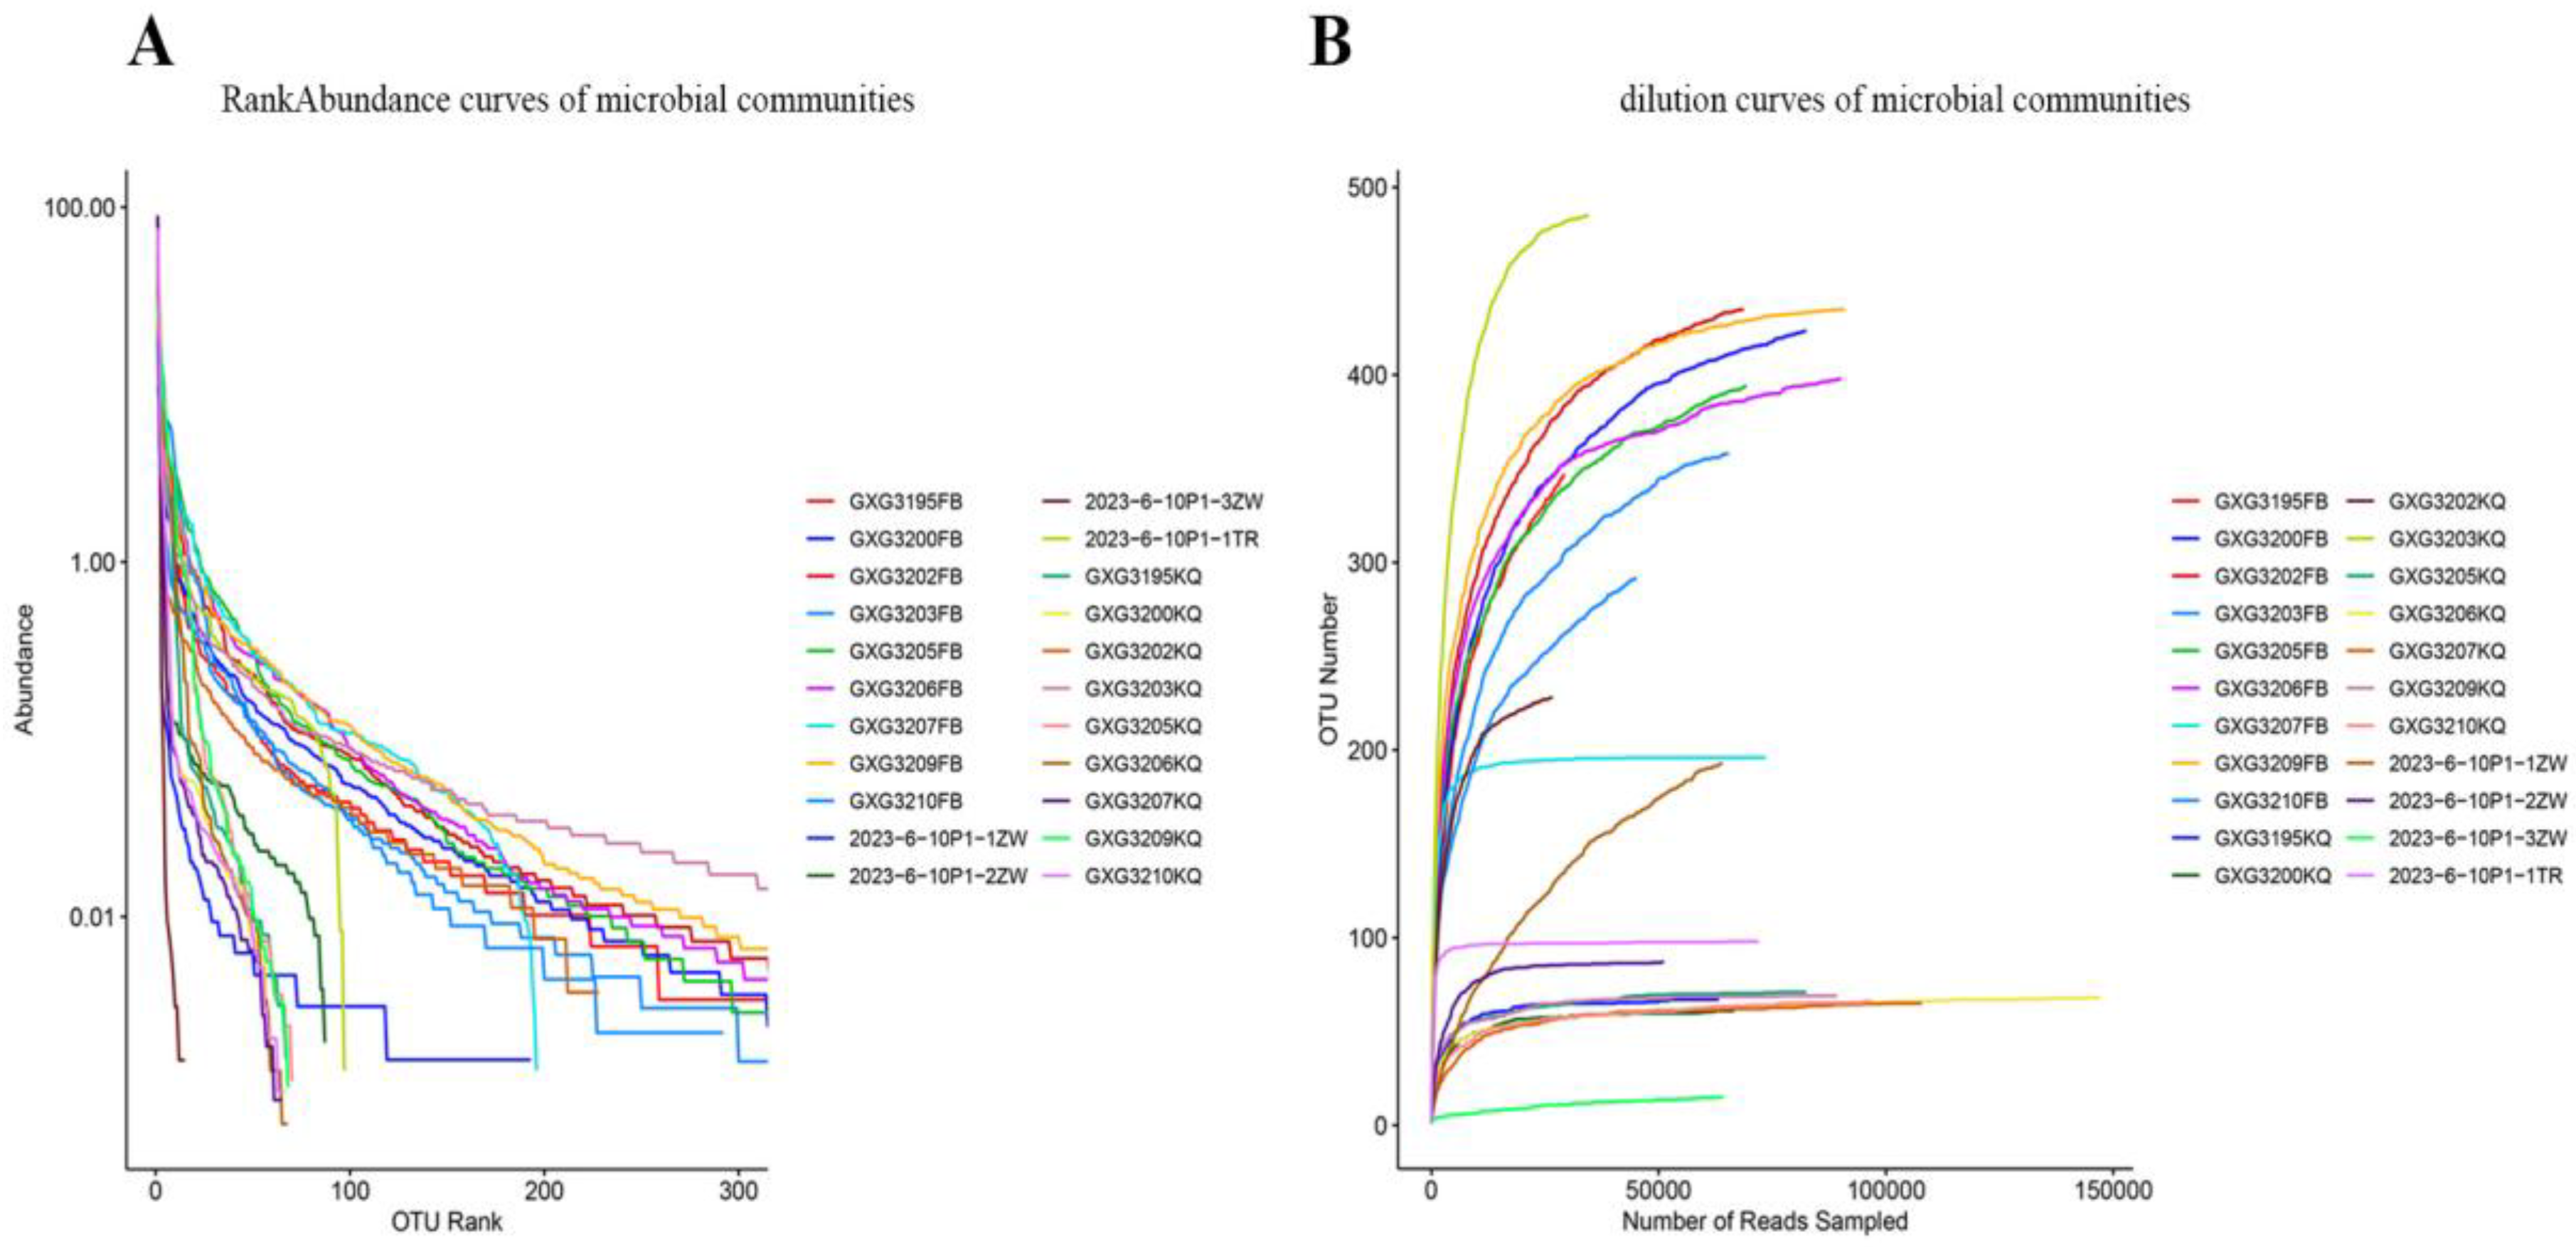
Figure 3.
Microbial community diversity analysis. (A–F) Boxplots of α-diversity indices comparing fecal (FB), oral (KQ), and environmental (HJ) samples: observed OTUs (A), Ace (B), Chao1 (C), Shannon (D), Simpson (E), and Coverage (F). Significant differences are indicated (*P < 0.05, **P < 0.01, ***P < 0.001), with notable divergence between FB vs. KQ (P < 0.05) and FB vs. HJ groups. (G) Venn diagram of shared/unique OTUs among groups. (H–I) β-diversity analysis via PCoA (H) and NMDS (I) based on OTU profiles.
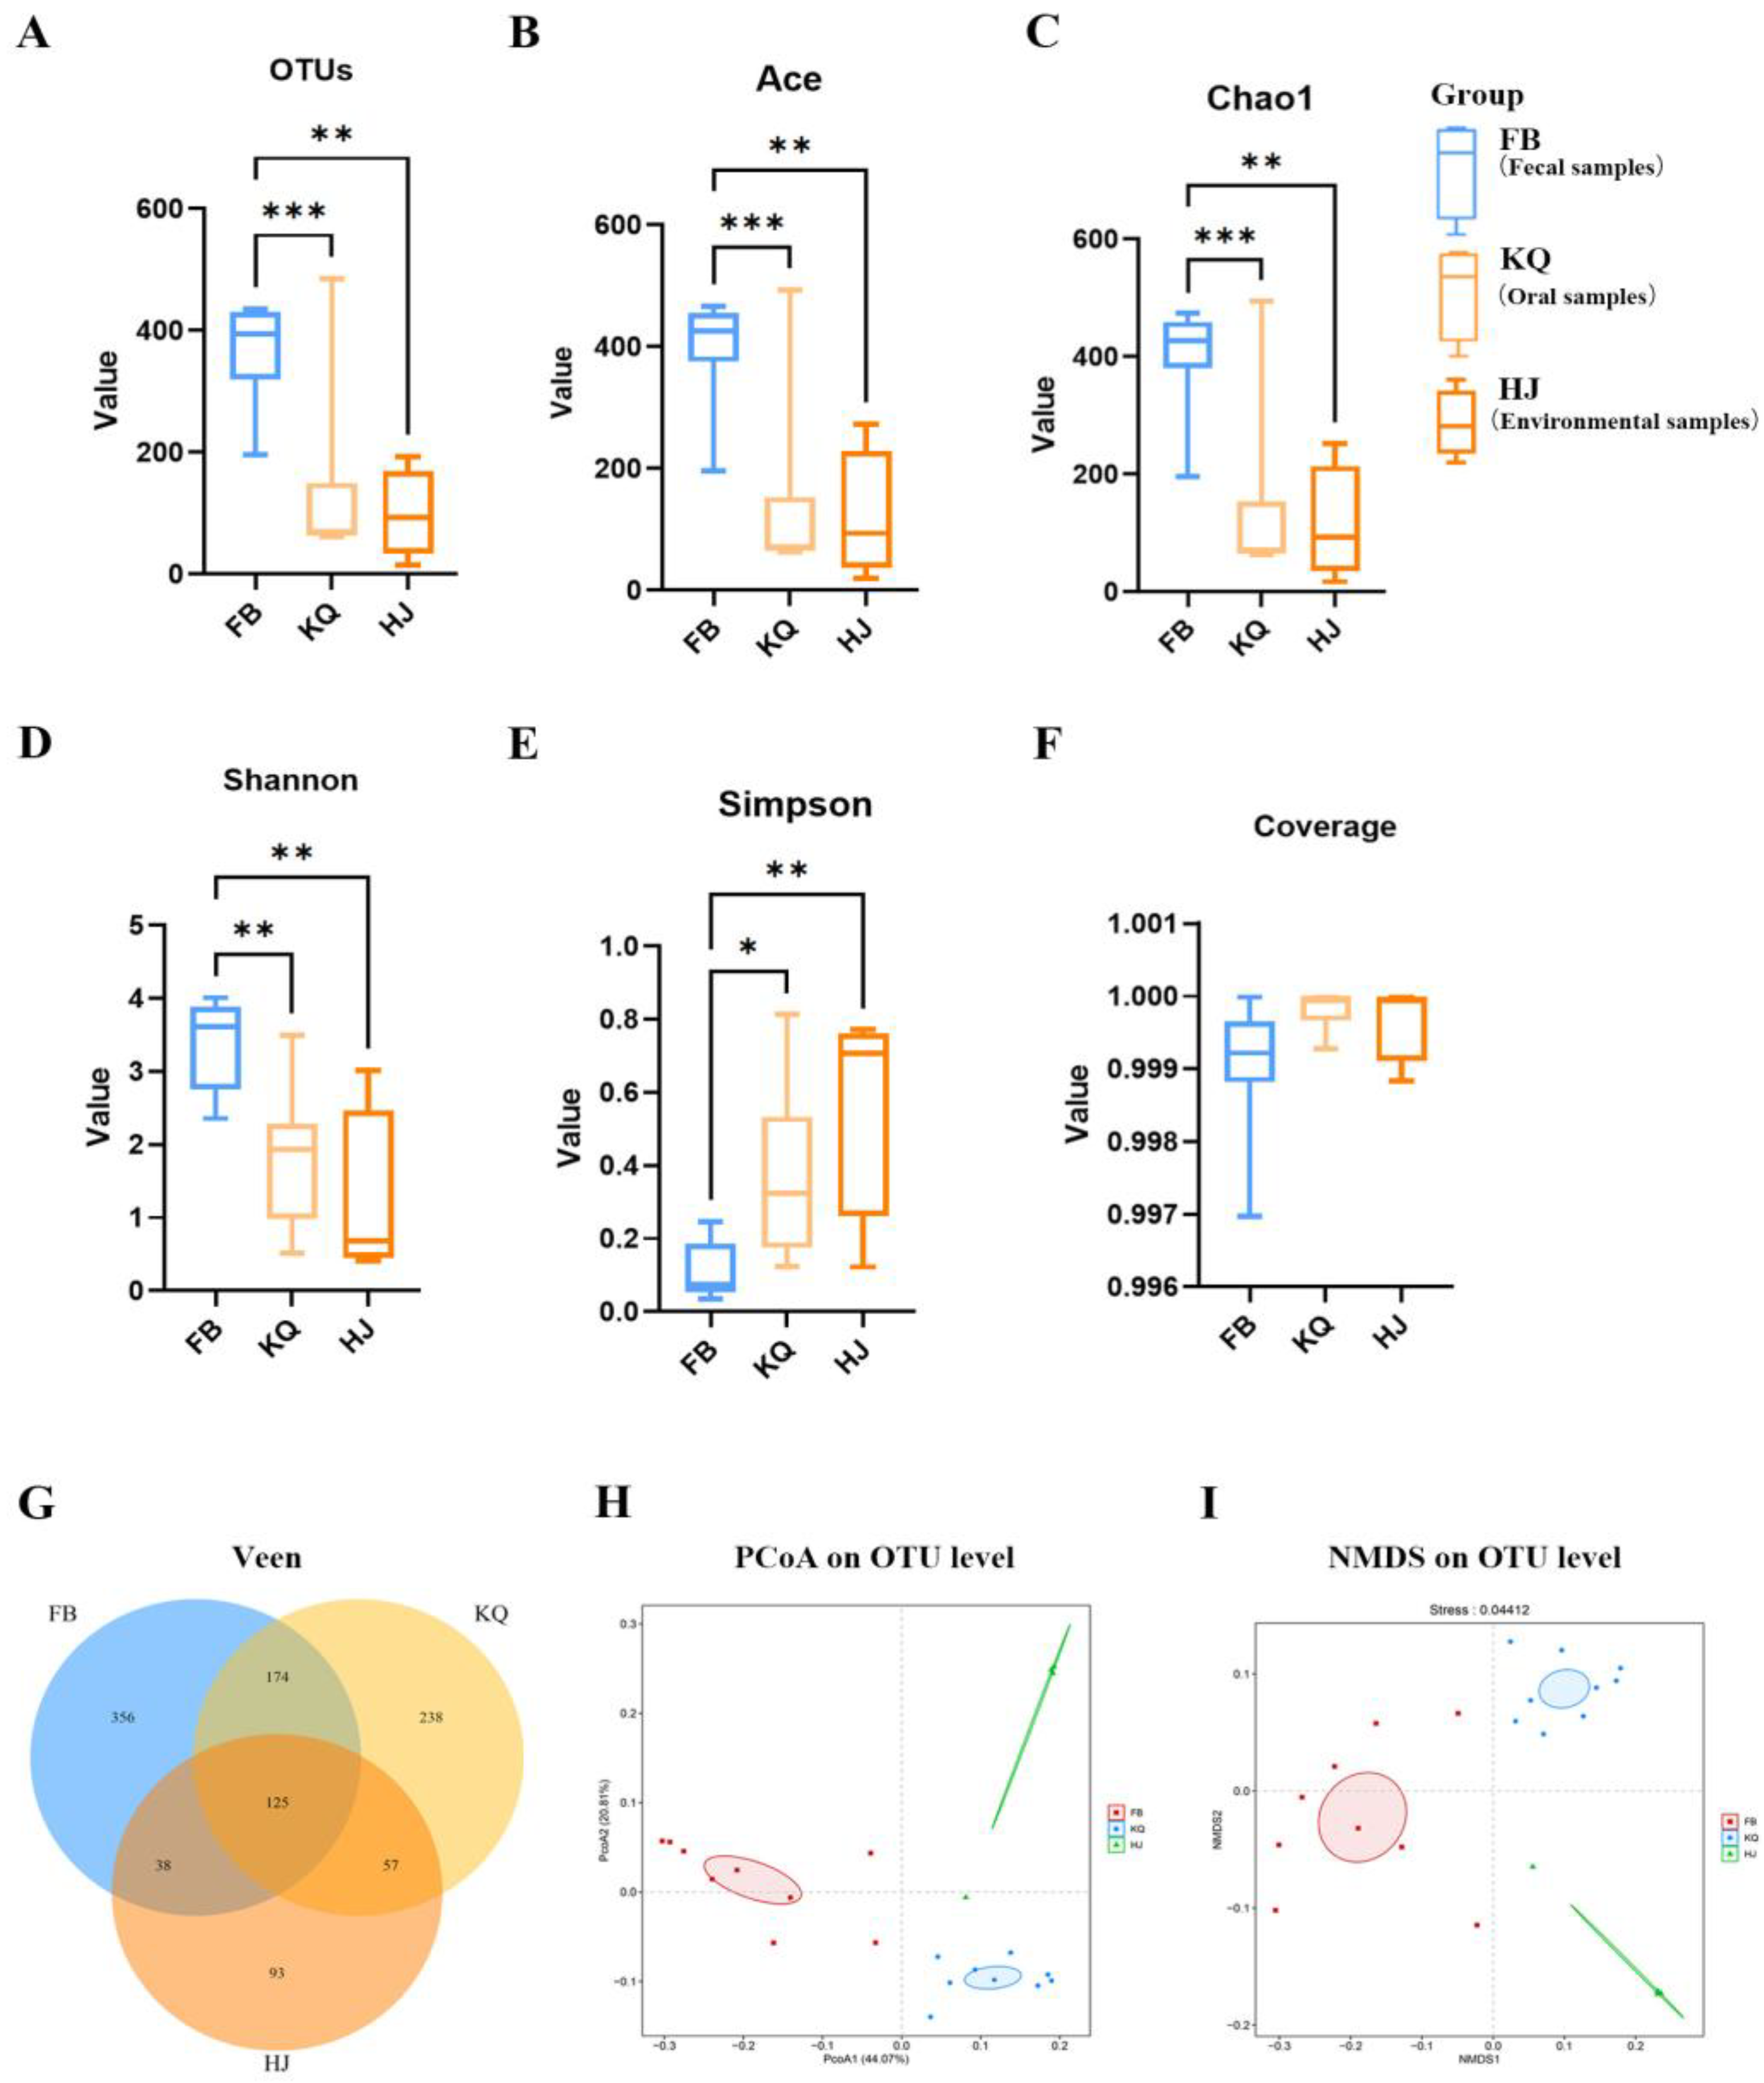
Figure 4.
Taxonomic composition of bacterial communities in fecal (FB), oral (KQ), and environmental (HJ) samples. Stacked bar plots show relative abundance at (A) phylum, (B) family, and (C) genus levels. The x-axis represents individual samples; the y-axis shows relative abundance (%). Color blocks represent different taxa, with widths proportional to their abundance. Taxonomic classifications are displayed for each corresponding level.
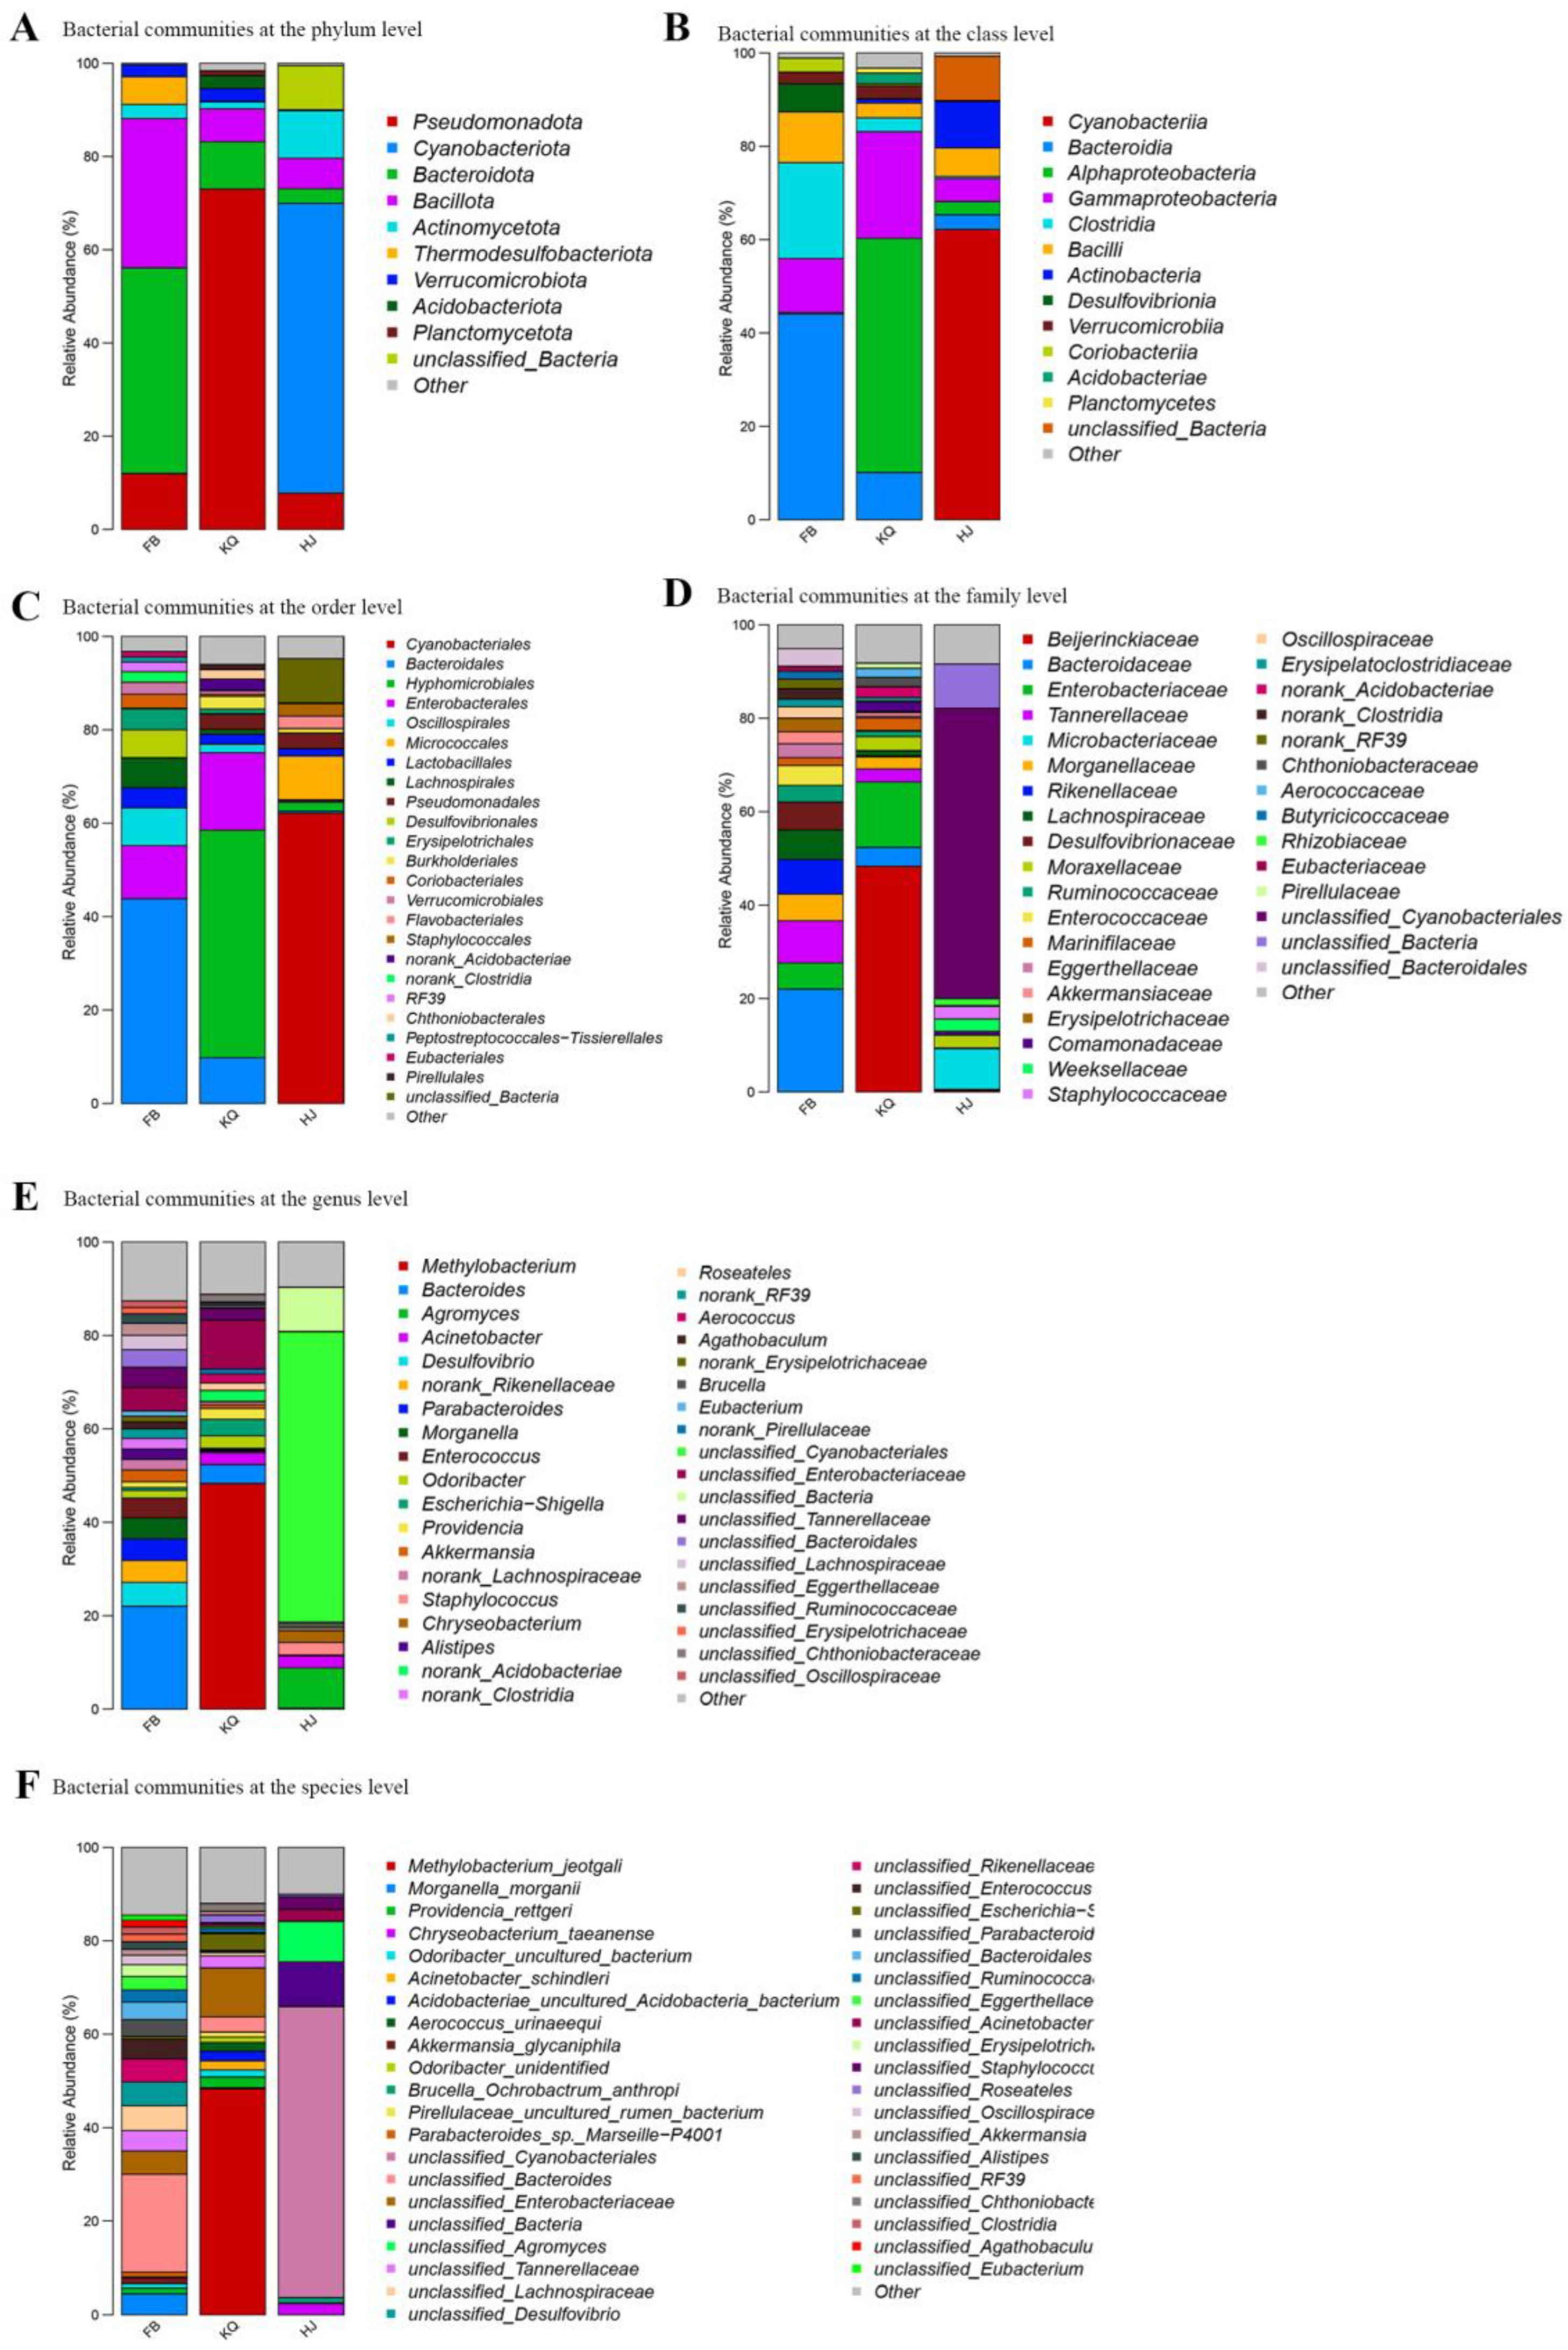
Figure 5.
Microbial community analysis using LEfSe. (A) Taxonomic cladogram showing biomarkers with LDA>3 (P<0.05) distinguishing fecal (FB, red), oral (KQ, green), and environmental (HJ, blue) groups in T. roborowskii. Concentric circles represent taxonomic levels from phylum (innermost) to species (outermost), with circle diameters proportional to relative abundance (p: phylum; c: class; o: order; f: family; g: genus; s: species). (B) Bar plot of differentially abundant bacteria with LDA scores >5, labeled by taxonomic name.
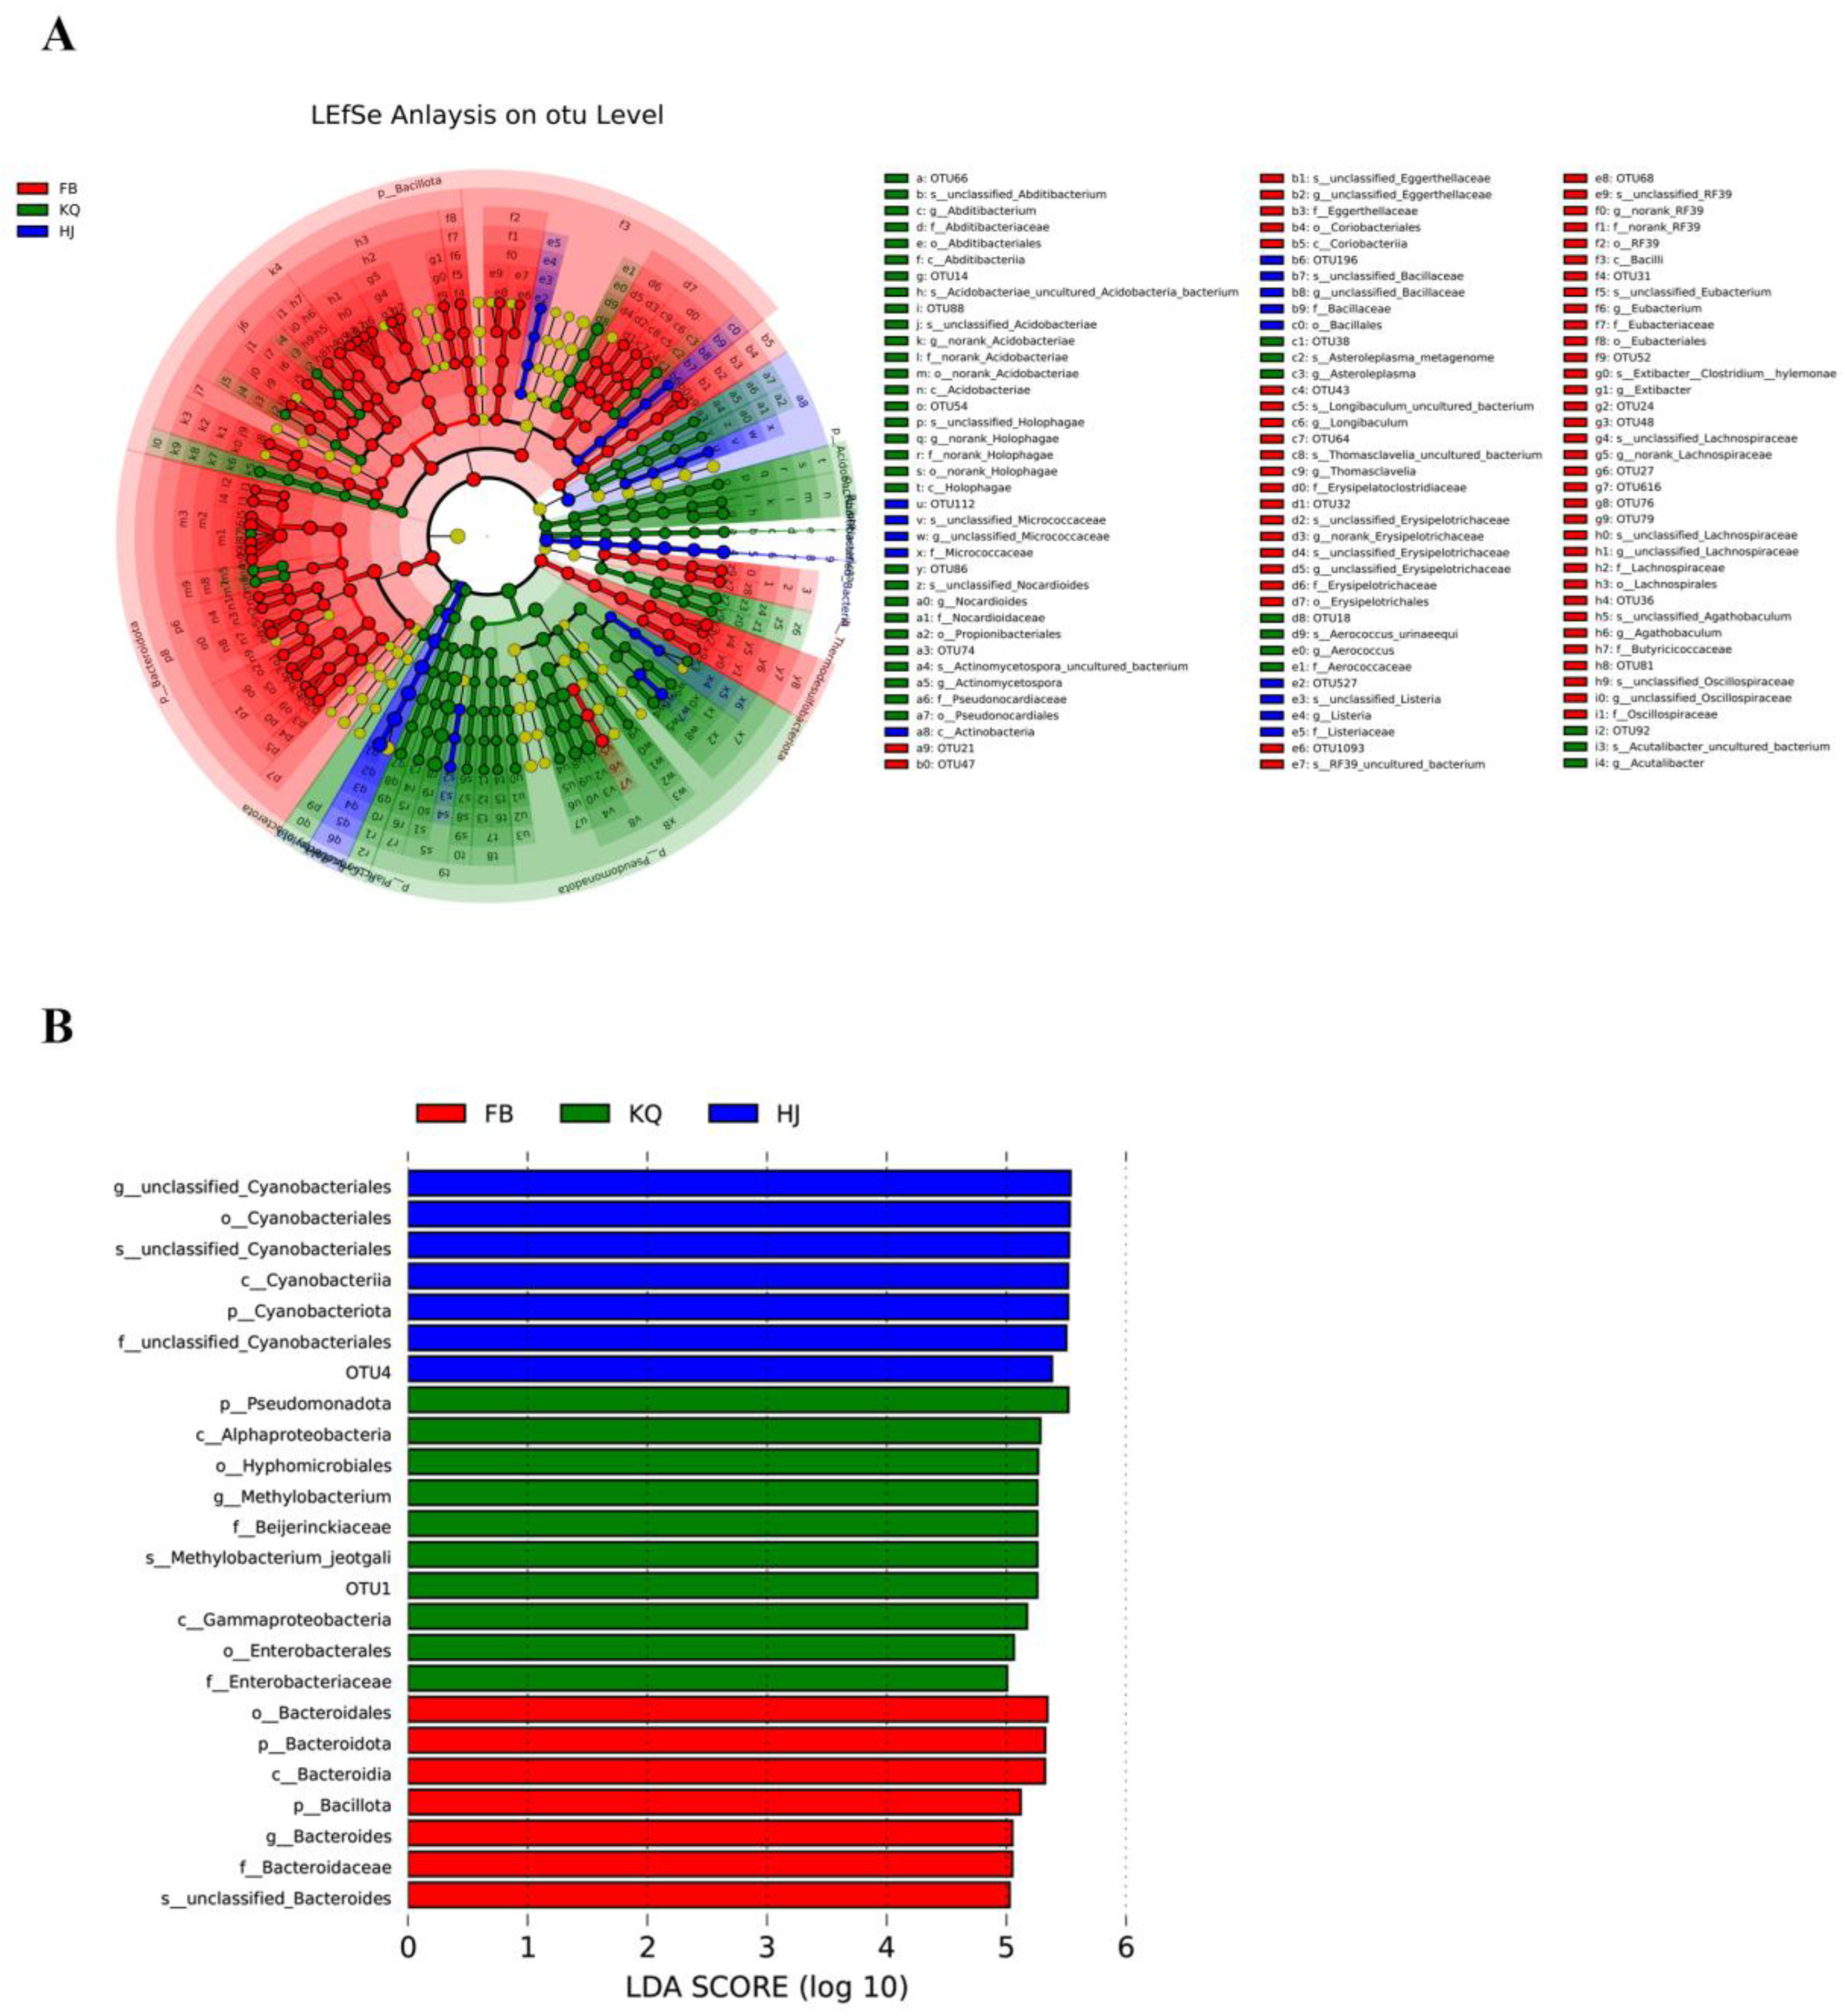
Figure 6.
Differential metabolic pathway analysis comparing fecal (FB), oral (KQ), and environmental (ZW) microbiomes using COG and KEGG annotations: (A) COG and (B) KEGG heatmaps display functional abundances across samples (red: high, blue: low); (C–E) COG and (F–H) KEGG bar plots show significantly divergent first-level pathways (P < 0.05, red bars) between FB vs. KQ (C, F), FB vs. ZW (D, G), and KQ vs. ZW (E, H), with y-axes indicating pathways and x-axes showing relative proportions.
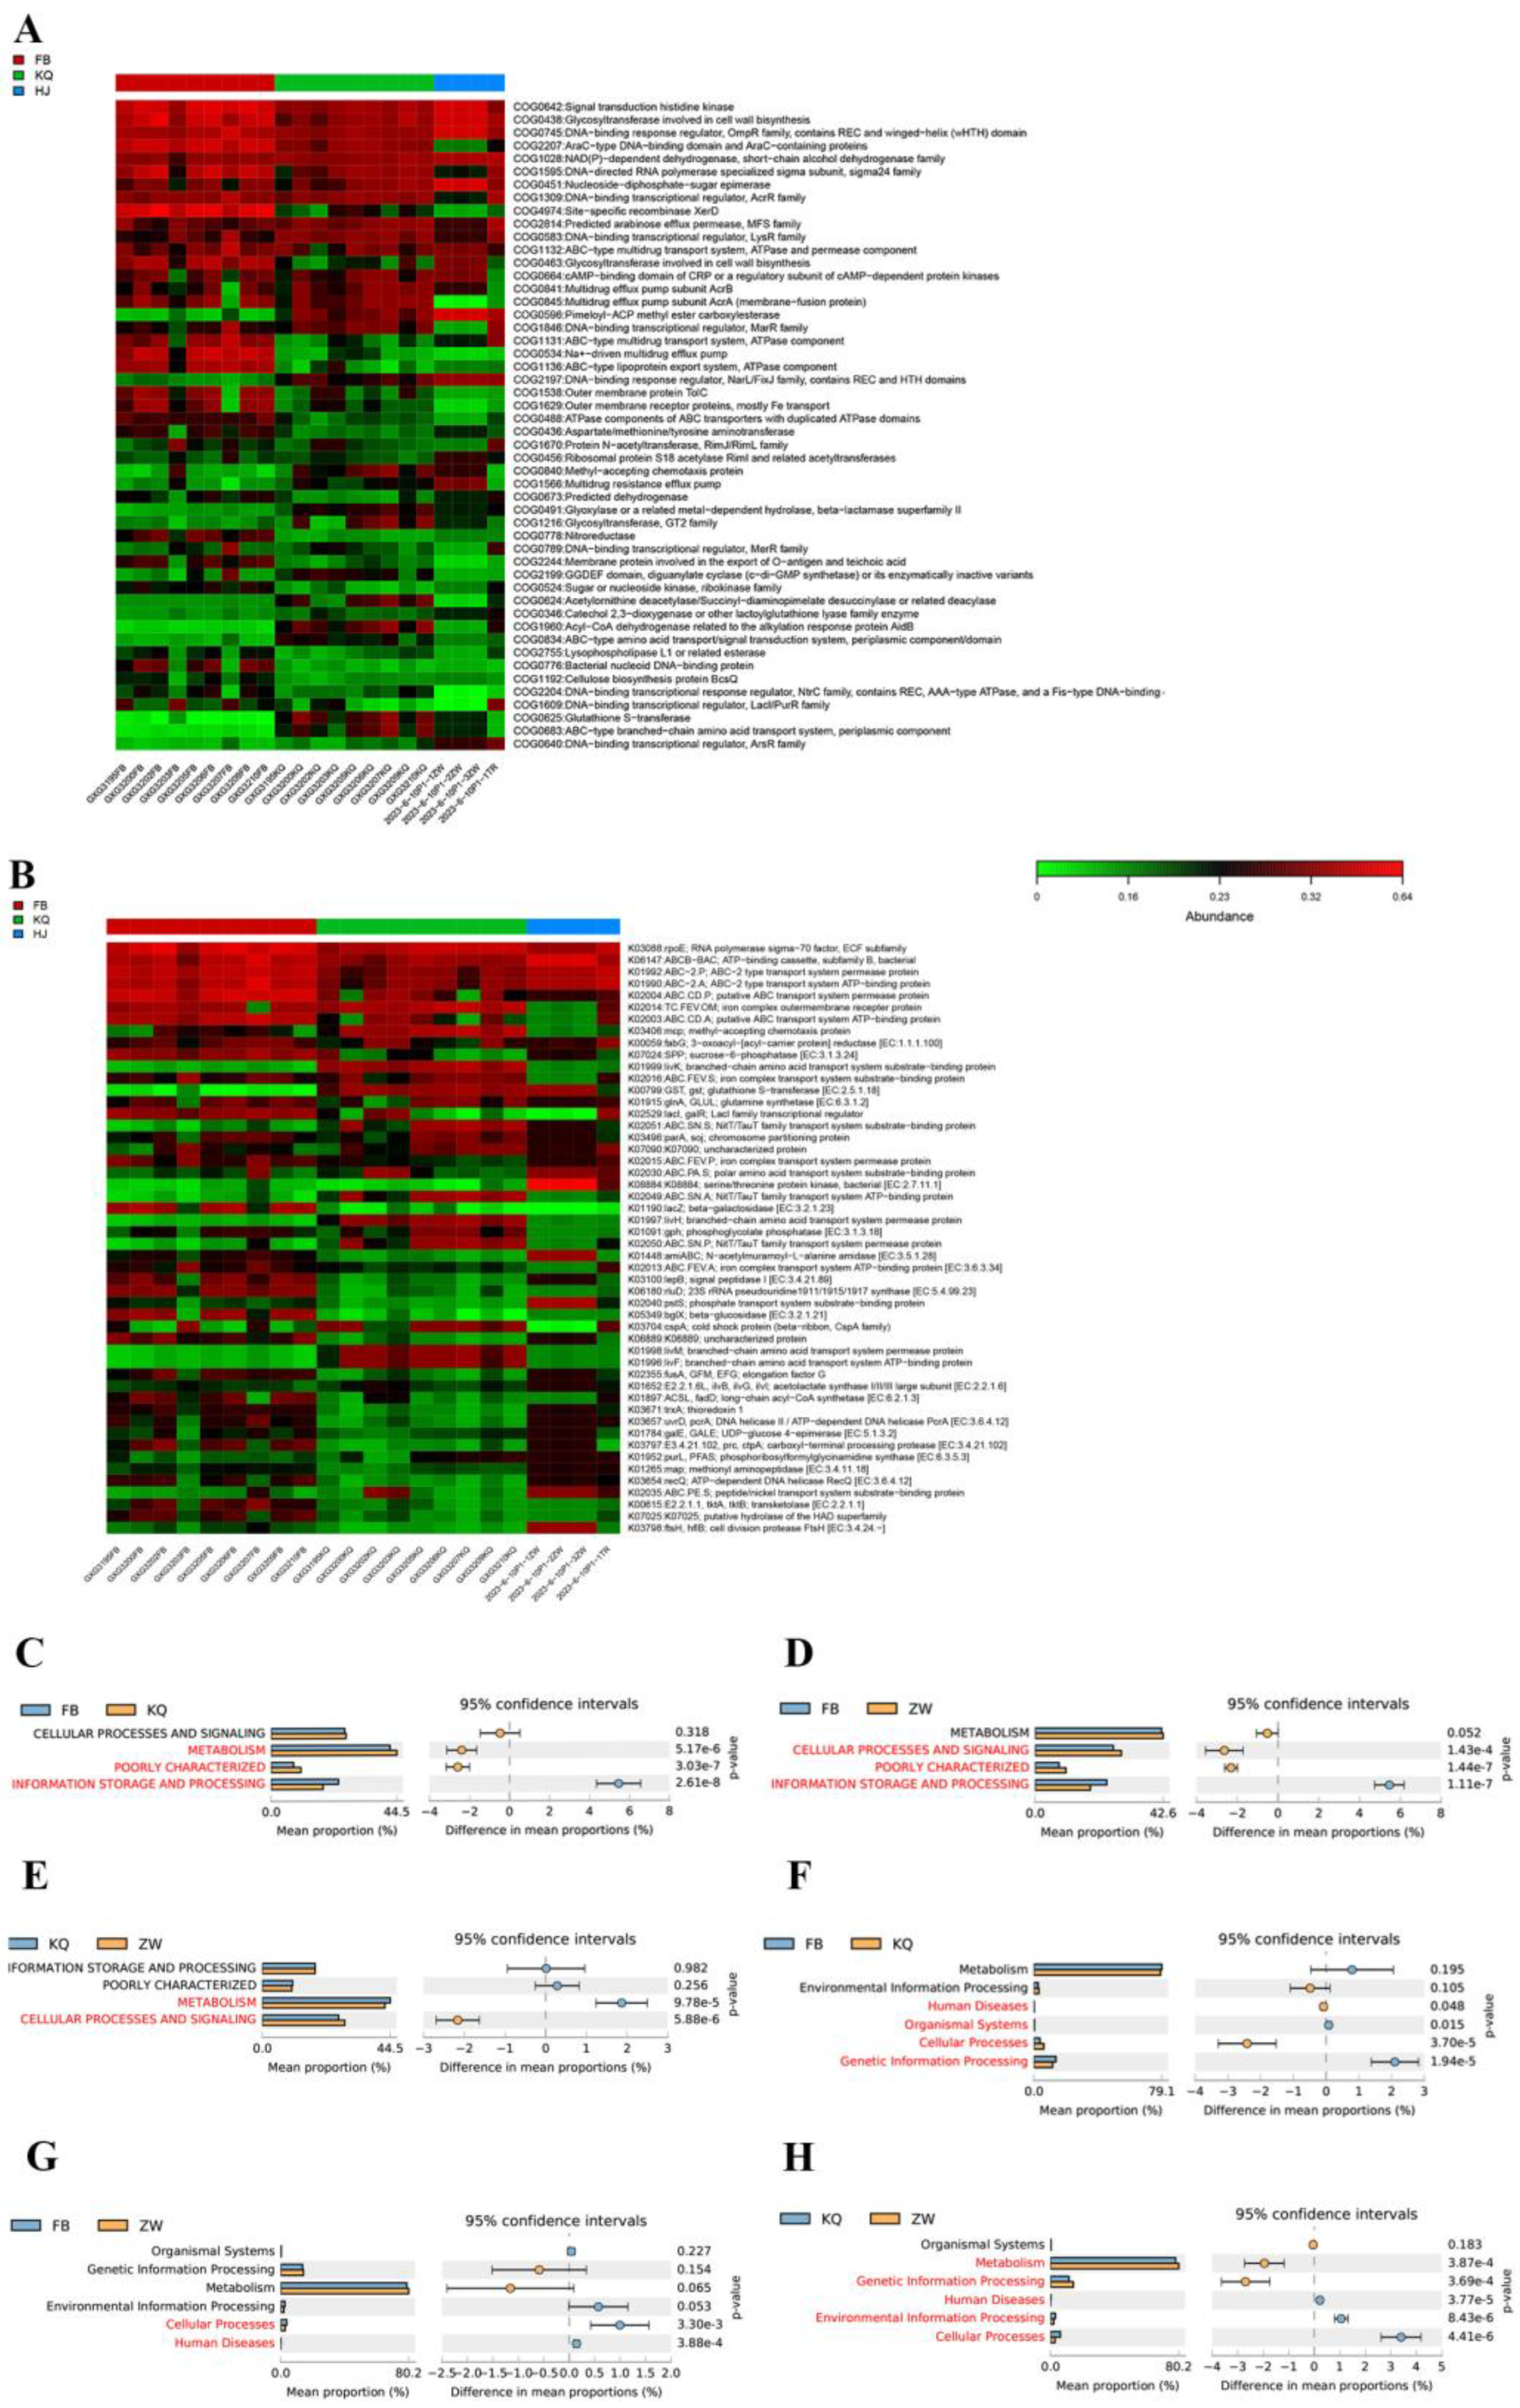
Figure 7.
Comparative analysis of second-level metabolic pathways reveals significant differences (P < 0.05, red) between sample groups: (A-C) COG pathways comparing FB vs. KQ (A), FB vs. ZW (B), and KQ vs. ZW (C); (D-F) KEGG pathways comparing FB vs. KQ (D), FB vs. ZW (E), and KQ vs. ZW (F). Vertical axes indicate metabolic pathways; horizontal axes show relative proportions of each pathway.
Disclaimer/Publisher’s Note: The statements, opinions and data contained in all publications are solely those of the individual author(s) and contributor(s) and not of MDPI and/or the editor(s). MDPI and/or the editor(s) disclaim responsibility for any injury to people or property resulting from any ideas, methods, instructions or products referred to in the content. |
© 2025 by the authors. Licensee MDPI, Basel, Switzerland. This article is an open access article distributed under the terms and conditions of the Creative Commons Attribution (CC BY) license (http://creativecommons.org/licenses/by/4.0/).
Copyright: This open access article is published under a Creative Commons CC BY 4.0 license, which permit the free download, distribution, and reuse, provided that the author and preprint are cited in any reuse.


