Submitted:
09 September 2025
Posted:
10 September 2025
You are already at the latest version
Abstract
High-performance nylon 6,6 webbings used in critical applications degrade under UV exposure, necessitating reliable methods to assess their residual strength non-destructively. This study investigates the feasibility of using instrumental color change as a predictive indicator for the loss of tensile strength. Four colors of nylon 6,6 webbings were subjected to accelerated xenon-arc UV weathering for up to 15 days. The resulting color change was quantified using both the CIELab and CIEDE2000 formulas, and residual tensile strength was measured following ASTM D6775. A regression analysis was performed to correlate these properties. The results demonstrate that a strong predictive relationship exists, but its efficacy is highly color dependent. Webbing with high initial chroma, namely tan (R2 = 0.889) and navy (R2 = 0.817), showed a strong correlation between color change and strength loss. In contrast, the models for low-chroma black and white webbings were weak and un-reliable. Furthermore, the simpler CIELab (ΔEab) formula provided slightly more accurate predictions than the more complex CIEDE2000 metric. It is concluded that colorimetry can be a viable non-destructive tool for predicting mechanical degradation, but its application is limited to specific high-chroma materials, precluding a universal model based entirely on colorimetry.
Keywords:
color
; nylon 66
; UV-Vis spectroscopy
; webbings
; UV
1. Introduction
Color has been a fundamental part of human history since prehistoric times, shaping societies, economies, and cultures for centuries [1], [2]. Today, it remains a powerful form of artistic expression, conveying emotions, cultural identity, and even gender [3]. Among the most accessible and widely used mediums for expressing color is textile dyeing, offering a vast array of possibilities [4].
In technical textiles, color serves functions that extend well beyond just visual appeal. These materials are engineered primarily for performance, and color is frequently employed to convey critical information regarding material properties and functional specifications [4]. For example, in critical safety harness systems, colored yarns are integrated into webbing structures to differentiate between varying grades, specifications, and performance attributes [5]. Such use of color facilitates quick visual identification and enhances safety and operational efficiency. However, exposure to environmental factors, particularly ultraviolet (UV) radiation, inevitably leads to degradation, with one of the most obvious signs being discoloration. While this color change is easily observed, its relationship to the underlying loss of mechanical integrity is not well understood.
To standardize the measurement of color, the International Commission on Illumination (CIE) introduced the CIELab color space in 1976, which otherwise could vary depending on the observer’s physiology, psychological state, and environmental influences. In this system three parameters are employed—L*, a*, and b*— to communicate and describe lightness, red-green, and yellow-blue components of the color measured [6]. Thus, allowing for the objective quantification of color difference (ΔE) between a standard and the sample, a metric that has been explored in various degradation studies. It is universally agreed that ΔE values above 2.7 indicating perceptibility to the human eye [7].
In a study by Cordeiro et al., the effects of UV exposure on the color and tensile properties of glass fiber-reinforced polymer (GFRP) composites were examined. While significant changes in ΔE were observed over time, no direct correlation with mechanical property degradation was established [8]. Conversely, Lan et al. reported a measurable correlation between mechanical properties and color variation in GFRP composites. Their findings indicated that the L* value (brightness) was the most sensitive indicator of degradation. They concluded that changes in brightness could potentially serve as a predictor for variations in tensile and flexural strength [6].
Building on this, studies have also incorporated gloss measurements as another potential indicator of degradation. Badji et al. investigated the impact of weathering on the microstructure and mechanical properties of wood-plastic composites (WPCs) [9]. Based on their previous work that relied on atomic-level imaging techniques such as Atomic Force Microscopy (AFM) and Scanning Electron Microscopy (SEM), this study incorporated CIELab and gloss analysis to explore alternative approaches for predicting mechanical degradation. While changes in L* were observed with increased exposure, no strong correlation with mechanical property loss was found. However, a positive correlation was noted between gloss and mechanical properties, linking it to surface microcracking observed via SEM.
This study aims to address this gap by systematically investigating the relationship between colorimetric changes, gloss, and the residual tensile strength of UV-degraded, high-performance nylon 6,6 webbings used in safety harness systems. By analyzing four distinct colors under controlled accelerated weathering, this research seeks to determine if a robust, non-destructive predictive model can be developed. Specifically, it evaluates the efficacy of both the CIELab (ΔEab) and the more complex CIEDE2000 (ΔE00) formulas to test the central hypothesis: that instrumental color change can serve as a reliable proxy for mechanical degradation in these critical materials.
2. Materials and Methods
Webbings used in safety harnesses in the military are subjected to rigorous testing protocols and must meet strict military specifications prior to deployment by the U.S. military, as the failure of even a single component can result in catastrophic loss of personnel and equipment [5], [10], [11], [12]. In our previous study, we examined the effects of ultraviolet (UV) exposure on the surface morphology and chemical structure of these webbings, particularly those deployed at military installations in the extreme environmental conditions of Arizona [13]. Building upon that work, the present study investigates the color changes associated with UV-induced degradation and explores the potential correlation between discoloration and tensile strength loss. The goal of this study is to evaluate the feasibility of a color-based nondestructive testing (NDT) method for in-situ assessment of webbing integrity.
2.1. Material
2.2. Sample Preparation
The samples were initially conditioned under standard environmental conditions, 21 ± 1 °C and 65 ± 2% RH. A total of 36 samples of 36 inches were cut from 200yds rolls for all 4 colors conforming to ASTM D6775-13 Standard Test Method for Breaking Strength and Elongation of Textile Webbing, Tape and Braided Material [14].
2.3. UV Weathering
UV weathering was performed using Ci4000 Xenon-Arc Weather-Ometer from Atlas/Ametek (Mount Prospect, IL, USA). In this study the webbings were exposed continuously with the irradiance control set to 1.5 sun equivalent or 0.83 W/(m2 nm) at 340nm under Arizona (dry) conditions, 43°C and 30% relative humidity in the chamber. The irradiance was set to 1.5 sun to accelerate UV degradation. Table 2 shows that the degradation time is equal to 2.7x of the lamp hours in the weatherometer, the calculations for which are reported in the previous study [13]. Six samples were removed at 3-day intervals up to 15 days for each color. The webbings were mounted on the Weather-Ometer racks using heavy duty clips as seen in Figure 2.
2.4. Color and Gloss Measurement
Color and gloss were measured for control and exposed samples using Spectro-Guide Sphere Gloss S from BYK-Gardner USA (Columbia, MD, USA). The resultant L*, a*, b* coordinates of color were used to calculate ΔE according to both CIE76 and CIEDE2000 following ISO/CIE 11664-4:2019 “Colorimetry — Part 4: CIE 1976 L*a*b* Colour space” and ISO/CIE 11664-6:2022 “Colorimetry – Part 6: CIEDE2000 Colour-difference formula” respectfully [15], [16]. The color difference formula in accordance to the CIE76 is shown in equation (1) and CIEDE2000 is shown in equation (2).
where ΔL’ is the lightness difference; ΔC’ is the chroma difference; ΔH’ is the hue difference; SL, SC, SH are weighing functions of lightness, chroma and hue; kL, kC, kH are parametric factors of lightness, chroma and hue (for textiles kL is 1.5-2 while kC and kH are 1) [16], [17], [18].
To calculate the color difference, first the L*, a*, b* values from the spectrophotometer should be transformed into L’, a’, b’ and C’, h’ are calculated following formulae (3) - (7),
where G in formula (3) is the switching function calculated using formula (8)
C* is calculated from the CIELab values of the control and test sample, denoted by subscript 0 and 1 respectively using formula (9) - (10)
The differences between the samples, denoted by subscript 0 for control and 1 for test sample is calculated according to formulae (11) – (14),
while the weighting factors in formula (1) are calculated using the formulae (15) – (21).
where are the arithmetic means of the measurements of 2 samples.
The gloss index measurements at 60° angle of incidence were also measured using spectro-guide from BYK-Gardner USA and will be reported as GL for this study.
2.5. Tensile Strength
Tensile evaluation for each sample was completed on Landmark Servohydraulic test system from MTS (Eden Prairie, MN, USA) based on ASTM D6775-13 Standard Test Method for Breaking Strength and Elongation of Textile Webbing, Tape and Braided Material [14]. The split-drum fixtures were first mounted to the MTS Landmark’s hydraulic wedges with a pressure of 2 kPa. One end of the 36-inch sample was inserted between the two halves of the upper fixture and wrapped around the drums once. The webbing was then wrapped around the lower fixture once before the other end was inserted between the two halves of the fixture. The setup of the clamps with webbings is shown in Figure 3. The samples were preloaded to ~4500N (~1000lbs) of tension (required due to the traversal limitations of the test frame) [13]. The test was performed under standard environmental conditions, 21 ± 1 °C and 65 ± 2% RH, under a constant rate of elongation (CRE) of 3 in/min.
2.6. Statistical Analysis
The study’s test results were evaluated statistically for normal distribution and effect size using JMP 18 software package from JMP (Cary, NC, USA). The significant level or alpha (α) is set to 0.05 to give confidence of 95%, any P value lower than the α will be statistically significant. Regression analyses were conducted using JMP 18 and Origin 2023b software package from OriginLab Corp. (Northampton, MA, USA). Data processing and visualization were conducted using Origin 2023b.
3. Results and Discussion
Based on the experimental methods described in the previous section, quantitative analyses of color change and tensile strength loss were conducted to assess whether visual indicators can reliably predict mechanical degradation
3.1. UV Exposure
UV exposure in the xenon-arc Weather-Ometer resulted in a clear progression of color change, with samples appearing increasingly lighter when viewed under a lightbox equipped with a CIE D65 daylight-simulating light source. The extent of this change became more perceptible to the naked eye with longer UV exposure durations. This trend was consistent across all colors except for the white webbings, which exhibited minimal visible change, as shown in Figure 4.
3.2. Color and Gloss Difference
To quantify these visual observations, colorimetric data were collected using the CIELab system, and changes in lightness (L*), red-green (a*), yellow-blue (b*) and gloss value (GL) were plotted over time to evaluate the degree of discoloration. The findings are shown in Figure 5, below.
3.2.1. Color Difference
The color coordinates of the six unexposed samples of each color were averaged and set as the control or reference coordinates for their respective color. Figure 5(a) shows increasing lightness values (L*) of all colors, although the increase for white was less significant than for the other colors. This could be the result of degradation of dye molecules on the surface of the webbing. The general trend in reduction of a* and b* in Figure 5(b)-(c) are consistent with the findings in literature [8], [19], [20]. It is important to note that the color coordinates are independent of each other and do not influence one another directly in the CIELab color space. As a result, changes in L*, a*, or b* represent distinct aspects of color alteration and should be interpreted separately when analyzing color degradation.
To quantify the magnitude of color change, these components are combined into a single metric, color difference (ΔE), which allows for quantitative measure of color change over time. The most common approach in textiles is to use CIELab as given by equation (1). It is simple and often provides good agreement with observations by observers with average color perception. In contrast, the CIEDE2000 formula is more complex and accounts for subtler changes in color [21]. CIEDE2000 also applies weighting and corrections for non-uniformity in human color perception [16]. The resultant color change over time is shown in Figure 6.
Figure 6 shows there is significant change in color as the duration of exposure increases. It is generally accepted that ΔE values between 1.0 – 3.7 correspond to the perceptibility of color difference, while values between 2.7–6.8 correspond to the acceptability of that difference [21], [22], [23]. In textiles aesthetics also play a crucial role in discerning any materials’ utility, while ΔE of 1 would be ideal since the human perception varies from person to person; hence in this study, a ΔE value of 2.7 is set as the acceptable and perceivable limit for an average observer. In doing so, it is observed that CIELab formula overestimates the change in comparison to CIEDE2000. This is attributed to the CIELab formula measuring the simple Euclidean distance between colors, while CIEDE2000 corrects for human perception of chroma and hue. However, the trend observed for both calculations shows increasing color change with increasing exposure duration. CIELab and CIEDE2000 both agree that the color change in white webbings is imperceptible to an untrained human eye but disagree regarding the other colors. The CIELab formula shows perceptible color change (≥ 2.7) after 6 days of exposure for all colors, while CIEDE2000 shows that the perceptible color change only occurs after 9 days for black webbings and 15 days for both tan and navy webbings. This result is consistent with the corrections in the CIEDE2000 formula, accounting for poor human perception of differences in high-chroma colors (namely blues and yellows), a fact supported by the Δb* coordinates of the tan and navy webbings in Figure 5 (c).
Normality of CIELab and CIEDE2000 were assessed within each of the 24 color-exposure duration groups using the Shapiro–Wilk test. All groups yielded p-values greater than 0.05, indicating that the null hypothesis of normality could not be rejected. Given that the assumption of normality was met across all groups, a two-way ANOVA was conducted to examine the effects of color and UV exposure duration on color change. Interaction effects between color and exposure were also evaluated.
A two-way ANOVA was performed to assess the effects of color and UV exposure duration on color difference for both CIELab (ΔEab) and CIEDE2000 (ΔE00). The main effect of color was not statistically significant (F(3, 120) = 1.26 and 1.125; p = 0.2907 and p = 0.3417, respectively), indicating that the magnitude of color change did not differ significantly between colors when averaged across exposure durations. However, exposure duration had a significant effect on ΔE (F(5, 120) = 549.58 and 125.45, respectively; p < 0.001 for both), suggesting that total color difference increased with longer UV exposure. Additionally, a significant interaction was observed between color and exposure duration (F(15, 120) = 190.54 and 136.78, respectively; p < 0.001 for both), indicating that the pattern of color change over time varied among different colors. This interaction implies that while overall color change may not differ significantly between colors, the rate and trend of color degradation across exposure times are color dependent.
3.2.2. Gloss
In this study, gloss was measured in gloss units (GL), which is a relative measure compared to a high-gloss standard with a defined value of 100 GL at a 60° angle of incidence. It is typically expected that gloss will decrease with increasing UV exposure duration [20], [24], [25]. However, the GL values observed in this study for all colors increased as exposure duration increased contrary to the literature as shown in Figure 5(d).
To analyze these changes, the normality of GL data was assessed within each of the 24 color-exposure duration groups using the Shapiro–Wilk test. All groups yielded p-values greater than 0.05, indicating that the null hypothesis of normality could not be rejected. Given that the assumption of normality was met across all groups, a two-way ANOVA was conducted to examine the effects of color and UV exposure duration, as well as their interaction effect, on gloss change. The results were similar to those observed for color change. The main effect of exposure duration and the interaction effect between color and exposure were both statistically significant (p < .0001). However, the main effect of color was not significant (p > 0.05), indicating that, while no single color was inherently more susceptible to gloss change, the specific pattern of change over time was dependent on the color.
These findings can be attributed to two concurrent physical mechanisms observed in polymers. First, the degradation of dye molecules could result in exposure of the underlying substrate. As UV exposure breaks down the dyes, the inherently glossier nylon 66 filaments becoming the dominant light-reflecting surface could also be the reason for increasing L* values in Figure 5(a). This is supported by the high gloss measured for the white webbings, which are manufactured without dyes and are thus representative of the base nylon 66 filament characteristics. Second, it is observed that UV exposure can induce UV planarization on polymer surface [24]. This results in degradation of the initial asperities and peaks on the webbing's surface resulting in surface flattening. This reduction in surface roughness could in turn increase the reflection of incident light from the spectrophotometer, registering as higher gloss.
However, these gloss-increasing effects do not continue indefinitely. The data for the white webbings show that gloss increases up to 12 days of exposure but declines after 15 days. This reversal reveals a complex, non-monotonic relationship between UV exposure and gloss, governed by competing physical mechanisms that dominate at different stages of degradation. Initially, effects like dye removal and UV planarization could cause gloss to rise. Subsequently, as polymer chain scission becomes more severe, destructive mechanisms such as surface pitting and micro-cracking could begin to dominate, causing a decrease in gloss. However, confirming the presence and influence of these competing mechanisms would require direct characterization using other analytical techniques, such as SEM or atomic force microscopy AFM. Moreover, 15-day duration of this study was only sufficient to capture the initial rise and the very beginning of the subsequent decline.
Given this complex behavior, a simple linear regression analysis would be statistically inappropriate and misleading. To accurately model this relationship a non-linear approach (such as a polynomial regression) is required and would necessitate data from a much longer exposure study to fully capture the entire degradation curve. Because the underlying mechanism is not yet fully characterized and the current data only represents the initial phase of a complex process, a regression analysis correlating gloss with tensile strength was not performed.
3.3. Tensile Strength
The mechanical properties of the webbings subjected to different durations of UV exposure were tested following the ASTM D6775 standard. A preload of 4500 N (1000 lbf) was applied because the machine's traversal limit of 170 mm was insufficient to break the high-strength webbings without it. While ASTM D6775 requires testing only a single 36-inch sample to characterize a sample lot, this study tested six replicates for each color at each exposure duration to improve the reliability and accuracy of the results. This analysis builds upon our previous work and utilizes tensile data from our investigation into the accelerated UV degradation of nylon 6,6 [13]. The results of the tensile tests are shown in Figure 7 (a)-(b).
While tensile strength was the primary outcome, elongation data were omitted from this report. The use of preload that exceeds beyond the requirement for removing initial slack causes significant extension that is not recorded and prevents the accurate determination of true zero strain starting point; therefore, elongation data were excluded in the analysis.
To assess the significance of color on mechanical properties, normality of the tensile data was also assessed for each of the 24 color-exposure duration groups using the Shapiro–Wilk test. All groups yielded p-values greater than 0.05, indicating that the null hypothesis of normality could not be rejected. A subsequent two-way ANOVA revealed that the main effects of color and exposure duration, as well as their interaction effect were all statistically significant (p < 0.05). Thus, indicating tensile strength was dependent on the color, the exposure duration and a combination of the two factors.
3.4. Color Difference vs Tensile Strength
The ANOVA results from the previous sections confirmed UV exposure significantly impacts both tensile strength and color. To investigate the potential correlation between the two properties, which forms the basis for a non-destructive predictive model, a regression analysis was performed. The analysis modelled the relationship between tensile strength and color change calculated using both the CIELab (ΔEab) and CIEDE2000 (ΔE00) formulas.
3.4.1. CIELab (ΔEab) vs Tensile Strength
Based on the preceding spectral and mechanical analyses, the relationship between tensile strength and CIELab color change (ΔEab) was plotted, as shown in Figure 8.
A linear regression analysis was performed to model the relationship between CIELab (ΔEab) and tensile strength. The results of the regression analysis are given in Table 3, below while the model fit is shown in Figure 8.
To first establish an overall trend, a linear regression model was fitted to the entire dataset, combining all colors. The results show a statistically significant negative correlation between color change and tensile strength (p < .001). However, the R-squared value (R2 = 0.595) indicates that this general model is insufficient for accurate prediction. This suggests that the relationship is not uniform across all samples which is consistent with the significant interaction effect found in the ANOVA tests. Hence, regression analysis was performed for each color to develop more robust and precise predictive relationships. The analysis reveals a negative correlation between color change and tensile strength stays true for all colors. However, the coefficients in the equations differ for each color, confirming that the rate of strength loss per unit of color change is dependent on the specific color and exposure interaction.
The analysis yielded high R-squared values for tan (R2 = 0.889) and navy (R2 = 0.817), confirming the observed trend in the graph. The analysis also showed poor R-squared values for white (R2 = 0.175) and black (R2 = 0.457) webbings, although the p-values show statistical significance, the model is only able to predict a fraction of the tensile strength correctly.
The predictive efficacy of the CIELab regression model appears to be strongly correlated with high chroma colors. The highest coefficients of determination were observed for the tan and navy colors, which possess the largest magnitudes in their respective b* and a* coordinates – the primary drivers of chroma (C*). This finding is significant, as it indicates that substantial, instrumentally measured colorimetric shifts provide robust indicators of polymer degradation, though this predictive relationship appears limited to materials with high initial chroma. To validate and generalize this conclusion, future work should examine a broader palette of high-chroma webbings, such as those with vibrant red or green dyes.
3.4.2. CIEDE2000 (ΔE00) vs Tensile Strength
Given the weak correlation observed when using the CIELab formula for white and black webbings, the analysis was repeated using the more perceptually uniform CIEDE2000 color difference formula (ΔE00). The relationship between tensile strength and ΔE00 is plotted in Figure 9.
The results of the regression analysis are given in Table 3, below while the model fit is shown in Figure 9 for tensile strength and ΔE00.

Table 4.
Regression models for predicting tensile strength from CIEDE2000 color change (ΔE00).
| Color | Regression Equation | R2 | p |
|---|---|---|---|
| All colors | Tensile Strength = 6611.64 - 412.28 × ΔE00 | 0.578 | < 0.0001 |
| White | Tensile Strength = 6710.77 - 272.92 × ΔE00 | 0.160 | 0.0155 |
| Tan | Tensile Strength = 6952.33 - 797.34 × ΔE00 | 0.883 | < 0.001 |
| Black | Tensile Strength = 6221.78 - 235.43 × ΔE00 | 0.460 | < 0.0001 |
| Navy | Tensile Strength = 6760.00 - 478.16 × ΔE00 | 0.803 | < 0.0001 |
When the analysis was repeated using the CIEDE2000 (ΔE00) formula, the overall trend for the combined dataset was still negative and statistically significant (p < .001). However, the model's predictive power did not improve; the R-squared value was slightly lower at 0.578, confirming that a general model remains insufficient for accurate prediction. Furthermore, when regression models were fitted for each individual color, the resulting R-squared values were consistently lower than those obtained using the simpler CIELab formula. This key finding suggests that for this material system, the additional complexity of the CIEDE2000 formula offers no advantage for predicting mechanical degradation. Therefore, the simpler CIELab (ΔEab) model is the more effective and practical choice.
4. Conclusions
This study investigated the potential of using color change as a non-destructive predictor for the tensile strength of UV-degraded nylon 6,6 webbings. The results demonstrate that the efficacy of this method is highly dependent on the material's color. A strong, reliable correlation was established for webbings with high initial chroma, namely tan (R2 = 0.889) and navy (R2 = 0.817). In contrast, the coefficient of determination of the model was poor for the neutral, low-chroma black and white webbings, confirming that a universal predictive model is not feasible.
A key secondary finding was that the simpler CIELab (ΔEab) formula yielded slightly more accurate predictions than the more complex, perceptually uniform CIEDE2000 formula. Additionally, an unexpected increase in gloss was observed with initial UV exposure, contrary to findings in broader literature. This was attributed to two concurrent mechanisms: the degradation of surface dyes exposing the inherently glossier nylon substrate, and UV-induced surface planarization.
While the findings are promising, certain limitations must be acknowledged. This study was performed specifically on nylon 6,6 and the exact dye chemistry and manufacturing processes were proprietary and not provided by the manufacturer. Furthermore, the degradation study was conducted under accelerated laboratory conditions, which may not perfectly replicate real-world weathering. The generalizability of these conclusions to other polymers, such as polyester or polypropylene, also remains unknown. However, this investigation provides a crucial foundation for future research. To validate the chroma hypothesis, studies should be expanded to include a broader palette of high-chroma colors. The proposed surface degradation mechanisms should also be directly investigated using techniques like scanning electron microscopy (SEM) and atomic force microscopy (AFM). Finally, the regression model for predicting tensile strength developed here should be tested on outdoor-weathered samples to assess their real-world accuracy and utility.
Author Contributions
Funding from Naval Air Warfare Center Weapons Division secured by Girish Srinivas, Brady J. Clapsaddle and David Eisenberg. All authors contributed to the study conception. Study design, material preparation, data collection and analysis were performed by Nilesh Rajendran under project supervision of Emiel DenHartog. The first draft of the manuscript was written by Nilesh Rajendran and reviewed by Emiel DenHartog, Girish Srinivas, Brady J. Clapsaddle and David Eisenberg. All authors read and approved of the final manuscript.
Funding
This material is based upon work supported by the Naval Air Warfare Center Weapons Division, China Lake, CA under Contract No. N6893621C0024. Any opinions, findings and conclusions or recommendations expressed in this material are those of the author(s) and do not necessarily reflect the views of the Naval Air Warfare Center Weapons Division, China Lake, CA.
Data Availability Statement
The data presented in this article are not readily available due to their proprietary and commercially sensitive nature. Requests to access the datasets should be directed to Brady J. Clapsaddle (bclapsaddle@tda.com) and the corresponding author, Nilesh Rajendran (nrajend@ncsu.edu).
Acknowledgments
Authors would like to thank Dr. Madilynn Smith (NC State), Judy Elson (NC State), Dr. Bryan Ormond (Milliken TPACC, NC State), and Dr. Renzo Shamey (NC State) for their technical and analytical expertise.
Conflicts of Interest
Authors David Eisenberg, Brady J. Clapsaddle, and Girish Srinivas were employed by the company TDA Research, Inc. The remaining authors declare that the research was conducted in the absence of any commercial or financial relationships that could be construed as a potential conflict of interest.
Abbreviations
The following abbreviations are used in this manuscript:
| UV | Ultraviolet |
| SEM | Scanning electron Microscopy |
| AFM | Atomic force microscopy |
| ASTM | American Society for Testing and Materials |
| ISO | International Organization for Standardization |
| L* | CIELab lightness |
| a*, b* | CIELab a*, b* coordinates |
| ΔEab | CIELab color difference |
| C* | CIELab chroma |
| h | CIELab hue angle |
| L’ | CIEDE2000 lightness |
| a’, b’ | CIEDE2000 adjusted a*, b* coordinates |
| C’ | CIEDE2000 adjusted chroma |
| h' | CIEDE2000 adjusted hue angle i.e., angular position of point a’, b’ between 0° to 360° |
| G | Switching function to modify CIELab a* coordinate to a’ used in CIEDE2000 |
| ΔL’ | CIEDE2000 lightness difference |
| ΔC’ | CIEDE2000 chroma difference |
| Δh’ | CIEDE2000 hue angle difference |
| ΔH’ | CIEDE2000 hue difference |
| ΔE00 | CIEDE2000 color difference |
| SL | Lightness weighting function – adjust for human sensitivity |
| SC | Chroma weighting function – adjust for human sensitivity |
| SH | Hue weighting function – adjust for human sensitivity |
| T | T-function for hue weighting – adjust for high red-blue and low yellow-green human perception |
| RT | Rotation function – adjust for hue-chroma interactions |
| RC | Chroma rotation factor |
| Δθ | Hue rotation factor |
| kL | Lightness parametric factor usually = 1 but for textiles = 1.5 or 2 to adjust for human perception of lightness and material variables |
| kC | Chroma parametric factor = 1 |
| kH | Hue parametric factor = 1 |
| GL | Gloss measurement |
| ANOVA | Analysis of Variance |
| R2 | Coefficient of determination (R-squared) |
References
- E. O. Alegbe and T. O. Uthman, “A review of history, properties, classification, applications and challenges of natural and synthetic dyes,” Heliyon, vol. 10, no. 13, p. e33646, Jul. 2024. [CrossRef]
- Barber E.J.W., “Prehistoric Textiles - Google Books,” vol. 1, pp. 19–48, 1991, Accessed: Jul. 28, 2025. [Online]. Available: https://www.google.co.in/books/edition/Prehistoric_Textiles/HnSlynSfeEIC?hl=en&gbpv=0.
- S. Singh, “Impact of color on marketing,” Management Decision, vol. 44, no. 6, pp. 783–789, Jul. 2006. [CrossRef]
- Holme, “Coloration of technical textiles,” Handbook of Technical Textiles: Technical Textile Processes, pp. 231–284, Jan. 2016. [CrossRef]
- The Defense Logistics Agency, MIL-DTL-4088 - Webbing, Textile, Woven Nylon. USA: https://quicksearch.dla.mil/qsDocDetails.aspx?ident_number=4934, 2021.
- Z. Lan et al., “Color Changes and Mechanical Properties of Glass Fiber Reinforced Polycarbonate Composites after Thermal Aging,” Polymers 2022, Vol. 14, Page 222, vol. 14, no. 2, p. 222, Jan. 2022. [CrossRef]
- Fullerton, T. Fischer, A. Lahti, K. P. Wilhelm, H. Takiwaki, and J. Serup, “Guidelines for measurement skin colour and erythema A report from the Standardization Group of the European Society of Contact Dermatitis *,” Contact Dermatitis, vol. 35, no. 1, pp. 1–10, Jul. 1996. [CrossRef]
- G. C. Cordeiro, J. D. Vieira, and C. M. Có, “Tensile properties and color and mass variations of GFPR composites under alkaline and ultraviolet exposures,” Matéria (Rio de Janeiro), vol. 21, no. 1, pp. 01–10, Jan. 2016. [CrossRef]
- C. Badji, L. Soccalingame, H. Garay, A. Bergeret, and J. C. Bénézet, “Influence of weathering on visual and surface aspect of wood plastic composites: Correlation approach with mechanical properties and microstructure,” Polym Degrad Stab, vol. 137, pp. 162–172, Mar. 2017. [CrossRef]
- S. Adanur, “Military and Defense Textiles,” Wellington Sears Handbook of Industrial Textiles, pp. 356–378, Sep. 2018. [CrossRef]
- R. G. Revaiah, T. M. Kotresh, and B. Kandasubramanian, “Technical textiles for military applications,” The Journal of The Textile Institute, vol. 111, no. 2, pp. 273–308, Feb. 2020. [CrossRef]
- Schmidt, R. Paul, E. Classen, S. Morlock, and J. Beringer, “Comfort testing and fit analysis of military textiles,” Performance Testing of Textiles: Methods, Technology and Applications, pp. 25–37, Jan. 2016. [CrossRef]
- N. Rajendran and E. DenHartog, “Accelerated UV Degradation Behavior of High Tensile Nylon 6, 6 Webbings,” May 2025. [CrossRef]
- ASTM D6775-13, “Test Method for Breaking Strength and Elongation of Textile Webbing, Tape and Braided Material,” Jan. 01, 2024, ASTM International, West Conshohocken, PA. [CrossRef]
- ISO/CIE 11664-4, “Colorimetry — Part 4: CIE 1976 L*a*b* Colour space,” 2019, International Organization for Standardization.
- ISO/CIE 11664-6, “Colorimetry — Part 6: CIEDE2000 colour-difference formula,” 2022, International Organization for Standardization. [Online]. Available: https://www.iso.org/obp/ui/en/#iso:std:iso-cie:11664:-6:ed-2:v1:en.
- H. Mangine, K. Jakes, and C. Noel, “A preliminary comparison of CIE color differences to textile color acceptability using average observers,” Color Res Appl, vol. 30, no. 4, pp. 288–294, Aug. 2005. [CrossRef]
- J. ; Liang et al., “Digital Grading the Color Fastness to Rubbing of Fabrics Based on Spectral Reconstruction and BP Neural Network,” Journal of Imaging 2023, Vol. 9, Page 251, vol. 9, no. 11, p. 251, Nov. 2023. [CrossRef]
- T. H. Yang, T. H. Yang, W. C. Chao, and S. Y. Leu, “Characterization of the property changes of extruded wood–plastic composites during year round subtropical weathering,” Constr Build Mater, vol. 88, pp. 159–168, Jul. 2015. [CrossRef]
- C. Badji, J. Beigbeder, H. Garay, A. Bergeret, J. C. Bénézet, and V. Desauziers, “Correlation between artificial and natural weathering of hemp fibers reinforced polypropylene biocomposites,” Polym Degrad Stab, vol. 148, pp. 117–131, Feb. 2018. [CrossRef]
- C. Gómez-Polo, M. P. Muñoz, M. C. Lorenzo Luengo, P. Vicente, P. Galindo, and A. M. Martín Casado, “Comparison of the CIELab and CIEDE2000 color difference formulas,” Journal of Prosthetic Dentistry, vol. 115, no. 1, pp. 65–70, Jan. 2016. [CrossRef]
- R. G. Kuehni and R. T. Marcus, “An Experiment in Visual Scaling of Small Color Differences,” Color Res Appl, vol. 4, no. 2, pp. 83–91, 1979. [CrossRef]
- J. C. Ragain and W. M. Johnston, “Color acceptance of direct dental restorative materials by human observers,” Color Res Appl, vol. 25, no. 4, pp. 278–285, Aug. 2000. [CrossRef]
- T. Lu, E. Solis-Ramos, Y. Yi, and M. Kumosa, “UV degradation model for polymers and polymer matrix composites,” Polym Degrad Stab, vol. 154, pp. 203–210, Aug. 2018. [CrossRef]
- E. Yousif and R. Haddad, “Photodegradation and photostabilization of polymers, especially polystyrene: review,” Springerplus, vol. 2, no. 1, p. 398, 2013. [CrossRef]
Figure 2.
(a) Face of the webbings exposed to the UV lamp; (b) Back of the webbings showing placement of the clips to secure the samples on the turning rack.
Figure 2.
(a) Face of the webbings exposed to the UV lamp; (b) Back of the webbings showing placement of the clips to secure the samples on the turning rack.
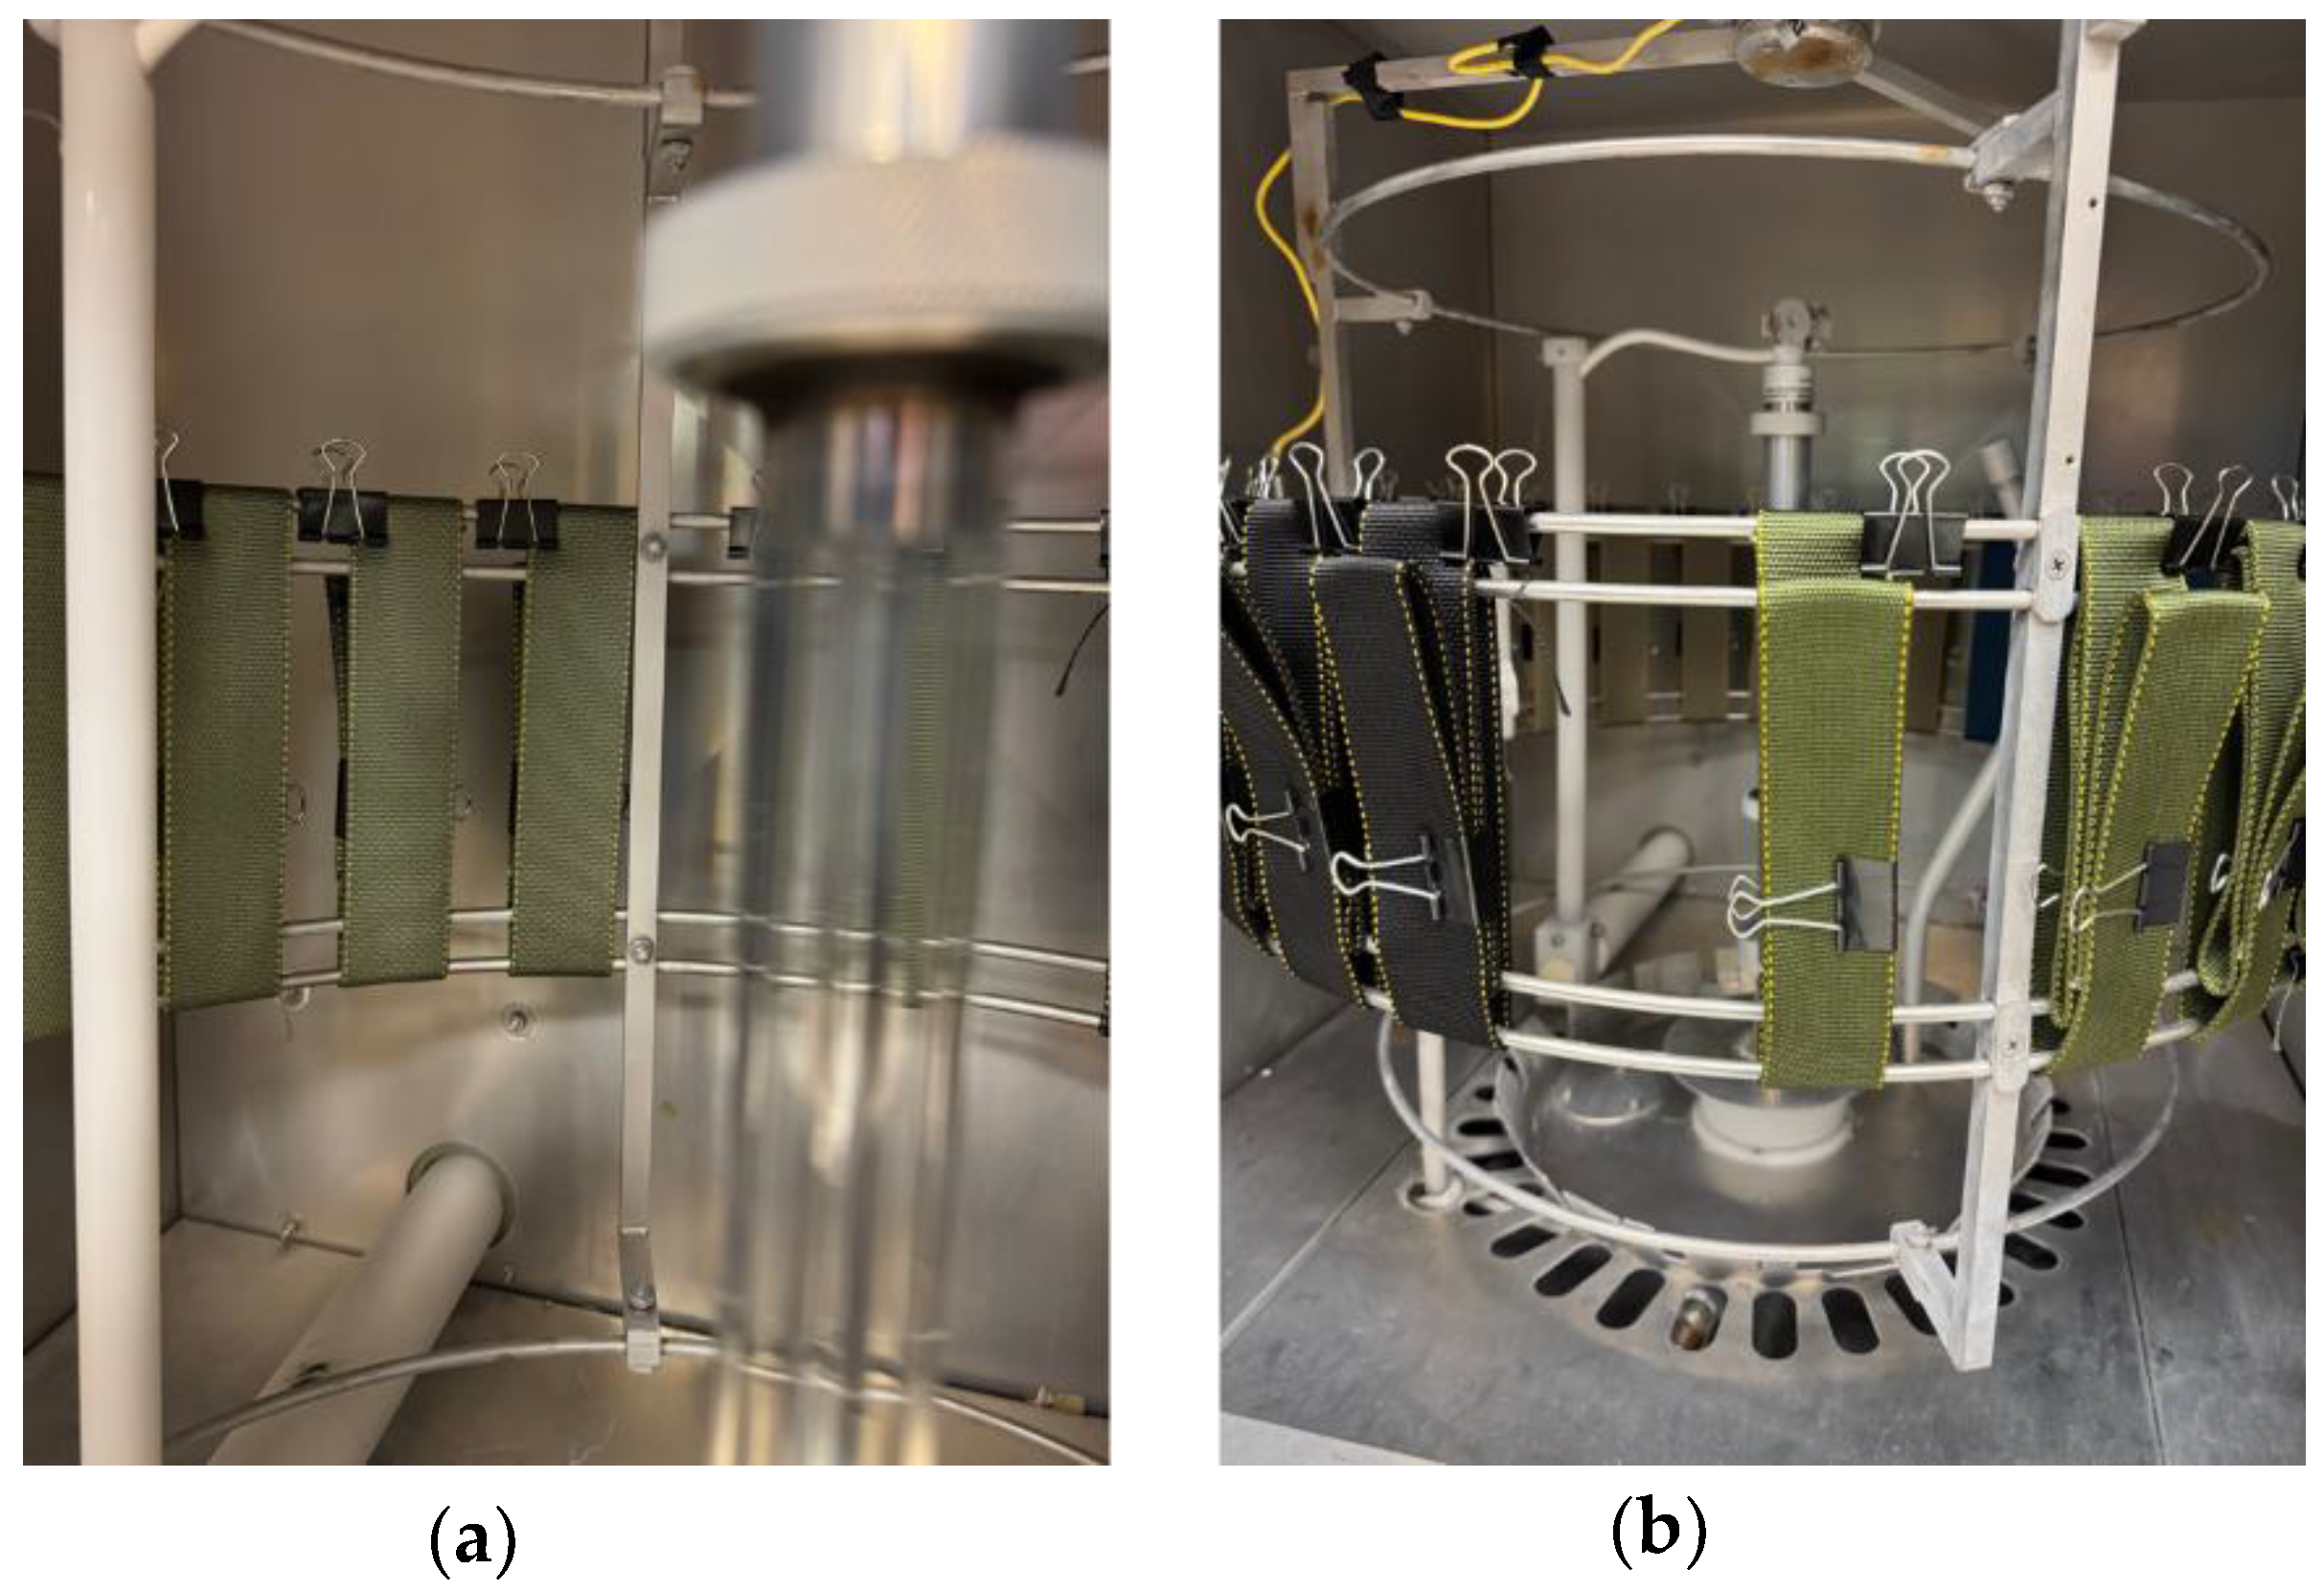
Figure 3.
ASTM D6775 test setup on MTS Landmark with split-drum clamp fixtures and the insert shows the side view schematic of the clamp (adapted from ASTM D6775) [14].
Figure 3.
ASTM D6775 test setup on MTS Landmark with split-drum clamp fixtures and the insert shows the side view schematic of the clamp (adapted from ASTM D6775) [14].
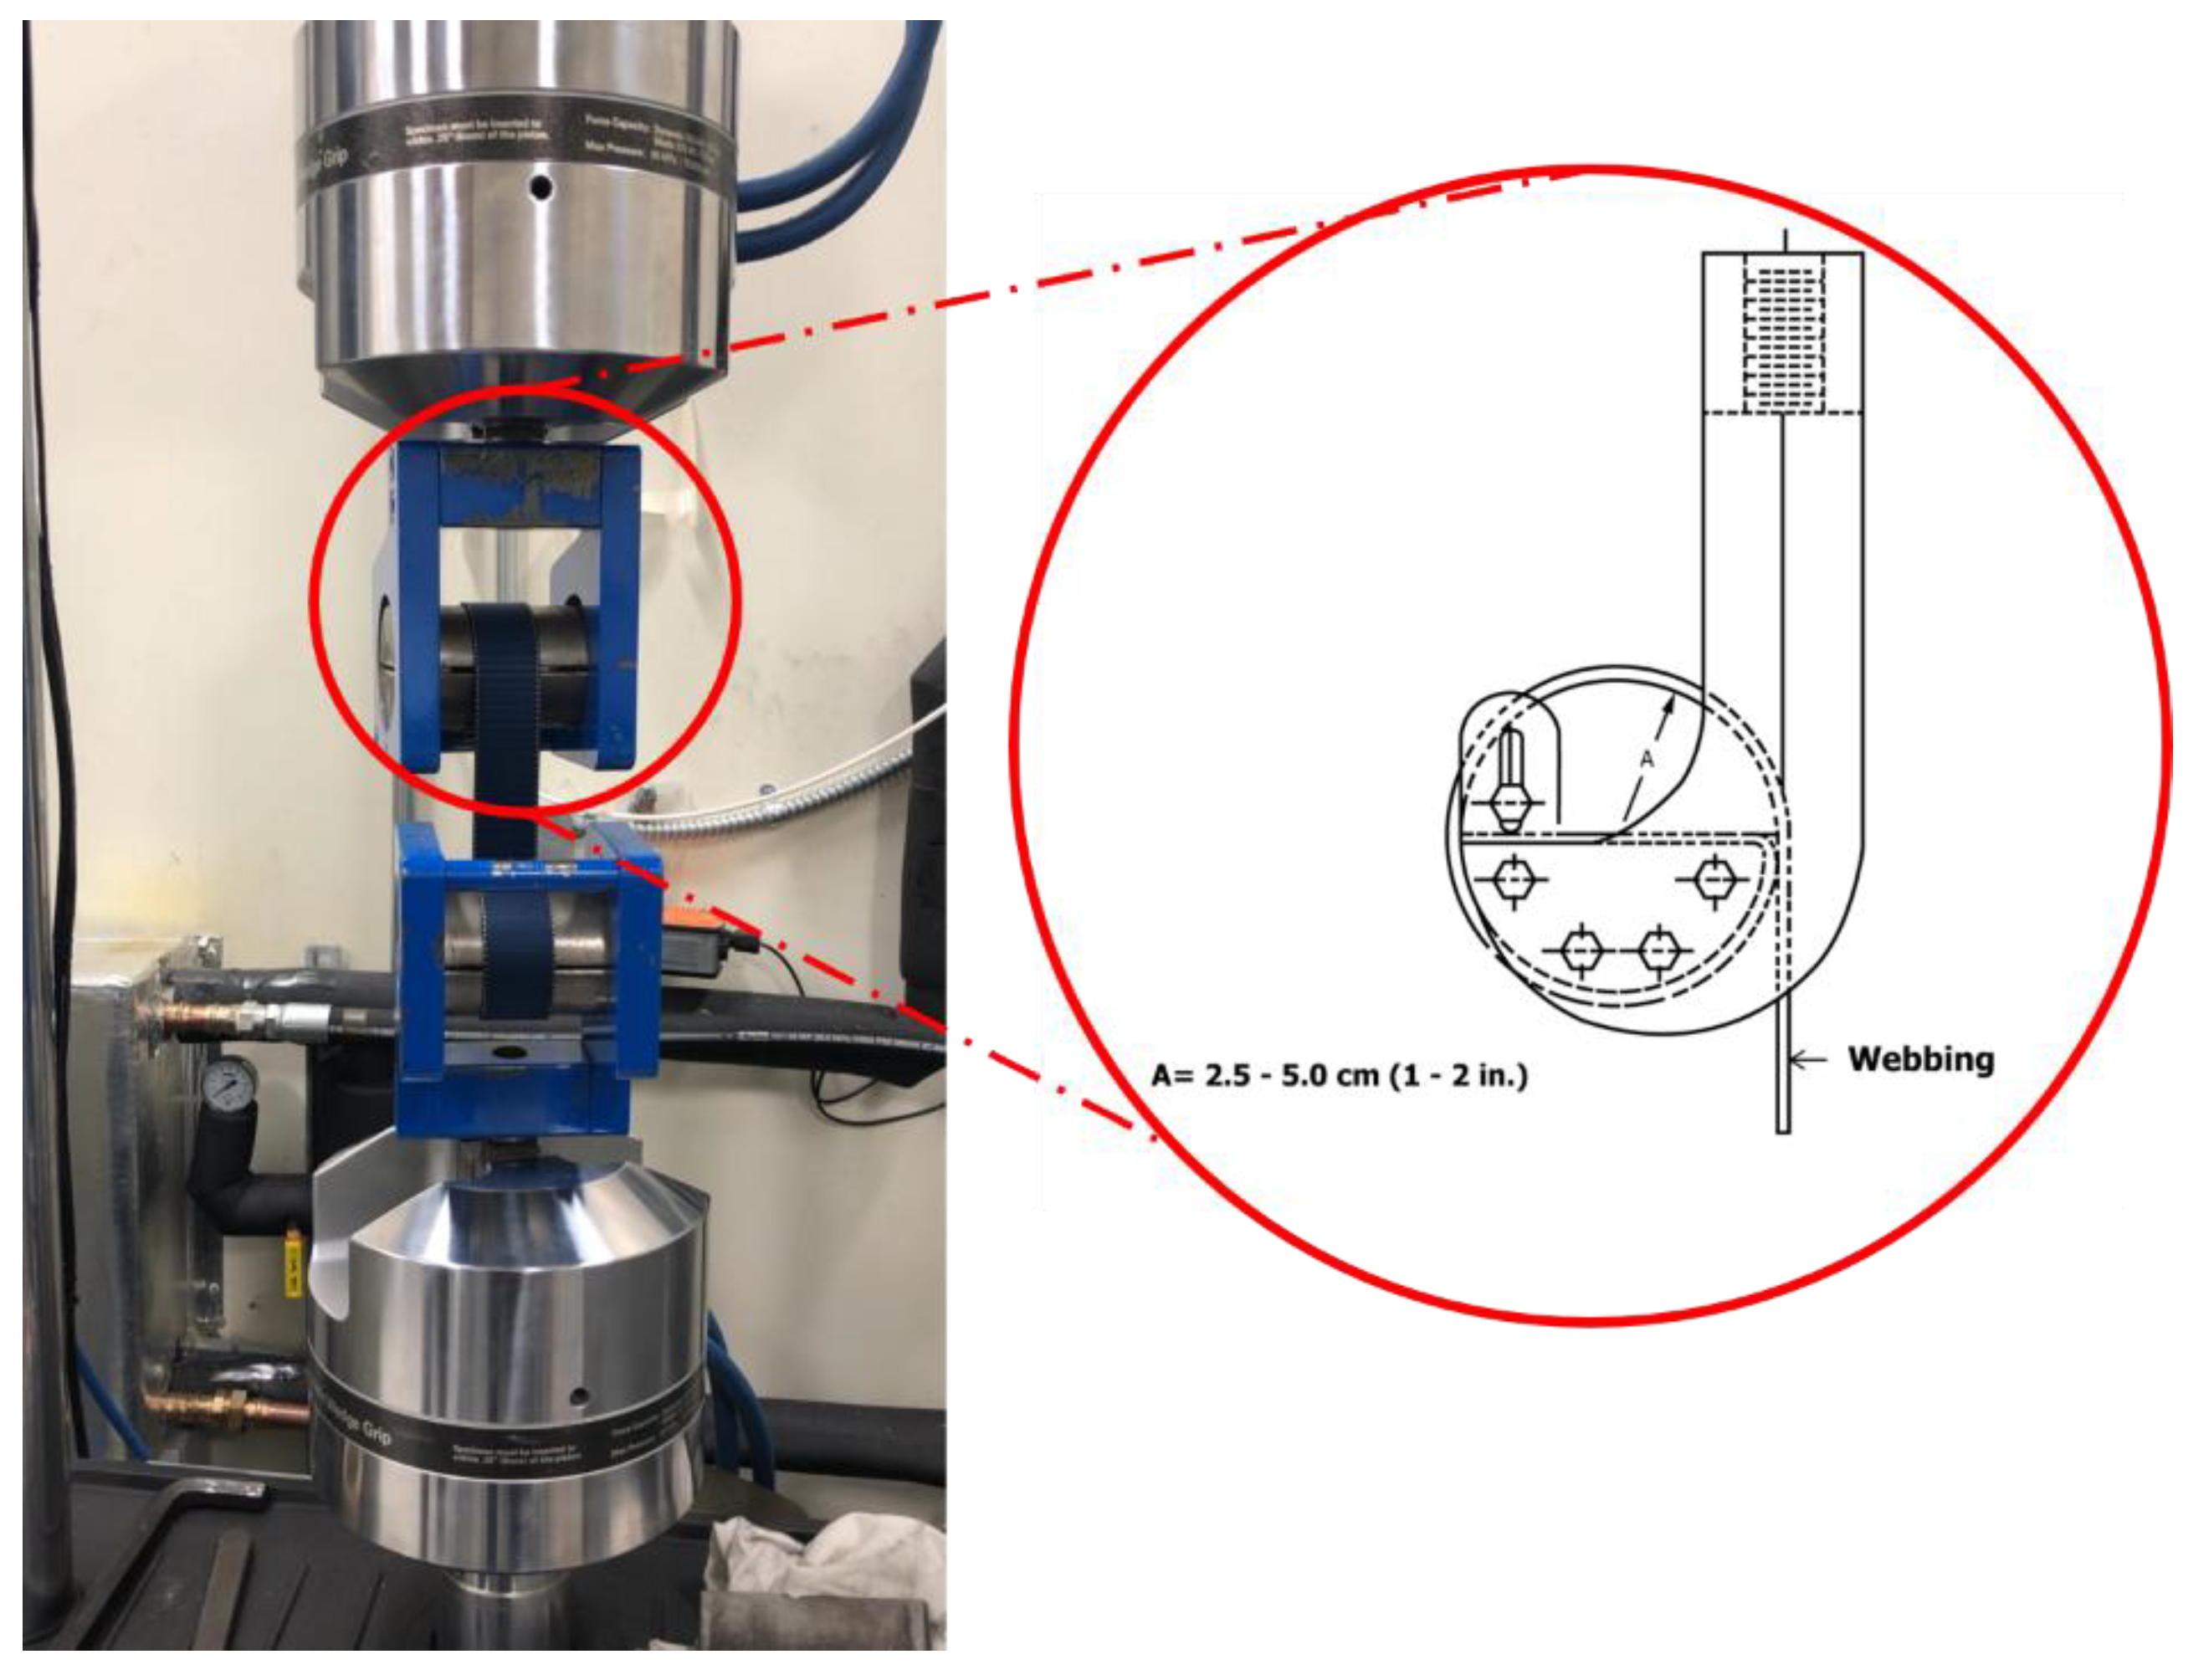
Figure 4.
UV exposed samples of 4 different colored webbings at 6 different exposure days as indicated by the numbers embedded in the image.
Figure 4.
UV exposed samples of 4 different colored webbings at 6 different exposure days as indicated by the numbers embedded in the image.
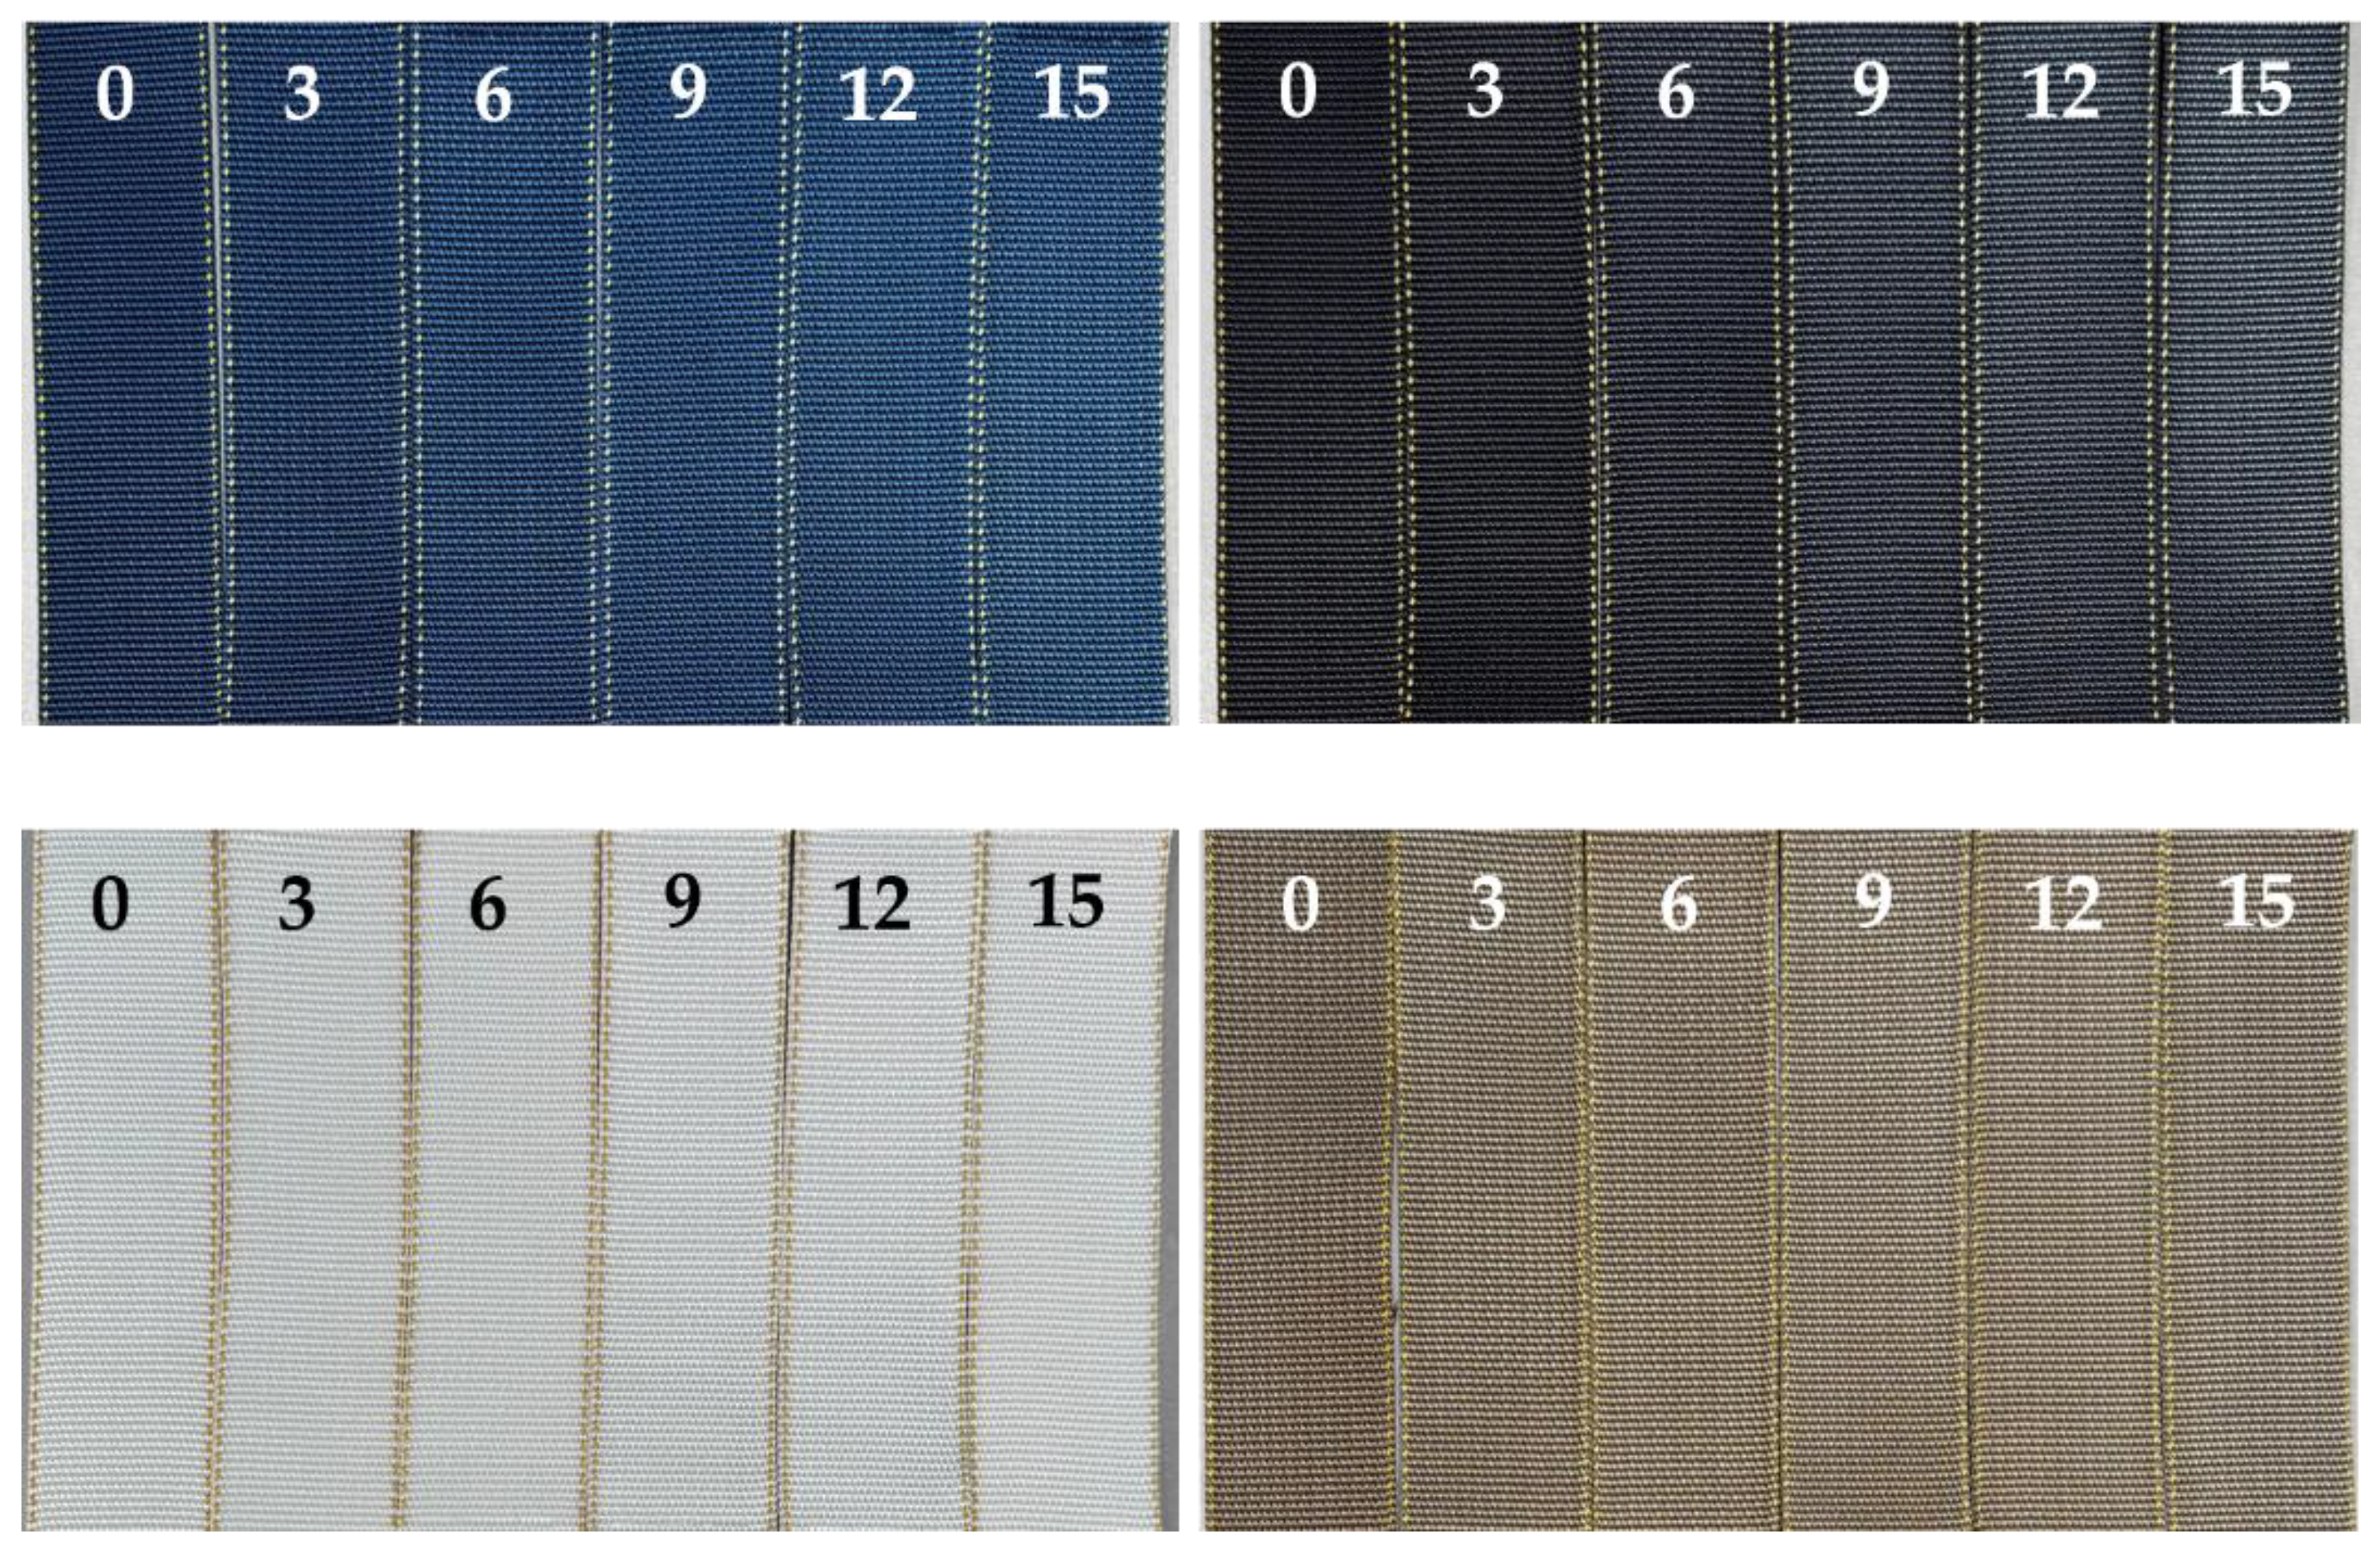
Figure 5.
Changes in the color coordinates over time in the Weather-Ometer for 15days with 1 standard deviation error bar - (a) Lightness (L*); (b) red-green (a*); (c) yellow-blue (b*); (d) gloss value (GL) of the webbings.
Figure 5.
Changes in the color coordinates over time in the Weather-Ometer for 15days with 1 standard deviation error bar - (a) Lightness (L*); (b) red-green (a*); (c) yellow-blue (b*); (d) gloss value (GL) of the webbings.
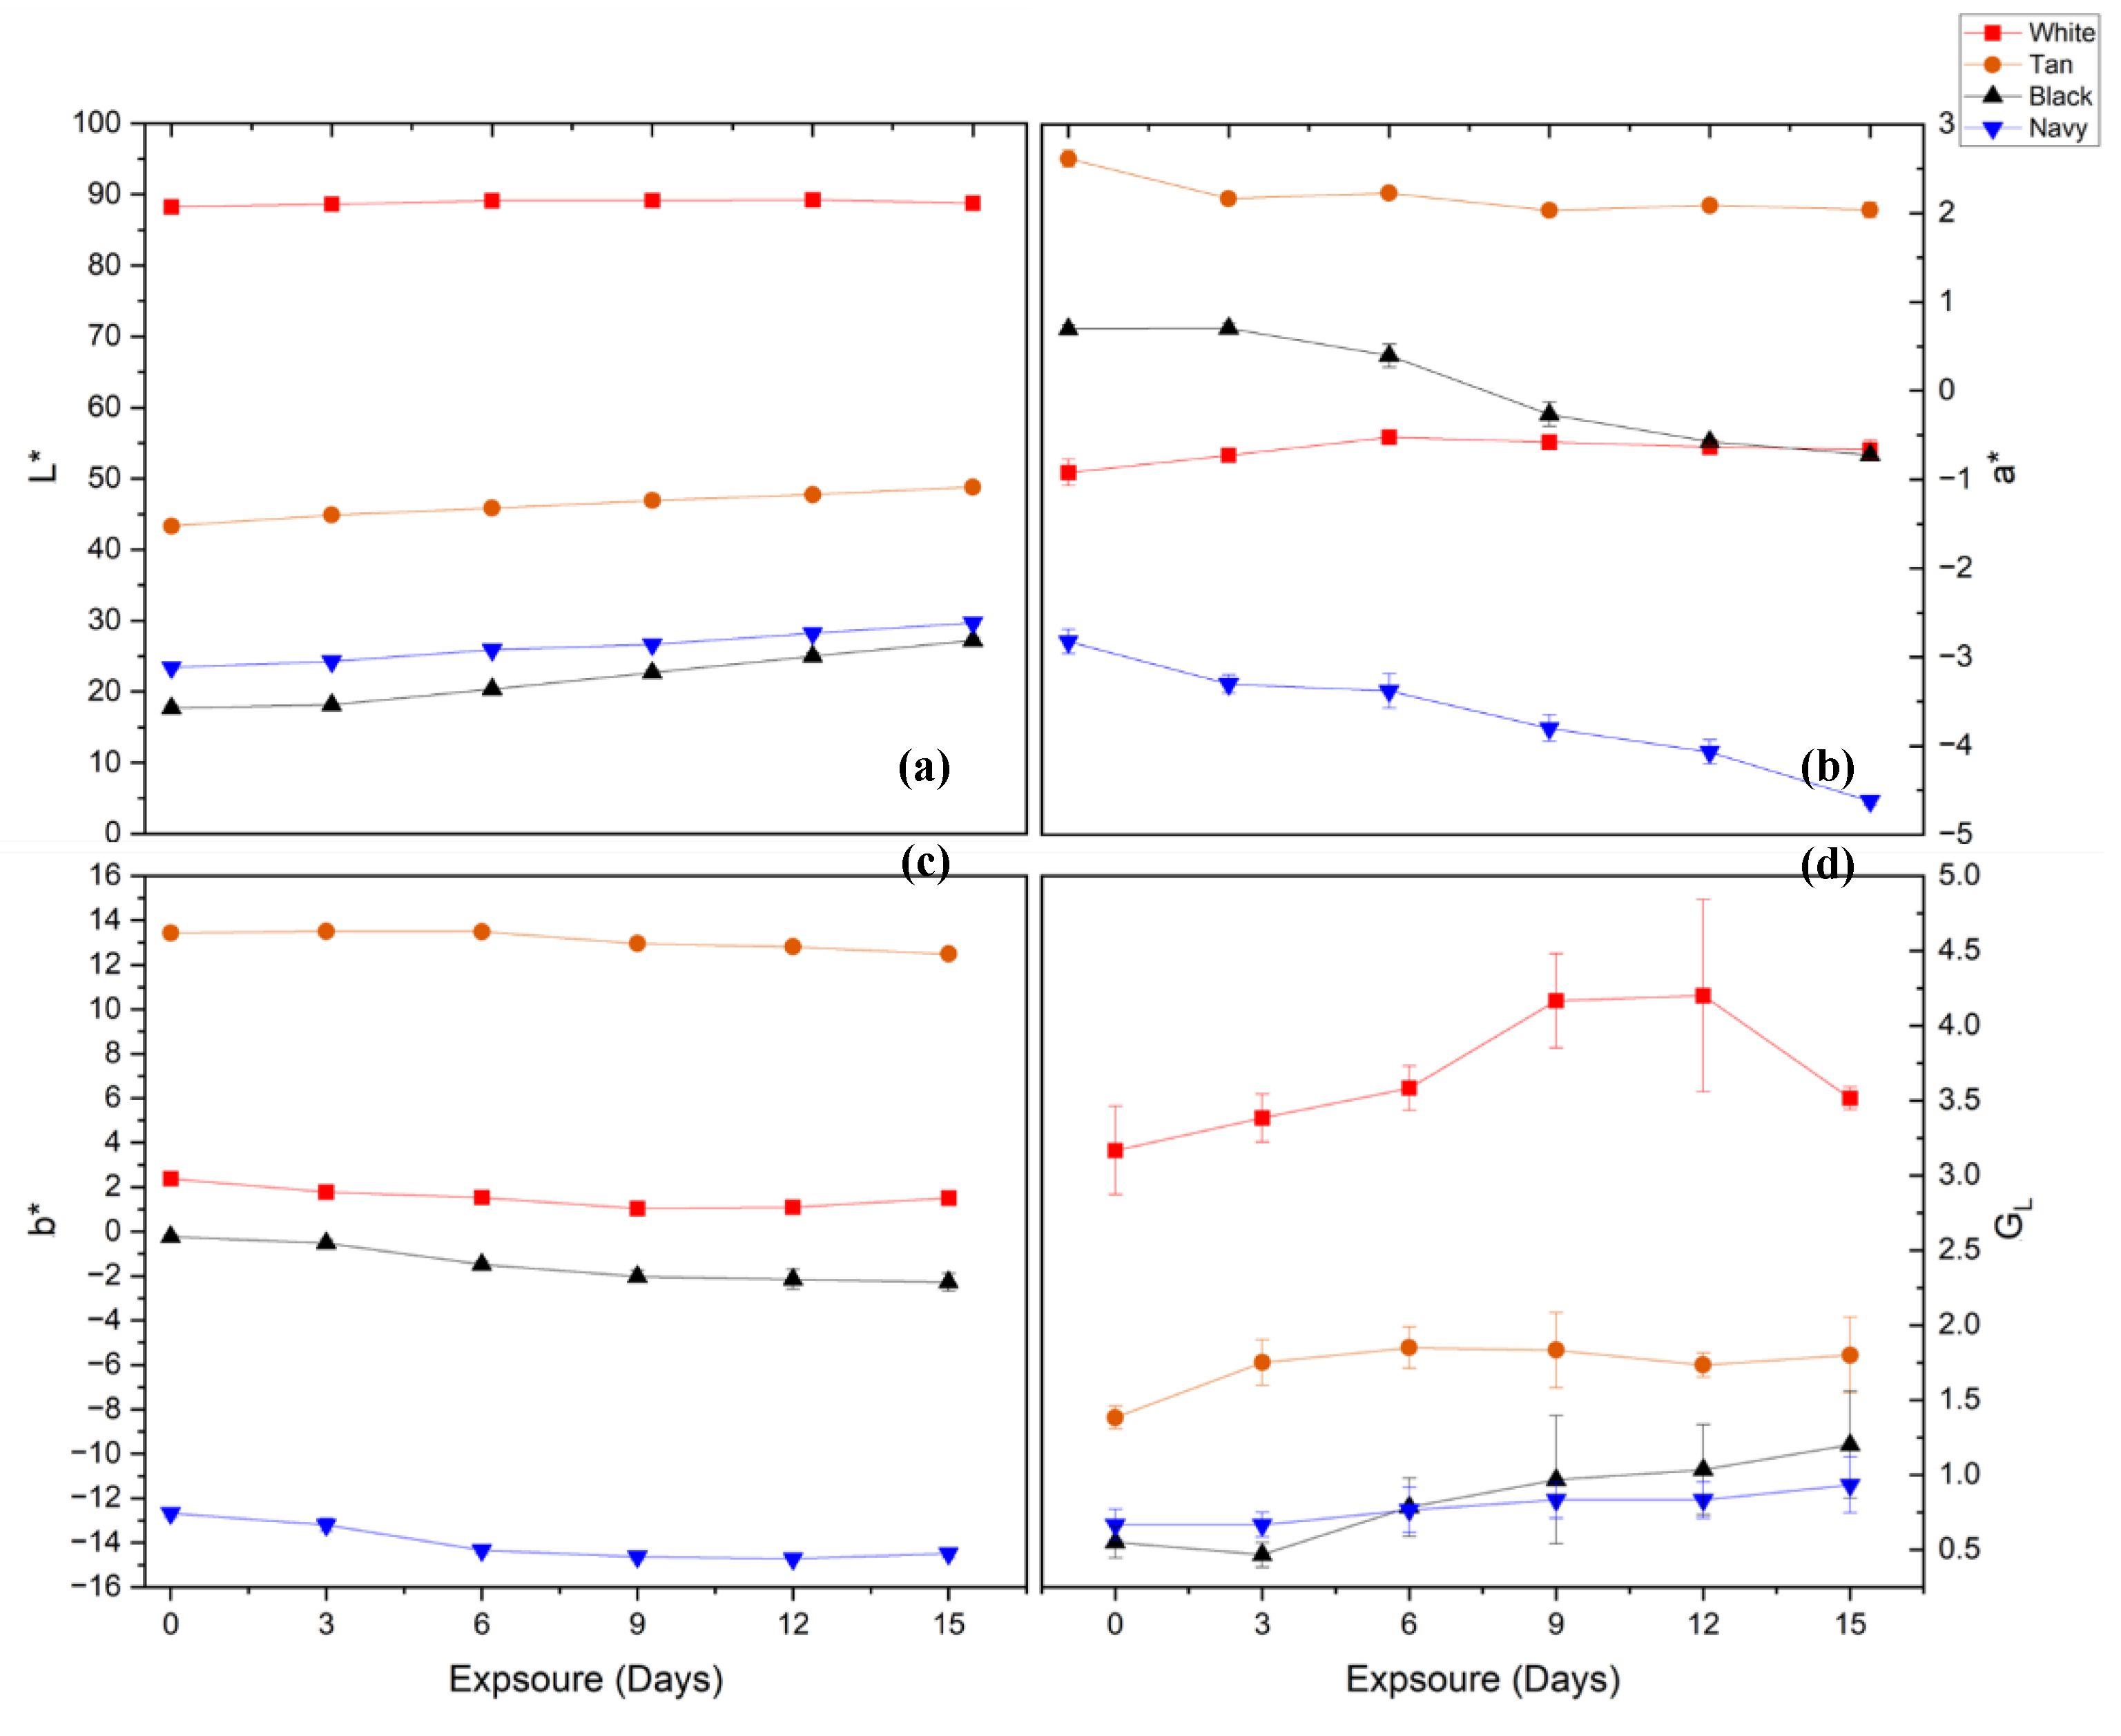
Figure 6.
Color difference over time in the Weather-Ometer for 15days with 1 standard deviation error bar - (a) CIELab (ΔEab); (b) CIEDE2000 (ΔE00).
Figure 6.
Color difference over time in the Weather-Ometer for 15days with 1 standard deviation error bar - (a) CIELab (ΔEab); (b) CIEDE2000 (ΔE00).
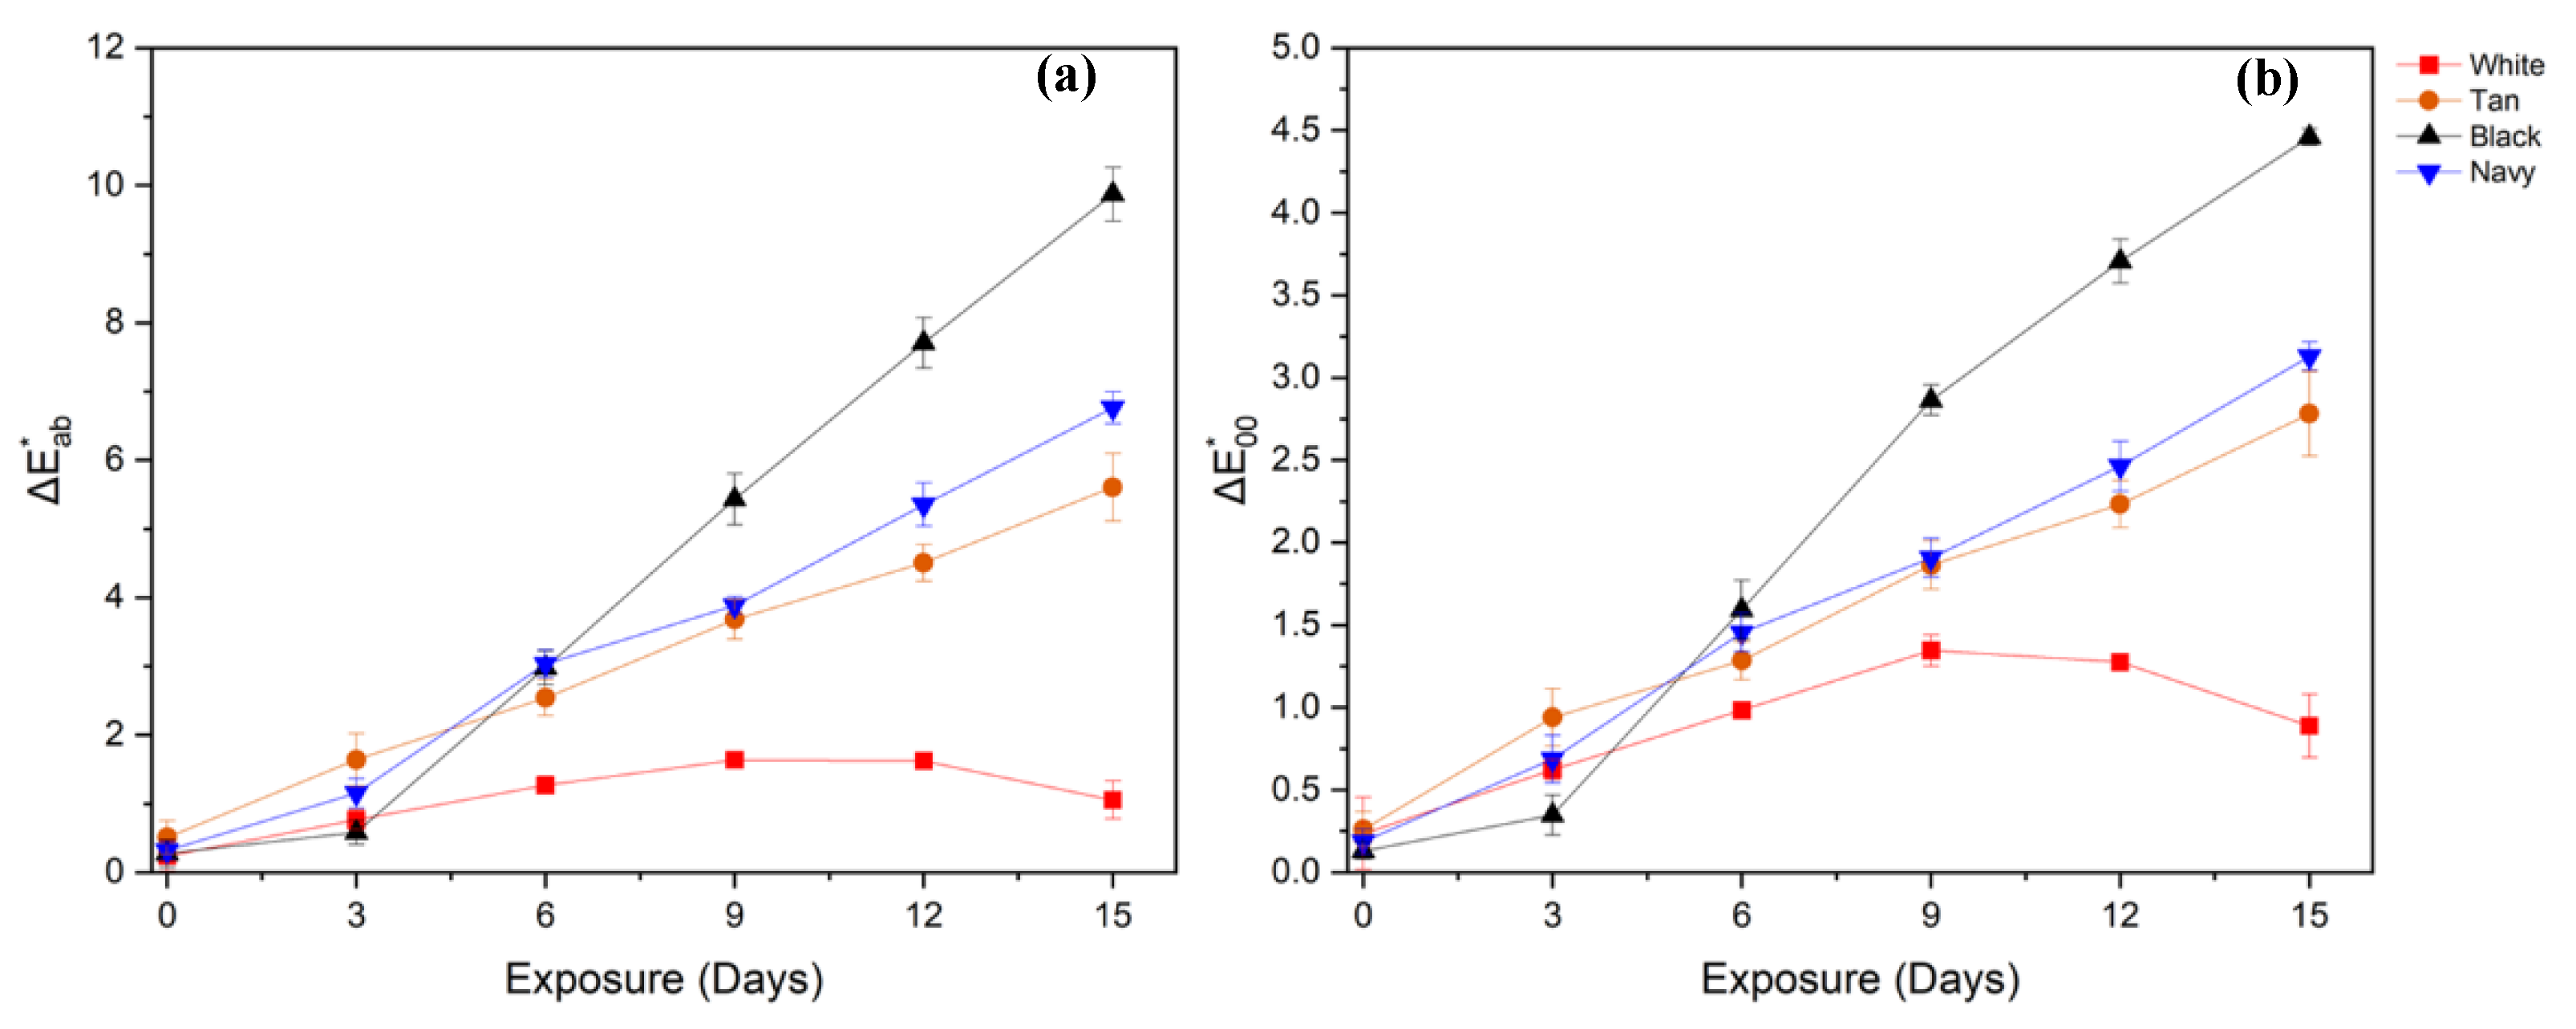
Figure 7.
Breaking strength of webbings at each exposure duration with 1 standard deviation error bar - (a) all webbings; (b) separated by color.
Figure 7.
Breaking strength of webbings at each exposure duration with 1 standard deviation error bar - (a) all webbings; (b) separated by color.
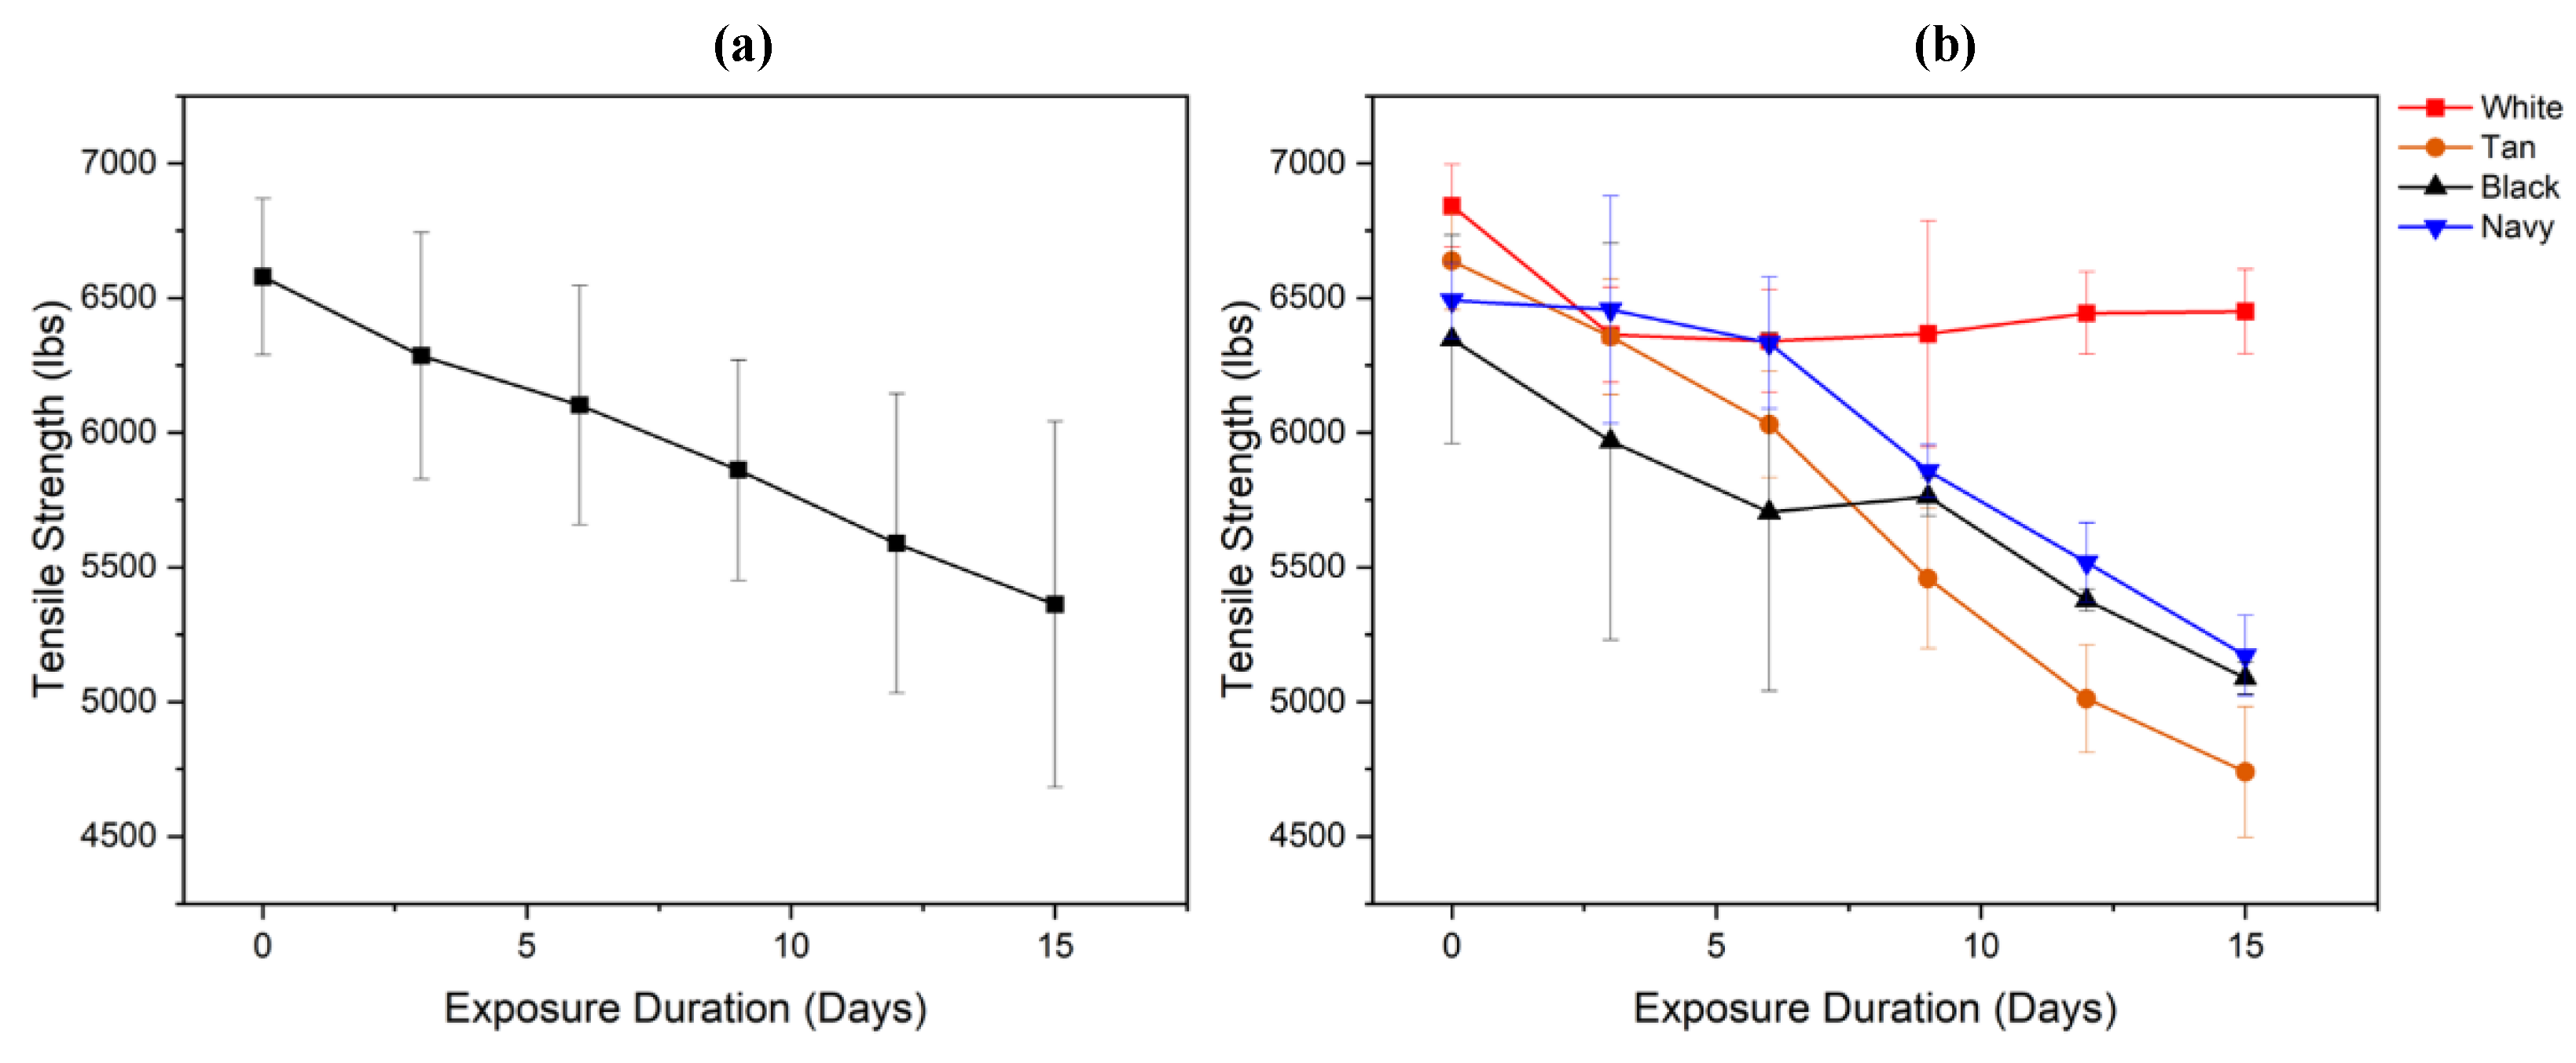
Figure 8.
Scatterplot of CIELab color change and tensile strength with linear fitting trendline - (a) all colors; (b) white; (c) tan; (d) black; (e) navy.
Figure 8.
Scatterplot of CIELab color change and tensile strength with linear fitting trendline - (a) all colors; (b) white; (c) tan; (d) black; (e) navy.
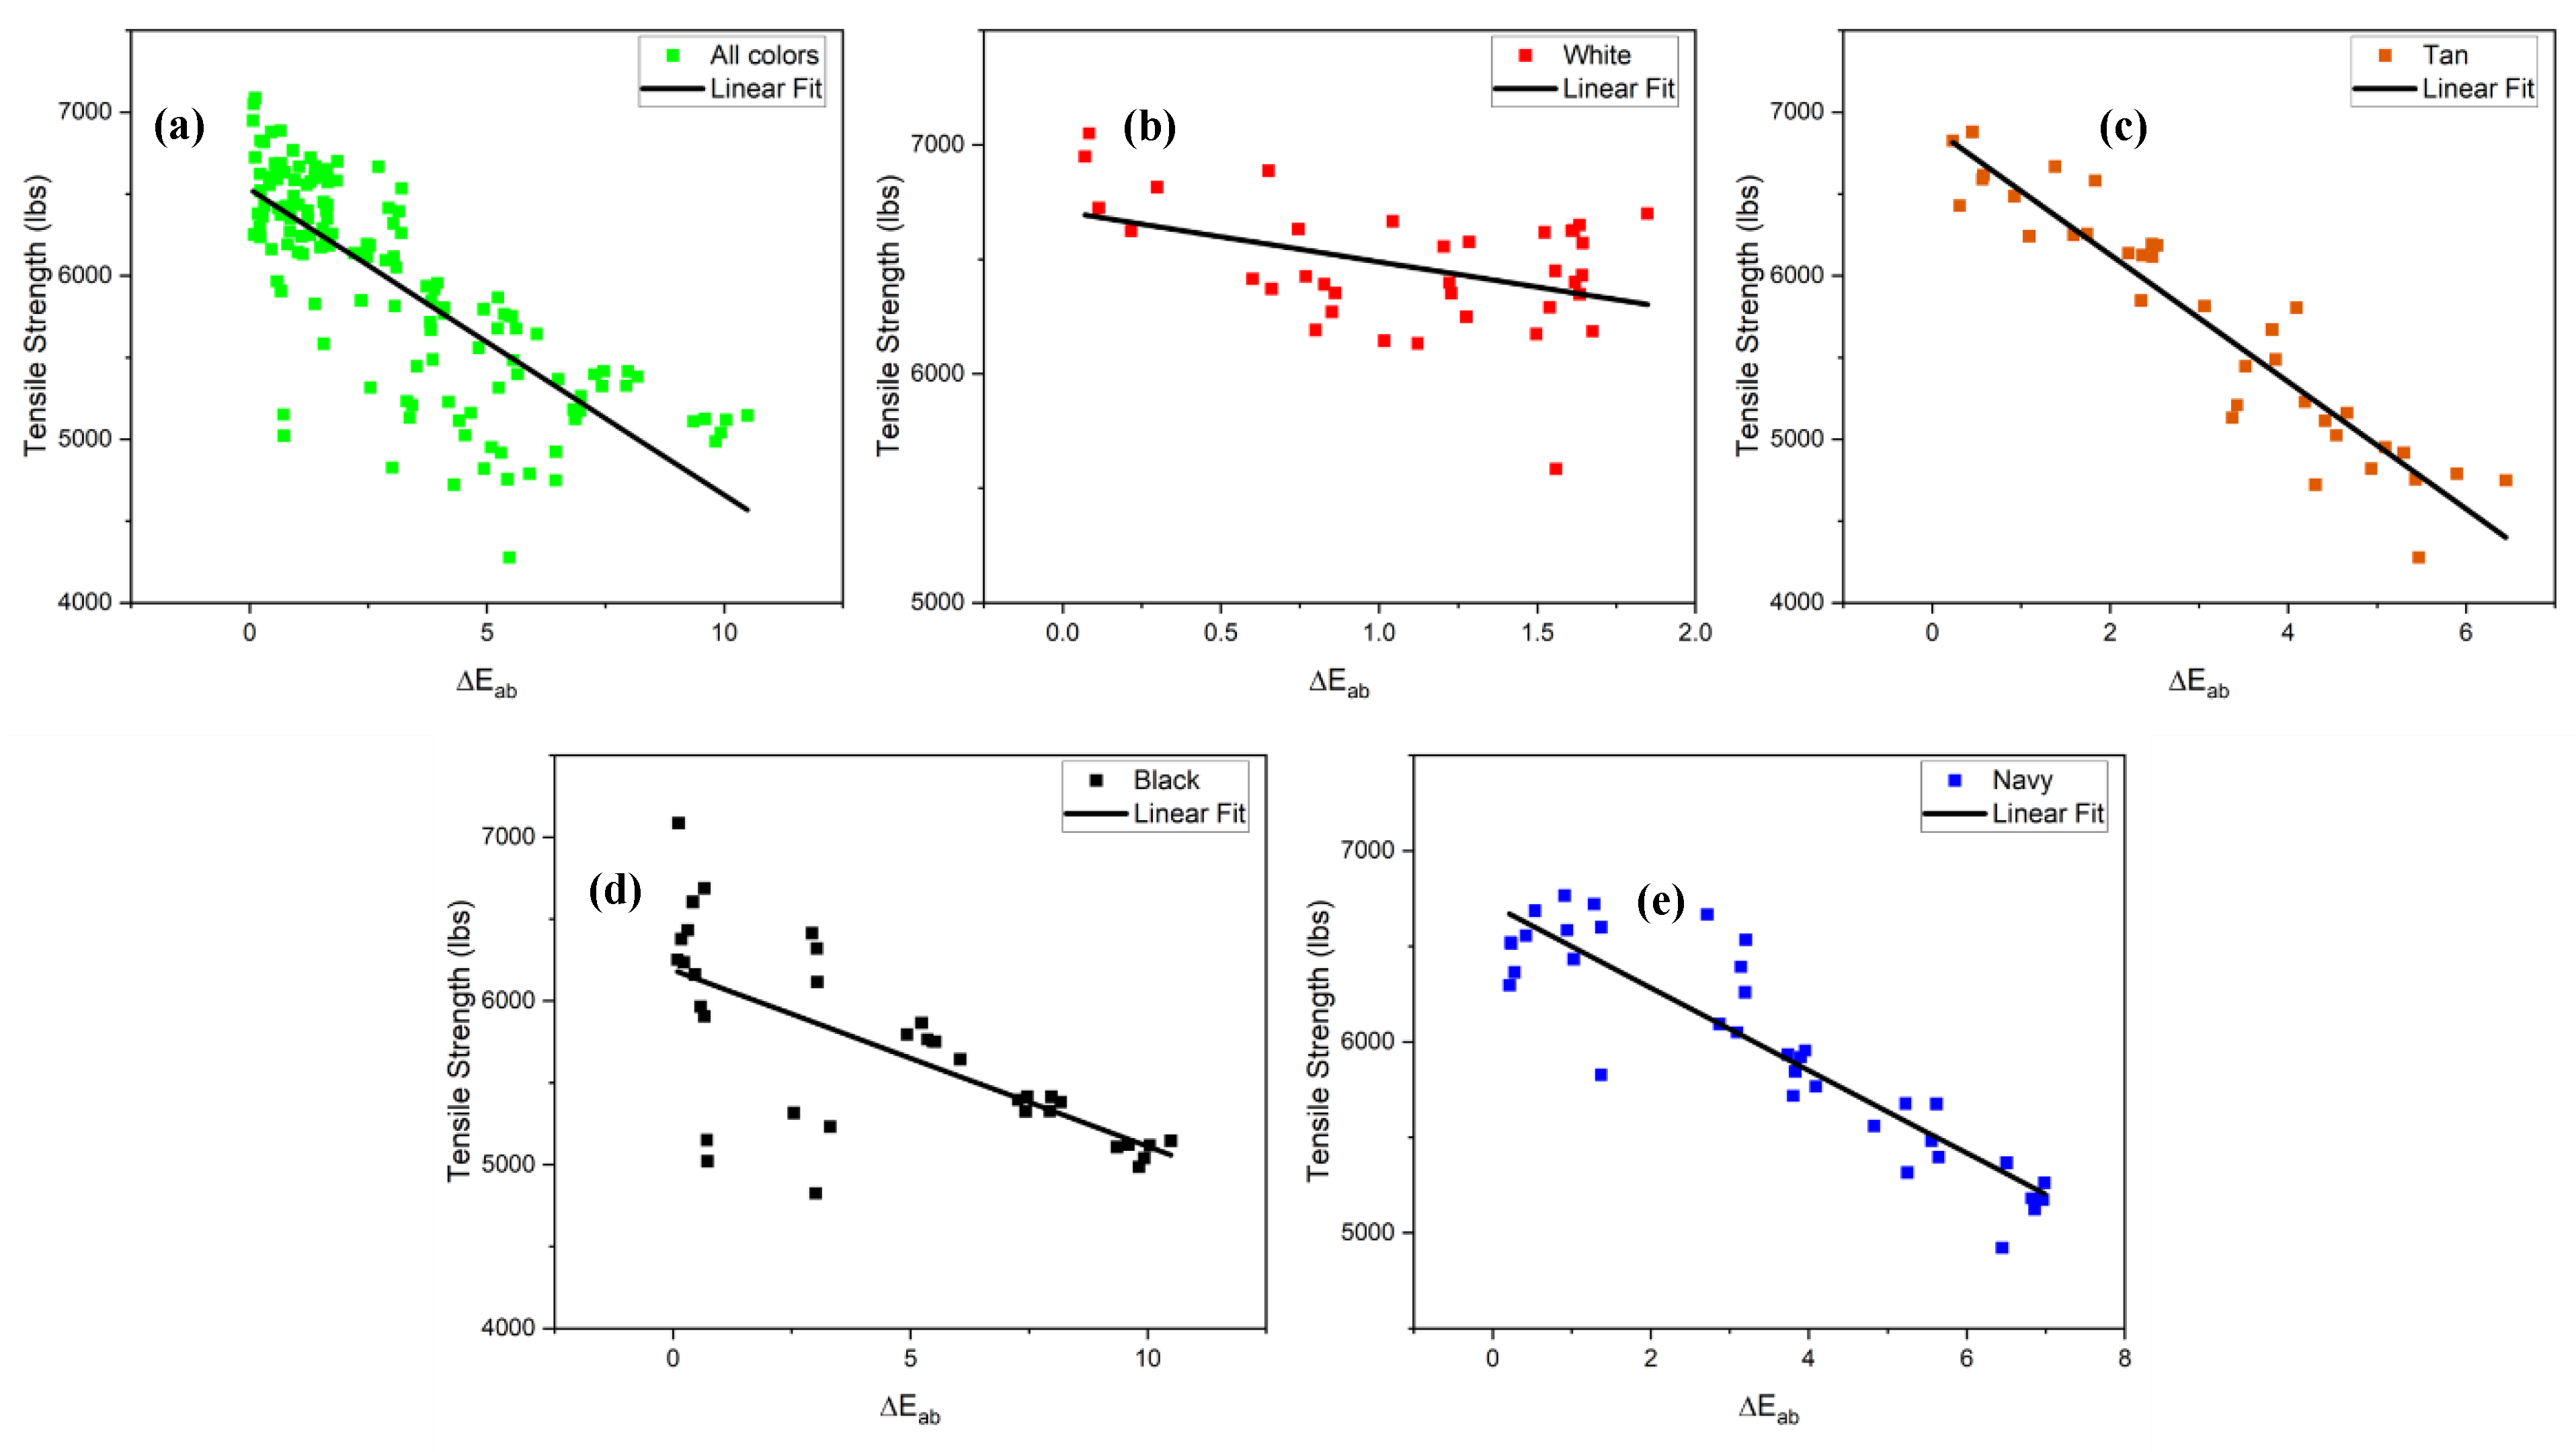
Figure 9.
Scatterplot of CIEDE2000 color change and tensile strength with linear fitting trendline - (a) all colors; (b) white; (c) tan; (d) black; (e) navy.
Figure 9.
Scatterplot of CIEDE2000 color change and tensile strength with linear fitting trendline - (a) all colors; (b) white; (c) tan; (d) black; (e) navy.
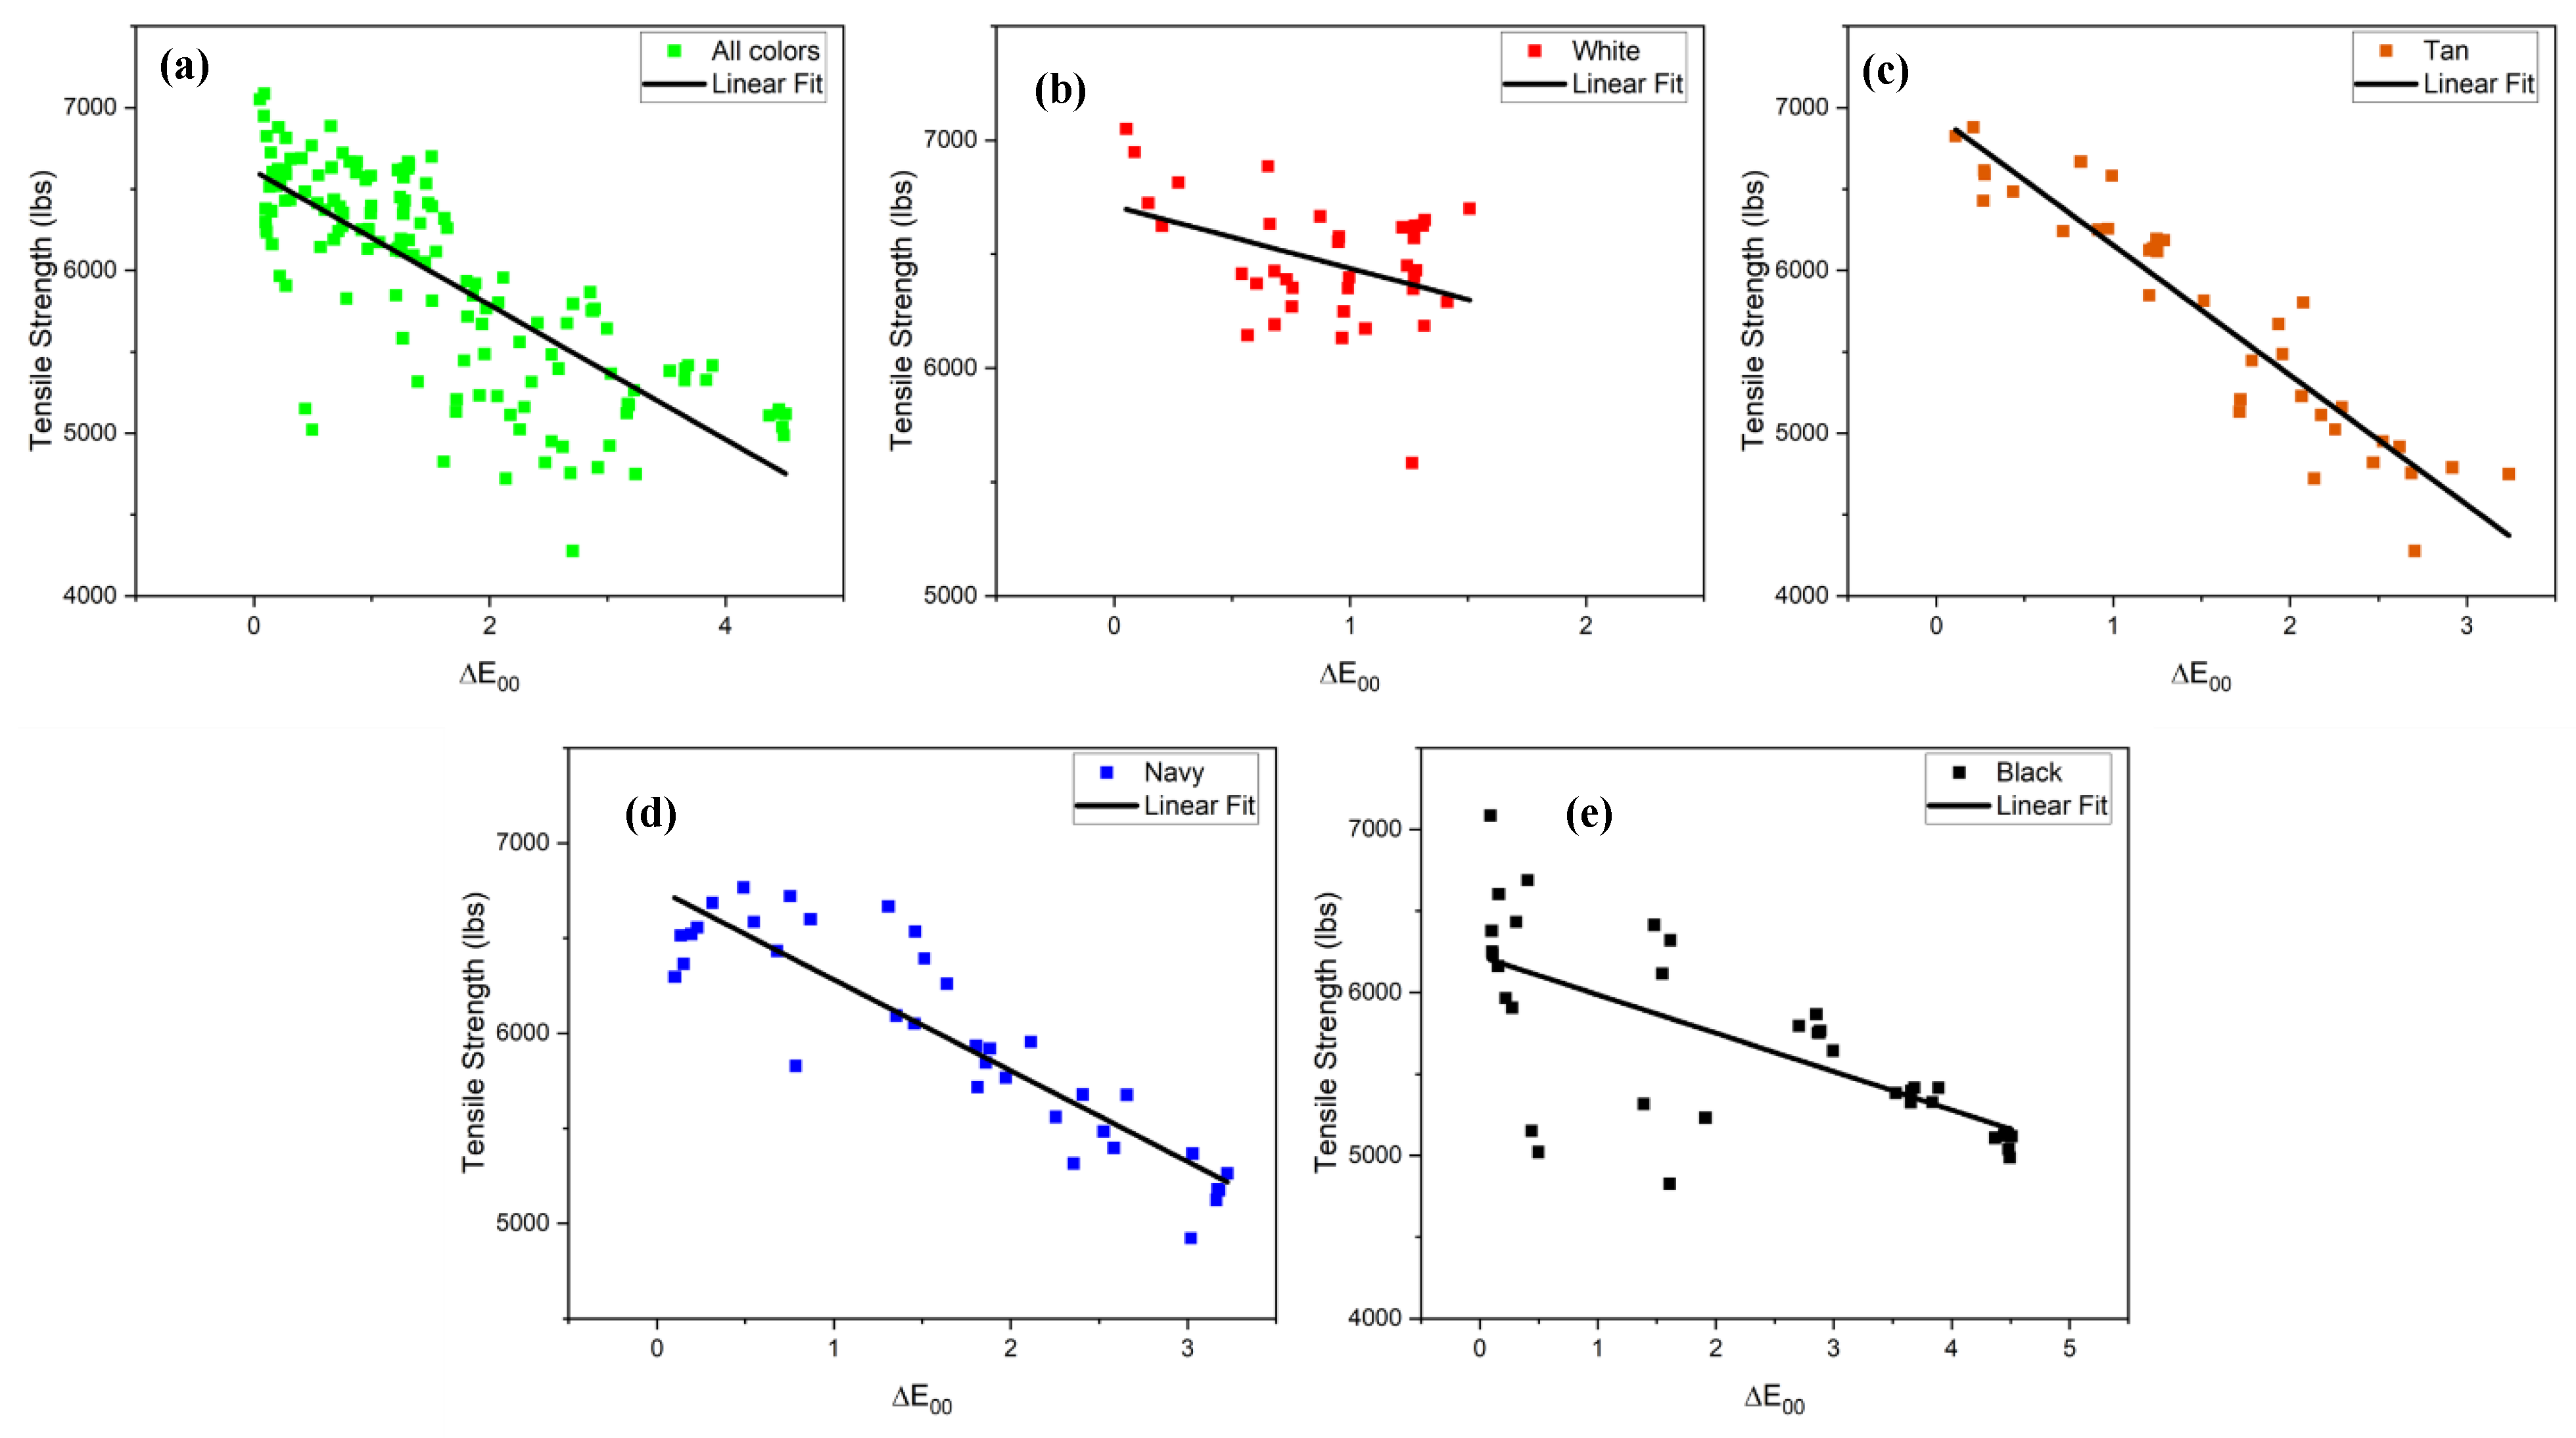
Table 1.
MIL-DTL-4088 Specifications [5].
Table 1.
MIL-DTL-4088 Specifications [5].
| Specification | |
|---|---|
| Class | 1 – Critical use |
| Type | VII |
| Polymer | Nylon 6, 6 |
| Linear Density | 840 Denier (W B F)1 |
| # of Filaments | 140 (W B F)1 |
| Twist per inch | 2.5 |
| Weave Design | Double Plain Weave |
| Picks per inch | Min. 26 |
| # of Ends | Min. 229 (W)1 & 27 (B)1 |
| Width | 1.71 ± 0.06 in |
| Thickness | 0.06 – 0.10 in |
| Weight | 2.35 oz/yd |
| Breaking Strength | Min. 6000 lbs |
| Fabric Finishes | None |
1 W = Warp; B = Binder; F = Fill.
Table 2.
The natural weathering equivalent of the lamp hours in the Weather-Ometer.
| Weather-Ometer Lamp Hours (Days) | Natural Weathering Equivalent (Days) |
|---|---|
| 3 | 21 |
| 6 | 43 |
| 9 | 64 |
| 12 | 86 |
| 15 | 107 |
Table 3.
Regression models for predicting tensile strength from CIELab color change (ΔEab).
| Color | Regression Equation | R2 | p |
|---|---|---|---|
| All colors | Tensile Strength = 6529.37 - 187.03 × ΔEab | 0.595 | < 0.0001 |
| White | Tensile Strength = 6708.64 - 219.68 × ΔEab | 0.175 | 0.0112 |
| Tan | Tensile Strength = 6905.65 - 388.64 × ΔEab | 0.889 | < 0.001 |
| Black | Tensile Strength = 6189.18 - 107.63 × ΔEab | 0.457 | < 0.0001 |
| Navy | Tensile Strength = 6715.60 - 216.22 × ΔEab | 0.817 | < 0.0001 |
Disclaimer/Publisher’s Note: The statements, opinions and data contained in all publications are solely those of the individual author(s) and contributor(s) and not of MDPI and/or the editor(s). MDPI and/or the editor(s) disclaim responsibility for any injury to people or property resulting from any ideas, methods, instructions or products referred to in the content. |
© 2025 by the authors. Licensee MDPI, Basel, Switzerland. This article is an open access article distributed under the terms and conditions of the Creative Commons Attribution (CC BY) license (http://creativecommons.org/licenses/by/4.0/).
Copyright: This open access article is published under a Creative Commons CC BY 4.0 license, which permit the free download, distribution, and reuse, provided that the author and preprint are cited in any reuse.


