Submitted:
09 September 2025
Posted:
10 September 2025
You are already at the latest version
Abstract
Background/Objectives: Osteopenia predisposes to osteoporosis and fracture, especially at the femoral neck and spine. Conventional calcium supplements offer modest benefit with tolerability limits. CalGo®, a salmon bone complex (calcium hydroxyapatite, colla-gen, trace minerals), may support skeletal health. We evaluated its efficacy and safety in postmenopausal women with osteopenia. Methods: In a 24-month, randomized, dou-ble-blind, placebo-controlled trial, 80 women aged 50–80 years with DXA-confirmed fem-oral-neck osteopenia were assigned to daily CalGo® (n=40) or placebo (n=40). The prima-ry endpoint was 24-month change in femoral-neck BMD (g/cm²) analyzed by base-line-adjusted linear regression; secondary outcomes were lumbar spine and distal radius BMD, serum bone turnover markers (β-CTX-I, P1NP), health-related quality of life, and safety. Results: The primary analysis included participants with 24-month DXA (CalGo® n=29; placebo n=30). Femoral-neck BMD was maintained with CalGo® (+0.003 g/cm²; +0.4%) but declined with placebo (–0.017 g/cm²; –2.4%), yielding a significant base-line-adjusted between-group difference of +0.019 g/cm² (95% CI 0.001–0.038; p=0.044). Lumbar-spine loss was attenuated with CalGo® (–0.005 g/cm²; –0.3%) versus placebo (–0.028 g/cm²; –3.4%); the adjusted difference favored CalGo® (+0.026 g/cm²; p=0.058), and ≥1% spine gain was more likely with CalGo® (32.5% vs 11.4%; OR 3.61; p=0.043). No treatment effects were seen at the distal radius, in bone turnover markers, or in EQ-5D/EQ-VAS. CalGo® was well tolerated, with low adverse-event rates and no hepatic or renal safety signals. Conclusions: Over 24 months, CalGo® preserved femoral-neck BMD and attenuated lumbar-spine loss in osteopenic postmenopausal women, with a favorable safety profile.
Keywords:
salmon bone meal
; bone mass density
; DXA
; menopause
; osteopenia
; osteoporosis
1. Introduction
Bone mass typically begins to decline from the third decade of life, with the rate of loss accelerating during the menopausal transition, increasing the risk of osteopenia [1]. Osteopenia often progresses to osteoporosis, characterized by reduced bone strength and an increased risk of fractures, most commonly at the femoral neck, spine, and distal radius [2,3].
Calcium supplementation, often combined with vitamin D, is widely used to help reduce bone loss. Calcium carbonate remains the most common form, and meta-analyses suggest it can prevent at least a 1% decline in bone mineral density (BMD) over three years [4,5,6]. However, benefits vary across individual trials, with better outcomes linked to higher doses and improved compliance. Higher doses, though, are associated with gastrointestinal side effects such as bloating and constipation. Natural sources of calcium appear to have more favorable absorption profiles, showing lower fluctuations in plasma ionized calcium while achieving at least equivalent suppression of bone turnover markers [7].
The addition of collagen, another major bone component, appears to enhance the effects of natural calcium supplementation. A systematic review and meta-analysis of randomized controlled trials demonstrated that ossein–hydroxyapatite complex (a bovine-derived bone matrix preparation) was significantly more effective than calcium carbonate in maintaining trabecular bone mineral density, with a pooled weighted mean difference of approximately +1% in favor of OHC [8]. Evidence from randomized clinical trials indicates that ossein–hydroxyapatite complex (a bovine-derived bone matrix preparation) is more effective than calcium carbonate in preserving lumbar spine BMD in postmenopausal women over follow-up periods of up to three years, although variations in study design and sample size temper the strength of conclusions [9]. More recently, a large prospective, open-label study in perimenopausal women reported that lumbar spine BMD remained stable over three years in those receiving OHC, whereas women treated with calcium carbonate experienced a significant 3.1% decline, with adverse drug reactions also occurring less frequently in the OHC group [10].
The marine-derived salmon bone powder (SBP; CalGo®, Hofseth BioCare ASA), obtained from whole bones of Norwegian Atlantic salmon, consists of approximately 60% calcium hydroxyapatite and 36% protein (primarily collagen), along with trace elements and natural growth factors.
Preclinical work has demonstrated differential effects of SBP compared with other calcium sources [11]. An in vitro study showed SBP to have the strongest stimulatory effect on human osteoblast proliferation relative to both natural (algae and eggshell) and synthetic (calcium citrate and carbonate) sources, with clear osteoinductive activity also demonstrated in an in vivo osteoporosis model [12]. Early clinical studies indicated a sixfold greater absorbability of SBP-derived calcium hydroxyapatite compared with calcium carbonate [13]. Importantly, serum calcium levels remained within the normal range and no changes in calcifediol were observed, suggesting that the increased calcium uptake reflected true bioavailability rather than resulting in increased renal excretion.
Both cortical and trabecular compartments contribute significantly to femoral neck strength [14,15], making this site an important indicator of bone health and metabolism. Moreover, femoral neck fractures are associated with the highest morbidity and healthcare costs among osteoporotic fractures, underscoring the importance of protecting bone mass at this site to support healthy aging and reduce healthcare burden [16,17]. Based on these findings and the composition of SBP, the present study was therefore undertaken to evaluate the effects and safety of a SBP (CalGo®, Hofseth BioCare ASA) on bone health in osteopenic women.
2. Materials and Methods
2.1. Trial Design and Registration
This investigation was conducted as a randomized, double-blind, placebo-controlled clinical trial in collaboration between Hofseth BioCare ASA (Ålesund, Norway) and the Møre and Romsdal Health Trust, and is registered at ClinicalTrials.gov (Identifier: NCT05066477). Eligible participants were recruited through mailed invitations, posters, and public announcements, and were randomly assigned to receive a daily supplement of salmon bone powder (CalGo®) or an inert placebo (maltodextrin). Recruitment was initiated in August 2021 and concluded in June 2023.
The protocol was reviewed and approved by the Regional Committee for Medical and Health Research Ethics (Application ID 264146), Central Norway, and all participants provided written informed consent prior to enrollment. The trial was conducted in accordance with the principles of the Declaration of Helsinki and reported following the Consolidated Standards of Reporting Trials (CONSORT) guidelines. Regular site visits by a clinical study monitor ensured adherence to protocol and data quality throughout the study.
2.2. Participants and Data Collection
Eligible participants were women aged ≥50 years with osteopenia of the femoral neck, confirmed by dual-energy X-ray absorptiometry (DXA) with a T-score > –2.5 and ≤ –1.0. Inclusion required female sex, steady body weight during the month prior to enrollment, and proficiency in Norwegian. Women with osteoporosis (T-score ≤ –2.5), a history of fragility fractures, or known fish allergy were excluded. Additional exclusion criteria were use of drugs affecting bone metabolism (e.g., glucocorticoids, hormone therapy <6 months, long-term heparin, anticonvulsants, proton pump inhibitors, lithium, anti-osteoporotic drugs, cancer therapy, or selective estrogen receptor modulators) and medical conditions influencing bone health or nutrient absorption (e.g., Paget’s disease, osteomalacia, neoplasia, Crohn’s disease, celiac disease). After written informed consent, baseline demographic characteristics, medical history, comorbidities, and concomitant medications were recorded.
Bone mineral density (BMD) was assessed at the femoral neck, lumbar spine (L1–L4), and distal radius at baseline, 12 months, and 24 months. Participants attended six on-site visits: screening, baseline (month 0), early-study (3 months), 6 months, mid-study (month 12), and study completion (month 24). All scans were performed by certified densitometry technologists at participating trial centers. In Ålesund, assessments were conducted at Medi3 using a MedixDR densitometer (DMS Imaging, Gallargues-le-Montueux, France). In Kristiansund and Oslo, measurements were performed at Kristiansund Hospital and Lovisenberg Diakonale Sykehus, respectively, using locally available DXA systems in accordance with standard clinical protocols. For hip measurements, the left side was used unless prior surgery necessitated measurement of the right hip.
Safety monitoring included hematology, liver and kidney function tests, electrolytes, and serum creatinine, albumin, calcium, and vitamin D levels. Urine calcium was measured throughout follow-up. Bone turnover markers—serum N-terminal propeptide of type I collagen (P1NP) and C-terminal telopeptide (CTX)—were analyzed at Lab1 AS (Sandvika, Norway). At each study visit, participants reported any new or ongoing medical issues. Serious adverse events (SAEs) were defined as events that were fatal, life-threatening, required hospitalization, or resulted in significant incapacity or disability.
All SAEs were reviewed and adjudicated by the medical monitor, and fractures were prospectively designated as adverse events of special interest. Adherence was monitored at each study visit and calculated as the proportion of days supplements were taken relative to total follow-up days.
Study data were collected at trial sites and managed using Ledidi Core collaborative software (Ledidi AS, Oslo, Norway).
2.3. Interventional Product and Blinding
The investigational product, CalGo®, is a natural marine bone powder derived from salmon (Hofseth BioCare ASA, Ålesund, Norway). CalGo® consists primarily of microcrystalline hydroxyapatite (>17% elemental calcium, >8% elemental phosphorus) embedded within a collagen-rich matrix (>25% collagen, predominantly type II), produced without additives or harsh processing to preserve the native quality of both calcium and collagen. The manufacturing process follows Good Manufacturing Practices (GMP) and Hazard Analysis and Critical Control Points (HACCP) principles, with certification under FSSC 22000, and the product is self-affirmed GRAS, Kosher, and Halal compliant. CalGo® has also been granted New Dietary Ingredient (NDI) status by the U.S. FDA for use in food supplements intended for human consumption.
For the trial, CalGo® and placebo were encapsulated in identical opaque capsules and dispensed in indistinguishable containers to ensure blinding. Each daily dose of 2 g CalGo® (administered as four capsules) provided approximately 380 mg elemental calcium, 500 mg type II collagen, and 40 µg vitamin D3. The comparator consisted of 2 g maltodextrin placebo, similarly, encapsulated and packaged.
2.4. Blood Collection and Laboratory Procedures
2.4.1. Venous Draw, Sample Handling, and Processing
Fasting venous blood (~12 mL) was collected via a 21 G butterfly needle after ≥10 minutes of seated rest. Two tubes were drawn in standardized order: an 8 mL serum-gel tube (yellow/red top) for bone-turnover markers and clinical chemistry, and a 4 mL K₂-EDTA tube (lavender top) for hematology. Tubes were gently inverted immediately after collection (5–6 times for serum, 8–10 for EDTA). The serum tube was kept upright at room temperature, protected from light, and allowed to clot for 30–60 minutes.
Clinical chemistry and hematology samples were processed according to hospital protocols. The serum-gel tube was centrifuged at 2 000 × g for 10 minutes at 4 °C, with serum stored at 4–8 °C for same-day transport to the hospital laboratory (HMR, Ålesund). The EDTA tube was not centrifuged; it was stored at room temperature if analyzed within 8 hours, or refrigerated at 4–8 °C if delayed, and transported together with the serum samples.
Serum for bone marker analysis was collected in a dedicated 8 mL serum-gel tube, clotted and centrifuged under the same conditions. The supernatant was pipetted into sterile 0.5 mL low-binding cryovials (minimum 2 mL per participant), snap-frozen in dry ice, and stored at −80 °C within two hours of venipuncture, pending batch shipment to the central laboratory.
2.4.2. Transport and Destination Laboratories
Serum aliquots for bone-turnover markers were shipped weekly on dry ice to Lab 1 (Medisinsk Laboratorium, Sandvika, Norway), which coordinated forwarding to SYNLAB MVZ Leinfelden, Germany. Where available, β-CTX-I was analyzed from EDTA plasma due to its higher stability; otherwise, serum was used. All bone marker samples adhered to SYNLAB’s matrix- and temperature-specific pre-analytical requirements.
Samples for routine clinical chemistry and hematology were dropped off at Medi3 Ålesund, a local private health center; Medi3 then arranged same-day courier transfer of specimens to the hospital clinical chemistry department (HMR, Ålesund).
2.4.3. Sample Documentation and Quality Assurance
Each sample was labeled with a 2D barcode and linked to participant ID, collection time, and processing metadata. Chain-of-custody and temperature logs were maintained throughout handling, storage, and shipment. Any deviations from protocol (e.g., prolonged clotting time or delayed freezing) were documented and flagged for sensitivity analyses.
2.4.4. Laboratory Assays and Reference Intervals
Bone-turnover markers were measured by electrochemiluminescence immunoassay (ECLIA) at SYNLAB Weiden. Reference intervals were 20.3–76.3 µg/L for P1NP and 0.18–1.02 µg/L for β-CTX-I, based on postmenopausal women not using hormone replacement therapy. Routine clinical chemistry and hematology were performed at HMR Ålesund using accredited automated platforms.
2.5. Sample Size Determination and Statistical Analysis
Sample size was based on published variance data for femoral-neck bone mineral density (BMD) in postmenopausal women [18], expressed in T-score units. Assuming a conservatively rounded standard deviation of 0.50 T-score units, 45 participants per group were required to detect a 0.30-unit between-group difference with 80% power at a two-sided α = 0.05. To accommodate an anticipated 20% attrition rate, the target enrollment was set at 56 women per group, for a total of 112 participants.
Participants were randomized in a 1:1 ratio to CalGo® or placebo using variable block sizes of 4 and 6, with the sequence generated by an independent statistician. Allocation was concealed from investigators, site staff, and participants; study capsules were indistinguishable in appearance and packaging.
The prespecified primary outcome was the absolute 24-month change (Δ) in areal BMD of the left femoral neck (g/cm²), calculated as follow-up minus baseline. Group differences were evaluated using ordinary least squares regression, both unadjusted and adjusted for baseline femoral-neck BMD. The same analytic approach was applied to secondary skeletal outcomes: Δ lumbar spine (L1–L4) and Δ distal radius BMD.
Exploratory outcomes with repeated measures (e.g., bone turnover markers, liver enzymes, urinary calcium/creatinine) were assessed using linear mixed-effects models with random intercepts. Binary responder outcomes were examined using logistic regression, and adverse event frequencies were compared with χ² tests.
All efficacy analyses followed the intention-to-treat principle, including all randomized participants with at least one post-baseline measurement. Statistical significance was defined as two-sided p ≤ 0.05. Analyses were performed in Stata/SE 17.0 (StataCorp, College Station, TX, USA).
3. Results
3.1. Participant Characteristics and Study completion
Eighty participants (from 346 screened) with confirmed osteopenia were enrolled across three study centers and randomized to either the CalGo® group (n = 40) or the placebo group (n = 40) for a 24-month intervention. Recruitment was distributed across Ålesund (n = 56), Kristiansund (n = 11), and LDS (n = 13), with site-specific completion rates of 77%, 64%, and 69%, respectively. Although the original recruitment target was 112 participants, only 80 were enrolled. The shortfall was primarily due to slower-than-anticipated recruitment and a limited eligible pool, as a high proportion of screened individuals (266/346, 77%) did not meet the osteopenia inclusion criteria.
Of the 80 enrolled participants, 59 (74%) completed the full intervention, with comparable completion rates between CalGo® (72.5%, n = 29) and placebo (75.0%, n = 30). Twenty-one participants (26%) discontinued prematurely, evenly distributed between the two arms: 14 within the first 6 months, 4 around the 12-month visit, and 3 after 18 months. Reasons for discontinuation included tolerability issues, initiation of osteoporosis therapy following new diagnoses or fracture, intercurrent medical conditions, and personal factors. Two participants withdrew following serious adverse events (one in each group). Participant screening, randomization, follow-up, and retention are summarized in the CONSORT flow diagram (Figure 1).
Baseline characteristics were generally well balanced between the CalGo® and placebo groups, supporting effective randomization (Table 1). The overall mean age was 61.9 ± 6.9 years (range 50–80), with a near-equal distribution between participants aged 50–61 and 62–80 years. Anthropometric measures were closely aligned across groups: BMI averaged 24.8 ± 4.1 kg/m² in the CalGo® group and 25.0 ± 4.2 kg/m² in the placebo group, values near the upper limit of the normal range.
Bone density values were consistent with osteopenia. Femoral neck BMD and T-scores were nearly identical across groups, whereas lumbar spine BMD was modestly higher in the CalGo® group (0.93 ± 0.13 vs. 0.88 ± 0.11 g/cm²). Bone turnover markers (P1NP and β-CTX-I) fell within expected postmenopausal ranges and showed no between-group differences.
Biochemical parameters were within reference limits and broadly comparable between groups. Serum 25-hydroxyvitamin D [25(OH)D] was higher in the CalGo® group than placebo (83.6 ± 30.9 vs. 73.7 ± 23.5 nmol/L; SMD = 0.36). Both group means exceeded the reference range, indicating adequate vitamin D status in the study population. EQ-VAS scores were high in both CalGo® (82.15 ± 13.91) and placebo (82.90 ± 14.81), reflecting generally good self-perceived health.
Adherence to the assigned intervention over 24 months was high in both groups, with mean compliance of 93.4% in the CalGo® group and 88.8% in placebo, based on available intake records (n = 31 and 32, respectively).
3.2. Efficacy
3.2.1. Primary Outcome: Change in Femoral Neck BMD (g/cm²)
Over 24 months, change in femoral neck BMD differed significantly (Figure 2) between treatment groups (β = 0.020 g/cm², 95% CI 0.001 to 0.038; p = 0.038). Participants in the placebo group showed a mean decline of –0.017 g/cm² (95% CI –0.030 to –0.004), whereas BMD remained stable in the CalGo® group (+0.003 g/cm², 95% CI –0.010 to +0.016).
After adjusting for baseline femoral neck BMD, the treatment effect remained significant (Table 3, β = 0.019 g/cm², 95% CI 0.001 to 0.038; p = 0.044), while baseline values were not predictive of subsequent change (p = 0.319).

Table 2.
Femoral Neck BMD: Baseline, 12-Month and 24-Month Values, and Within-Group Changes.
| Group | Baseline BMD (g/cm²) | 12-Month BMD (g/cm²) | 24-Month BMD (g/cm²) | Mean Change (g/cm², 95% CI) | % Change1 |
|---|---|---|---|---|---|
| CalGo® | 0.74 ± 0.068 g/cm² | 0.75 ± 0.073 g/cm² | 0.74 ± 0.070 g/cm² | +0.0030 (–0.0102 to +0.0163) | +0.4% |
| Placebo | 0.75 ± 0.049 g/cm² | 0.73 ± 0.054 g/cm² | 0.73 ± 0.054 g/cm² | –0.0167 (–0.0297 to –0.0036) | –2.4% |
Values are mean ± SD unless otherwise indicated. 1% Change represents relative within-group change from baseline.
Relative to baseline, femoral neck BMD increased by +0.4% in the CalGo® group and declined by −2.4% in the placebo group (Table 2). The 95% confidence interval for the placebo group (−0.0297 to −0.0036 g/cm²) indicated consistent bone loss, whereas the interval for the CalGo® group (−0.0102 to +0.0163 g/cm²) crossed zero and centered near stability, consistent with maintenance of femoral neck BMD over 24 months. The adjusted between-group difference was +0.0192 g/cm² (95% CI 0.0006 to 0.0378; p = 0.044), corresponding to a relative preservation of approximately 2.8% compared with placebo.
Table 3.
Between-Group Differences in Femoral Neck BMD at 24 Months.
| Model | Difference (g/cm²) | 95% CI | p-value | Relative effect2 |
|---|---|---|---|---|
| Unadjusted | +0.0197 | 0.0011 to 0.0383 | 0.038 | - |
| Adjusted1 | +0.0192 | 0.0006 to 0.0378 | 0.044 | +2.8% |
1Adjusted for baseline femoral neck BMD. 2Relative effect = adjusted between-group difference expressed as a percentage of baseline mean BMD.
Relative to baseline, femoral neck BMD increased by +0.4% in the CalGo® group and declined by −2.4% in the placebo group (Table 2). The 95% confidence interval for the placebo group (−0.0297 to −0.0036 g/cm²) indicated consistent bone loss, whereas the interval for the CalGo® group (−0.0102 to +0.016
3.2.2. Secondary Outcome: Lumbar Spine BMD (L1-L4)
Over 24 months, lumbar spine BMD showed divergent trajectories between groups (Table 4). Participants in the placebo group experienced a mean decline of –0.030 g/cm² (95% CI –0.049 to –0.011; p = 0.002), whereas BMD remained stable in the CalGo® group (–0.003 g/cm², 95% CI –0.023 to +0.016; p = 0.721). Confidence interval analysis reinforced these findings: the placebo group’s interval was entirely negative, indicating consistent bone loss, whereas the CalGo® group’s interval crossed zero and centered near stability, consistent with maintenance of lumbar spine BMD over 24 months.
At 12 months mean BMD was 0.92 g/cm² (95% CI 0.88–0.97) in the CalGo® group and 0.86 g/cm² (95% CI 0.82–0.90) in the placebo group. The narrow overlap (0.88–0.90) occurred only at the margins, indicating early divergence. By 24 months, mean BMD was 0.93 g/cm² (95% CI 0.88–0.98) for CalGo® and 0.85 g/cm² (95% CI 0.82–0.89) for placebo, with no confidence interval overlap. This lack of overlap strongly suggests a meaningful and sustained difference in lumbar spine BMD trajectories between groups.
The unadjusted between-group difference in mean change was +0.023 g/cm² (95% CI –0.003 to +0.050; p = 0.086). After adjusting for baseline lumbar spine BMD, the treatment effect was +0.026 g/cm² (95% CI –0.001 to +0.054; p = 0.058), corresponding to a relative preservation of approximately 3.0% compared with placebo (Table 5). Baseline values were not predictive of subsequent change (p = 0.313). These findings suggest attenuation of bone loss at the lumbar spine with CalGo®, although between-group differences did not reach statistical significance.
Proportion of Responders Across BMD Sites
Responder analyses (≥1% BMD gain from baseline to 24 months) revealed site-specific patterns (Table 6). At the femoral neck, CalGo® participants had higher odds of response than placebo (OR = 1.89, 95% CI 0.57–6.29; p = 0.298), though the difference was not statistically significant.
In contrast, at the lumbar spine, CalGo® was associated with a significantly greater likelihood of response. Logistic regression indicated 3.6-fold higher odds of achieving ≥1% gain versus placebo (OR = 3.61, 95% CI 1.04–12.6; p = 0.043). Baseline BMD and age were not predictive of response.
At the distal radius, no treatment effect was observed (OR = 0.98, 95% CI 0.29–3.37; p = 0.980), with baseline radius BMD being the strongest predictor of outcome (p = 0.004).
3.2.3. Secondary Outcome: Distal Radius BMD
At the distal radius, no treatment effect was observed. Over 24 months, BMD remained essentially stable in both groups, with mean changes of –0.0029 g/cm² (95% CI –0.027 to +0.021) in the placebo group and +0.0029 g/cm² (95% CI –0.022 to +0.027) in the CalGo® group (Table 7).
The between-group difference was non-significant (p = 0.623 unadjusted; p = 0.735 adjusted; Table 8). Lower baseline distal radius BMD predicted greater subsequent bone loss, independent of treatment (p < 0.001).
3.2.4. Secondary Outcome: Health-Related Quality of Life – EQ-5D and EQ-VAS
No significant differences were observed between groups in changes from baseline in either the EQ-5D index (Δ = –0.0054; p = 0.746) or EQ-VAS scores (p = 0.763). Adjustment for baseline values did not materially alter the results. Baseline EQ-5D was a strong independent predictor of subsequent change (β = –0.51, p < 0.001), with higher initial health-related quality of life associated with smaller gains, reflecting a ceiling effect in this relatively healthy cohort.
3.2.5. Serum Bone Turnover Markers (P1NP & β-CTX-I)
P1NP
Between-group differences in P1NP were not significant (Figure 3). CalGo® showed a –2.98 µg/L effect relative to placebo in the unadjusted model (p = 0.59), which increased to –6.55 µg/L after baseline adjustment (p = 0.18). Baseline P1NP strongly predicted subsequent change (β = –0.58, p < 0.001), with higher initial levels associated with greater declines.
In mixed-effects models, neither treatment nor treatment-by-time interactions were significant. Both groups showed early reductions at 2 months (placebo: 57.7→53.0 µg/L; CalGo®: 53.0→42.5 µg/L), a partial rebound at 3 months, and increases by 5 months. Across visits, CalGo® values tracked consistently below placebo, suggesting a possible dampening of overall bone turnover activity, though without statistical confirmation.
β-CTX-I
No significant treatment effect was observed for β-CTX-I. In the unadjusted model, CalGo® was associated with a –0.019 µg/L change relative to placebo (p = 0.67). After adjustment for baseline β-CTX-I, the estimated effect was –0.027 µg/L (p = 0.53). Baseline β-CTX-I showed a trend toward predicting subsequent change (β = –0.34, p = 0.07), suggesting that higher initial levels were associated with greater reductions. Mixed-effects regression likewise indicated no significant main or interaction effects of treatment. Over time, β-CTX-I values were stable at 2 months, increased at 3 months, and remained elevated at 5 months (Figure 4). At all visits, mean β-CTX-I levels in the CalGo® group were numerically lower than those in the placebo group, but none of these differences reached statistical significance.
When examining coupling of bone turnover markers, positive associations were observed between change in β-CTX-I and change in ALP (CalGo®: r = 0.43, p = 0.025; placebo: r = 0.54, p = 0.003). Regression analyses indicated a steeper slope in CalGo® (β = 55.6, 95% CI: 7.6–103.7, p = 0.025) compared with placebo (β = 30.8, 95% CI: 11.6–50.0, p = 0.003), suggesting a stronger ALP response relative to resorption. Baseline ALP was not associated with subsequent β-CTX-I change (p = 0.688).
Exploratory Analyses of Bone Turnover Markers and BMD Relationships
At 3 months, between-group differences in β-CTX-I change from baseline were non-significant (β = –0.032, p = 0.26). Baseline β-CTX-I significantly predicted change (β = –0.27, p = 0.024), with greater early reductions among participants with higher initial values. Marginal means indicated a slight increase in placebo (+0.016 µg/L) versus a small decrease with CalGo® (–0.016 µg/L), favoring attenuated resorption in the active group.
At 24 months, changes in turnover markers were not associated with lumbar spine BMD in the CalGo® group (P1NP: β = –5.0 × 10⁻⁵, p = 0.94; β-CTX-I: β = –0.081, p = 0.22). In contrast, placebo showed a significant inverse relationship between P1NP change and BMD change (β = –0.00099, p = 0.013), with greater P1NP increases linked to greater bone loss. β-CTX-I was not significant (β = –0.061, p = 0.32). These findings suggest uncoupled remodeling in placebo, versus metabolic stabilization with CalGo®.
Baseline ALP did not predict early changes in β-CTX-I (β = –0.00025, p = 0.69), indicating no evidence that formation status influenced resorption dynamics.
3.2.6. Safety
Adverse Events
The overall incidence of adverse events across two years was low in both groups. At 12 months, 20.0% of participants in the placebo arm reported at least one event compared with 12.8% in the CalGo® arm (χ² = 0.70, p = 0.403). By study end, adverse events had declined further, occurring in 10.0% of placebo participants and 3.5% of those receiving CalGo® (χ² = 1.00, p = 0.317). Although these differences were not statistically significant, the numerical pattern favored CalGo®.
Across the trial, 32 adverse events were reported, occurring in 65.6% of participants (Table 9). The majority were of mild or moderate intensity, and most were judged by investigators as unrelated or unlikely to be related to study product. The most frequent categories were gastrointestinal complaints—dyspepsia, constipation, diarrhea, nausea, and bloating—while isolated cases included headache, cardiac events (palpitations/arrhythmia), dermatologic symptoms (eczema, pruritus, vesicular rash), and nonspecific complaints. A total of eight fractures were recorded (four rib, three upper extremity, one toe).
Three serious adverse events required hospitalization: paroxysmal atrial fibrillation (placebo, severe, unlikely related), ischemic cerebrovascular event (CalGo®, mild, unlikely related), and bacterial skin infection (placebo, moderate, not related). Two of these events (atrial fibrillation and cerebrovascular event) led to study withdrawal, whereas the infection resolved and the participant continued treatment. No deaths occurred, and no hepatic or renal safety concerns were observed during follow-up.
3.2.7. Liver and Renal Function Parameters
Creatinine remained stable and within the normal reference range throughout follow-up. At study end, mean creatinine was 69.1 ± 10.4 µmol/L in the CalGo® group and 66.8 ± 8.9 µmol/L in the placebo group, with negligible mean changes from baseline (−0.07 ± 6.2 vs. +2.3 ± 5.4 µmol/L, respectively). eGFR declined modestly in both groups (−2.0 ± 6.6 vs. −4.5 ± 7.0 mL/min/1.73m²) but remained within the normal range, with no significant between-group differences.
The urinary calcium/creatinine ratio was stable across the intervention. At T5, mean values were 8.37 in the placebo group and 7.71 in the CalGo® group (p = 0.63). Adjustment for baseline yielded similar results (p = 0.55). Mixed-effects regression across Baseline, 12 months and 24 months confirmed no group effect (p = 0.54), no time effect (p = 0.89), and no group × time interaction (p = 0.32). Predicted means (7.5–8.5) remained consistently within normal physiological limits, indicating no impact of CalGo® on urinary calcium handling or renal mineral excretion.
Baseline ALT concentrations were comparable between groups. During follow-up, values fluctuated slightly (≈22–26 U/L) but showed no significant main effect of group (p = 0.61), time (all p > 0.20), or group × time interaction (all p > 0.26). Estimated marginal means followed parallel trajectories, with no clinically meaningful changes. Thus, CalGo® supplementation did not adversely affect liver function over 24 months.
3.2.8. Subgroup Analyses on Dosing Behavior (Exploratory)
3.2.8.1. Split-Dose vs All in Morning
No differences in femoral neck BMD response were observed between participants taking CalGo® as a split dose (2+2 capsules). In the interaction model, dosing pattern showed no modifying effect (p = 0.95), indicating that efficacy was consistent regardless of dosing schedule.
3.2.8.2. With Meal vs Without Meal
Within the overall model (n = 58), CalGo® supplementation was associated with greater preservation of femoral neck BMD compared with placebo (β = 0.020 g/cm², p = 0.044). Capsule intake with food showed no independent effect (p = 0.99). Analyses restricted to CalGo® recipients likewise demonstrated no effect of food intake on treatment response (p = 0.68), and formal interaction testing confirmed the absence of effect modification (p = 0.48). These findings indicate that CalGo® efficacy was unaffected by meal timing.
4. Discussion
This 24-month randomized controlled trial demonstrates that daily supplementation with CalGo®, a marine-derived salmon bone complex, preserved femoral neck bone mineral density (BMD) and attenuated lumbar spine loss in postmenopausal women with osteopenia. These findings are likely to be clinically relevant, as osteopenia is common, undertreated, and confers elevated fracture risk. Postmenopausal women with osteopenia constitute a group in whom specific nutritional and nutraceutical interventions may yield BMD benefits [23]. Stabilizing BMD in this population represents a meaningful preventive opportunity.
Placebo recipients experienced the age-expected 2–3% decline in femoral neck and lumbar spine BMD over two years, whereas CalGo® significantly preserved femoral neck values and attenuated lumbar spine decline. The adjusted between-group difference at the femoral neck corresponded to a relative preservation of nearly 3% (p = 0.044), a magnitude considered clinically relevant given that modest gains in BMD translate into meaningful fracture risk reduction. At the lumbar spine, the adjusted between-group difference narrowly missed conventional statistical significance (p = 0.058). However, responder analysis indicated that nearly one-third of CalGo® recipients achieved measurable improvements compared with only one in ten placebo participants, suggesting clinically meaningful benefits in a subset of participants. Health-related quality of life did not change between groups (EQ-5D index and EQ-VAS), and baseline EQ-5D strongly predicted smaller subsequent gains, consistent with a ceiling effect in this relatively healthy cohort. The study’s rigorous design—including double blinding, external monitoring, validated densitometry, and high adherence—supports confidence in these results.
Effects varied by skeletal site, with benefits observed at the femoral neck and lumbar spine, but not the distal radius. This site-specificity likely reflects the differing cortical and trabecular composition of these regions and their distinct bone remodeling dynamics, with trabecular-rich sites generally more responsive to metabolic and nutritional influences, a pattern also observed in recent meta-analytic evidence [24]. Such patterns are consistent with earlier findings on ossein–hydroxyapatite complexes, reinforcing the biological plausibility of interventions derived from native bone matrix. At the distal radius, lower baseline BMD predicted greater subsequent loss irrespective of treatment, indicating that baseline cortical bone status was the dominant driver at this site. Broad, contemporary syntheses likewise conclude that calcium supplementation has only modest and context-dependent effects on BMD—showing little benefit in healthy premenopausal women and no routine role in well-nourished postmenopausal women—underscoring the importance of targeting nutritionally vulnerable populations [19,20]. A recent review likewise concludes that routine calcium supplements produce only small, non-cumulative BMD gains without reducing fractures in community-dwelling adults, while also raising safety concerns; accordingly, dietary calcium is preferred [25]. Bone-matrix complexes may offer advantages over calcium salts by providing not only mineral–collagen structure but also trace proteins and growth factors (e.g., osteocalcin, Insulin-like Growth Factors, Transforming Growth Factor-β) that can support osteoblast activity and bone formation [10]. Although not directly assayed here, CalGo®’s minimally processed, collagen-rich marine matrix could plausibly convey such anabolic cues, which may have contributed to the observed preservation of BMD.
No significant between-group differences emerged for bone turnover markers (PINP, β-CTX-I). This was not unexpected, as these markers are tend to be most responsive to short-term changes and generally require larger within-person shifts to exceed biological and analytical variability, whereas DXA-derived BMD reflects cumulative remodeling balance over years [21]. Therefore, the absence of detectable BTM changes does not diminish the relevance of the BMD findings, which capture longer-term skeletal adaptations. Exploratory analyses suggested a possible signal of altered remodeling dynamics in the CalGo® group: the association between β-CTX-I and ALP appeared steeper than in placebo, indicating that in participants with greater resorption, osteoblastic activity may have risen more proportionally. While hypothesis-generating, this observation raises the possibility that CalGo® may influence coupling between resorption and formation rather than acting through a single pathway In placebo, increases in P1NP were inversely associated with 24-month lumbar spine BMD change, indicating that P1NP behaved like a remodeling stress marker—where higher apparent formation activity accompanied greater net bone loss—whereas no such associations were observed with CalGo®. These preliminary findings should be interpreted cautiously and require validation in larger studies with mechanistic endpoints.
The safety profile was favorable, with no hepatic or renal adverse effects and a low incidence of generally mild side effects. Renal and hepatic safety profiles were reassuring: creatinine and eGFR remained within reference ranges with modest, similar declines in both groups; ALAT values fluctuated slightly without group, time, or interaction effects; and urinary calcium/creatinine ratios were stable across T0–T5 with no group or time effects, indicating no perturbation of calcium handling. Across two years, adverse events were generally mild/moderate with three serious events (two placebo, one CalGo®) and no deaths; two SAEs prompted withdrawal. Although not powered for fractures, eight fractures (rib, upper extremity and toe) were recorded overall without evidence to attribute causality to study product. Importantly, efficacy was unaffected by dosing behavior: neither split versus once-daily intake (p = 0.95) nor capsule consumption with versus without food (p = 0.99) modified femoral neck BMD response, with interaction testing confirming consistent effects across regimens (all p > 0.4). Adherence was high (≈93% CalGo® vs ≈89% placebo among participants with intake records), supporting that the observed BMD effects are unlikely to be explained by differential compliance. These findings support flexibility in real-world use, where convenience often determines adherence.
Although this study was not designed to evaluate fractures directly, the observed preservation of femoral neck BMD is noteworthy given the established link between BMD and fracture risk. The between-group difference of 0.019 g/cm² corresponds to approximately 0.33 SD. Large epidemiological studies suggest that each 1-SD reduction in femoral neck BMD is associated with a ~1.5-fold increase in major osteoporotic fractures and a 2.0–2.6-fold increase in hip fractures [22]. Extrapolating from these relationships, the preservation of bone mass observed here could translate into a modest reduction in fracture risk if sustained over time. While model-based, as data of microarchitecture were not available, and requiring confirmation in larger cohorts with fracture endpoints, these estimates underscore the potential clinical significance of maintaining BMD at fracture-prone sites.
The trial had limitations. Recruitment did not reach the original target, and it was neither designed nor powered to assess fractures, which remain a very important clinical endpoint in osteoporosis research. The study population was restricted to relatively healthy postmenopausal women with osteopenia drawn from three geographic regions, which enhances internal validity but may still somewhat limit broader generalizability. However, this reduced confounding from comorbidities and medication use, strengthening internal validity. A baseline imbalance in 25(OH)D, with higher levels in the CalGo® group (p < 0.05), was observed. Although both groups were vitamin D–replete, this imbalance may represent a potential confounder. Trial strengths included its randomized, double-blind design, rigorous selection criteria, long follow-up, external monitoring, and high adherence.
In summary, two years of CalGo® supplementation preserved femoral neck BMD and attenuated lumbar spine loss in postmenopausal women with osteopenia. Together with biological plausibility, favorable safety, and the observed subset of spine responders, these findings support CalGo® as a promising marine-derived strategy for maintaining skeletal health at fracture-prone sites. Larger and longer trials with fracture outcomes and mechanistic endpoints are warranted to confirm these effects and further delineate the contributions of hydroxyapatite, collagen, and other bone matrix constituents.
5. Conclusions
Daily supplementation with CalGo® for 24 months preserved femoral neck bone mineral density and attenuated lumbar spine loss in postmenopausal women with osteopenia, with a favorable safety profile. These findings support CalGo® as a promising marine-derived strategy for skeletal health.
Supplementary Materials
The following supporting information can be downloaded at the website of this paper posted on Preprints.org.
Author Contributions
Conceptualization, C.B., A.N.S.T. and E.H.; methodology, C.B.; software, C.B., A.N.S.T. and E.H.; validation, C.B., A.N.S.T. and C.C.; formal analysis, T.Å.M.; investigation, A.N.S.T. and C.B.; resources, T.F.A.; data curation, A.N.S.T.; writing—original draft preparation, C.B.; writing—review and editing, C.B., B.F., C.C., T.Å.M., E.H. and T.F.A.; visualization, T.Å.M. and C.C.; supervision, C.C., B.F. and E.H.; project administration, E.H.; funding acquisition, —. All authors have read and agreed to the published version of the manuscript.
Funding
This study was funded by Hofseth BioCare ASA and additionally supported through the SkatteFUNN scheme of the Research Council of Norway.
Institutional Review Board Statement
The study was conducted in accordance with the Declaration of Helsinki and approved by the Regional Committee for Medical and Health Research Ethics, Mid-Norway (REK midt) (Protocol code 264146, approval date 21 June 2021).
Informed Consent Statement
Informed consent was obtained from all subjects involved in the study.
Data Availability Statement
The data generated and analyzed in this trial are stored securely in accordance with the General Data Protection Regulation (GDPR) and the requirements set forth by REK Central. Due to ethical and legal restrictions, the full dataset cannot be made publicly available. Certain de-identified data may be made available upon reasonable request to the corresponding author (chbj@hofsethbiocare.no), subject to GDPR and REK midt requirements.
Acknowledgments
The CONSORT diagram was created with BioRender.com (https://BioRender.com/yimionp).
Conflicts of Interest
C.B., A.R.S., C.C., and B.F. are employees of Hofseth BioCare ASA, the manufacturer of CalGo®. Aside from the employment relationships disclosed above, the authors report no competing interests.
Abbreviations
The following abbreviations are used in this manuscript.
| AE | Adverse Event |
| AHA | American Heart Association |
| ALT (ALAT) | Alanine Aminotransferase |
| ALP | Alkaline Phosphatase |
| APC | Article Processing Charge |
| BMD | Bone Mineral Density |
| BMI | Body Mass Index |
| BP | Blood Pressure |
| BTM | Bone Turnover Marker(s) |
| CalGo® | Salmon Bone Complex (CalGo®, Hofseth BioCare ASA) |
| SBP | Salmon Bone Powder |
| CC BY | Creative Commons Attribution License |
| CI | Confidence Interval |
| CONSORT | Consolidated Standards of Reporting Trials |
| β-CTX-I | C-Terminal Telopeptide of Type I Collagen |
| DXA | Dual-Energy X-ray Absorptiometry |
| DXA | Dual-Energy X-ray Absorptiometry |
| eGFR | Estimated Glomerular Filtration Rate |
| ECLIA | Electrochemiluminescence Immunoassay |
| EQ-5D-3L | EuroQol 5-Dimension, 3-Level |
| EQ-VAS | EuroQol Visual Analogue Scale |
| FDA | U.S. Food and Drug Administration |
| FHI | Norwegian Institute of Public Health (Folkehelseinstituttet) |
| FSSC 22000 | Food Safety System Certification 22000 |
| GMP | Good Manufacturing Practice |
| GDPR | General Data Protection Regulation |
| GRAS | Generally Recognized As Safe |
| HACCP | Hazard Analysis and Critical Control Points |
| HMR | Helse Møre og Romsdal HF (Møre og Romsdal Hospital Trust) |
| HRT | Hormone Replacement Therapy |
| IRB | Institutional Review Board |
| LDS | Lovisenberg Diakonale Sykehus |
| MDPI | Multidisciplinary Digital Publishing Institute |
| NDI | New Dietary Ingredient |
| NTNU | Norwegian University of Science and Technology |
| OHC | Ossein–Hydroxyapatite Complex |
| OR | Odds Ratio |
| P1NP | Procollagen Type I N-Terminal Propeptide |
| REK midt | Regional Committee for Medical and Health Research Ethics, Mid-Norway |
| SAE | Serious Adverse Event |
| SD | Standard Deviation |
References
- Baxter-Jones ADG; Faulkner RA; Forwood MR; Mirwald RL; Bailey DA. Bone mineral accrual from 8 to 30 years of age: an estimation of peak bone mass. J Bone Miner Res 2011, 26, 1729–1739. [CrossRef]
- Hendrickx G; Boudin E; Van Hul W. A look behind the scenes: the risk and pathogenesis of primary osteoporosis. Nat Rev Rheumatol 2015, 11, 462–474. [CrossRef]
- Zanker J; Duque G. Osteoporosis in older persons: old and new players. J Am Geriatr Soc 2019, 67, 831–840. [CrossRef]
- Shea B; Wells G; Cranney A; Zytaruk N; Robinson V; Griffith L; Ortiz Z; Peterson J; Adachi J; Tugwell P; et al. Meta-analyses of therapies for postmenopausal osteoporosis. VII. Meta-analysis of calcium supplementation for the prevention of postmenopausal osteoporosis. Endocr Rev 2002, 23, 552–559.
- Tang BM; Eslick GD; Nowson C; Smith C; Bensoussan A. Use of calcium or calcium in combination with vitamin D supplementation to prevent fractures and bone loss in people aged 50 years and older: a meta-analysis. Lancet 2007, 370, 657–666. [CrossRef]
- Tai V; Leung W; Grey A; Reid IR; Bolland MJ. Calcium intake and bone mineral density: systematic review and meta-analysis. BMJ 2015, 351, h4183. [CrossRef]
- Bristow SM; Gamble GD; Stewart A; Horne L; House ME; Aati O; Mihov B; Horne AM; Reid IR. Acute and 3-month effects of microcrystalline hydroxyapatite, calcium citrate and calcium carbonate on serum calcium and markers of bone turnover: a randomised controlled trial in postmenopausal women. Br J Nutr 2014, 112, 1611–1620. [CrossRef]
- Castelo-Branco C; Ciria-Recasens M; Cancelo-Hidalgo MJ; Palacios S; Haya-Palazuelos J; Carbonell-Abelló J; Blanch-Rubió J; Martínez-Zapata MJ; Manasanch J; Pérez-Edo L. Efficacy of ossein-hydroxyapatite complex compared with calcium carbonate to prevent bone loss: a meta-analysis. Menopause 2009, 16, 984–991. [CrossRef]
- Castelo-Branco C; Dávila Guardia J. Use of ossein-hydroxyapatite complex in the prevention of bone loss: a review. Climacteric 2015, 18, 29–37. [CrossRef]
- Castelo-Branco C; Cancelo Hidalgo MJ; Palacios S; Ciria-Recasens M; Fernández-Pareja A; Carbonell-Abella C; Manasanch J; Haya-Palazuelos J. Efficacy and safety of ossein-hydroxyapatite complex versus calcium carbonate to prevent bone loss. Climacteric 2020, 23, 252–258. [CrossRef]
- Framroze B; Godase S; Sawant S. A comparative study of the impact of dietary calcium sources on serum calcium and bone reformation using an ovariectomized Sprague-Dawley rat model. J Nutr Food Sci 2015, 5, 348.
- Framroze B; Havaldar F. An in vitro study on the effect of five commercial calcium supplements on human osteoblast cell proliferation and Ca²⁺ mineralization. J Nutr Food Sci 2018, 8, 738.
- Currie C; Bjerknes C; Framroze B; Hermansen E. A randomized, blinded, calcium-carbonate controlled cross-over study of serum calcium levels 24 hours after CalGo™ oral supplementation in post-menopausal women. Biomed J Sci Tech Res 2022, 41(2), 32581–32585.
- Manske SL; Liu-Ambrose T; Cooper DM; Kontulainen S; Guy P; Forster BB; McKay HA. Cortical and trabecular bone in the femoral neck both contribute to proximal femur failure load prediction. Osteoporos Int 2009, 20, 445–453. [CrossRef]
- Lotz JC; Cheal EJ; Hayes WC. Stress distributions within the proximal femur during gait and falls: implications for osteoporotic fracture. Osteoporos Int 1995, 5, 252–261. [CrossRef]
- Abrahamsen B; van Staa T; Ariely R; Olson M; Cooper C. Excess mortality following hip fracture: a systematic epidemiological review. Osteoporos Int 2009, 20, 1633–1650. [CrossRef]
- Johnell O; Kanis JA. An estimate of the worldwide prevalence and disability associated with osteoporotic fractures. Osteoporos Int 2006, 17, 1726–1733. [CrossRef]
- Kistler-Fischbacher M; Yong JS; Weeks BK; Beck BR. High-intensity exercise and geometric indices of hip bone strength in postmenopausal women on or off bone medication: the MEDEX-OP randomised controlled trial. Calcif Tissue Int 2022, 111, 256–266. [CrossRef]
- Manson JE; Crandall CJ; Rossouw JE; Chlebowski RT; Anderson GL; Stefanick ML; Aragaki AK; Cauley JA; Wells GL; LaCroix AZ; et al. The Women’s Health Initiative randomized trials and clinical practice: a review. JAMA 2024, 331, 1748–1760.
- Méndez-Sánchez L; Clark P; Winzenberg TM; Tugwell P; Correa-Burrows P; Costello R. Calcium and vitamin D for increasing bone mineral density in premenopausal women. Cochrane Database Syst Rev 2023, 1, CD012664.
- Bhattoa HP; Vasikaran S; Trifonidi I; Kapoula G; Lombardi G; Jørgensen NR; Pikner R; Miura M; Chapurlat R; Hiligsmann M; et al. Update on the role of bone turnover markers in the diagnosis and management of osteoporosis: a consensus paper from ESCEO, IOF, and IFCC. Osteoporos Int 2025, 36, 579–608.
- Schini M; Lui L-Y; Vilaca T; Ewing SK; Thompson AR; Bauer DC; Bouxsein ML; Black DM; Eastell R. The relationship between baseline bone mineral density and fracture incidence in the placebo groups of randomized controlled trials using individual patient data from the FNIH-ASBMR-SABRE project. J Bone Miner Res 2024, 40, 307–314. [CrossRef]
- Wang F; Wei W; Liu PJ. Effects of probiotic supplementation on bone health in postmenopausal women: a systematic review and meta-analysis. Front Endocrinol (Lausanne) 2024, 15, 1487998. [CrossRef]
- Xiaoya L; Junpeng Z; Li X; Haoyang Z; Xueying F; Yu W. Effect of different types of exercise on bone mineral density in postmenopausal women: a systematic review and network meta-analysis. Sci Rep 2025, 15, 11740. [CrossRef]
- Reid IR. Calcium supplementation – efficacy and safety. Curr Osteoporos Rep 2025, 23, 8. [CrossRef]
Figure 1.
CONSORT flow diagram of the 24-month CalGo® trial. Of 346 screened, 80 were randomized 1:1 to CalGo® (n = 40) or placebo (n = 40). The diagram shows allocation, follow-up, analysis, and reasons for exclusion or discontinuation.
Figure 1.
CONSORT flow diagram of the 24-month CalGo® trial. Of 346 screened, 80 were randomized 1:1 to CalGo® (n = 40) or placebo (n = 40). The diagram shows allocation, follow-up, analysis, and reasons for exclusion or discontinuation.
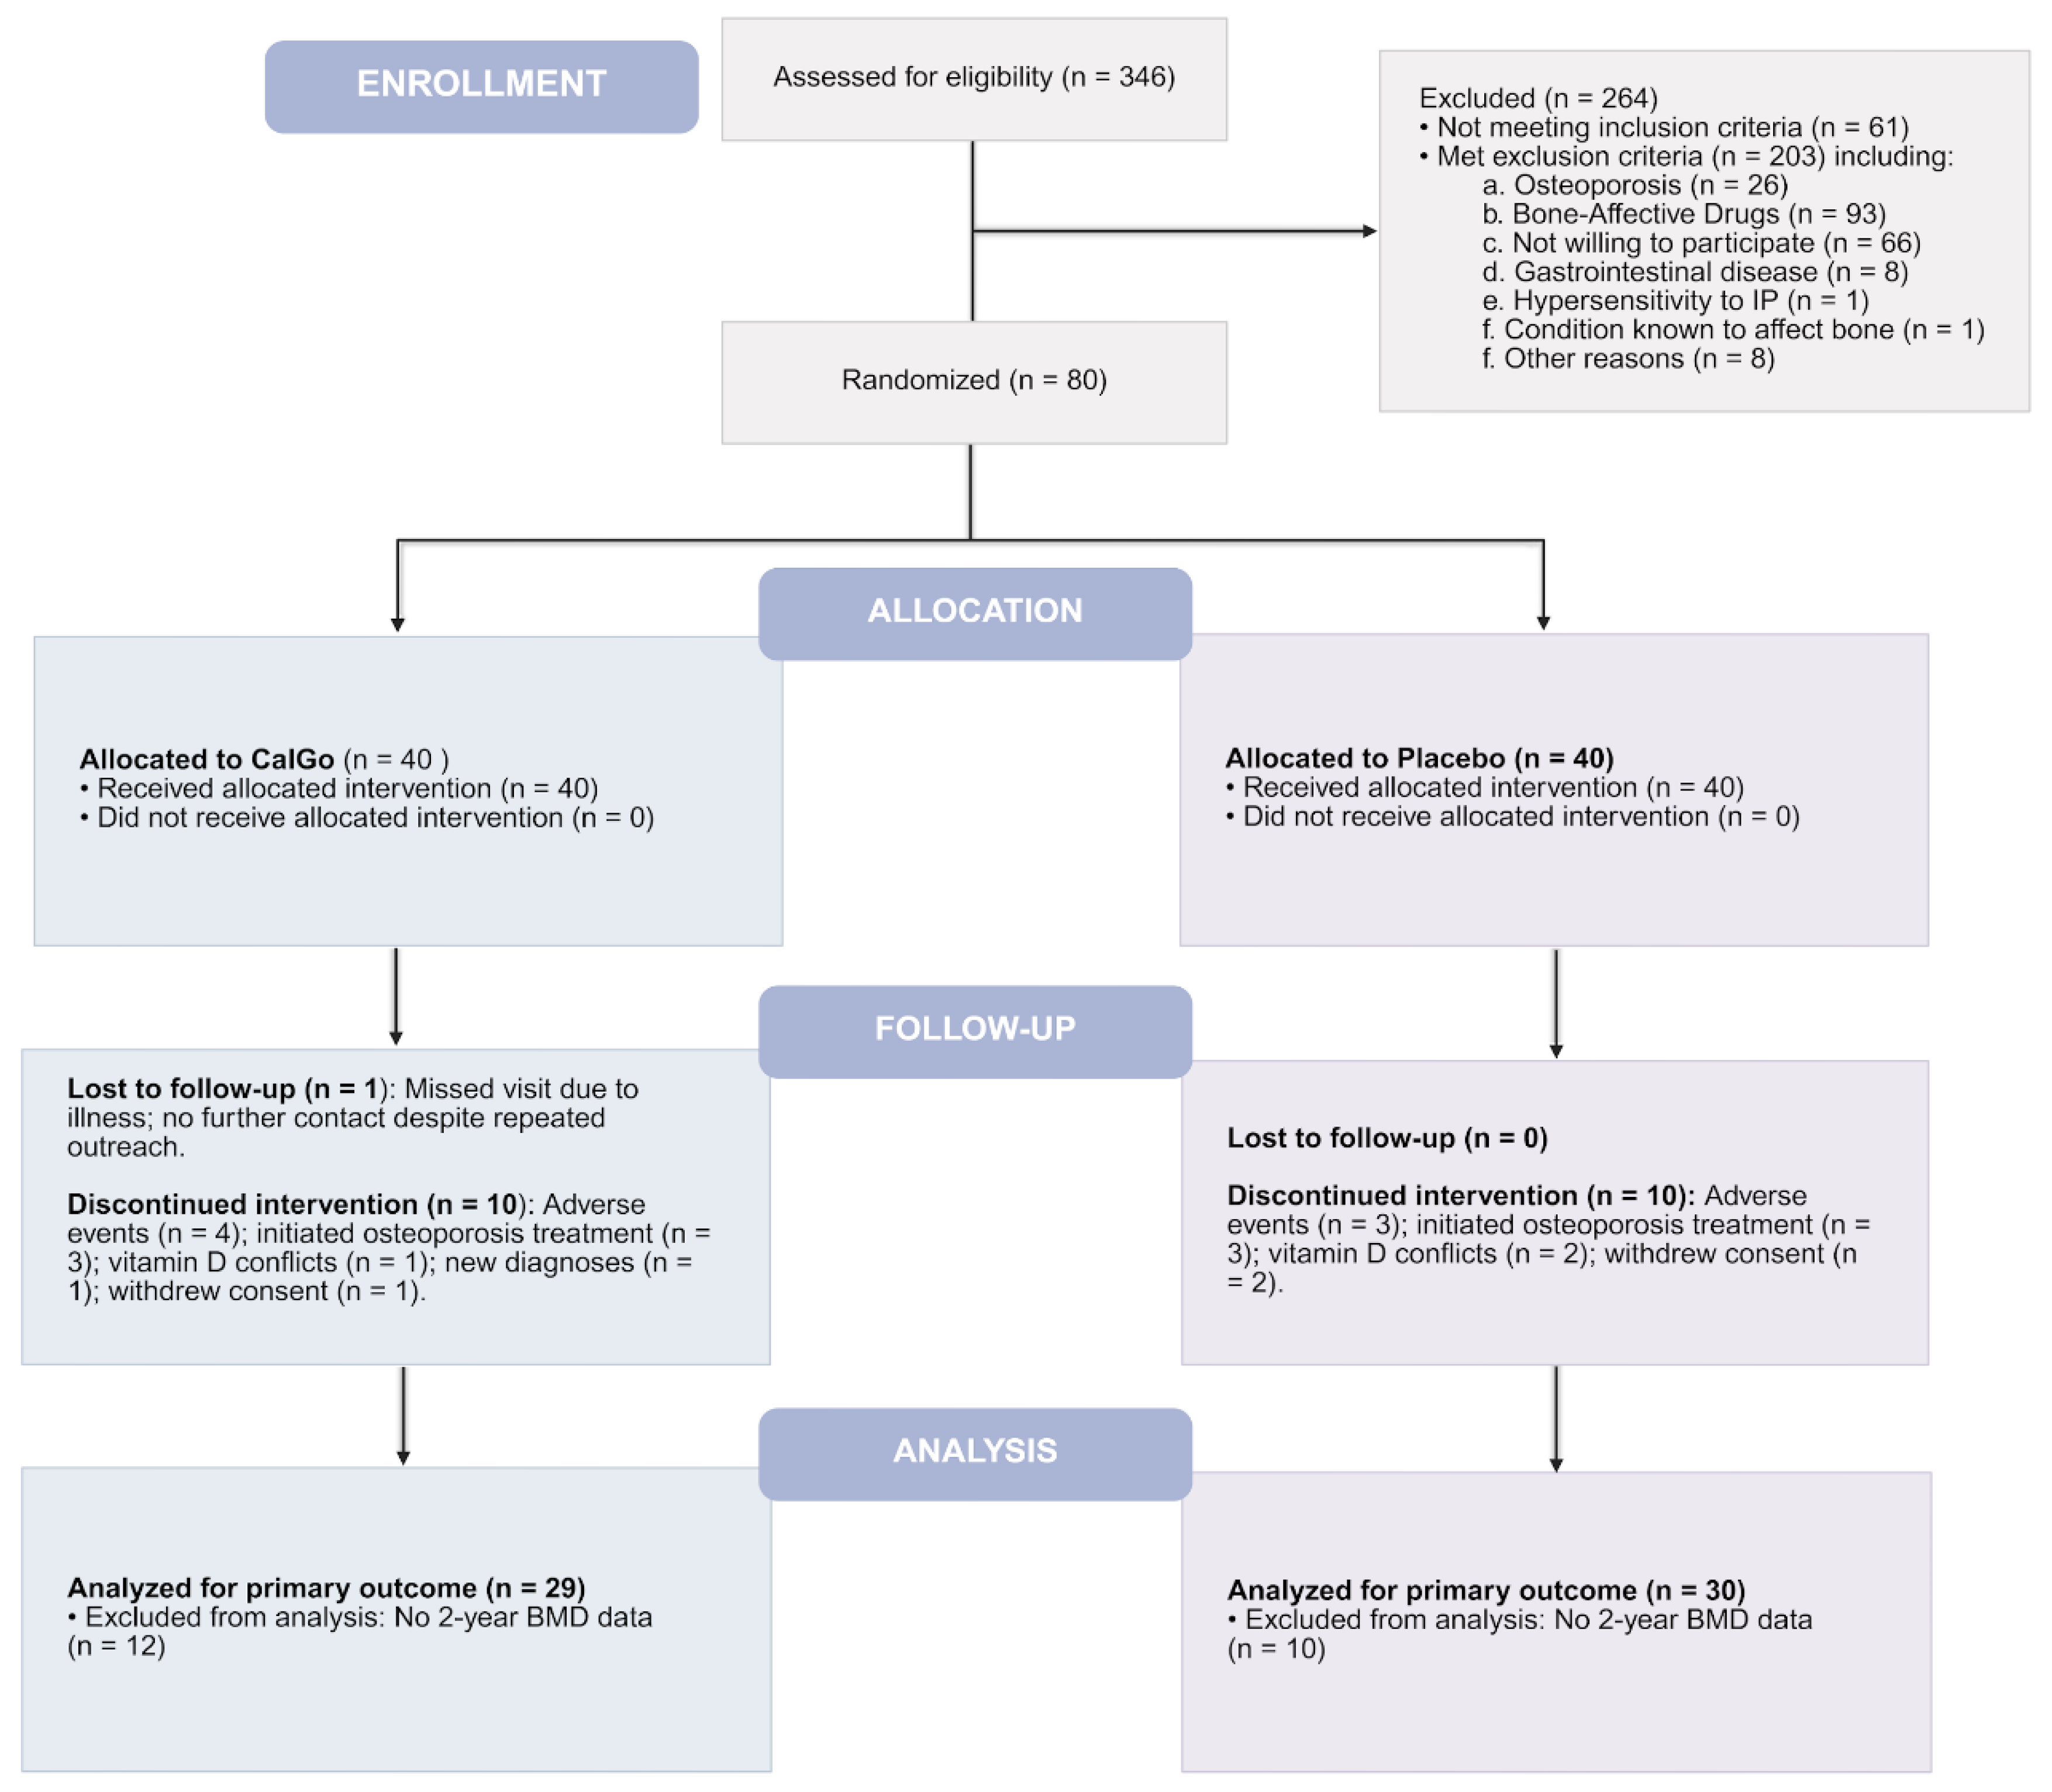
Figure 2.
Femoral neck BMD (g/cm²) at baseline and 24 months (CalGo® n=29, placebo n=30 at 24 months). Means ± SD shown; red stippled line marks baseline CalGo®. Covariate-adjusted treatment effect at 24 months: +0.019 g/cm² (95% CI 0.001–0.038; p=0.044).
Figure 2.
Femoral neck BMD (g/cm²) at baseline and 24 months (CalGo® n=29, placebo n=30 at 24 months). Means ± SD shown; red stippled line marks baseline CalGo®. Covariate-adjusted treatment effect at 24 months: +0.019 g/cm² (95% CI 0.001–0.038; p=0.044).
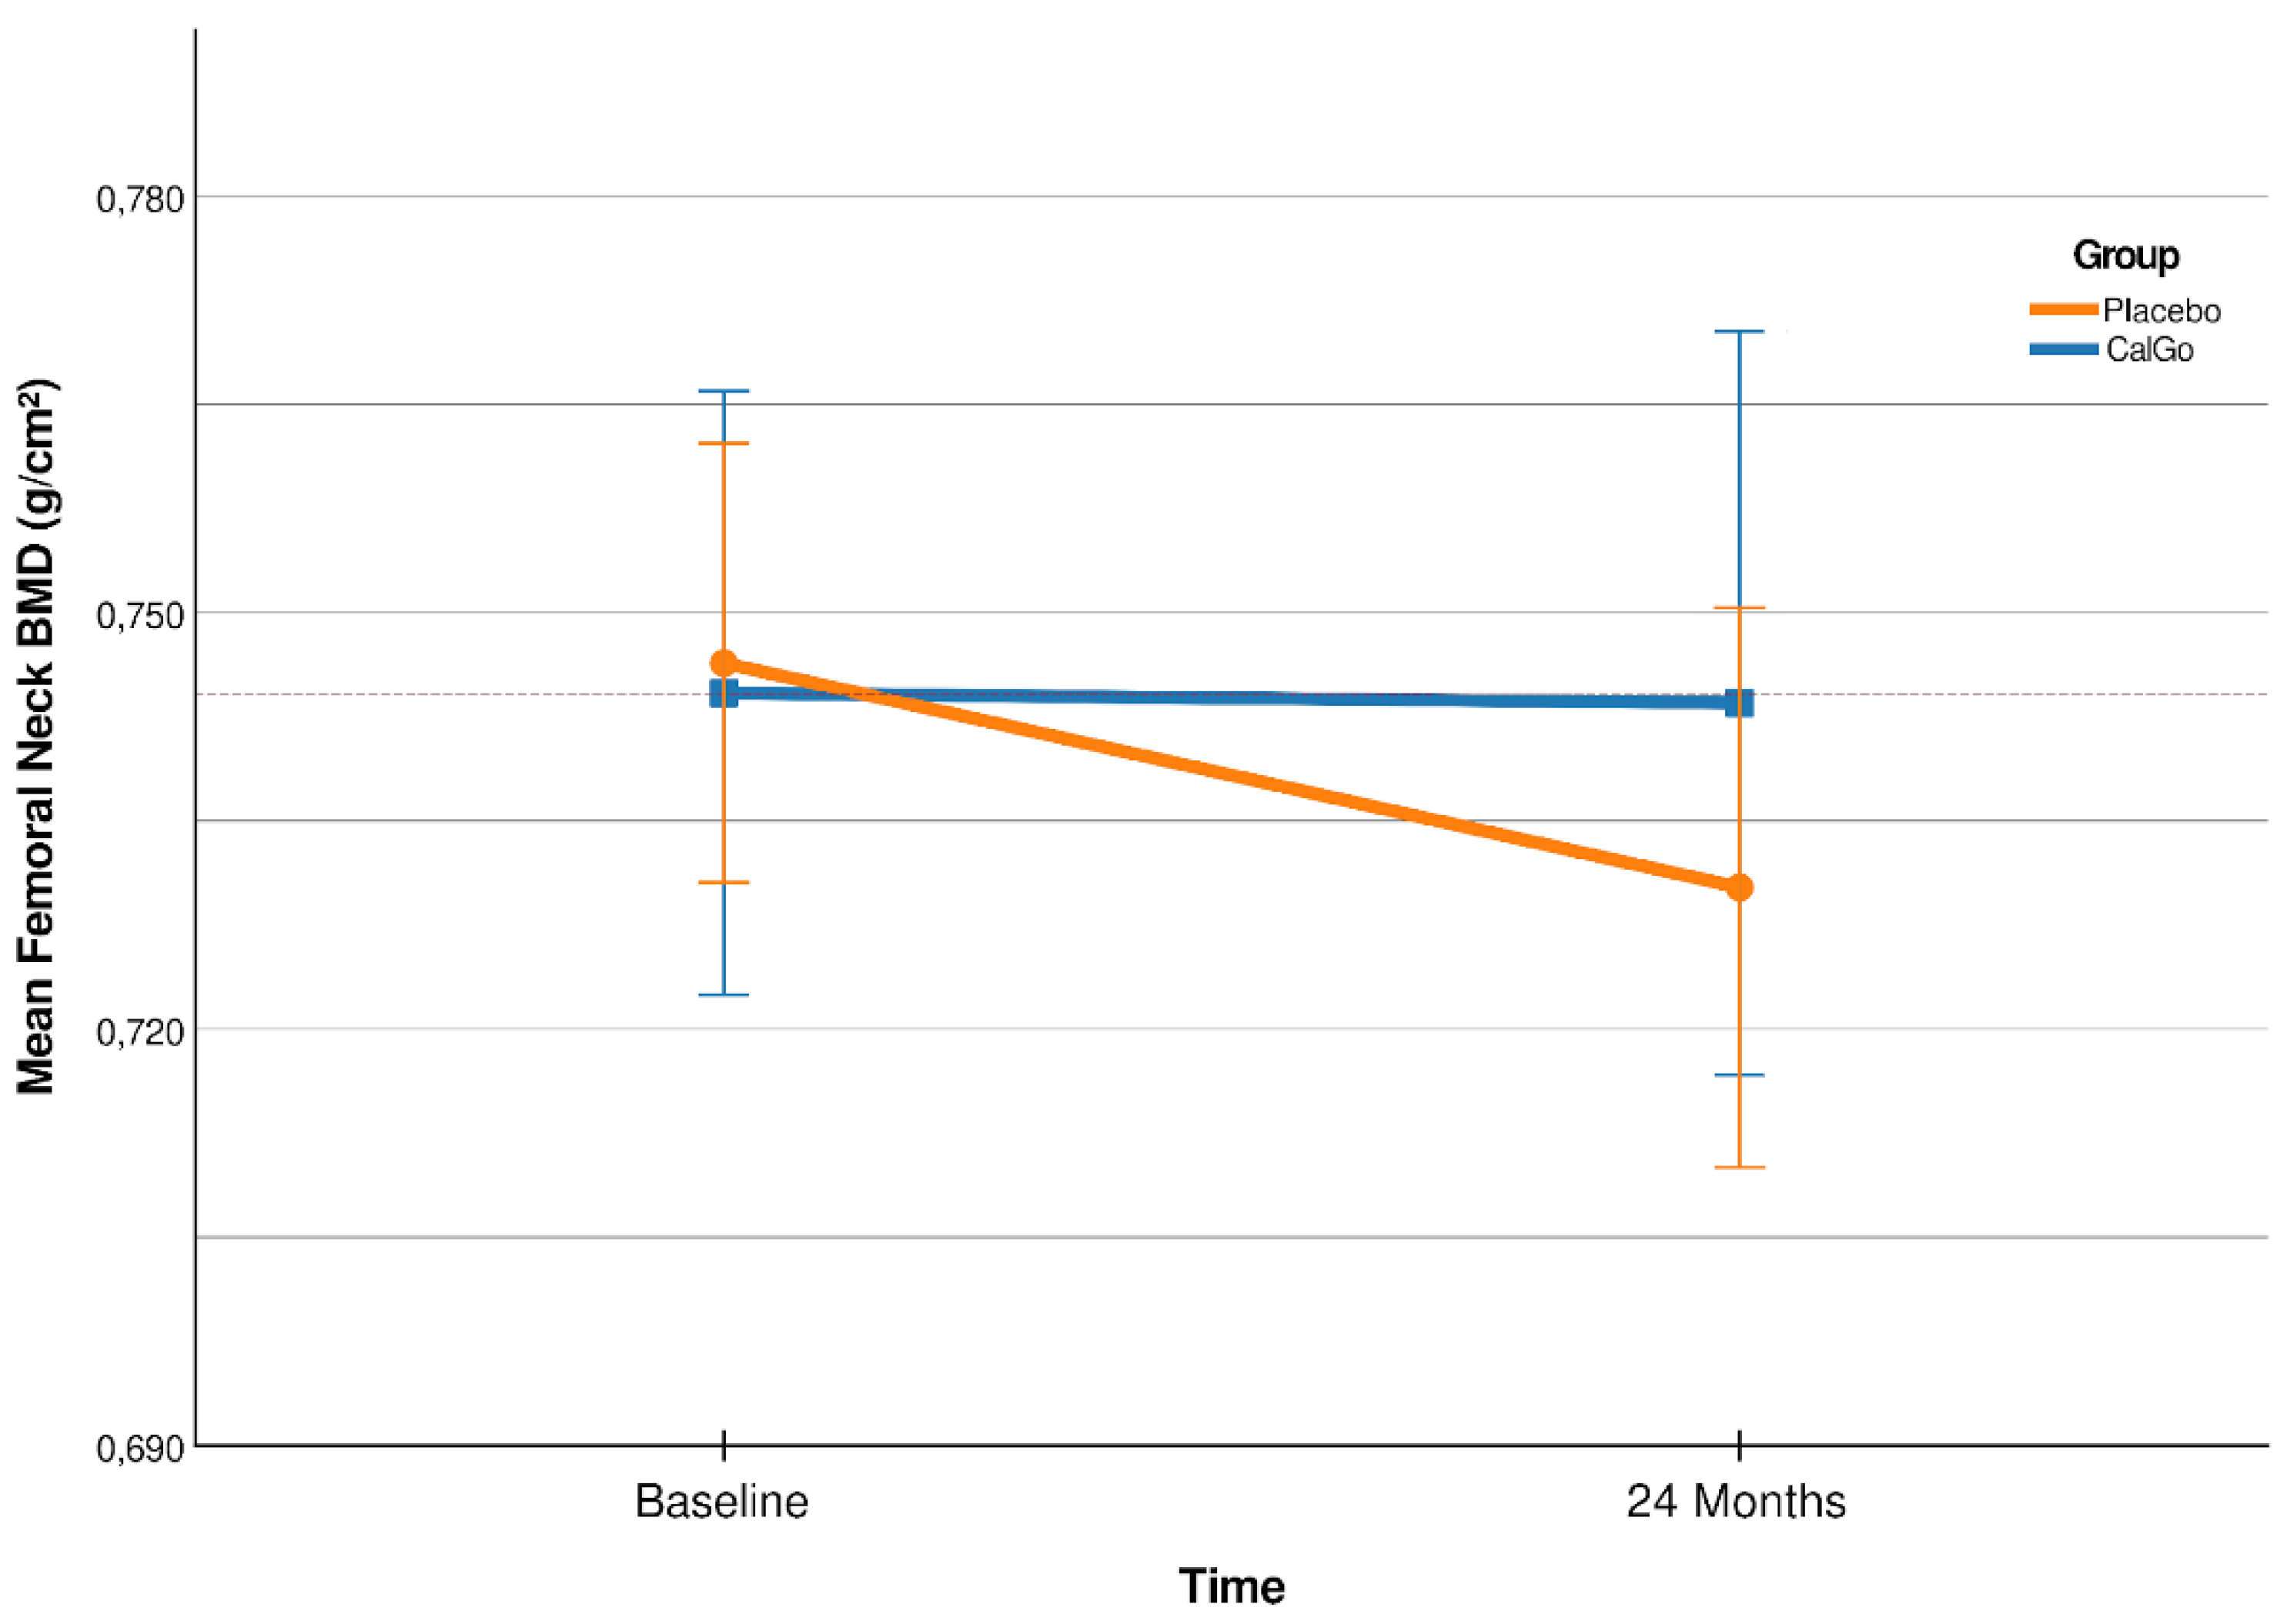
Figure 3.
Estimated serum P1NP concentrations (µg/L) by treatment group over time. Values were derived from a mixed-effects model with fixed effects for treatment, time, and their interaction, and random subject intercepts. Means (95% CI) are shown for placebo (red) and CalGo® (black) at baseline, 2, 3, and 5 months. P1NP levels were consistently lower with CalGo®, though differences were not statistically significant.
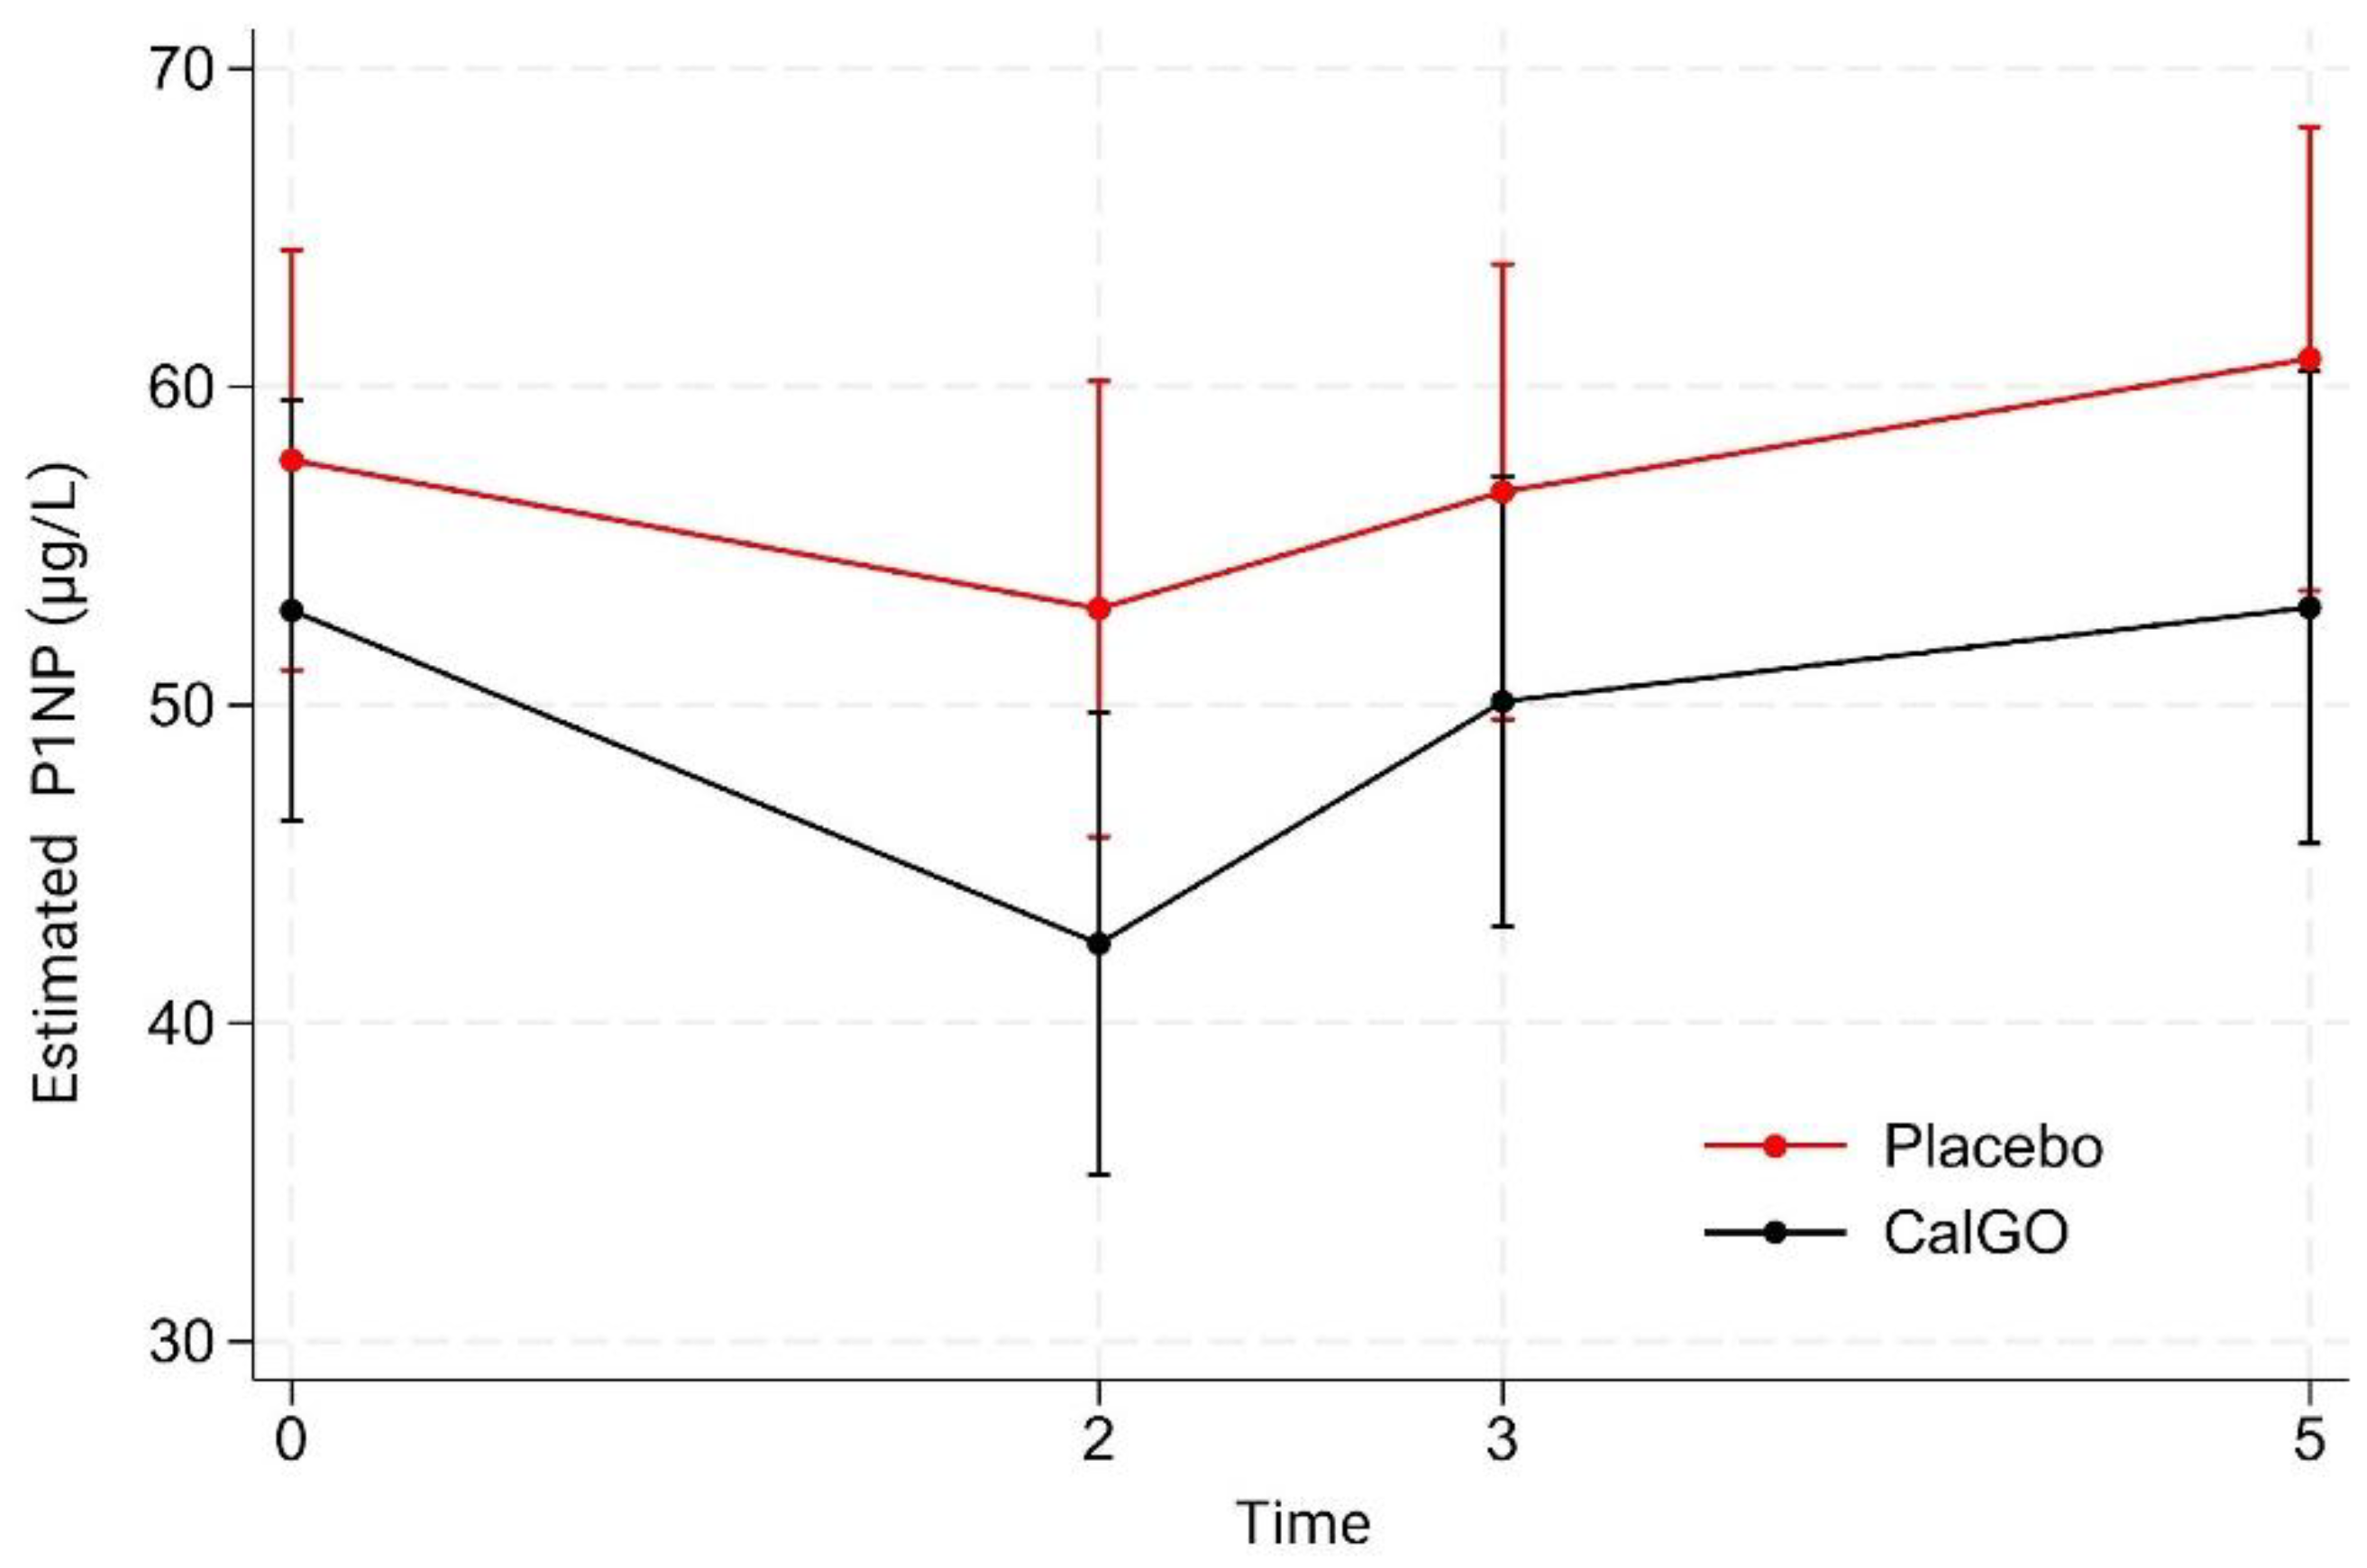
Figure 4.
Estimated serum β-CTX-I concentrations (µg/L) by treatment group over time. Values were derived from a mixed-effects model with fixed effects for treatment, time, and their interaction, and random subject intercepts. Means (95% CI) are shown for placebo (red) and CalGo® (black) at baseline, 2, 3, and 5 months. β-CTX-I levels were consistently lower with CalGo®, though differences were not statistically significant.
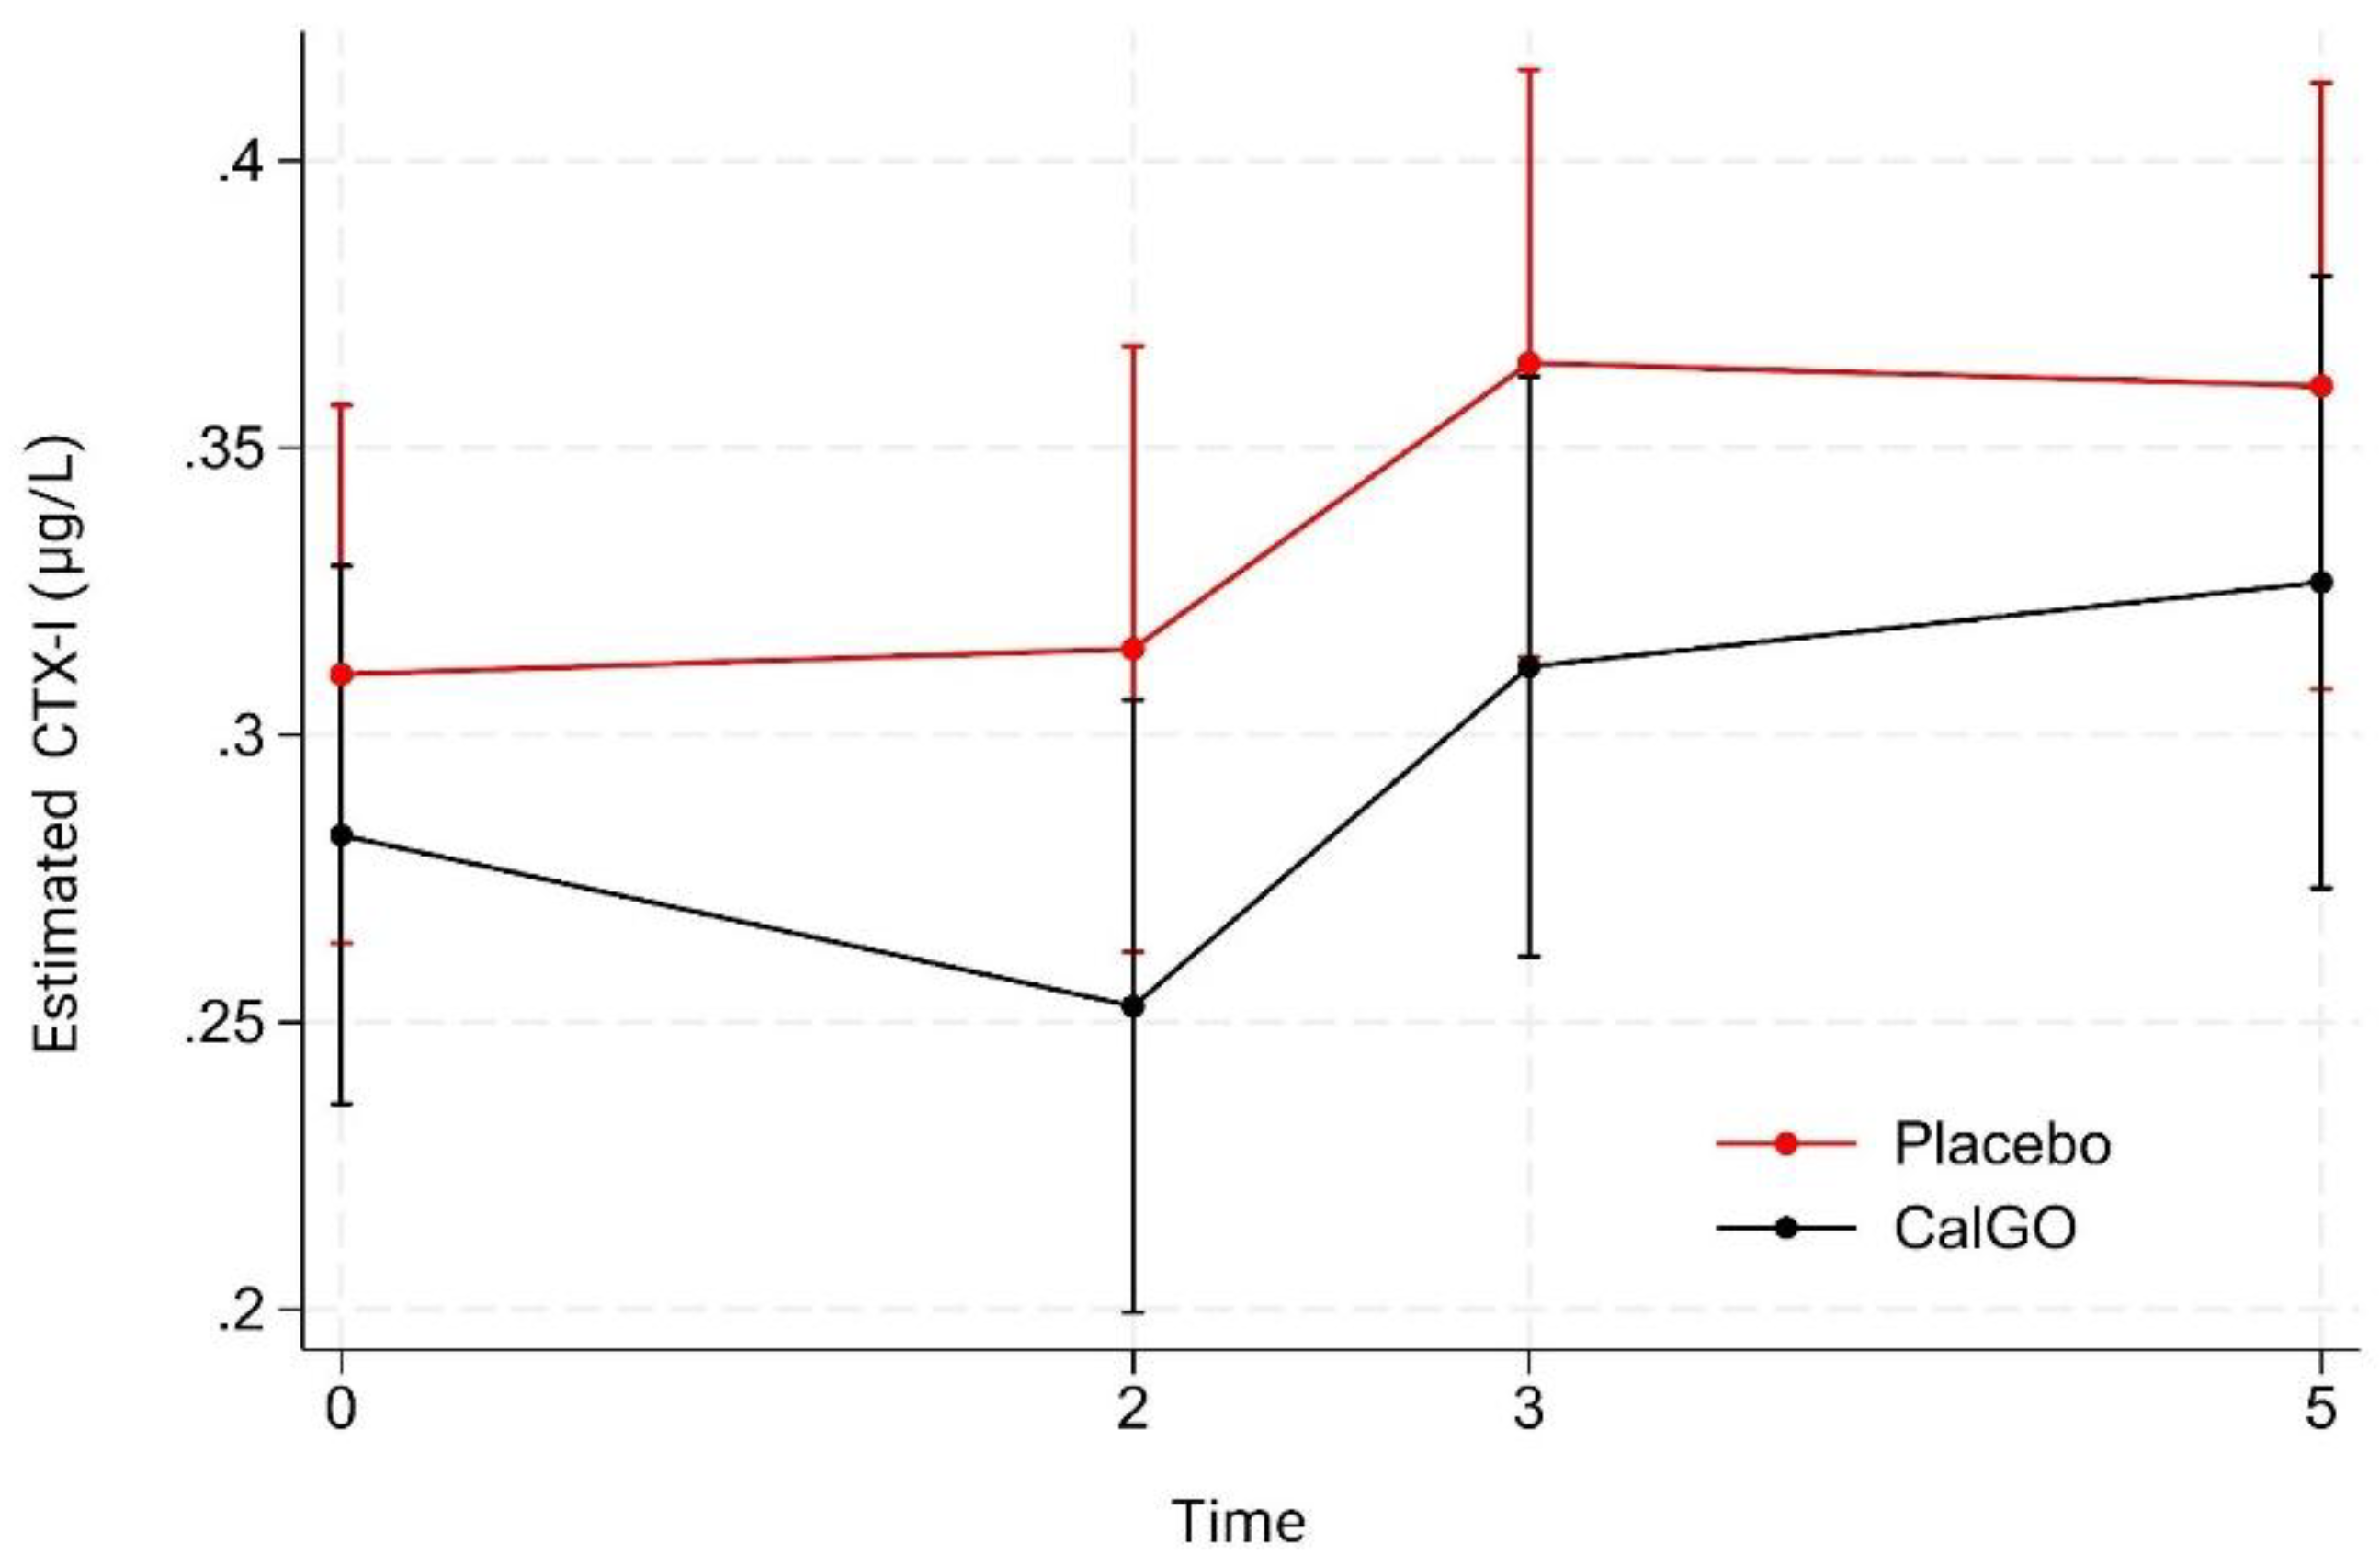
Table 1.
Baseline characteristics of participants who completed the study in the CalGo® (n = 29) and placebo (n = 30) groups. Values are mean (± SD) unless otherwise indicated. Primary analyses were conducted on these available cases, as a strict intention-to-treat approach was not feasible due to missing follow-up data.
| Measure | Overall (n = 59) | CalGo® (n = 29) | Placebo (n = 30) | Reference Range |
|---|---|---|---|---|
| Demographics | ||||
| Age (years) | 61.54 (± 6.72) | 62.62 (±7.06) | 60.50 (±6.13) | — |
| Weight (kg) | 68.92 (± 10.68) | 69.10 (± 10.91) | 68.73 (± 10.64) | — |
| Height (m) | 1.66 (± 0.054) | 1.66 (± 0.063) | 1.67 (± 0.044) | — |
| Body-mass index (kg/m²)§ | 24.93 (± 3.81) | 25.08 kg m⁻² (± 3.88) | 24.79 kg m⁻² (± 3.80) | Normal: 18.5-24.9 |
| Vital Signs§ | ||||
| Heart Rate (bpm) | 70.36 (± 10.09) | 70.41 (± 11.97) | 70.30 (± 8.08) | Normal: 60–100 |
| Systolic BP (mmHg) | 131.46 (± 20.89) | 130.79 (± 16.79) | 132.10 (± 24.49) | Normotensive: 90-120 |
| Diastolic BP (mmHg) | 80.56 (± 11.41) | 79.79 (± 10.34) | 81.30 (± 12.49) | Normotensive: 60-80 |
| Bone Mineral Density | ||||
| Femoral Neck BMD (g/cm²) | 0.74 (± 0.056) | 0.74 (± 0.065) | 0.75 (± 0.047) | — |
| Femoral Neck T-score (SD) | -1.70 (± 0.42) | -1.73 (± 0.48) | -1.67 (±0.37) | Normal: ≥–1.0; Osteopenia: –1.0 to –2.5; Osteoporosis: ≤–2.5 |
| Lumbar Spine BMD (g/cm²) | 0.91 (± 0.11) | 0.93 (± 0.12) | 0.88 (± 0.099) | — |
| Lumbar Spine T-score (SD)* | -1.55 (± 0.97) | -1.32 (± 1.05) | -1.77 (± 0.85) | Normal: ≥–1.0; Osteopenia: –1.0 to –2.5; Osteoporosis: ≤–2.5 |
| Bone Turnover Markers | ||||
| P1NP (µg/L) | 51.46 (± 19.69) | 48.02 (± 16.96) | 54.78 (± 21.78) | Women postmenopausal (HRT): 14.3–58.9; No HRT: 20.3–76.3 µg/L‡ |
| β-CTX-I (µg/L) | 0.28 (± 0.12) | 0.26 (± 0.11) | 0.30 (±0.13) | Women postmenopausal: 0.18–1.02‡ |
| Biochemistry† | ||||
| Serum Calcium (mmol/L) | 2.38 (± 0.090) | 2.40 (± 0.10) | 2.36 (± 0.072) | 2.15–2.51 |
| Serum Phosphate (mmol/L) | 1.16 (± 0.18) | 1.10 (± 0.15) | 1.22 (±0.18) | 0.75–1.65 |
| 25(OH)D (nmol/L) | 78.58 (± 27.05) | 83.62 (± 30.93) | 73.70 (± 23.53) | 39–50 |
Values are presented as mean ± SD. † Reference ranges from Helse Møre og Romsdal HF, Klinikk for Diagnostikk, Ålesund. ‡ P1NP and β-CTX-I reference ranges from SYNLAB (electrochemiluminescence method). § Reference ranges for BMI, heart rate, and blood pressure are based on World Health Organization (WHO) and American Heart Association (AHA) guidelines. * Lumbar spine BMD and T-score refer to the L1–L4 region measured by dual-energy X-ray absorptiometry (DXA).
Table 4.
Lumbar Spine BMD: Baseline, 24-Month Values, and Within-Group Change.
| Group | Baseline BMD (g/cm²) | 12-Month BMD (g/cm²) | 24-Month BMD (g/cm²) | Mean Change (g/cm², 95% CI) | % Change1 |
|---|---|---|---|---|---|
| CalGo® | 0.93 ± 0.13 | 0.92 ± 0.13 | 0.93 ± 0.13 | –0.0051 (–0.0240 to +0.0138) | –0.4% |
| Placebo | 0.88 ± 0.11 | 0.86 ± 0.10 | 0.85 ± 0.096 | –0.0282 (–0.0468 to –0.0096) | –3.4% |
Values are mean ± SD unless otherwise indicated. 1% Change represents relative within-group change from baseline.
Table 5.
Between-Group Differences in Femoral Neck BMD at 24 Months.
| Model | Difference (g/cm²) | 95% CI | p-value | Relative effect2 |
|---|---|---|---|---|
| Unadjusted | +0.023 | –0.003 to +0.050 | 0.086 | – |
| Adjusted1 | +0.026 | –0.001 to +0.054 | 0.058 | +3.0% |
1Adjusted for baseline femoral neck BMD. 2Relative effect = adjusted between-group difference expressed as a percentage of baseline mean BMD.
Table 6.
Responder Analyses (≥1% Increase in BMD from Baseline to 24 Months).
| Site | Odds Ratio (95% CI) | p-value (OR) |
|---|---|---|
| Femoral Neck | 1.89 (0.57–6.29) | 0.298 |
| Lumbar Spine | 3.61 (1.04–12.6) | 0.043 |
| Distal Radius | 0.98 (0.29–3.37) | 0.980 |
Responder defined as ≥1% site-specific BMD increase at 24 months. Values derived from logistic regression (odds ratios). Models adjusted for baseline BMD and age.
Table 7.
Distal Radius BMD: Baseline, 24-Month Values, and Within-Group Change.
| Group | Baseline BMD (g/cm²) | 12-Month BMD (g/cm²) | 24-Month BMD (g/cm²) | Mean Change (g/cm², 95% CI) | % Change1 |
|---|---|---|---|---|---|
| CalGo® | 0.66 ± 0.13 | 0.66 ± 0.12 | 0.66 ± 0.13 | +0.0049 (–0.0233 to +0.0332) | +0.4% |
| Placebo | 0.65 ± 0.11 | 0.67 ± 0.090 | 0.66 ± 0.088 | –0.0049 (–0.0326 to +0.0229) | –0.4% |
Values are mean ± SD unless otherwise indicated. 1% Change represents relative within-group change from baseline.
Table 8.
Between-Group Differences in Distal Radius BMD at 24 Months.
| Model | Difference (g/cm²) | 95% CI | p-value | Relative effect2 |
|---|---|---|---|---|
| Unadjusted | +0.0098 | –0.030 to +0.049 | 0.623 | – |
| Adjusted1 | +0.0058 | –0.028 to +0.040 | 0.735 | +0.9% |
1Adjusted for baseline femoral neck BMD. 2Relative effect = adjusted between-group difference expressed as a percentage of baseline mean BMD.
Table 9.
Summary of Adverse Events by Treatment Group.
| Category | Placebo (n=20) | CalGo® (n=12) | Total (N=32) |
|---|---|---|---|
| Any adverse event (AE) | 15 (75.0%) | 6 (50.0%) | 21 (65.6%) |
| Fractures | 3 (15.0%) | 5 (41.7%) | 8 (25.0%) |
| Serious adverse events (SAE) | 2 (10.0%) | 1 (8.3%) | 3 (9.4%) |
| Most common AEs1 | |||
| – Dyspepsia | 2 (9.1%) | 1 (8.3%) | 3 (8.8%) |
| – Constipation | 1 (4.5%) | 1 (8.3%) | 2 (5.9%) |
| – Diarrhea | 2 (9.1%) | 0 | 2 (5.9%) |
| – Nausea | 2 (9.1%) | 0 | 2 (5.9%) |
| – Any cardiac event | 2 (9.1%) | 0 | 2 (5.9%) |
| Causality (AE, investigator-judged) | |||
| – Possible / likely | 4 (20.0%) | 5 (41.7%) | – |
| – Unlikely / not related | 14 (70.0%) | 6 (50.0%) | – |
| Intensity of AE | |||
| – Mild | 10 (50.0%) | 7 (58.3%) | – |
| – Moderate | 8 (40.0%) | 4 (33.3%) | – |
| Outcome of AE | |||
| Resolved | 17 (85.0%) | 11 (91.7%) | – |
Fractures included rib (n=4), . upper extremity (n=3), and toe (n=1). Serious adverse events were atrial fibrillation (placebo), ischemic cerebrovascular event (CalGo®), and bacterial skin infection (placebo).
Disclaimer/Publisher’s Note: The statements, opinions and data contained in all publications are solely those of the individual author(s) and contributor(s) and not of MDPI and/or the editor(s). MDPI and/or the editor(s) disclaim responsibility for any injury to people or property resulting from any ideas, methods, instructions or products referred to in the content. |
© 2025 by the authors. Licensee MDPI, Basel, Switzerland. This article is an open access article distributed under the terms and conditions of the Creative Commons Attribution (CC BY) license (http://creativecommons.org/licenses/by/4.0/).
Copyright: This open access article is published under a Creative Commons CC BY 4.0 license, which permit the free download, distribution, and reuse, provided that the author and preprint are cited in any reuse.


