1. Introduction
1.1. Clinical Background
Pneumothorax (PTX) is a life-threatening condition characterized by the accumulation of air in the pleural space, causing partial or complete lung collapse. Rapid and accurate diagnosis of PTX is critical to prevent respiratory or circulatory collapse [
1]. Traditionally, chest X-ray (CXR) has been the first-line imaging modality for suspected PTX, while computed tomography (CT) serves as the diagnostic gold standard [
2]. However, CXR has relatively low sensitivity for PTX, especially in occult cases or when patients are supine, often missing a significant proportion of pneumothoraces [
3]. CT scans can detect even small PTXs, but they are time-consuming, costly, and expose patients to ionizing radiation [
4]. In contrast, lung ultrasound (LUS) has emerged as a rapid, repeatable, and radiation-free alternative for PTX diagnosis, particularly in emergency and critical care settings [
5]. A large body of evidence indicates that LUS is more sensitive than chest radiography for detecting pneumothorax, while maintaining high specificity [
6]. Meta-analyses report that bedside ultrasound can achieve sensitivity as high as 86–90% and specificity 98–99% for PTX, outperforming standard chest X-rays in accuracy [
7]. Accordingly, point-of-care ultrasound has become a key component of trauma protocols (e.g., the Extended Focused Assessment with Sonography for Trauma, E-FAST) and critical care algorithms for prompt PTX identification and management [
8].
Despite its proven diagnostic performance, lung ultrasound’s effectiveness heavily depends on operator skill and experience. Proper image acquisition and interpretation require training in recognizing sonographic signs of PTX, such as the absence of lung sliding (often seen as the “barcode sign” on M-mode) and the absence of B-lines or lung pulse [
9]. Expert sonographers can identify pneumothorax with a high degree of confidence, but ultrasound is highly operator-dependent, and its accuracy may drop in the hands of less experienced clinicians. This operator variability has traditionally impeded the widespread adoption of LUS for PTX in some settings, particularly prehospital and resource-limited environments where skilled ultrasonographers are not readily available. Surveys of critical care providers have highlighted practical barriers to mastering lung ultrasound, including steep learning curves and subjective interpretation differences [
10]. There is a clear need for solutions that can support less-experienced users and standardize pneumothorax detection on ultrasound, thereby extending the benefits of LUS to a broader range of clinical scenarios (e.g. ambulance services, rural clinics, and battlefield triage).
Recent advances in artificial intelligence (AI) offer a promising avenue to address these challenges. In particular, deep learning – a family of machine learning techniques capable of automatic feature extraction from images – has revolutionized medical image analysis [
11]. Convolutional neural networks (CNN) and related models can learn to recognize complex patterns given sufficient training data, and have already shown remarkable success in interpreting chest radiographs and CT scans [12, 13]. Applying AI to lung ultrasound is a logical next step to mitigate operator dependence: an AI-driven system could automatically identify sonographic signs of PTX (such as the loss of pleural motion) and alert providers in real time [
14]. In theory, this could enable even novice ultrasound operators to achieve diagnostic accuracy approaching that of seasoned experts. However, developing robust AI for LUS interpretation poses unique difficulties. Ultrasound images are more operator-variably and artifact-laden than X-ray/CT images, and large public datasets for lung ultrasound have historically been lacking [
15]. The limited availability of labelled ultrasound data and the complexity of dynamic ultrasound artifacts (e.g. movement of pleura) have been significant barriers to training conventional neural networks for this task [
16]. Nevertheless, in the past few years there has been a growing research effort exploring AI solutions specifically for pneumothorax detection using ultrasound, with encouraging results across a spectrum of experimental and clinical studies [17, 18].
In this context, the present study builds upon this growing body of work to address the need for accurate and standardized pneumothorax detection in diverse clinical environments. We developed and evaluated two transformer based deep learning architectures for the analysis of point-of-care lung ultrasound images acquired in emergency and intensive care settings. By leveraging these state-of-the-art AI techniques, our goal is to enhance diagnostic accuracy, reduce operator dependency, and facilitate wider adoption of lung ultrasound in real-world clinical practice.
1.2. State of the Art in AI-Assisted Pneumothorax Diagnosis with Ultrasound
1.2.1. Early Feasibility Studies (Animal and Phantom Models)
In the literature, early proof-of-concept studies demonstrated the feasibility of automated pneumothorax recognition on ultrasound images. Summers
et al. (2016) developed a rule-based computerized diagnostic assistant that analysed B-mode clips for pleural sliding and M-mode images for the “seashore sign” [
19]. In a pilot evaluation on archived trauma scans, their algorithm achieved 79% sensitivity and 87% specificity for PTX when compared to an expert panel, and notably 100% sensitivity on a subset of high-quality. This early work proved that key sonographic features of pneumothorax could be detected algorithmically. Building on that foundation, Summers
et al. (2017) introduced the “iFAST” (intelligent FAST) ultrasound algorithm using a controlled porcine model of pneumothorax. In that study, ultrasound videos were collected from ventilated pigs with incrementally introduced PTXs [
20]. The iFAST system demonstrated extremely high performance, detecting pneumothorax with 98% sensitivity and 95% specificity on M-mode ultrasound images in the animal model. Even on raw B-mode video clips (which are more challenging due to respiratory motion and noise), the algorithm reached about 86% sensitivity and 85% specificity. These results were among the first to show that a computer algorithm could rival human-level interpretation of ultrasound for pneumothorax in a controlled setting. Subsequent experiments applied modern deep learning to the same dataset: Lindsey
et al. (2019) trained deep CNN models (e.g. VGG16, VGG19, ResNet50) on the pig ultrasound data and reported near-perfect classification of pneumothorax images [
21]. Their best model improved B-mode video analysis to 97–99% sensitivity/specificity, substantially higher than the original iFAST outcomes. However, it was noted that some of this impressive performance might be due to overlap between training and test data (frames from the same animal appearing in both sets), which could inflate accuracy estimates. In parallel, other groups explored complementary AI approaches. Kulhare
et al. (2018) designed a deep learning pipeline to detect various lung pathologies on ultrasound; for pneumothorax, they used an InceptionV3 CNN to classify simulated M-mode images and achieved about 93% sensitivity and specificity on a test set of 35 ultrasound videos [
22]. Mehanian
et al. (2019) developed a suite of AI methods (including M-mode analysis, feature fusion, and Long-Short Term Memory for temporal modelling) to recognize absent lung sliding, using ultrasound data from four pigs [
23]. Their best-performing classifier had a mean sensitivity of 78–84% and specificity 82–87% for pneumothorax detection in a rigorous four-fold cross-validation (leaving one animal out for each fold). These studies collectively established a proof of concept that AI algorithms can automatically identify the ultrasonographic signatures of pneumothorax in both still images and dynamic clips.
1.2.2. Deep Learning on Simulated and Augmented Data
A consistent challenge in developing deep learning models for LUS has been the scarcity of large, annotated datasets. To address this challenge, researchers have turned to creative solutions such as simulation and data augmentation. Boice
et al. (2022) pioneered the use of synthetic ultrasound phantoms to generate training data for pneumothorax AI [
4]. They constructed a realistic tissue phantom with a pleural-air interface and simulated rib cage, which produces ultrasound images mimicking real lung scans with and without PTX. Using this phantom, they trained a deep classification network and then tested it on actual pig ultrasound images. Notably, a model trained solely on synthetic data successfully identified pneumothorax in swine scans acquired in vivo, achieving an accuracy of about 82%. Furthermore, by enriching the training set with augmented images (varying brightness, contrast, etc.), they improved the test accuracy to 93.6%, nearly on par with models trained on real data. This study highlighted the value of affordable, reproducible ultrasound phantoms for generating the large volumes of labeled data that deep learning requires, thereby circumventing the need for labor-intensive animal experiments or clinical image collection. The use of phantoms and synthetic data has opened the door for more robust and generalizable AI models in ultrasound by providing an unlimited supply of training examples, while also underscoring the importance of careful validation on real-world scans.
1.2.3. Clinical Data-Based AI Models
As the field matures, recent investigations have shifted focus toward clinical ultrasound data and real-time implementation. Jascur
et al. (2021) published one of the first deep learning studies on
human lung ultrasound videos for pneumothorax. They developed a model to automatically recognize the absence of lung sliding – a critical sign of PTX – in B-mode ultrasound clips [
11]. Their algorithm, based on a ResNet-18 CNN analyzing temporal sequences, detected absent sliding with a balanced accuracy of 89% (82% sensitivity, 92% specificity) in post-thoracic surgery patients. The authors demonstrated that AI was capable of interpreting pleural movement in real patient scans, rather than being limited to static images or animal data. Another notable study by VanBerlo
et al. (2022) took a large-scale data approach: they aggregated lung ultrasound exams from two academic centers and trained a deep model to assess the presence of the lung-sliding artifact [
17]. By converting B-mode videos into M-mode-like slices and feeding these into a custom CNN, their system achieved 93.5% sensitivity and 87.3% specificity for detecting lung sliding (corresponding to PTX detection when sliding is absent), with an area under the receiver operating characteristic (ROC) curve (AUC) of 0.973. This high accuracy was maintained on an external validation set, indicating good generalizability. Importantly, VanBerlo
et al. also emphasized model interpretability, as their algorithm provided visual overlays to show where pleural motion was detected or not. Around the same time, Kim
et al. (2023) described a stepwise AI-assisted ultrasound framework for PTX diagnosis, explicitly mirroring the workflow of experienced clinicians [
8]. In their approach, one neural network first identifies and zooms in on the pleural line in the ultrasound image (quality assurance and pleural localization), and a second network then classifies lung sliding vs. no-sliding using M-mode data. They implemented this pipeline on a lightweight EfficientNet model to allow real-time inference on portable devices. The results were promising: both the pleural line detection and lung sliding classification achieved AUCs >95%, and the integrated end-to-end system attained an overall AUC of 0.89 for diagnosing pneumothorax in a retrospective test set. This stepwise strategy provides an
intelligible decision process (finding pleura → checking sliding) that may be easier for clinicians to trust and follow. Most recently, Qiang
et al. (2025) introduced a video comprehension model for lung ultrasound, leveraging a Temporal Shift Module (TSM) network to fuse spatial and temporal features across entire ultrasound clips [
18]. In what they described as a “multi-feature fusion” approach, their deep learning model considers not only lung sliding but also other sonographic indicators (e.g. comet-tail artifact changes) to emulate how a human expert diagnoses PTX from video. Tested on a sizeable dataset of 164 lung ultrasound videos, their method achieved an average accuracy of 96.9%, with 99.2% sensitivity and 89.2% specificity for pneumothorax identification. This represents one of the highest-performing AI systems for PTX to date, and notably it approaches the ideal of analysing ultrasound
videos in their entirety (as opposed to single frames or single sweeps), much like a clinician observing motion in real-time.
1.2.4. Prospective and Comparative Validation Studies
Beyond algorithm development, investigators have begun reporting prospective and comparative studies to evaluate how AI performs against human clinicians. Clausdorff Fiedler
et al. (2024) conducted a prospective diagnostic accuracy study of an AI system for real-time lung sliding detection during trauma ultrasounds [
24]. In a cohort of emergency patients, the AI model was able to detect the absence of lung sliding with high sensitivity (on the order of 90–100%) but only moderate specificity, due to some false positives in cases with poor image quality or equivocal sliding. This mirrors the classic trade-off in pneumothorax diagnosis: maximizing sensitivity (to avoid missed PTXs) can come at the expense of more false alarms, an issue that AI will need to balance with clinical input. Another recent study by Yang
et al. (2024) compared an AI-assisted LUS diagnostic protocol to the standard radiology work-up for pneumothorax in a hospital setting [
25]. The AI-assisted lung ultrasound showed 79.4% sensitivity and 85.4% specificity for pneumothorax, which was on par with the accuracy of the attending radiologists’ assessments using CXR and CT. This suggests that an intelligent ultrasound system could potentially serve as an effective triage or screening tool, flagging pneumothoraces at the bedside with performance approaching that of formal imaging studies. It is worth noting, however, that certain clinical scenarios remain challenging – for instance, differentiating true lung sliding absence due to PTX vs. due to extensive adhesions or mainstem intubation. Advanced algorithms are being trained to recognize these nuances (such as identifying the lung point or lung pulse sign to confirm a pneumothorax) to reduce false positives [
11]. Overall, the trend in current research is moving from controlled experiments to real-world validation, ensuring that AI tools maintain high accuracy in diverse patient populations and imaging conditions.
In addition to pneumothorax detection, AI is making inroads in analyzing other lung ultrasound findings, further underscoring its versatility. For example, a recent study evaluated an AI tool for automatically detecting and counting A-lines and B-lines on lung ultrasound – artifacts that are key to assessing pulmonary edema, fibrosis, or COVID-19 pneumonia severity [
15]. ExoLungAI demonstrated 91% sensitivity and 81% specificity in identifying normal A-lines, and 84% sensitivity and 86% specificity in detecting pathologic B-lines, showing strong concordance with expert counts of B-line numbers. This automated quantification of B-lines provides rapid, objective monitoring of interstitial syndrome, illustrating how AI can enhance ultrasound-based diagnosis across a range of respiratory conditions. These advancements in artifact detection are highly relevant to pneumothorax as well – for instance, confirming the absence of B-lines over an area of interest is part of the ultrasound criteria for PTX (since B-lines are abolished when the pleural layers separate). AI’s ability to reliably recognize such signs can thus reinforce pneumothorax decision-making. By improving the objectivity, consistency, and speed of ultrasound interpretation, AI tools have the potential to transform lung ultrasound into an even more powerful diagnostic modality. Clinicians ranging from emergency physicians and intensivists to aeromedical crews and telemedicine providers could someday rely on AI-augmented ultrasound devices to rapidly rule in or rule out pneumothorax at the point of care, even without extensive sonography training.
Overall, the integration of artificial intelligence with lung ultrasound represents a promising convergence of technologies for improving pneumothorax diagnosis. Ultrasound-based AI models have progressed from initial feasibility studies in animals to sophisticated algorithms approaching expert-level performance in clinical settings. The literature spans a broad spectrum – including algorithmic analyses of lung sliding, deep learning classifiers trained on simulated and real ultrasound data, and prototype systems validated on patients – collectively demonstrating the viability of AI-assisted pneumothorax detection on ultrasound. At the same time, these studies highlight ongoing challenges such as limited public datasets, inter-patient variability, and the need for prospective validation. Further research is warranted to refine the robustness of AI models (e.g. making them more explainable and resistant to image noise), and to evaluate their impact on clinical decision-making and patient outcomes. Ultimately, by reducing operator dependence and standardizing interpretation, reliable AI could enable lung ultrasound to be used more widely and effectively for pneumothorax screening – from busy emergency departments to remote or austere environments where expert sonographers are unavailable.
2. Material and Methods
2.1. Study Design and Participants
This single-center observational study was conducted between June 2025 and August 2025 after obtaining ethics committee approval (Approval No. 2024-KAEK-64). Written informed consent was obtained from all participants, and the study was carried out in accordance with the Declaration of Helsinki. While lung ultrasound (LUS) data were acquired in real time during the study period, the subsequent evaluation was conducted retrospectively. Inclusion criteria were: adult patients (age ≥ 18 years) who had either a pneumothorax confirmed by chest computed tomography (CT) or no evidence of pneumothorax on CT (healthy controls), with corresponding ultrasound images available for analysis. All included subjects had a diagnostic chest CT performed within 24 hours prior to the ultrasound examination to serve as the reference standard for pneumothorax. Exclusion criteria included any cases lacking recorded ultrasound images or with non-diagnostic image quality, as well as patients who had received a pleural intervention (e.g. chest tube placement or needle decompression) before the ultrasound exam (to avoid confounding the ultrasound findings)
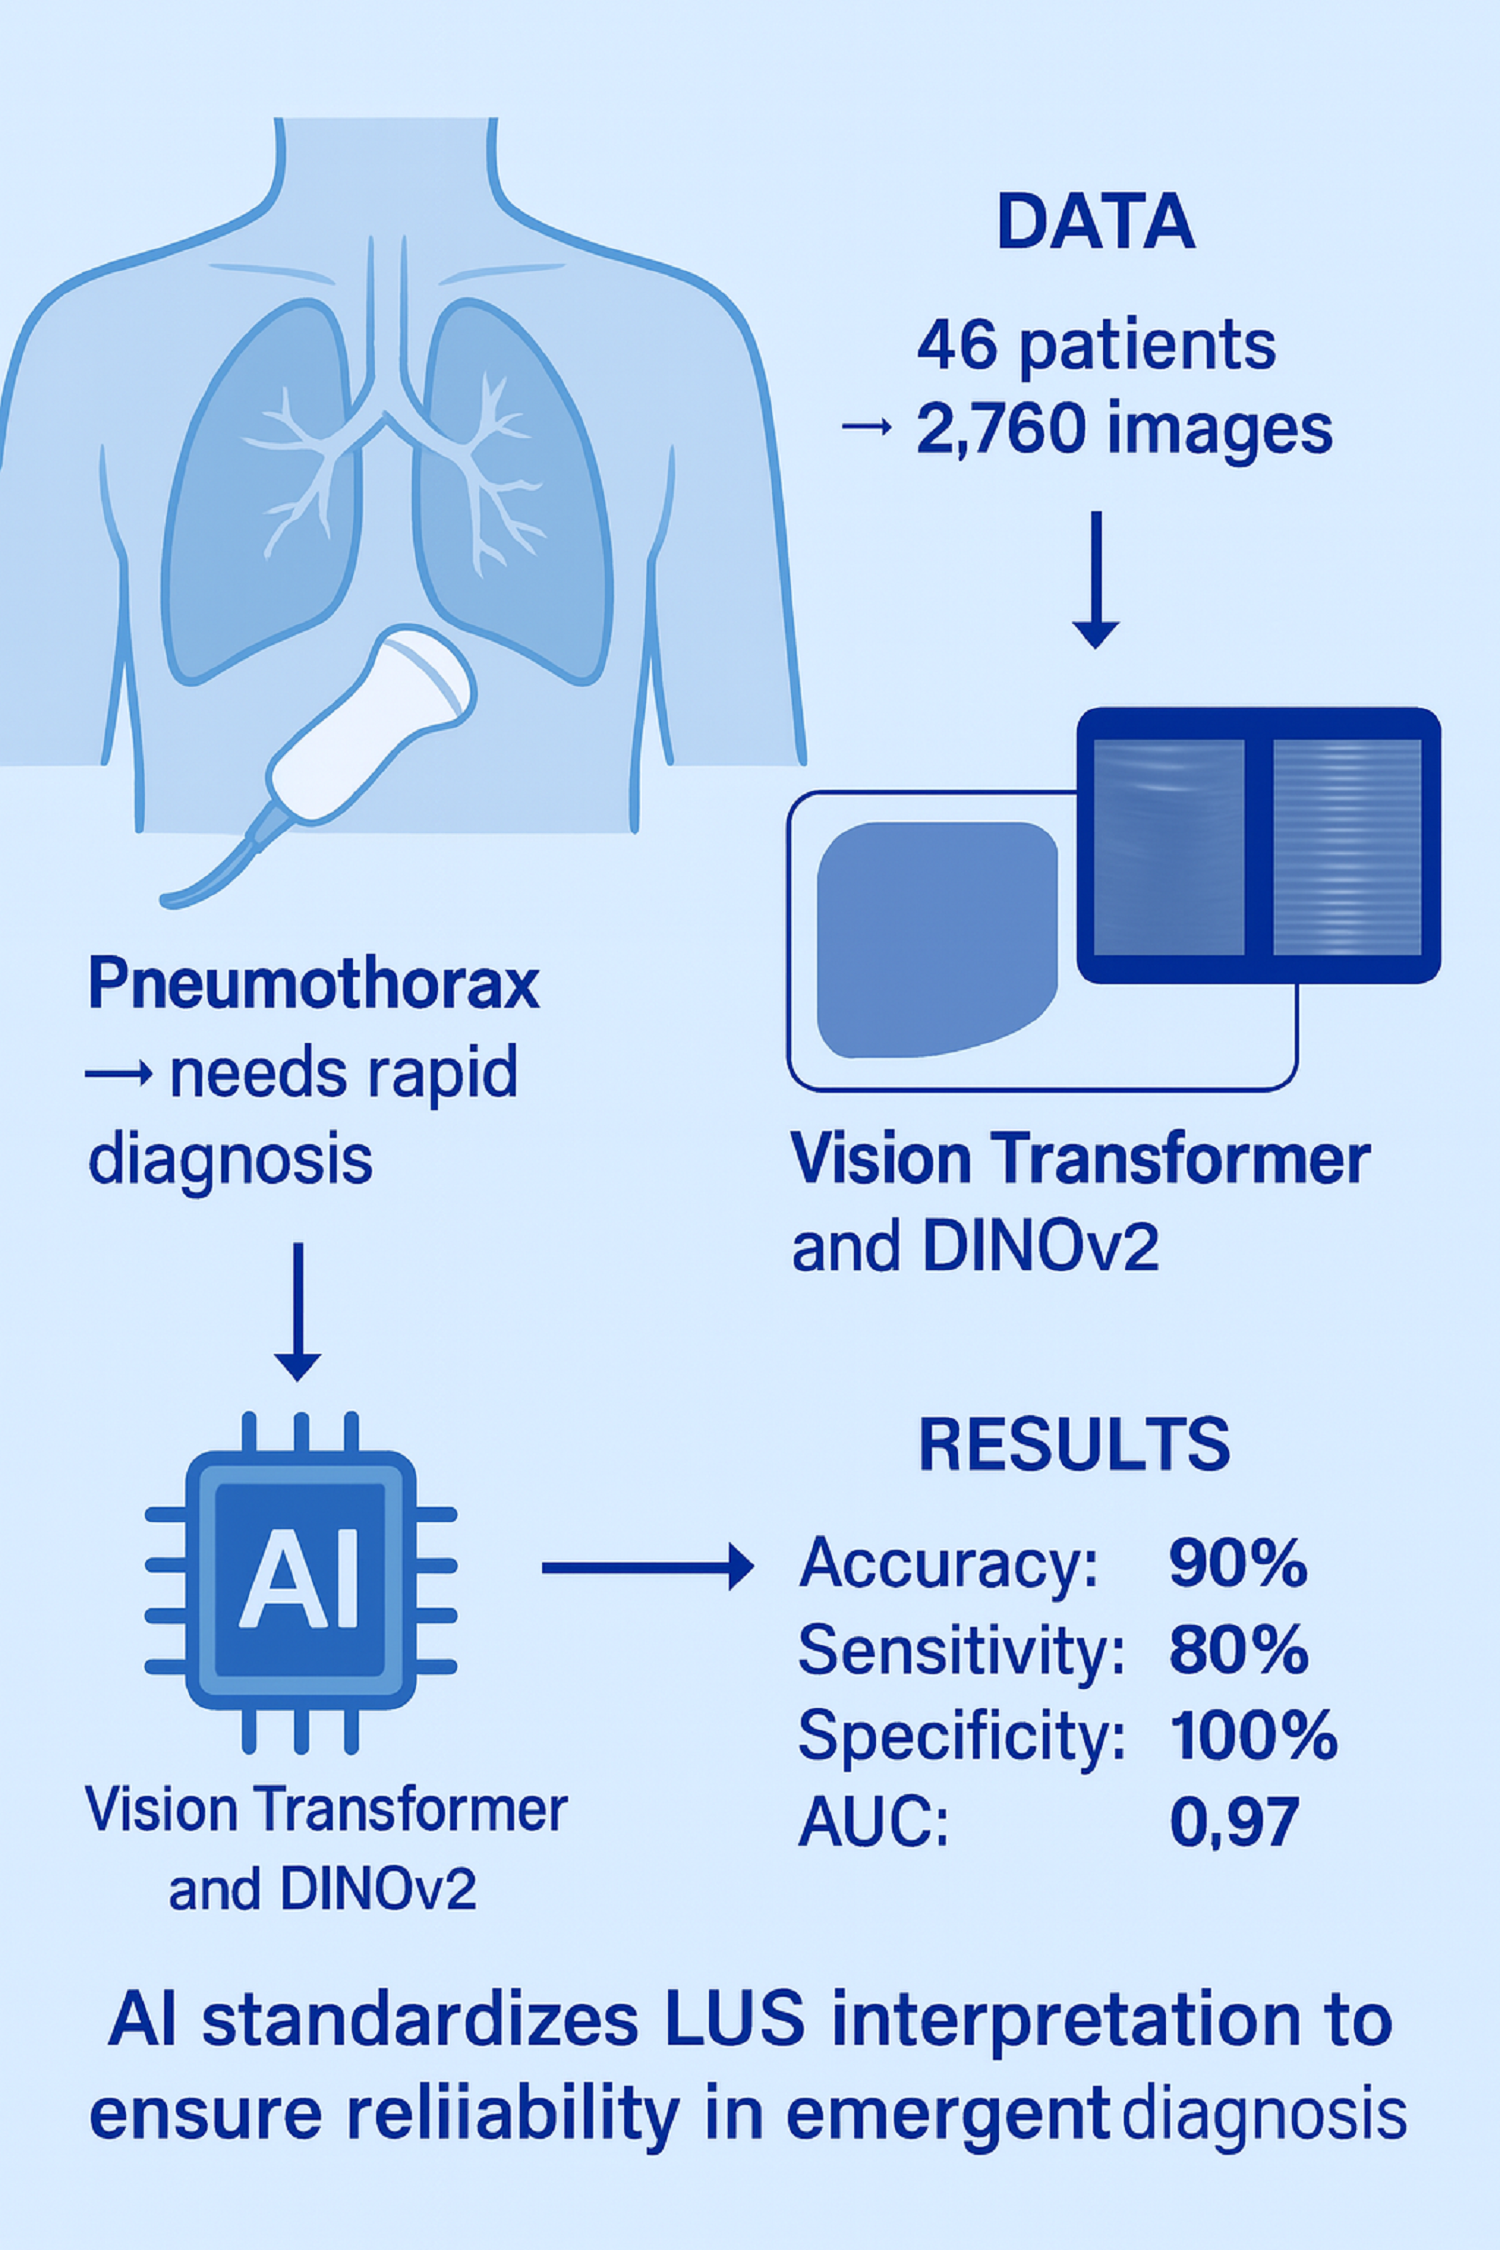
A total of 46 participants were included, comprising 23 patients with pneumothorax and 23 healthy controls. The median age was 59 years (Q1–Q3: 41–65.5) in the pneumothorax group and 55 years (Q1–Q3: 41–65.5) in the healthy group, with no significant difference (p = 0.964). The proportion of males was identical in both groups (78.3%, p = 1.000). Median BMI was 23.0 (Q1–Q3: 20.5–25.5) in the pneumothorax group and 22.0 (Q1–Q3: 21.0–27.0) in the healthy group (p = 0.658). The distribution of right-sided involvement was similar between groups (52.2% vs. 56.5%, p = 0.767). Smoking prevalence was 65.2% in the pneumothorax group and 69.6% in the healthy group (p = 0.753). The presence of chronic obstructive pulmonary disease (COPD) was observed in 34.8% of both groups (p = 1.000). No statistically significant differences were found for any demographic or clinical variable between the groups (
Table 1). In the pneumothorax group (n=23), the most common etiology was trauma-related pneumothorax (39.1%), followed by secondary spontaneous pneumothorax (SSP) (34.8%) and primary spontaneous pneumothorax (PSP) (26.1%). For image analysis, 60 ultrasound images (combined B-mode and M-mode) were obtained from each participant, resulting in a total of 2,760 images included in the study dataset.
2.2. Lung Ultrasound Acquisition Protocol
All LUS examinations were performed at the bedside by a single experienced thoracic surgery specialist, using a wireless handheld ultrasound device (Clarius, Canada) set to the manufacturer’s “Lung” preset mode. To standardize image acquisition, the ultrasounds were focused on the lateral chest wall in the “triangle of safety” region – the area commonly used for chest drain insertion (bounded by the lateral border of pectoralis major, the lateral border of latissimus dorsi, and a line at roughly the level of the nipple or 4th–5th intercostal space). Scanning in this region ensured consistent views of the pleural interface for all subjects. In patients with pneumothorax, this approach also facilitated procedural guidance: the ultrasound probe was used to mark an optimal site, and subsequently a pleural decompression (needle thoracostomy or chest tube) was performed at the same location as needed. The success of air aspiration at the ultrasound-marked site provided additional confirmation that a pneumothorax was indeed present in that area (corroborating the CT findings). In the control subjects (no PTX on CT), an identical scanning technique and location were employed for consistency, although no intervention was performed after imaging. For each exam, ultrasound clips and images were recorded and saved in the system for later analysis. During LUS, typical sonographic signs were noted (e.g. lung sliding or its absence, B-lines, etc.), but final determination of pneumothorax for study purposes was based on the reference standard CT results rather than real-time ultrasound interpretation alone.
2.3. Reference Standard and Data Collection
Chest CT was considered the gold standard for diagnosing pneumothorax in this study. All CT scans were interpreted by radiologists as part of routine clinical care, and each case was classified as either “Pneumothorax” or “No Pneumothorax.” These CT findings were used to label the corresponding lung ultrasound (LUS) data, thereby assigning each examination a ground-truth outcome. Notably, CT and ultrasound were performed within a 24-hour window, with no therapeutic interventions performed in between, ensuring that the lung condition at the time of LUS corresponded to the CT diagnosis. The first stage of the study involved data collection and labeling in collaboration with Kastamonu University Training and Research Hospital, where a standardized lung ultrasound acquisition protocol was implemented. Each patient record consisted of a 10-second ultrasound video, from which 60 frames were extracted, resulting in a total of 2,760 images across all subjects. For subsequent machine learning analysis, a key challenge was that the background regions of the images were disproportionately large compared to the areas of diagnostic interest, which could negatively affect model performance. To address this challenge, the original images were pre-processed to isolate upper and lower regions of interest. Separate datasets were generated for each region, with the number of images remaining identical to the original dataset. Throughout the manuscript, the cropped bottom region is denoted as M (M-mode, motion mode) and the cropped top region as B (B-mode, brightness mode).
Figure 1 illustrates four representative examples, with two images from the B region and two from the M region.
2.4. Visual Characteristics of Pneumothorax Images
Lung ultrasound images obtained from pneumothorax patients differ markedly from those of healthy lungs. In normal lungs, B-mode imaging demonstrates the pleural line with dynamic artifacts such as lung sliding and vertical reverberations known as B-lines, while M-mode reveals the characteristic “seashore sign,” reflecting normal pleural motion. In contrast, pneumothorax images typically lack lung sliding and B-lines; instead, the pleural line appears static, and M-mode displays the “barcode sign,” which is diagnostic of absent pleural movement. These visual distinctions form the basis of both clinical interpretation and AI-assisted classification. Representative examples of pneumothorax cases in B-mode and M-mode are illustrated in
Figure 1.
2.5. Statistical Analysis
Statistical analyses were performed using IBM SPSS Statistics, version 23 (IBM Corp., Armonk, NY, USA). Continuous variables (age and BMI) were expressed as median and interquartile range (Q1–Q3) and compared between groups using the Mann–Whitney U test due to non-normal distribution. Categorical variables were presented as counts and percentages, and between-group comparisons were performed using Pearson’s chi-square test without continuity correction. A two-tailed p-value < 0.05 was considered statistically significant.
2.6. Transformers
Transformers employ self-attention mechanisms to emphasize the most relevant elements of input sequences, making them highly efficient across a wide range of tasks. Transformer-based models can also be enhanced through knowledge distillation, whereby information from a larger pretrained teacher model is transferred to a more compact student model, enabling faster training without compromising accuracy. Vision Transformers, in particular, have gained prominence due to their strong capability in processing visual inputs [
26]. Recent studies have highlighted their successful application in medical imaging tasks, including radiology, pathology, and lung ultrasound, where they demonstrate superior performance compared with conventional convolutional neural networks [26, 27]. Building on this evidence, we applied transformer-based architectures to lung ultrasound images in order to evaluate their diagnostic utility for pneumothorax detection.
2.6.1. Vision Transformer
The Vision Transformer (ViT) is a modern deep learning framework tailored for visual recognition applications. It marks a significant innovation by adapting transformer architectures—originally created for natural language processing—to the domain of computer vision [
28]. By applying the transformer mechanism to images, ViT is able to capture both local and global contextual relationships within visual data [
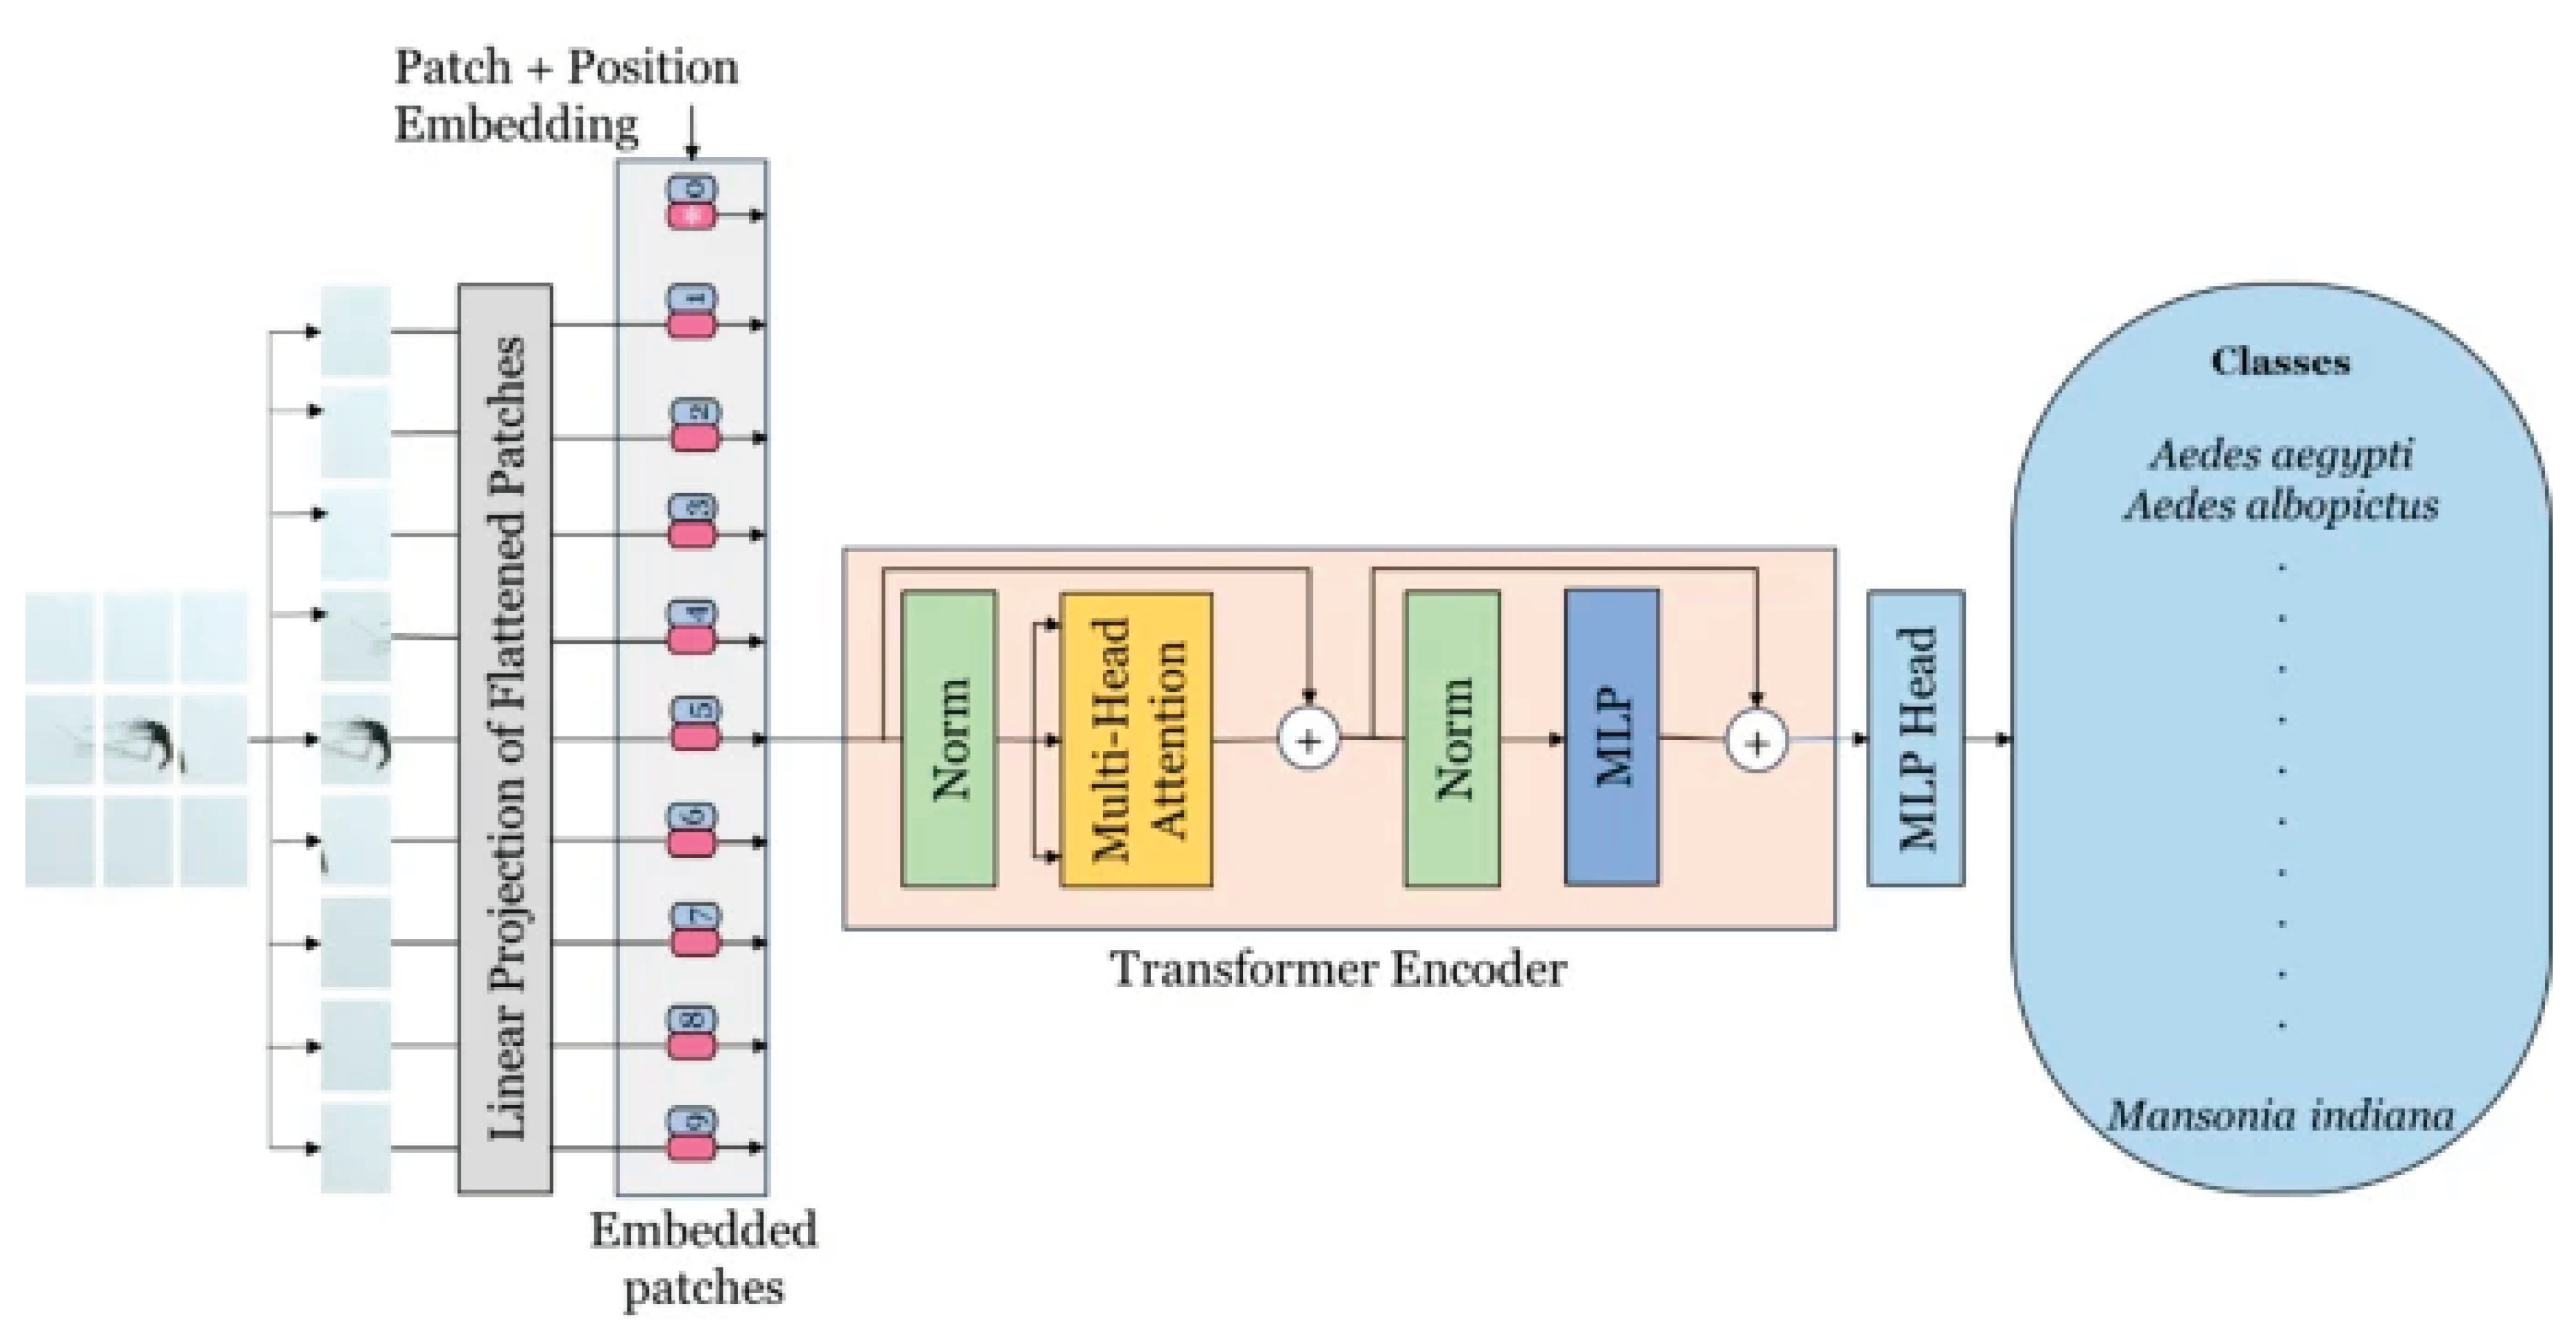
29]. The architecture is organized into three primary components: Patch Embedding, the Transformer Encoder, and the Multi-Layer Perceptron (MLP) Head. In the Patch Embedding stage, an image is partitioned into fixed-size patches that are linearly projected and enriched with positional encodings before being passed into the Transformer Encoder. This encoder, which plays a central role in feature extraction, replaces the need for a convolutional backbone and is composed of multiple layers containing multi-head self-attention and feed-forward submodules, each followed by normalization. The MLP Head forms the final stage and includes two fully connected hidden layers with 2048 and 1024 units, respectively, which contribute to the classification process. The output layer then produces two logits corresponding to the binary classes of the pneumothorax dataset. A schematic representation of the ViT architecture is depicted in
Figure 2 [
30].
2.6.2. DINOv2
DINOv2 is a self-supervised variant of the ViT that produces spatially aware features suitable for dense prediction tasks. For each image, it generates a global token together with a grid of local patch tokens. The PolaCount module preserves patch-level placements, as these localization cues are essential for accurate object counting [
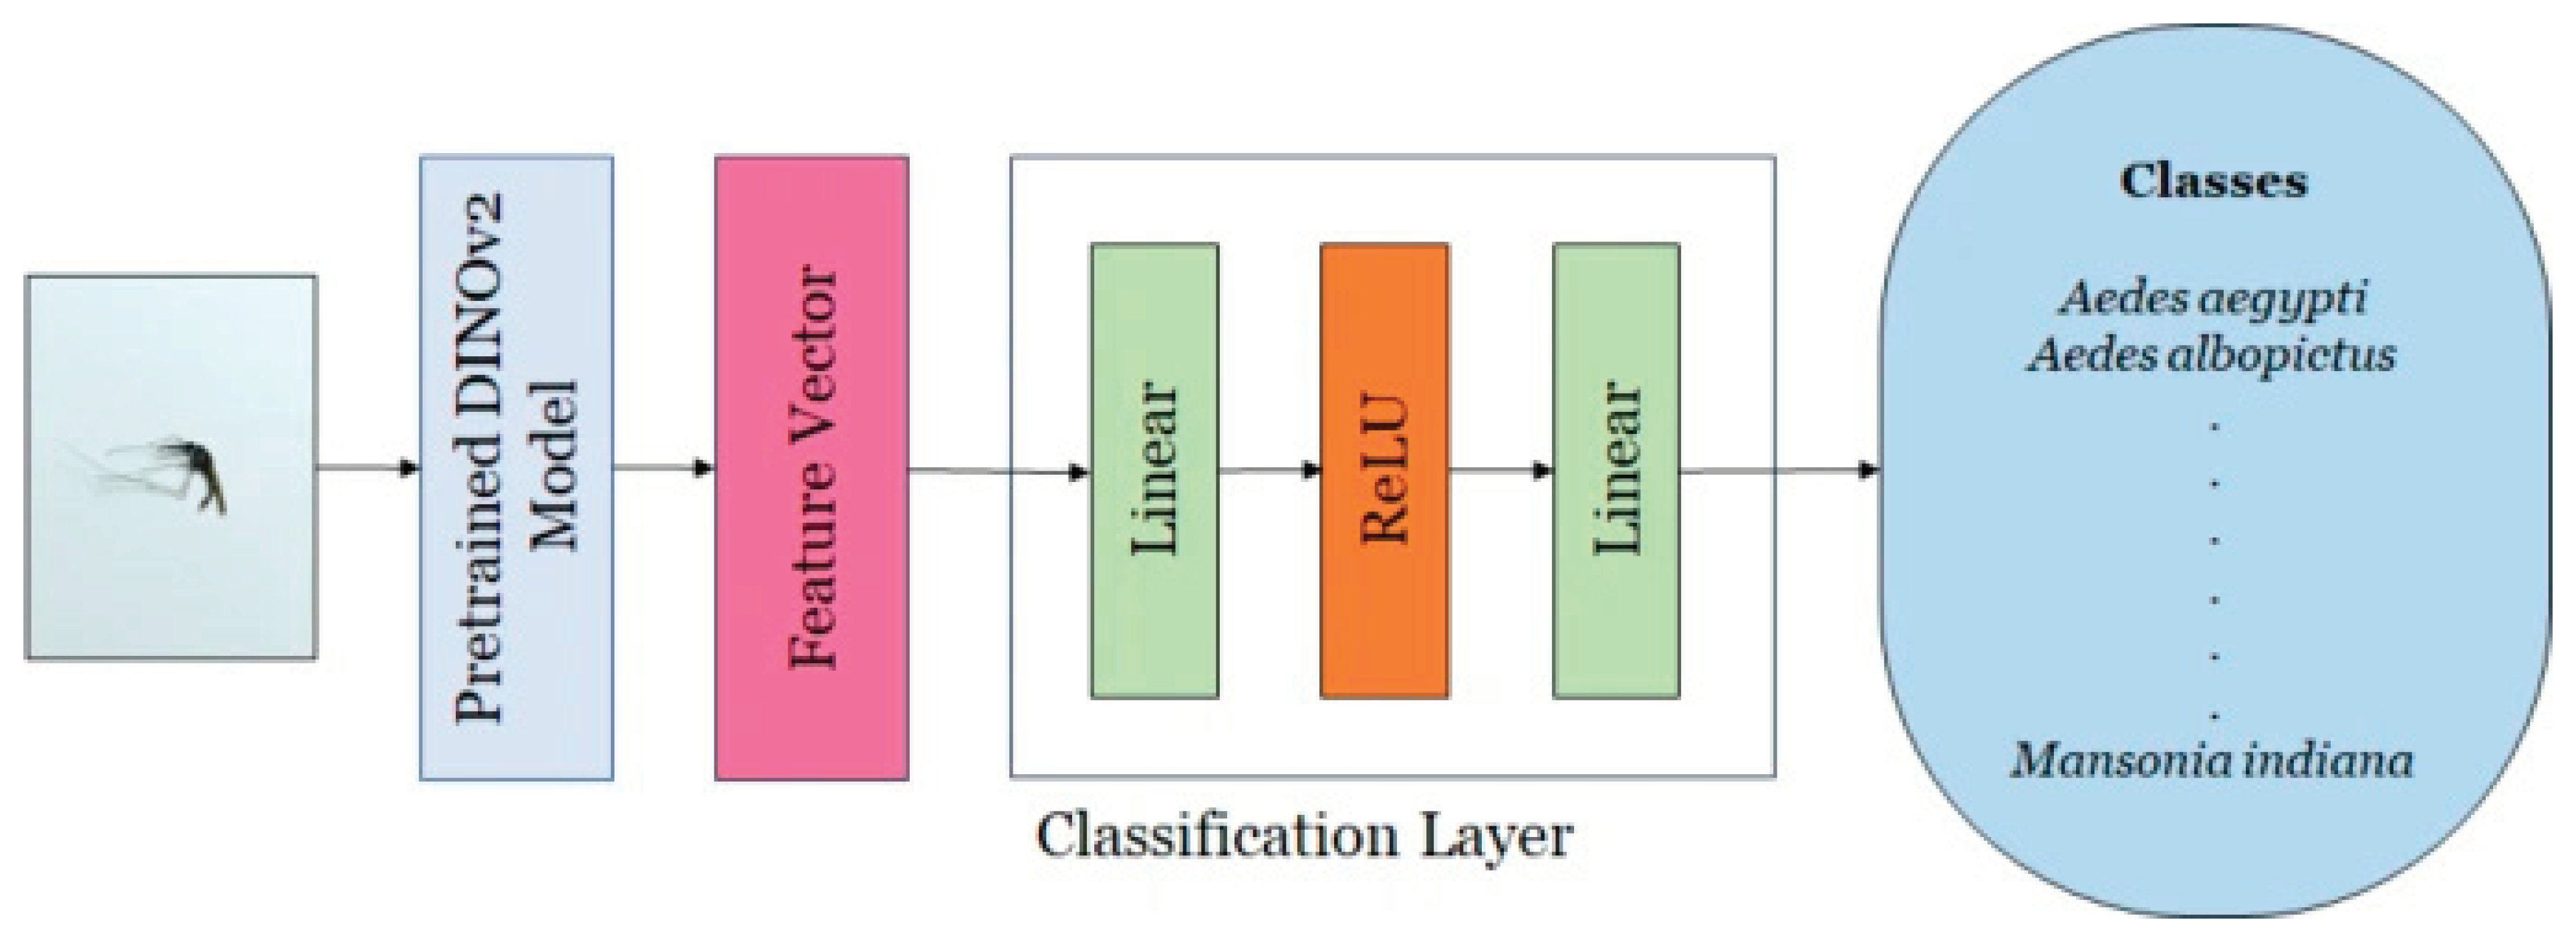
31]. This architecture integrates self-distillation into its training strategy and functions as a backbone network for feature extraction. This backbone employs a transformer-based architecture designed to derive high-dimensional feature representations from input images. The extracted features have been shown to outperform task-specific models and state-of-the-art baselines in various downstream applications. A classification head is subsequently attached to the backbone, using the feature vector to perform image-level classification. The classifier consists of two fully connected layers: the first projects the feature space to a 256-dimensional embedding, followed by a second layer that maps it to the number of target classes (16 in this study). A ReLU activation is applied after the first linear transformation.
Figure 3 provides a schematic overview of the DINOv2 architecture, illustrating its core components and interactions [
30].
2.7. Evaluation Metrics
In a binary classification task, model performance can be assessed using a 2×2 confusion matrix, which includes true positives (TP), true negatives (TN), false positives (FP), and false negatives (FN). In this matrix, the rows represent the actual classes, while the columns indicate the predicted classes. Several standard metrics are derived from these values. Accuracy reflects the proportion of correctly classified cases (both positive and negative) relative to the total number of samples. Recall (sensitivity) measures the proportion of true positive cases correctly identified out of all actual positives. Precision denotes the proportion of true positive predictions among all cases predicted as positive. F1-score represents the harmonic mean of precision and recall, providing a balanced measure of a model’s reliability in both detecting positive cases and minimizing false alarms.
2.8. Experimental Setup and Training Details
All deep learning experiments were conducted in a CUDA-enabled Google Colaboratory environment using the Keras framework, which provided efficient processing and faster training. Given the limited number of class-level samples in the dataset, we employed pretrained transformer-based architectures-ViT and DINOv2—rather than constructing models from scratch. No architectural modifications were made to the original models.
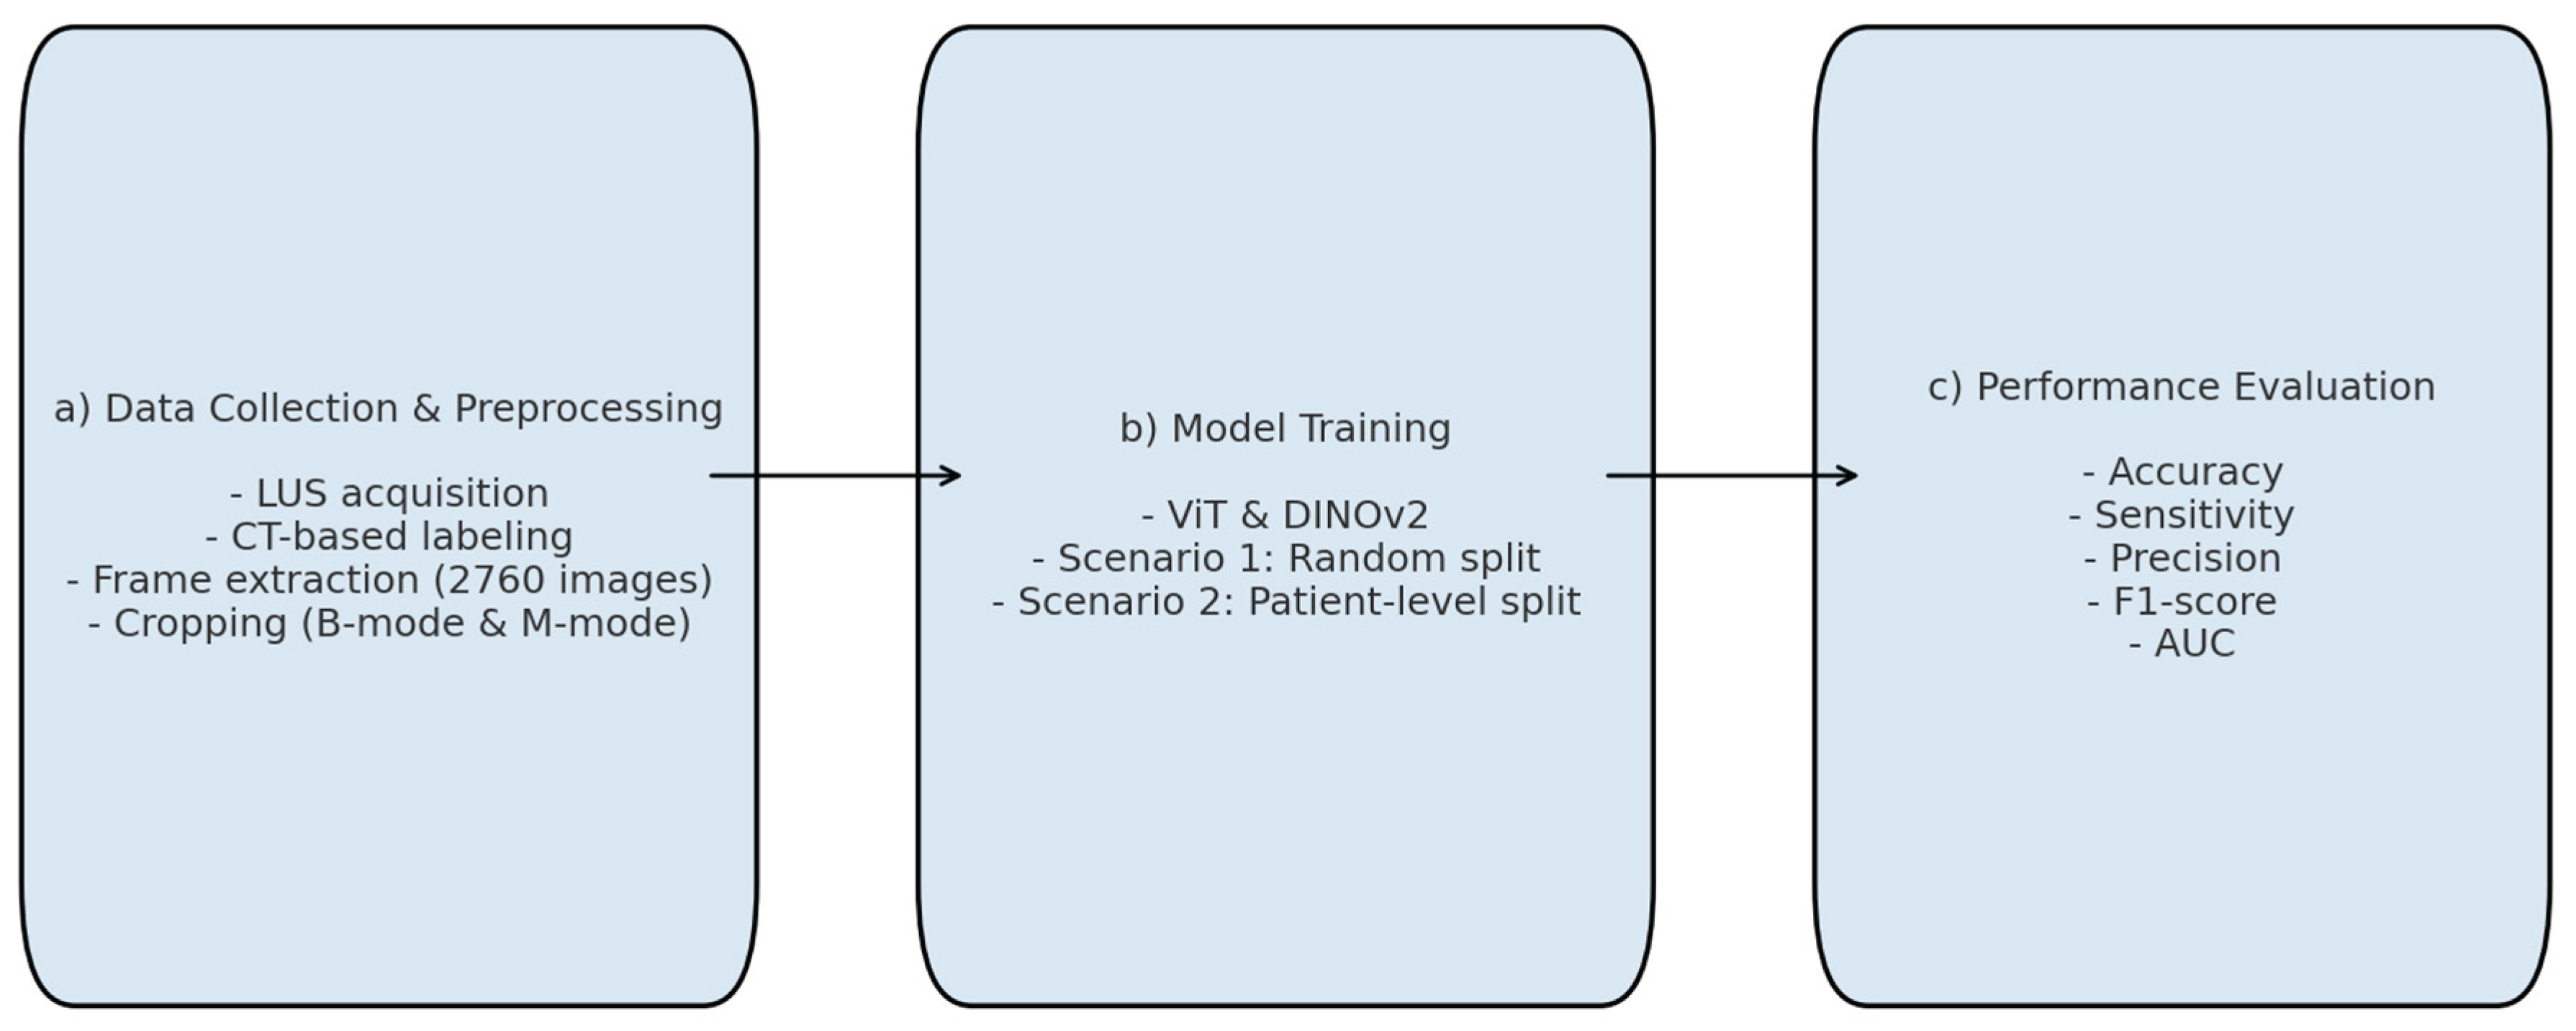
Figure 4 summarizes the main stages of the experimental workflow: (a) data collection and pre-processing, (b) model training, and (c) performance evaluation.
To prevent potential overfitting due to repeated frames in the 10-second video sequences, subsets were generated by selecting one out of every five frames (e.g., 1st, 6th, 11th, etc.) from each patient. Although the initial dataset contained 2,760 frames (60 frames per patient × 46 patients), this down-sampling strategy reduced the number to 552 representative images. Two scenarios were implemented to validate the performances of deep learning models. In Scenario 1, this dataset was randomly divided into training, validation, and test sets, resulting in 342 images (62%) for training, 99 images (17.9%) for validation, and 111 images (20.1%) for testing. While this random split achieved high accuracy, it carried the risk of data leakage, as frames from the same patient could appear across different subsets. In Scenario 2, patient-level separation was strictly enforced. A total of 26 patients (312 images, 56.6%) were allocated to training, 10 patients (120 images, 21.7%) to validation, and another 10 patients (120 images, 21.7%) to testing. This ensured that no individual contributed images to more than one subset, thereby improving the robustness of the evaluation and eliminating overlap across sets.
Table 2 summarises the information about the train, validation, and testing sets for both scenarios.
All images were resized according to the input requirements of each architecture. Models were trained for 30 epochs with a batch size of 256, using the Adam optimizer with an initial learning rate of 1× 10
−3. Hyperparameters are summarized in
Table 3. Model performance was assessed using accuracy, sensitivity, precision, F1-score, and AUC. Although binary cross-entropy is commonly used in binary classification tasks, in this study Mean Squared Error (MSE) was selected as the loss function, consistent with prior work applying regression-style optimization in medical image classification [
32]. Preliminary experiments indicated that MSE provided stable convergence in our relatively small dataset.
3. Results
This section presents a comprehensive summary of model performance during training, validation, and test set evaluation for automatic pneumothorax detection. The experiments were conducted under two scenarios. In both scenarios, M-mode images derived from the region with lower motion and B-mode images focused on the pleural line region were used, and deep learning models were compared to assess their ability to distinguish pneumothorax from healthy lungs.
Figure 5 and
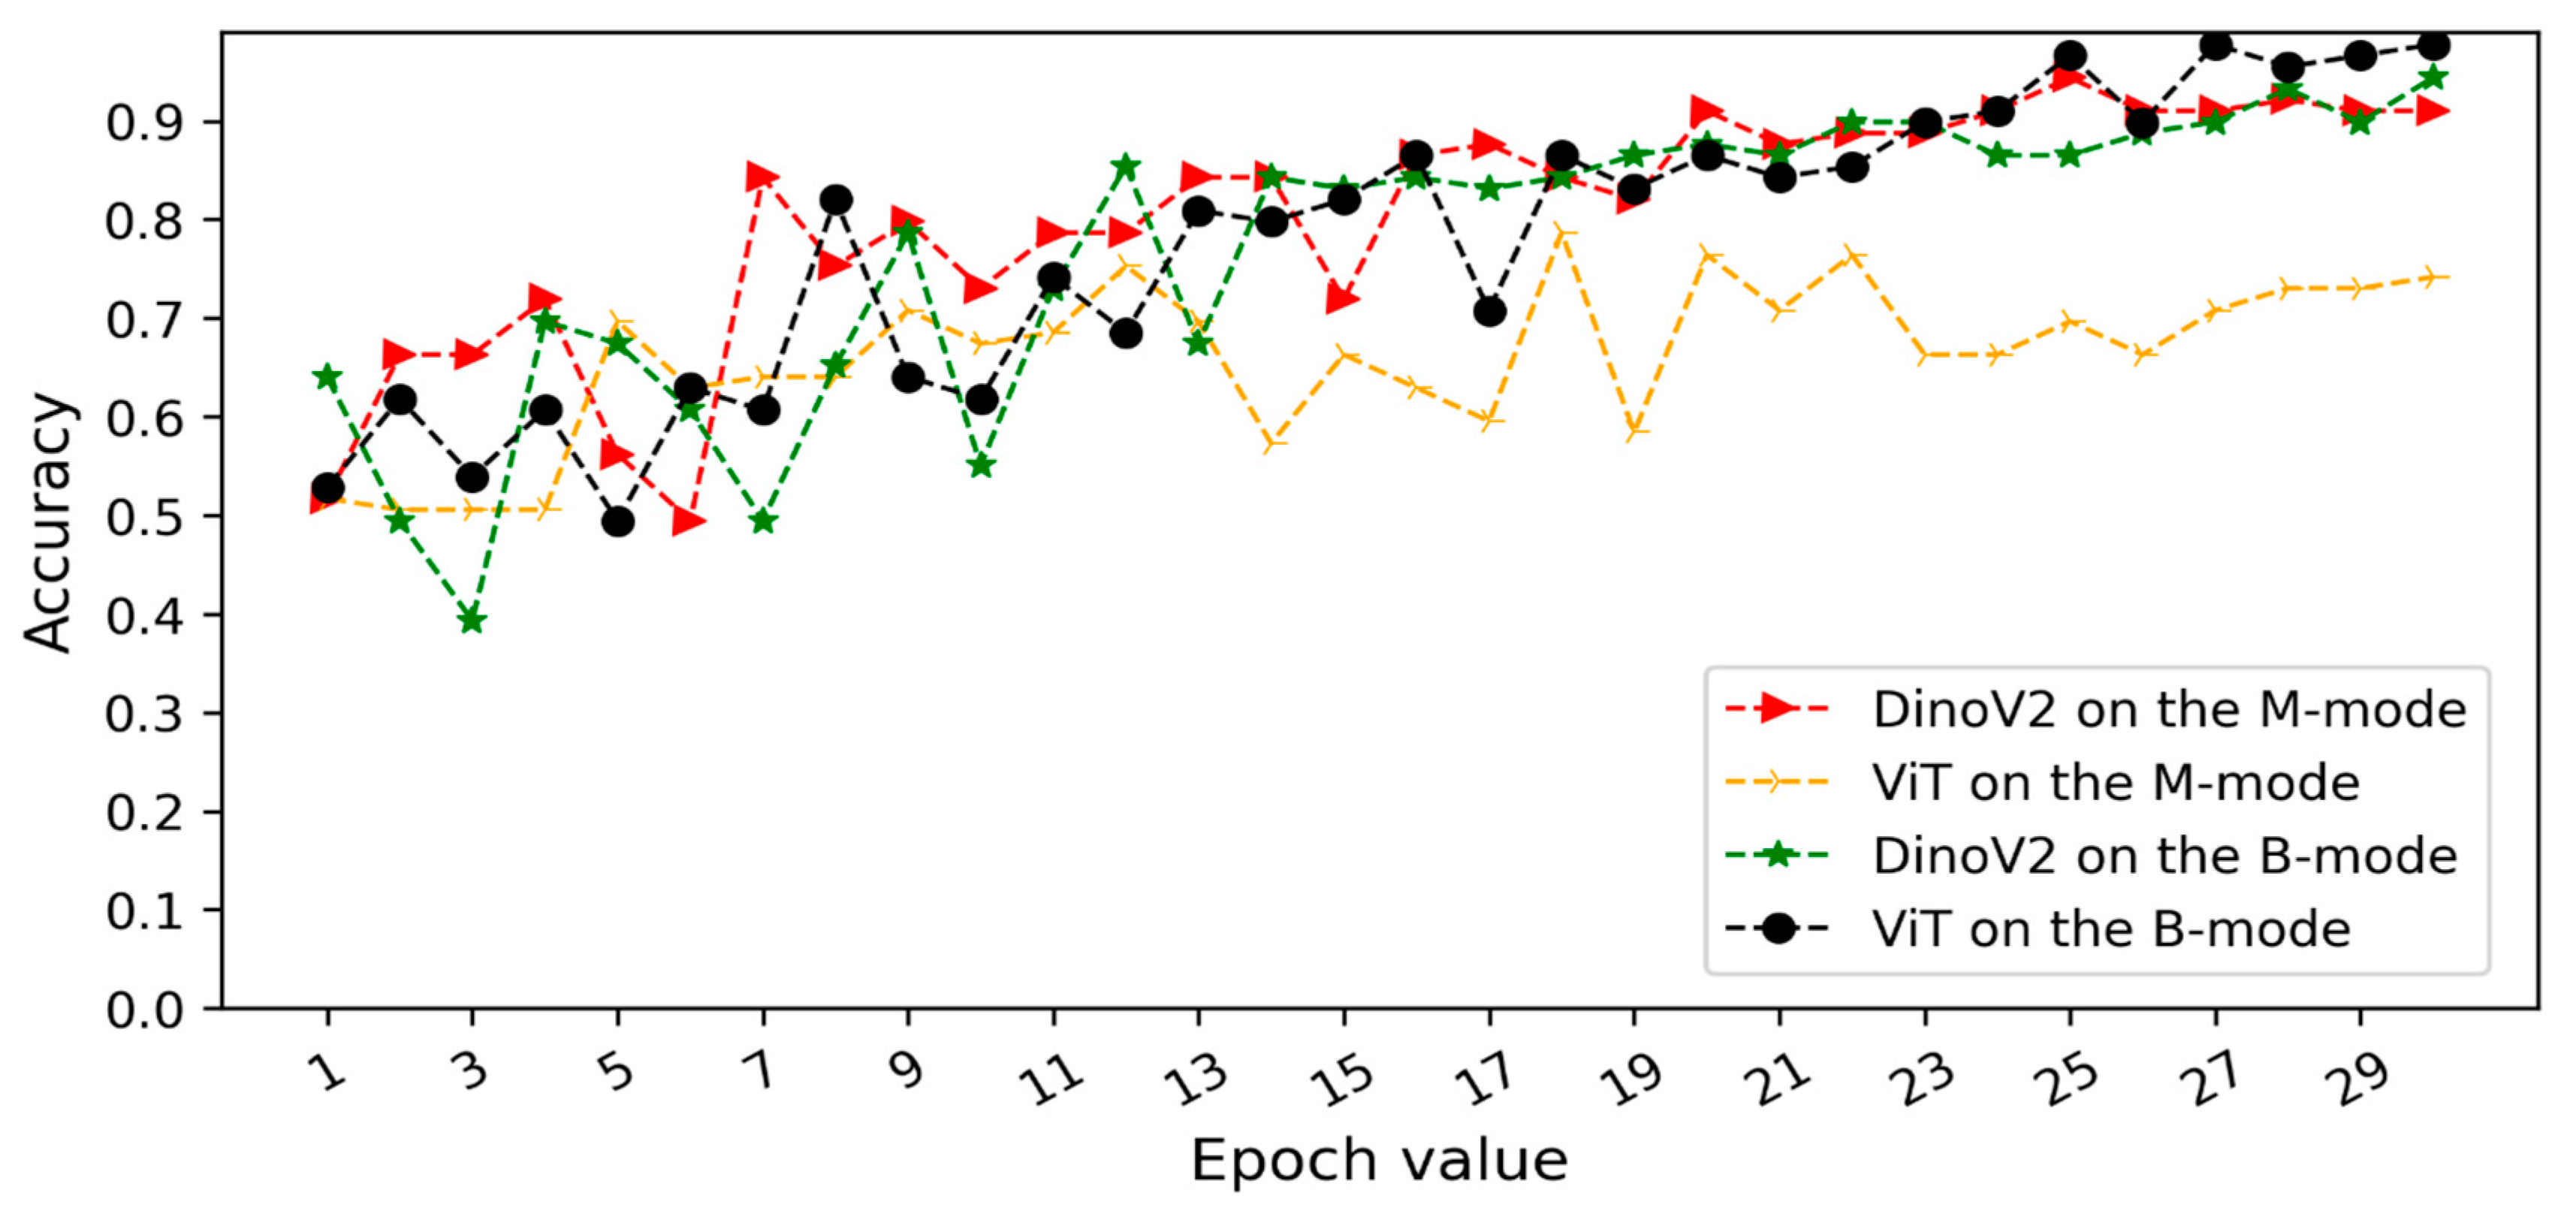
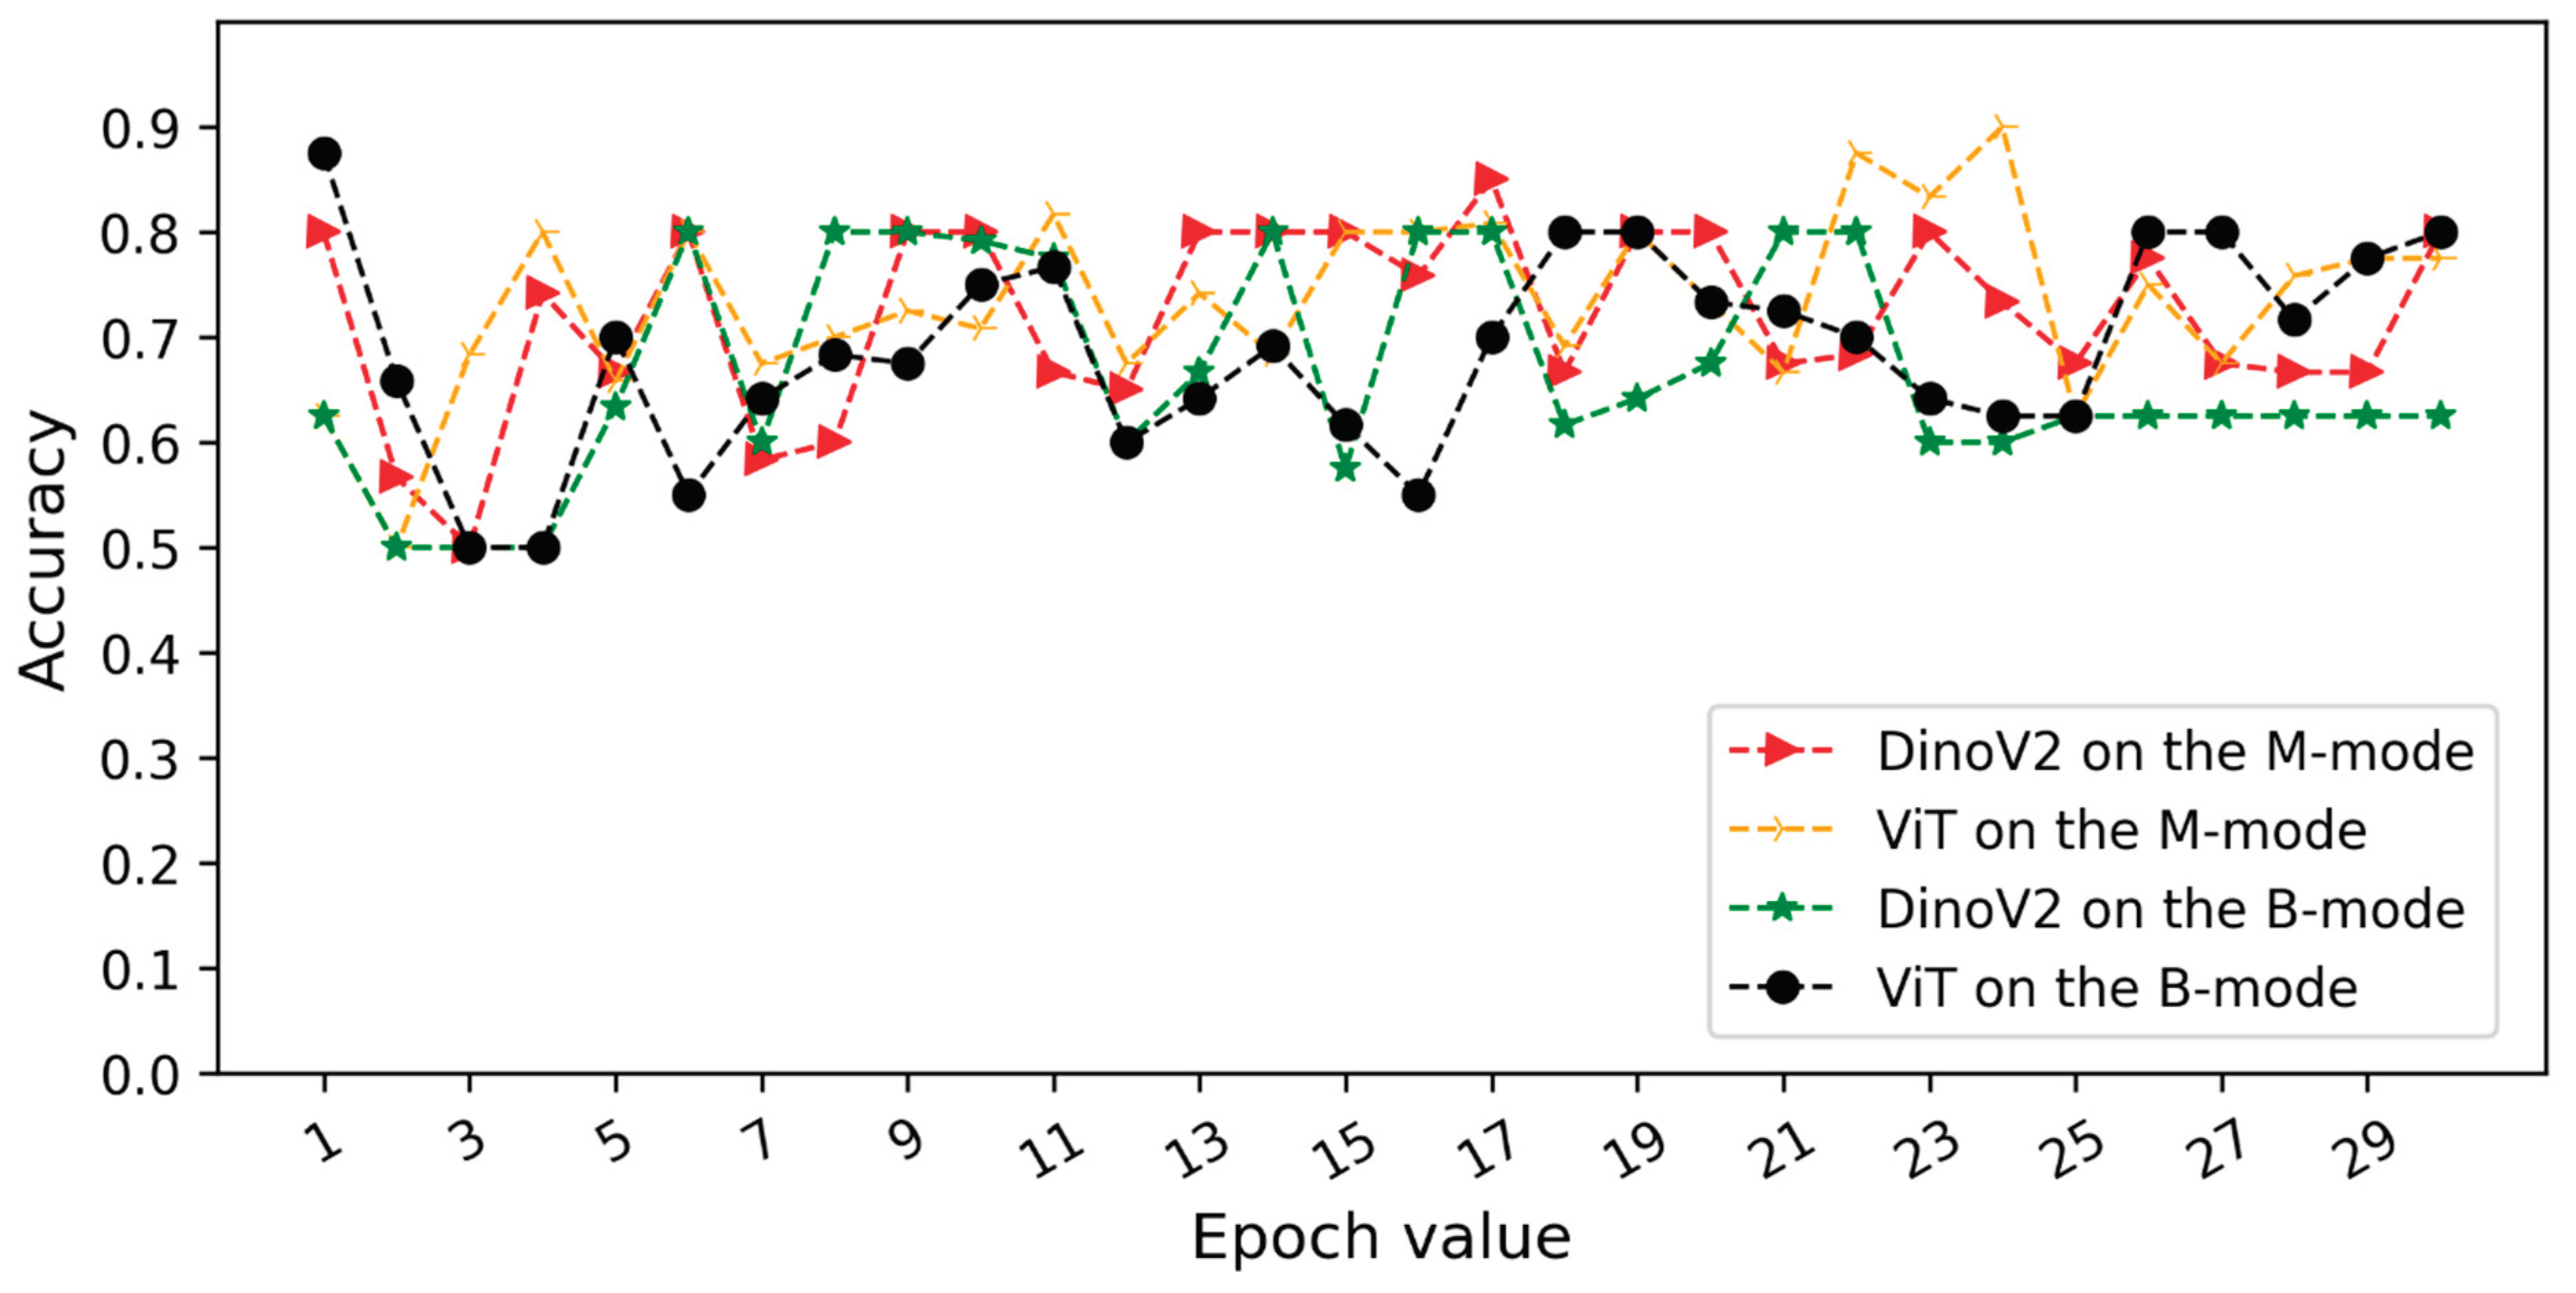
Figure 6 illustrate the validation accuracy curves over training epochs for each model. Specifically,
Figure 5 corresponds to Scenario 1 and
Figure 6 to Scenario 2. In both datasets, the models achieved consistently high accuracy, with B-mode (pleural line) inputs generally yielding overall superior performance.
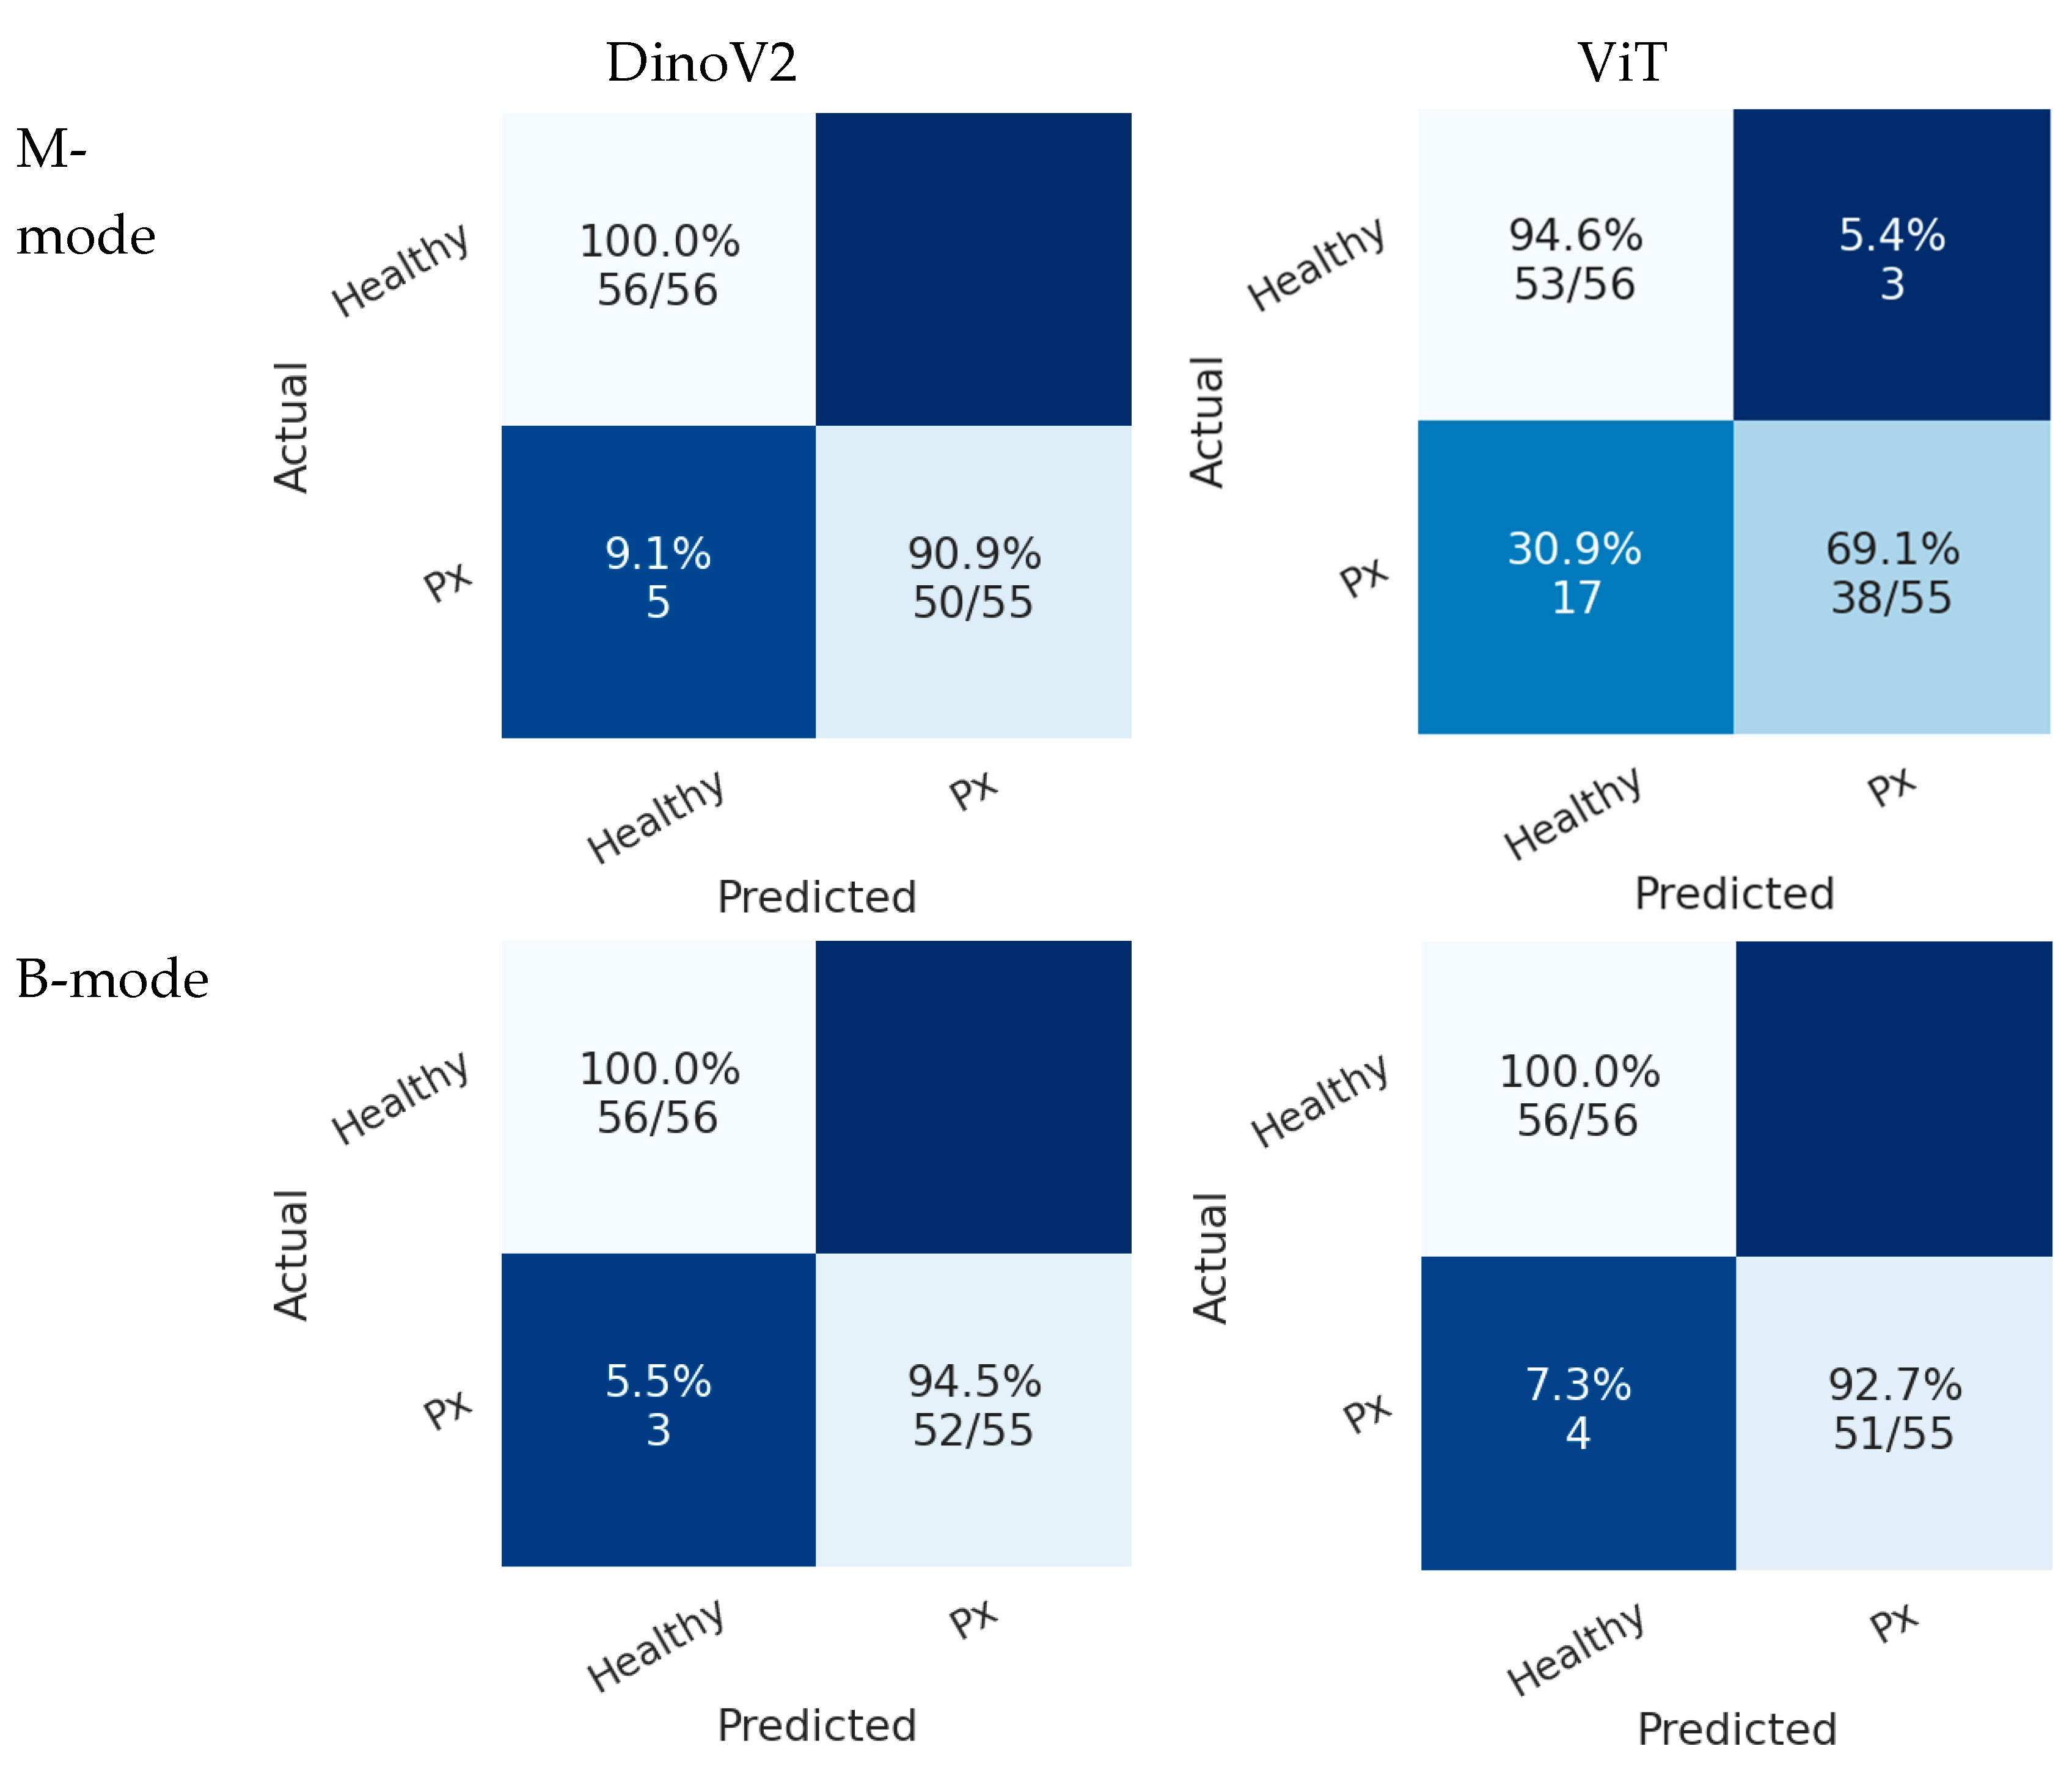
Figure 7 presents the confusion matrices of deep learning models on the test sets in Scenario 1. In the B-mode dataset, both ViT and DINOv2 demonstrated superior performance compared with the M-mode dataset. In this scenario, the DINOv2 model misclassified only 3 pneumothorax images in the B-mode region, while the ViT model misclassified 4 images. Both models achieved perfect classification of healthy cases.
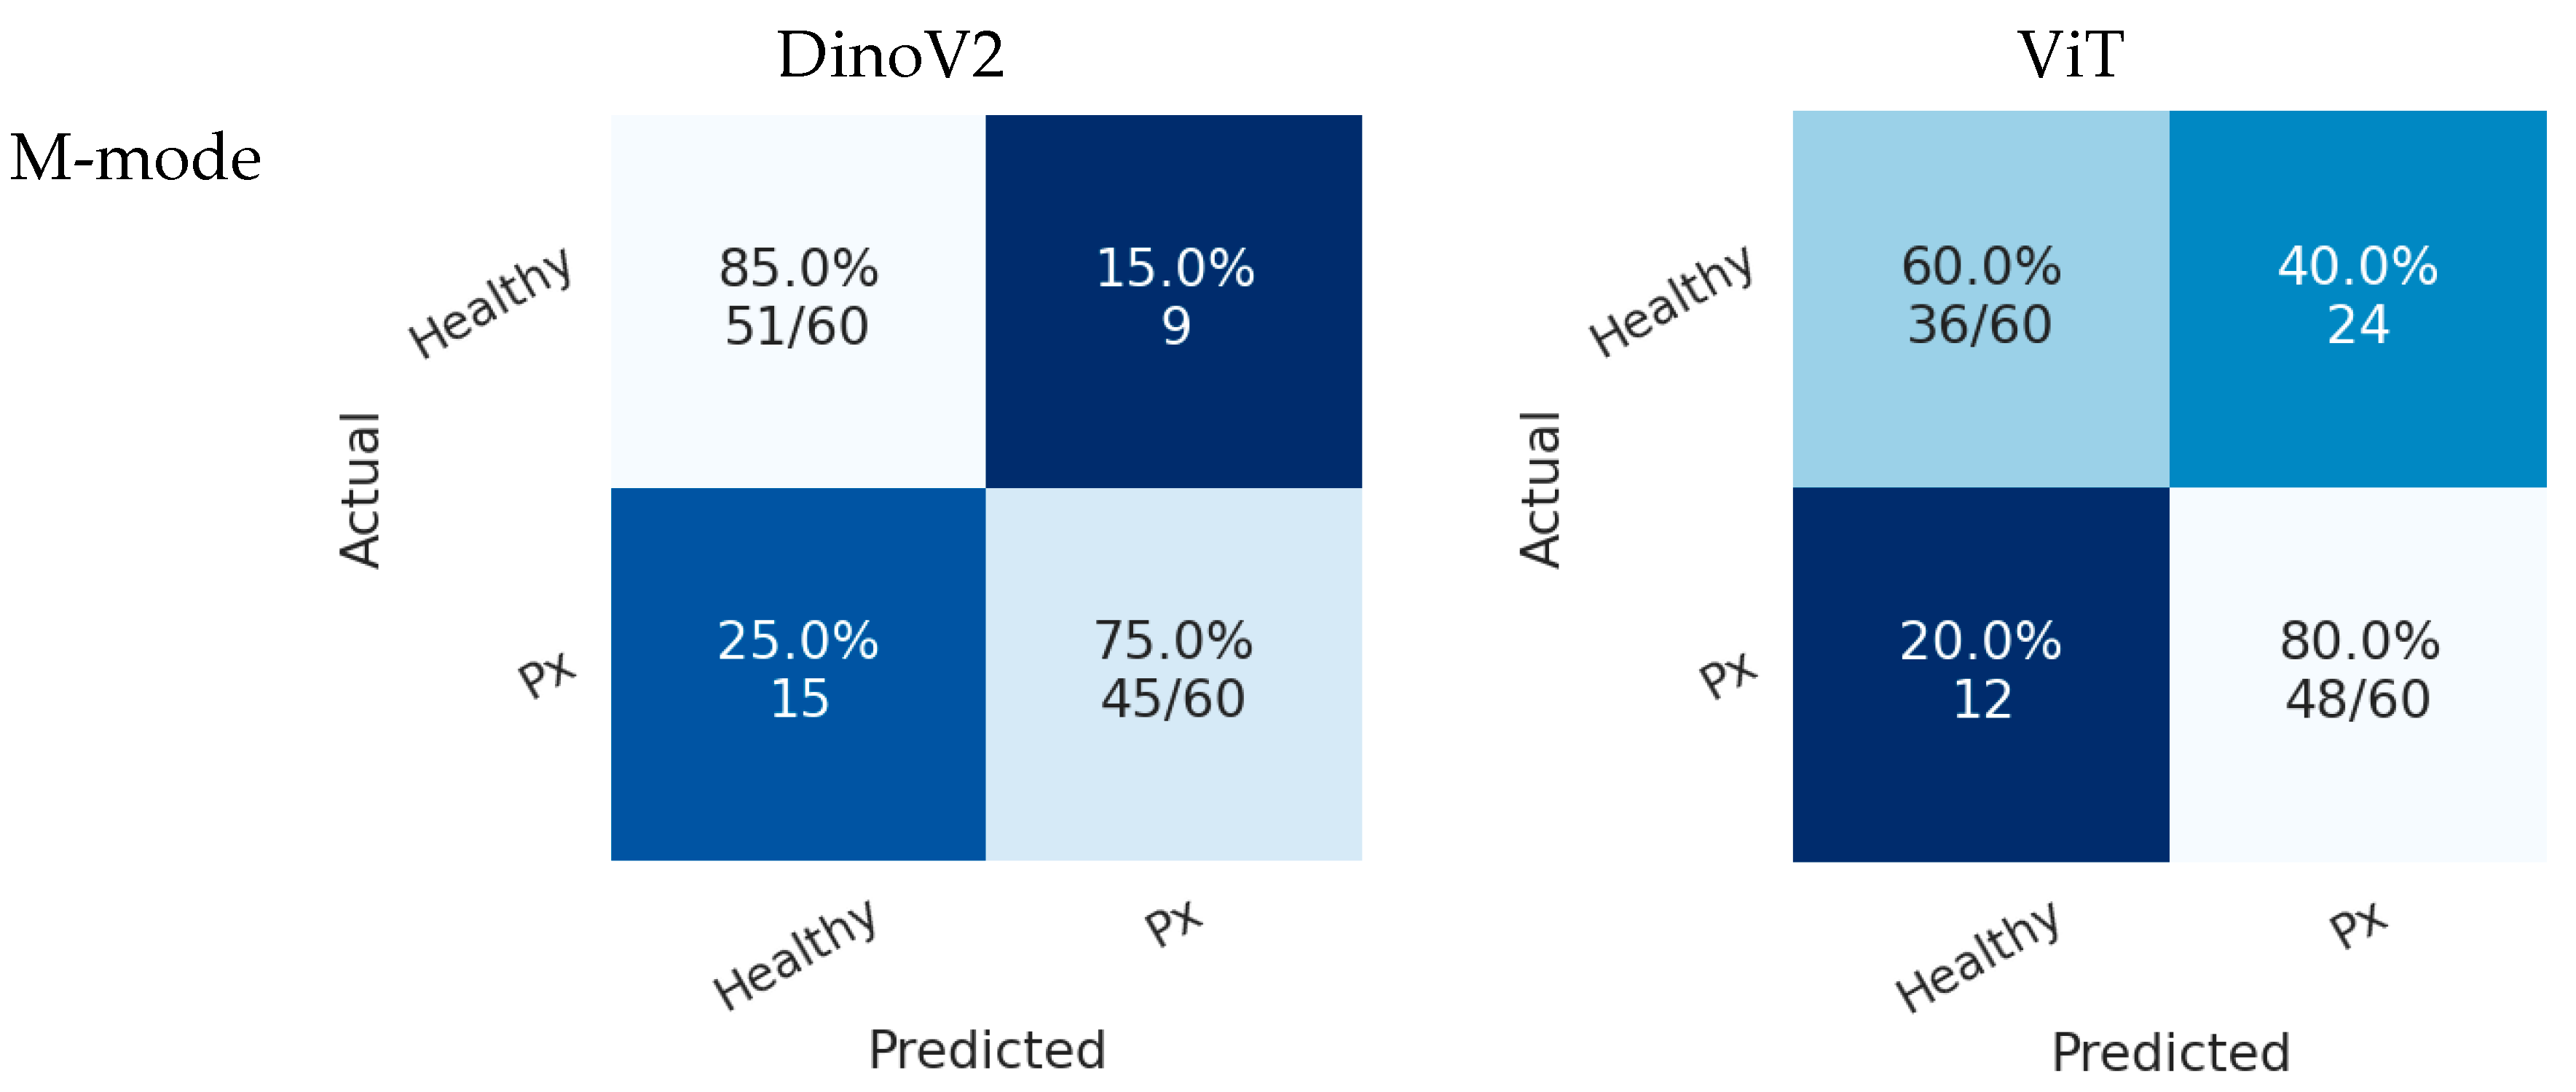
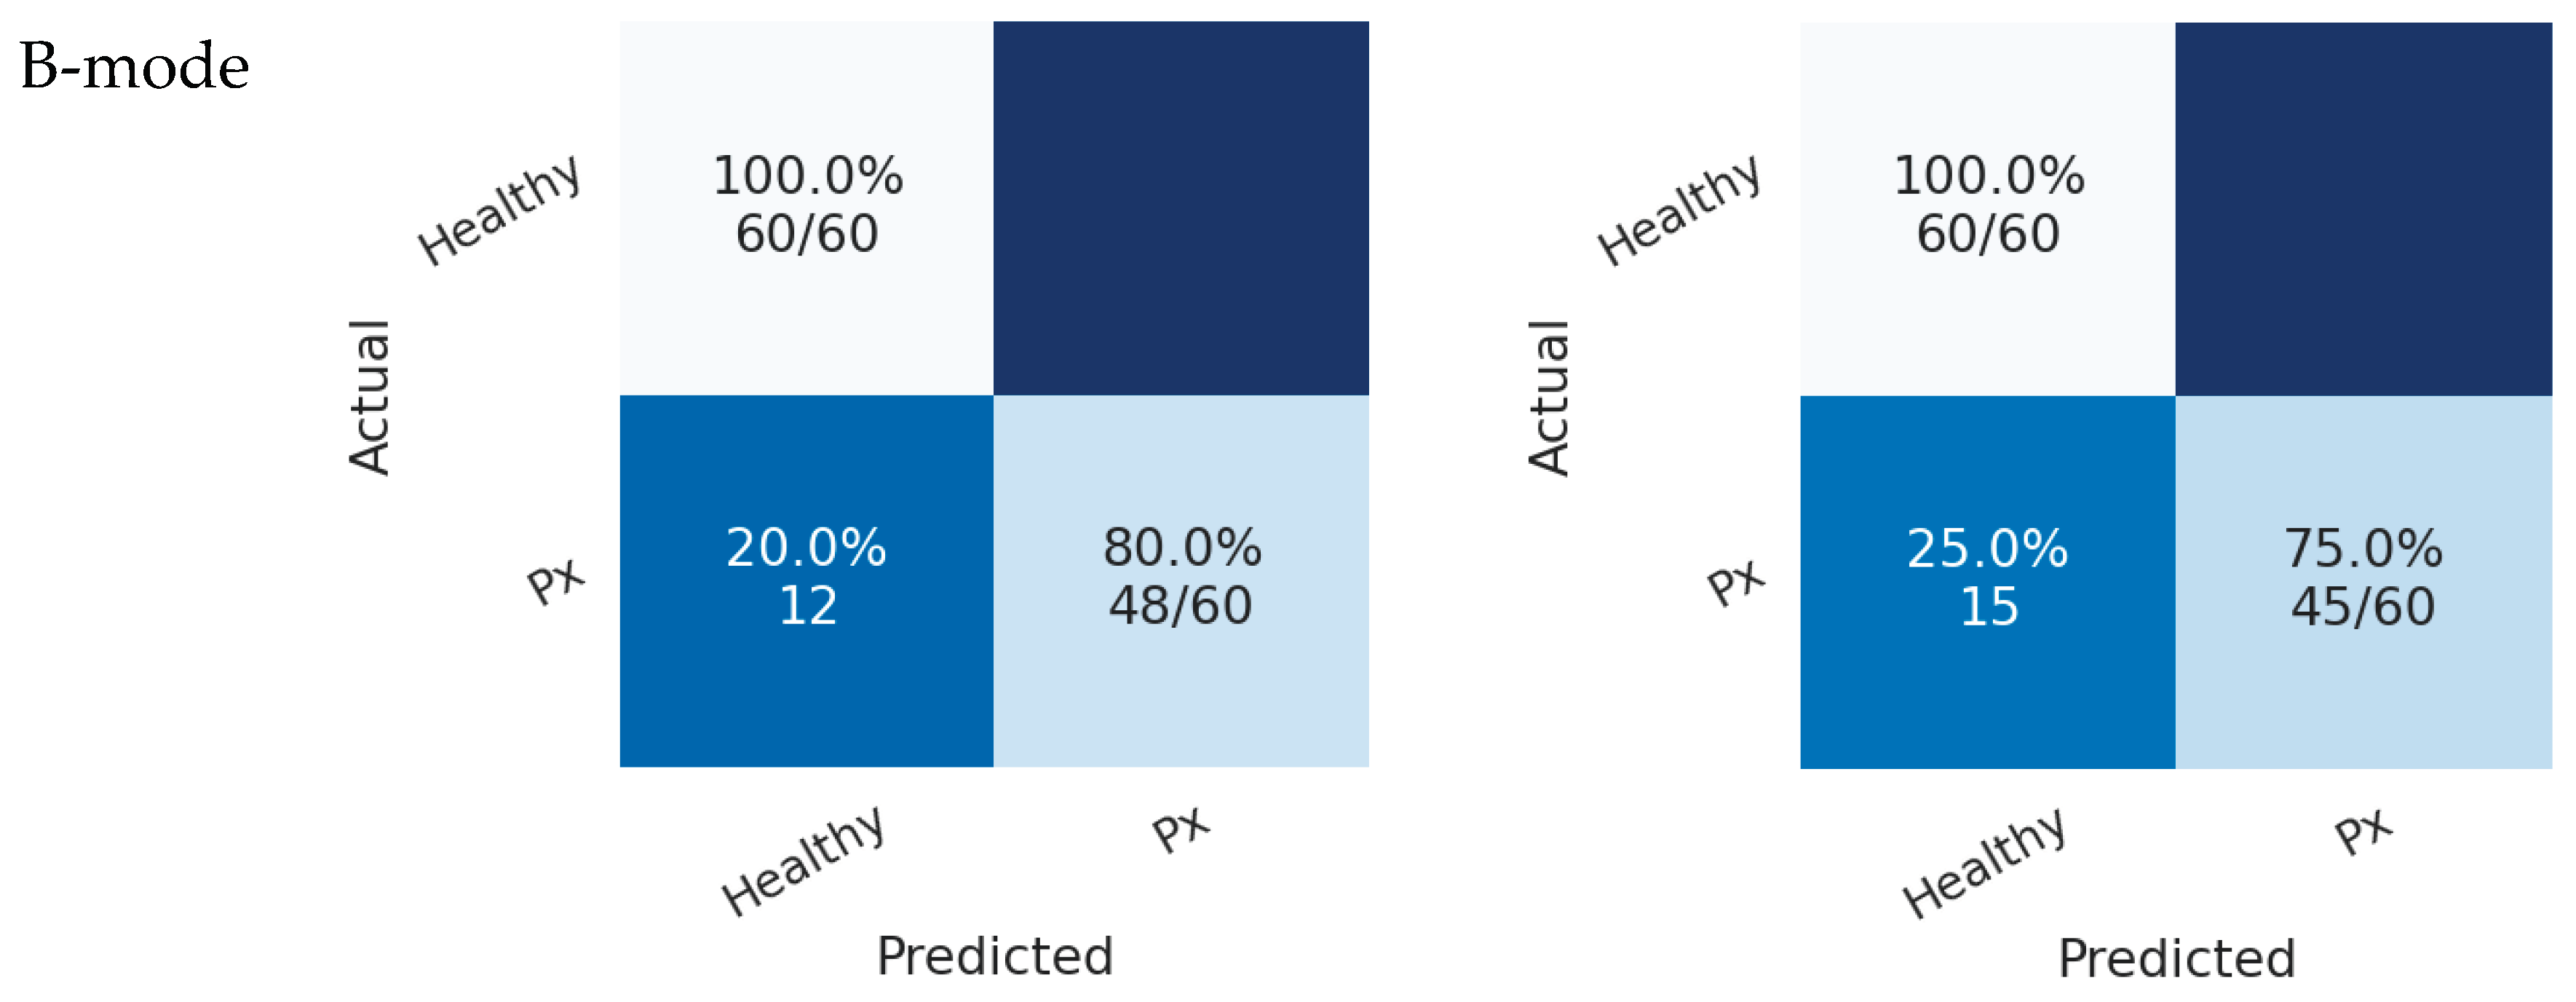
In Scenario 2, both models also achieved higher accuracy in the B-mode region compared with the M-mode region. As shown in
Figure 8, the DINOv2 model misclassified 12 pneumothorax images, while the ViT model misclassified 15 images. Both models achieved perfect classification of healthy cases.
Table 4 presents the performance of the deep learning models. The results from both the M-mode and B-mode regions indicate that both models performed better in the B-mode region compared with the M-mode region. Bold values indicate the highest metric values. In Scenario 1, the ViT model achieved the highest accuracy in the B-mode region, with 99.1%, while the DINOv2 model also demonstrated acceptable performance with 97.3% accuracy in the same region. In Scenario 2, the DINOv2 model achieved the best performance in the B-mode region with 90% accuracy, corresponding to 90% accuracy, 80% recall, 100% precision, and an F1-score of 88.89%.
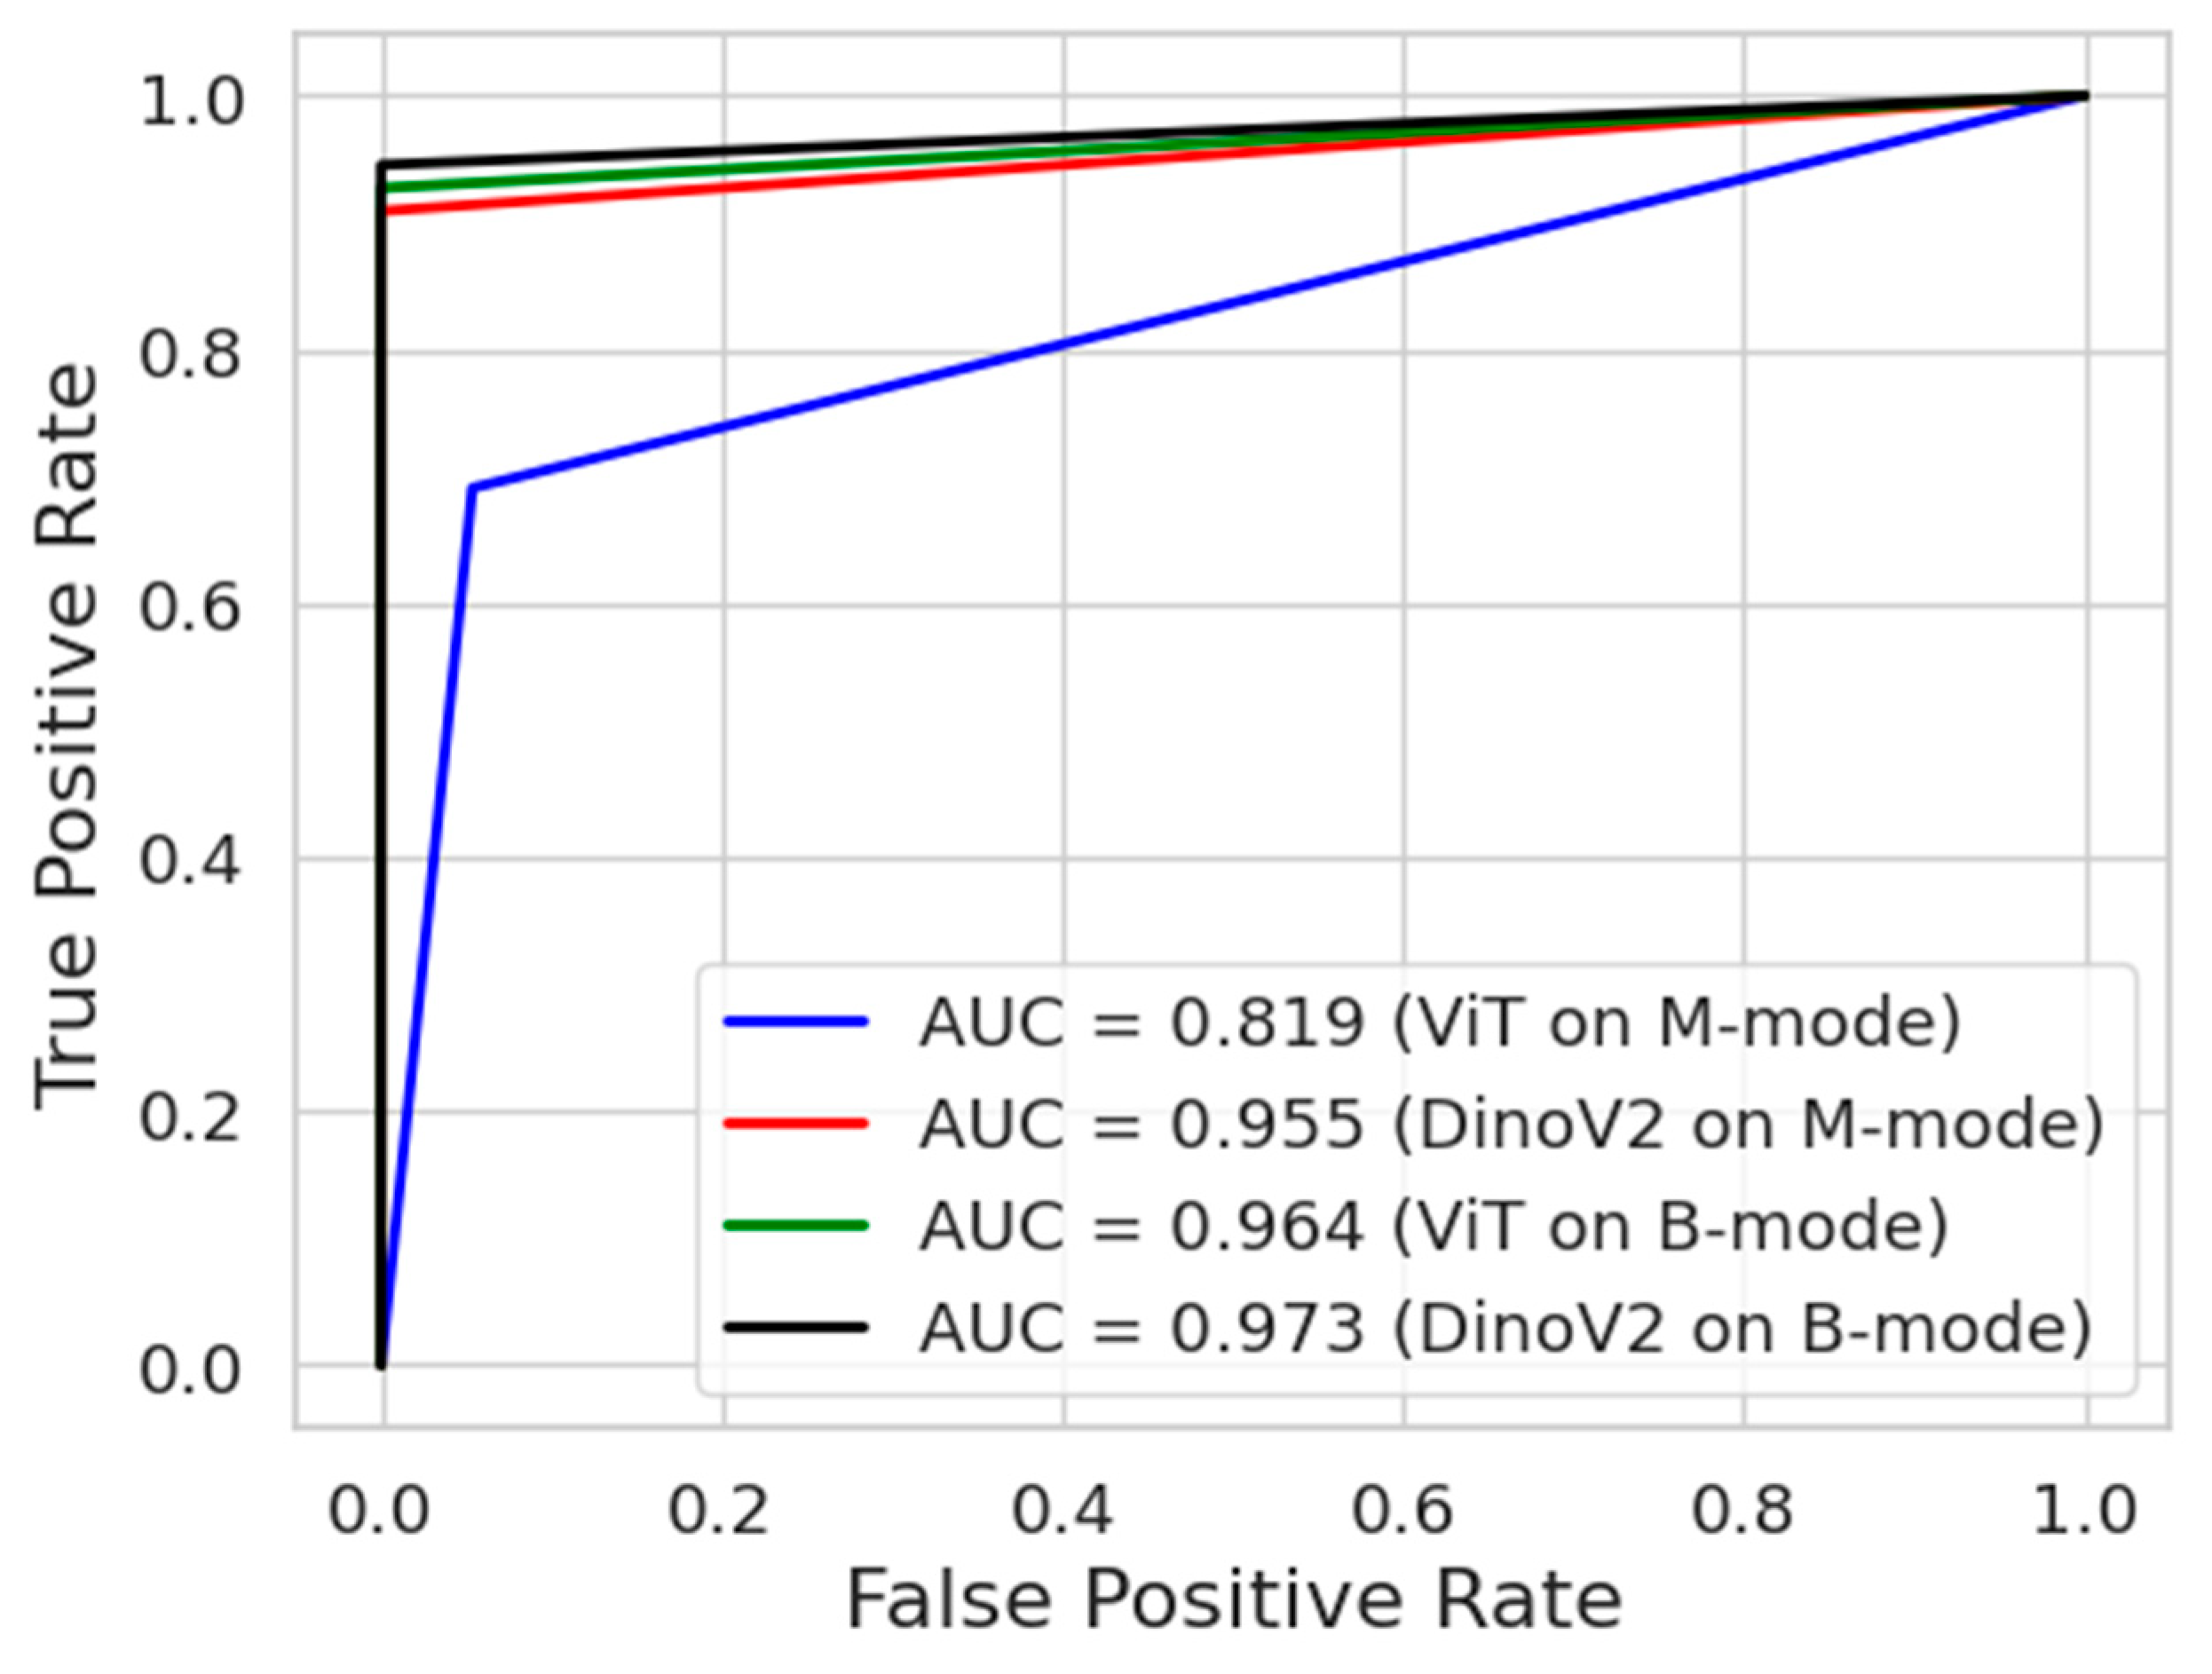
Figure 9 presents the ROC curves of the deep learning models. The ROC curve is an important tool frequently used in medical data analysis fields. This curve visualizes the balance between sensitivity and specificity offered by a classifier model. The blue and red colours indicate the ROC curves of models trained on M-mode images. On the other hand, the green and black colours indicate the ROC curves of models trained on B-mode images. As can be seen, the DinoV2 and ViT models achieved an AUC of 0.973 and 0.964, respectively, on B-mode images.
4. Discussion
4.1. Comparison with Existing Literature
The findings of our study are largely consistent with recent literature on AI-assisted lung ultrasound (AI-LUS) for pneumothorax detection. Multiple studies in recent years have demonstrated that deep learning models can achieve near-expert performance when applied to lung ultrasound for pneumothorax diagnosis. For instance, VanBerlo et al. [
17] trained a deep learning model on large-scale LUS datasets from two academic centers and reported 93.5% sensitivity and 87.3% specificity, with similar performance on an external dataset, indicating good generalizability. Likewise, Qiang et al. [
18] introduced a spatiotemporal deep learning model capable of analyzing full LUS video clips, achieving 96.9% accuracy, 99.2% sensitivity, and 89.2% specificity, representing one of the highest-performing systems to date. These results corroborate our finding that transformer-based architectures, particularly DINOv2, can deliver high diagnostic accuracy, with patient-level splits in our study yielding AUC values around 0.97, comparable to the best values reported in the literature.
Earlier approaches showed more modest performance. Rule-based algorithms initially reported sensitivities around 79%, whereas deep learning models, when carefully trained to avoid data leakage, achieved marked improvements. Jascur et al. [
11] applied a ResNet-based model to post-thoracic surgery patients, reporting 82% sensitivity and 92% specificity. Similarly, Montgomery et al. [
14] demonstrated that AI-assisted ultrasound could detect pneumothorax with 86% sensitivity and 75% specificity. Our study further confirms that B-mode images are more informative than M-mode, consistent with reports emphasizing the limitations of frame-based analysis when temporal pleural motion is underutilized. Importantly, by applying a strict patient-level split, our study mitigated data leakage—a methodological issue that inflated performance in some earlier studies.
Prospective evaluations also highlight the potential of AI in real-world clinical practice. Clausdorff Fiedler et al. [
24] reported that an AI tool achieved 90–100% sensitivity in real-time lung sliding detection in trauma patients, though specificity was moderate in low-quality scans. This mirrors the sensitivity-specificity tradeoff observed in our models, where DINOv2 maximized specificity (100%) at the expense of slightly lower sensitivity in the patient-level scenario. Yang et al. [
25] found that AI-assisted LUS demonstrated 79.4% sensitivity and 85.4% specificity, comparable to chest radiography in the same cohort. Taken together, these reports align with our results, reinforcing the conclusion that transformer-based models can achieve diagnostic accuracy close to that of human experts while avoiding methodological pitfalls.
4.2. Clinical Implications
Our findings underscore the value of AI-assisted LUS in scenarios where access to radiologists or expert sonographers is limited. In emergencies such as traumatic pneumothorax, prehospital personnel—including paramedics in ambulances or general practitioners in rural clinics—may be the first and only providers available. Traditional lung ultrasound is highly operator-dependent, and inexperience can significantly limit diagnostic accuracy. AI integration can mitigate this limitation by functioning as a standardized observer, automatically detecting sonographic signs of pneumothorax.
Evidence from diverse ultrasound applications underscores this potential. A multicenter investigation showed that AI-assisted lung ultrasound enhanced diagnostic accuracy and improved agreement among less experienced clinicians. Likewise, Sultan et al. [
33] reported that AI-driven teleguided point-of-care ultrasound enabled individuals without prior ultrasound training to effectively perform scans for COVID-19 pneumonia. Collectively, these findings highlight how AI can broaden the clinical utility of LUS, making it accessible to non-specialist providers.
AI-assisted LUS also holds promise beyond hospitals. In prehospital settings such as ambulances, battlefield medicine, or maritime environments, handheld ultrasound devices equipped with AI algorithms could allow rapid, accurate diagnosis of pneumothorax even in the absence of a physician. Case reports have already described successful tele-ultrasound-guided pneumothorax detection by paramedics. With AI integration, such workflows could be further streamlined, reducing dependence on remote specialists. Thus, the combination of portable devices and embedded AI has the potential to democratize access to high-quality imaging, bridging the diagnostic gap between tertiary centers and austere environments.
4.3. Strengths and Limitations
This study has several strengths. First, pneumothorax diagnoses were confirmed with CT, ensuring a robust reference standard. Second, the use of a strict patient-level split eliminated the risk of data leakage, a known source of bias in prior studies. Third, the evaluation of transformer-based architectures, which are less commonly applied to lung ultrasound, provides novel insights into their diagnostic utility.
Nonetheless, important limitations should be noted. The single-center, retrospective design and modest sample size (n=46) may restrict generalizability. All images were acquired by a single operator using one handheld device, reducing variability but excluding inter-operator and inter-device effects. Frame-based analysis limited the exploitation of temporal pleural motion, which could be better captured by video-based models such as temporal shift networks. Although CT and LUS were performed within 24 hours, minor clinical changes during this interval cannot be excluded. A practical limitation was the absence of a high-frequency linear probe during data collection. The handheld curvilinear transducer—chosen for portability, consistent bedside access in the ED/ICU, and for marking the “triangle of safety” in procedures—was used to standardize acquisition and ensure adequate penetration across body habitus. Notably, for pneumothorax detection the core signs (absent lung sliding on B-mode and the “barcode” pattern on M-mode) can be reliably assessed with either linear or curvilinear probes. Still, prior reports suggest that while overall differences between probe types are minimal, small pneumothoraces may be more easily detected with high-frequency linear transducers [
34]. Finally, models were trained with fixed hyperparameters and single-vendor images, potentially limiting out-of-distribution performance.
An additional limitation is the absence of explainability methods such as saliency mapping, Grad-CAM, or attention heatmaps, which are increasingly recommended to support clinical trust in AI-assisted diagnostic systems. Future work should incorporate visualization of model decision pathways at the pleural line to provide transparency for clinicians and to facilitate adoption in practice.
Future research should therefore pursue multicenter, prospective validation across diverse patient populations, devices, and probe types. Video-based models, calibration methods, and explainability features targeted at the pleural line may further enhance clinical trust and usability. Ultimately, pilot workflow studies integrating AI-assisted LUS into trauma protocols such as E-FAST will be essential to establish real-world feasibility and impact.
5. Conclusions
This study demonstrates that state-of-the-art deep learning models can significantly enhance the diagnostic accuracy of lung ultrasound for pneumothorax detection. By systematically comparing transformer-based and convolutional architectures, we found that transformer models, particularly DINOv2, achieved the highest performance across multiple evaluation metrics. These findings suggest that AI-assisted analysis has the potential to reduce operator dependency, improve diagnostic consistency, and support timely decision-making in emergency and critical care settings. The results provide a foundation for the integration of artificial intelligence into point-of-care ultrasound workflows, highlighting its promise as a valuable adjunct to clinical expertise in pneumothorax diagnosis.
Author Contributions
Conceptualization, ID and KA; methodology, ID and KA; software, KA; validation, ID and KA; formal analysis, KA; investigation, ID; resources, ID; data curation, KA; writing—original draft preparation, ID and KA; writing—review and editing, ID and KA; visualization, KA; supervision, ID; project administration, ID. All authors have read and agreed to the published version of the manuscript.
Funding
This research received no external funding.
Ethical Statement
This study involved human subjects. All procedures were approved by the Clinical Ethics Committee of Kastamonu University (approval number: 2024-KAEK-64) and were conducted in accordance with institutional requirements and ethical standards.
Data Availability Statement
The data used for this research work will be shared on reasonable request.
AI Disclosure Statement
Artificial Intelligence (AI)-assisted tools were used solely for grammar and language editing. No AI tools were used for content generation, data analysis, or figure preparation. The authors take full responsibility for the scientific content of this work.
Declaration of Competing Interest
The authors declare that they have no known competing financial interests or personal relationships that could have appeared to influence the work reported in this paper.
References
- Zhang M, Liu ZH, Yang JX, Gan JX, Xu SW, You XD, Jiang GY. Rapid detection of pneumothorax by ultrasonography in patients with multiple trauma. Crit Care. 2006;10(4):R112. PMCID: PMC1751015. [CrossRef] [PubMed]
- Abu Arab W, Abdulhaleem M, Eltahan S, Elhamami M. Comparative study between bedside chest ultrasound and chest CT scan in the diagnosis of traumatic pneumothorax. Cardiothorac Surg, 2021;29(1):15. [CrossRef]
- Omar HR, Abdelmalak H, Mangar D, Rashad R, Helal E, Camporesi EM. Occult pneumothorax, revisited. J Trauma Manag Outcomes. 2010 Oct 29;4:12. PMCID: PMC2984474. [CrossRef] [PubMed]
- Boice EN, Hernandez Torres SI, Knowlton ZJ, Berard D, Gonzalez JM, Avital G, Snider EJ. Training Ultrasound Image Classification Deep-Learning Algorithms for Pneumothorax Detection Using a Synthetic Tissue Phantom Apparatus. J Imaging. 2022 Sep 11;8(9):249. PMCID: PMC9502699. [CrossRef] [PubMed]
- Lichtenstein DA, Mezière GA. Relevance of lung ultrasound in the diagnosis of acute respiratory failure: the BLUE protocol. Chest. 2008 Jul;134(1):117-25. Epub 2008 Apr 10. Erratum in: Chest. 2013 Aug;144(2):721. PMCID: PMC3734893. [CrossRef] [PubMed]
- Alrajhi K, Woo MY, Vaillancourt C. Test characteristics of ultrasonography for the detection of pneumothorax: a systematic review and meta-analysis. Chest. 2012 Mar;141(3):703-708. Epub 2011 Aug 25. [CrossRef] [PubMed]
- Ebrahimi A, Yousefifard M, Mohammad Kazemi H, Rasouli HR, Asady H, Moghadas Jafari A, Hosseini M. Diagnostic Accuracy of Chest Ultrasonography versus Chest Radiography for Identification of Pneumothorax: A Systematic Review and Meta-Analysis. Tanaffos. 2014;13(4):29-40. PMCID: PMC4386013. [PubMed]
- Kim DJ, Bell C, Jelic T, Sheppard G, Robichaud L, Burwash-Brennan T, Chenkin J, Lalande E, Buchanan I, Atkinson P, Thavanathan R, Heslop C, Myslik F, Lewis D. Point of Care Ultrasound Literature Primer: Key Papers on Focused Assessment With Sonography in Trauma (FAST) and Extended FAST. Cureus. 2022 Oct 6;14(10):e30001. PMCID: PMC9637006. [CrossRef] [PubMed]
- Chen L, Zhang Z. Bedside ultrasonography for diagnosis of pneumothorax. Quant Imaging Med Surg. 2015 Aug;5(4):618-23. PMCID: PMC4559988. [CrossRef] [PubMed]
- Mathew CS, Dias E, Kalathikudiyil Sreedharan J, Al Ahmari M, Trujillo L, West A, Karthika M. Lung ultrasound in respiratory therapy: a global reflective survey. Multidiscip Respir Med. 2024 Jul 2;19(1):980. PMCID: PMC11229826. [CrossRef] [PubMed]
- Jaščur M, Bundzel M, Malík M, Dzian A, Ferenčík N, Babič F. Detecting the absence of lung sliding in lung ultrasounds using deep learning. Appl Sci, 2021;11(15):6976. [CrossRef]
- Taylor AG, Mielke C, Mongan J. Automated detection of moderate and large pneumothorax on frontal chest X-rays using deep convolutional neural networks: A retrospective study. PLoS Med. 2018 Nov 20;15(11):e1002697. PMCID: PMC6245672. [CrossRef] [PubMed]
- Röhrich S, Schlegl T, Bardach C, Prosch H, Langs G. Deep learning detection and quantification of pneumothorax in heterogeneous routine chest computed tomography. Eur Radiol Exp. 2020 Apr 17;4(1):26. PMCID: PMC7165213. [CrossRef] [PubMed]
- Montgomery S, Li F, Funk C, Peethumangsin E, Morris M, Anderson JT, Hersh AM, Aylward S. Detection of pneumothorax on ultrasound using artificial intelligence. J Trauma Acute Care Surg. 2023 Mar 1;94(3):379-384. Epub 2022 Nov 28. [CrossRef] [PubMed]
- Nekoui M, Seyed Bolouri SE, Forouzandeh A, Dehghan M, Zonoobi D, Jaremko JL, Buchanan B, Nagdev A, Kapur J. Enhancing Lung Ultrasound Diagnostics: A Clinical Study on an Artificial Intelligence Tool for the Detection and Quantification of A-Lines and B-Lines. Diagnostics (Basel). 2024 Nov 12;14(22):2526. PMCID: PMC11593069. [CrossRef] [PubMed]
- Trovato G, Russo M. Artificial Intelligence (AI) and Lung Ultrasound in Infectious Pulmonary Disease. Front Med (Lausanne). 2021 Nov 25;8:706794. PMCID: PMC8655241. [CrossRef] [PubMed]
- VanBerlo B, Wu D, Li B, Rahman MA, Hogg G, VanBerlo B, Tschirhart J, Ford A, Ho J, McCauley J, Wu B, Deglint J, Hargun J, Chaudhary R, Dave C, Arntfield R. Accurate assessment of the lung sliding artefact on lung ultrasonography using a deep learning approach. Comput Biol Med. 2022 Sep;148:105953. Epub 2022 Aug 9. [CrossRef] [PubMed]
- Qiang X, Wang Q, Liu G, Song L, Zhou W, Yu M, Wu H. Use video comprehension technology to diagnose ultrasound pneumothorax like a doctor would. Front Physiol. 2025 May 27;16:1530808. PMCID: PMC12148891. [CrossRef] [PubMed]
- Summers SM, Chin EJ, Long BJ, Grisell RD, Knight JG, Grathwohl KW, Ritter JL, Morgan JD, Salinas J, Blackbourne LH. Computerized Diagnostic Assistant for the Automatic Detection of Pneumothorax on Ultrasound: A Pilot Study. West J Emerg Med. 2016 Mar;17(2):209-15. Epub 2016 Mar 2. PMCID: PMC4786248. [CrossRef] [PubMed]
- Summers SM, Chin EJ, April MD, Grisell RD, Lospinoso JA, Kheirabadi BS, Salinas J, Blackbourne LH. Diagnostic accuracy of a novel software technology for detecting pneumothorax in a porcine model. Am J Emerg Med. 2017 Sep;35(9):1285-1290. Epub 2017 Apr 1. [CrossRef] [PubMed]
- Lindsey T, Lee R, Grisell R, Vega S, Veazey S. Automated pneumothorax diagnosis using deep neural networks. In: Progress in Pattern Recognition, Image Analysis, Computer Vision, and Applications. Cham (Switzerland) and Madrid (Spain): Springer International Publishing; 2019. p 723–731.
- Kulhare S, Zheng X, Mehanian C, Gregory C, Zhu M, Gregory K, Xie H, Jones JM, Wilson B. Ultrasound-based detection of lung abnormalities using single shot detection convolutional neural networks. In: Simulation, Image Processing, and Ultrasound Systems for Assisted Diagnosis and Navigation. Berlin/Heidelberg (Germany): Springer; 2018. p 65–73.
- Mehanian C, Kulhare S, Millin R, Zheng X, Gregory C, Zhu M, Xie H, Jones J, Lazar J, Halse A, et al. Deep learning-based pneumothorax detection in ultrasound videos. In: Smart Ultrasound Imaging and Perinatal, Preterm and Paediatric Image Analysis. Berlin/Heidelberg (Germany): Springer; 2019. p 74–82.
- Clausdorff Fiedler H, Prager R, Smith D, Wu D, Dave C, Tschirhart J, Wu B, Van Berlo B, Malthaner R, Arntfield R. Automated Real-Time Detection of Lung Sliding Using Artificial Intelligence: A Prospective Diagnostic Accuracy Study. Chest. 2024 Aug;166(2):362-370. Epub 2024 Feb 15. [CrossRef] [PubMed]
- Yang C, Zhao H, Wang A, Li J, Gao J. Comparison of lung ultrasound assisted by artificial intelligence to radiology examination in pneumothorax. J Clin Ultrasound. 2024 Oct;52(8):1051-1055. Epub 2024 Jun 29. [CrossRef] [PubMed]
- Gómez-Guzmán MA, Jiménez-Beristain L, García-Guerrero EE, Aguirre-Castro OA, Esqueda-Elizondo JJ, Ramos-Acosta ER, Galindo-Aldana GM, Torres-Gonzalez C, Inzunza-Gonzalez E. Enhanced multi-class brain tumor classification in MRI using pre-trained CNNs and transformer architectures. Technologies (Basel). 2025;13(9):379. [CrossRef]
- Azad R, Kazerouni A, Heidari M, Khodapanah Aghdam E, Molaei A, Jia Y, Jose A, Roy R, Merhof D. Advances in medical image analysis with vision Transformers: A comprehensive review. Med Image Anal. 2024 Jan;91:103000. [CrossRef]
- Kilimci ZH, Yalcin M, Kucukmanisa A, Mishra AK. Advancing heart disease diagnosis with vision-based transformer architectures applied to ECG imagery. Image Vis Comput. 2025 Oct;162:105666. [CrossRef]
- Espejo-Garcia B, Güldenring R, Nalpantidis L, Fountas S. Foundation vision models in agriculture: DINOv2, LoRA and knowledge distillation for disease and weed identification. Comput Electron Agric. 2025 Dec;239:110900. [CrossRef]
- Kittichai V, Kaewthamasorn M, Chaiphongpachara T, Laojun S, Saiwichai T, Naing KM, Tongloy T, Boonsang S, Chuwongin S. Enhance fashion classification of mosquito vector species via self-supervised vision transformer. Sci Rep. 2024 Dec 28;14:31517. [CrossRef]
- Qian C, Cao J, Mao Y, Liu K, Zhu P, Sang J. PolaCount: Text-specified zero-shot object counting with pyramid polarity-aware cross-attention. Neurocomputing. 2025 Nov 1;652:131135. [CrossRef]
- Fu Y, Lei Y, Wang T, Curran WJ, Liu T, Yang X. Deep learning in medical image registration: a review. Phys Med Biol. 2020 Oct 22;65(20):20TR01. PMCID: PMC7759388. [CrossRef] [PubMed]
- Sultan LR, Haertter A, Al-Hasani M, Demiris G, Cary TW, Tung-Chen Y, Sehgal CM. Can Artificial Intelligence Aid Diagnosis by Teleguided Point-of-Care Ultrasound? A Pilot Study for Evaluating a Novel Computer Algorithm for COVID-19 Diagnosis Using Lung Ultrasound. AI (Basel). 2023 Dec;4(4):875-887. Epub 2023 Oct 10. PMCID: PMC10623579. [CrossRef] [PubMed]
- Beshara M, Bittner EA, Goffi A, Berra L, Chang MG. Nuts and bolts of lung ultrasound: utility, scanning techniques, protocols, and findings in common pathologies. Crit Care. 2024 Oct 7;28(1):328. PMCID: PMC11460009. [CrossRef] [PubMed]
Figure 1.
Representative lung ultrasound frames extracted from the dataset. Two examples correspond to the cropped lower region (M-mode, motion mode) and two to the cropped upper region (B-mode, brightness mode), obtained after image pre-processing for model training.
Figure 1.
Representative lung ultrasound frames extracted from the dataset. Two examples correspond to the cropped lower region (M-mode, motion mode) and two to the cropped upper region (B-mode, brightness mode), obtained after image pre-processing for model training.
Figure 2.
Overview of the Vision Transformer (ViT) architecture, consisting of patch embedding, transformer encoder, and a multi-layer perceptron (MLP) head for classification.
Reproduced from Kittichai et al., 2024 [
30]
, licensed under CC BY-NC-ND 4.0.
Figure 2.
Overview of the Vision Transformer (ViT) architecture, consisting of patch embedding, transformer encoder, and a multi-layer perceptron (MLP) head for classification.
Reproduced from Kittichai et al., 2024 [
30]
, licensed under CC BY-NC-ND 4.0.
Figure 3.
Overview of the DINOv2 architecture, illustrating its backbone, feature extraction process, and classification head.
Reproduced from Kittichai et al., 2024 [
30]
, licensed under CC BY-NC-ND 4.0.
Figure 3.
Overview of the DINOv2 architecture, illustrating its backbone, feature extraction process, and classification head.
Reproduced from Kittichai et al., 2024 [
30]
, licensed under CC BY-NC-ND 4.0.
Figure 4.
Experimental workflow for pneumothorax detection using AI-assisted lung ultrasound.
Figure 4.
Experimental workflow for pneumothorax detection using AI-assisted lung ultrasound.
Figure 5.
Validation accuracy curves of transformer models for pneumothorax detection in Sce-nario 1. The “M-mode region” (previously referred to as the bottom region) corresponds to the mo-tion-mode area below the pleural line, while the “B-mode region” (previously referred to as the top region) represents the pleural line and overlying structures in brightness-mode imaging.
Figure 6.
Validation accuracy curves of transformer models for pneumothorax detection in Scenario 2. The “M-mode region” (previously referred to as the bottom region) corresponds to the motion-mode area below the pleural line, while the “B-mode region” (previously referred to as the top region) represents the pleural line and overlying structures in brightness-mode imaging.
Figure 7.
Confusion matrices of transformer models (DINOv2 and ViT) for pneumothorax detection in Scenario 1. Each cell shows classification accuracy as a percentage, with the corresponding absolute number of correctly classified cases over total cases in parentheses. Top-left = TN, top-right = FP, bottom-left = FN, bottom-right = TP.
Figure 8.
Confusion matrices of transformer models (DINOv2 and ViT) for pneumothorax detection in Scenario 2. Each cell shows classification accuracy as a percentage, with the corresponding absolute number of correctly classified cases over total cases in parentheses. Top-left = TN, top-right = FP, bottom-left = FN, bottom-right = TP.
Figure 9.
ROC analysis of transformer models (DINOv2 and ViT) for pneumothorax detection for all experiments.
Figure 9.
ROC analysis of transformer models (DINOv2 and ViT) for pneumothorax detection for all experiments.
Table 1.
Demographic and clinical characteristics of the study groups.
Table 1.
Demographic and clinical characteristics of the study groups.
| |
Pneumothorax (n=23) |
Healthy (n=23) |
p-value |
| Age, median (Q1-Q3) |
59 (41 - 65.5) |
55 (41 - 65.5) |
0.964 |
| Male, n (%) |
18 (78.3) |
18 (78.3) |
1 |
| BMI, median (Q1-Q3) |
23 (20.5 - 25.5) |
22 (21 - 27) |
0.658 |
| Right Sided, n (%) |
12 (52.2) |
13 (56.5) |
0.767 |
| Smoking, n (%) |
15 (65.2) |
16 (69.6) |
0.753 |
| COPD, n (%) |
8 (34.8) |
8 (34.8) |
1 |
Table 2.
Dataset information for Scenario 1 (random split) and Scenario 2 (patient-level split).
Table 2.
Dataset information for Scenario 1 (random split) and Scenario 2 (patient-level split).
| Dataset |
Scenario 1 |
Scenario 2 |
| Training |
342 (62%) |
312 (56.6%) |
| Validation |
99 (17.9%) |
120 (21.7%) |
| Test |
111 (20.1%) |
120 (21.7%) |
| Total |
552 (100%) |
552 (100%) |
Table 3.
Hyperparameters used for training the transformer architectures.
Table 3.
Hyperparameters used for training the transformer architectures.
| Learning rate |
0.001 |
| Optimizer |
Adam |
| Loss function |
Mean Squared Error |
| Weight decay |
0.0001 |
| Batch size |
256 |
| num_epochs |
30 |
| Image size |
72 |
| Patch size |
6 |
Table 4.
Comparative performance of transformer models (DINOv2 and ViT) in pneumothorax classification across Scenario 1 and Scenario 2 using M-mode and B-mode image regions.
Table 4.
Comparative performance of transformer models (DINOv2 and ViT) in pneumothorax classification across Scenario 1 and Scenario 2 using M-mode and B-mode image regions.
| Scenario |
Mode |
Models |
Acc |
Rec |
Pre |
F1-score |
| 1 |
M-mode |
DinoV2 |
95.5 |
90.91 |
100.0 |
95.24 |
| ViT |
81.98 |
69.09 |
92.68 |
79.17 |
| B-mode |
DinoV2 |
97.3 |
94.55 |
100.0 |
97.2 |
| ViT |
99.1 |
98.21 |
100.0 |
99.1 |
| 2 |
M-mode |
DinoV2 |
80.0 |
75.0 |
83.33 |
78.95 |
| ViT |
70.0 |
80.0 |
66.67 |
72.73 |
| B-mode |
DinoV2 |
90.0 |
80.0 |
100.0 |
88.89 |
| ViT |
87.5 |
75.0 |
100.0 |
85.71 |
|
Disclaimer/Publisher’s Note: The statements, opinions and data contained in all publications are solely those of the individual author(s) and contributor(s) and not of MDPI and/or the editor(s). MDPI and/or the editor(s) disclaim responsibility for any injury to people or property resulting from any ideas, methods, instructions or products referred to in the content. |
© 2025 by the authors. Licensee MDPI, Basel, Switzerland. This article is an open access article distributed under the terms and conditions of the Creative Commons Attribution (CC BY) license (http://creativecommons.org/licenses/by/4.0/).