
Submitted:
11 March 2023
Posted:
13 March 2023
You are already at the latest version
Preprints on COVID-19 and SARS-CoV-2
Abstract
A machine learning method for classifying Lung UltraSound is here proposed to pro-
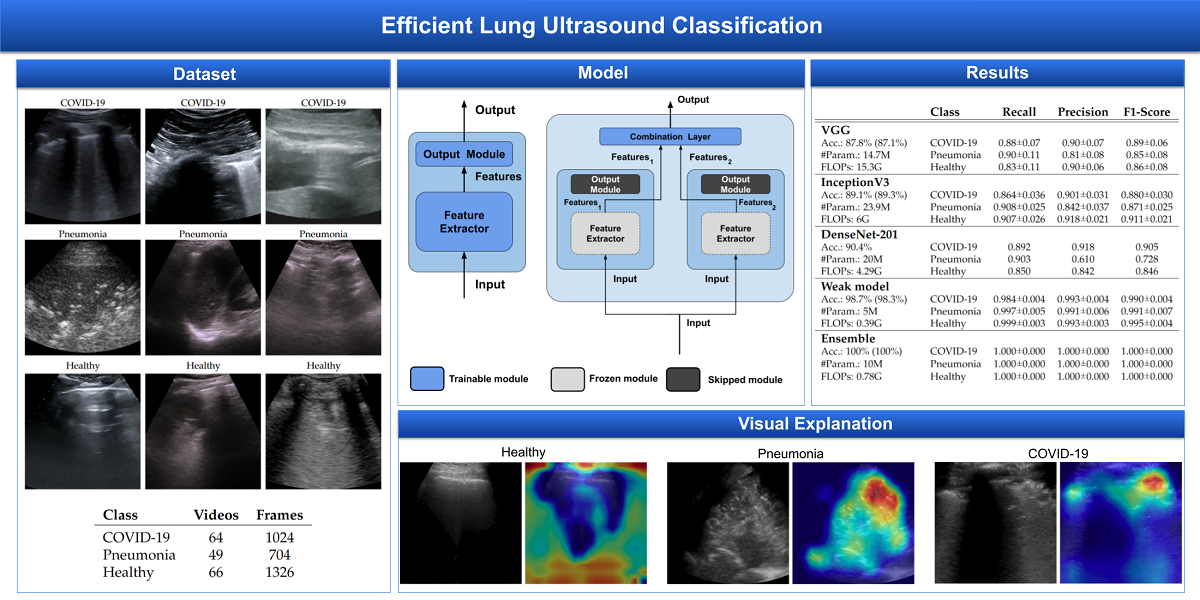
vide a point of care tool for supporting a safe, fast and accurate diagnosis, that can also be useful during a pandemic like as SARS-CoV-2. Given the advantages (e.g. safety, rapidity, portability, cost-effectiveness) provided by the ultrasound technology over other methods (e.g. X-ray, computer tomography, magnetic resonance imaging), our method was validated on the largest LUS public dataset. Focusing on both accuracy and efficiency, our solution is based on an efficient adaptive ensembling of two EfficientNet-b0 models reaching 100% of accuracy, which, to our knowledge, outperforms the previous state-of-the-art. The complexity of this solution keeps the number of parameters in the same order as an EfficientNet-b0 by adopting specific design choices that are adaptive ensembling with a combination layer, ensembling performed on the deep features, minimal ensemble only two weak models. Moreover, a visual analysis of the saliency maps on sample images of all the classes of the dataset reveals where the focus is on an inaccurate weak model versus an accurate model.
Keywords:
Convolutional Neural Networks
; EfficientNet
; Lung Ultrasound
; SARS-CoV-2
; COVID-19
; Pneumonia
; Ensemble
; Computer Vision
; Supervised Learning
; Deep Learning
1. Introduction
Artificial Intelligence (AI) and specifically Computer Vision, is having remarkable developments in recent years, allowing software programs to obtain meaningful information from digital images. Medicine is a sector in which the experimentation and use of this technology are experiencing strong growth [1,2,3]. Also, considering that in the year 2020, only in the United States of America, a production of 600 million images was reported [4] and that this number seems to grow steadily, it is increasingly necessary to process this data using robust and trustworthy algorithms developed through the collaboration of medical staff, engineers, and physics at different levels. The SARS-CoV-2 pandemic has again highlighted the need for a quick and safe response, as well as cheap, and to this aim, one of the most peculiar case studies that emerged is the use of point-of-care ultrasound (POCUS) to detect SARS-CoV-2 pneumonia, that is the use of sonography exams in loco instead of dedicated facility [5,6]. In general, the preferred methods to assess pulmonary diseases are both X-Ray or Computed Tomography (CT) due to their high image quality and diagnostic power. Nonetheless, ultrasound appears to detect signs of pathologies in the lung as well or better than CT [7,8,9,10,11]. Even, in some cases, there is a directed mapping between evidence found by ultrasound and CT [12]. The necessities dictated by the SARS-CoV-2 pandemic moved the attention from a precision diagnostic approach to one that aims to maximize a trade-off between accuracy, time, and safety, crucial aspects in “a real emergency situation”. Physicians and researchers around the world adapted their point-of-view towards a direction where the employment of lung POCUS seemed a natural solution for both quarantine subjects and hospitalized ones [8,13,14]. Naturally, CT and Magnetic Resonance Imaging (MRI) are far more precise and reliable exams, but both have downsides which cannot be ignored. Specifically for CT, a notable downside is the associated ionizing radiation, while both exams are more time-consuming and affected by subject cooperation. In the case of POCUS, the trade-off between pros and cons is hugely in favour of the former: it is portable, safe, cheap and repeatable for a lot of medical fields. As a downside, the generated images are noisy and deeply affected by operator experience so interpretation can be less direct than CT or MRI. Artificial Intelligence can be used to narrow this gap; before 2019 [15], deep learning methods were used on ultrasound datasets efficiently [16,17], but not specifically on lung disease detection. In the aftermath of the SARS-CoV-2 pandemic, an increase in articles about this topic can be noted. The underlying reasons are evident: necessity, scientific purpose and a new abundance of data.
In medicine, deep learning algorithms applications are mainly used for classification and segmentation tasks, and, as emerge from recent literature reviews [15,18], they seem to perform efficiently in the field of lung ultrasound. The study about classification focuses above all on the use of AI to discriminate between chest ultrasound images of healthy and pneumonia-afflicted subjects [19]. The vast majority of these studies investigate the possibility of discerning between SARS-CoV-2 and bacterial pneumonia [20]. Among the most performing approaches [11] employs a transfer learning approach, pre-training a network with a more consistent lung CT/MRI dataset. Segmentation approaches studies mostly focus on the detection of bio-markers [21] and signs that are important in POCUS diagnosis (A-lines, B-lines, etc...)[22] Most recent and interesting works provide solutions to discriminate LUS among healthy, pneumonia and SARS-CoV-2 conditions with good results [23,24] and the work described in [25] also provides an explanation of results. Since the classification of medical images entails decisions and actions involving human beings, it is crucial that the system is secure and understandable, that it is used as a second reading and that the final decision must be taken by a clinician. To this aim, an explanation of the results obtained by an automatic system must also be provided. Indeed, the use of POCUS as a diagnostic tool was an argument of debate [9,26,27].
In this paper, we aim to introduce new methods and models for the analysis of LUS images to distinguish between SARS-CoV-2, pneumonia and healthy conditions. The proposed new model, using EfficientNet-b0 [28] as a core, is based on a recent strategy for ensembling at the deep features level [29,30]. It reaches a state-of-the-art (SOTA) accuracy of 100% on a well-known public reference dataset. The proposed model is computationally efficient with a relatively low number of parameters and Floating Point Operations (FLOPs), making it applicable in principle for real-time operation in the point-of-care scenario. As an additional contribution, the explainability of the ensemble model is investigated with a preliminary analysis of activation maps. Such research contributes to understanding models and providing visual explanations of the obtained results.
2. Materials and Methods
2.1. Dataset
The dataset used for this task is, to our knowledge, the largest publicly available LUS (Lung UltraSound) dataset1, comprising ultrasound videos and images from 261 different patients among 41 different sources. The data have been collected, cleaned and reviewed by medical experts. In particular, for the sake of this work, we used the frame-based version when the frames of each video are considered. In Table 1 data distribution is described and some examples for each class are shown in Figure 1. More details about the whole dataset (e.g. patient distribution, acquisition technique, sources) are described both in the article [25] and in the GitHub repository of the project.
2.2. Validation pipeline
First of all, end-to-end training using transfer learning [31] from ImageNet pre-trained models [32] is performed, and then the ensemble is fine-tuned. The description of details follows.
2.2.1. EfficientNet
Since ultrasound has the advantage to be processed in real-time, the efficiency of the processing plays a crucial role. For this reason, in this work EfficientNet-b0 [28] is used as a core model because, in our opinion and based on previous data [29], it is the architecture with the best accuracy/complexity trade-off. The efficiency of this architecture is given by two main factors: (i) the inverted bottleneck MBConv (first introduced in MobileNetV2) as a core module, which expands and compresses channels reducing the complexity of convolution and (ii) the compound scaling by which input, width and depth scaling are performed in conjunction since it is observed that they are dependent.
2.2.2. Hyperparameters
After a previous investigation, in order to reduce the search space, some hyperparameters have been fixed:
- Input size:
- set to 512×512 because it is the best resolution in order to have less computational cost without losing image details.
- Batch size:
- set to the maximum available using our GPU (32GB RAM) which is 50 for end-to-end and 200 for fine-tuning.
- Regularization:
- to prevent overfitting early-stopping is used, and patience is set at 10, because deep models have relatively fast convergence and they usually start overfitting early, no more patience is needed.
- Optimizer:
- AdaBelief [33] with learning rate , betas (0.9, 0.999), eps , using weight decoupling without rectifying, to have both fast convergence and generalization.
- Validation metric:
- Weighted F1-score which better takes into account both errors and data imbalance.
- Dataset split:
- 75/10/15 respectively for train/valid/test subsets.
- Standardization:
- data are processed in order to belong to a distribution with values around the mean and unit standard deviation, improving stability and convergence of the training.
Then a grid search on the following hyperparameters is performed:
- Seeds:
- 5 seeds are used for the end-to-end training (seeds affect both subset splitting and classification layer initialization) and 5 seeds for ensemble the fine-tuning (affecting the combination layer initialization only);
- Interpolation:
- bilinear, bicubic and Lanczos for both end-to-end and fine-tuning.
2.2.3. Efficient Adaptive Ensemble
Ensembling is the way of combining two or more models (i.e. weak models) in order to have a new combined model better than the weak ones [34]. In this work, ensembling is performed in this way:
- select the best two end-to-end trained models (i.e. weak models);
- remove the classification layers of the weak models;
- freeze the parameters of the weak models;
- initialize a fresh combination linear layer;
- train the ensemble model (i.e. fine-tune the combination layer) by usual gradient descent.
This kind of ensemble is (i) efficient because only the combination layer is fine-tuned and there are just two weak models that can be executed in parallel since their processing is independent and (ii) adaptive since the ensemble and, especially, its combination layer are trained according to the data.
3. Results
For the sake of robustness and comparability with the SOTA, experiments have been performed using Stratified 5-fold Cross Validation, keeping the frames of a single video belonging to one fold only and having the number of videos per class similar in all folds. In this way, every fold is treated as an independent task as described in Section 2.2.
The result on the single folds are reported in Table 2, Table 3, Table 4, Table 5 and Table 6 showing that Ensemble obtains 100% accuracy at every run in all folds, then since now we focus on end-to-end weak models results. Fold 1 (Table 2) seems to be the hardest having no runs with 100% at every subset, the Fold 2 (Table 3) is the easiest with 100% accuracy at every run while the remaining folds are in the "average".
Last but not least, according to Table 8, the proposed method improves the SOTA, reducing the number of parameters and FLOPS.
4. Discussion
Dataset issues were extensively discussed in its official presentation paper [25]. The method here presented for classifying COVID-19, Pneumonia and Healthy lung ultrasounds outperforms the SOTA: its importance is in terms of the number of parameters and on complexity that are lower than other methods, pointing the way to an efficient and fast classification system that can be embedded in real-time scenarios. On one side, the dataset used is undoubtedly the biggest one publicly available; on the other side, it would be better to test the proposed method on even larger and more heterogeneous datasets to prove its validity.
To better understand the behaviour of our model, we applied the Gradient-weighted Class Activation Mapping (GradCAM)[35] algorithm producing visual explanations: as the saliency maps show, our model seems to produce reasonable explanations since in all the cases it is focusing on meaningful areas. On the other side, when we apply the same method to weak models which didn’t obtain the 100% of accuracy, it is clear that the model concentrates on areas of the LUS that are less or not important. Indeed, we generally noticed that an accurate classification focus on (see a representative example in Figure 2):
- “evidence” usually at the upper side of the image and concentrated activations in case of COVID-19;
- “evidence” everywhere (mainly lower part) with relaxed activation in case of Pneumonia;
- mainly the healthy part of the lung (black) with very expanded activation in the case of Healthy.
5. Conclusions
An artificial intelligence method was presented to classify LUS videos into healthy, COVID-19 or Pneumonia automatically: the proposed method matches both advantages (e.g. portability, safety) and disadvantages (e.g. challenging interpretation) of LUS. An efficient adaptive ensembling model based on two EfficientNet-b0 weak models achieved an accuracy of 100% on the largest publicly available LUS dataset, improving the performance with respect to the previous SOTA, maintaining the same order of magnitude of an EfficientNet-b0 model. Saliency maps were presented, showing that the proposed network uses significant areas of the LUS images to discern between the analysed class. Future investigations will focus on further improving our adaptive efficient ensembling model and applying it to classify other important signs in LUS we are acquiring in an ongoing telemedicine project [36].
Author Contributions
Conceptualization, A.B., G.I., O.S., D.M., M.M.; methodology, A.B., G.I., O.S., D.M., M.M.; software, A.B., M.M.; validation, A.B., G.I., O.S., D.M., M.M.; formal analysis, A.B., G.I., O.S., D.M., M.M.; investigation, A.B., G.I., O.S., D.M., M.M.; resources, A.B., G.I., O.S., D.M., M.M.; data curation, A.B., M.M.; writing—original draft preparation, A.B., G.I., D.M., M.M.; writing—review and editing, A.B., G.I., O.S., D.M., M.M.; visualization, A.B., G.I., O.S., D.M., M.M.; supervision, A.B., G.I., O.S., D.M., M.M.; project administration, D.M. and M.M.; . All authors have read and agreed to the published version of the manuscript.
Institutional Review Board Statement
Not applicable.
Informed Consent Statement
Not applicable.
Data Availability Statement
Data used in this work is publicly available at https://github.com/jannisborn/covid19_ultrasound.
Conflicts of Interest
The authors declare no conflict of interest.
Abbreviations
The following abbreviations are used in this manuscript:
| AI | Artificial Intelligence |
| CT | Computed Tomography |
| FLOP | Floating Point Operation |
| LUS | Lung UltraSound |
| MRI | Magnetic Resonance Imaging |
| POCUS | Point Of Care UltraSound |
| SOTA | State-Of-The-Art |
References
- Born, J.; Wiedemann, N.; Cossio, M.; Buhre, C.; Brändle, G.; Leidermann, K.; Aujayeb, A.; Moor, M.; Rieck, B.; Borgwardt, K. Accelerating Detection of Lung Pathologies with Explainable Ultrasound Image Analysis. Appl. Sci. 2021, 11, 672. [Google Scholar] [CrossRef]
- Vollmer, S.; Mateen, B.A.; Bohner, G.; Király, F.J.; Ghani, R.; Jonsson, P.; Cumbers, S.; Jonas, A.; McAllister, K.S.L.; Myles, P.; et al. Machine learning and artificial intelligence research for patient benefit: 20 critical questions on transparency, replicability, ethics, and effectiveness. BMJ 2020, 368, https. [Google Scholar] [CrossRef] [PubMed]
- Briganti, G.; Le Moine, O. Artificial intelligence in medicine: Today and tomorrow. Front. Med. 2020, 7, 27. [Google Scholar] [CrossRef]
- Vidhyalakshmi, A.; Priya, C. Chapter 1 - Medical big data mining and processing in e-health care. In An Industrial IoT Approach for Pharmaceutical Industry Growth; Balas, V.E.; Solanki, V.K.; Kumar, R., Eds.; Academic Press, 2020; pp. 1–30. [CrossRef]
- Moore, C.L.; Copel, J.A. Point-of-care ultrasonography. New Engl. J. Med. 2011, 364, 749–757. [Google Scholar] [CrossRef] [PubMed]
- Díaz-Gómez, J.L.; Mayo, P.H.; Koenig, S.J. Point-of-care ultrasonography. New Engl. J. Med. 2021, 385, 1593–1602. [Google Scholar] [CrossRef] [PubMed]
- Pare, J.R.; Camelo, I.; Mayo, K.C.; Leo, M.M.; Dugas, J.N.; Nelson, K.P.; Baker, W.E.; Shareef, F.; Mitchell, P.M.; Schechter-Perkins, E.M. Point-of-care lung ultrasound is more sensitive than chest radiograph for evaluation of COVID-19. West. J. Emerg. Med. 2020, 21, 771. [Google Scholar] [CrossRef]
- Buonsenso, D.; Pata, D.; Chiaretti, A. COVID-19 outbreak: Less stethoscope, more ultrasound. Lancet Respir. Med. 2020, 8, e27. [Google Scholar] [CrossRef]
- Soldati, G.; Smargiassi, A.; Inchingolo, R.; Buonsenso, D.; Perrone, T.; Briganti, D.F.; Perlini, S.; Torri, E.; Mariani, A.; Mossolani, E.E.; et al. Is there a role for lung ultrasound during the COVID-19 pandemic? J. Ultrasound Med. 2020, 39, 1459. [Google Scholar] [CrossRef]
- Sofia, S.; Boccatonda, A.; Montanari, M.; Spampinato, M.; D’ardes, D.; Cocco, G.; Accogli, E.; Cipollone, F.; Schiavone, C. Thoracic ultrasound and SARS-COVID-19: A pictorial essay. J. Ultrasound 2020, 23, 217–221. [Google Scholar] [CrossRef]
- Horry, M.; Chakraborty, S.; Paul, M.; Ulhaq, A.; Pradhan, B.; Saha, M.; Shukla, N. COVID-19 Detection through Transfer Learning using Multimodal Imaging Data. IEEE Access 2020, PP, 1–1. [Google Scholar] [CrossRef]
- Fiala, M. Ultrasound in COVID-19: A timeline of ultrasound findings in relation to CT. Clin. Radiol. 2020, 75, 553–554. [Google Scholar] [CrossRef] [PubMed]
- Smith, M.; Hayward, S.; Innes, S.; Miller, A. Point-of-care lung ultrasound in patients with COVID-19–a narrative review. Anaesthesia 2020, 75, 1096–1104. [Google Scholar] [CrossRef]
- Coimbra, R.; Edwards, S.; Kurihara, H.; Bass, G.A.; Balogh, Z.J.; Tilsed, J.; Faccincani, R.; Carlucci, M.; Martínez Casas, I.; Gaarder, C.; et al. European Society of Trauma and Emergency Surgery (ESTES) recommendations for trauma and emergency surgery preparation during times of COVID-19 infection. Eur. J. Trauma Emerg. Surg. 2020, 46, 505–510. [Google Scholar] [CrossRef]
- Zhao, L.; Bell, M.A.L. A Review of Deep Learning Applications in Lung Ultrasound Imaging of COVID-19 Patients. BME Front. 2022, 2022, https. [Google Scholar] [CrossRef]
- Liu, S.; Wang, Y.; Yang, X.; Lei, B.; Liu, L.; Li, S.X.; Ni, D.; Wang, T. Deep learning in medical ultrasound analysis: A review. Engineering 2019, 5, 261–275. [Google Scholar] [CrossRef]
- Van Sloun, R.J.; Cohen, R.; Eldar, Y.C. Deep learning in ultrasound imaging. Proc. IEEE 2019, 108, 11–29. [Google Scholar] [CrossRef]
- Wang, J.; Yang, X.; Zhou, B.; Sohn, J.J.; Zhou, J.; Jacob, J.T.; Higgins, K.A.; Bradley, J.D.; Liu, T. Review of Machine Learning in Lung Ultrasound in COVID-19 Pandemic. J. Imaging 2022, 8. [Google Scholar] [CrossRef] [PubMed]
- Huang, S.; Yang, J.; Fong, S.; Zhao, Q. Artificial intelligence in the diagnosis of COVID-19: Challenges and perspectives. Int. J. Biol. Sci. 2021, 17, 1581. [Google Scholar] [CrossRef]
- Karnes, M.; Perera, S.; Adhikari, S.; Yilmaz, A. Adaptive Few-Shot Learning PoC Ultrasound COVID-19 Diagnostic System. In Proceedings of the 2021 IEEE Biomedical Circuits and Systems Conference (BioCAS). IEEE; 2021; pp. 1–6. [Google Scholar] [CrossRef]
- Roy, S.; Menapace, W.; Oei, S.; Luijten, B.; Fini, E.; Saltori, C.; Huijben, I.; Chennakeshava, N.; Mento, F.; Sentelli, A.; et al. Deep learning for classification and localization of COVID-19 markers in point-of-care lung ultrasound. IEEE Trans. Med Imaging 2020, 39, 2676–2687. [Google Scholar] [CrossRef]
- Gare, G.R.; Schoenling, A.; Philip, V.; Tran, H.V.; Bennett, P.d.; Rodriguez, R.L.; Galeotti, J.M. Dense pixel-labeling for reverse-transfer and diagnostic learning on lung ultrasound for COVID-19 and pneumonia detection. In Proceedings of the 2021 IEEE 18th International Symposium on Biomedical Imaging (ISBI). IEEE; 2021; pp. 1406–1410. [Google Scholar] [CrossRef]
- Diaz-Escobar, J.; Ordóñez-Guillén, N.E.; Villarreal-Reyes, S.; Galaviz-Mosqueda, A.; Kober, V.; Rivera-Rodriguez, R.; Lozano Rizk, J.E. Deep-learning based detection of COVID-19 using lung ultrasound imagery. PLoS ONE 2021, 16, 1–21. [Google Scholar] [CrossRef]
- Sadik, F.; Dastider, A.G.; Fattah, S.A. SpecMEn-DL: Spectral mask enhancement with deep learning models to predict COVID-19 from lung ultrasound videos. Health Inf. Sci. Syst. 2021, 9. [Google Scholar] [CrossRef]
- Born, J.; Wiedemann, N.; Cossio, M.; Buhre, C.; Brändle, G.; Leidermann, K.; Aujayeb, A.; Moor, M.; Rieck, B.; Borgwardt, K. Accelerating Detection of Lung Pathologies with Explainable Ultrasound Image Analysis. Appl. Sci. 2021, 11, 672. [Google Scholar] [CrossRef]
- Haseli, S.; Iranpour, P.; et al. Lung ultrasound in COVID-19 pneumonia: Prospects and limitations. Acad. Radiol. 2020, 27, 1044–1045. [Google Scholar]
- Meroi, F.; Orso, D.; Vetrugno, L.; Bove, T. Lung ultrasound score in critically ill COVID-19 patients: A waste of time or a time-saving tool? Acad. Radiol. 2021, 28, 1323. [Google Scholar] [CrossRef]
- Tan, M.; Le, Q. EfficientNet: Rethinking Model Scaling for Convolutional Neural Networks. In Proceedings of the Proceedings of the 36th International Conference on Machine Learning; Chaudhuri, K.; Salakhutdinov, R., Eds. PMLR, 2019, Vol. 97. In Proceedings of Machine Learning Research; pp. 6105–6114.
- Bruno, A.; Moroni, D.; Martinelli, M. Efficient Adaptive Ensembling for Image Classification. arXiv 2022, arXiv:2206.07394. [Google Scholar]
- Bruno, A.; Martinelli, M.; Moroni, D. Exploring Ensembling in Deep Learning. Pattern Recognit. Image Anal. 2022, 32, 519–521. [Google Scholar] [CrossRef]
- Weiss, K.; Khoshgoftaar, T.; Wang, D. A survey of transfer learning. J. Big Data 2016, 3. [Google Scholar] [CrossRef]
- Deng, J.; Dong, W.; Socher, R.; Li, L.; Kai, Li.; Li, F.-F. ImageNet: A large-scale hierarchical image database. In Proceedings of the 2009 IEEE Conference on Computer Vision and Pattern Recognition; 2009; pp. 248–255. [Google Scholar] [CrossRef]
- Zhuang, J.; Tang, T.; Ding, Y.; Tatikonda, S.; Dvornek, N.; Papademetris, X.; Duncan, J. AdaBelief Optimizer: Adapting Stepsizes by the Belief in Observed Gradients. Conference on Neural Information Processing Systems 2020, 33, 18795–18806. [Google Scholar] [CrossRef]
- Opitz, D.W.; Maclin, R. Popular Ensemble Methods: An Empirical Study. J. Artif. Intell. Res. 1999, 11, 169–198. [Google Scholar] [CrossRef]
- Selvaraju, R.R.; Cogswell, M.; Das, A.; Vedantam, R.; Parikh, D.; Batra, D. Grad-CAM: Visual Explanations from Deep Networks via Gradient-Based Localization. Int. J. Comput. Vis. 2020, 128, 336–359. [Google Scholar] [CrossRef]
- Ignesti, G.; Bruno, A.; Deri, C.; D’Angelo, G.; Bastiani, L.; Pratali, L.; Memmini, S.; Cicalini, D.; Dini, A.; Galesi, G.; et al. An intelligent platform of services based on multimedia understanding&telehealth for supporting the management of SARS-CoV-2 multi-pathological patients. In Proceedings of the SITIS 2022 - 16th International Conference on Signal Image Technology & Internet-Based Systems, Dijon, France, New York, USA, 2022., 18-22/10/2022. IEEE. [Google Scholar] [CrossRef]
| 1 |
Figure 1.
some COVID-19 (first row), Pneumonia (second row) and Healthy (third row) samples from the dataset. As can be seen the images, even among the same class, are very heterogeneous, and there is no kind of bias (e.g. pattern, color).
Figure 1.
some COVID-19 (first row), Pneumonia (second row) and Healthy (third row) samples from the dataset. As can be seen the images, even among the same class, are very heterogeneous, and there is no kind of bias (e.g. pattern, color).
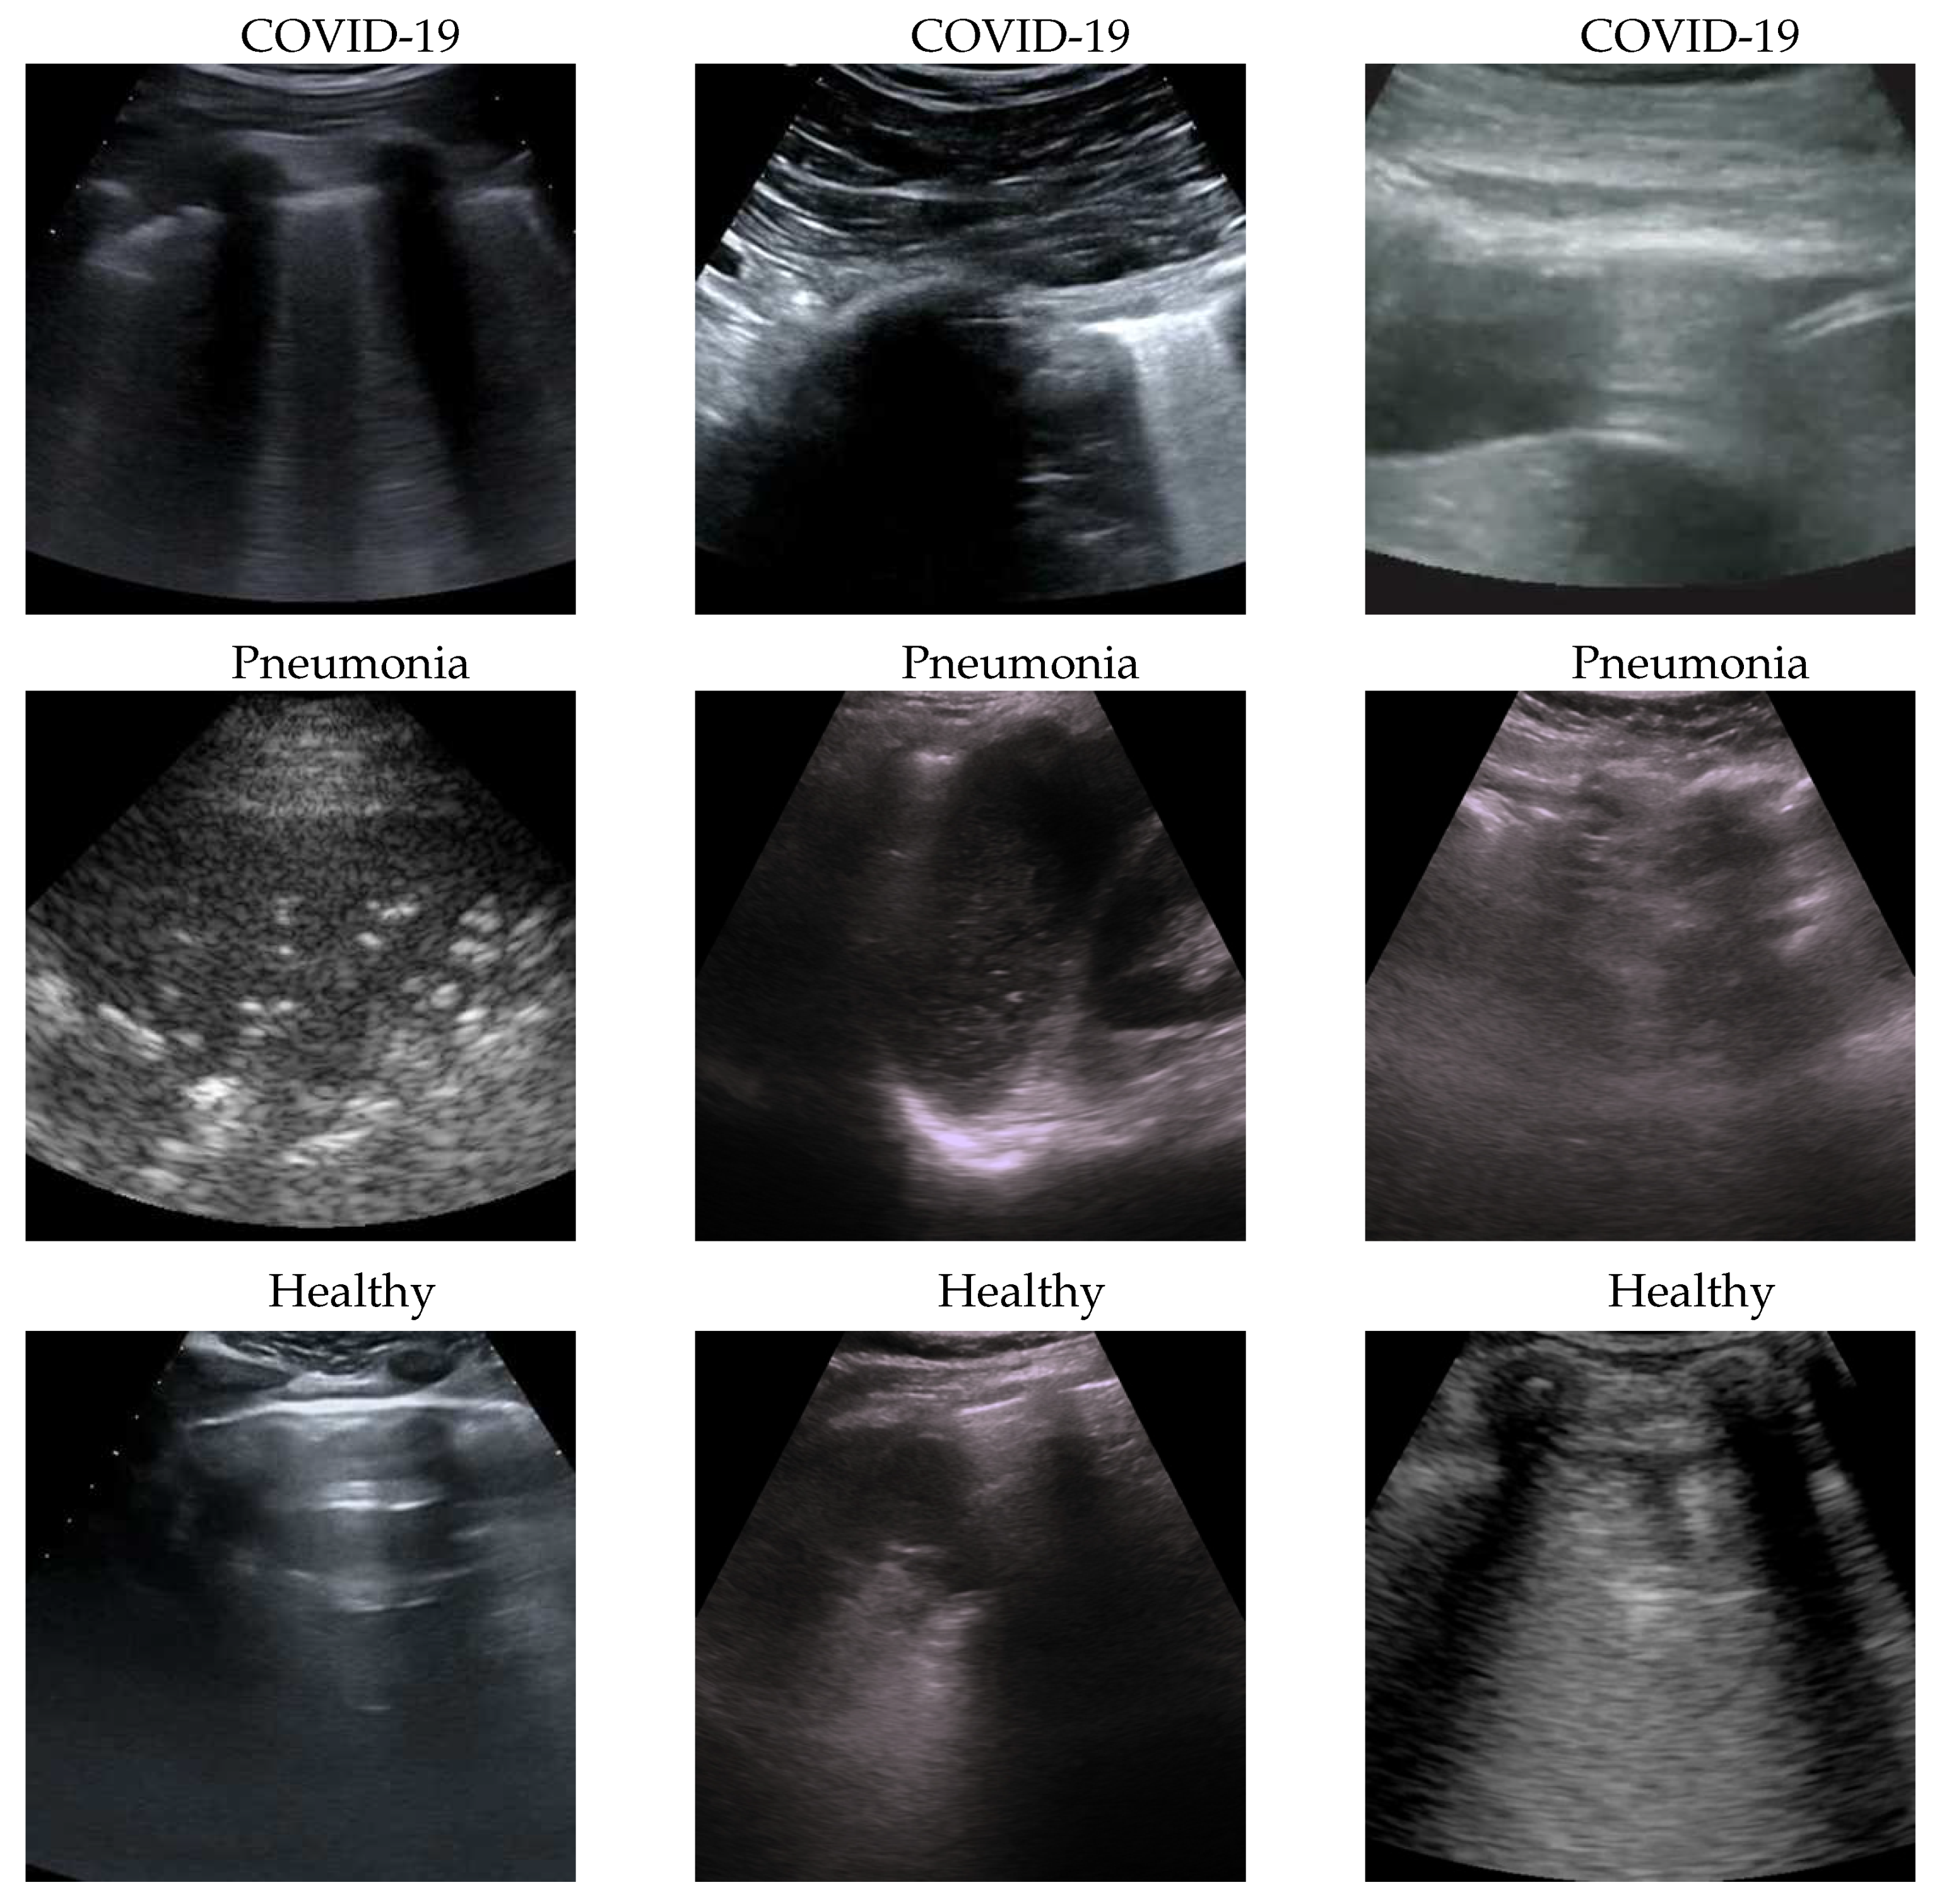
Figure 2.
Healthy (first row), Pneumonia (second row) and COVID-19 (third row) samples from the dataset and their saliency map. Red (higher) to blue (lower) scale.
Figure 2.
Healthy (first row), Pneumonia (second row) and COVID-19 (third row) samples from the dataset and their saliency map. Red (higher) to blue (lower) scale.
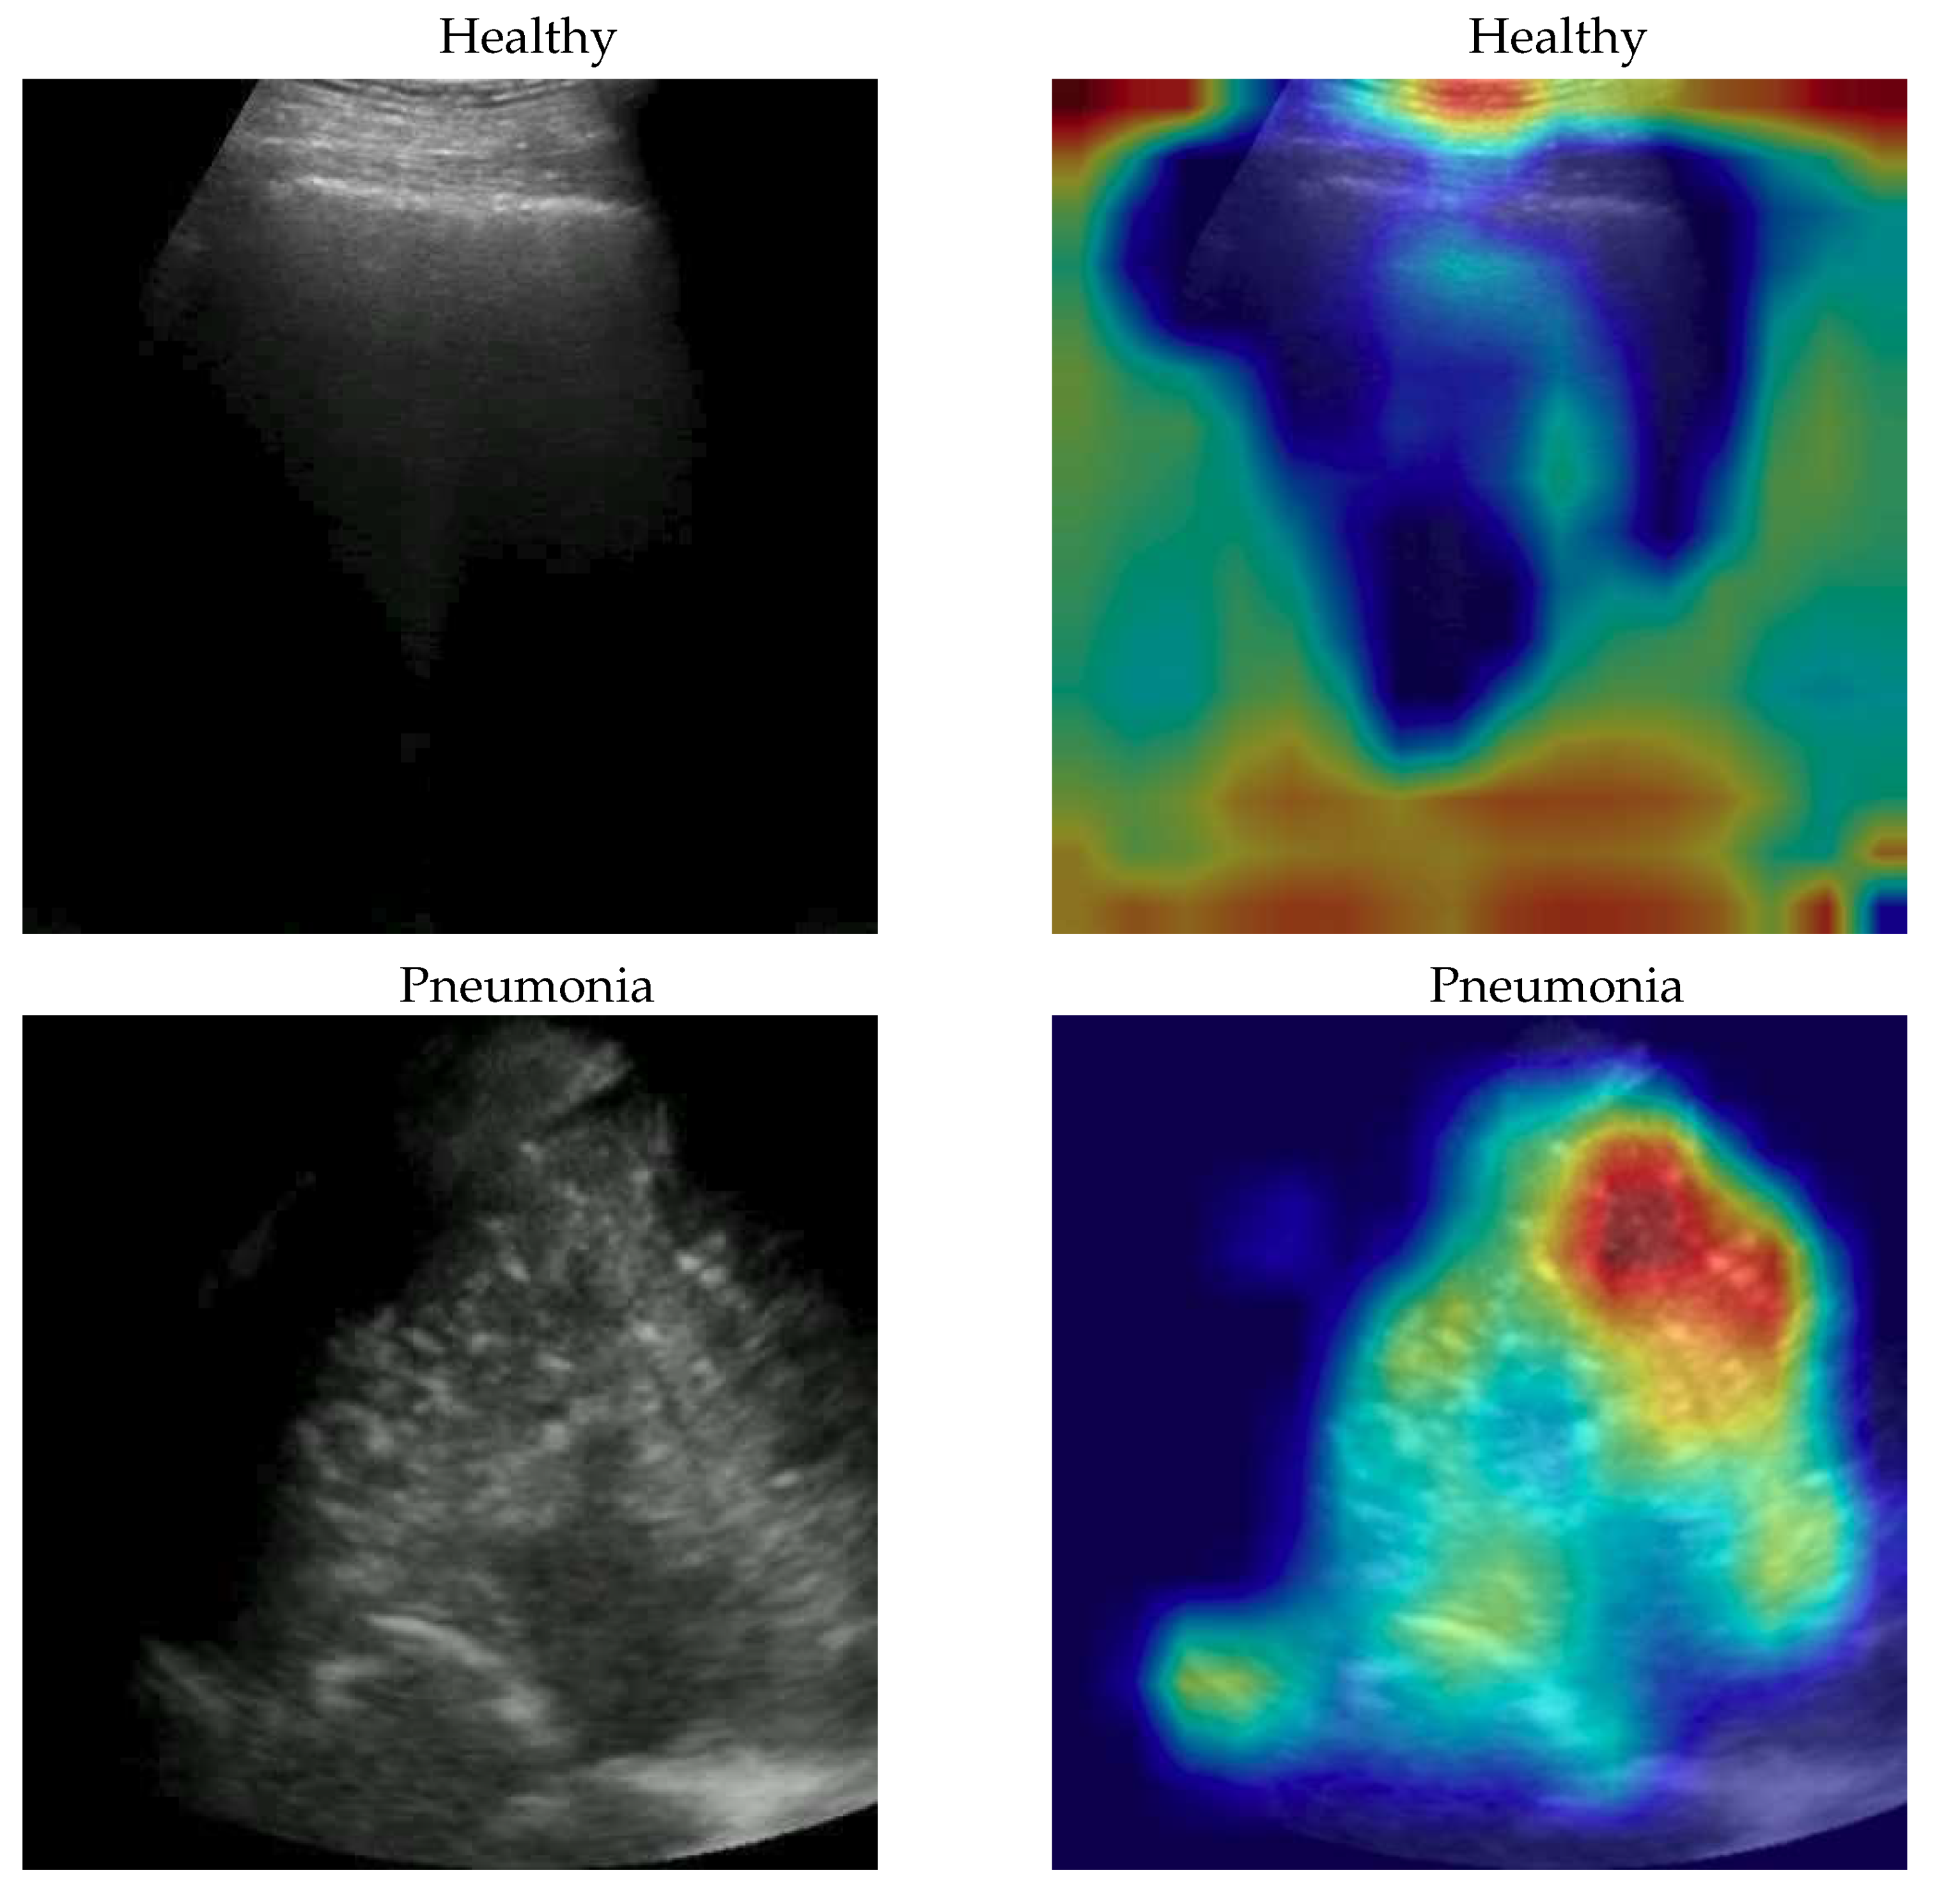
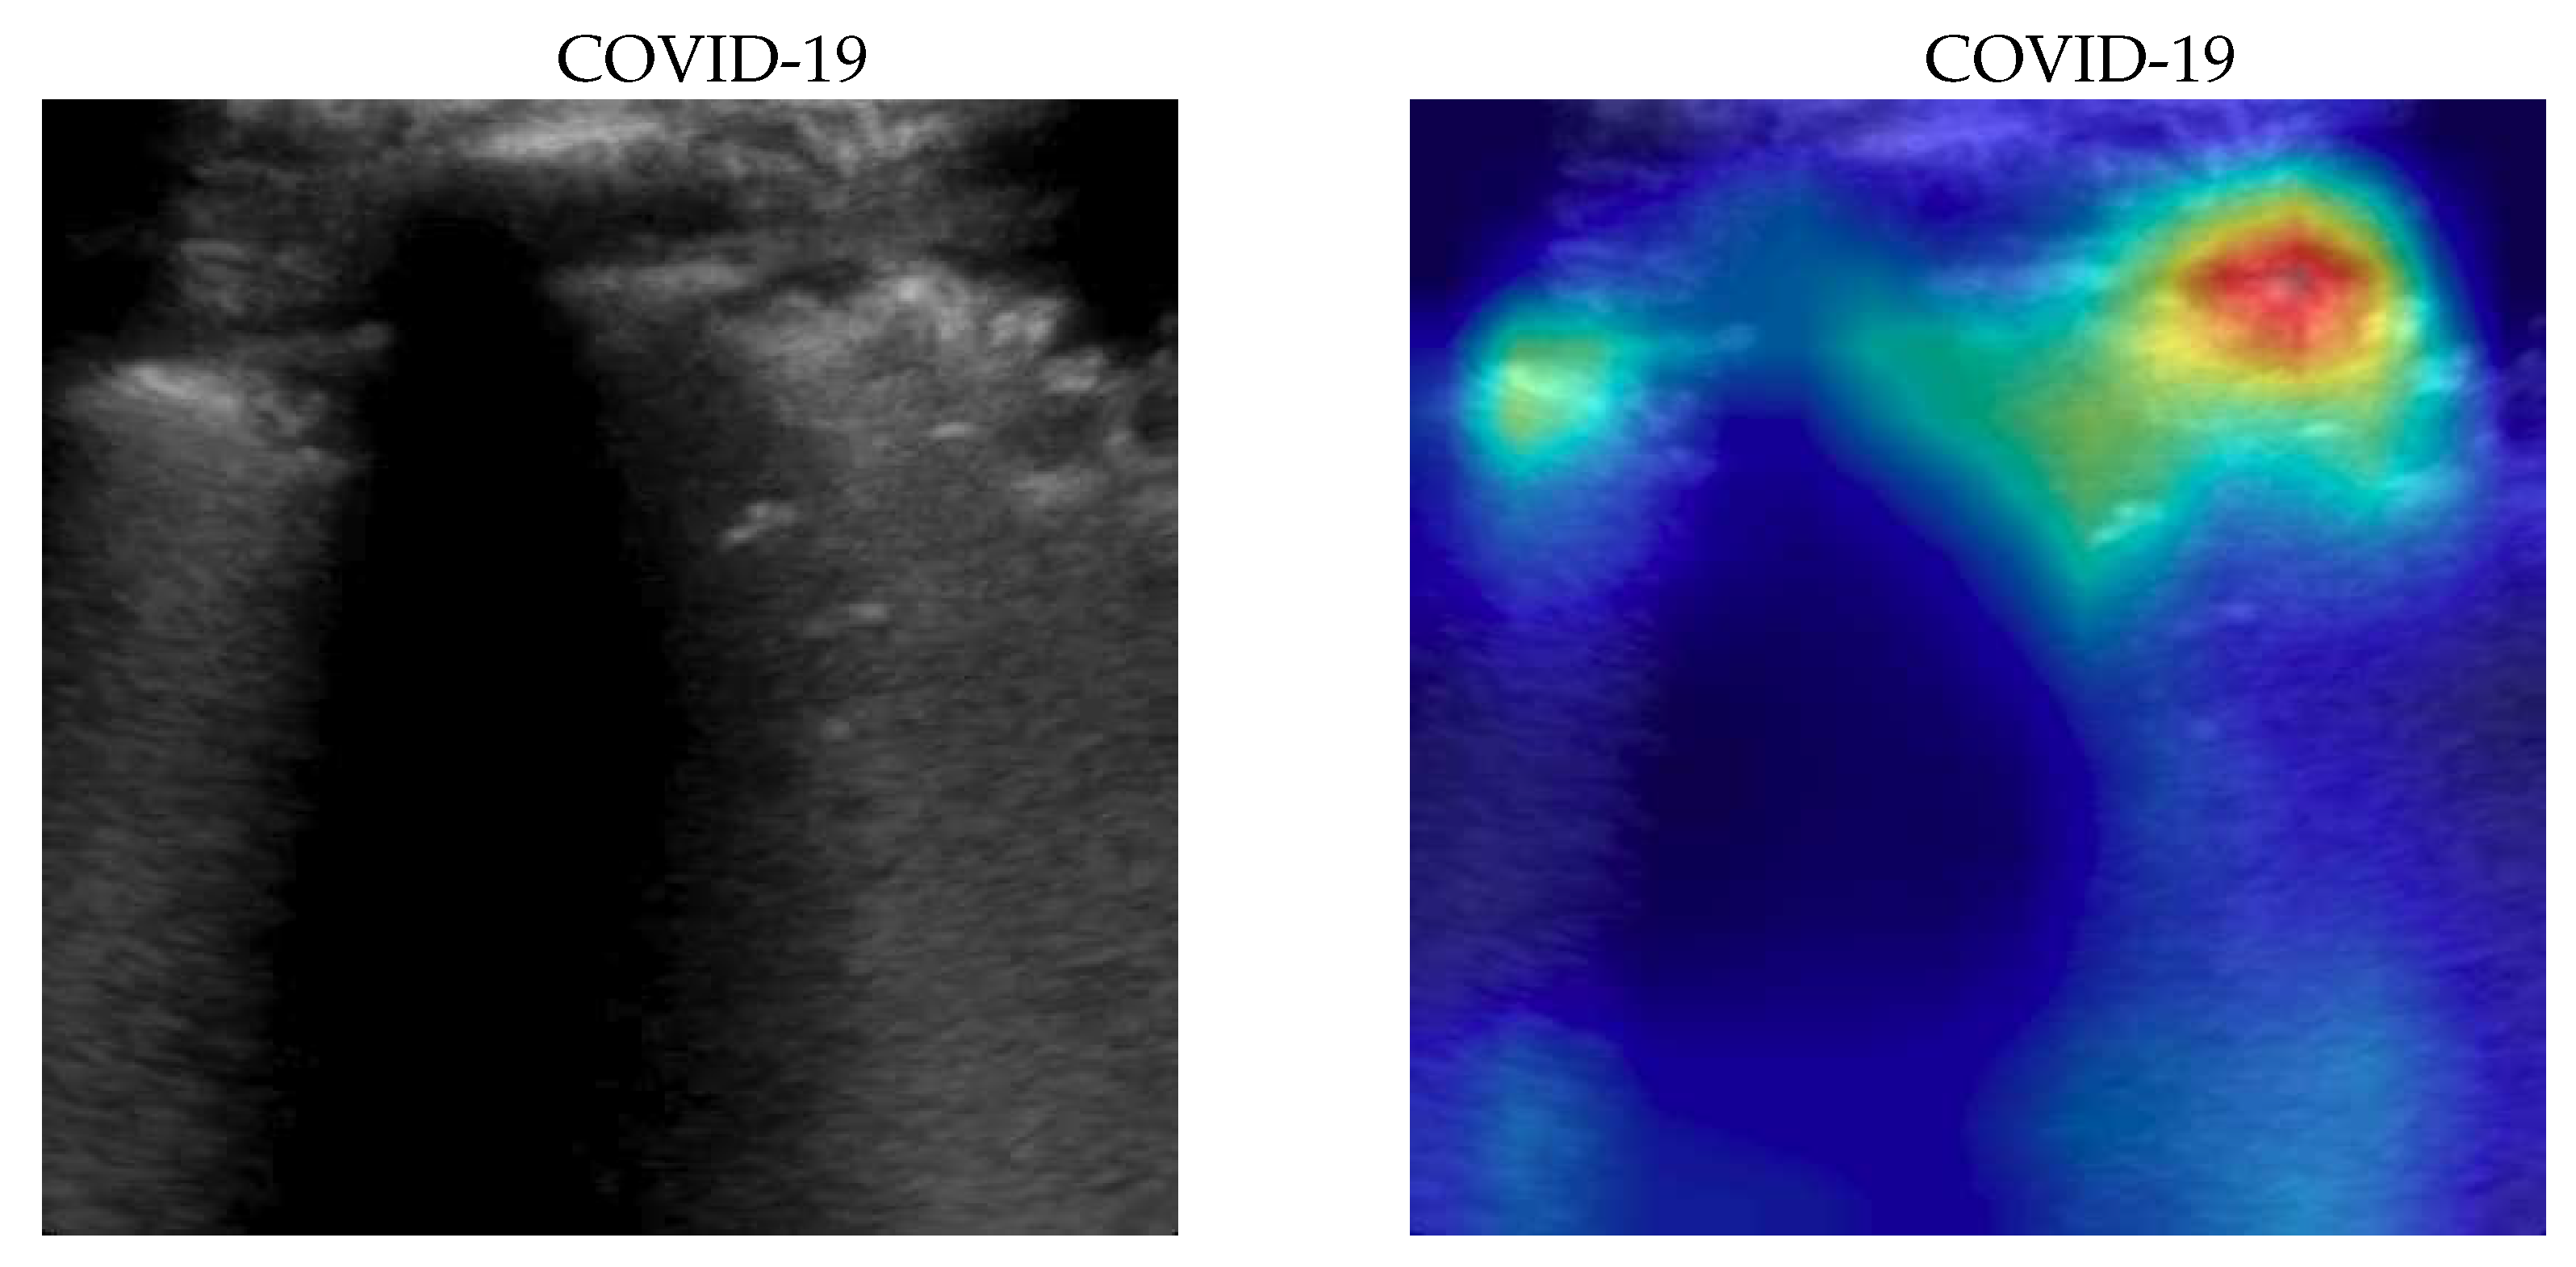
Figure 3.
Classification of a COVID-19 image: in the center the input image, on the left, the focus of a wrong classification as Healthy and on the right the focus of correct classification by 100% classifier. Red (higher) to blue (lower) scale.
Figure 3.
Classification of a COVID-19 image: in the center the input image, on the left, the focus of a wrong classification as Healthy and on the right the focus of correct classification by 100% classifier. Red (higher) to blue (lower) scale.
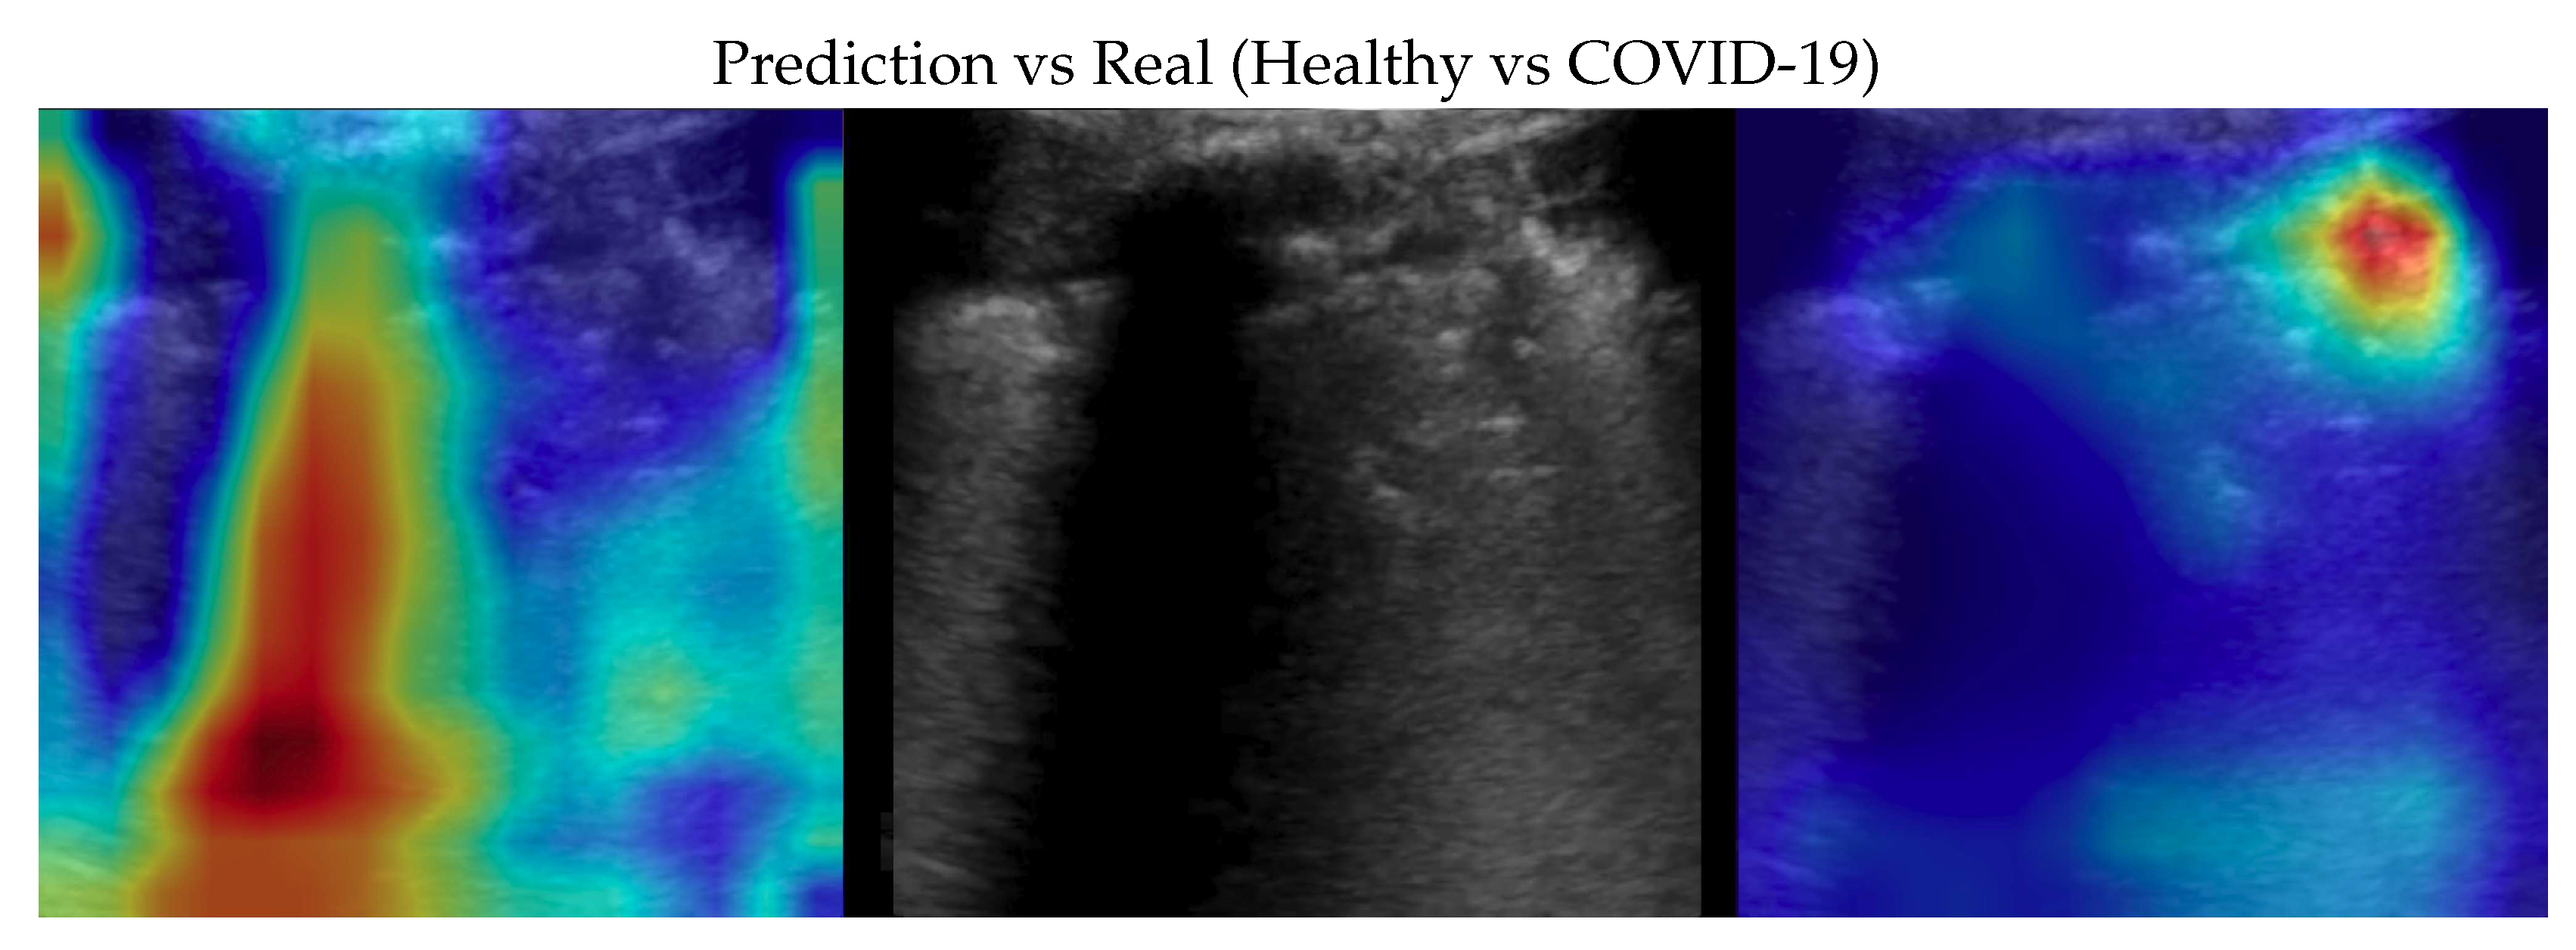
Figure 4.
Classification of a COVID-19 image: in the center the input image, on the left the focus of a wrong classification as Pneumonia and on the right the focus of correct classification by 100% classifier. Red (higher) to blue (lower) scale.
Figure 4.
Classification of a COVID-19 image: in the center the input image, on the left the focus of a wrong classification as Pneumonia and on the right the focus of correct classification by 100% classifier. Red (higher) to blue (lower) scale.
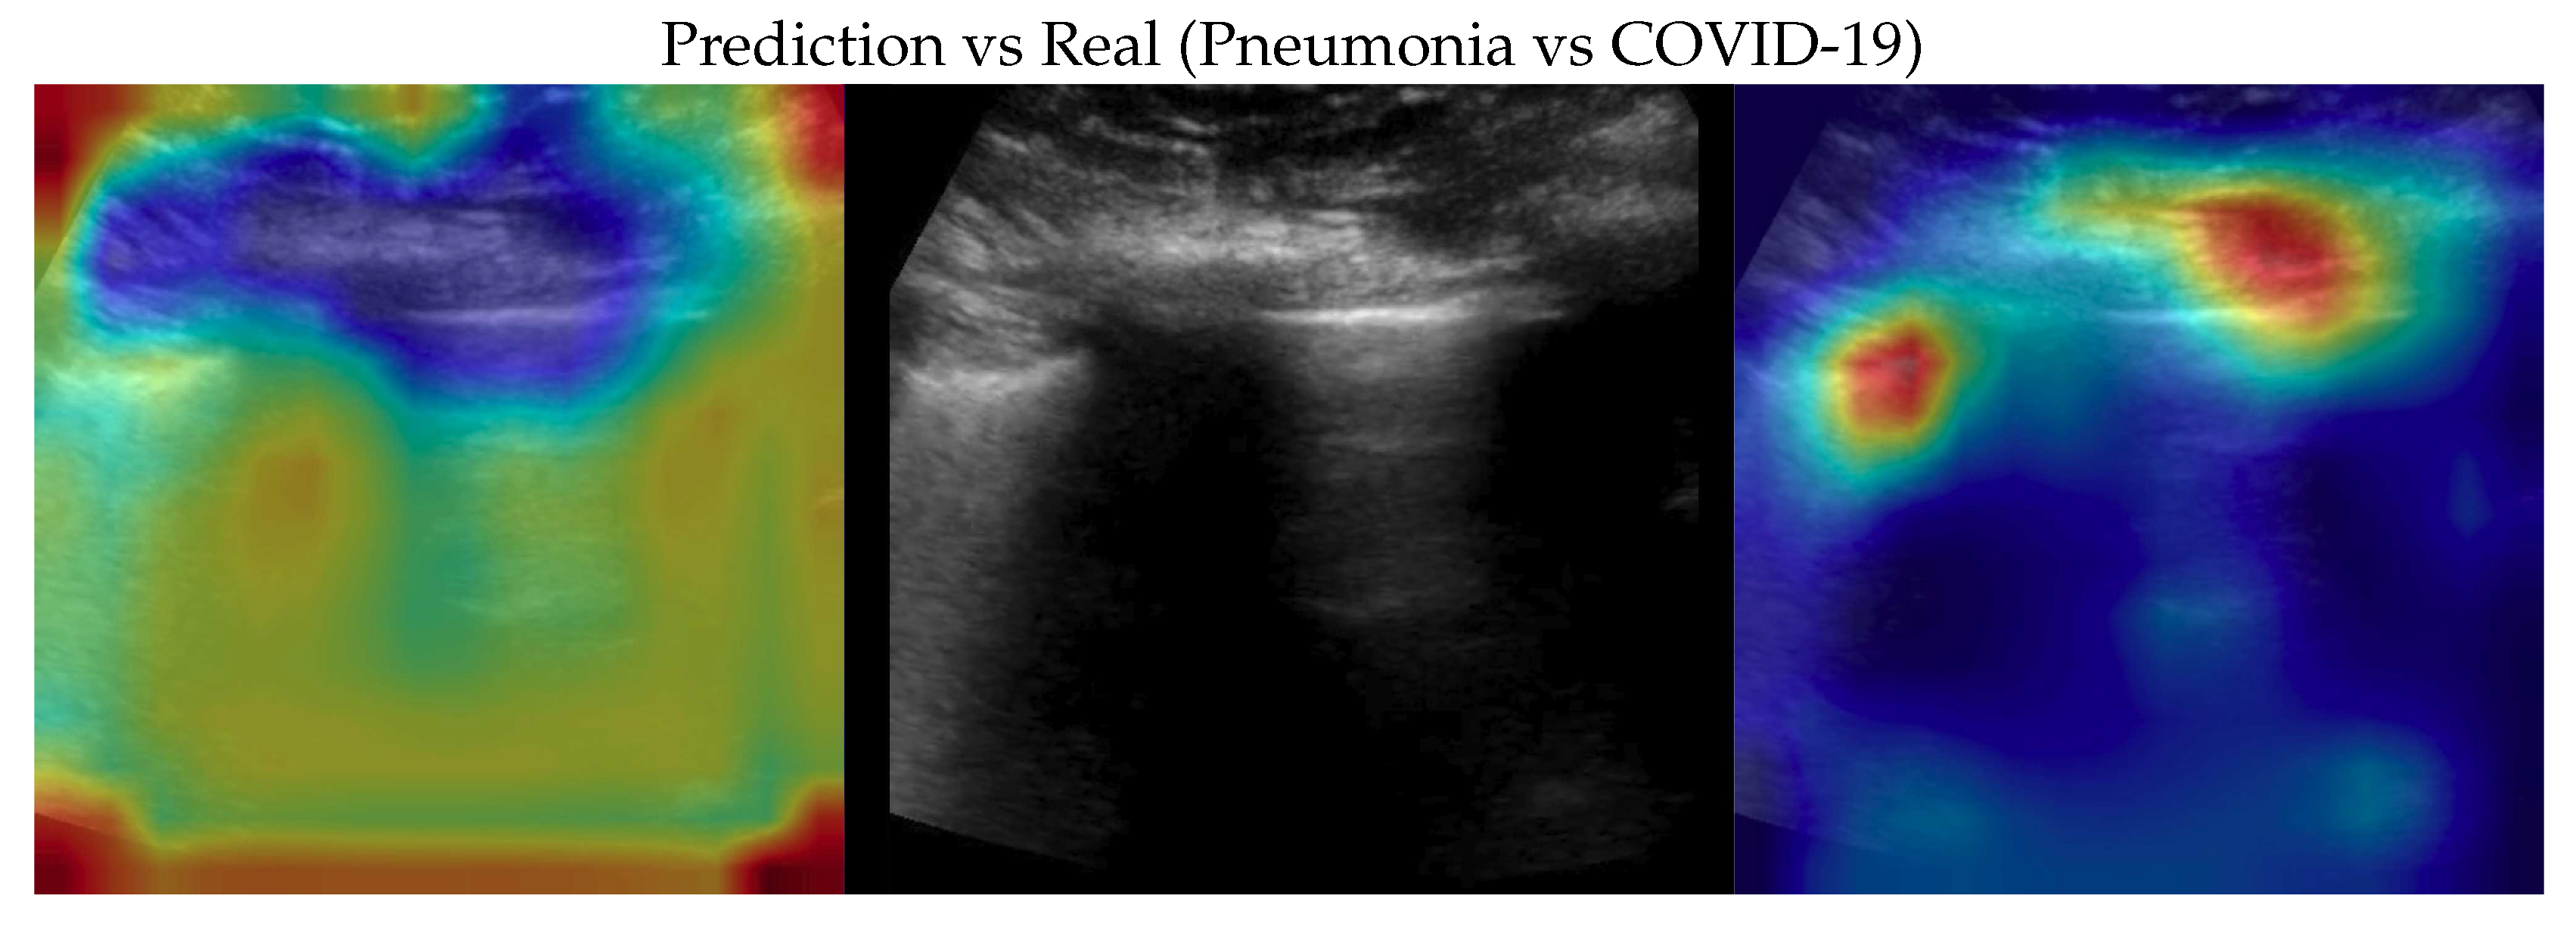
Figure 5.
Classification of a Pneumonia image: in the center the input image, on the left the focus of a wrong classification as Healthy and on the right the focus of correct classification by 100% classifier. Red (higher) to blue (lower) scale.
Figure 5.
Classification of a Pneumonia image: in the center the input image, on the left the focus of a wrong classification as Healthy and on the right the focus of correct classification by 100% classifier. Red (higher) to blue (lower) scale.
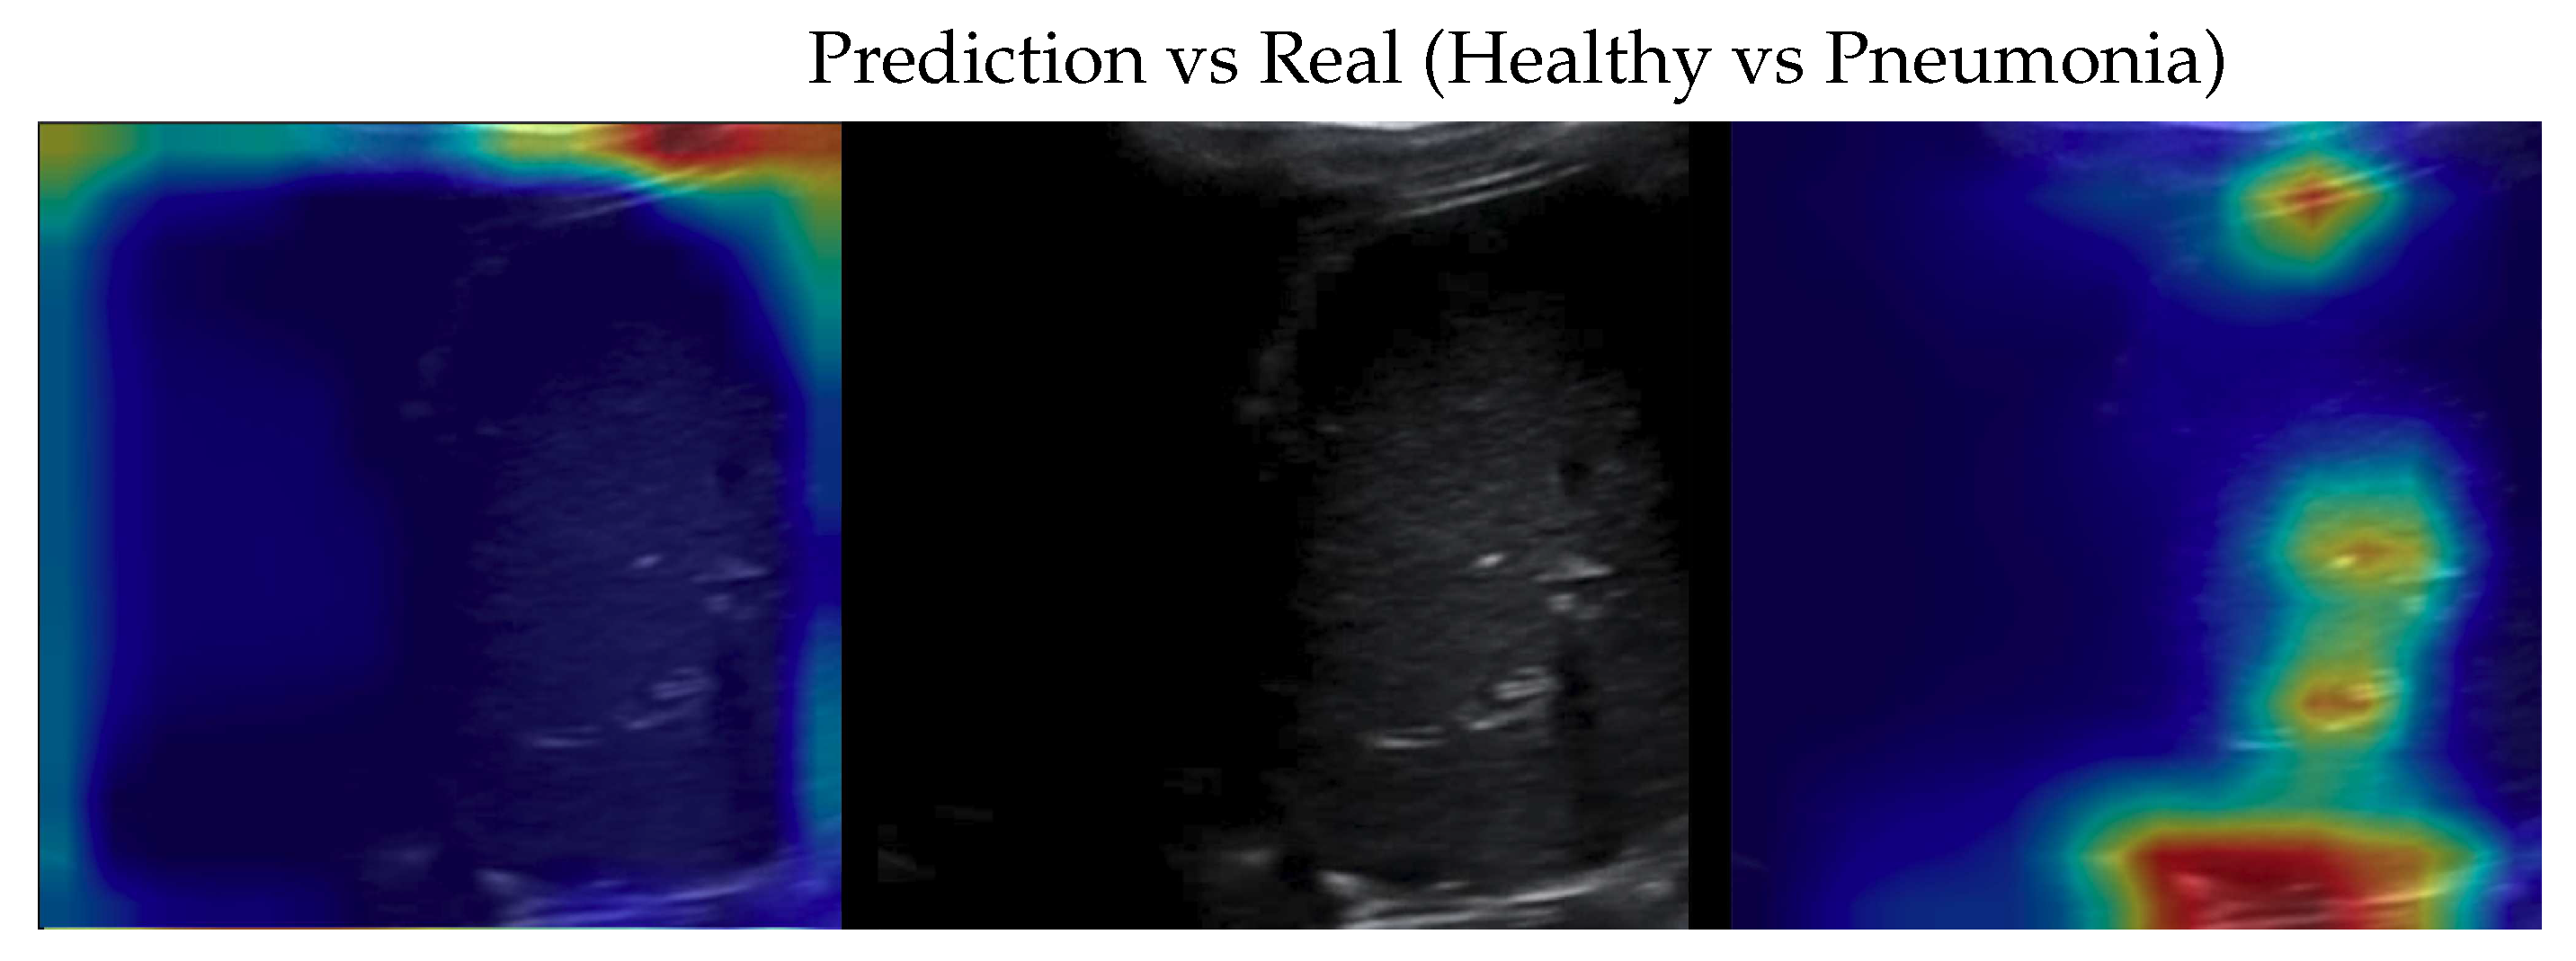
Figure 6.
Classification of a Pneumonia image: in the center the input image, on the left the focus of a wrong classification as COVID-19 and on the right the focus of correct classification by 100% classifier. Red (higher) to blue (lower) scale.
Figure 6.
Classification of a Pneumonia image: in the center the input image, on the left the focus of a wrong classification as COVID-19 and on the right the focus of correct classification by 100% classifier. Red (higher) to blue (lower) scale.
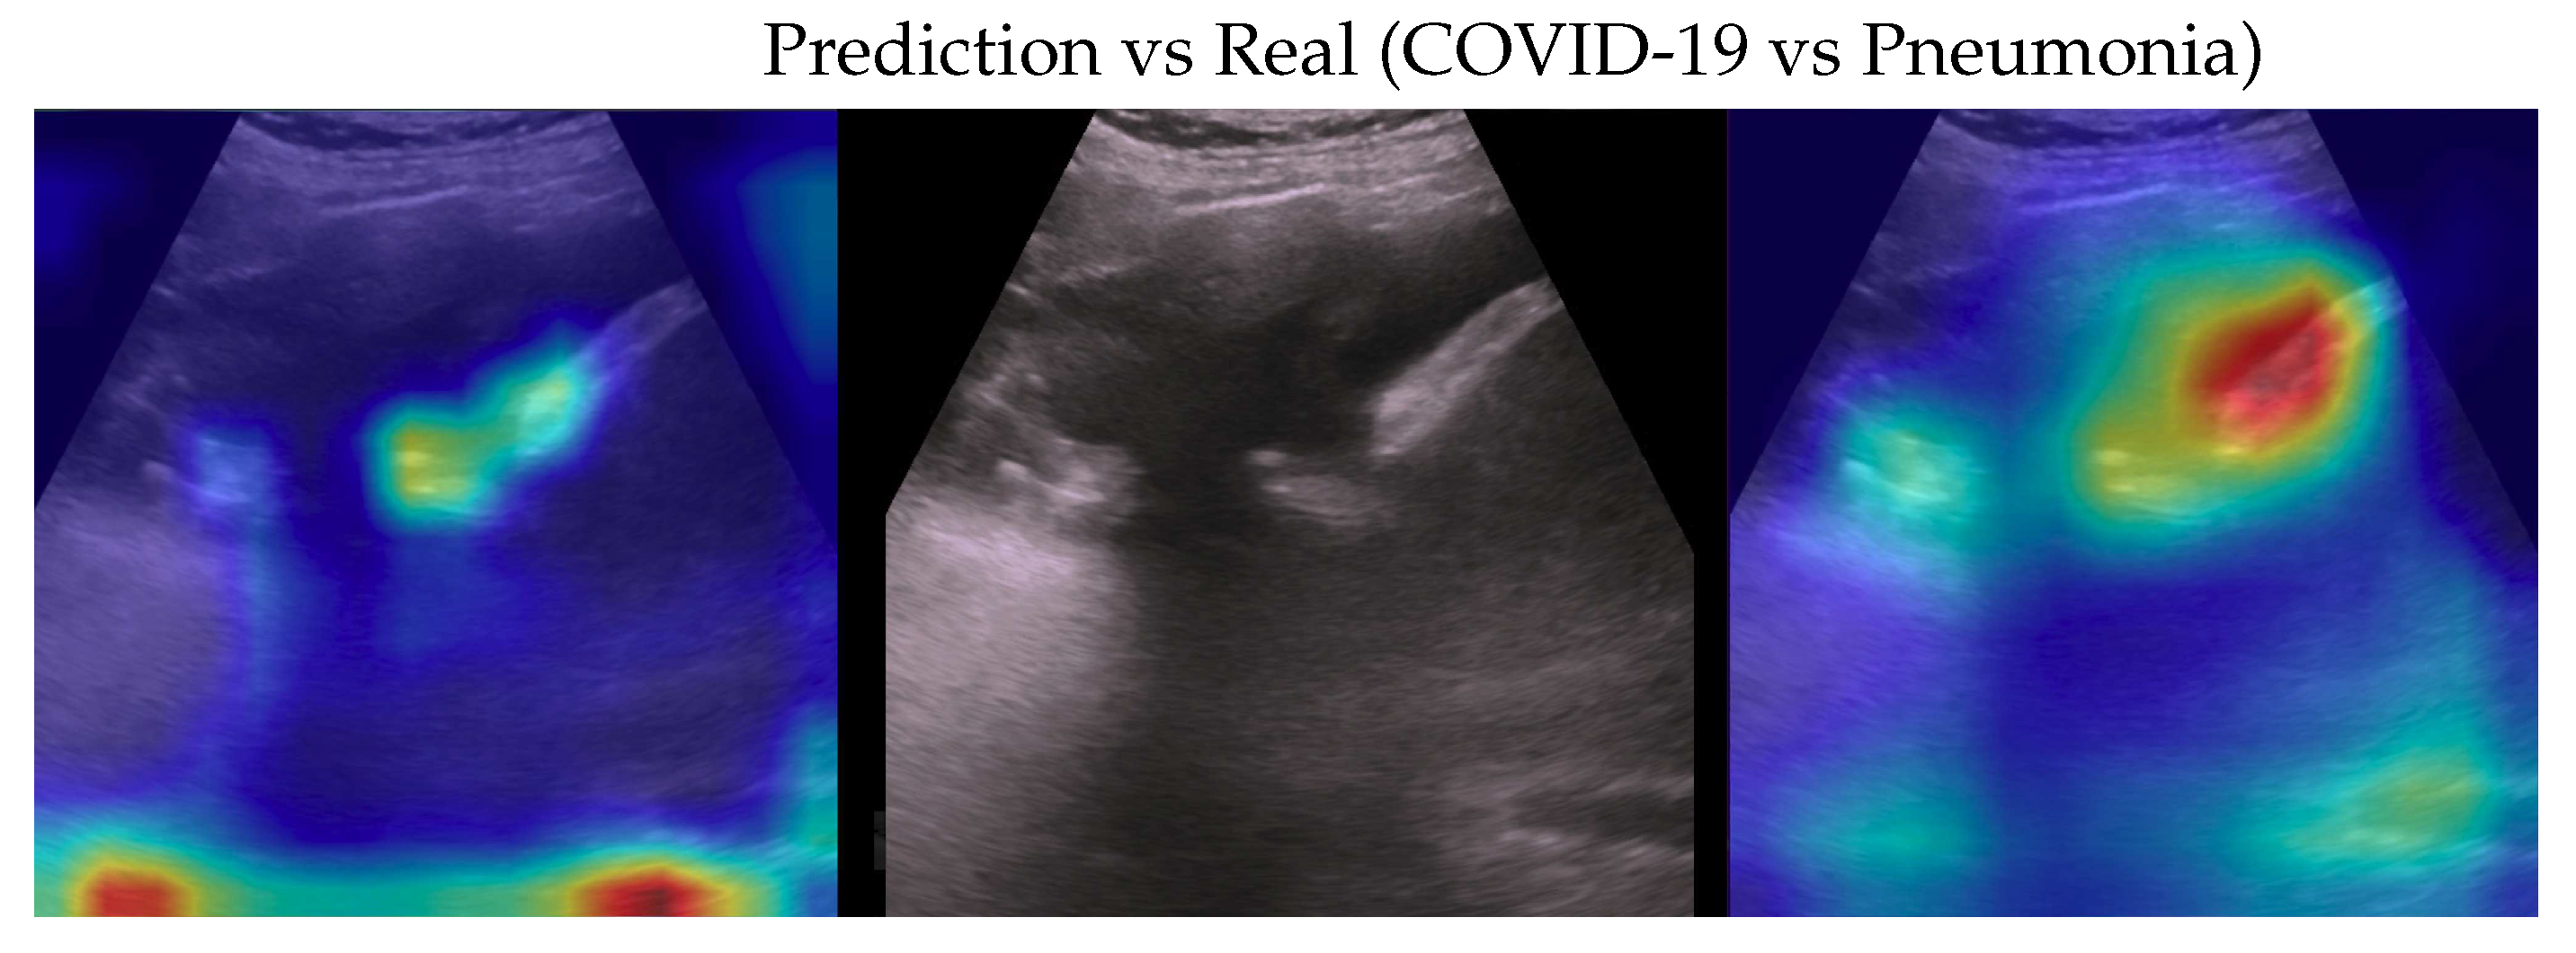
Figure 7.
Classification of a Healthy image: in the center the input image, on the left the focus of a wrong classification as COVID-19 and on the right the focus of correct classification by 100% classifier. Red (higher) to blue (lower) scale.
Figure 7.
Classification of a Healthy image: in the center the input image, on the left the focus of a wrong classification as COVID-19 and on the right the focus of correct classification by 100% classifier. Red (higher) to blue (lower) scale.
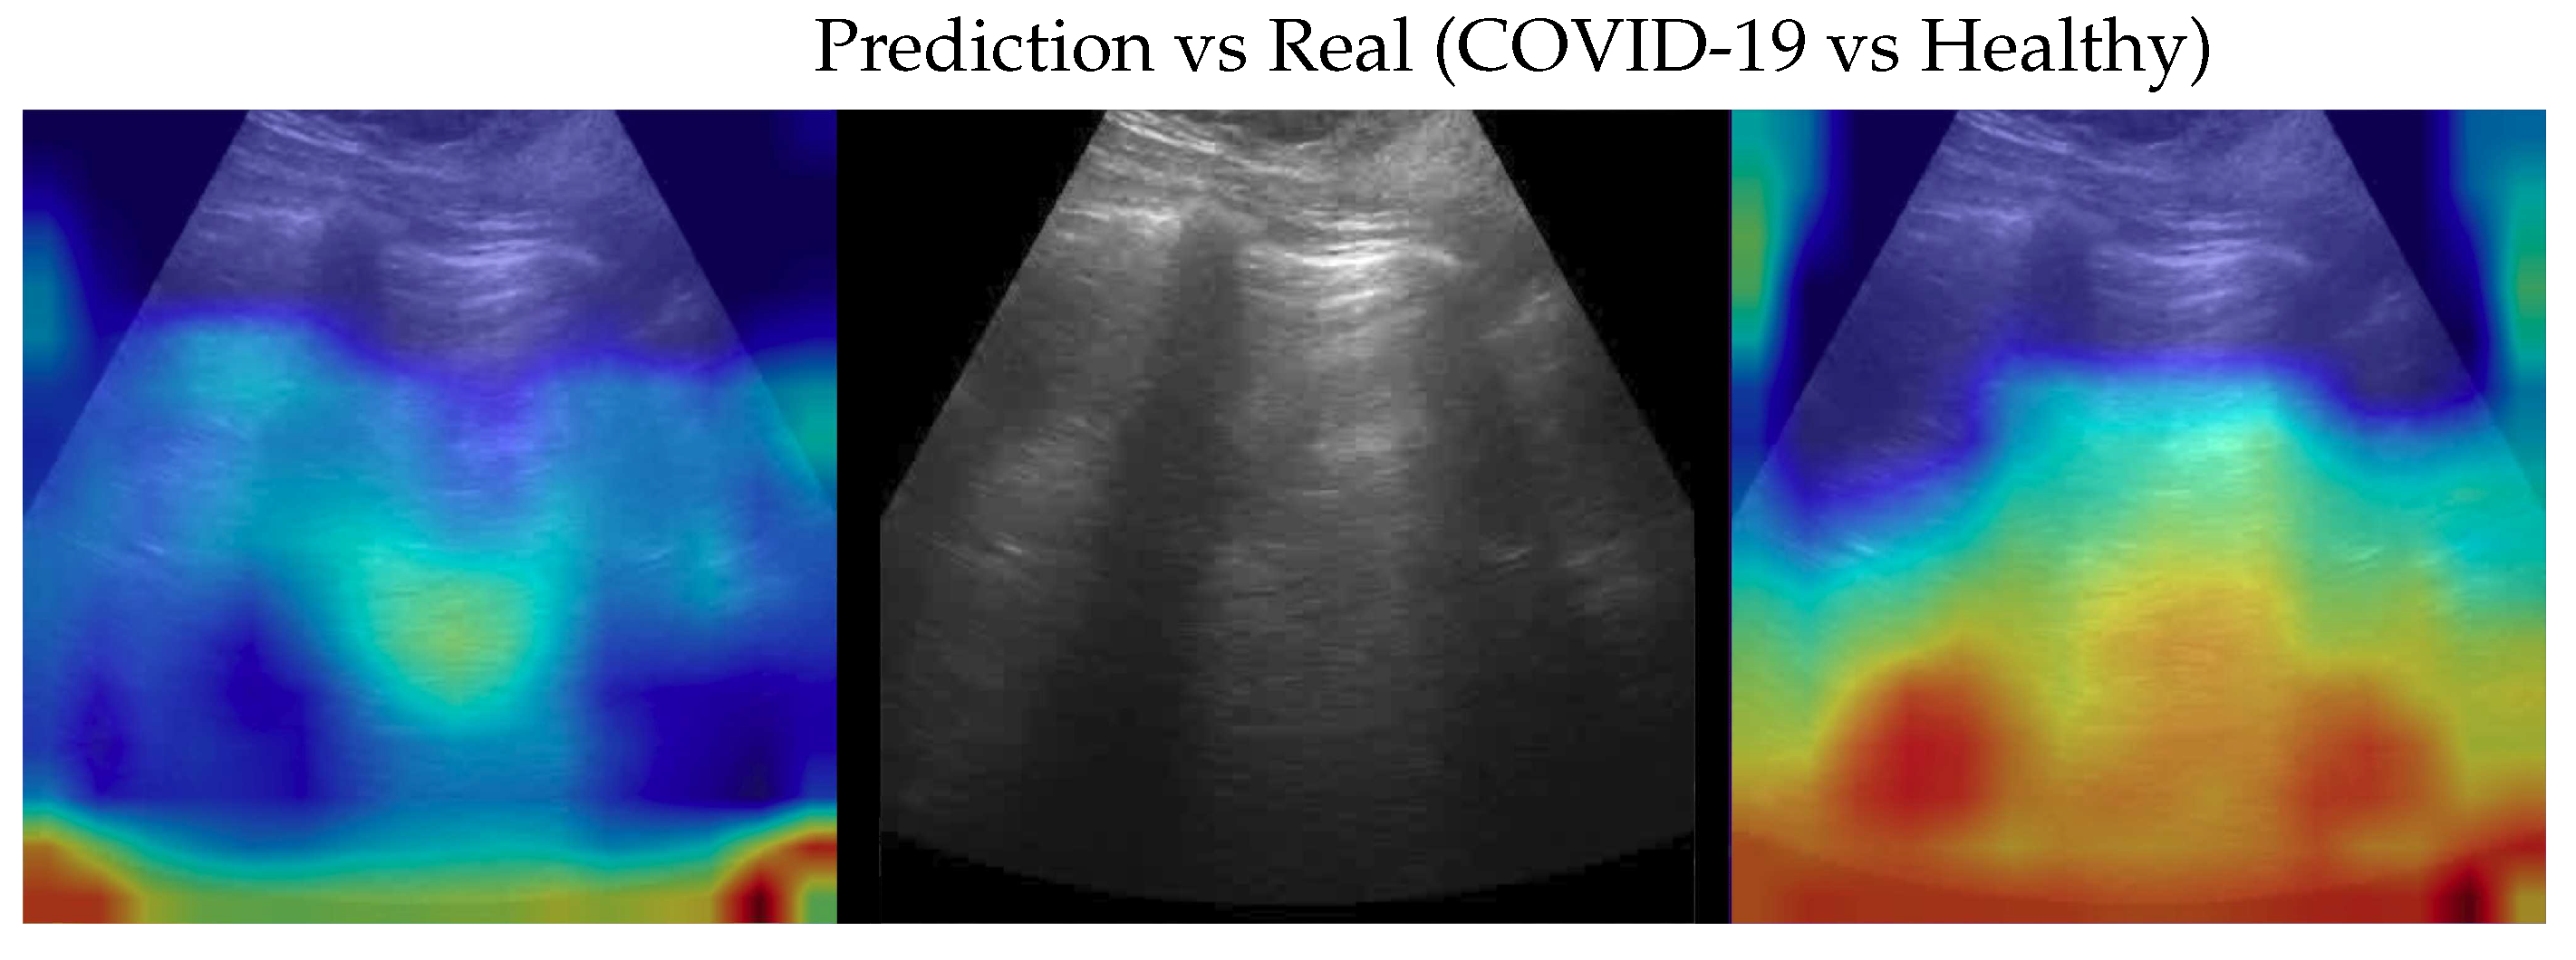
Figure 8.
Classification of a Healthy image: in the centre of the input image, on the left the focus of a wrong classification as Pneumonia and on the right the focus of the correct classification by 100% classifier. Red (higher) to blue (lower) scale.
Figure 8.
Classification of a Healthy image: in the centre of the input image, on the left the focus of a wrong classification as Pneumonia and on the right the focus of the correct classification by 100% classifier. Red (higher) to blue (lower) scale.
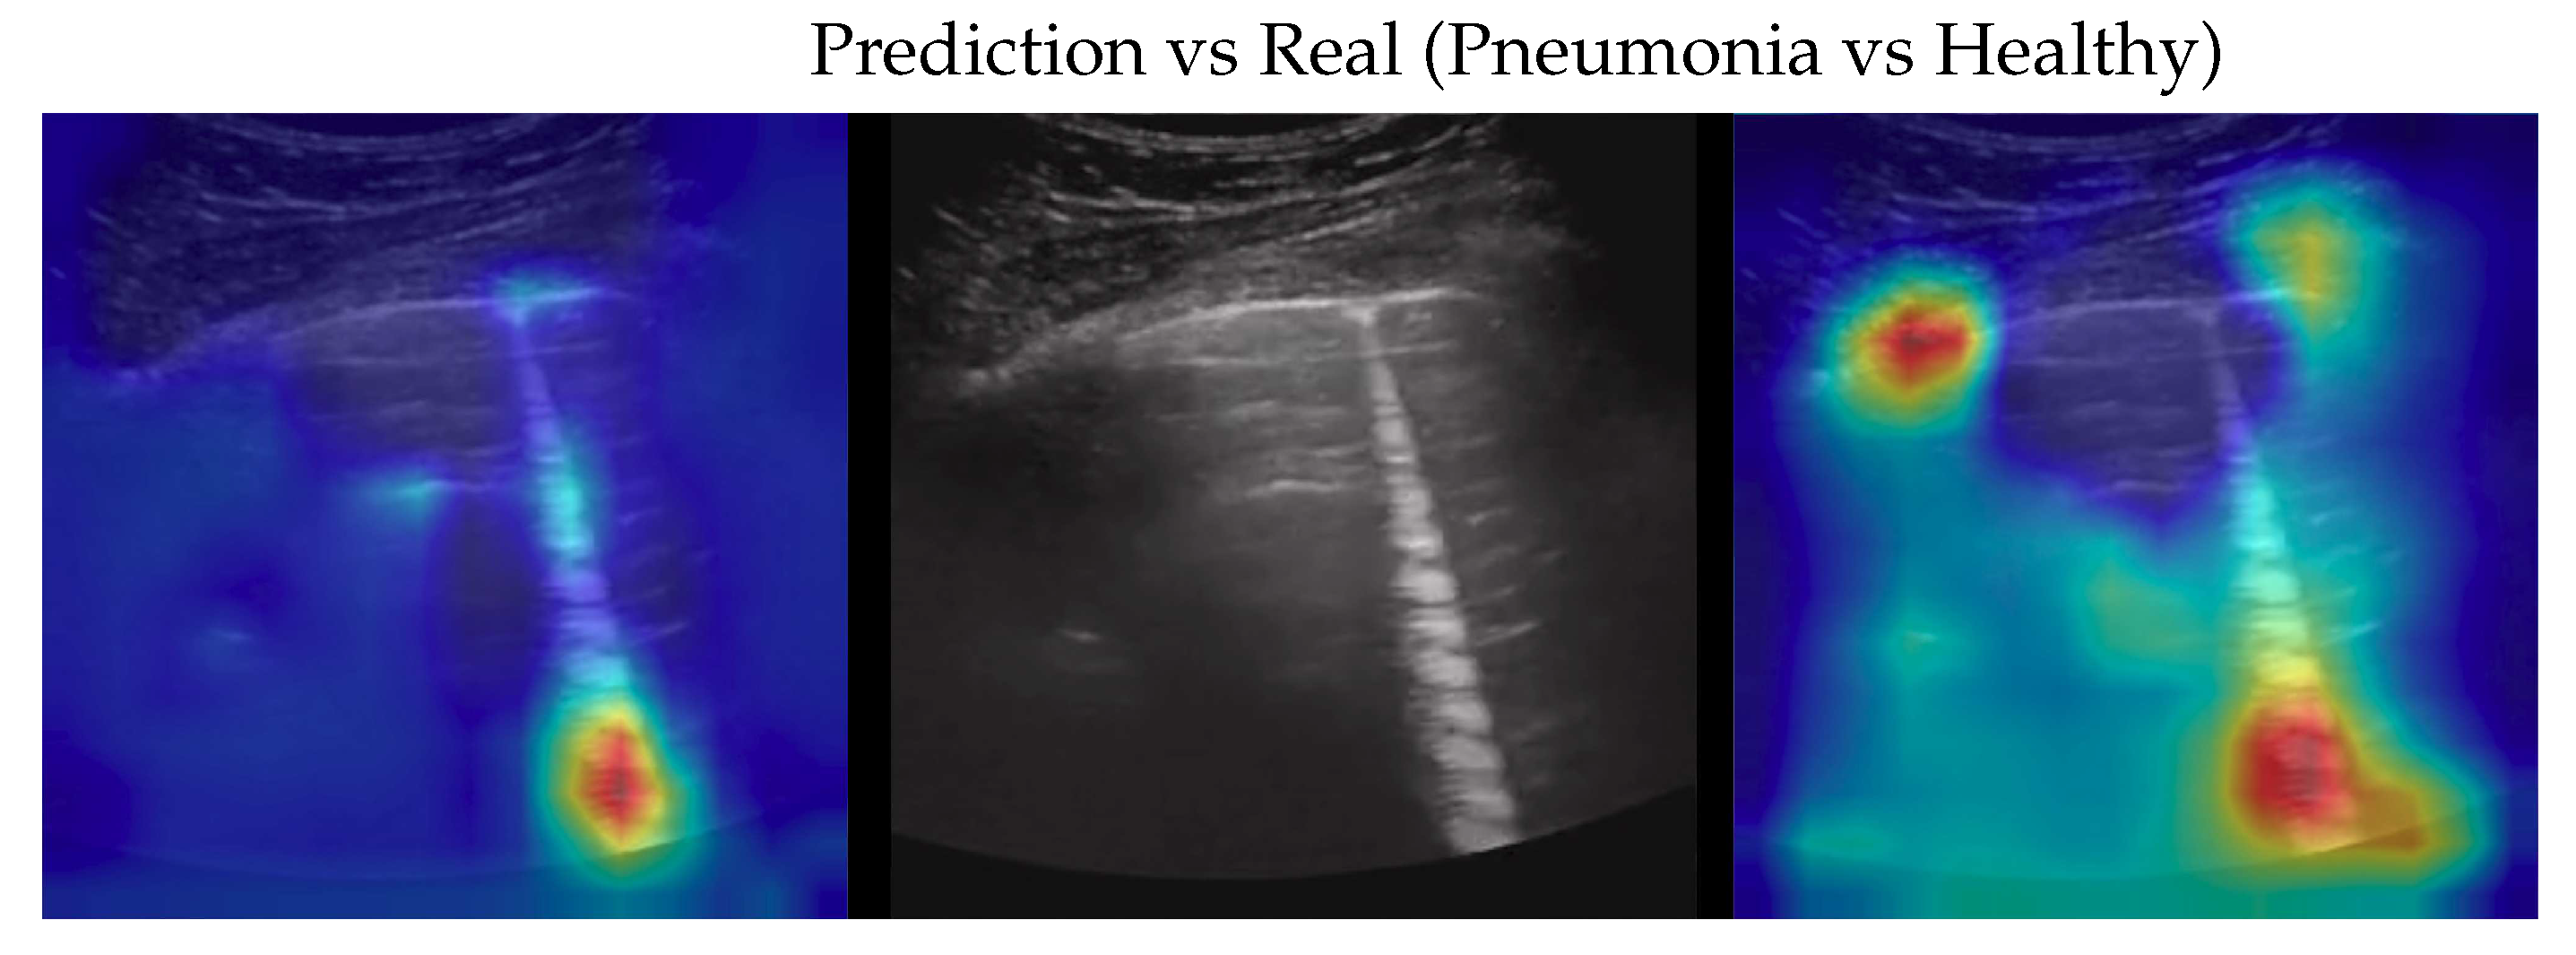

Table 1.
dataset description with the number of videos and the corresponding number of frames for each class.
Table 1.
dataset description with the number of videos and the corresponding number of frames for each class.
| Class | Videos | Frames |
|---|---|---|
| COVID-19 | 64 | 1024 |
| Pneumonia | 49 | 704 |
| Healthy | 66 | 1326 |
Table 2.
Fold 1 results - this fold seems to be the hardest one having end-to-end run with the lowest mean accuracies. With the ensemble fine-tuning, like the rest of the folds, 100% is reached.
Table 2.
Fold 1 results - this fold seems to be the hardest one having end-to-end run with the lowest mean accuracies. With the ensemble fine-tuning, like the rest of the folds, 100% is reached.
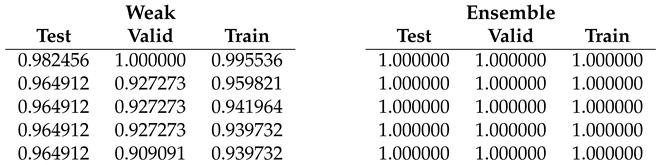
Table 3.
Fold 2 results - this fold seems to be the easiest one having 100% on all end-to-end runs, results are confirmed by ensemble too (runs on ensemble have been performed just for completeness).
Table 3.
Fold 2 results - this fold seems to be the easiest one having 100% on all end-to-end runs, results are confirmed by ensemble too (runs on ensemble have been performed just for completeness).
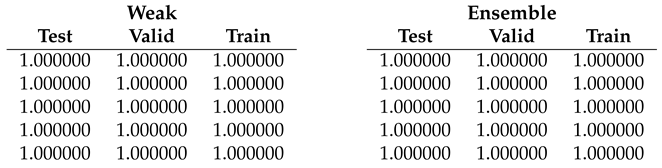
Table 4.
Fold 3 results - results on this fold are unusual since the best end-to-end run obtain 100% on test and valid but not on train subset. Ensemble fine-tuning confirms to reach 100%.
Table 4.
Fold 3 results - results on this fold are unusual since the best end-to-end run obtain 100% on test and valid but not on train subset. Ensemble fine-tuning confirms to reach 100%.
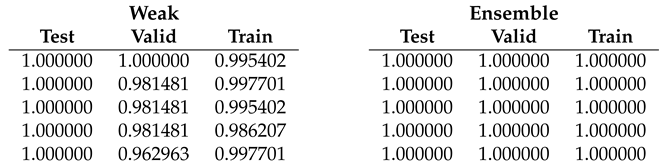
Table 5.
Fold 4 results - results on this fold are "average" since some end-to-end runs obtain 100% accuracy on all subsets while the ensemble confirms the 100% on all runs.
Table 5.
Fold 4 results - results on this fold are "average" since some end-to-end runs obtain 100% accuracy on all subsets while the ensemble confirms the 100% on all runs.
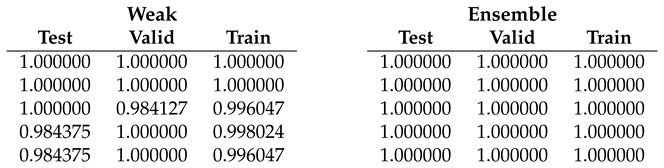
Table 6.
Fold 5 results - results on this fold are "average" since some end-to-end runs obtain 100% accuracy on all subsets while the ensemble confirms the 100% on all runs.
Table 6.
Fold 5 results - results on this fold are "average" since some end-to-end runs obtain 100% accuracy on all subsets while the ensemble confirms the 100% on all runs.
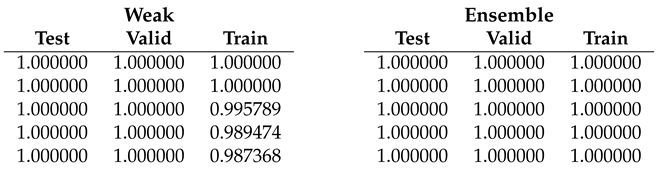
Table 7.
End-to-end weak models training mean accuracies of every subset for each fold.
| Test | Valid | Train | |
|---|---|---|---|
| Fold 1 | 0.968 0.007 | 0.938 0.032 | 0.955 0.021 |
| Fold 2 | 1.000 0.000 | 1.000 0.000 | 1.000 0.000 |
| Fold 3 | 1.000 0.000 | 0.981 0.012 | 0.994 0.004 |
| Fold 4 | 0.993 0.008 | 0.996 0.006 | 0.998 0.002 |
| Fold 5 | 1.000 0.000 | 1.000 0.000 | 0.994 0.005 |
| Average | 0.992 0.012 | 0.983 0.024 | 0.988 0.017 |
Table 8.
Comparisons, with metrics for each class, of the proposed model with the SOTA. Accuracy in brackets, if any, refers to Balanced Accuracy. Values are reported with the same significant digits in the papers.
Table 8.
Comparisons, with metrics for each class, of the proposed model with the SOTA. Accuracy in brackets, if any, refers to Balanced Accuracy. Values are reported with the same significant digits in the papers.
| Class | Recall | Precision | F1-Score | |
|---|---|---|---|---|
| VGG [25] | ||||
| Acc.: 87.8% (87.1%) | COVID-19 | 0.88 0.07 | 0.90 0.07 | 0.89 0.06 |
| #Param.: 14.7M | Pneumonia | 0.90 0.11 | 0.81 0.08 | 0.85 0.08 |
| FLOPs: 15.3G | Healthy | 0.83 0.11 | 0.90 0.06 | 0.86 0.08 |
| InceptionV3 [23] | ||||
| Acc.: 89.1% (89.3%) | COVID-19 | 0.864 0.036 | 0.901 0.031 | 0.880 0.030 |
| #Param.: 23.9M | Pneumonia | 0.908 0.025 | 0.842 0.037 | 0.871 0.025 |
| FLOPs: 6G | Healthy | 0.907 0.026 | 0.918 0.021 | 0.911 0.021 |
| DenseNet-201 [24] | ||||
| Acc.: 90.4% | COVID-19 | 0.892 | 0.918 | 0.905 |
| #Param.: 20M | Pneumonia | 0.903 | 0.610 | 0.728 |
| FLOPs: 4.29G | Healthy | 0.850 | 0.842 | 0.846 |
| Weak model | ||||
| Acc.: 98.7% (98.3%) | COVID-19 | 0.984 0.004 | 0.993 0.004 | 0.990 0.004 |
| #Param.: 5M | Pneumonia | 0.997 0.005 | 0.991 0.006 | 0.991 0.007 |
| FLOPs: 0.39G | Healthy | 0.999 0.003 | 0.993 0.003 | 0.995 0.004 |
| Ensemble | ||||
| Acc.: 100% (100%) | COVID-19 | 1.000 0.000 | 1.000 0.000 | 1.000 0.000 |
| #Param.: 10M | Pneumonia | 1.000 0.000 | 1.000 0.000 | 1.000 0.000 |
| FLOPs: 0.78G | Healthy | 1.000 0.000 | 1.000 0.000 | 1.000 0.000 |
2 the actual trainable parameters are 0.1M (the parameters of the combination layer) and the backward pass during the training ends very early because there is no reason to propagate gradients to the input layer. 3 the forward pass can be parallelized, having the same execution time of a weak model.
Disclaimer/Publisher’s Note: The statements, opinions and data contained in all publications are solely those of the individual author(s) and contributor(s) and not of MDPI and/or the editor(s). MDPI and/or the editor(s) disclaim responsibility for any injury to people or property resulting from any ideas, methods, instructions or products referred to in the content. |
© 2023 by the authors. Licensee MDPI, Basel, Switzerland. This article is an open access article distributed under the terms and conditions of the Creative Commons Attribution (CC BY) license (http://creativecommons.org/licenses/by/4.0/).
Copyright: This open access article is published under a Creative Commons CC BY 4.0 license, which permit the free download, distribution, and reuse, provided that the author and preprint are cited in any reuse.


